Embed Size (px)
Citation preview
lable at ScienceDirect
Acta Materialia 133 (2017) 10e20
Contents lists avai
Acta Materialia
journal homepage: www.elsevier .com/locate/actamat
Full length article
Crystal growth during keyhole mode laser welding
H.L. Wei a, J.W. Elmer b, T. DebRoy a, *
a Department of Materials Science and Engineering, The Pennsylvania State University, University Park, PA 16802, USAb Materials Engineering Division, Lawrence Livermore National Laboratory, Livermore, CA 94550, USA
a r t i c l e i n f o
Article history:Received 20 January 2017Received in revised form29 March 2017Accepted 27 April 2017Available online 13 May 2017
Keywords:Laser weldingGrain growthMonte carloFusion zoneHeat affected zone
* Corresponding author.E-mail address: [email protected] (T. DebRoy).
http://dx.doi.org/10.1016/j.actamat.2017.04.0741359-6454/© 2017 Acta Materialia Inc. Published by E
a b s t r a c t
Evolution of microstructure during keyhole mode welding involves several special features such asmultiple inflections of weld pool boundary curvatures, strong spatially variable thermal cycles andnegligible undercooling. These systems are difficult to characterize rigorously, because depending on thesections selected, significantly different grain structures and topological features are observed. Here weuncover the special features of crystal growth during keyhole mode laser welding considering themotion of the melt pool and the interdependence of the grain growth in both the fusion zone and theheat affected zone. The temperature distribution and the transient thermal history of welds werecombined with the grain growth simulation using a Monte Carlo approach in a computationally efficientmanner. The computed results were tested against independent experimental data for keyhole modelaser welding of copper where the grain structure can be easily resolved. The results showed that thecurved columnar grains growing from the fusion zone boundary coexisted with axial columnar grainsnear the centerline of welds. The effects of welding speed on the dimension, distribution, orientation andmorphology of the columnar and equiaxed grains were studied.
© 2017 Acta Materialia Inc. Published by Elsevier Ltd. All rights reserved.
1. Introduction
Keyhole mode laser welding is widely used to join large com-ponents of many important engineering alloys. Due to very highenergy density of the laser beam, a vapor cavity known as thekeyhole forms inside the components surrounded by a pool ofliquid metal which solidifies to form the weld as the laser beammoves along [1,2]. Evolution of microstructure during keyholemode welding is characterized by several special features that arevery different from most fusion welding processes including con-ductionmode laser welding where the power density is insufficientto form a keyhole [3,4]. They include very high peak temperatureclose to the boiling temperature of the alloy, a moving solidificationfront with multiple inflection points, strong spatial variations ofthermal cycles, and negligible constitutional and kinetic under-cooling, all of which affect microstructure evolution in a mannerunlike any other fusion welding process [5e7].
The grain structure evolution during keyhole mode welding issignificantly different from that in conduction mode laser weldingor gas tungsten arc welding and most previous studies were
lsevier Ltd. All rights reserved.
focused onwelds that did not form any keyhole. For example, grainstructure evolution within the heat affected zone (HAZ) wassimulated based on a Monte Carlo (MC) technique [8e11].Computationally intensive cellular automaton model was used tosimulate the 3D grain growth in the fusion zone (FZ) while ignoringgrain growth in the HAZ [12e14]. Grain structure prediction in analuminum alloy weld was reported based on a MC techniqueconsidering the temporal and spatial distributions of temperaturefield during gas tungsten arc welding [15]. However, studies ofgrain growth during keyhole mode laser welding are scarce.
Grain growth in keyhole mode welds is difficult to characterizerigorously, because depending on the sections selected, signifi-cantly different grain structures and topological features areobserved because of the multiple inflections of weld pool boundarycurvatures and other complexities [3,16]. By incorporating a wellknown fact that directions of grain growth are normal to the weldpool boundary [17], and these directions may be different from thedirections of growths of cells and dendrites, crystal growth andtopological features can be rigorously probed for keyhole modewelding. Simulation of the grain structure evolution requires reli-able three dimensional (3D) transient temperature fields [1,18,19].In addition, both the moving liquid pool and the interdependentgrain growth in the FZ and the HAZ need to be considered to revealthe grain growth process.
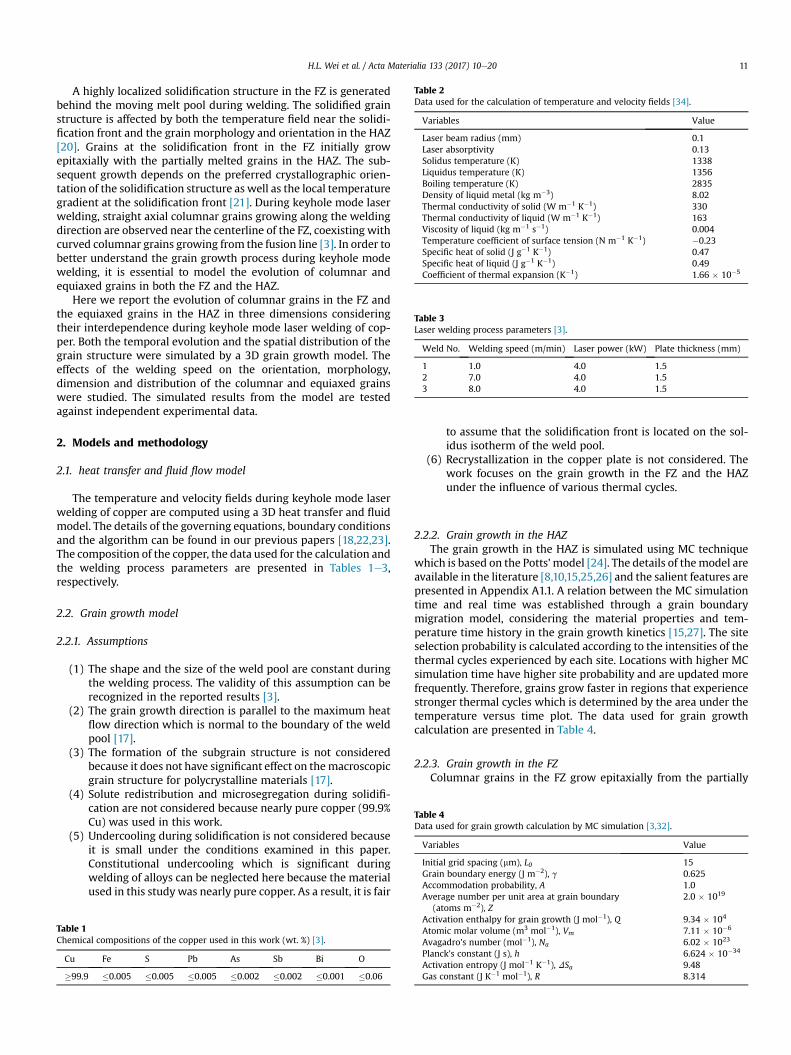
Table 2Data used for the calculation of temperature and velocity fields [34].
Variables Value
Laser beam radius (mm) 0.1Laser absorptivity 0.13Solidus temperature (K) 1338Liquidus temperature (K) 1356Boiling temperature (K) 2835Density of liquid metal (kg m�3) 8.02Thermal conductivity of solid (W m�1 K�1) 330Thermal conductivity of liquid (W m�1 K�1) 163Viscosity of liquid (kg m�1 s�1) 0.004Temperature coefficient of surface tension (N m�1 K�1) �0.23Specific heat of solid (J g�1 K�1) 0.47Specific heat of liquid (J g�1 K�1) 0.49Coefficient of thermal expansion (K�1) 1.66 � 10�5
Table 3Laser welding process parameters [3].
Weld No. Welding speed (m/min) Laser power (kW) Plate thickness (mm)
1 1.0 4.0 1.52 7.0 4.0 1.53 8.0 4.0 1.5
Table 4Data used for grain growth calculation by MC simulation [3,32].
Variables Value
Initial grid spacing (mm), L0 15Grain boundary energy (J m�2), g 0.625Accommodation probability, A 1.0Average number per unit area at grain boundary 2.0 � 1019
H.L. Wei et al. / Acta Materialia 133 (2017) 10e20 11
A highly localized solidification structure in the FZ is generatedbehind the moving melt pool during welding. The solidified grainstructure is affected by both the temperature field near the solidi-fication front and the grain morphology and orientation in the HAZ[20]. Grains at the solidification front in the FZ initially growepitaxially with the partially melted grains in the HAZ. The sub-sequent growth depends on the preferred crystallographic orien-tation of the solidification structure as well as the local temperaturegradient at the solidification front [21]. During keyhole mode laserwelding, straight axial columnar grains growing along the weldingdirection are observed near the centerline of the FZ, coexisting withcurved columnar grains growing from the fusion line [3]. In order tobetter understand the grain growth process during keyhole modewelding, it is essential to model the evolution of columnar andequiaxed grains in both the FZ and the HAZ.
Here we report the evolution of columnar grains in the FZ andthe equiaxed grains in the HAZ in three dimensions consideringtheir interdependence during keyhole mode laser welding of cop-per. Both the temporal evolution and the spatial distribution of thegrain structure were simulated by a 3D grain growth model. Theeffects of the welding speed on the orientation, morphology,dimension and distribution of the columnar and equiaxed grainswere studied. The simulated results from the model are testedagainst independent experimental data.
2. Models and methodology
2.1. heat transfer and fluid flow model
The temperature and velocity fields during keyhole mode laserwelding of copper are computed using a 3D heat transfer and fluidmodel. The details of the governing equations, boundary conditionsand the algorithm can be found in our previous papers [18,22,23].The composition of the copper, the data used for the calculation andthe welding process parameters are presented in Tables 1e3,respectively.
2.2. Grain growth model
2.2.1. Assumptions
(1) The shape and the size of the weld pool are constant duringthe welding process. The validity of this assumption can berecognized in the reported results [3].
(2) The grain growth direction is parallel to the maximum heatflow direction which is normal to the boundary of the weldpool [17].
(3) The formation of the subgrain structure is not consideredbecause it does not have significant effect on themacroscopicgrain structure for polycrystalline materials [17].
(4) Solute redistribution and microsegregation during solidifi-cation are not considered because nearly pure copper (99.9%Cu) was used in this work.
(5) Undercooling during solidification is not considered becauseit is small under the conditions examined in this paper.Constitutional undercooling which is significant duringwelding of alloys can be neglected here because the materialused in this studywas nearly pure copper. As a result, it is fair
Table 1Chemical compositions of the copper used in this work (wt. %) [3].
Cu Fe S Pb As Sb Bi O
�99.9 �0.005 �0.005 �0.005 �0.002 �0.002 �0.001 �0.06
to assume that the solidification front is located on the sol-idus isotherm of the weld pool.
(6) Recrystallization in the copper plate is not considered. Thework focuses on the grain growth in the FZ and the HAZunder the influence of various thermal cycles.
2.2.2. Grain growth in the HAZThe grain growth in the HAZ is simulated using MC technique
which is based on the Potts' model [24]. The details of themodel areavailable in the literature [8,10,15,25,26] and the salient features arepresented in Appendix A1.1. A relation between the MC simulationtime and real time was established through a grain boundarymigration model, considering the material properties and tem-perature time history in the grain growth kinetics [15,27]. The siteselection probability is calculated according to the intensities of thethermal cycles experienced by each site. Locations with higher MCsimulation time have higher site probability and are updated morefrequently. Therefore, grains grow faster in regions that experiencestronger thermal cycles which is determined by the area under thetemperature versus time plot. The data used for grain growthcalculation are presented in Table 4.
2.2.3. Grain growth in the FZColumnar grains in the FZ grow epitaxially from the partially
(atoms m�2), ZActivation enthalpy for grain growth (J mol�1), Q 9.34 � 104
Atomic molar volume (m3 mol�1), Vm 7.11 � 10�6
Avagadro's number (mol�1), Na 6.02 � 1023
Planck's constant (J s), h 6.624 � 10�34
Activation entropy (J mol�1 K�1), DSa 9.48Gas constant (J K�1 mol�1), R 8.314
H.L. Wei et al. / Acta Materialia 133 (2017) 10e2012
melted grains in the HAZ at the solidification front. Subsequentlythe columnar grains grow along location dependent directions andrates. The details of the calculation of the local growth direction andrate on the solidifying surface of the weld pool can be found in ourprevious papers [15,20,28] and the salient features are presented inAppendix A1.2. The freshly solidified grains in the FZ thicken in sizewhich is simulated using the MC model.
At steady state, the motion of the weld pool determines thesolidification growth rate which depends only on the weldingspeed. In other words, the movement of the solidus line with timedetermines the position on the growth interface. The direction ofgrain growth is influenced by themaximumheat flowdirection andthis direction aligns closely with ⟨100⟩ for face-centered cubicmaterials such as copper in most cases. In other words, growthoccurs perpendicular to the boundary of the melt pool. At highsolidification growth rates, the growth direction may deviate fromthe heat flow direction. Experimental data on the extent ofmisalignment between the maximum heat flow direction and thecrystal growth direction are not available for the laser processing ofcopper and has been neglected in the current investigation. Thelocal growth direction is modified after each incremental move-ment of the weld pool depending on the 3D temperature gradientswhich affects the local curvature of the solidus surface.
2.2.4. Numerical schemeThe 3D simulations were conducted in a cubic lattice system.
The computational domain included only one half of the specimendue to the symmetry of the weld. In the 3D grain growth model thegrid spacing is 15 mm in x-, y- and z-directions, which is equal to theinitial base metal grain size. The variation of grid spacing does notaffect the final grain structure significantly because the effect ofgrid spacing on the grain size has already been considered in theMC simulation algorithm. Non-uniform coarser grids were used inthe heat transfer and fluid flow model to calculate the temperaturefield, which was subsequently interploted in the grain growthmodel.
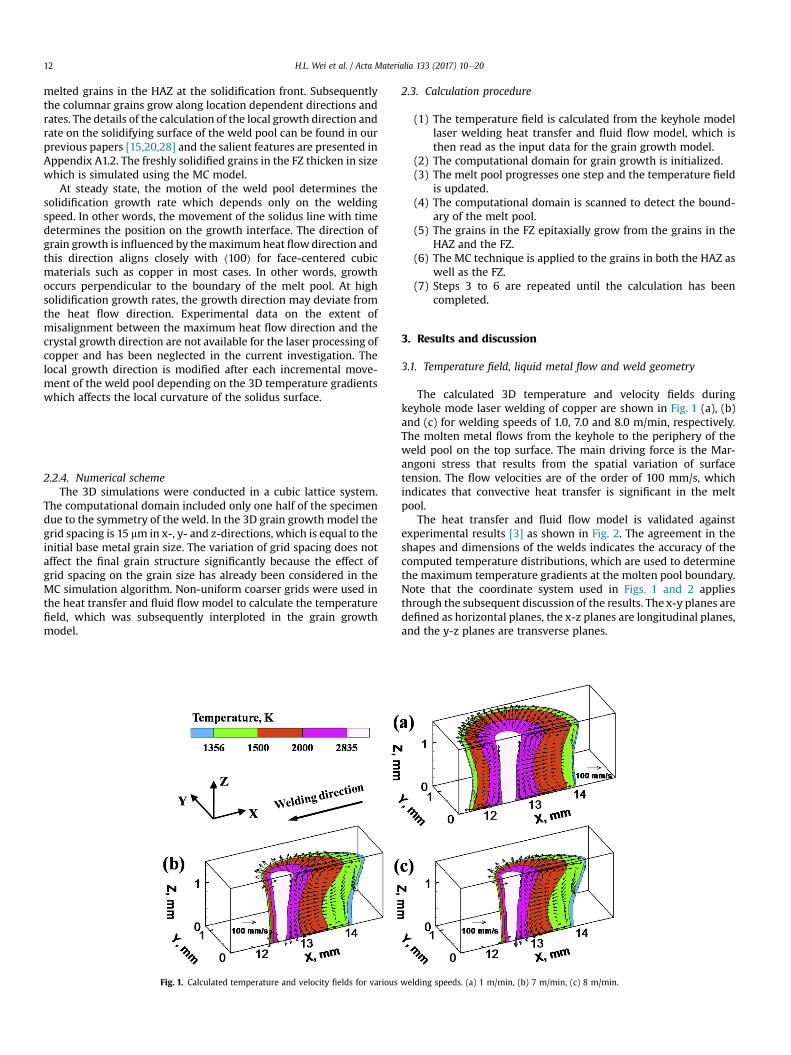
Fig. 1. Calculated temperature and velocity fields for various
2.3. Calculation procedure
(1) The temperature field is calculated from the keyhole modellaser welding heat transfer and fluid flow model, which isthen read as the input data for the grain growth model.
(2) The computational domain for grain growth is initialized.(3) The melt pool progresses one step and the temperature field
is updated.(4) The computational domain is scanned to detect the bound-
ary of the melt pool.(5) The grains in the FZ epitaxially grow from the grains in the
HAZ and the FZ.(6) The MC technique is applied to the grains in both the HAZ as
well as the FZ.(7) Steps 3 to 6 are repeated until the calculation has been
completed.
3. Results and discussion
3.1. Temperature field, liquid metal flow and weld geometry
The calculated 3D temperature and velocity fields duringkeyhole mode laser welding of copper are shown in Fig. 1 (a), (b)and (c) for welding speeds of 1.0, 7.0 and 8.0 m/min, respectively.The molten metal flows from the keyhole to the periphery of theweld pool on the top surface. The main driving force is the Mar-angoni stress that results from the spatial variation of surfacetension. The flow velocities are of the order of 100 mm/s, whichindicates that convective heat transfer is significant in the meltpool.
The heat transfer and fluid flow model is validated againstexperimental results [3] as shown in Fig. 2. The agreement in theshapes and dimensions of the welds indicates the accuracy of thecomputed temperature distributions, which are used to determinethe maximum temperature gradients at the molten pool boundary.Note that the coordinate system used in Figs. 1 and 2 appliesthrough the subsequent discussion of the results. The x-y planes aredefined as horizontal planes, the x-z planes are longitudinal planes,and the y-z planes are transverse planes.
welding speeds. (a) 1 m/min, (b) 7 m/min, (c) 8 m/min.
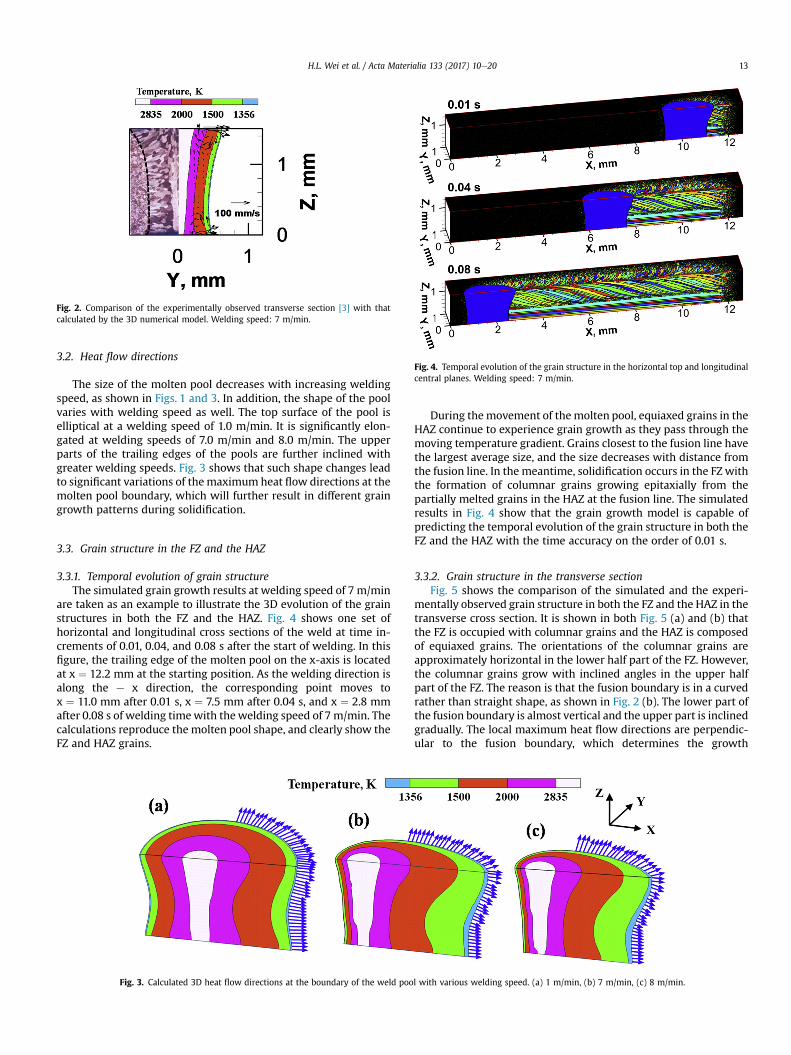
Fig. 2. Comparison of the experimentally observed transverse section [3] with thatcalculated by the 3D numerical model. Welding speed: 7 m/min.
Fig. 4. Temporal evolution of the grain structure in the horizontal top and longitudinalcentral planes. Welding speed: 7 m/min.
H.L. Wei et al. / Acta Materialia 133 (2017) 10e20 13
3.2. Heat flow directions
The size of the molten pool decreases with increasing weldingspeed, as shown in Figs. 1 and 3. In addition, the shape of the poolvaries with welding speed as well. The top surface of the pool iselliptical at a welding speed of 1.0 m/min. It is significantly elon-gated at welding speeds of 7.0 m/min and 8.0 m/min. The upperparts of the trailing edges of the pools are further inclined withgreater welding speeds. Fig. 3 shows that such shape changes leadto significant variations of the maximum heat flow directions at themolten pool boundary, which will further result in different graingrowth patterns during solidification.
3.3. Grain structure in the FZ and the HAZ
3.3.1. Temporal evolution of grain structureThe simulated grain growth results at welding speed of 7 m/min
are taken as an example to illustrate the 3D evolution of the grainstructures in both the FZ and the HAZ. Fig. 4 shows one set ofhorizontal and longitudinal cross sections of the weld at time in-crements of 0.01, 0.04, and 0.08 s after the start of welding. In thisfigure, the trailing edge of the molten pool on the x-axis is locatedat x ¼ 12.2 mm at the starting position. As the welding direction isalong the e x direction, the corresponding point moves tox ¼ 11.0 mm after 0.01 s, x ¼ 7.5 mm after 0.04 s, and x ¼ 2.8 mmafter 0.08 s of welding timewith thewelding speed of 7 m/min. Thecalculations reproduce the molten pool shape, and clearly show theFZ and HAZ grains.
Fig. 3. Calculated 3D heat flow directions at the boundary of the weld poo
During themovement of the molten pool, equiaxed grains in theHAZ continue to experience grain growth as they pass through themoving temperature gradient. Grains closest to the fusion line havethe largest average size, and the size decreases with distance fromthe fusion line. In the meantime, solidification occurs in the FZ withthe formation of columnar grains growing epitaxially from thepartially melted grains in the HAZ at the fusion line. The simulatedresults in Fig. 4 show that the grain growth model is capable ofpredicting the temporal evolution of the grain structure in both theFZ and the HAZ with the time accuracy on the order of 0.01 s.
3.3.2. Grain structure in the transverse sectionFig. 5 shows the comparison of the simulated and the experi-
mentally observed grain structure in both the FZ and the HAZ in thetransverse cross section. It is shown in both Fig. 5 (a) and (b) thatthe FZ is occupied with columnar grains and the HAZ is composedof equiaxed grains. The orientations of the columnar grains areapproximately horizontal in the lower half part of the FZ. However,the columnar grains grow with inclined angles in the upper halfpart of the FZ. The reason is that the fusion boundary is in a curvedrather than straight shape, as shown in Fig. 2 (b). The lower part ofthe fusion boundary is almost vertical and the upper part is inclinedgradually. The local maximum heat flow directions are perpendic-ular to the fusion boundary, which determines the growth
l with various welding speed. (a) 1 m/min, (b) 7 m/min, (c) 8 m/min.
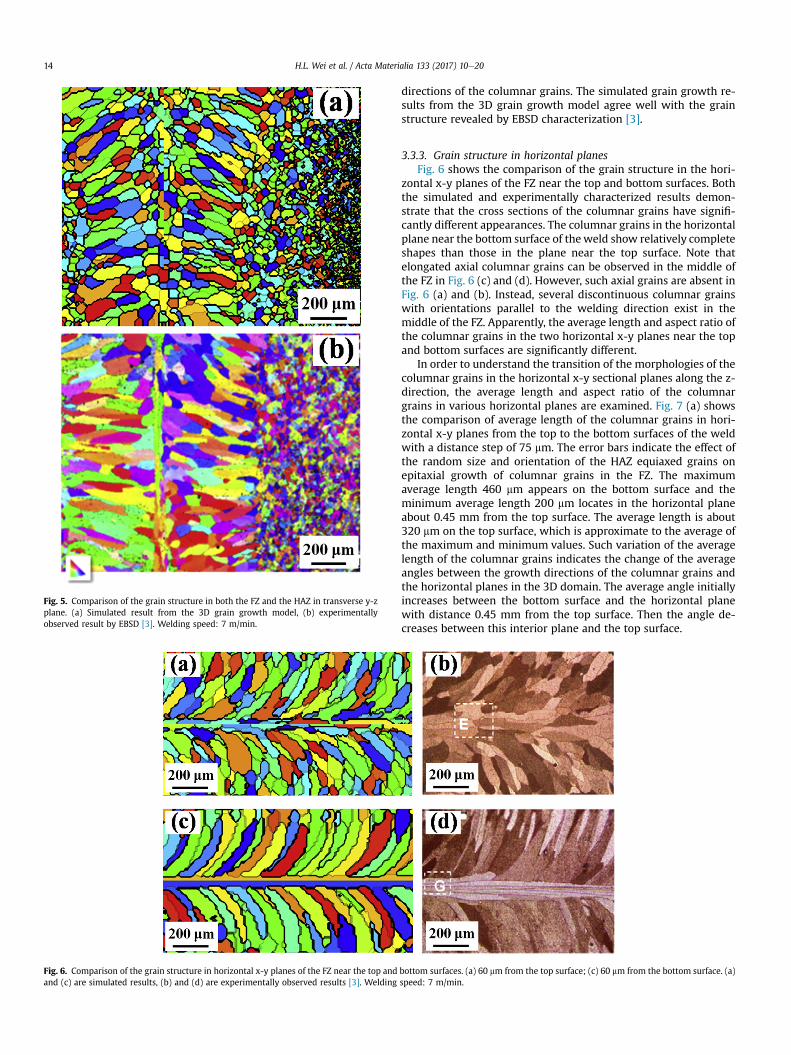
Fig. 5. Comparison of the grain structure in both the FZ and the HAZ in transverse y-zplane. (a) Simulated result from the 3D grain growth model, (b) experimentallyobserved result by EBSD [3]. Welding speed: 7 m/min.
Fig. 6. Comparison of the grain structure in horizontal x-y planes of the FZ near the top andand (c) are simulated results, (b) and (d) are experimentally observed results [3]. Welding
H.L. Wei et al. / Acta Materialia 133 (2017) 10e2014
directions of the columnar grains. The simulated grain growth re-sults from the 3D grain growth model agree well with the grainstructure revealed by EBSD characterization [3].
3.3.3. Grain structure in horizontal planesFig. 6 shows the comparison of the grain structure in the hori-
zontal x-y planes of the FZ near the top and bottom surfaces. Boththe simulated and experimentally characterized results demon-strate that the cross sections of the columnar grains have signifi-cantly different appearances. The columnar grains in the horizontalplane near the bottom surface of theweld show relatively completeshapes than those in the plane near the top surface. Note thatelongated axial columnar grains can be observed in the middle ofthe FZ in Fig. 6 (c) and (d). However, such axial grains are absent inFig. 6 (a) and (b). Instead, several discontinuous columnar grainswith orientations parallel to the welding direction exist in themiddle of the FZ. Apparently, the average length and aspect ratio ofthe columnar grains in the two horizontal x-y planes near the topand bottom surfaces are significantly different.
In order to understand the transition of the morphologies of thecolumnar grains in the horizontal x-y sectional planes along the z-direction, the average length and aspect ratio of the columnargrains in various horizontal planes are examined. Fig. 7 (a) showsthe comparison of average length of the columnar grains in hori-zontal x-y planes from the top to the bottom surfaces of the weldwith a distance step of 75 mm. The error bars indicate the effect ofthe random size and orientation of the HAZ equiaxed grains onepitaxial growth of columnar grains in the FZ. The maximumaverage length 460 mm appears on the bottom surface and theminimum average length 200 mm locates in the horizontal planeabout 0.45 mm from the top surface. The average length is about320 mm on the top surface, which is approximate to the average ofthe maximum and minimum values. Such variation of the averagelength of the columnar grains indicates the change of the averageangles between the growth directions of the columnar grains andthe horizontal planes in the 3D domain. The average angle initiallyincreases between the bottom surface and the horizontal planewith distance 0.45 mm from the top surface. Then the angle de-creases between this interior plane and the top surface.
bottom surfaces. (a) 60 mm from the top surface; (c) 60 mm from the bottom surface. (a)speed: 7 m/min.
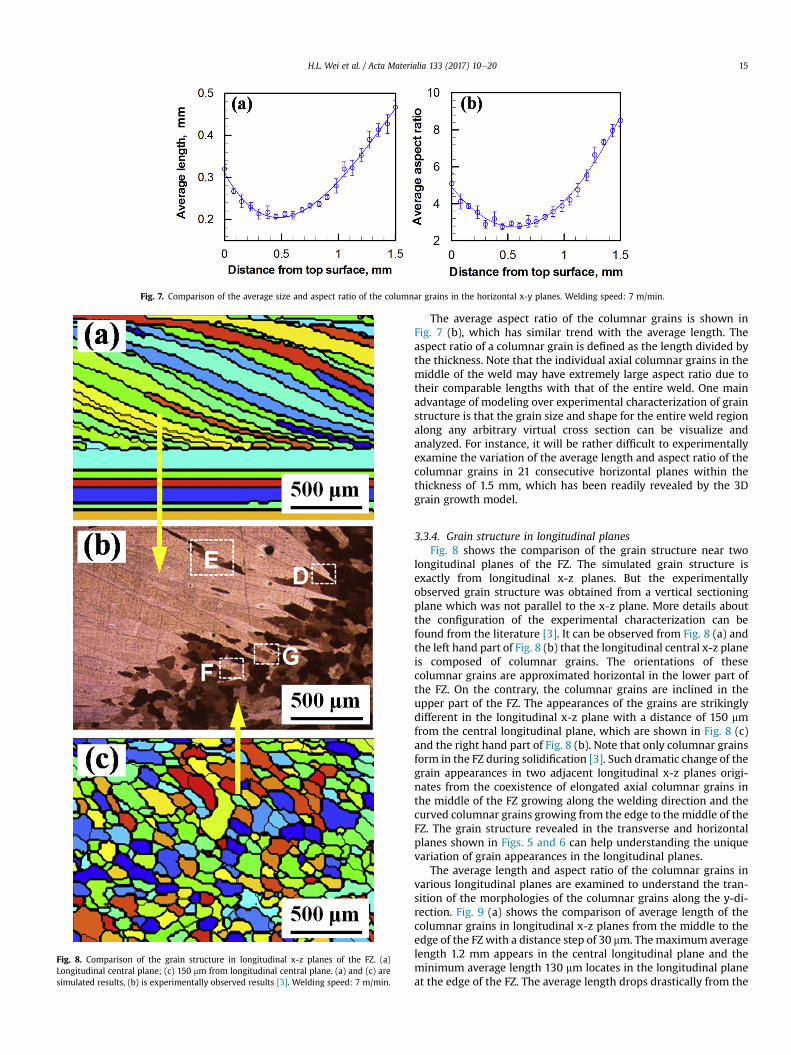
Fig. 7. Comparison of the average size and aspect ratio of the columnar grains in the horizontal x-y planes. Welding speed: 7 m/min.
Fig. 8. Comparison of the grain structure in longitudinal x-z planes of the FZ. (a)Longitudinal central plane; (c) 150 mm from longitudinal central plane. (a) and (c) aresimulated results, (b) is experimentally observed results [3]. Welding speed: 7 m/min.
H.L. Wei et al. / Acta Materialia 133 (2017) 10e20 15
The average aspect ratio of the columnar grains is shown inFig. 7 (b), which has similar trend with the average length. Theaspect ratio of a columnar grain is defined as the length divided bythe thickness. Note that the individual axial columnar grains in themiddle of the weld may have extremely large aspect ratio due totheir comparable lengths with that of the entire weld. One mainadvantage of modeling over experimental characterization of grainstructure is that the grain size and shape for the entire weld regionalong any arbitrary virtual cross section can be visualize andanalyzed. For instance, it will be rather difficult to experimentallyexamine the variation of the average length and aspect ratio of thecolumnar grains in 21 consecutive horizontal planes within thethickness of 1.5 mm, which has been readily revealed by the 3Dgrain growth model.
3.3.4. Grain structure in longitudinal planesFig. 8 shows the comparison of the grain structure near two
longitudinal planes of the FZ. The simulated grain structure isexactly from longitudinal x-z planes. But the experimentallyobserved grain structure was obtained from a vertical sectioningplane which was not parallel to the x-z plane. More details aboutthe configuration of the experimental characterization can befound from the literature [3]. It can be observed from Fig. 8 (a) andthe left hand part of Fig. 8 (b) that the longitudinal central x-z planeis composed of columnar grains. The orientations of thesecolumnar grains are approximated horizontal in the lower part ofthe FZ. On the contrary, the columnar grains are inclined in theupper part of the FZ. The appearances of the grains are strikinglydifferent in the longitudinal x-z plane with a distance of 150 mmfrom the central longitudinal plane, which are shown in Fig. 8 (c)and the right hand part of Fig. 8 (b). Note that only columnar grainsform in the FZ during solidification [3]. Such dramatic change of thegrain appearances in two adjacent longitudinal x-z planes origi-nates from the coexistence of elongated axial columnar grains inthe middle of the FZ growing along the welding direction and thecurved columnar grains growing from the edge to the middle of theFZ. The grain structure revealed in the transverse and horizontalplanes shown in Figs. 5 and 6 can help understanding the uniquevariation of grain appearances in the longitudinal planes.
The average length and aspect ratio of the columnar grains invarious longitudinal planes are examined to understand the tran-sition of the morphologies of the columnar grains along the y-di-rection. Fig. 9 (a) shows the comparison of average length of thecolumnar grains in longitudinal x-z planes from the middle to theedge of the FZ with a distance step of 30 mm. Themaximum averagelength 1.2 mm appears in the central longitudinal plane and theminimum average length 130 mm locates in the longitudinal planeat the edge of the FZ. The average length drops drastically from the
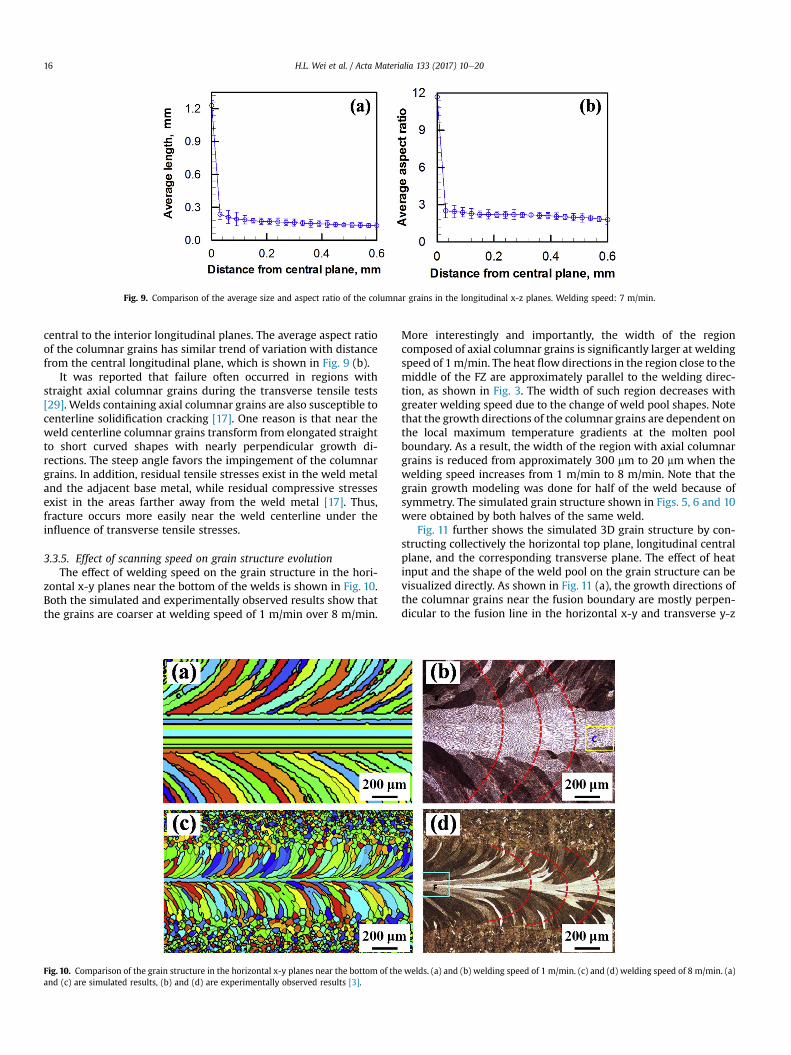
Fig. 9. Comparison of the average size and aspect ratio of the columnar grains in the longitudinal x-z planes. Welding speed: 7 m/min.
H.L. Wei et al. / Acta Materialia 133 (2017) 10e2016
central to the interior longitudinal planes. The average aspect ratioof the columnar grains has similar trend of variation with distancefrom the central longitudinal plane, which is shown in Fig. 9 (b).
It was reported that failure often occurred in regions withstraight axial columnar grains during the transverse tensile tests[29]. Welds containing axial columnar grains are also susceptible tocenterline solidification cracking [17]. One reason is that near theweld centerline columnar grains transform from elongated straightto short curved shapes with nearly perpendicular growth di-rections. The steep angle favors the impingement of the columnargrains. In addition, residual tensile stresses exist in the weld metaland the adjacent base metal, while residual compressive stressesexist in the areas farther away from the weld metal [17]. Thus,fracture occurs more easily near the weld centerline under theinfluence of transverse tensile stresses.
3.3.5. Effect of scanning speed on grain structure evolutionThe effect of welding speed on the grain structure in the hori-
zontal x-y planes near the bottom of the welds is shown in Fig. 10.Both the simulated and experimentally observed results show thatthe grains are coarser at welding speed of 1 m/min over 8 m/min.
Fig. 10. Comparison of the grain structure in the horizontal x-y planes near the bottom of theand (c) are simulated results, (b) and (d) are experimentally observed results [3].
More interestingly and importantly, the width of the regioncomposed of axial columnar grains is significantly larger at weldingspeed of 1m/min. The heat flow directions in the region close to themiddle of the FZ are approximately parallel to the welding direc-tion, as shown in Fig. 3. The width of such region decreases withgreater welding speed due to the change of weld pool shapes. Notethat the growth directions of the columnar grains are dependent onthe local maximum temperature gradients at the molten poolboundary. As a result, the width of the region with axial columnargrains is reduced from approximately 300 mm to 20 mm when thewelding speed increases from 1 m/min to 8 m/min. Note that thegrain growth modeling was done for half of the weld because ofsymmetry. The simulated grain structure shown in Figs. 5, 6 and 10were obtained by both halves of the same weld.
Fig. 11 further shows the simulated 3D grain structure by con-structing collectively the horizontal top plane, longitudinal centralplane, and the corresponding transverse plane. The effect of heatinput and the shape of the weld pool on the grain structure can bevisualized directly. As shown in Fig. 11 (a), the growth directions ofthe columnar grains near the fusion boundary are mostly perpen-dicular to the fusion line in the horizontal x-y and transverse y-z
welds. (a) and (b) welding speed of 1 m/min. (c) and (d) welding speed of 8 m/min. (a)
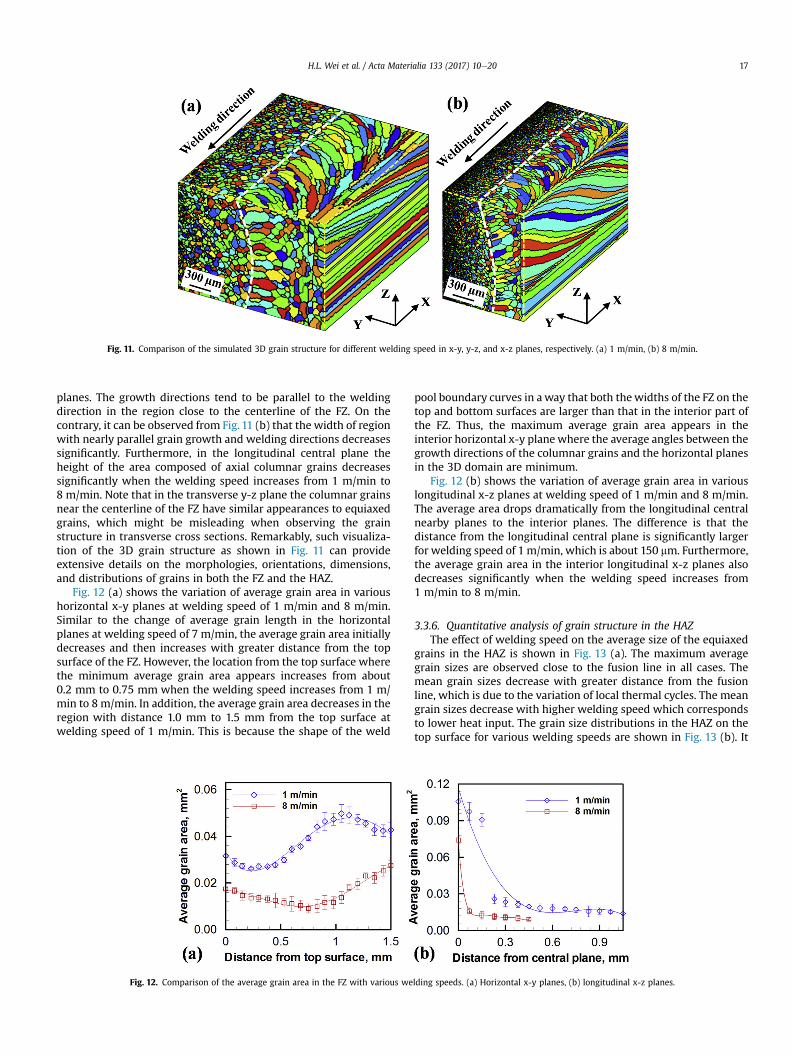
Fig. 11. Comparison of the simulated 3D grain structure for different welding speed in x-y, y-z, and x-z planes, respectively. (a) 1 m/min, (b) 8 m/min.
H.L. Wei et al. / Acta Materialia 133 (2017) 10e20 17
planes. The growth directions tend to be parallel to the weldingdirection in the region close to the centerline of the FZ. On thecontrary, it can be observed from Fig. 11 (b) that the width of regionwith nearly parallel grain growth and welding directions decreasessignificantly. Furthermore, in the longitudinal central plane theheight of the area composed of axial columnar grains decreasessignificantly when the welding speed increases from 1 m/min to8 m/min. Note that in the transverse y-z plane the columnar grainsnear the centerline of the FZ have similar appearances to equiaxedgrains, which might be misleading when observing the grainstructure in transverse cross sections. Remarkably, such visualiza-tion of the 3D grain structure as shown in Fig. 11 can provideextensive details on the morphologies, orientations, dimensions,and distributions of grains in both the FZ and the HAZ.
Fig. 12 (a) shows the variation of average grain area in varioushorizontal x-y planes at welding speed of 1 m/min and 8 m/min.Similar to the change of average grain length in the horizontalplanes at welding speed of 7 m/min, the average grain area initiallydecreases and then increases with greater distance from the topsurface of the FZ. However, the location from the top surface wherethe minimum average grain area appears increases from about0.2 mm to 0.75 mm when the welding speed increases from 1 m/min to 8 m/min. In addition, the average grain area decreases in theregion with distance 1.0 mm to 1.5 mm from the top surface atwelding speed of 1 m/min. This is because the shape of the weld
Fig. 12. Comparison of the average grain area in the FZ with various we
pool boundary curves in away that both thewidths of the FZ on thetop and bottom surfaces are larger than that in the interior part ofthe FZ. Thus, the maximum average grain area appears in theinterior horizontal x-y planewhere the average angles between thegrowth directions of the columnar grains and the horizontal planesin the 3D domain are minimum.
Fig. 12 (b) shows the variation of average grain area in variouslongitudinal x-z planes at welding speed of 1 m/min and 8 m/min.The average area drops dramatically from the longitudinal centralnearby planes to the interior planes. The difference is that thedistance from the longitudinal central plane is significantly largerfor welding speed of 1 m/min, which is about 150 mm. Furthermore,the average grain area in the interior longitudinal x-z planes alsodecreases significantly when the welding speed increases from1 m/min to 8 m/min.
3.3.6. Quantitative analysis of grain structure in the HAZThe effect of welding speed on the average size of the equiaxed
grains in the HAZ is shown in Fig. 13 (a). The maximum averagegrain sizes are observed close to the fusion line in all cases. Themean grain sizes decrease with greater distance from the fusionline, which is due to the variation of local thermal cycles. The meangrain sizes decrease with higher welding speed which correspondsto lower heat input. The grain size distributions in the HAZ on thetop surface for various welding speeds are shown in Fig. 13 (b). It
lding speeds. (a) Horizontal x-y planes, (b) longitudinal x-z planes.
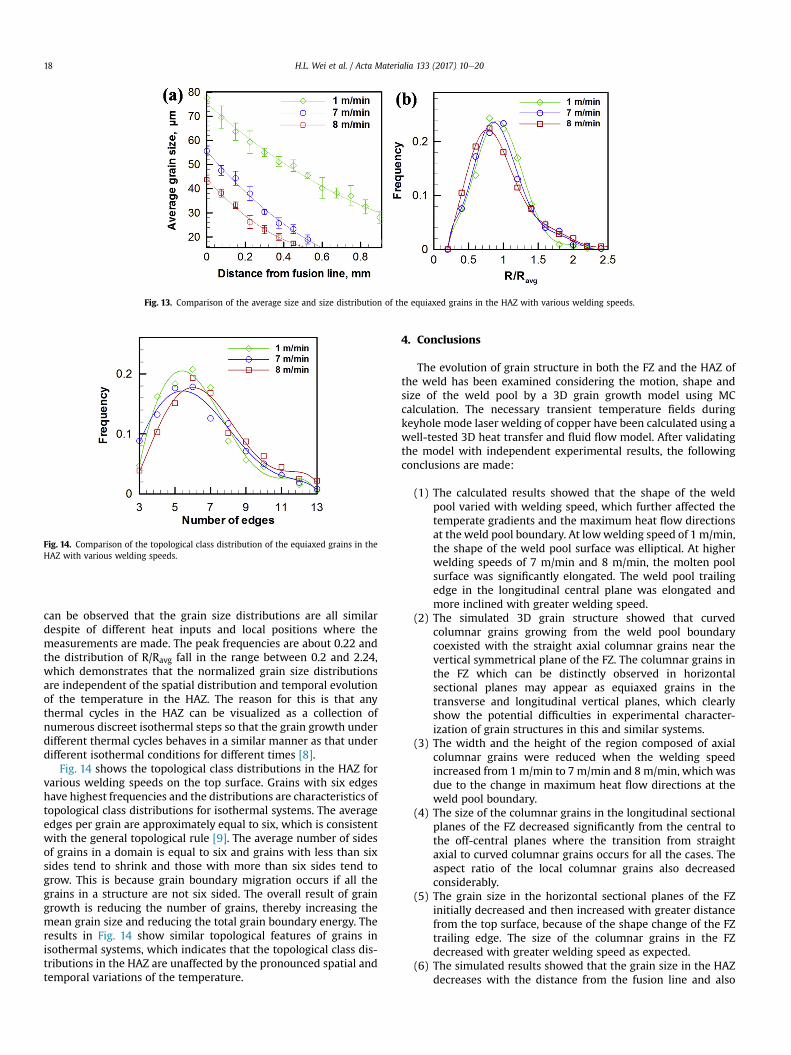
Fig. 13. Comparison of the average size and size distribution of the equiaxed grains in the HAZ with various welding speeds.
Fig. 14. Comparison of the topological class distribution of the equiaxed grains in theHAZ with various welding speeds.
H.L. Wei et al. / Acta Materialia 133 (2017) 10e2018
can be observed that the grain size distributions are all similardespite of different heat inputs and local positions where themeasurements are made. The peak frequencies are about 0.22 andthe distribution of R/Ravg fall in the range between 0.2 and 2.24,which demonstrates that the normalized grain size distributionsare independent of the spatial distribution and temporal evolutionof the temperature in the HAZ. The reason for this is that anythermal cycles in the HAZ can be visualized as a collection ofnumerous discreet isothermal steps so that the grain growth underdifferent thermal cycles behaves in a similar manner as that underdifferent isothermal conditions for different times [8].
Fig. 14 shows the topological class distributions in the HAZ forvarious welding speeds on the top surface. Grains with six edgeshave highest frequencies and the distributions are characteristics oftopological class distributions for isothermal systems. The averageedges per grain are approximately equal to six, which is consistentwith the general topological rule [9]. The average number of sidesof grains in a domain is equal to six and grains with less than sixsides tend to shrink and those with more than six sides tend togrow. This is because grain boundary migration occurs if all thegrains in a structure are not six sided. The overall result of graingrowth is reducing the number of grains, thereby increasing themean grain size and reducing the total grain boundary energy. Theresults in Fig. 14 show similar topological features of grains inisothermal systems, which indicates that the topological class dis-tributions in the HAZ are unaffected by the pronounced spatial andtemporal variations of the temperature.
4. Conclusions
The evolution of grain structure in both the FZ and the HAZ ofthe weld has been examined considering the motion, shape andsize of the weld pool by a 3D grain growth model using MCcalculation. The necessary transient temperature fields duringkeyhole mode laser welding of copper have been calculated using awell-tested 3D heat transfer and fluid flow model. After validatingthe model with independent experimental results, the followingconclusions are made:
(1) The calculated results showed that the shape of the weldpool varied with welding speed, which further affected thetemperate gradients and the maximum heat flow directionsat the weld pool boundary. At lowwelding speed of 1 m/min,the shape of the weld pool surface was elliptical. At higherwelding speeds of 7 m/min and 8 m/min, the molten poolsurface was significantly elongated. The weld pool trailingedge in the longitudinal central plane was elongated andmore inclined with greater welding speed.
(2) The simulated 3D grain structure showed that curvedcolumnar grains growing from the weld pool boundarycoexisted with the straight axial columnar grains near thevertical symmetrical plane of the FZ. The columnar grains inthe FZ which can be distinctly observed in horizontalsectional planes may appear as equiaxed grains in thetransverse and longitudinal vertical planes, which clearlyshow the potential difficulties in experimental character-ization of grain structures in this and similar systems.
(3) The width and the height of the region composed of axialcolumnar grains were reduced when the welding speedincreased from 1m/min to 7 m/min and 8 m/min, which wasdue to the change in maximum heat flow directions at theweld pool boundary.
(4) The size of the columnar grains in the longitudinal sectionalplanes of the FZ decreased significantly from the central tothe off-central planes where the transition from straightaxial to curved columnar grains occurs for all the cases. Theaspect ratio of the local columnar grains also decreasedconsiderably.
(5) The grain size in the horizontal sectional planes of the FZinitially decreased and then increased with greater distancefrom the top surface, because of the shape change of the FZtrailing edge. The size of the columnar grains in the FZdecreased with greater welding speed as expected.
(6) The simulated results showed that the grain size in the HAZdecreases with the distance from the fusion line and also
H.L. Wei et al. / Acta Materialia 133 (2017) 10e20 19
decreases with the increase in welding speed due to weakerthermal cycles. The grain size distributions and topologicalclass distributions in the HAZ were unaffected by weldingspeeds, which obeyed the normal distribution similar toisothermal systems.
Acknowledgements
This work was supported by US Department of Energy NEUPGrant DE-NE0008280.
Appendix A. Grain growth model for the HAZ and the FZ
A1.1. Grain growth in the HAZ
The grain growth in the HAZ is simulated using MC techniquewhich is based on Potts' model [24]. The details of the model areavailable in the literature [8,10,25,26] and only the salient featurespertinent to the specific problems in this paper are described here.The grid points are designated in the solid region with 15 mmspacing for the initialization of the simulation process. These gridpoints are assigned a random orientation number between 1 and q,where q is the total number of possible grain orientations. Theinitial orientations of each site are represented by random integralnumbers between 1 and 48. The adjacent sites have identicalorientation number in each individual grain. The grain boundarieslocate at the neighbor sites with unlike grain orientations.
The grain boundary energy is determined by defining an inter-action between nearest neighbor lattice sites. The local interactionenergy E is calculated by the Hamiltonian [30]:
E ¼ �JXnj¼1
�dSiSj � 1
�(A.1)
where J is a positive constant which sets the scale of the grainboundary energy, d is Kronecker's delta function, Si is the orienta-tion at a randomly selected site i, Sj are the orientations of itsnearest neighbors, and n is the total number of nearest neighborsites. Each pair of nearest neighbor contributes J to the total energywhen they have unlike orientations.
The kinetics of grain boundary migration are simulated byrandomly selecting a site and altering its orientation to one of itsnearest neighbor orientations, and judging the system energyvariation due to the attempted orientation change. The probabilityof orientation change is defined as [31]:
P ¼ 1 for DE � 0 (A.2)
P ¼ e�DEkBT for DE � 0 (A.3)
where DE is the change of energy due to the change of orientation,kB is the Boltzmann constant and T is the temperature. Boundarymigration, i.e. grain expansion or shrinkage, occurs upon any suc-cessful reorientation of a grain to orientations of its nearestneighbors.
The material properties and temperature-time history areconsidered in the grain growth kinetics using MC technique, whichestablishes a relation between the MC simulation time (tMCS) andreal time through a grain boundary migration model [27]. Theexpression of the MC time, tMCS, can be described as [32]:
tMCS ¼(
1K1l
"4gAZV2
m
N2ah
eDSa=RXi
�Dtiexp
�� QRTi
��þ L20
#12
� 1K1
) 1n1
(A.4)
where l is the grid spacing, K1 and n1 are model constants, g is thegrain boundary energy, A is the accommodation probability, Z is theaverage number of atoms per unit area at the grain boundary, Vm isthe atomic molar volume, Na is Avagadro's number, h is Planck'sconstant, DSa is the activation entropy, Q is that activation enthalpyfor grain growth, T is the absolute temperature, R is the gas con-stant, L0 is the initial average grain size and t is time. Eq. (A.4) in-dicates that higher values of tMCS are obtained at sites with highertemperature and longer grain growth time.
The site selection probability for all grains is identical due to therandom selection of grid points during the update of grain orien-tation numbers in traditional MC calculations. Actually grains growfaster in regions that experience stronger thermal cycles. Theprobability p to visit each site is calculated by considering thegradient of tMCS [26]:
p ¼ tMCS
tMCSMAX(A.5)
where tMCS is the computed MC simulation time at any site andtMCSMAX is the maximum MC simulation time in the entire calcu-lation domain. Eq. (A.5) indicates that locations with higher siteprobability have higher tMCS and are updated more frequently.
A1.2. Grain growth in the FZ
Columnar grains in the FZ grow epitaxially from the partiallymelted grains in the HAZwhere grain growth also occurs with time.The columnar grains then grow along location dependent di-rections and speeds. The incremental growth of grains for each timestep modifies the local directions and velocities. The solidificationdirection is parallel to the local maximum temperature gradient,which is normal to the S/L interface, on the trailing side of themolten pool. The temperature gradient G at any location of the S/Linterface of the molten pool is calculated by Refs. [20,28,33]:
G ¼ kVTk ¼����vTvx iþ vT
vyjþ vT
vzk���� (A.6)
where T is temperature and i, j and k are unit vectors in the weldingdirection, x, width direction, y and the vertical depth direction, z,respectively. The angle a between the scanning direction and themaximum heat flow direction that the grains follow is calculatedby:
cos a ¼ �vT=vxG
(A.7)
The local solidification rate Rloc is the speed at the S/L interfaceon the trailing side of the molten pool moving at steady state, asindicated in Fig. 1. Its value is position dependent and changes fromRloc ¼ 0 at the maximumweld width to Rloc ¼ Rmax at the centerlineon the top surface of the weld. The solidification rate is calculatedas:
Rloc ¼ Rmax$cos a (A.8)
where Rmax is the maximum solidification rate which is the same asthe scanning speed. The freshly solidified grains thicken in size inthe FZ which is simulated using the MC model.
H.L. Wei et al. / Acta Materialia 133 (2017) 10e2020
References
[1] R. Rai, J.W. Elmer, T.A. Palmer, T. DebRoy, Heat transfer and fluid flow duringkeyhole mode laser welding of tantalum, Tie6Ale4V, 304L stainless steel andvanadium, J. Phys. D Appl. Phys. 40 (18) (2007) 5753e5766.
[2] T. DebRoy, S.A. David, Physical processes in fusion welding, Rev. Mod. Phys. 67(1) (1995) 85e112.
[3] L.J. Zhang, G.F. Zhang, J. Ning, X.J. Zhang, J.X. Zhang, Microstructure andproperties of the laser butt welded 1.5-mm thick T2 copper joint achieved athigh welding speed, Mater. Des. 88 (2015) 720e736.
[4] S.A. David, J.M. Vitek, Correlation between solidification parameters and weldmicrostructures, Int. Mater. Rev. 34 (1) (1989) 213e245.
[5] Y. Kawahito, M. Mizutani, S. Katayama, High quality welding of stainless steelwith 10 kW high power fibre laser, Sci. Technol. Weld. Joi 14 (2013) 288e294.
[6] Yousuke Kawahito, Masami Mizutani, Seiji Katayama, Elucidation of high-power fibre laser welding phenomena of stainless steel and effect of factorson weld geometry, J. Phys. D Appl. Phys. 40 (19) (2007) 5854e5859.
[7] J.J. Blecher, C.M. Galbraith, C. Van Vlack, T.A. Palmer, J.M. Fraser, P.J.L. Webster,T. DebRoy, Real time monitoring of laser beam welding keyhole depth by laserinterferometry, Sci. Technol. Weld. Join. 19 (7) (2014) 560e564.
[8] S. Mishra, T. DebRoy, Measurements and Monte Carlo simulation of graingrowth in the heat-affected zone of Tie6Ale4V welds, Acta Mater 52 (2004)1183e1192.
[9] S. Mishra, T. DebRoy, Grain topology in Tie6Ale4V weldsdmonte Carlosimulation and experiments, J. Phys. D Appl. Phys. 37 (15) (2004) 2191e2196.
[10] Z. Yang, S. Sista, J.W. Elmer, T. DebRoy, Three dimensional Monte Carlosimulation of grain growth during GTA welding of titanium, Acta Mater. 48(20) (2000) 4813e4825.
[11] Z. Yang, J.W. Elmer, J. Wong, T. DebRoy, Evolution of titanium arc weldmentmacro and microstructures - modeling and real time mapping of phases,Weld. J. 79 (2000) 97Se112S.
[12] Wenda Tan, Yung C. Shin, Multi-scale modeling of solidification and micro-structure development in laser keyhole welding process for austenitic stain-less steel, Comput. Mater. Sci. 98 (2015) 446e458.
[13] Shijia Chen, Gildas Guillemot, Charles-Andr�e Gandin, 3D coupled cellularautomaton (CA)eFinite element (FE) modeling for solidification grain struc-tures in gas tungsten arc welding (GTAW), ISIJ Int. 54 (2) (2014) 401e407.
[14] Shijia Chen, Gildas Guillemot, Charles-Andr�e Gandin, Three-dimensionalcellular automaton-finite element modeling of solidification grain structuresfor arc-welding processes, Acta Mater. 115 (2016) 448e467.
[15] H.L. Wei, J.W. Elmer, T. DebRoy, Three-dimensional modeling of grain struc-ture evolution during welding of an aluminum alloy, Acta Mater. 126 (2017)413e425.
[16] Jie Ning, Lin-Jie Zhang, An Wang, Qing-Lin Bai, Jian-Nan Yang, Jian-Xun Zhang,Effects of double-pass welding and extrusion on properties of fiber laser
welded 1.5-mm thick T2 copper joints, J. Mater. Process. Technol. 237 (2016)75e87.
[17] S. Kou, Welding Metallurgy, second ed., John Wiley & Sons, Hoboken, NJ,2003.
[18] R. Rai, S.M. Kelly, R.P. Martukanitz, T. DebRoy, A convective heat-transfermodel for partial and full penetration keyhole mode laser welding of astructural steel, Metall. Mater. Trans. A 39 (2007) 98e112.
[19] H. Zhao, T. DebRoy, Macroporosity free aluminum alloy weldments throughnumerical simulation of keyhole mode laser welding, J. Appl. Phys. 93 (12)(2003) 10089e10096.
[20] H.L. Wei, J.W. Elmer, T. DebRoy, Origin of grain orientation during solidifica-tion of an aluminum alloy, Acta Mater. 115 (2016) 123e131.
[21] S.A. David, T. DebRoy, Current issues and problems in welding science, Science257 (5069) (1992) 497e502.
[22] K. Mundra, T. DebRoy, K.M. Kelkar, Numerical prediction of fluid flow and heattransfer in welding with a moving heat source, Numer. Heat. Tr. A - Appl. 29(1996) 115e129.
[23] H.L. Wei, J.J. Blecher, T.A. Palmer, T. DebRoy, Fusion zone microstructure andgeometry in complete-joint-penetration laser-arc hybrid welding of low-alloysteel, Weld. J. 94 (2015) 135Se144S.
[24] R.B. Potts, Some generalized order-disorder transformations, Proc. Camb.Philos. Soc. 48 (1952) 106e109.
[25] B. Radhakrishnan, T. Zacharia, Simulation of curvature-driven grain growth byusing a modified monte carlo algorithm, Metall. Mater. Trans. A 26 (1) (1995)167e180.
[26] B. Radhakrishnan, T. Zacharia, Monte Carlo simulation of grain boundarypinning in the weld heat-affected zone, Metall. Mater. Trans. A 26 (8) (1995)2123e2130.
[27] J.H. Gao, R.G. Thompson, Real time-temperature models for Monte Carlosimulations of normal grain growth, Acta Mater 44 (1996) 4565e4570.
[28] H.L. Wei, J. Mazumder, T. DebRoy, Evolution of solidification texture duringadditive manufacturing, Sci. Rep. 5 (2015). Article number: 16446.
[29] S.R.Koteswara Rao, G. Madhusudhana Reddy, M. Kamaraj, K. Prasad Rao, Grainrefinement through arc manipulation techniques in AleCu alloy GTA welds,Mater. Sci. Eng. A 404 (1e2) (2005) 227e234.
[30] S. Sista, T. Debroy, Three-dimensional monte carlo simulation of grain growthin zone-refined iron, Metall. Mater. Trans. B 32 (6) (2001) 1195e1201.
[31] M.P. Anderson, D.J. Srolovitz, G.S. Grest, P.S. Sahni, Computer simulation ofgrain growthdI. Kinetics, Acta Metall. 32 (5) (1984) 783e791.
[32] S. Mishra, T. DebRoy, Non-isothermal grain growth in metals and alloys,Mater. Sci. Technol. 22 (3) (2006) 253e278.
[33] J.J. Blecher, T.A. Palmer, T. DebRoy, Solidification map of a nickel-base alloy,Metall. Mater. Trans. A 45 (4) (2014) 2142e2151.
[34] K. Mills, Recommended Values of Thermophysical Properties for SelectedCommercial Alloys, Woodhead Publishing Limited, England, 2002.