Embed Size (px)
Citation preview
Cryogenic Far-Infrared Detectors for the Space Infrared Interferometric Telescope (SPIRIT)
Dominic J. Benford, Stephen A. Rinehart, David T. Leisawitz, and T. Tupper Hyde
NASA / Goddard Space Flight Center, Greenbelt, MD 20771 USA
ABSTRACT
SPIRIT is a spatial and spectral interferometer with an operating wavelength range 25µm – 400µm. As a double-Fourier interferometer, SPIRIT features sub-arcsecond spatial resolution and R = 3000 spectral resolution over a 1 arcmin field of view. Its three primary scientific objectives are to: (1) Learn how planetary systems form from protostellar disks, and how they acquire their chemical organization; (2) Characterize the family of extrasolar planetary systems by imaging the structure in debris disks to understand how and where planets form, and why some planets are ice giants and others are rocky; and (3) Learn how high-redshift galaxies formed and merged to form the present-day population of galaxies. The detector subsystem provides a set of far-infrared detector arrays in the SPIRIT instrument. These arrays are used for science purposes by detecting the faint interferometric signal. The resulting technology requirement is for a set of eight arrays operating at wavelengths of 25µm-400µm, divided into two arrays per octave. At the short wavelength end, the arrays are 14x14, shrinking to 2x2 at the longest band. The per-pixel sensitivity requirement of 10–19 W/√Hz, coupled with speed of tau_effective~150µs, make these relatively small arrays challenging. Their operating temperature will be around 50mK. Over the majority of the SPIRIT wavelength range and sensitivity requirement, there are no commercial vendors of detector arrays, and thus they will require a separate NASA-supported development.
Keywords: infrared interferometer, far-infrared astronomy, superconducting bolometer array, transition edge sensor, SQUID multiplexer
1. INTRODUCTION The Space Infrared Interferometric Telescope (SPIRIT) will provide integral field spectroscopy throughout the wavelength range 25 – 400 µm with sub-arcsecond angular resolution and λ/∆λ = 3000 spectral resolution in a 1 arcminute instantaneous field of view. Many of the astronomical targets of interest will be resolved for the first time at far-IR wavelengths. SPIRIT’s spatially resolved spectra will break model degeneracy and enable a new physical understanding of forming stars and planetary systems, mature planetary systems, and galaxies.
A single scientific instrument gives SPIRIT its powerful combination of spatial and spectroscopic measurement capabilities. SPIRIT is a Michelson stellar interferometer with a scanning optical delay line for Fourier transform spectroscopy and compensation of external optical path length differences. Following beam combination in the pupil plane, detector arrays multiplex the area coverage, expanding the field of view from the diffraction spot size of the individual light collecting telescopes to the desired arcminute scale. SPIRIT’s two telescopes can be moved to sample many interferometric baselines, and therefore spatial structure on all of the angular scales necessary to produce high-quality far-IR images. The image resolution, 0.3 (λ/100 µm) arcsec, is determined by the maximum baseline length, 36 m. To attain superlative sensitivity, limited by astrophysical background photon noise, the SPIRIT optics are cooled to 4 K and sufficiently sensitive detectors will be used.
The results of a pre-Formulation Phase study of the SPIRIT mission concept are given in a series of papers, of which this paper is one. The scientific objectives, measurement requirements, and an overview of the design concept are described by Leisawitz et al. (2007).[1] A description of the mission concept from a systems engineering point of view is given by Hyde et al. (2007).[2] Wilson et al. (2007)[3] describe the optics and stray light trades. Budinoff et al. (2007)[4] describe the SPIRIT mechanical design and mechanisms and explains how the mechanical design will meet instrument stability, thermal and packaging requirements. DiPirro et al. (2007)[5] present the thermal design concept, thermal modeling results, and the cooling power requirements, and they explain how cryocoolers will be used to meet these requirements. Rinehart et al. (2007)[6] update the status of our development of the wide-field imaging interferometry technique applicable to SPIRIT, and Martino et al. (2007) [7] describe a model of the Wide-field Imaging Interferometry Testbed, a model which can be adapted to simulate interferometric data from SPIRIT. This paper covers detector requirements,
*[email protected]; phone 301 286 5386; Applied Engineering and Technology Directorate, NASA GSFC.
including noise equivalent power (NEP), pixel count and readout speed, and present the rationale for using small arrays of superconducting transition edge sensor (TES) bolometers.
2. SPIRIT DETECTOR SUBSYSTEM REQUIREMENTS A description of the SPIRIT mission concept (Hyde et al. 2007[2]) details the aspects of the instrument and operations that impact on the detector subsystem. The driving requirements laid out in that concept are:
(1) Wavelength range of 25 µm – 400 µm (2) Field of view of 1.0’ square (3) Observation duration of 24h total (4) Telescopes (two) of diameter 1 m and temperature 4 K (5) Baseline range of 6 m – 36 m (6) Spectral resolution of R=3000 or greater at the center of all wavelength bands.
One thing to note in the above assumption is that the amount of time required to produce a full uv-sampled image is quite long: the baseline step size of (1m/2 = 0.5m), baseline throw (36 m – 6m = 30 m), and mean rotation time (1.59 hr/rev) combine (under naïve assumptions) to produce a ~50 hr observation. In order to produce the baseline observation time of 24h, we instead assume a uv spacing of only 1m.
The pixel count is required to Nyquist sample the field-of-view (FOV) at each wavelength λx, where the wavelength x must be chosen (e.g., center of the band). The array size is easily calculated using:
W = 2FOV
1.22λxDaperture
, (1)
where W is the pixel count on one side of a square array, and Daperture is the telescope diameter.
To place a requirement on the speed of the detector, we first need to estimate the speed of optical modulation. First, we determine the number of uv positions Ψ to be acquired:
Ψ ~12
Bmax2 − Bmin
2( )Daperture
2
4
= 2520 for baseline assumptions. (2)
In an integration time T, we know that SPIRIT must sweep its delay line Ψ times by a distance a ξ that depends on the field of view and the spectral resolution R. It is given by:
ξ = Rλmid( )+ sin(FOV )* Bmax( ) = 12.27 cm (3)
Because of the physical layout of the optical delay line, the total optical stroke is a factor of ϑ longer than ξ, whereas the physical motion required of the mechanism is only ξ/2. As per the mechanical design (Budinoff et al. 2007[4]), if ϑ=1 at the shortest band, then ϑ=3,5,7,… for each subsequent wavelength octave longward of this. So, the optical modulation rate is given by:
OMR =total stroke
λshort
⋅
Nscans / image
Timage
= 291.67HzT
24hr
−1 Ψ2520
ϑξ(cm)
λshort (µm)
Hz ~ 215 Hz at λshort.=50µm. (4)
The detectors should be read out faster than this optical modulation rate by a factor of υ=4 (see Rinehart et al. 2007[6]). The detector effective time constant must be a factor ω of a few faster than this. How much is not known, as it will
require a fairly sophisticated simulation to determine the impact of detector speed on the correlations in the interferogram. Conservatively, we assume that this factor is ω=2π~6. Then, the time constant requirement is:
τ effective ≤ OMR( )−1 υω( )−1= 185 µs. (5)
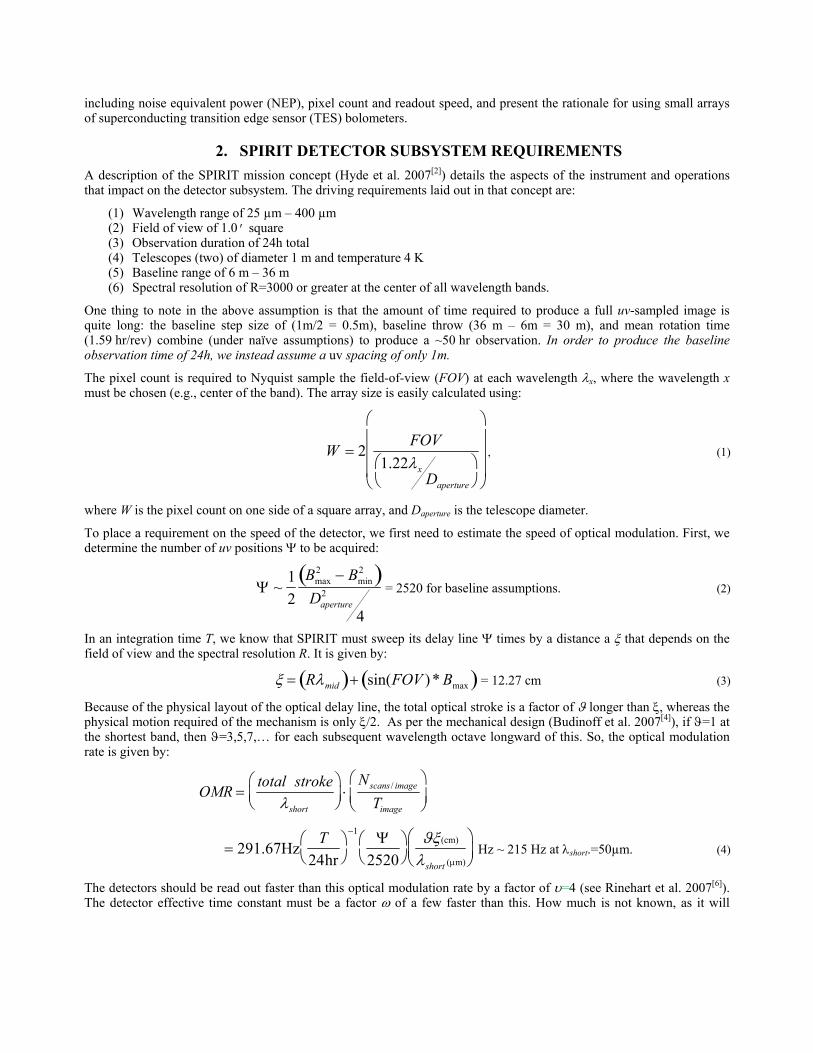
We can derive the sensitivity requirement of these detectors from the background power expected in operation. It is desired that these detectors have background-limited performance. Our model of the sky brightness (in MJy/sr) includes contributions from Zodiacal emission and scattering near the plane of the ecliptic, telescope emission, the cosmic microwave background, Galactic cirrus, and extragalactic sources. We further calculate the optical power and photon fluctuation power (often referred to as the noise equiavelent power, or NEP) for this photon stream. The result of this calculation is shown in Figure 1, with quantities for the 5 octaves of SPIRIT A bands (Hyde et al. 2007[2]) of 25-50µm, 50-100µm, 100-200µm, 200-400µm, and 400-800µm. SPIRIT C (ibid) uses the all but the longest wavelength band.
Fig. 1. Natural sky brightness in dark regions of the ecliptic, highlighting the five SPIRIT A bands and showing the photon
power and NEP for each band; SPIRIT C uses the four shorter wavelength bands.
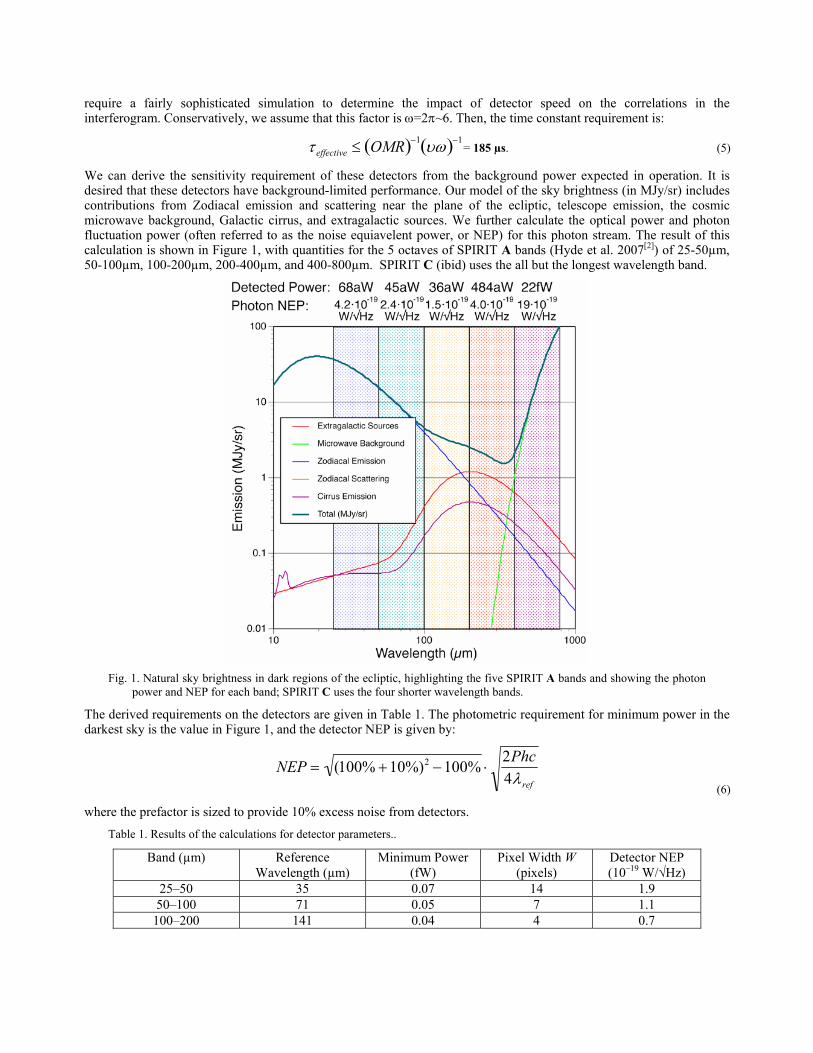
The derived requirements on the detectors are given in Table 1. The photometric requirement for minimum power in the darkest sky is the value in Figure 1, and the detector NEP is given by:
NEP = (100% +10%)2 −100% ⋅2Phc4λref (6)
where the prefactor is sized to provide 10% excess noise from detectors.
Table 1. Results of the calculations for detector parameters..
Band (µm) Reference Wavelength (µm)
Minimum Power (fW)
Pixel Width W (pixels)
Detector NEP (10–19 W/√Hz)
25–50 35 0.07 14 1.9 50–100 71 0.05 7 1.1
100–200 141 0.04 4 0.7
200–400 283 0.48 2 1.8
3. DETECTOR SUBSYSTEM IMPLEMENTATION 2.1 Detector Architecture
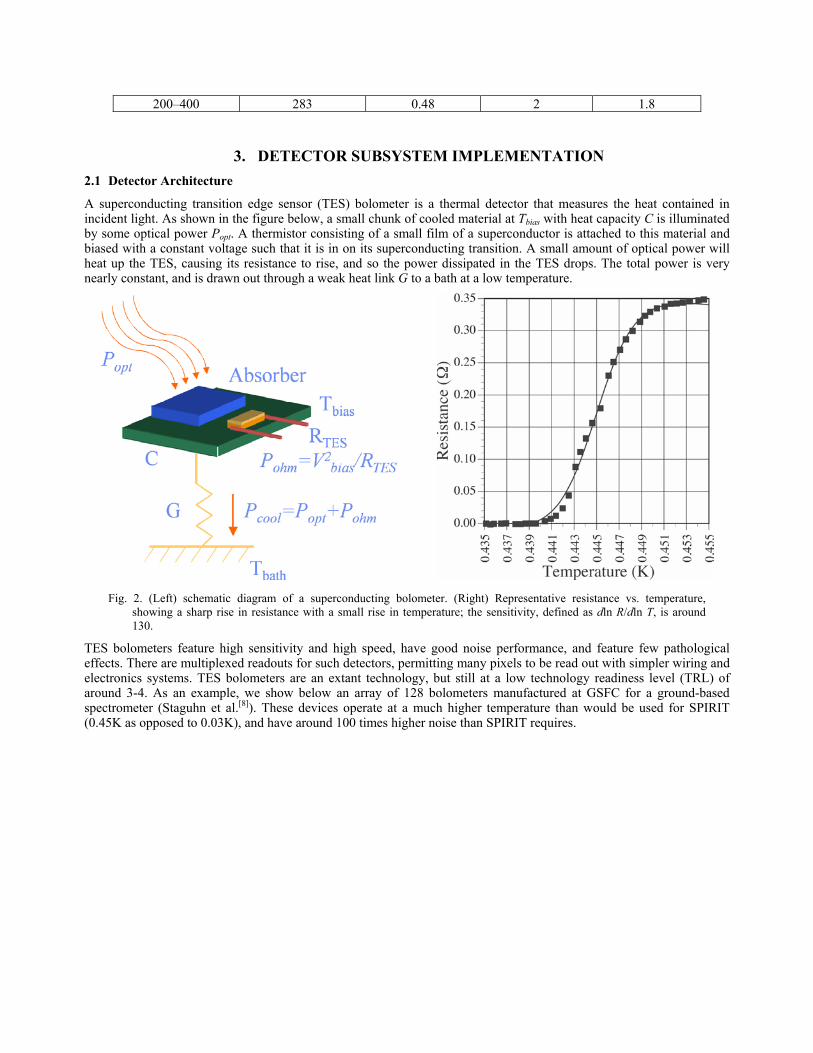
A superconducting transition edge sensor (TES) bolometer is a thermal detector that measures the heat contained in incident light. As shown in the figure below, a small chunk of cooled material at Tbias with heat capacity C is illuminated by some optical power Popt. A thermistor consisting of a small film of a superconductor is attached to this material and biased with a constant voltage such that it is in on its superconducting transition. A small amount of optical power will heat up the TES, causing its resistance to rise, and so the power dissipated in the TES drops. The total power is very nearly constant, and is drawn out through a weak heat link G to a bath at a low temperature.
Fig. 2. (Left) schematic diagram of a superconducting bolometer. (Right) Representative resistance vs. temperature, showing a sharp rise in resistance with a small rise in temperature; the sensitivity, defined as dln R/dln T, is around 130.
TES bolometers feature high sensitivity and high speed, have good noise performance, and feature few pathological effects. There are multiplexed readouts for such detectors, permitting many pixels to be read out with simpler wiring and electronics systems. TES bolometers are an extant technology, but still at a low technology readiness level (TRL) of around 3-4. As an example, we show below an array of 128 bolometers manufactured at GSFC for a ground-based spectrometer (Staguhn et al.[8]). These devices operate at a much higher temperature than would be used for SPIRIT (0.45K as opposed to 0.03K), and have around 100 times higher noise than SPIRIT requires.
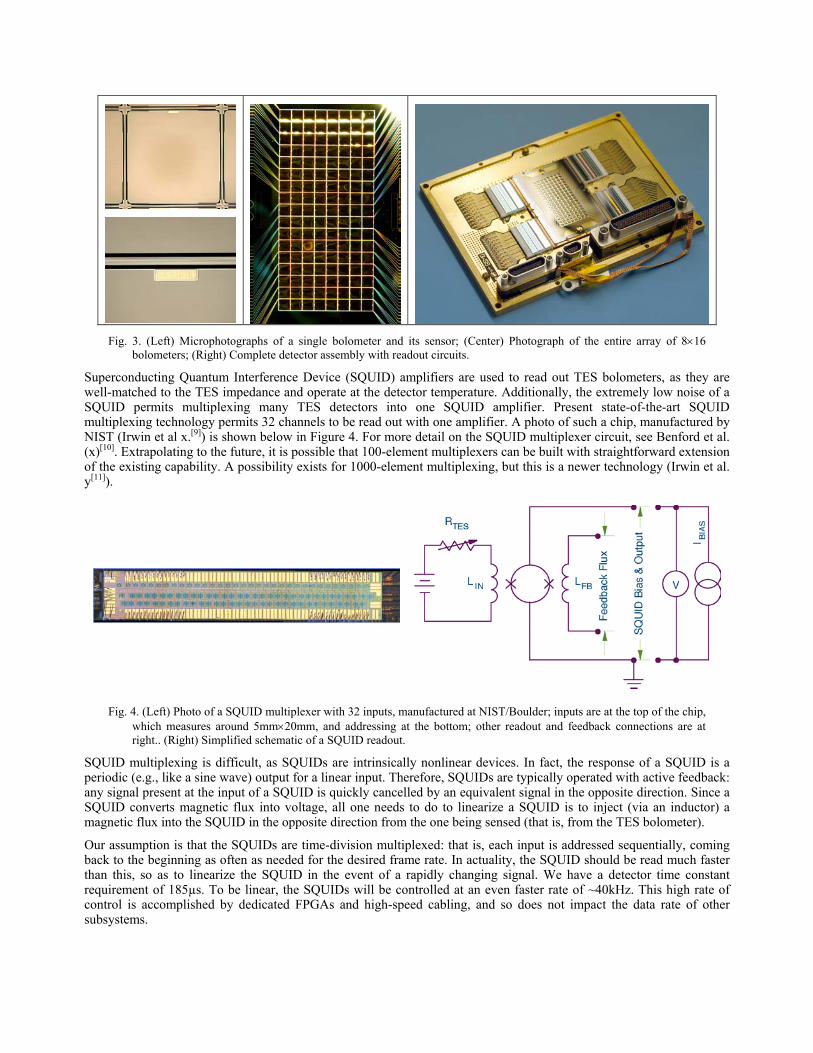
Fig. 3. (Left) Microphotographs of a single bolometer and its sensor; (Center) Photograph of the entire array of 8×16 bolometers; (Right) Complete detector assembly with readout circuits.
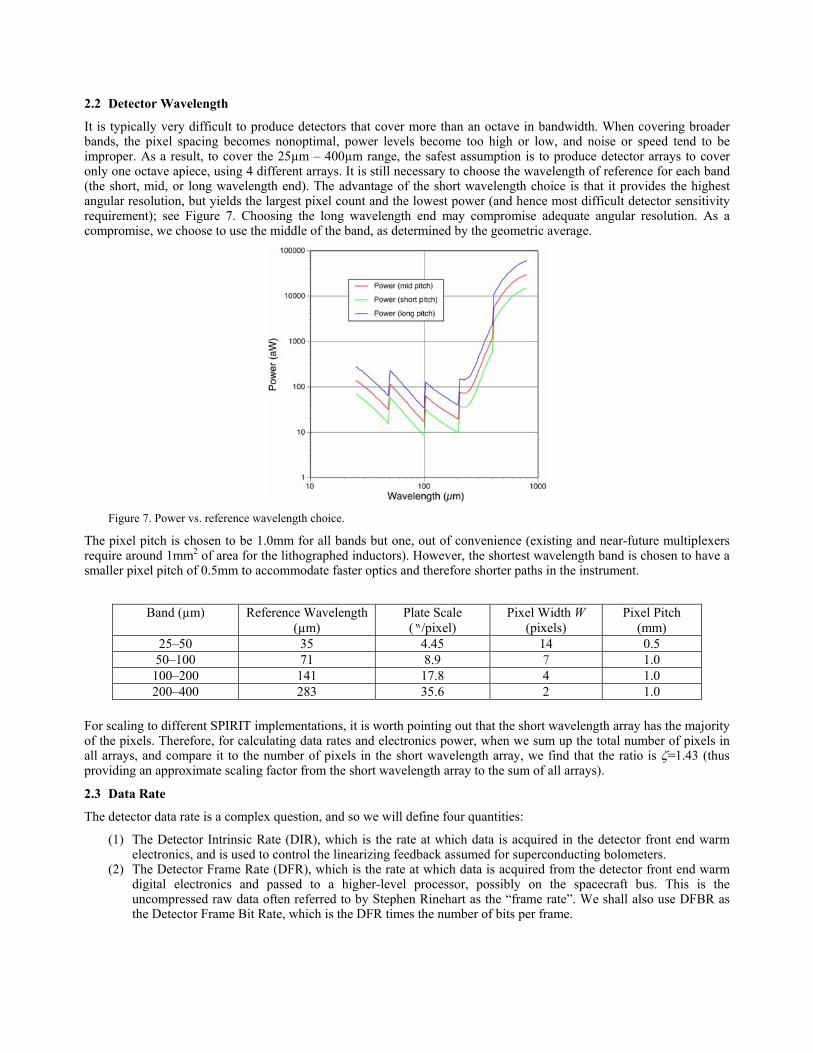
Superconducting Quantum Interference Device (SQUID) amplifiers are used to read out TES bolometers, as they are well-matched to the TES impedance and operate at the detector temperature. Additionally, the extremely low noise of a SQUID permits multiplexing many TES detectors into one SQUID amplifier. Present state-of-the-art SQUID multiplexing technology permits 32 channels to be read out with one amplifier. A photo of such a chip, manufactured by NIST (Irwin et al x.[9]) is shown below in Figure 4. For more detail on the SQUID multiplexer circuit, see Benford et al. (x)[10]. Extrapolating to the future, it is possible that 100-element multiplexers can be built with straightforward extension of the existing capability. A possibility exists for 1000-element multiplexing, but this is a newer technology (Irwin et al. y[11]).
Fig. 4. (Left) Photo of a SQUID multiplexer with 32 inputs, manufactured at NIST/Boulder; inputs are at the top of the chip, which measures around 5mm×20mm, and addressing at the bottom; other readout and feedback connections are at right.. (Right) Simplified schematic of a SQUID readout.
SQUID multiplexing is difficult, as SQUIDs are intrinsically nonlinear devices. In fact, the response of a SQUID is a periodic (e.g., like a sine wave) output for a linear input. Therefore, SQUIDs are typically operated with active feedback: any signal present at the input of a SQUID is quickly cancelled by an equivalent signal in the opposite direction. Since a SQUID converts magnetic flux into voltage, all one needs to do to linearize a SQUID is to inject (via an inductor) a magnetic flux into the SQUID in the opposite direction from the one being sensed (that is, from the TES bolometer).
Our assumption is that the SQUIDs are time-division multiplexed: that is, each input is addressed sequentially, coming back to the beginning as often as needed for the desired frame rate. In actuality, the SQUID should be read much faster than this, so as to linearize the SQUID in the event of a rapidly changing signal. We have a detector time constant requirement of 185µs. To be linear, the SQUIDs will be controlled at an even faster rate of ~40kHz. This high rate of control is accomplished by dedicated FPGAs and high-speed cabling, and so does not impact the data rate of other subsystems.
2.2 Detector Wavelength
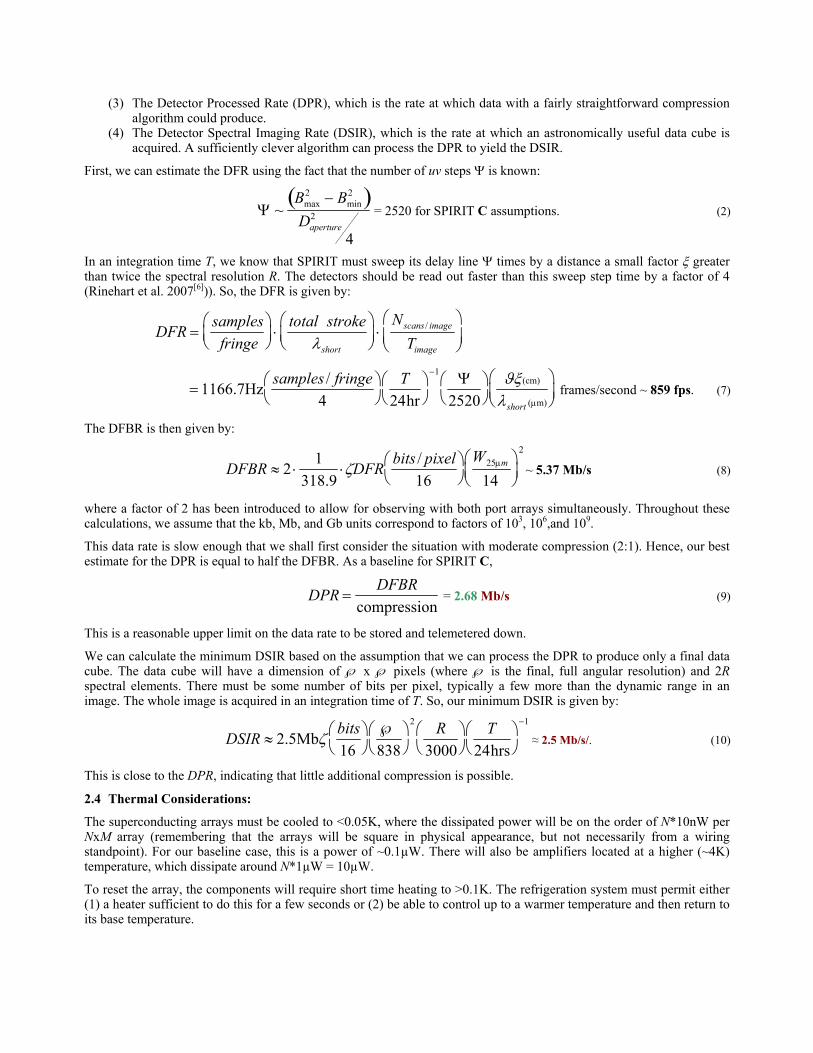
It is typically very difficult to produce detectors that cover more than an octave in bandwidth. When covering broader bands, the pixel spacing becomes nonoptimal, power levels become too high or low, and noise or speed tend to be improper. As a result, to cover the 25µm – 400µm range, the safest assumption is to produce detector arrays to cover only one octave apiece, using 4 different arrays. It is still necessary to choose the wavelength of reference for each band (the short, mid, or long wavelength end). The advantage of the short wavelength choice is that it provides the highest angular resolution, but yields the largest pixel count and the lowest power (and hence most difficult detector sensitivity requirement); see Figure 7. Choosing the long wavelength end may compromise adequate angular resolution. As a compromise, we choose to use the middle of the band, as determined by the geometric average.
Figure 7. Power vs. reference wavelength choice.
The pixel pitch is chosen to be 1.0mm for all bands but one, out of convenience (existing and near-future multiplexers require around 1mm2 of area for the lithographed inductors). However, the shortest wavelength band is chosen to have a smaller pixel pitch of 0.5mm to accommodate faster optics and therefore shorter paths in the instrument.
Band (µm) Reference Wavelength
(µm) Plate Scale (“/pixel)
Pixel Width W (pixels)
Pixel Pitch (mm)
25–50 35 4.45 14 0.5 50–100 71 8.9 7 1.0
100–200 141 17.8 4 1.0 200–400 283 35.6 2 1.0
For scaling to different SPIRIT implementations, it is worth pointing out that the short wavelength array has the majority of the pixels. Therefore, for calculating data rates and electronics power, when we sum up the total number of pixels in all arrays, and compare it to the number of pixels in the short wavelength array, we find that the ratio is ζ=1.43 (thus providing an approximate scaling factor from the short wavelength array to the sum of all arrays).
2.3 Data Rate
The detector data rate is a complex question, and so we will define four quantities:
(1) The Detector Intrinsic Rate (DIR), which is the rate at which data is acquired in the detector front end warm electronics, and is used to control the linearizing feedback assumed for superconducting bolometers.
(2) The Detector Frame Rate (DFR), which is the rate at which data is acquired from the detector front end warm digital electronics and passed to a higher-level processor, possibly on the spacecraft bus. This is the uncompressed raw data often referred to by Stephen Rinehart as the “frame rate”. We shall also use DFBR as the Detector Frame Bit Rate, which is the DFR times the number of bits per frame.
(3) The Detector Processed Rate (DPR), which is the rate at which data with a fairly straightforward compression algorithm could produce.
(4) The Detector Spectral Imaging Rate (DSIR), which is the rate at which an astronomically useful data cube is acquired. A sufficiently clever algorithm can process the DPR to yield the DSIR.
First, we can estimate the DFR using the fact that the number of uv steps Ψ is known:
Ψ ~Bmax
2 − Bmin2( )
Daperture2
4
= 2520 for SPIRIT C assumptions. (2)
In an integration time T, we know that SPIRIT must sweep its delay line Ψ times by a distance a small factor ξ greater than twice the spectral resolution R. The detectors should be read out faster than this sweep step time by a factor of 4 (Rinehart et al. 2007[6])). So, the DFR is given by:
DFR =samplesfringe
⋅
total strokeλshort
⋅
Nscans / image
Timage
= 1166.7Hzsamples / fringe
4
T24hr
−1 Ψ2520
ϑξ(cm)
λshort (µm)
frames/second ~ 859 fps. (7)
The DFBR is then given by:
DFBR ≈ 2 ⋅1
318.9⋅ζDFR
bits / pixel16
W25µm
14
2
~ 5.37 Mb/s (8)
where a factor of 2 has been introduced to allow for observing with both port arrays simultaneously. Throughout these calculations, we assume that the kb, Mb, and Gb units correspond to factors of 103, 106,and 109.
This data rate is slow enough that we shall first consider the situation with moderate compression (2:1). Hence, our best estimate for the DPR is equal to half the DFBR. As a baseline for SPIRIT C,
DPR =DFBR
compression = 2.68 Mb/s (9)
This is a reasonable upper limit on the data rate to be stored and telemetered down.
We can calculate the minimum DSIR based on the assumption that we can process the DPR to produce only a final data cube. The data cube will have a dimension of ℘ x ℘ pixels (where ℘ is the final, full angular resolution) and 2R spectral elements. There must be some number of bits per pixel, typically a few more than the dynamic range in an image. The whole image is acquired in an integration time of T. So, our minimum DSIR is given by:
DSIR ≈ 2.5Mbζbits16
℘838
2 R3000
T24hrs
−1
≈ 2.5 Mb/s/. (10)
This is close to the DPR, indicating that little additional compression is possible.
2.4 Thermal Considerations:
The superconducting arrays must be cooled to <0.05K, where the dissipated power will be on the order of N*10nW per NxM array (remembering that the arrays will be square in physical appearance, but not necessarily from a wiring standpoint). For our baseline case, this is a power of ~0.1µW. There will also be amplifiers located at a higher (~4K) temperature, which dissipate around N*1µW = 10µW.
To reset the array, the components will require short time heating to >0.1K. The refrigeration system must permit either (1) a heater sufficient to do this for a few seconds or (2) be able to control up to a warmer temperature and then return to its base temperature.
2.5 Calibration:
Calibration of TES bolometers should be done as frequently as possible to mitigate the effects of 1/f drifts. The time necessary to eliminate this is on the order of one minute, but the interferograms will serve as good monitors of the 1/f noise on these timescales. It would be best to calibrate once between each delay line scan, such that these scans can be accurately combined. This implies calibration taking place each time after the delay line strokes. The illuminators should be stable and fast (τ ≤ 1 s). To calibrate data, the illuminators would be cycled on and off as necessary after every delay line stroke, while the mirrors are moving. This illumination response would be used to transfer calibrations from standards to unknown sources. Calibration can take place in about 5 seconds, much less than the time to move a mirror.
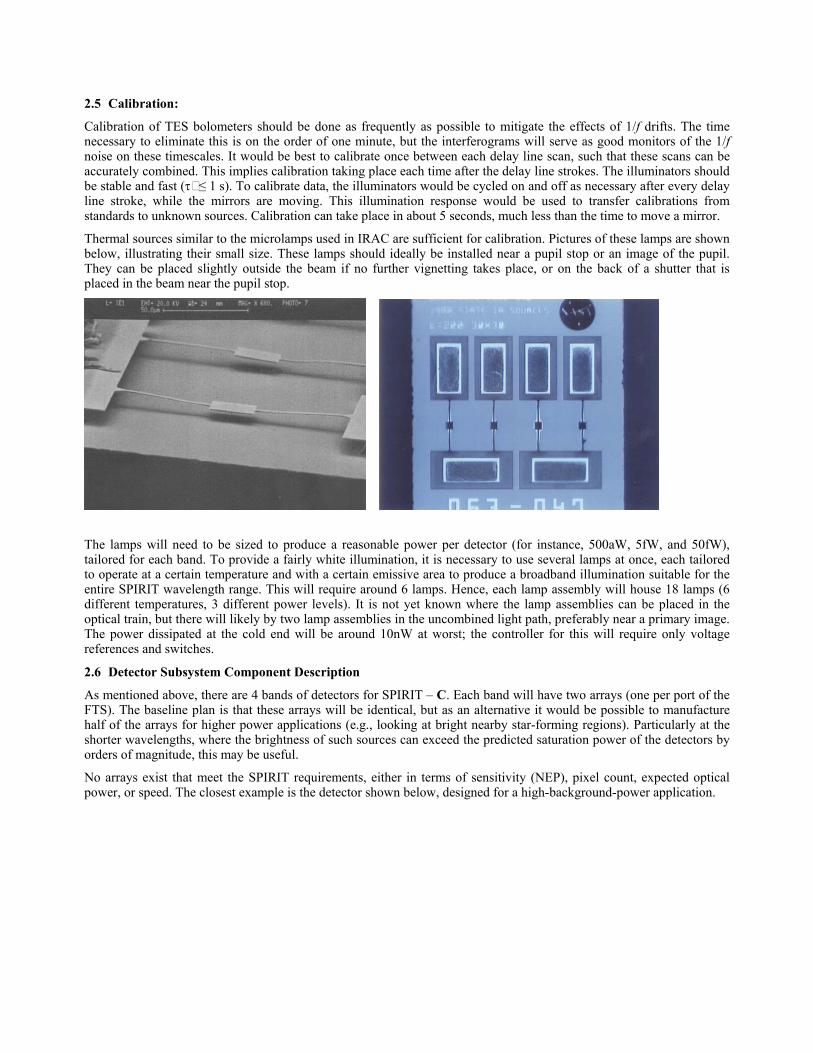
Thermal sources similar to the microlamps used in IRAC are sufficient for calibration. Pictures of these lamps are shown below, illustrating their small size. These lamps should ideally be installed near a pupil stop or an image of the pupil. They can be placed slightly outside the beam if no further vignetting takes place, or on the back of a shutter that is placed in the beam near the pupil stop.
The lamps will need to be sized to produce a reasonable power per detector (for instance, 500aW, 5fW, and 50fW), tailored for each band. To provide a fairly white illumination, it is necessary to use several lamps at once, each tailored to operate at a certain temperature and with a certain emissive area to produce a broadband illumination suitable for the entire SPIRIT wavelength range. This will require around 6 lamps. Hence, each lamp assembly will house 18 lamps (6 different temperatures, 3 different power levels). It is not yet known where the lamp assemblies can be placed in the optical train, but there will likely by two lamp assemblies in the uncombined light path, preferably near a primary image. The power dissipated at the cold end will be around 10nW at worst; the controller for this will require only voltage references and switches.
2.6 Detector Subsystem Component Description
As mentioned above, there are 4 bands of detectors for SPIRIT – C. Each band will have two arrays (one per port of the FTS). The baseline plan is that these arrays will be identical, but as an alternative it would be possible to manufacture half of the arrays for higher power applications (e.g., looking at bright nearby star-forming regions). Particularly at the shorter wavelengths, where the brightness of such sources can exceed the predicted saturation power of the detectors by orders of magnitude, this may be useful.
No arrays exist that meet the SPIRIT requirements, either in terms of sensitivity (NEP), pixel count, expected optical power, or speed. The closest example is the detector shown below, designed for a high-background-power application.
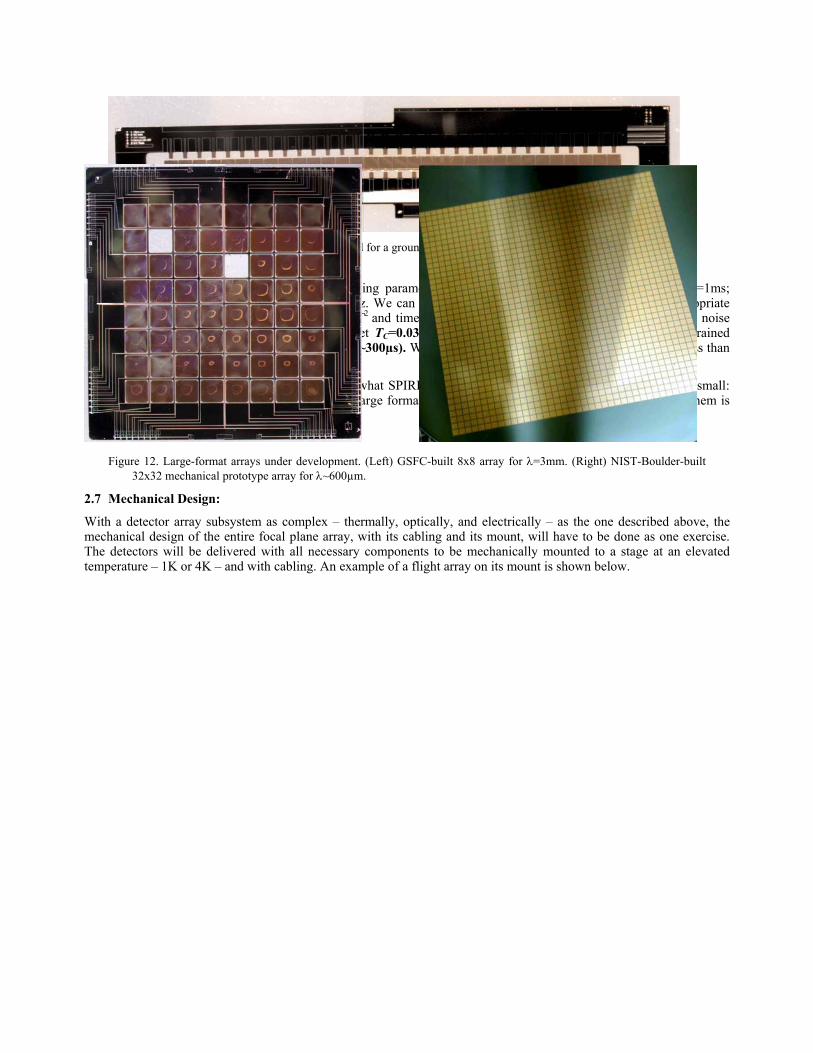
Figure 11. 32-element TES bolometer array designed for a ground-based application.
The detector array pictured above has the following parameters: optical loading Psat=6pW; time constant τe=1ms; temperature TC=450mK; noise NEP=2·10-17 W/√Hz. We can attempt to guess the parameters of a SPIRIT-appropriate device of this sort, knowing that NEP scales as ~T2
and time constant scales as ~T-1±1. So, to meet SPIRIT – C noise requirement of NEP~10-19 W/√Hz, we have to set TC=0.030K. We then find that the time constant is constrained toτe≤15ms & ≥65µs (with a most likely value of ~300µs). With this design, the saturation flux is likely to be less than 5Jy, so many sources would blind the detectors.
The extrapolated detector parameters are close to what SPIRIT needs, but the pixel count is still somewhat too small: SPIRIT requires 196 pixels for the largest array. Large format arrays are being developed. A picture of two of them is shown below in Figure 12.
Figure 12. Large-format arrays under development. (Left) GSFC-built 8x8 array for λ=3mm. (Right) NIST-Boulder-built 32x32 mechanical prototype array for λ~600µm.
2.7 Mechanical Design:
With a detector array subsystem as complex – thermally, optically, and electrically – as the one described above, the mechanical design of the entire focal plane array, with its cabling and its mount, will have to be done as one exercise. The detectors will be delivered with all necessary components to be mechanically mounted to a stage at an elevated temperature – 1K or 4K – and with cabling. An example of a flight array on its mount is shown below.
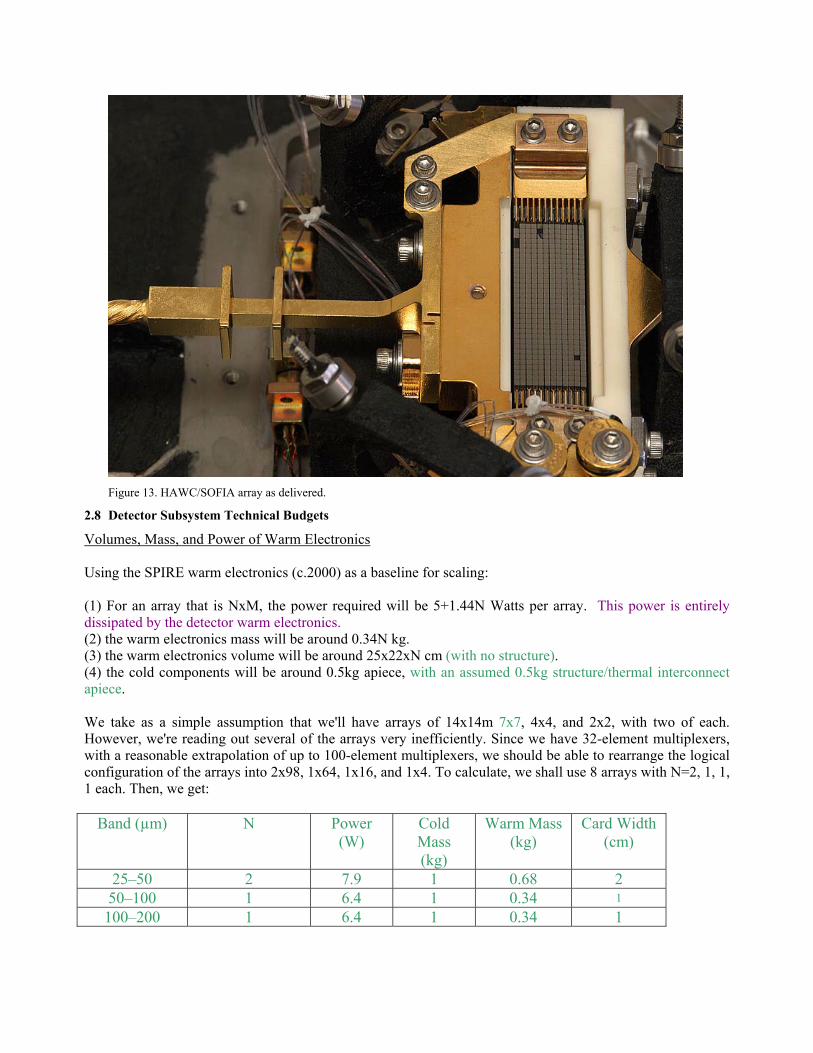
Figure 13. HAWC/SOFIA array as delivered.
2.8 Detector Subsystem Technical Budgets
Volumes, Mass, and Power of Warm Electronics Using the SPIRE warm electronics (c.2000) as a baseline for scaling: (1) For an array that is NxM, the power required will be 5+1.44N Watts per array. This power is entirely dissipated by the detector warm electronics. (2) the warm electronics mass will be around 0.34N kg. (3) the warm electronics volume will be around 25x22xN cm (with no structure). (4) the cold components will be around 0.5kg apiece, with an assumed 0.5kg structure/thermal interconnect apiece. We take as a simple assumption that we'll have arrays of 14x14m 7x7, 4x4, and 2x2, with two of each. However, we're reading out several of the arrays very inefficiently. Since we have 32-element multiplexers, with a reasonable extrapolation of up to 100-element multiplexers, we should be able to rearrange the logical configuration of the arrays into 2x98, 1x64, 1x16, and 1x4. To calculate, we shall use 8 arrays with N=2, 1, 1, 1 each. Then, we get:
Band (µm) N Power (W)
Cold Mass (kg)
Warm Mass (kg)
Card Width (cm)
25–50 2 7.9 1 0.68 2 50–100 1 6.4 1 0.34 1
100–200 1 6.4 1 0.34 1
200–400 1 6.4 1 0.34 1 Power = 54 W Mass = 12 kg (roughly 4kg warm, 8kg cold) Volume = 25 x 22 x 5 cm, two boxes. Voltage requirements:
+/- 5.0V (digital) 20% of total +/- 8.0V (analog) 65% of total +/- 15.0V (analog) 15% of total
2.9 Detector Subsystem Fault Tolerance Approach
There are two arrays for each wavelength, and the assumption has been that both arrays are read out at all times. We carry a redundant set of electronics. The only exception to this double-string approach is in the possibility of using some of the arrays (particularly those at shorter wavelengths) for higher power applications. In this case, the arrays would not be identical, and so would not represent full backups, but would be redundant for most applications.
There are two arrays for each wavelength, and the assumption has been that both arrays are identical and are read out at all times. We carry a redundant set of electronics and harnessing. In this case, the loss of one array will result in a degradation in sensitivity of a factor of 30% (1-1/√2) in the affected wavelength band. The only exception to this double-string approach is in the possibility of using some of the arrays (particularly those at shorter wavelengths) for higher power applications. In this case, the arrays would not be identical, and so would not represent full backups, but would be redundant for most applications. One likely implementation would be to have the 25-50µm arrays optimized for significantly (100x) different power, so that there would be a dark-optimized and bright-optimized array. For the following cases, we would have different resulting degradations in performance (relative to the nominal SPIRIT-C design, for identical arrays at 25-50µm), shown in Table x.
Table x. Degradation of capability with the loss of any one array in the different-array configuration.
Source Brightness Fault State Performance Faint None 30% worse than nominal SPIRIT-C design Faint Faint array dead >10x worse performance at 25-50µm Faint Bright array dead 30% worse Medium None No degradation Medium Faint array dead 30% worse Medium Bright array dead 30% worse Bright None 30% worse Bright Faint array dead Cannot operate Bright Bright array dead 30% worse
4. SUMMARY This paper showed the basic design and operations for the SPIRIT concept. The three design cycle approach for conceptual design was explained. The science team’s design reference mission was used to guide the design process through requirement specifications and performance appraisals. Interferometric performance error budgets were flowed down from visibility requirements and allocated to subsystems (optics, sensors, controls, mechanisms, and structures). Performance estimates were then rolled back up based on the actual component performance reported in subsystem design documents. For science light at 25 microns, a 98 percent visibility is estimated against a 90 percent requirement. For the more stringent near infrared metrology light at 2 microns, a 47 percent visibility is estimated against a 25 percent requirement.
The SPIRIT study team accomplished the goal, which was to demonstrate the scientific promise and technical viability of a space-based far-IR/ submillimeter spatial and spectral interferometer as a candidate Origins Probe mission. The IR
community recommended SPIRIT in its “Community Plan,” and the mission is well aligned with NASA programmatic and science objectives.
REFERENCES
1. Leisawitz, D., Baker, C., Barger, A., Benford, D., Blain, A., Boyle, R., Broderick, R., Budinoff, J., Carpenter, J., Caverly, R., Chen, P., Cooley, S., Cottingham, C., Crooke, J., DiPietro, D., DiPirro, M., Femiano, M., Ferrer, A., Fischer, J., Gardner, J.P., Hallock, L., Harris, K., Hartman, K., Harwit, M., Hillenbrand, L., Hyde, T., Jones, A., Kellogg, J., Kogut, A., Kuchner, M., Lawson, W., Lecha, J., Lecha, M., Mainzer, A., Mannion, J., Martino, A., Mason, P., Mather, J.C., McDonald, G., Mills, R., Mundy, L., Ollendorf, S., Pellicciotti, J., Quinn, D., Rhee, K., Rinehart, S.A., Sauerwine, T., Silverberg, R.F., Smith, T., Stacey, G., Stahl, H.P., Staguhn, J., Tompkins, S., Tveekrem, J., Wall, S., and Wilson, M., “The Space Infrared Interferometric Telescope (SPIRIT): High-resolution imaging and spectroscopy in the far-infrared,” J. Adv. Sp. Res., in press (2007), doi:10.1016/j.asr.2007.05.081
2. Hyde, T.T., Leisawitz, D.T., and Rinehart, S.A., “System engineering the Space Infrared Interferometric Telescope (SPIRIT),” Proc. SPIE 6687, this volume (2007).
3. Wilson, M.E., Leisawitz, D.T., Martino, A.J., Rinehart, S.A., Crooke, J.A., Tveekrem, J.L., Budinoff, J.G., Quijada, M.A., and Hyde, T.T., “The Space Infrared Interferometric Telescope (SPIRIT): Optical system design considerations,” Proc. SPIE 6687, this volume (2007).
4. Budinoff, J.G., Leisawitz, D.T., Rinehart, S.A., DiPirro, M.J., Jones, D.L., Hyde, T.T., and Taylor, B., “Mechanical design of the Space Infrared Interferometric Telescope (SPIRIT),” Proc. SPIE 6687, this volume (2007).
5. DiPirro, M.J., Cottingham, C., Boyle, R., Ollendorf, S., and Leisawitz, D.T., “The SPIRIT thermal system,” Proc. SPIE 6687, this volume (2007).
6. Rinehart, S.A., Armstrong, J.T., Frey, B.J., Jung, J., Kirk, J., Leisawitz, D.T., Leviton, D.B., Lyon, R.G., Martino, A.J., Mundy, L.G., Pauls, T.A., and Schurr, S., “Wide-field imaging interferometry: An enabling technique for high angular resolution astronomy,” Proc. SPIE 6687, this volume (2007).
7. Martino, A.J., Leisawitz, D.T., Thompson, A.K., Rinehart, S.A., and Frey, B.J., “An optical model of the Wide-field Imaging Interferometry Testbed,” Proc. SPIE 6687, this volume (2007)
8. Staguhn – GISMO
9. Irwin 32mux
10. Benford – Musc circuit descrip.
11. Irwin microwave mux