Embed Size (px)
Citation preview

CryOceanQCV quality control/validation for CryoSat2
IOP Daily Data Quality report for 29/06/2016
DOCUMENT INFORMATION
Document history
Version Issued Reason for change Author
1.0r1 03/07/16 Creation F. M. Calafat
This Version
Version 1.0r1 – issued by National Oceanography Centre on 03/07/16
Written by: F. M. Calafat
Checked by: P. Cipollini
Approved by:
Distribution List
Company Delivered via Names
ESA ftpJerome Bouffard, EOP-GMQPierre Féménias, EOP-GMQ
NOC ftpP.CipolliniH.Snaith
ESA/ESRIN RFQ/3-14139/14/I-LG Date: 03/07/16

CryOcean-QCV IOP Daily Quality Report for29/06/2016
Version 1.0r1 - 03/07/16
IOP DAILY QUALITY ASSESSMENT FOR 29/06/2016
Report issued on 03/07/16Date and time of the first record: 29 06 2016 00:00:00.859Date and time of the last record: 29 06 2016 23:59:43.838Range of complete orbits in present day: 32993 to 33006
WARNINGS (see Appendix A for details)
No warnings
2

IOP Daily Quality Report for29/06/2016
Version 1.0r1 - 03/07/16
CryOcean-QCV
1 Data latency
Median latency [min max]: 1.6 days [1.1 - 2.1]
Figure 1. Box-and-whiskers plot for the latency showing for each day in last 30-daywindow the first and third quartiles (bottom and top of the box), the median (thick black),the 5% and 95% percentiles (lower and upper whiskers), the mean (blue) and the mean±1 standard deviation (blue dashed line). The percentage of records delivered within 3days is also shown (red, right y-axis). The yellow shading highlights the day analyzed inthis report whereas the horizontal black line denotes the 3 days threshold.
Figure 2. Histogram of the data latency for 29/06/2016. The y-axis denotes the number offiles that are made available with a delay of x-hours with respect to the mean time of therecords stored in the file.
3

CryOcean-QCV IOP Daily Quality Report for29/06/2016
Version 1.0r1 - 03/07/16
2 Data coverage and completeness
Present in day Theoretical max. Percentage (%)
Total 79700 80428 99.1
Oceans and lakes 58845 59071 99.6
Table 1. Number of total (land and ocean/lake) and only ocean/lake records (based on the surface_type flag) together with their percentage relative to the theoretically expected number of measurements from the orbits ground tracks for 29/06/2016. Theoretical values are also shown.
Figure 3. Percentage of 1-Hz records over land and ocean/lake (red) and only overocean/lake (blue) relative to the theoretically expected number from the orbits groundtracks for each day in last 30-day window. The black circle at the end of the time serieshighlights the day analyzed in this report.
4

IOP Daily Quality Report for29/06/2016
Version 1.0r1 - 03/07/16
CryOcean-QCV
Figure 4. Percentage of 1-Hz records over land and ocean/lake (red) and only overocean/lake (blue) relative to the theoretically expected number from the orbits groundtracks for each orbit in last 30-day window. The yellow shading highlights the day analyzedin this report. The mean (μ) and standard deviation (σ) are also shown.
3 SSH anomaly coverage and validity
Note 3.1: unless otherwise stated, measurements taken over polar polygons have beenexcluded from the computation of all statistics shown in this section.
Note 3.2: the extent of the regions defining the geographical mode mask of the referencemission is shown in Figure A1 (Appendix A).
Note 3.3: most statistics shown in this section have been computed separately for the lowresolution mode (LRM) and the pseudo low resolution mode (PLRM).
3.1. Validity based on flags
Note 3.4: here “flag-valid” refers to those records that have not been flagged as bad by eitherthe average status flag or the measurement confidence flag.
Number of flag-valid 1-Hz SSH records over oceans and lakes (including polar regions):49802Percentage of flag-valid 1-Hz SSH records over oceans and lakes (including polar regions)relative to theoretical maximum: 84.3%
5

CryOcean-QCV IOP Daily Quality Report for29/06/2016
Version 1.0r1 - 03/07/16
Figure 5. Geographical distribution of flag-valid 1-Hz SSH anomaly data over oceans andlakes for 29/06/2016. The statistical values shown in the table refer to the SSH anomaly incm and are calculated separately for LRM and PLRM regions. Measurements taken overpolar polygons have been excluded from the computation of the statistical values. Theblack lines mark the outer limit of the Arctic and Antarctic polar polygons.
Figure 6. Percentage of flag-valid 1-Hz SSH records over ocean and lakes (including polarregions) relative to theory for each day in last 30-day window. The mean (μ) and standarddeviation (σ) are also shown.
6

IOP Daily Quality Report for29/06/2016
Version 1.0r1 - 03/07/16
CryOcean-QCV
Figure 7. Histogram of flag-valid SSH anomaly over oceans and lakes for LRM (blue) andPLRM (red) for 29/06/2016. The mean (μ) and standard deviation (σ) are also shown. Notethat values outside [-50 50] cm are excluded from the histogram for the sake of readabilitybut not from the computation of μ and σ.
3.2. Analysis of measurement noise
20-Hz measurement noise (average std of 20-Hz sample blocks) for the flag-valid SSHanomaly over oceans and lakes for LRM and PLRM, respectively: 8.9 cm and 14.2 cmEquivalent 1-Hz measurement noise for the flag-valid SSH anomaly for LRM and PLRM,respectively: 2.0 cm and 3.2 cm
7

CryOcean-QCV IOP Daily Quality Report for29/06/2016
Version 1.0r1 - 03/07/16
Figure 8. Geographical distribution of flag-valid 20-Hz SSH anomaly measurement noiseover oceans and lakes for 29/06/2016. The statistical values shown in the table refer to theSSH anomaly noise and are calculated separately for LRM and PLRM regions.Measurements taken over polar polygons have been excluded from the computation of thestatistical values. The black lines mark the outer limit of the Arctic and Antarctic polarpolygons.
8

IOP Daily Quality Report for29/06/2016
Version 1.0r1 - 03/07/16
CryOcean-QCV
Figure 9. 2D histogram showing flag-valid SSH anomaly noise as a function of SWH forLRM (top) and PLRM (bottom) for 29/06/2016. The black line denotes the median SSHanomaly noise as a function of SWH.
3.3. Validity based on scientific editing criteria
Note 3.5: here “science-valid” refers to the flag-valid SSH records over oceans and lakes(excluding polar regions) that meet the editing criteria described in Table 2.
Parameter Minthreshold
Maxthreshold
Percentageedited
SSH anomaly -3 m 3 m 0.3%
Standard deviation of SSH anomaly 0 m 0.20 m 1.8%
Inverse barometer correction -2 m 2 m 0.0%
Biased orbit 0 m 0 m 0.0%
Wet tropospheric correction -0.5 m -0.001 m 0.0%
Dry tropospheric correction -2.5 m -1.9 m 0.0%
Ionospheric correction -0.4 m 0.04 m 0.0%
Sea state bias -0.5 m 0 m 0.0%
Sigma0 7 dB 30 dB 1.4%
Standard deviation of sigma0 0 dB 0.23 dB 5.3%
9

CryOcean-QCV IOP Daily Quality Report for29/06/2016
Version 1.0r1 - 03/07/16
All together - - 7.0%
Table 2. Editing criteria. The biased orbit criteria in the table refers to the orbits highlighted in the 'Warnings' table at the beginning of this report as being suspicious of suffering from a significant orbit bias. For such orbits, all records are rejected, hence the 0 m thresholds. The percentage of rejected flag-valid records (excluding polar regions) for each criteria is shown.
Number of science-valid 1-Hz SSH records over oceans and lakes (excluding polarregions): 43155 Percentage of science-valid 1-Hz SSH records over oceans and lakes (excluding polarregions) relative to theoretical maximum: 92.3%20-Hz measurement noise (average std of 20-Hz sample blocks) for the science-valid SSHanomaly for LRM and PLRM, respectively: 7.5 cm and 11.3 cmEquivalent 1-Hz measurement noise for the science-valid SSH anomaly for LRM andPLRM, respectively: 1.7 cm and 2.5 cm
Figure 10. Geographical distribution of science-valid SSH anomaly data over oceans andlakes for 29/06/2016. The statistical values shown in the table refer to the SSH anomaly incm and are calculated separately for LRM and PLRM regions. The black lines mark theouter limit of the Arctic and Antarctic polar polygons. Gray circles denote records that havebeen rejected based on the editing criteria described in Table 2.
10

IOP Daily Quality Report for29/06/2016
Version 1.0r1 - 03/07/16
CryOcean-QCV
Figure 11. Histogram of science-valid SSH anomaly over oceans and lakes for LRM (blue)and PLRM (red) for 29/06/2016. The mean (μ) and standard deviation (σ) are also shown.Note that values outside [-50 50] cm are excluded from the histogram for the sake ofreadability but not from the computation of μ and σ.
Figure 12. Mean science-valid SSH anomaly for LRM (blue dot) and PLRM (red dot). Thecorresponding standard deviation (blue error bar and thin red lines, respectively) for eachday in last 30-day window is also shown. The yellow shading highlights the day analyzedin this report.
11

CryOcean-QCV IOP Daily Quality Report for29/06/2016
Version 1.0r1 - 03/07/16
Figure 13. Average science-valid SSH anomaly noise for LRM (blue dot) and PLRM (reddot). The corresponding standard deviation (blue error bar and thin red lines, respectively)for each day in last 30-day window is also shown. The yellow shading highlights the dayanalyzed in this report.
3.4. Crossover analysis
Figure 14. Mean crossover differences (absolute values) for the science-valid SSHanomaly (blue dot) and the corresponding standard deviation (error bar) for each day inlast 30-day window. Mean crossover differences are calculated daily by averaging allcrossover differences in a day (there are about 12-13 crossovers per day). The differenceat each crossover is computed as the difference between median values over 2-s windowscentered about the crossover. The yellow shading highlights the day analyzed in thisreport.
12

IOP Daily Quality Report for29/06/2016
Version 1.0r1 - 03/07/16
CryOcean-QCV
4 SWH coverage and validity
Note 4.1: unless otherwise stated, measurements taken over polar polygons have beenexcluded from the computation of all statistics shown in this section.
Note 4.2: the extent of the regions defining the geographical mode mask of the referencemission is shown in Figure A1 (Appendix A).
Note 4.3: most statistics shown in this section have been computed separately for the lowresolution mode (LRM) and the pseudo low resolution mode (PLRM).
4.1. Validity based on flags
Note 4.4: here “flag-valid” refers to those records that have not been flagged as bad by eitherthe average status flag or the measurement confidence flag.
Number of flag-valid 1-Hz SWH records over oceans and lakes (including polar regions):49799Percentage of flag-valid 1-Hz SWH records over oceans and lakes (including polarregions) relative to theoretical maximum: 84.3%
Figure 15. Geographical distribution of flag-valid SWH data over oceans and lakes for29/06/2016. The statistical values shown in the table refer to the SWH in m and arecalculated separately for LRM and PLRM regions. Measurements taken over polarpolygons have been excluded from the computation of the statistical values. The blacklines mark the outer limit of the Arctic and Antarctic polar polygons.
13

CryOcean-QCV IOP Daily Quality Report for29/06/2016
Version 1.0r1 - 03/07/16
Figure 16. Percentage of flag-valid 1-Hz SWH records over ocean and lakes (includingpolar regions) relative to theory for each day in last 30-day window. The mean (μ) andstandard deviation (σ) are also shown.
Figure 17. Histogram of flag-valid SWH over oceans and lakes for LRM (blue) and PLRM(red) for 29/06/2016. The mean (μ) and standard deviation (σ) are also shown. Note thatvalues larger than 12 m are excluded from the histogram for the sake of readability but notfrom the computation of μ and σ.
4.2. Analysis of measurement noise
20-Hz measurement noise (average std of 20-Hz sample blocks) for the flag-valid SWHover oceans and lakes for LRM and PLRM, respectively: 53.4 cm and 82.0 cm
14

IOP Daily Quality Report for29/06/2016
Version 1.0r1 - 03/07/16
CryOcean-QCV
Equivalent 1-Hz measurement noise for the flag-valid SWH for LRM and PLRM,respectively: 11.9 cm and 18.3 cm
Figure 18. Geographical distribution of flag-valid 20-Hz SWH measurement noise overoceans and lakes for 29/06/2016. The statistical values shown in the table refer to theSWH noise and are calculated separately for LRM and PLRM regions. Measurementstaken over polar polygons have been excluded from the computation of the statisticalvalues. The black lines mark the outer limit of the Arctic and Antarctic polar polygons.
4.3. Validity based on scientific editing criteria
Note 4.5: here “science-valid” refers to the flag-valid SWH records over oceans and lakes thatmeet the editing criteria described in Table 3.
Parameter Minthreshold
Maxthreshold
Percentageedited
SWH 0 m 15 m 0.0%
Standard deviation of SWH (1-Hz block) 0 m 1 m 2.4%
All together - - 2.4%
Table 3. Editing criteria. The percentage of rejected flag-valid records (excluding polar regions) for each criteria is shown.
15

CryOcean-QCV IOP Daily Quality Report for29/06/2016
Version 1.0r1 - 03/07/16
Number of science-valid 1-Hz SWH records over oceans and lakes (excluding polarregions): 45312 Percentage of science-valid 1-Hz SWH records over oceans and lakes (excluding polarregions) relative to theoretical maximum: 96.9%20-Hz measurement noise (average std of 20-Hz sample blocks) for the science-validSWH for LRM and PLRM, respectively: 49.1 cm and 69.5 cmEquivalent 1-Hz measurement noise for the science-valid SWH for LRM and PLRM,respectively: 11.0 cm and 15.5 cm
Figure 19. Geographical distribution of science-valid SWH data over oceans and lakes for29/06/2016. The statistical values shown in the table refer to the SWH in m and arecalculated separately for LRM and PLRM regions. The black lines mark the outer limit ofthe Arctic and Antarctic polar polygons. Gray circles denote records that have beenrejected based on the editing criteria described in Table 3.
16

IOP Daily Quality Report for29/06/2016
Version 1.0r1 - 03/07/16
CryOcean-QCV
Figure 20. Histogram of science-valid SWH over oceans and lakes for LRM (blue) andPLRM (red) for 29/06/2016. The mean (μ) and standard deviation (σ) are also shown. Notethat values larger than 12 m are excluded from the histogram for the sake of readability butnot from the computation of μ and σ.
Figure 21. Box-and-whiskers plot for the science-valid SWH showing for each day in last30-day window the first and third quartiles (bottom and top of the box), the median (thickblack), the 5% and 95% percentiles (lower and upper whiskers), and the mean (blue). Theyellow shading highlights the day analyzed in this report.
17
CryOcean-QCV IOP Daily Quality Report for29/06/2016
Version 1.0r1 - 03/07/16
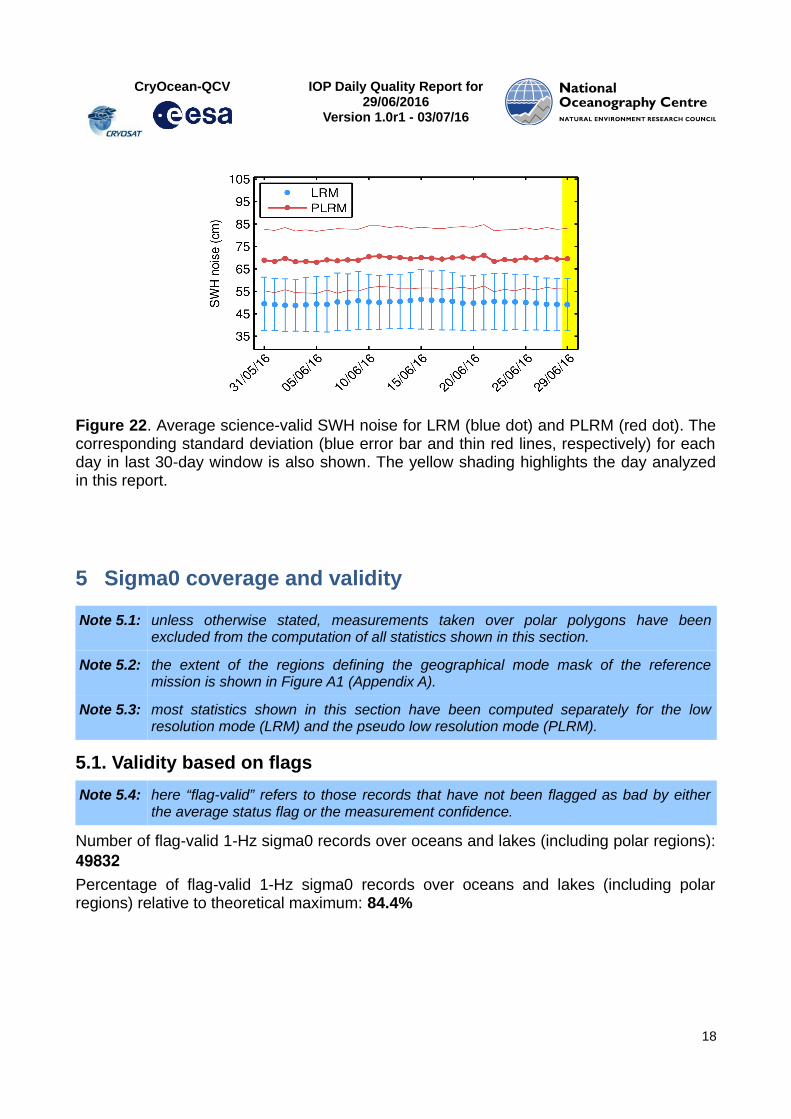
Figure 22. Average science-valid SWH noise for LRM (blue dot) and PLRM (red dot). Thecorresponding standard deviation (blue error bar and thin red lines, respectively) for eachday in last 30-day window is also shown. The yellow shading highlights the day analyzedin this report.
5 Sigma0 coverage and validity
Note 5.1: unless otherwise stated, measurements taken over polar polygons have beenexcluded from the computation of all statistics shown in this section.
Note 5.2: the extent of the regions defining the geographical mode mask of the referencemission is shown in Figure A1 (Appendix A).
Note 5.3: most statistics shown in this section have been computed separately for the lowresolution mode (LRM) and the pseudo low resolution mode (PLRM).
5.1. Validity based on flags
Note 5.4: here “flag-valid” refers to those records that have not been flagged as bad by eitherthe average status flag or the measurement confidence.
Number of flag-valid 1-Hz sigma0 records over oceans and lakes (including polar regions):49832Percentage of flag-valid 1-Hz sigma0 records over oceans and lakes (including polarregions) relative to theoretical maximum: 84.4%
18
IOP Daily Quality Report for29/06/2016
Version 1.0r1 - 03/07/16
CryOcean-QCV
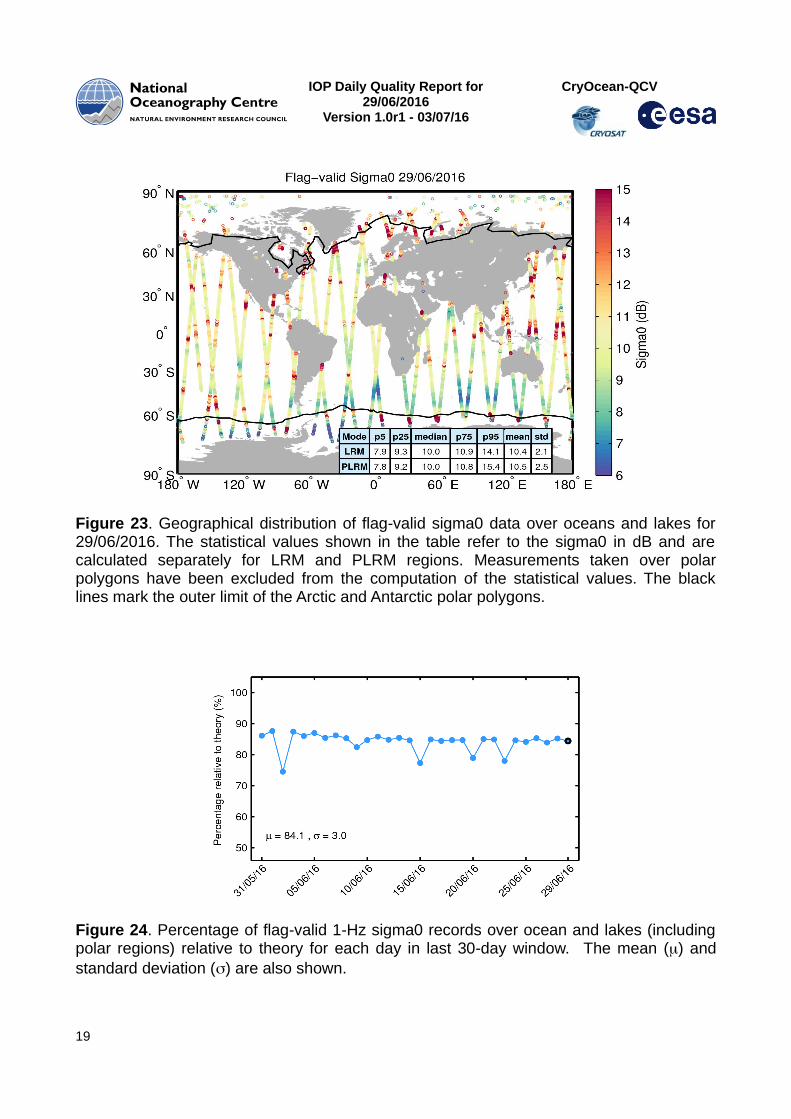
Figure 23. Geographical distribution of flag-valid sigma0 data over oceans and lakes for29/06/2016. The statistical values shown in the table refer to the sigma0 in dB and arecalculated separately for LRM and PLRM regions. Measurements taken over polarpolygons have been excluded from the computation of the statistical values. The blacklines mark the outer limit of the Arctic and Antarctic polar polygons.
Figure 24. Percentage of flag-valid 1-Hz sigma0 records over ocean and lakes (includingpolar regions) relative to theory for each day in last 30-day window. The mean (μ) andstandard deviation (σ) are also shown.
19

CryOcean-QCV IOP Daily Quality Report for29/06/2016
Version 1.0r1 - 03/07/16
Figure 25. Histogram of flag-valid sigma0 over oceans and lakes for LRM (blue) andPLRM (red) for 29/06/2016. The mean (μ) and standard deviation (σ) are also shown. Notethat values outside [4 20] dB are excluded from the histogram for the sake of readabilitybut not from the computation of μ and σ.
5.2. Analysis of measurement noise
20-Hz measurement noise (average std of 20-Hz sample blocks) for the flag-valid SWHover oceans and lakes for LRM and PLRM, respectively: 12.6 10-2 dB and 13.9 10-2 dBEquivalent 1-Hz measurement noise for the flag-valid SWH for LRM and PLRM,respectively: 2.8 10-2 dB and 3.1 10-2 dB
20

IOP Daily Quality Report for29/06/2016
Version 1.0r1 - 03/07/16
CryOcean-QCV
Figure 26. Geographical distribution of flag-valid 20-Hz sigma0 measurement noise overoceans and lakes for 29/06/2016. The statistical values shown in the table refer to thesigma0 noise and are calculated separately for LRM and PLRM regions. Measurementstaken over polar polygons have been excluded from the computation of the statisticalvalues. The black lines mark the outer limit of the Arctic and Antarctic polar polygons.
5.3. Validity based on scientific editing criteria
Note 5.5: here “science-valid” refers to the flag-valid sigma0 records over oceans and lakes thatmeet the editing criteria described in Table 4.
Parameter Minthreshold
Maxthreshold
Percentageedited
Sigma0 7 dB 30 dB 1.4%
Standard deviation of Sigma0 (1-Hz block) 0 dB 0.23 dB 5.3%
All together - - 6.5%
Table 4. Editing criteria. The percentage of rejected flag-valid records (excluding polar regions) for each criteria is shown.
Number of science-valid 1-Hz sigma0 records over oceans and lakes (excluding polarregions): 43375
21
CryOcean-QCV IOP Daily Quality Report for29/06/2016
Version 1.0r1 - 03/07/16
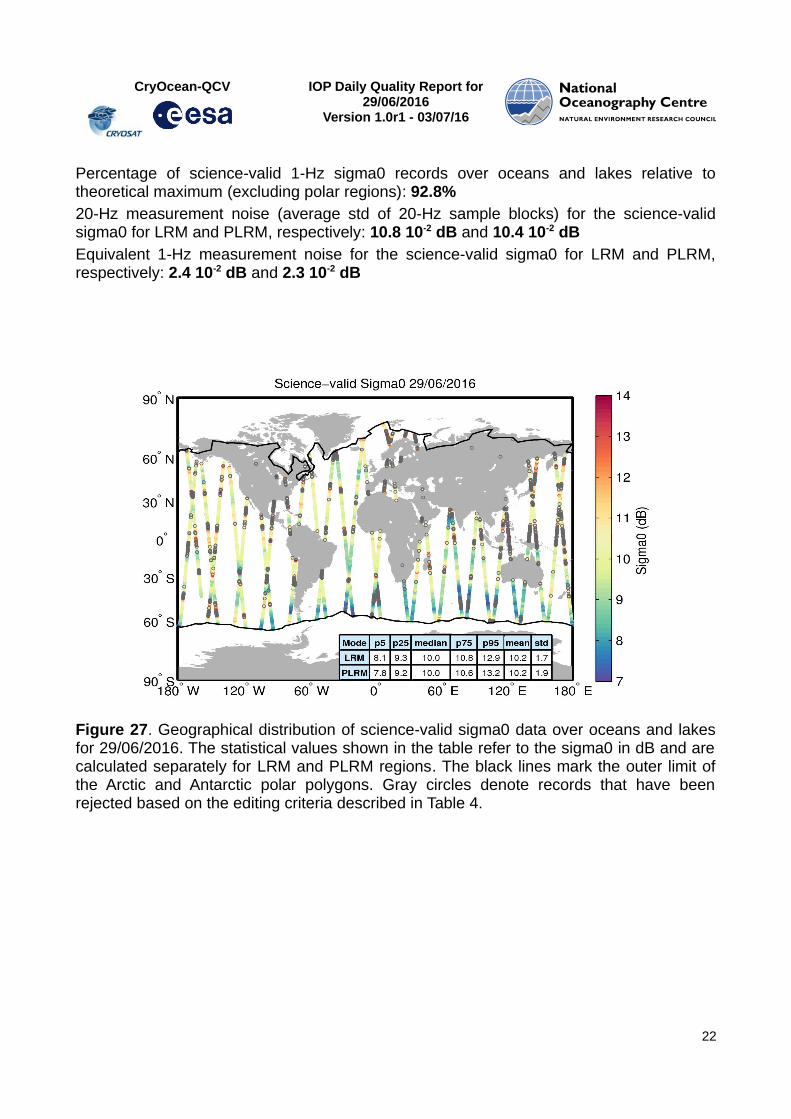
Percentage of science-valid 1-Hz sigma0 records over oceans and lakes relative totheoretical maximum (excluding polar regions): 92.8%20-Hz measurement noise (average std of 20-Hz sample blocks) for the science-validsigma0 for LRM and PLRM, respectively: 10.8 10-2 dB and 10.4 10-2 dBEquivalent 1-Hz measurement noise for the science-valid sigma0 for LRM and PLRM,respectively: 2.4 10-2 dB and 2.3 10-2 dB
Figure 27. Geographical distribution of science-valid sigma0 data over oceans and lakesfor 29/06/2016. The statistical values shown in the table refer to the sigma0 in dB and arecalculated separately for LRM and PLRM regions. The black lines mark the outer limit ofthe Arctic and Antarctic polar polygons. Gray circles denote records that have beenrejected based on the editing criteria described in Table 4.
22

IOP Daily Quality Report for29/06/2016
Version 1.0r1 - 03/07/16
CryOcean-QCV
Figure 28. Histogram of science-valid sigma0 over oceans and lakes for LRM (blue) andPLRM (red) for 29/06/2016. The mean (μ) and standard deviation (σ) are also shown. Notethat values outside [4 20] dB are excluded from the histogram for the sake of readabilitybut not from the computation of μ and σ.
Figure 29. Box-and-whiskers plot for science-valid sigma0 showing for each day in last30-day window the first and third quartiles (bottom and top of the box), the median (thickblack), the 5% and 95% percentiles (lower and upper whiskers), and the mean (blue). Theyellow shading highlights the day analyzed in this report.
23

CryOcean-QCV IOP Daily Quality Report for29/06/2016
Version 1.0r1 - 03/07/16
Figure 30. Average science-valid sigma0 noise for LRM (blue dot) and PLRM (red dot).The corresponding standard deviation (blue error bar and thin red lines, respectively) foreach day in last 30-day window is also shown. The yellow shading highlights the dayanalyzed in this report.
6 Altimeter wind speed coverage and validity
Note 6.1: unless otherwise stated, measurements taken over polar polygons have beenexcluded from the computation of all statistics shown in this section.
Note 6.2: the extent of the regions defining the geographical mode mask of the referencemission is shown in Figure A1 (Appendix A).
Note 6.3: most statistics shown in this section have been computed separately for the lowresolution mode (LRM) and the pseudo low resolution mode (PLRM).
6.1. Validity based on flags
Note 6.4: here “flag-valid” refers to those records that have not been flagged as bad by eitherthe average status flag or the measurement confidence flag.
Number of flag-valid 1-Hz wind records over oceans and lakes (including polar regions):51426Percentage of flag-valid 1-Hz wind records over oceans and lakes (including polar regions)relative to theoretical maximum: 87.1%
24

IOP Daily Quality Report for29/06/2016
Version 1.0r1 - 03/07/16
CryOcean-QCV
Figure 31. Geographical distribution of flag-valid wind data over oceans and lakes for29/06/2016. The statistical values shown in the table refer to the wind in m/s and arecalculated separately for LRM and PLRM regions. Measurements taken over polarpolygons have been excluded from the computation of the statistical values. The blacklines mark the outer limit of the Arctic and Antarctic polar polygons.
Figure 32. Percentage of flag-valid 1-Hz wind records over ocean and lakes (includingpolar regions) relative to theory for each day in last 30-day window. The mean (μ) andstandard deviation (σ) are also shown.
25

CryOcean-QCV IOP Daily Quality Report for29/06/2016
Version 1.0r1 - 03/07/16
Figure 33. Histogram of flag-valid wind over oceans and lakes for LRM (blue) and PLRM(red) for 29/06/2016. The mean (μ) and standard deviation (σ) are also shown. Note thatvalues larger than 24 m/s are excluded from the histogram for the sake of readability butnot from the computation of μ and σ.
6.2. Validity based on scientific editing criteria
Note 6.5: here “science-valid” refers to the flag-valid wind records over oceans and lakes thatmeet the editing criteria described in Table 5.
Parameter Minthreshold
Maxthreshold
Percentageedited
Altimeter wind speed 0 m/s 30 m/s 0.0%
Table 5. Editing criteria. The percentage of rejected flag-valid records (excluding polar regions) for each criteria is shown.
Number of science-valid 1-Hz wind records over oceans and lakes (excluding polarregions): 46565 Percentage of science-valid 1-Hz wind records over oceans and lakes relative totheoretical maximum (excluding polar regions): 99.6%
26
IOP Daily Quality Report for29/06/2016
Version 1.0r1 - 03/07/16
CryOcean-QCV
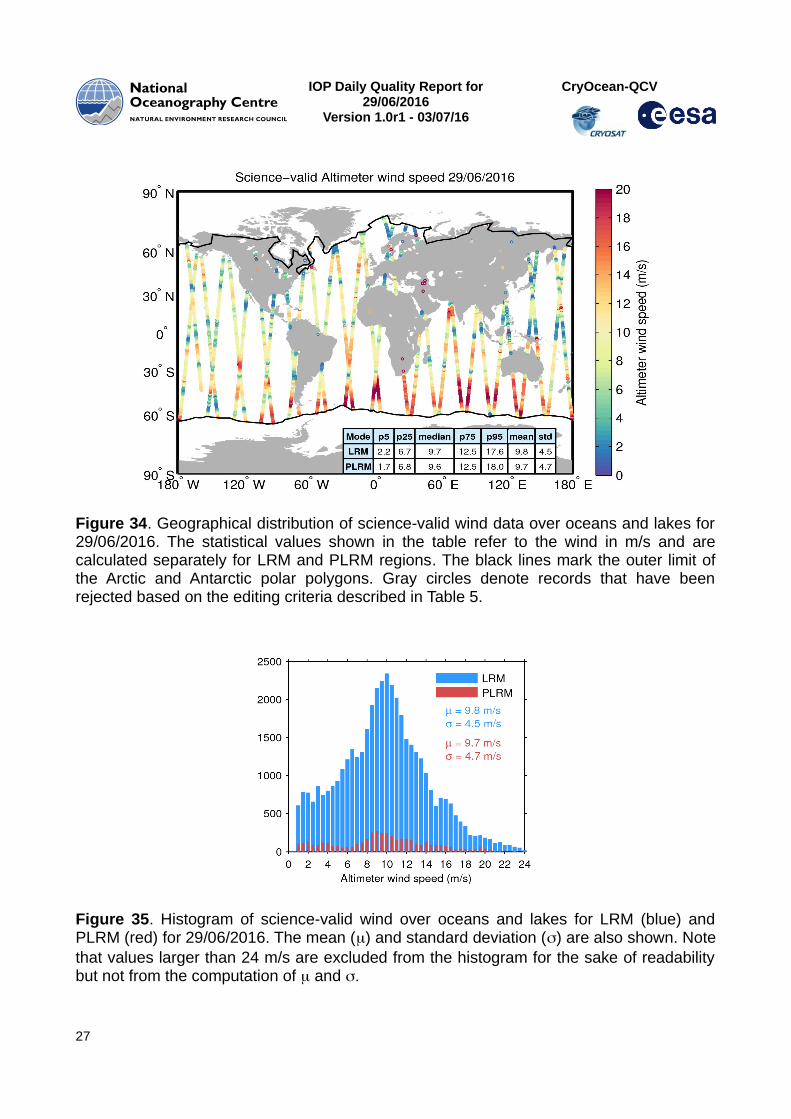
Figure 34. Geographical distribution of science-valid wind data over oceans and lakes for29/06/2016. The statistical values shown in the table refer to the wind in m/s and arecalculated separately for LRM and PLRM regions. The black lines mark the outer limit ofthe Arctic and Antarctic polar polygons. Gray circles denote records that have beenrejected based on the editing criteria described in Table 5.
Figure 35. Histogram of science-valid wind over oceans and lakes for LRM (blue) andPLRM (red) for 29/06/2016. The mean (μ) and standard deviation (σ) are also shown. Notethat values larger than 24 m/s are excluded from the histogram for the sake of readabilitybut not from the computation of μ and σ.
27

CryOcean-QCV IOP Daily Quality Report for29/06/2016
Version 1.0r1 - 03/07/16
Figure 36. Box-and-whiskers plot for the science-valid wind showing for each day in last30-day window the first and third quartiles (bottom and top of the box), the median (thickblack), the 5% and 95% percentiles (lower and upper whiskers), and the mean (blue). Theyellow shading highlights the day analyzed in this report.
7 Mispointing coverage and validity
Note 7.1: unless otherwise stated, measurements taken over polar polygons have beenexcluded from the computation of all statistics shown in this section.
Note 7.2: the extent of the regions defining the geographical mode mask of the referencemission is shown in Figure A1 (Appendix A).
Note 7.3: most statistics shown in this section have been computed separately for the lowresolution mode (LRM) and the pseudo low resolution mode (PLRM).
Note 7.4: here “flag-valid” refers to those records that have not been flagged as bad by eitherthe average status flag or the measurement confidence flag.
Number of flag-valid 1-Hz mispointing records over oceans and lakes (including polarregions): 51447Percentage of flag-valid 1-Hz mispointing records over oceans and lakes (including polarregions) relative to theoretical maximum: 87.1%Percentage of positive flag-valid 1-Hz mispointing records over oceans and lakes(including polar regions) relative to theoretical maximum: 79.5%
28
IOP Daily Quality Report for29/06/2016
Version 1.0r1 - 03/07/16
CryOcean-QCV
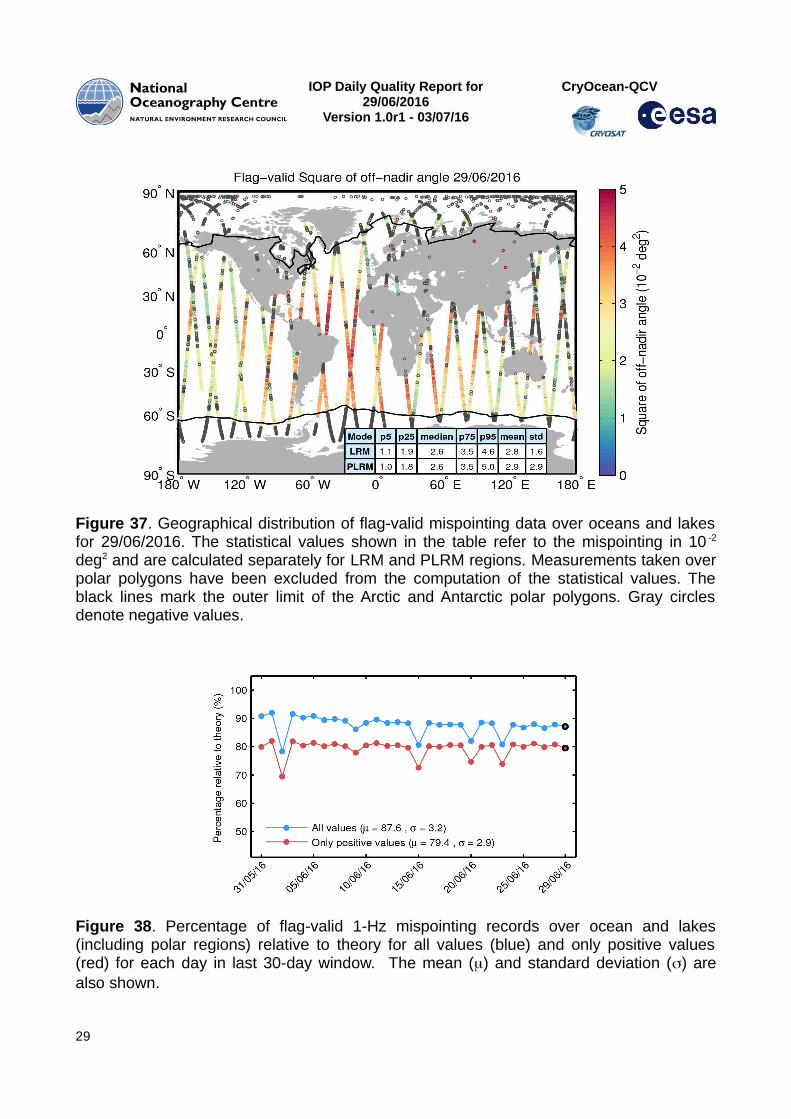
Figure 37. Geographical distribution of flag-valid mispointing data over oceans and lakesfor 29/06/2016. The statistical values shown in the table refer to the mispointing in 10 -2
deg2 and are calculated separately for LRM and PLRM regions. Measurements taken overpolar polygons have been excluded from the computation of the statistical values. Theblack lines mark the outer limit of the Arctic and Antarctic polar polygons. Gray circlesdenote negative values.
Figure 38. Percentage of flag-valid 1-Hz mispointing records over ocean and lakes(including polar regions) relative to theory for all values (blue) and only positive values(red) for each day in last 30-day window. The mean (μ) and standard deviation (σ) arealso shown.
29

CryOcean-QCV IOP Daily Quality Report for29/06/2016
Version 1.0r1 - 03/07/16
Figure 39. Histogram of flag-valid mispointing over oceans and lakes for LRM (blue) andPLRM (red) for 29/06/2016. Only positive values have been considered. The mean (μ) andstandard deviation (σ) are also shown. Note that values larger than 8 10 -2 deg 2 areexcluded from the histogram for the sake of readability but not from the computation of μand σ.
Figure 40. Box-and-whiskers plot for flag-valid mispointing showing for each day in last30-day window the first and third quartiles (bottom and top of the box), the median (thickblack), the 5% and 95% percentiles (lower and upper whiskers), and the mean (blue). The
30

IOP Daily Quality Report for29/06/2016
Version 1.0r1 - 03/07/16
CryOcean-QCV
yellow shading highlights the day analyzed in this report. Only positive values have beenconsidered.
31

CryOcean-QCV IOP Daily Quality Report for29/06/2016
Version 1.0r1 - 03/07/16
APPENDIX AIn this appendix we briefly describe the meaning of the warning codes summarized in page2 of the document.
• latency_fail: this warning is issued whenever one or more data files for the dayanalyzed in this report are made available with a delay of more than 3 days withrespect to the mean time of the records stored in the file.
• latency_mean_high: this warning is issued whenever the mean of the latencies overall data files for the day analyzed in this report is larger than 2 days.
• ocean_dropout: this warning is issued whenever the percentage of 1-Hz recordsover ocean and lakes relative to the theoretically expected number per day is smallerthan 80% for the day analyzed in this report.
• orbit_dropout: this warning refers to individual orbits and is issued whenever thepercentage of 1-Hz records over oceans and lakes relative to the theoreticallyexpected number per orbit is smaller than 80% for one or more orbits for the dayanalyzed in this report.
• large_orbit_bias: this warning refers to individual orbits and is issued wheneverthere are more than 100 flag-valid records with a SSH anomaly larger than ±90 cm.
• iono_missing: the whole ionospheric correction is missing for the day analyzed inthis report.
• dry_missing: the whole dry tropospheric correction is missing for the day analyzedin this report.
• wet_missing: the whole wet tropospheric correction is missing for the day analyzedin this report.
• atm_missing: the whole atmospheric (both IB and DAC) correction is missing for theday analyzed in this report.
• ssb_missing: the whole sea state bias correction is missing for the day analyzed inthis report.
32

IOP Daily Quality Report for29/06/2016
Version 1.0r1 - 03/07/16
CryOcean-QCV
Figure A1. Extent of the regions defining the geographical mode mask for 29/06/2016.The regions where SAR, and SARIn are operated are denoted by the orange and bluepolygons, respectively. LRM is operated over areas of the continental ice sheets (redpolygons) and over oceans and land not covered by other modes.
(end of Document)
33


![12[1]. IOP](https://img.pdfslide.us/doc/110x75/5475bb2eb4af9fa30a8b5d8f/121-iop.jpg)