Embed Size (px)
Citation preview

CRUSTAL AND UPPER MANTLE STRUCTURE OF OMAN AND THE
NORTHERN MIDDLE EAST
A Dissertation
Presented to the Faculty of the Graduate School
of Cornell University
in Partial Fulfillment of the Requirement for the Degree of
Doctor of Philosophy
by
Ali Ibrahim AlLazki
January 2003

© 2003 Ali Ibrahim AlLazki

iii
BIOGRAPHICAL SKETCH
Ali Ibrahim AlLazki was born in December 12, 1969. In 1992 he graduated from
Sultan Qaboos University, Sultanate of Oman, with a B. Sc. degree majoring in earth
sciences and a minor in physics. After graduation he joined the Department of Earth
Sciences in Sultan Qaboos University (SQU) as a demonstrator (teaching assistant)
position. His main interest was to continue his education in the field of geophysics. In
1995, he finished his Masters degree in geophysics from the University of Tulsa,
Oklahoma, USA, and went back to Oman to continue his teaching assistant job. Sultan
Qaboos University was involved in a national project to establish earthquakes
monitoring network. This was his first involvement with earthquakes and seismology.
Convinced by his colleagues in the earthquake committee that there was a need for a
seismologist to maintain the planned network, he thought of seismology as an option
at that time. Thereafter, in 1997 Ali was accepted at Cornell University in a Ph.D.
program in the field of Seismology/Geophysics.

iv
To my wife Asiya, my daughters Rayyan and Balqees,
and my larger family.
Thank you for your support.

v
ACKNOWLEDGMENTS
First of all, I would like to express my gratitude and thankfulness to my
Committee chair (Muawia Barazangi), Dogan Seber (Committee member), and Eric
Sandvol for their extended support and generosity in the long hours and efforts in
bringing about this dissertation. I am thankful to my other committee members Larry
Brown and William Philpot for their assistance throughout my studies at Cornell
University. This research is also the result of the generous exchange of information
and ideas from instructors and colleagues at the Department of Earth and Atmospheric
Sciences at Cornell University. My sincere gratitude to the many people I met
throughout my stay here at Cornell University and in other places who contributed in
one way or another to this research. In particular, I am thankful to Weldon Beuchamp,
Graham Brew, Carrie Brindisi, Alex Calvert, Khaled AlDamegh, Francisco Gomez,
George Hade, Steve Gallow, Christopher Harig, Matt Ricker, David Steer, Marisa
Valve, and Aaron Wade. I am thankful to the Oman Ministry of Oil and Gas in
allowing access to seismic and well data. Also thanks to Petroleum Development
Oman for their assistance in obtaining the seismic reflection and well data. Special
thanks to the Department of Minerals in the Oman Ministry of Commerce and
Industry for their continuing support and providing Oman Geological Maps and other
data. Special Thanks to Waris Warsi, Salam AlHashmi, and Khalfan AlTobi at the
Oman Earthquake Observatory Center, Sultan Qaboos University, for their
commitment in obtaining earthquake data from the four temporary stations in Oman.
Thanks to Samir Hanna at the Department of Earth Sciences, Sultan Qaboos
University, for his continuing support and help throughout my Ph.D. program here at
Cornell University and in Oman.
vi
I am grateful to the help and assistance of my colleagues at Bogazici
University in Turkey: Niyazi Turkelli, Ekrem Zor, Tolga Bekler, and Sadi Kuleli.
Thanks to the local and federal governments of Turkey for their help and assistance in
the field work in eastern Turkey.
The research was funded partially by a scholarship from the Sultan Qaboos
University, Sultanate of Oman, and partially was funded by the National Science
Foundation (Grant No. EAR9804780).

vii
TABLE OF CONTENTS
CHAPTER ONE: AN INTRODUCTION ………………………………………….....1
AN INTRODUCTION …………………………………………………………….1
REFERENCES …………………………………………………………………….6
CAHPTER TWO: A CRUSTAL TRANSECT ON THE SOUTHEAST ARABIAN
MARGIN ACROSS THE OMAN MOUNTAINS ……………..……………………..7
ABSTRACT ……………………………………………………………………….7
INTRODUCTION AND GEOLOGIC SETTING ………………………………...8
SEISMIC REFLECTION AND WELL ANALYSIS ……………………………18
Data …………………………………………………………………………..18
Methodology …………………………………………………………………19
Well Correlation ……………………………………………………………...22
Seismic Interpretation ………………………………………………………..26
Interior Zone: Line S50295 ……………………………………………….26
Interior Zone: Line S50274 ……………………………………………….29
Interior Zone: Line R40984 ……………………………………………….32
Hamrat Ad Duru Zone: Line R41019 ……………………………………..32
Coastal Zone: Line IUL0205 ……………………………………………...37
MOHO DEPTH ESTIMATION FROM RECEIVER FUNCTIONS ……………42
Methodology …………………………………………………………………42
Data and Analysis ……………………………………………………………43
GRAVITY MODELING ………………………………………………………...50
Data …………………………………………………………………………..53
Gravity Analysis ……………………………………………………………..58
Model_A ……………………………………………………………..58

viii
Model_B ……………………………………………………………...61
DISCUSSION ……………………………………………………………………62
The Foreland Region …………………………………………………………62
The Hinterland Region ……………………………………………………….69
CONCLUSIONS …………………………………………………………………72
ACKNOWLWDGMENT ………………………………………………………..74
RFERENCES …………………………………………………………………….75
CHAPTER THREE: TOMOGRAPHIC PN VELOCITY AND ANISOTROPY
STRUCTURE BENEATH THE ANATOLIAN PLATEAU (EASTERN TURKEY)
AND THE SURROUNDING REGION ………………………………...…………...80
ABSTRACT …………….…………………………………………………….….80
INTRODUCTION ……………………………….………………………….…...81
DATA AND INVERSION METHOD……...……………….……………….…..84
TOMOGRAPHY RESULTS …………………………………..………….……..85
DISCUSION AND CONCLUSIONS ……………………………………...…….96
ACKNOWLEDGMENTS ………………………………………………….……98
REFERENCES …………………………………………………………………...99
CHAPTER FOUR: PN TOMOGRAPHIC IMAGING OF MANTL LID VELOCITY
AND ANISOTROPY AT THE JUNCTION OF THE ARABIAN, EURASIAN, AND
AFRICAN PLATES ……………….………………………………………….……101
ABSTRACT ………………………………………………………………….....101
INTRODUCTION ……………………………………………………….……..102
TECTONIC BACKGROUND ……………………………………….…………107
METHOD ……………………………………………………………………….108
DATA …………………………………………………………………………...109
RESOLUTION AND ANALYSIS ……………………………………………..119

ix
INVERSION RESULTS ………………………………………………………..128
Pn Velocity Anomalies ……………………………………………………..128
Pn Anisotropy ……………………………………………………………....137
Pn Station Delays …………………………………………………………..140
DISCUSION AND CONCLUSIONS ……………………………………….…145
Rheology and structure ………………………………………………….….145
Pn Anisotropy and Station Delays: Tectonic implications ……………..…..151
ACKNOWLEDGMENTS ………………………………………………...……157
REFERENCES ………………………………………………………………….158

x
LIST OF TABLES
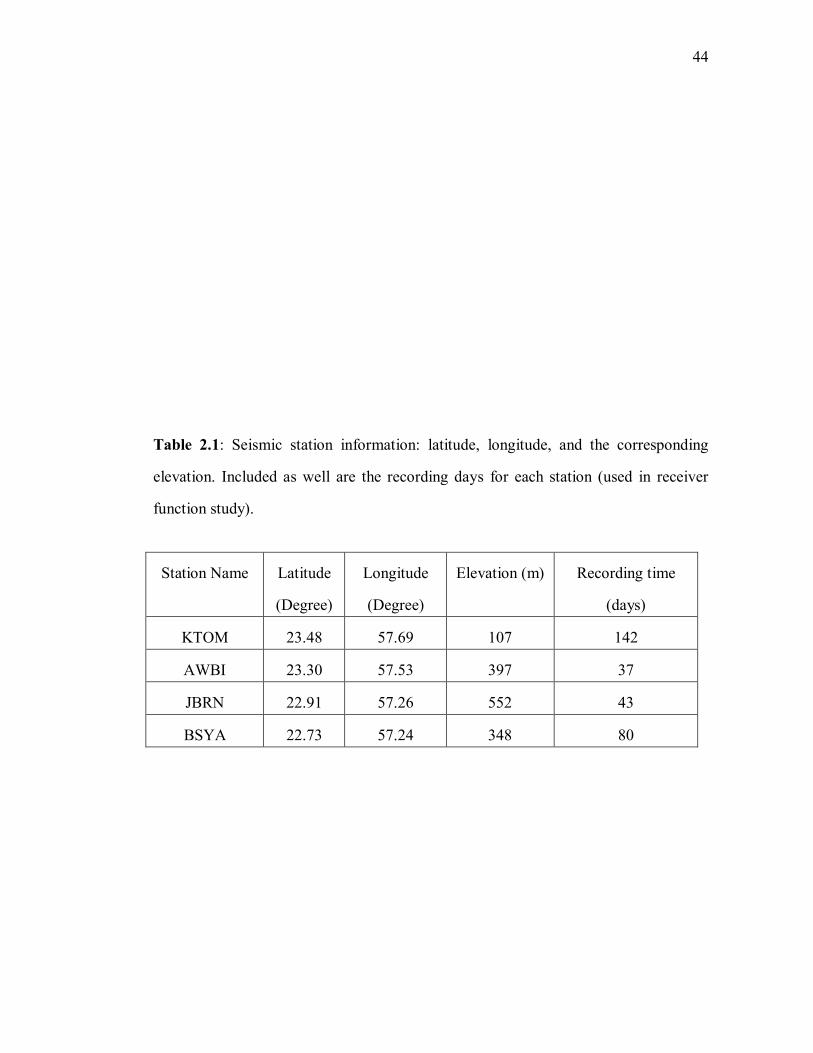
Table 2.1. Seismic stations information: latitude, longitude, and the corresponding
elevation. Included as well are the recording days for each station (used in
receiver function study). …………………………………………...………...….44

xi
LIST OF FIGURES
Figure 1.1. A map showing simplified tectonic plate boundaries and major fault zones
in the study area. Shown in two gray scale grades are ophiolites, and basement
outcrops. AP: Anatolian Plate, CA: Cyprean Arc, EAF: East Anatolian Fault, HA:
Hellenic Arc, NAF: North Anatolian Fault. ……………………………………...3
Figure 2.1. Map showing simplified plate boundaries surrounding the Arabian Plate.
Green arrows represent plate motion relative to the nearest plate, and pink arrows
represent absolute plate motion. (After Kensaku Tamaki, Ocean Research
Institute, University of Tokyo, http://manbow.ori.utokyo.ac.jp). …………...10
Figure 2.2. A Geologic column of the Oman Mountains and Interior Oman showing
major sedimentary groups (e.g., Haima) and key formations names (e.g., Muti) in
the region. The geologic column includes the major tectonic events that have
affected the southeastern Arabian margin and the surrounding regions. (Modified
from Le Metour et al. 1995). ……………………………………………………13
Figure 2.3. Topography map of the study area showing wells and seismic reflection
lines (blue) locations (see Figure 2.1 for location). Shown in this map are the
three structural zones: Coastal Zone, Hamrat Ad Duru Zone, and Interior Zone.
The yellow triangles and circles show seismic station locations and the
corresponding approximate PsMoho impingement location, respectively.
Abbreviated text shown on map stands for the following names, SH: Saih Hatat,
JQ: Jabal Qusaybah, JS: Jabal Salakh, JM: Jabal Madmar, JN: Jabal Nakhl, MFZ:
Maradi Fault Zone, N: Natih structure, and F: Fahud structure. Base map is a

xii
shaded relief representation of topography data available at Cornell
University.……………………………………………………………………….16
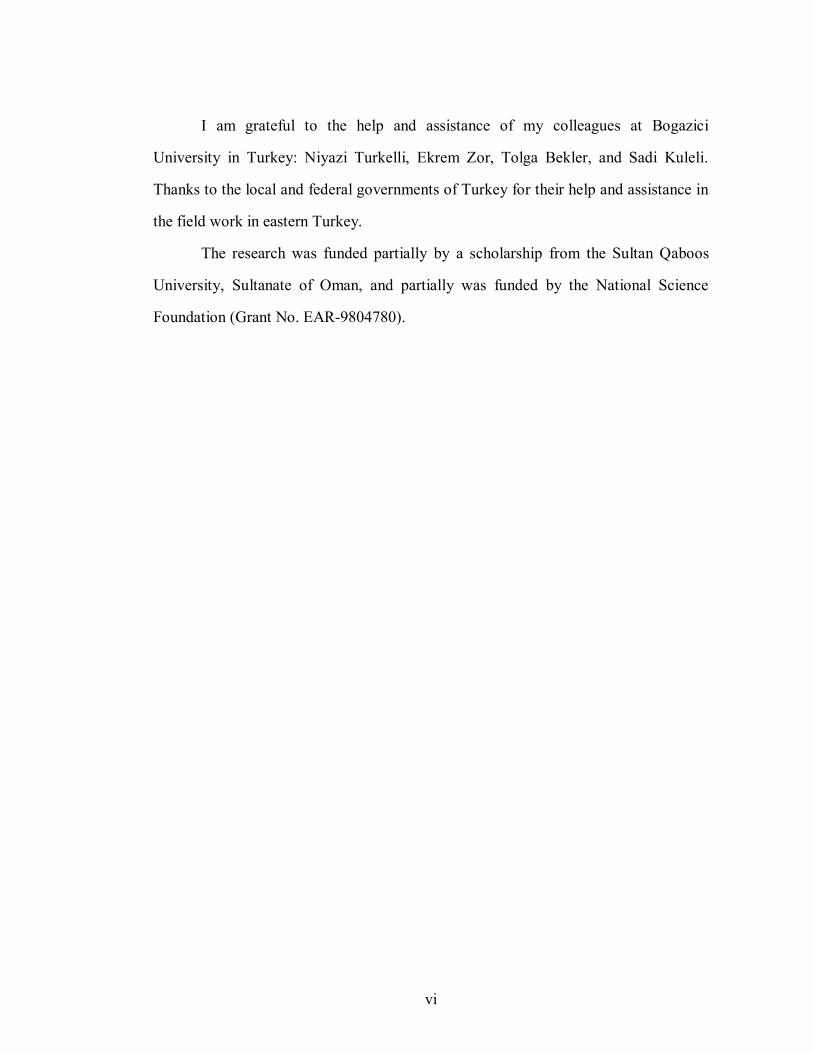
Figure 2.4. Well log correlation diagram showing sonic velocity in solid black lines
and interval seismic velocities in dashed blue lines. Seismic interval velocities
overlain on SD1 and JKH2 are obtained from lines S50295, and IUL0001 (see
Figure 2.3), respectively. Blue text is the averaged velocity for delineated
intervals (see Figure 2.3 for location). ………………………………………......21
Figure 2.5. Fence diagram showing correlation of the Hajar Supergroup (HSG)
Sequence in the Interior and Hamrat Ad Duru Zones (see Figure 2.3 for location).
Red lines represent correlation between units within the HSG Sequence, and blue
line marks the top of Aruma Group (Muti and Fiqa Formations). Age and
stratigraphic identification is based on interpretation of oil exploration companies.
Defined groups (GP) and correlated formations are after Le Metour et al. (1995),
Pratt and Smewing (1990), Rabu et al. (1990), and Nolan et al. (1990). ……….24
Figure 2.6. Interpretation of a migrated 2D seismic reflection profile (see Figure 2.3
for location). Red lines are inferred normal faults with possible continuation
shown as dashed lines. The normal faulting system form negative flower
structures that offset reflectors below 3 seconds. These flower structures are
associated with a wrench faulting system observed in the foreland region. The
upper one second of the section shows reflectors of the Fiqa Formation onlapping
southwestward. The orange colored solid line represents the top of Hajar
Supergroup Sequence and MPLF corresponds to MiocenePliocene Fars
Group.……………………………………………….……………………..…….28

xiii
Figure 2.7. (a) A migrated 2D seismic reflection profile of line S50274 crossing the
Maradi Fault Zone. The fault zone includes two styles of deformation: a strike
slip component (a flower structure) and a reverse component inferred from the
depth difference of the Natih Formation (orange line) reflector across the fault
zone (see Figure 2.3 for location). (b) A line interpretation of S50274 line
showing relative motion within the Maradi Fault Zone and marker reflectors.
Abbreviated text MPlbz and Eur stands for MiocenePliocene Berzman
Formation and Eocene Um Er Radhuma Formation. ………...…………………31
Figure 2.8. (a) A migrated 2D seismic reflection profile of line R40984 crossing in
the subsurface northern bounds of Jabal Qusaybah anticline structure (see Figure
2.3). (b) A line interpretation of the seismic line R40984 showing a normal fault
system southwest of Jabal Qusaybah. Note we also interpret a zone of strikeslip
faulting (flower structure) south of Jabal Qusaybah. …………………………...34
Figure 2.9. A migrated 2D seismic reflection profile of line R41019 in the Hamrat
Ad Duru Zone, overlain by line interpretation (see Figure 2.3 for location). The
line interpretation shows reflectors of the Fiqa Formation downlapping onto the
top of Muti Formation in a southwesterly direction. Also important stratigraphic
markers are shown. ……………………………….…………………...………...36
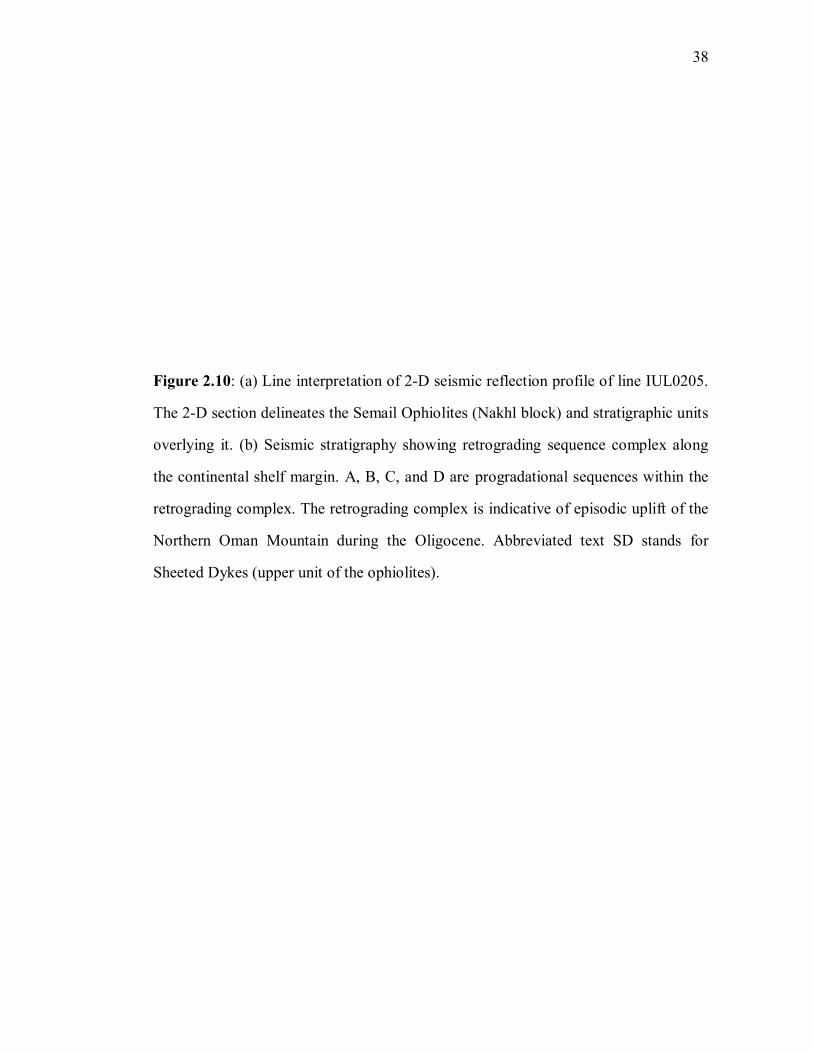
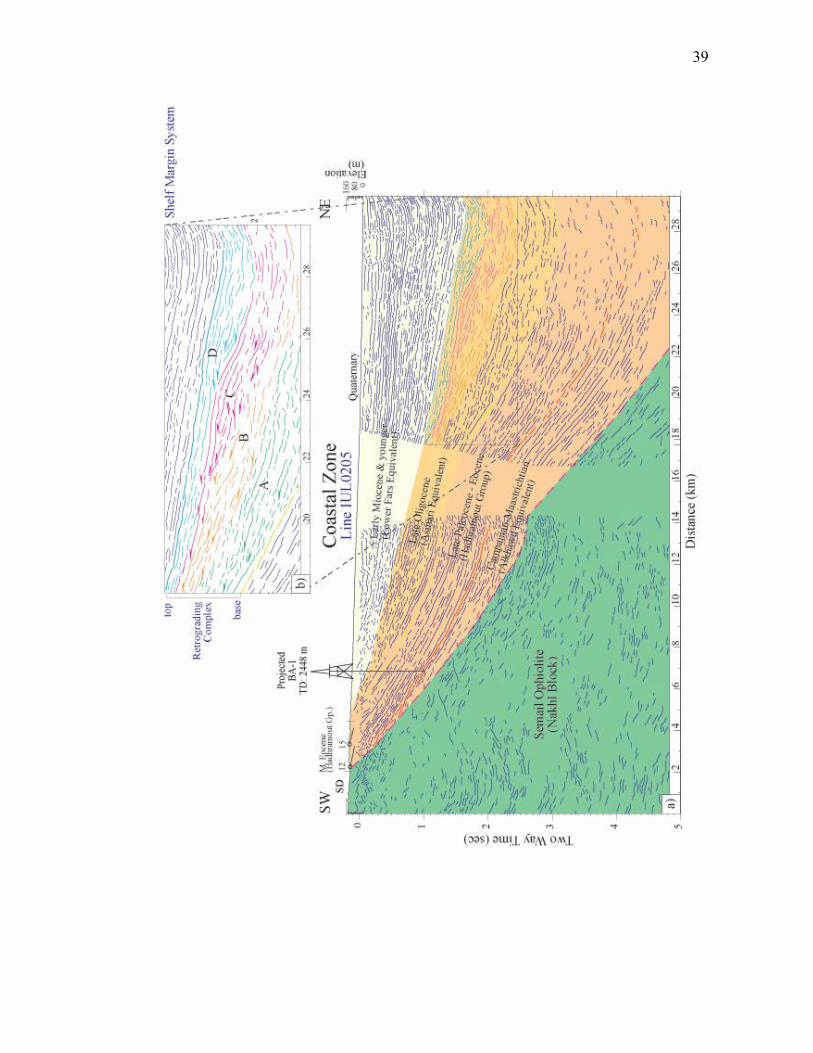
Figure 2.10. (a) Line interpretation of 2D seismic reflection profile of line IUL0205.
The 2D section delineates the Semail Ophiolites (Nakhl block) and stratigraphic
units overlying it. (b) Seismic stratigraphy showing retrograding sequence
complex along the continental shelf margin. A, B, C, and D are progradational
sequences within the retrograding complex. The retrograding complex is

xiv
indicative of episodic uplift of the Northern Oman Mountain during the
Oligocene. Abbreviated text SD stands for Sheeted Dykes (upper unit of the
ophiolites). ………………………………………………………………………39
Figure 2.11. Map centered on Oman showing locations of teleseismic earthquakes that
were used to obtain the final receiver function response for the stations KTOM,
AWBI, JBRN, and BSYA (see Figure 2.3 for location). Recorded events location,
magnitude, and depth information were obtained from the USGS event catalog
(Mb: body wave moment magnitude). ………………………………………….46
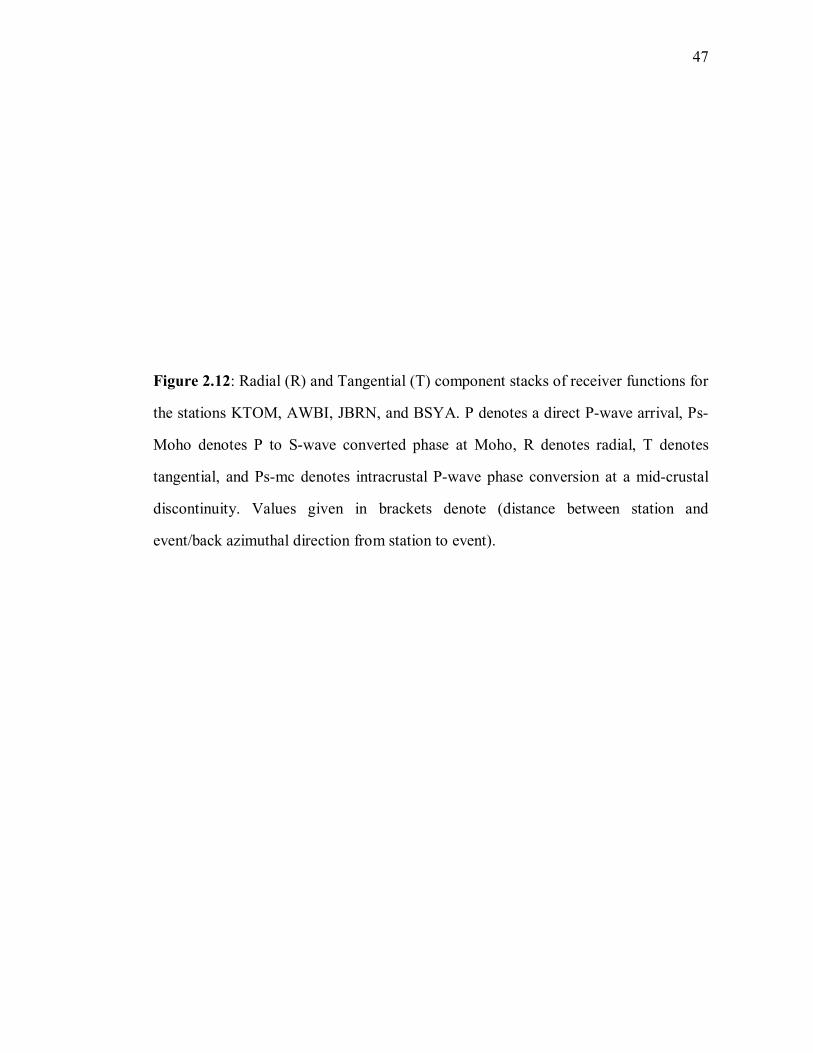
Figure 2.12. Radial (R) and Tangential (T) component stacks of receiver functions for
the stations KTOM, AWBI, JBRN, and BSYA. P denotes a direct Pwave arrival,
PsMoho denotes P to Swave converted phase at Moho, R denotes radial, T
denotes tangential, and Psmc denotes intracrustal Pwave phase conversion at a
midcrustal discontinuity. Values given in brackets denote (distance between
station and event/back azimuthal direction from station to event). ……………..48
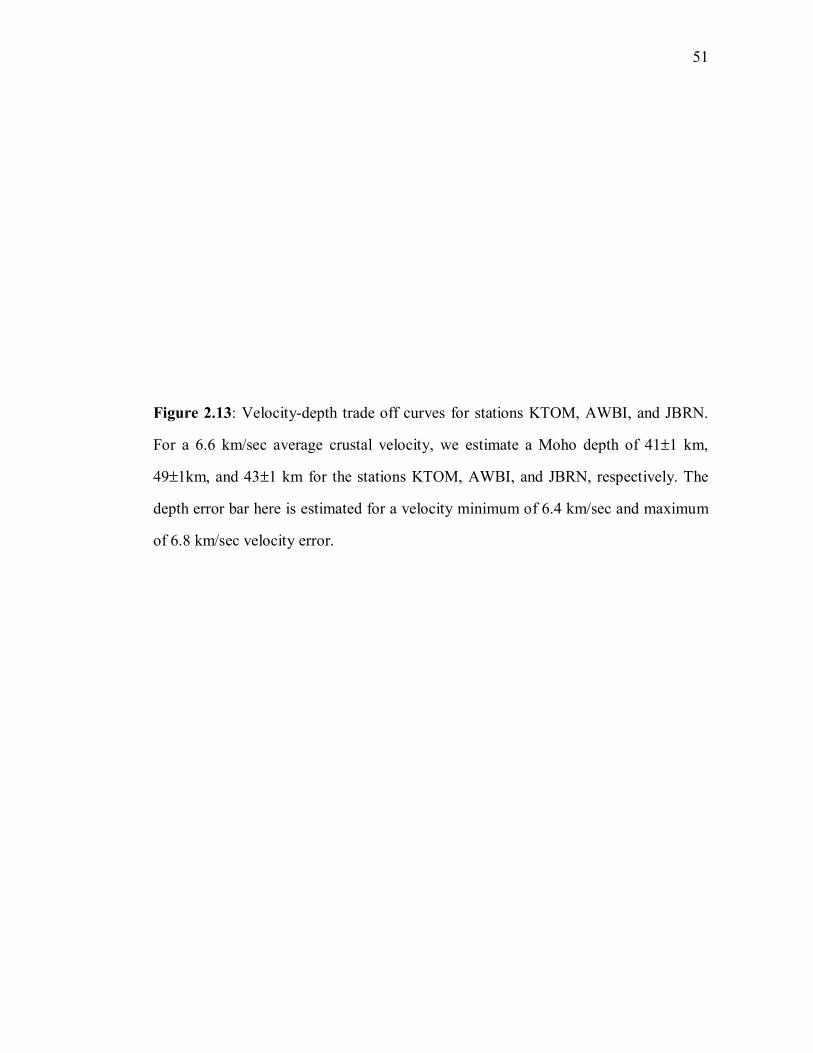
Figure 2.13. Velocitydepth trade off curves for stations KTOM, AWBI, and JBRN.
For a 6.6 km/sec average crustal velocity, we estimate a Moho depth of 41±1 km,
49±1km, and 43±1 km for the stations KTOM, AWBI, and JBRN, respectively.
The depth error bar here is estimated for a velocity minimum of 6.4 km/sec and
maximum of 6.8 km/sec velocity error. …………………………………………52
Figure 2.14. (a) Graph showing maximum, minimum, and average Bouguer gravity
anomalies in a 50 km swath along the transect (see Figure 2.3 for location). (b)
Graph showing maximum, average, and minimum elevation profiles along the

xv
transect. Gravity and elevation values are calculated for a 5 km sampling interval
along the complete transect. …………………………………………………….55
Figure 2.15. Cross sections showing the entire crust and upper mantle obtained from
gravity modeling. ModelA: Density values of 2.7 gm/cc and 2.5 gm/cc for the
lower crust and the prePermian Sequence, respectively. A minimum lateral
density variation is allowed in this model. ModelB: For a 2.7 gm/cc and 2.55
gm/cc for the lower crust and the prePermian Sequence, allowing relatively more
lateral variation in density values along the transect. Density values are allowed to
increase along both sections, from southwest to northeast, for both models. …..60
Figure 2.16. The complete transect of the crust and parts of the upper mantle from the
interior of Oman in the southwest, across the Jabal Akhdar Mountain and in the
hinterland in the northeast. Also, shown observed and model Bouguer gravity
values, with the corresponding elevation along the transect. The transect depicts
important stratigraphic sequences and formations, and structural relations. Red
lines indicate faults and black arrows indicate relative motion along the fault. 2D
seismic profiles location along the transect are indicated by dashed blue and green
rectangles. The Semail Ophiolites frontal thrust is delineated at the sole of the
Hawasina Sediments, and a bold red line indicates the sole of the igneous
ophiolite body. Dip information of the Jabal Akhdar Mountain are shown along
the surface of the structure. The transect also shows locations of deployed seismic
stations (yellow triangles) and the corresponding, projected, impinging locations
are shown as error bars. …………………………………………………………65

xvi
Figure 2.17. A geology map extracted from 1:250,000 scale Oman Geological Maps,
(1992) of part of the foreland region (see Figure 2.3 for location). The map view
depicts the structural relations between the Maradi Fault Zone (MFZ) and the
structures of Natih and Fahud. Abbreviated text shown in the legend stands for
the following: MPlbz: MiocenePliocene Berzman Formation, Mda: Middle
Miocene Dam Formation, Edm: Middle Eocene Dammam Formation, Ers: Early
Eocene Rus Formatio, Eur: Early Eocene Um Er Radhuma Formation, LKfq: Late
Cretaceous Fiqa Formation, Ant: Albian Natih Formation, and HW: Hawasina
Sediments. The map shows locations of selected, depth converted section, with no
vertical exaggeration. The depth sections are used to infer subsurface structural
relation between MZF, Fahud and Natih structures with NWNE wrench faulting
system, observed as flower structures in each section. Within each depth section,
red lines denote faults, with black arrows showing the relative motion. Blue lines
delineate random reflector to enhance the structural attributes shown in each
section. SectionA and SectionB are interpreted as positive flower structures
while SectionC as a negative flower structure. ………………………………...68
Figure 3.1. Simplified tectonic boundaries (black lines) of northern Arabian and
Eurasian plates atop hit counts basemap for every 1/6 o cell size. 1 = White
triangles are Eastern Turkey Seismic Experiment (ETSE) stations, and black
triangles are Syrian National Seismic Network (SNSN) stations; white hexagons
are Turkish National Seismic Network stations, black hexagons are temporary
stations of the southern Caspian experiment; white stars are the temporary station
of the Iranian Long Period Array (ILPA); and open triangles are other local
stations obtained from the ISC catalouge. 2 = Thrust, and 3 = strikeslip fault
boundaries. BS = Bitlis Suture and ZS = Zagros Suture, GC = Greater Caucasus,

xvii
LC = Lesser Caucasus, NAF = North Anatolian Fault, EAF = East Anatolian
Fault, DSF = Dead Sea Fault. ………………………………………………...…83
Figure 3.2. (a) A map showing inverted tomographic image of Pn velocity of the
study area. Red tones represent low Pn velocity zones (unstable to partially
molten mantle lid regions), while blue tones represent high Pn velocity (indicate
stable mantle lid regions). A broad scale low (< 8 km/s) Pn velocity anomaly
underlies northwestern Iran, the Caucasus region, Turkey, and northwestern
Arabia, while smaller scale very low (< 7.8 km/s) Pn velocity anomalies underlie
the Lesser Caucasus, western Greater Caucasus, and the easternmost portion of
the NAF. High Pn velocity (> 8 km/s) zones underlie northern and northeastern
Arabia, the Caspian and Azerbaijan (eastern Greater Caucasus), the Black Sea,
and northeastern Mediterranean Sea. 1= Neaogene/Quaternary volcanoes, 2=
Thrust boundary, and 3= Strikeslip boundary. (b) Checkerboard test results for
2 o x2 o cells inverted using the same station and event distribution used in the
velocity and anisotropy model shown in Figure 3.2a. Most of the study area
shows resolved checkerboard cells except for the northwestern Iran and the
southern Caspian Sea where partial NWSE smearing is observed to influence
inverted Pn velocity and anisotropy directions. …………………………………87
Figure 3.3. (a) A map showing our tomographic image of Pn velocity using only the
data picked and read by the authors. The upper bounds of high Pn velocity zone
along the EAF and the eastern BS are used to define the northern extent of the
Arabian plate boundary. (b) A map showing 1.5 o x1.5 o checkerboard test results
inverted using the same stations and events distribution for Figure 3.3a. The best

xviii
resolution is along the EAF, eastern BS zones, and at the intersection zone
between the EAF and NAF zones. Symbols are as in Figure 3.2. …...…….……90
Figure 3.4. A map showing Pn anisotropy inverted simultaneously with the velocity
model. See Figure 3.2a for text abbreviation in map. ………………………..…93
Figure 3.5. A map of station delays representing the station leg residuals relative to
the assumed velocity model. Squares are positive station delays and indicate thick
and/or slow crust. Circles are negative station delays and indicate fast and/or thin
crust relative to the assumed velocity and thickness model of the crust. For
abbreviated text, see Figure 3.1. Eastern Turkey Seismic Experiment (ETSE)
array shows a general decrease in delay magnitudes from east to west. Stations
located in the Caucasus region show negative station delays. ……………….…95
Figure 4.1. Simplified tectonic map of the study area showing main plate boundaries.
AP: Anatolian Plate, BS: Bitlis Suture, CA: Cyprean Arc, CIM: Central Iranian
Microplate, DSF: Dead Sea Fault, EAF: East Anatolian Fault, GC: Greater
Caucasus, HA: Hellenic Arc, IA: Isparta Angle, KD: Kopeh Dagh, LC: Lesser
Caucasus, LB: Lut Block, SL: Sinai and Levantine subplate, NAF: North
Anatolian Fault, NWIP: North West Iranian Plate, TC: Transcaucasus, and ZS:
Zagros Suture. ………………………………………………………………….104
Figure 4.2a. Map showing seismic stations used in this study. CA: southern Caspian
Sea stations, ETSE: Eastern Turkey Seismic Experiment stations, ILPA: Iran
Long Period Array, SN: Syrian National network, and TN: Turkish National
network. Open triangles correspond to selected stations from the National

xix
Earthquake Information Center (NEIC) and the International Seismological
Centre (ISC) catalogues. (See Figure 4.1 for geographic locations). ………….111
Figure 4.2b. Map showing seismic events (in circles) used in the Pn velocity and
anisotropy tomography inversion. (See Figure 4.1 for geographic locations). ..113
Figure 4.3. (a) Input travel time residuals (corrected for a 2D velocity fit). A 10
seconds cutoff is used in the Pn tomography inversion. The travel time residuals
are calculated using the study area’s Pn average velocity (8 km/s). (See Figure 4.1
for geographic locations). (b) Travel time residuals obtained using the Pn
tomography results. A 35 % variance reduction is obtained compared to the input
2D fit residuals. (See Figure 4.1 for geographic locations). . ………………...116
Figure 4.4. Hit map coverage of the study area. Shades of gray show the number of
rays passing through a single 0.25 o x0.25 o cell. ………………………………..118
Figure 4.5a. Checkerboard synthetic velocity anomalies used to test the ability of the
available stations and events coverage to resolve a 2 o x2 o velocity checkers. The
anomaly amplitudes alternate between 0.25 km/s and +0.25 km/s velocity. (See
Figure 4.1 for geographic locations). …………………………………………..121
Figure 4.5b. Pn velocity checkerboard test result. (See Figure 4.1 for geographic
locations). ………………………………………………………………….…..123
Figure 4.6a. Checkerboard synthetic anisotropy anomalies used to test the ability of
available stations and events coverage to resolve a 2 o x2 o anisotropy checkers. The

xx
checkers are made of alternating NS and EW anisotropy orientations of a 0.25
km/s magnitude. (See Figure 4.1 for geographic locations). …………………..125
Figure 4.6b. Pn anisotropy checkerboard test result. (See Figure 4.1 for geographic
locations). ………………………………………………………………….…..127
Figure 4.7a. A map showing the Pn velocity tomographic results including Pn
anisotropy. The image shows a broader scale low Pn velocity (< 8 km/s) anomaly
underlying the boundary zone of Arabia and most of the Anatolian plate. Within
the broader low velocity zone anomalies shorter scale very low Pn velocity (< 7.8
km/s) anomalies underlie southern Syria, the Lesser Caucasus region, the Isparta
Angle, and central Turkey. (See Figure 4.1 for geographic locations). . ……...130
Figure 4.7b. A map showing the optimal isotropic Pn velocity model. This model
shows minor differences from the anisotropic model of Figure 4.7a. Notice the
difference in the Aegean Sea region, where higher velocities south of the Hellenic
arc are displaced northwards inside the Sea of Crete and southern Aegean Sea.
(See Figure 4.1 for geographic locations). . ……………………………….…..134
Figure 4.8. A map showing Pn velocity errors calculated using 100 bootstrap
iterations. (See Figure 4.1 for geographic locations). ………………………….136
Figure 4.9. A map showing Pn azimuthal anisotropy orientations. Compared to Pn
velocity of Figure 4.7a, Pn anisotropy orientations display a higher degree of
lateral variations in the region. (See Figure 4.1 for geographic locations). …...139

xxi
Figure 4.10. A map showing Pn anisotropy errors using 100 bootstrap iterations. (See
Figure 4.1 for geographic locations). …………………………………………..142
Figure 4.11. A map showing stations delay. Squares represent thick and/or slow crust,
circles represent fast and/or thin crust (See Figure 4.1 for geographic
locations).…………………………………………………………………...….144
Figure 4.12. A comparative map showing Pn velocity with anisotropy (base map, red
blue color, see Figure 4.7a), volcanic outcrops in green and pink polygons filled
with plus signs, Sn attenuation zones in yellow lines hatched areas enclosed by a
solid gray line (after Khaled AlDamegh, personal communication, June 2002),
and volcanoes in yellow triangles. (See Figure 4.1 for geographic locations). ..147
Figure 4.13. A comparative map showing Pn anisotropy in solid blue lines (see Figure
4.9), SKS shear wave splitting in green solid lines (after Sandvol et al. 2001), and
GPS vector direction in pink solid lines (after McClusky et al. 2000). (See Figure
4.1 for geographic locations). …………………………………………..……...153

1
CHAPTER ONE
An Introduction
This dissertation focuses on studying the crustal structure on the southeast
margin and foreland of Arabia in Oman, and upper mantle rheology and structure at
the zone of interaction between the Arabian, Eurasian, and African plates (Figure 1.1).
At the center of the study area, the Arabian plate is bounded in the east by the Indian
plate along the Owen and Murray Transform Fault zones, in the northeast and north it
is bounded by the Eurasian plate along the ZagrosBitlis Suture zones, and in the west,
northwest, and southwest it is bounded by the African plate along the Dead Sea Fault,
the Red Sea, and the Gulf of Aden (Figure 1.1). Northwest of Arabia, the Hellenic and
the Cyprean arcs define the convergence boundary between the African plate and the
Anatolian plate in eastern Mediterranean Sea (Figure 1.1).
One of the most important events throughout geologic history of the region is
the closure of the NeoTethys ocean. It began in Early Cretaceous along the eastern
and northeastern boundaries of the ArabianAfrica Plate and lasted to Pliocene times
(Sengor and Yilmaz, 1981). Ophiolite emplacement is a process that commonly
accompanied the closure and subduction of the NeoTethys ocean. At present day a
belt of NeoTethyan ophiolites follows the suture zone between the ArabianEurasian
plate boundary and farther west within the Anatolian plate (Figure 1.1). While at the
north and northeast boundaries of the Arabian plate the closure of the NeoTethys and
final suturing processes have concluded and resulted in the building of the Iranian
Anaoltian plateaus, at the southeast Arabian plate boundary, a piece of the NeoTethys
oceanic lithosphere (Semail Ophiolites) was emplaced in the late Cretaceous, but the
closure process is still ongoing by subducting the remnant basin of Oman at the
Makran Subduction zone (Figure 1.1).

2
Figure 1.1: A map showing simplified tectonic plate boundaries and major fault zones
in the study area. Shown in two gray scale grades are ophiolites and basement
outcrops. AP: Anatolian Plate, CA: Cyprean Arc, EAF: East Anatolian Fault, HA:
Hellenic Arc, NAF: North Anatolian Fault.

3

4
At a later stage, the opening of the Red Sea and Gulf of Aden is thought to have
occurred episodically (Hempton, 1987). An initial phase occurring in the period
MiddleLate Eocene and a later phase occurred in the Early Pliocene (~14.5 Ma)
(Hempton, 1987). This separation of Arabia from Africa accommodated by the left
lateral Dead Sea Fault System is thought to be responsible for the reorganization of
relative plate motions in the Anatolian Plateau (Eurasian plate) (Sengor and Yilmaz,
1981). In early Pliocene, continued NS convergence between Arabia and Eurasia
resulted in the extrusion of an Anatolian plate along the North Anatolian Fault (NAF)
and the East Anatolian Fault (EAF) zones (Bozkurt, 2001). The Anatolian plate's
westward escape is converging along the Hellenic and Cyprean subduction zones,
where Africa's oceanic lithosphere is being subducted.
Chapter two of this dissertation presents a detailed study of the crustal
structure along 255 km long transect that includes the hinterland, the mountains, and
the foreland of Oman. The main objective of this study is to investigate the crustal
scale structure of the eastern Arabian margin, across the 3,000 meters high Oman
Mountains. Various geophysical and geological data are used to model the crustal
thickness along the transect. We used exploration seismic and well data to constrain
the upper 78 km of the sedimentary column, receiver function to infer Moho depth
along the transect, and gravity modeling to constrain Moho lateral variations and infer
a basement depths along the transect. Furthermore, integrated geological and
geophysical data shed valuable information about the processes that accompanied the
Semail Ophiolite emplacement.
Chapter three focuses on the young continentcontinent collision zone between
northern Arabia and Eurasia along the BitlisZagros Suture zone. We use Pn
tomography to further our knowledge about the mantle lithosphere rheology and
structure and its contribution to lithosphere dynamics at the young BitlisZagros

5
continentcontinent collision zone. Pn velocities higher than 8 km/s are used to infer
stable mantle lid, while Pn velocities less than 8 km/s are used to infer mantle lid
instability.
Chapter four presents evidence on upper mantle rheology using Pn velocity
and structure and using Pn anisotropy at the junction of the Arabian, Eurasian, and
African plates. This research looks at the larger scale picture of the three plates'
interactions and use Pn velocity and anisotropy to contrast regions underlain by stable
mantle lid from those unstable and to investigate uppermost mantle processes. This
study, also, focuses on regions underlain by small scale (< 200 km) very low Pn
velocity anomalies that indicate thinned to absent mantle lid. This study compares Pn
velocity with Sn attenuation map of the region. It also compares observed Pn
azimuthal anisotropy with shear wave SKS polarization anisotropy to infer
asthenospheric mantle deformation.

6
REFERENCES Bozkurt, E. 2001. Neotectonics of Turkey a synthesis. Geodinamica Acta : The
Europian Journal of Geodynamics, v. 14, no. 13, p. 330.
Hempton, M.R. 1987. Constraints on Arabian plate motion and extensional history of the Red Sea. Tectonics, v. 6, no. 5, p. 687705.
Sengor, A.M.C. and Y. Yilmaz 1981. Tethyan evolution of Turkey: a plate tectonic approach. Tectonophysics, v. 75, p. 181241.

7
CHAPTER TWO
A Crustal Transect on the Southeast Arabian Margin Across the
Oman Mountains*
ABSTRACT
The unique tectonic setting of the Oman Mountains, the Semail Ophiolite, and
the ongoing hydrocarbon exploration have led to extensive geological research
focused on sedimentary units and ophiolite stratigraphy of Oman. Few studies,
however, investigated the crustalscale structure of the southeastern Arabian
continental margin. Here we construct a NESW oriented crustal transect in the
northern Oman Mountains across the Jabal Akhdar Mountain and the foreland region,
covering a distance of 255 km. Along the transect the upper 8 km of the crust is
primarily constrained using 152 km of 2D seismic reflection profiles, 15 exploratory
wells, and 1:100,000 to 1:250,000 scale geological maps. Seismic receiver function
analysis of teleseismic earthquake waveform data produced by three temporary digital
seismic stations provided the first reliable constraints on Moho depth beneath three
locations along the transect. Bouguer gravity modeling was subsequently used to
further interpret depth to Moho along the transect and depth to the metamorphic
basement.
Four principal findings are documented. First, we interpret the presence of a
mountain root beneath the Jabal Akhdar Mountain with a lateral extent of about 60 km
along the transect. A Moho depth of 4144 km was obtained ~25 km southwest of the
Jabal Akhdar Mountain. The Moho depth increases to 4851 km beneath the
______________________________________ *Published in part as Ali I. AlLazki, Dogan Seber, Eric Sandvol, and Muawia Barazangi, Institute for the Study of the Continents and Department of Earth and Atmospheric Sciences, Cornell University, Ithaca, New York, GeoArabia, Vol. 7, No. 1, 4778, 2002, Gulf PetroLink, Bahrain.

8
northeastern limb of Jabal Akhdar Mountain and decreases to a depth of 3942 km at
~25 km northeast of the Akhdar Mountain, in the coastal plains. Second, based on
Bouguer gravity modeling, we infer an average of 9 km depth to the metamorphic
basement in the core of the Jabal Akhdar Mountain and the area immediately
southwest of the mountain. A relatively shallow depth to basement, 78 km, is found
to coincide with Jabal Qusaybah south of the Hamrat Ad Duru range. Third, based on
surface, subsurface and gravity modeling, the Nakhl Ophiolite block is found to
extend beyond the shoreline for approximately 80 kilometers from its most southern
surface outcrop. The Nakhl block averages in thickness ~5 km, whereas the ophiolite
body south of the Jabal Akhdar Mountain is found to have a maximum thickness of 1
km. The underlying unit of the Hawasina sediments is found to average in thickness
between 23 km in the Hamrat Ad Duru Zone and 2 km in the Coastal Zone. Finally,
based on interpretation of seismic reflection profiles in the area southwest of Jabal
Akhdar Mountain, we document the presence of NWSE oriented, basement involved
strikeslip faults deforming Miocene to Pliocene sediments.
INTRODUCTION AND GEOLOGIC SETTING
The presentday Arabian Plate is surrounded by different types of known plate
boundaries (Figure 2.1). In the west, a divergent boundary running south from the
Gulf of Aqaba to the Red Sea and the Gulf of Aden marks stages of early continental
rifting (Gulf of Aqaba) to the final stages of development of a mature oceanic
lithosphere (southern Red Sea and Gulf of Aden). In the northwest, the Dead Sea
transform fault system separates the Arabian Plate from the African Plate. The
northern and the northeastern boundaries are continentcontinent collision zones
between the Arabian and the Eurasian plates forming the Bitlis and the Zagros sutures.
The Zagros collision in the east continues south and transforms into a continent

9
Figure 2.1: Map showing simplified plate boundaries surrounding the Arabian Plate.
Green arrows represent plate motion relative to the nearest plate, and pink arrows
represent absolute plate motion. (After Kensaku Tamaki, Ocean Research Institute,
University of Tokyo, http://manbow.ori.utokyo.ac.jp).

10

11
oceanic subduction zone in the Makran subduction zone. The Owen and Murray
transform faults mark the southeastern boundary of the Arabian plate that separate
Arabia from the Indian Plate (Figure 2.1).
The study area is located in northern Oman and includes the southeastern
margin and the foreland regions of the Arabian Plate. Tectonically, the most
prominent feature along the southeastern Arabian margin is the Northern Oman
Mountains, also known as the Hajar Mountains. The Northern Oman Mountains cover
a length of ~700 km and vary between 40 to 130 km in width, with elevations up to
3000 meters above sea level.
Five tectonic sequences are recognized throughout the Oman region and are
described below from the structurally lowest to the highiest sequence as shown in
Figure 2.2. Rifting events initiated in the Precambrian/Cambrian, and the Early
Permian periods started the development of two distinctive stratigraphic sequences:
the prePermian Sequence (Late Proterozoic to Early Permian) made of alternations of
clastics and carbonates, and the Hajar Supergroup (HSG) sequence (Late PermianMid
Cretaceous), dominantly made of marine carbonates (Figure 2.2). The Late Cretaceous
ophiolite emplacement is one of the most important tectonic events that affected the
southeastern Arabian margin (Glennie et al., 1973; Boudier and Coleman, 1981;
Coleman, 1981; Lippard, 1983). This tectonic event led to the emplacement of the
Allochthonous Sequence; comprised of the Semail Ophiolite, with thickness of 1012
km (Shelton, 1990) and deep oceanic and shallow marine sediments of the Hamrat Ad
Duru and Sumeini Groups, respectively. The emplacement event is documented to
span the period Cenomanian to Coniacian, (Hopson et al., 1981; Pallister and Hopson,
1981; Boudier et al., 1985; Nicolas et al., 1996; Searle and Cox, 1999). In this study,
we refer to both the Hawasina and Sumeini Groups as the Hawasina Sediments.
Lithologic units of the Muti Formation deposited in the period Turonian

12
Figure 2.2: A Geologic column of the Oman Mountains and Interior Oman showing
major sedimentary groups (e.g., Haima) and key formations names (e.g., Muti) in the
region. The geologic column includes the major tectonic events that have affected the
southeastern Arabian margin and the surrounding regions. (Modified from Le Metour
et al. 1995).

13

14
Coniacian/Santonian mark a transition from a passive continental margin to the
foreland basin of Muti (Robertson, 1987; Bechennec et al., 1994). The syntectonic unit
of Aruma Group (Fiqa Formation) deposited in the CampanianMaastrichtian period
(Bechennec et al., 1994) records the ophiolite advancement in the foreland region. In
this study, we will consider the mapped Fiqa and Muti Formations separately when
establishing stratigraphic relationships, and consider them jointly as the Aruma Group
when establishing regional lateral continuity (Figures 2.2 and 2.4). Finally, the post
emplacement period was followed by the deposition of the Tertiary Cover, which
spans the Tertiary and the Quaternary period (Figure 2.2). The Tertiary period
includes the Miocene Zagros collision event.
Two prominent domal structures are observed in the northern Oman
Mountains: the Jabal Akhdar (JA), reaching an elevation of 3000 meters, and the Saih
Hatat (SH) (Figure 2.3). The Jabal Akhdar and Saih Hatat provide a window to the
stratigraphy of the PrePermian and the HSG Sequences. The structures of the JA and
SH mountains received extensive investigations concerning timing and mechanism of
deformation, and several alternative models have been proposed. One of the models is
a faultbend fold style of deformation responsible for the formation of Jabal Akhdar
and Saih Hatat Mountains (e.g., Cawood et al., 1990; Hanna, 1990). However, the
proposed geometry and the existence of the faultbend fold are controversial. Mount et
al. (1998) concluded that the Jabal Akhdar Mountain is the result of a compressional
event that initiated in the Oligocene, involving a high angle reverse fault below the
southern limb of the mountain, i.e., faultpropagation fold structure. Recently,
LeMetour et al. (1995) concluded that the Late Permian rifting horst and graben
structures at the continental shelf edge are possibly inherited in the structures of the
Jabal Akhdar and Saih Hatat Mountains. In this study, we find that the structure of
Jabal Akhdar Mountain cannot be described by a single deformation style or a

15
Figure 2.3: Topography map of the study area showing wells and seismic reflection
lines (blue) locations (see Figure 2.1 for location). Shown in this map are the three
structural zones: Coastal Zone, Hamrat Ad Duru Zone, and Interior Zone. The yellow
triangles and circles show seismic station locations and the corresponding approximate
PsMoho impingement location, respectively. Abbreviated text shown on map stands
for the following names, SH: Saih Hatat, JQ: Jabal Qusaybah, JS: Jabal Salakh, JM:
Jabal Madmar, JN: Jabal Nakhl, MFZ: Maradi Fault Zone, N: Natih structure, and F:
Fahud structure. Base map is a shaded relief representation of topography data
available at Cornell University.

16

17
single event, but is rather an integration of multiple and different events that lead to
the presentday structures.
A limited number of geophysical studies investigated the southeastern Arabian
margin and continental crust in the Oman region. The study by Manghnani and
Coleman (1981) estimated an average crustal thickness of ~40 km with a maximum
thickness of ~43 km below the Saih Hatat Mountain based on 2D Bouguer gravity
modeling. Recent work by Ravaut (1997) and Ravaut et al. (1997a) estimated an
average crustal thickness of ~43 km in the southeastern margin with a maximum
crustal thickness of ~47 km beneath the northern Oman Mountains. The study was
primarily based on Bouguer gravity modeling with limited subsurface information and
constraints.
The main objective of this study is to construct a complete crustalscale
transect across the southeastern Arabian margin, the Oman Mountains, and the
foreland region. The transect starts offshore in the coastal plains crossing the Jabal
Akhdar Mountain and ends in the interior of Oman, southeast of Natih and Fahud
structures (see Figure 2.3). The multidisciplinary approach we used in this study
integrates data and results from three different methodologies: seismic reflection and
well data interpretation, earthquake receiver function analysis, and Bouguer gravity
modeling. We used 2D seismic reflection profiles and well data to constrain the upper
8 km of the crust, the receiver function methodology to constrain Moho depth at three
locations, and Bouguer gravity modeling to further constrain the lateral extent of
Moho and infer depth to the metamorphic basement.
Along the transect, we divide the study area into four structural zones from
north to south: (1) the Coastal Zone occupying the area north of Jabal Akhdar
Mountain, on the coastal plains and the offshore region; (2) The Mountain Zone,
which corresponds to the Jabal Akhdar Mountain; (3) the Hamrat Ad Duru Zone that

18
occupies the area directly south of Jabal Akhdar Mountain and shows the most
significant surface deformation, within the Hawasina sediments; and (4) the Interior
Zone which shows minimal surface deformation south of Jabal Qusaybah (see Figure
2.3). In this study, we also group the Interior and Hamrat Ad Duru Zones as the
foreland region, and the Mountain and the Coastal Zones as the hinterland region.
SEISMIC REFLECTION AND WELL ANALYSIS
Data
Data used in seismic interpretation include a total of 152 km 2D reflection
profiles along the transect (Figure 2.3), 100 km of which are digital, and 52 km are
analog paper copies. Seismic reflection data processing involved mainly depth
conversion of the 2D seismic profiles using stack and migration velocities. Stack and
migration velocities were also used to perform line depth conversion on the analog
data. A total of 15 exploratory wells were used to identify and correlate with
stratigraphic units mapped in seismic reflection profiles (Figure 2.3). Well data
included information on formations tops, age, lithology, and biostratigraphic
descriptions prepared by different oil companies for exploration purposes. In this
study, we used 100,000 and 250,000 scale geologic maps of Oman (Bechennec et al.,
1986a, b; Beurrier et al., 1986; Chevrel et al., 1992; Rabu et al., 1986 Wyns et al.,
1992) to construct a complete geologic cross section. These maps provided lithology,
age, and most importantly dip information for the Jabal Akhdar Mountain, where no
seismic or exploratory well information were available.

19
Methodology
Seismic reflection profiles directly along the transect provided the most
complete coverage in the Interior and the Coastal Zones. Seismic correlation and
interpretation provided important stratigraphic and structural relations of the HSG and
the overlying sequences. Correlation of the prePermian Sequence was proceeded with
limited confidence at time depths below 3 sec two way travel time (twt) that
correspond approximately to the top of Huqf Group (Lower Cambrian). The top of
metamorphic basement was almost impossible to identify in all seismic profiles in the
Interior, the Hamrat Ad Duru, and the Coastal Zones. Depth converted time sections
using interval stack and migration velocities showed in some cases a depth difference
of ~200300 meters at the 1 sec (twt) level, and deeper levels (Figure 2.4). We used
well information whenever possible to correct the depth converted seismic sections,
where wells intersected with seismic lines. In cases where wells did not intersect with
a seismic line we made sure that the depth converted seismic section correlates with
nearby wells and to wells across the transect. Along the entire transect only JKH1,
and SD1 well data included sonic velocity information to ~1 km maximum depth
(Figure 2.4). This deficiency restricted us from further comparing depth conversion
velocities with well log sonic velocity data. DA7 and ML1 wells, located 50 km and
80 km, respectively, northwest of the transect, provided sonic velocity information for
the entire HSG Sequence and were important in approximating depth conversion
differences with the migration and stack velocities used in the study area (Figure 2.4).
The sonic velocity of the upper “half” of the HSG Sequence shown in Figure 2.4,
marked by the top of Natih and the base of Jurassic, is 4700 m/s and 5120 m/s for the
DA7, and ML1 wells, respectively. This velocity discrepancy is attributed to lateral
thickness variation of some lithologic units. The lower portion of the HSG Sequence,
20
Figure 2.4: Well log correlation diagram showing sonic velocity in solid black lines
and interval seismic velocities in dashed blue lines. Seismic interval velocities
overlain on SD1 and JKH2 are obtained from lines S50295, and IUL0001 (see
Figure 2.3), respectively. Blue text is the averaged velocity for delineated intervals
(see Figure 2.3 for location).

21
22
marked by base of Jurassic, and top of Haushi, for ML1, and DA7 wells, shows a
small sonic velocity difference, with ~5900 m/s average sonic.
Well Correlation
Well data provided good lateral correlation for the HSG Sequence, the Aruma
Group, the Tertiary Cover, and the Allochthonous Sequence in the foreland region
(Figure 2.5). The Natih Formation (Albian) top delineates the top of HSG Sequence.
The full thickness of the HSG Sequence is ~2.4 km (Figure 2.5) in the Hamrat Ad
Duru Zone, at MH1 well, and in the Interior Zone varied from ~2.6 km at FD1/SD1
well to ~2 km at FH1. The tops of Haushi, Haima, and Huqf Groups that constitute
the prePermian Sequence were penetrated in FD1, and FH1 wells (see Figures 2.5)
in the foreland. In the foreland region the Aruma Group is identified in well data as the
Fiqa Formation only, with no mention of the Muti Formation. Determined age of the
Fiqa Formation in well data is the period TuronianMaastrichtian, which includes the
Muti Formation age mapped at the surface by Chevrel et al. (1992). In some well logs
the Fiqa Formation is identified as the "Shargi shale member" and in others, simply as
claystone lithology (HD1, and MH1). The Fiqa Formation thickness varies
throughout the foreland region. It is thickest (1350 m) in the Hamrat Ad Duru Zone, at
JKH1 (Figure 2.5). The thickness of the Fiqa Formation averages 595 m along the
correlation section of the wells HD1, MH1, and JKH2 shown in Figure 2.5.
However, the thickness of the Fiqa Formation in JKH1 and KH1 is twice (1284 m)
that observed in the latter three wells (Figure 2.5). The considerable variation of Fiqa
thickness in such a short distance could be attributed to either localized structural
thickening of the unit in JKH1 and KH1, possibly by reverse faulting, or possible
misidentification of the Fiqa Formation with the Hawasina Sediments. The Hawasina

23
Figure 2.5: Fence diagram showing correlation of the Hajar Supergroup (HSG)
Sequence in the Interior and Hamrat Ad Duru Zones (see Figure 2.3 for location). Red
lines represent correlation between units within the HSG Sequence, and blue line
marks the top of Aruma Group (Muti and Fiqa Formations). Age and stratigraphic
identification is based on interpretation of oil exploration companies. Defined groups
(GP) and correlated formations are after Le Metour et al. (1995), Pratt and Smewing
(1990), Rabu et al. (1990), and Nolan et al. (1990).

24

25
Sediments directly overlie the Aruma Group, and are found to occur primarily in the
Hamrat Ad Duru Zone (Figure 2.5). The Hawasina Sediments are shown to extend to
NR1 location (see Figure 2.5) with a thickness of 154 m, located at the boundary of
the Hamrat Ad Duru and the Interior Zone (Figure 2.5). The Hawasina Sediments are
made of imbricate stacks of alternating sheets of overthrusted sheets of Guwayza
sandstone and limestone members, and thrusted sheets of the underlying Aruma Group
(Robertson, 1987). For the purpose of sequence correlation we have cumulatively
included the thickness of thrusted sheets of Aruma Group with its in situ thickness
(Figure 2.5). Well data in the Hamrat Ad Duru Zone do not include the Tertiary Cover
Sequence and only SD1 and FH1 in the Interior Zone includes sediments of the
Tertiary Cover Sequence.
Fewer exploration wells have been drilled in the Coastal Plains and the
offshore area. BA1 and BMB1 (see Figure 2.3 for location) are the only well data
available to us in the coastal and offshore areas. BA1 located ~30 km east of the
transect penetrates the basal parts of the Hadhramout Group (ThanetianBartonian) at
a maximum depth of 2448 m. Northeast of BA1 well, BMB1 well reaches a
maximum depth of 4631 m. BMB1 location and lateral structural complexity
prohibited its projection to our transect. It is noteworthy that the BMB1 well
penetrates units of shale, marly sand, and shalely marl deposited in the period
MassrtichtianCampanian equivalent to the Alkhawd Formation. The Alkhawd
Formation equivalent in BMB1 well is 1195 m thick, overlain by only 305 m Eocene
age Hadhramout Group, which is thinner than its equivalent in BA1 well (1200 m).

26
Seismic Interpretation
Interior Zone: Line S50295
The upper 1s (twt) of line S50295 includes the Tertiary Cover Sequence and
the Aruma Group (Fiqa and Muti Formations) overlying the HSG Sequence (Figure
2.6). In this 2D reflection profile, as well as other profiles the top of the Muti
Formation is inferred by downlapping reflectors of the overlying Fiqa Formation. The
downlapping reflectors provide a structural relationship between the interpreted Muti
Formation and the Fiqa Formation, and not a distinctive chronostratigrphy of the Muti
Foramtion. In line S50295 the Fiqa Formation shows a SW reflector progradation,
onlapping the top of Muti Formation. The green reflector at ~200 ms (twt) marks the
termination of prograding reflectors, overlain by conformable strata of the Tertiary
Cover (Figure 2.6). Generally, the Aruma Group is shown to thicken towards the NE,
but the basal Muti Formation is interpreted to thicken towards the SW.
A system of negative flower structures is observed in line S50295 and other 2
D seismic profiles throughout the Interior Zone, and in some parts of Hamrat Ad Duru
Zone. The flower structures in line S50295 exhibit minimal vertical displacement with
subtle reflector offsets at the top of the Natih Formation, and gentle folding of the
overlying layers of the Aruma Group and the Tertiary Cover (Figure 2.6). Below ~2 s
(twt) the flower structures converge to a single steep fault that is shown to offset the
tops of Haushi Group (Late Permian) and Huqf Group (Lower Cambrian) marker
reflectors (Figure 2.6). Fault continuity or surface exposure, especially for the two
flower structures in the NE portion of the profile is obscured within the Fiqa
Formation. Alternatively, the fault tips may be within the Fiqa shales and did not cross
into the Tertiary. However, the base of Tertiary Cover reflector (green), Hadhramout
Group (Paleocene) does show gentle folding near the surface shown in Figure 2.6.

27
Figure 2.6: Interpretation of a migrated 2D seismic reflection profile (see Figure 2.3
for location). Red lines are inferred normal faults with possible continuation shown as
dashed lines. The normal faulting system form negative flower structures that offset
reflectors below 3 seconds. These flower structures are associated with a wrench
faulting system observed in the foreland region. The upper one second of the section
shows reflectors of the Fiqa Formation onlapping southwestward. The orange colored
solid line represents the top of Hajar Supergroup Sequence and MPLF corresponds to
MiocenePliocene Fars Group.

28
29
Interior Zone: Line S50274
In line S50274 (Figure 2.7) the distinctive reflector marker of the top of Natih
Formation and the top of Haushi Group are shown to clearly delineate the HSG
Sequence. The Muti Formation top is interpreted at ~0.9 s (twt) level in the NE end of
line S50274 and at ~1.35 s in the SW. Hanna and Nolan (1989) interpreted the Maradi
Fault Zone (MFZ) as a right lateral strike slip fault reactivated in the Pliocene
Pliestocene times. In line S50274 we interpret the MFZ as basement associated, right
lateral strikeslip fault that includes a reverse component (Figure 2.7). The reverse
component is inferred from 0.350.4 s (~900 m) time difference of the Natih reflector
marker between the NE and SW sides of the MFZ (Figure 2.7). The center of the
structure between 2 to 6 km distance shows internal collapse, possibly by normal
faulting, towards the center of the structure (Figure 2.7). In line S50274, note that the
NE arm of the triangular zone of the MFZ separates surface outcrops of Fiqa
Formation in the NE from the outcropping, southward steeply dipping (72 O ), Umm Er
Radhuma Formation and the Berzman Formation (Tertiary Cover Sequence) (Figure
2.7). It is important to note the relative thickness of the Aruma Group and the Tertiary
Cover in the SW side of the MFZ is ~1.6 s (twt), compared to the NE side of the MFZ
where Fiqa Formation is found have a thickness ~1.2 (twt). In the SW, the thickness of
the Aruma Group and the Tertiary Cover is correlated with the thickening observed at
the NE end of above interpreted line S50295 (1.3 s). Therefore, we interpret the MFZ
to include a reverse faulting component, possibly related to the earlier Late Cretaceous
emplacement process. Later the deformed zone was followed by a transtensional
event, strike slip faulting, in the PliocenePliestocene as dated by Hanna and Nolan
(1989).

30
Figure 2.7: (a) A migrated 2D seismic reflection profile of line S50274 crossing the
Maradi Fault Zone. The fault zone includes two styles of deformation: a strike slip
component (a flower structure) and a reverse component inferred from the depth
difference of the Natih Formation (orange line) reflector across the fault zone (see
Figure 2.3 for location). (b) A line interpretation of S50274 line showing relative
motion within the Maradi Fault Zone and marker reflectors. Abbreviated text MPlbz
and Eur stands for MiocenePliocene Berzman Formation and Eocene Um Er
Radhuma Formation.

31
32
Interior Zone: Line R40984
Directly north of line S50274 (Figure 2.7) lies line R40984 (Figure 2.8) with
about 8 km overlap. However, correlation between the two lines is possible as
reflectors are subhorizontal and no significant deformation exists in the overlap area.
In line R40984 the top of HSG Sequence is distinct in the SW section as far as its
intersection with the subsurface structure of Jabal Qusaybah (JQ). The top of HSG
then becomes less obvious and its interpretation is based on correlation with the NE
side of JQ and surface outcrops. The HSG sequence in this section is overlain by the
Aruma Group only (Figure 2.8). The Jabal Qusaybah anticline is part of the arc shaped
range from Jabal Salakh to Jabal Madmar shown in Figure 2.3. In this section Jabal
Qusaybah is found to separate the southernmost extent of the Hawasina Sediments in
the Hamrat Ad Duru Zone from the Interior Zone (Figure 2.8). The Jabal Qusaybah
structure shows subsurface symmetry indicated by the top of HSG Sequence marker
reflector found at ~1 s (twt), at both NE and SW sides of Jabal Qusabah (Figure 2.8).
We interpret the structure of Jabal Qusaybah to be supported by a salt lens structure
and its possible intrusion in the host rock is at ~2 s (twt) (Figure 2.8b). A set of normal
faults is interpreted to affect the western limb of the Jabal Qusaybah structure, which
could be related to the same event forming the negative flower structures observed in
line S50295 (Figure 2.6). The Fiqa Formation reflectors are observed to onlap the SW
limb of the Jabal Qusaybah structure (Figure 2.8). Reflectors at the base of the Fiqa
Formation are also interpreted to downlap the top of the Muti Formation and prograde
towards the SW (Figure 2.8).
Hamrat Ad Duru Zone: Line R41019
Line R41019 (Figure 2.9) located east of the transect in the Hamrat Ad Duru
Zone has the highest signal to noise ratio and better shows stratigraphic relations

33
Figure 2.8: (a) A migrated 2D seismic reflection profile of line R40984 crossing in
the subsurface northern bounds of Jabal Qusaybah anticline structure (see Figure 2.3).
(b) A line interpretation of the seismic line R40984 showing a normal fault system
southwest of Jabal Qusaybah. Note we also interpret a zone of strikeslip faulting
(flower structure) south of Jabal Qusaybah.

34

35
Figure 2.9: (a) A migrated 2D seismic reflection profile of line R41019 in the Hamrat
Ad Duru Zone, overlain by line interpretation (see Figure 2.3 for location). The line
interpretation shows reflectors of the Fiqa Formation downlapping onto the top of
Muti Formation in a southwesterly direction. Also important stratigraphic markers are
shown.

36

37
within the Aruma Group. In this profile the HSG Sequence top is marked by the Natih
Formation reflector at ~1.2 second (twt) and its base is marked by the top of Haushi
Group (Late Permian) reflector at ~2 seconds. The HSG Sequence shows minor
change in thickness compared to the Interior Zone (Figure 2.9). It is noteworthy that
the top of HSG is identified in seismic profiles throughout the Hamrat Ad Duru Zone,
which establishes its continuity with the surface outcrop at the southern limb of Jabal
Akhdar Mountain. Line R41019 also shows the top of Huqf Group (Lower Cambrian)
and the top of Buah Formation (Vendian/Infracambrian) (Figure 2.9). Downlapping
reflectors of the Fiqa Formation mark the top of Muti Formation, which is shown to be
thinner than what is interpreted in previous profiles in the Interior Zone. The
downlapping reflectors of Fiqa Formation (dark green) show steeper dips, especially
in the NE half of the line (Figure 2.9). The downlapping reflectors indicate
progradation towards the SW direction.
Coastal Zone: Line IUL0205
A gap in seismic and well data coverage across the Jabal Akhdar Mountain
Zone limited the subsurface information within the mountain. To provide other
constraints we used structural information obtained from 1:200,000 scale geological
maps to correlate the prePermian Sequence, the HSG Sequence, and the overlying
units across the Mountain Zone.
In the Coastal Zone we show the interpretation of line IUL0205 (Figure 2.10)
instead of IUL0203. Line IUL0205 is parallel to IUL0203 and shows almost identical
structural features, but with a better resolution. The Coastal Zone (Figure 2.10) is
characterized by a widespread ophiolite blocks overlain in the northern parts by the
Tertiary sediments and Quaternary alluvial deposits (Tertiary Cover Sequence).
Continuity of the top of the HSG Sequence could not be identified in all seismic
38
Figure 2.10: (a) Line interpretation of 2D seismic reflection profile of line IUL0205.
The 2D section delineates the Semail Ophiolites (Nakhl block) and stratigraphic units
overlying it. (b) Seismic stratigraphy showing retrograding sequence complex along
the continental shelf margin. A, B, C, and D are progradational sequences within the
retrograding complex. The retrograding complex is indicative of episodic uplift of the
Northern Oman Mountain during the Oligocene. Abbreviated text SD stands for
Sheeted Dykes (upper unit of the ophiolites).
39

40
reflection coverage in the Coastal Zone. The extensive thickness of the Nakhl
Ophiolite block and the Tertiary Cover most likely masks the HSG Sequence that we
observed in the foreland region. Chaotic to reflection free character is observed within
the 2.510 km thick Nakhl Ophiolite block (Shelton, 1990) shown in Figure 2.10. The
Nakhl Ophiolite block extent continues at the surface towards the southwest until the
northern limb of the Jabal Akhdar structure. The Nakhl Ophiolite block includes both
the mantle and the crustal units of the ophiolite body, separated at the surface by a
thrust boundary dipping towards the north. The crustal section of the Nakhl Ophiolite
block averages a dip of ~20 O N (Nicolas et al., 1996). At the surface, a minor, yet
distinct linear feature of Hadhramout Group outcrops in the northern bounds of the
ophiolite body, striking NWSE, and dipping 15 o north. Line IUL0205, located 8 km
east of the transect (see Figure 2.3) shows the upper boundary of the ophiolite body
dipping at ~25 o N based on the depth converted section of IUL0205 (Figure 2.10).
Northwest of the transect Hawasina sediments are observed to overlie the volcanic
section of the Semail Ophiolites. But, along the Coastal Zone section of the transect
geological maps show no units equivalent to the Hawasina nappes atop the Nakhl
Ophiolite block. Seismic lines IUL0203 and IUL0205 (Figure 2.3) showed no
indication of discordant units above the Nakhl Ophiolite block. Three seismic
stratigraphic sequences are distinguished overlying the Nakhl Ophiolite block shown
in Figure 2.10: (1) the Alkhawd Formation Equivalent and the Hadhramout Group
(Late CampanianEocene), (2) the Asmari Equivalent (Late Oligocene), and (3) the
Lower Fars Equivalent (Early MioceneRecent). On line IUL0205 the Alkhawd
Formation equivalent unconformably overlies the top of the Nakhl Ophiolite block.
The Alkhawd Formation thickens towards the NE and is pinchedout at the surface in
the SW. Cyclic shallow to deep, shelf environment carbonates of the Hadhramout
group overly the Alkhawd Formation equivalent (unpublished report, Amoco Oman

41
Petroleum Company, 1985). The base of the Hadhramout Group reflectors shows an
ambiguous boundary relation with the Alkhawd Formation top, where well penetration
could have resolved this ambiguity. A regional erosional unconformity of early
Oligocene age recorded in well BA1 (unpublished report, Amoco Oman Petroleum
Company, 1985) marks an uplift period that followed the deposition of the
Hadhramout Group. Later in the Middle to Late Oligocene times, seismic reflection
interpretation indicates a period of marine transgression that led to the deposition of
the Asmari Formation, equivalent to shallow outer shelf to marginal marine
environment (unpublished report, Amoco Oman Petroleum Company, 1985). Shown
in the seismic profile, the sea transgression was perturbed by episodic margin uplifts
indicated by seaward migration of facies A, B, C and D (Figure 2.10). Within each
cycle, transgression is indicated by reflectors onlapping the top of the older cycle
(Figure 2.10). The Lower Fars Group equivalent and the Quaternary alluvial deposits
form a wedgeshaped seismic pattern, indicative of a continued margin uplift
throughout the Miocene, possibly until the Quaternary time (Figure 2.10). The seismic
reflection gap between 14 and 16 km distance is an offset of the NE dipping
Hadhramout Group (Figure 2.10). This offset is observed to effect the Hadhramout
Group, and can be traced on seismic lines parallel to IUL0205 extending for ~45 km
across the transect line. This offset could be the result of a magmatic intrusion process
that is reported by AlHarthy et al. (1991) to have occurred during the Tertiary period
on the northern flanks of Jabal Akhdar and Saih Hatat structures. Northeast of the
transect Hawasina sediments are observed to overlie the volcanic section of the Semail
Ophiolites. But, along the Coastal Zone section of the transect geological maps show
no units equivalent to the Hawasina nappes atop the Nakhl Ophiolite block. Seismic
lines IUL0203 and IUL0205 (see Figure 2.3 for location) showed no indication of
discordant units above the Nakhl Ophiolite block.

42
MOHO DEPTH ESTIMATES FROM RECEIVER FUNCTIONS
Methodology
Receiver function is a singlestation teleseismic technique used to study P
wave train to isolate structural effects under a seismic station. Generally, the receiver
function technique utilizes converted seismic phases, such as P to S (Ps) and converted
Pwave multiples reflecting within the crust. For earthquakes at distances of more than
30 O seismic Pwaves are steeply incident beneath a seismic station, and dominate the
vertical component of ground motion, whereas a converted phase, such as Ps, is
largely contained in the horizontal components of ground motion (e.g. Clayton and
Wiggins, 1976; Burdick and Langston, 1977; Cassidy, 1992; Zandt and Ammon,
1995; Sandvol et al., 1998b). The locally generated Ps phase amplitude is sensitive to
the Svelocity structure beneath the station (Cassidy, 1992), and its arrival time
relative to the first Pwave is used to estimate the depth of conversion. Since the
largest velocity change in the lithosphere is along the Moho boundary, receiver
functions are mainly used for Moho depth estimation (e.g. Sandvol et al., 1998a and
b).
A seismic wave propagating from a source to a seismic station includes
information about the source mechanism, the velocity structure surrounding the
source, the velocity structure along the ray path, and the crust and upper mantle
structure below the recording station (Burdick and Langston, 1977). For the recording
of teleseismic earthquakes the converted Ps phase is isolated from the source effects
by deconvolving the vertical component of ground motion with the radial components
of the P waveform to produce the time series know as receiver function (Zandt and
Ammon, 1995). Whereas, the radial component is used to estimate the Moho depth,
the tangential component provides information about any possible dip in the Moho

43
interface. Details of the receiver function technique we used are described in Sandvol
et al. (1998b) and will not be discussed here.
Data and Analysis
We used teleseismic data recorded by two shortperiod (1 Hz), 3component, portable
digital instruments deployed in four different locations along the transect (Figure 2.3).
Each station was operated for at least two months and recorded with a sampling
interval of 50 samples per second (Table 2.1). The stations occupied locations within
cities and villages where power supply was available and accessibility to the site was
not restricted. Recorded teleseismic earthquakes were largely from the western Pacific
(Japan, Philippines, Taiwan, New Guinea, and Indonesian islands) (Figure 2.11).
These events provided the necessary distance required for receiver function analysis.
Most of the recorded earthquakes were associated with subduction zones (Figure
2.11). We used the time difference between the primary Pwave arrival and the
converted P to Swave (Ps) arrival to estimate depth to Moho along the transect
(Figure 2.12). The average time differences between PsMoho and P are 4.7, 5.6, and
4.9 seconds for the stations KTOM, AWBI, and JBRN, respectively (Figure 2.12). We
observed no obvious converted Moho phase, PsMoho, at the fourth station BSYA,
possibly due to site problems. The receiver function of station KTOM showed the
clearest signal that exceeded the noise level. In all stations the tangential components
of the receiver function gave no indication of steeply dipping Moho, as shown by the
low amplitudes in the tangential component at the arrival times of the Ps
phase. During our analysis of the receiver functions, we observed an intracrustal phase
conversion, Pscrust, beneath stations JBRN and BSYA.
In order to estimate the depth to Moho using the receiver functions shown in
Figure 2.12, accurate velocity information beneath each station is required.
44
Table 2.1: Seismic station information: latitude, longitude, and the corresponding
elevation. Included as well are the recording days for each station (used in receiver
function study).
Station Name Latitude
(Degree)
Longitude
(Degree)
Elevation (m) Recording time
(days)
KTOM 23.48 57.69 107 142
AWBI 23.30 57.53 397 37
JBRN 22.91 57.26 552 43
BSYA 22.73 57.24 348 80

45
Figure 2.11: Map centered on Oman showing locations of teleseismic earthquakes
that were used to obtain the final receiver function response for the stations KTOM,
AWBI, JBRN, and BSYA (see Figure 2.3 for location). Recorded events location,
magnitude, and depth information were obtained from the USGS event catalog (Mb:
body wave moment magnitude).

46
47
Figure 2.12: Radial (R) and Tangential (T) component stacks of receiver functions for
the stations KTOM, AWBI, JBRN, and BSYA. P denotes a direct Pwave arrival, Ps
Moho denotes P to Swave converted phase at Moho, R denotes radial, T denotes
tangential, and Psmc denotes intracrustal Pwave phase conversion at a midcrustal
discontinuity. Values given in brackets denote (distance between station and
event/back azimuthal direction from station to event).

48

49
Unfortunately, we do not have average crustal velocity information directly beneath
the stations. However, a number of studies on the eastern Arabian shield provide
estimates of the average Pwave velocity of the crust in the region. Mooney et al.
(1985) reported an average crustal velocity of 6.6 km/s; and Badri (1990) reported a
6.5 km/s average crustal velocity. We used these average velocities as representative
for the southeastern Arabian margin and the foreland region. However, the study area
has significant sediment thickness that could affect the average crustal velocities. To
estimate the effect of the sedimentary section we used available, average sonic
velocity for the total depth of DA7 and ML1 wells. At the latter two wells the
average velocity for ~5 km sedimentary section is between 5.2 km/s to 5.4 km/s
(Figure 2.5). In this region, sedimentary units younger than Late Cretaceous age have
an average velocity of 3 km/s. The thickness of these sediments varies throughout the
region, but along the transect the maximum thickness is only 11.5 km, which will
have ~2% effect on the averaged crustal velocity. Since we do not have absolute
velocity values of the entire crust, and have only average measurements from a nearby
region, we used a range of velocity values with a minimum limit of 6.4 km/s and a
maximum limit of 6.8 km/s for the whole crust to take into account any potential
uncertainty. An additional velocity error is introduced by the converted phase (Ps)
wavelength, where the interface resolution is dependent on the frequency of the
impinging wave. Hence we estimate an additional error of ~1 km. Based on a 6.6 km/s
crustal velocity, and a 0.25 Poisson's ratio value (Zandt and Amon, 1995), the
calculated Moho depth for KTOM station is 41 km (Figures 2.3 and 2.13). Also,
taking into account potential errors, we estimate the Moho depth beneath this station
to be 41±2 km. Due to the incident angle of the incoming seismic wave, the actual
Moho impingement is at 8 km east of KTOM location based on the assumed seismic
velocity above. In this zone (Coastal Zone) the ophiolite blocks are estimated to vary

50
in thickness between 1020 km (Shelton, 1990). Ophiolites in north Oman have an
average compressional velocity of about 6.9 km/s (Christensen and Smewing, 1981).
The ophiolite block accounts for at least 25% of the average continental crust
thickness in the region (45 km). This high velocity could result in a small decrease in
the estimated Moho depth at KTOM station by about 4 km, which is about the total
estimated error. The actual impingement location of the AWBI station falls within the
northern limb of the Jabal Akhdar Mountain, which isolates it from the high velocity
ophiolite effect in this region. AWBI station, located in the northern limb of the Jabal
Akhdar Mountain gave a Moho depth of 49±2 km, which is about 5 km deeper than
the Moho depth beneath KTOM station. The station of JBRN located directly south of
the Jabal Akhdar Mountain (Figure 2.3), produced a Moho depth of 43±2 km (Figure
2.13). The actual Moho impingement of JBRN is located within the Hamrat Ad Duru
Zone, where, the ophiolite body is only ~500 meters thick (based on seismic and
gravity modeling) and would not produce significant errors in the calculated depth
(Figure 2.3).
GRAVITY MODELING
Seismic reflection profiles along with well log data provided thickness
information for the upper 8 km along the transect. However, seismic reflection profiles
alone could not provide the total depth to basement along the transect. Similarly, the
receiver function provided accurate Moho depths beneath three points along the
transect, but would not further predict Moho topography in other parts of the transect.
In addition, the Jabal Akhdar Mountain Zone does not include seismic nor well data
coverage. In order to determine the subsurface structure along the entire transect, we
used gravity modeling constrained by the existing seismic, well logs, and receiver
function results. Gravity modeling is a nonunique methodology. However, our use of
51
Figure 2.13: Velocitydepth trade off curves for stations KTOM, AWBI, and JBRN.
For a 6.6 km/sec average crustal velocity, we estimate a Moho depth of 41±1 km,
49±1km, and 43±1 km for the stations KTOM, AWBI, and JBRN, respectively. The
depth error bar here is estimated for a velocity minimum of 6.4 km/sec and maximum
of 6.8 km/sec velocity error.

52

53
seismic, well logs, and receiver function results made gravity modeling a more useful
tool. We used GMSYS gravity modeling software of the Northwest Geophysical
Associates Incorporation, which uses a 2.5D body model, allowing limits on the
lateral extent of each modeled body.
Data
In this study, we used Bouguer gravity data of Oman compiled by Ravaut and
Warsi (1997). The determined Bouguer gravity anomalies are based on the
international gravity formulae and are corrected for a 2.67 g/cm 3 slab. We used their
available Bouguer point values along a 50 km wide swath at a 5 km interval along the
transect (Figure 2.14). In areas with no digital information, we obtained the average
Bouguer values from their published gravity map of Oman (Ravaut and Warsi, 1997)
with the same sampling interval and swath width. We also extracted surface elevation
data at a 5 km sampling interval (Figure 2.14). We modeled the average gravity value
of the 50 km swath shown in Figure 2.14. Density information of modeled
stratigraphic units was primarily obtained from well logs of corrected bulk density
values and/or transient sonic velocity. We used Gardner’s equation (Gardner et al.,
1974) to convert transient sonic velocity values to density values. JKH2, FH1, and
SD1 wells provided density values for the Hawasina Sediments (2.45 g/cm 3 ) and the
Aruma Group (2.28 g/cm 3 ). Density value for the HSG Sequence (2.6 g/cm 3 ) was
obtained from ML1 and DA7 wells located northwest of the transect (see Figure 3).
Density values of the ophiolite (3.07 g/cm 3 ) and the upper mantle (3.3 g/cm 3 ) were
obtained from previous studies conducted in the same region (Ravaut, 1997a). In this
study, density value of the prePermian Sequence is set to 2.5 g/cm 3 as an average
value, which is smaller than the density value of the overlying HSG Sequence (2.6
g/cm 3 ). We approximated the prePermian Sequence density to ~2.52.55 g/cm 3 that

54
Figure 2.14: (a) Graph showing maximum, minimum, and average Bouguer gravity
anomalies in a 50 km swath along the transect (see Figure 2.3 for location). (b) Graph
showing maximum, average, and minimum elevation profiles along the transect.
Gravity and elevation values are calculated for a 5 km sampling interval along the
complete transect.

55

56
accommodates for the Ara salt (2.2 g/cm 3 ) which is known to extend throughout the
study area, with enormous thickness variation between 02000 meters (Mattes and
Morris, 1990; Mount et al., 1998). The estimated prePermian Sequence density 2.5
2.55 g/cm 3 was found to be the most suitable value for the prePermian Sequence that
resulted in a good model fit with the observed gravity values. We have estimated a
comparable density value for the middle and lower crust of 2.7 g/cm 3 . Known
constraints in the Coastal Zone include the upper boundary of the ophiolite block dip
angle, 25 O N, and density of the ophiolite and the overlying sequences. BA1 well
provided density information for the Hadhramout group (2.45 g/cm 3 ) and for the
EoceneRecent sediments (2.2 g/cm 3 ). In the Coastal Zone, we approximated the
density of the Alkhawd Formation equivalent as that of the Hadhramout group. The
edge of the continental margin is found at ~40 km farther northeast of the end of the
transect. It drops off to ~3000 m depths into the Oman remnant basin. Therefore, we
allowed termination of the Shelf and the prePermian Sequences towards the NE end
of the model. Also, we allowed the basement depth to shallow at the northern end of
the model.
Moho depth obtained for the stations KTOM, AWBI, and JBRN were used to
constrain the Moho structure across the Jabal Akhdar Mountain. In all models, we
allowed the Moho depth south of Jabal Akhdar Mountain to vary about the determined
Moho depth at JBRN station (43 km). In the northeastern part we varied the Moho
depth below what is obtained from KTOM station to accommodate the crustal
thinning towards the oceanic areas of the Gulf of Oman. In addition, we allowed the
Moho depth to vary beneath the Jabal Akhdar Mountain to accommodate for any
possible crustal thickening beneath the Mountain.
Observed Bouguer gravity values along the transect vary from –80 mGal
beneath the Jabal Akhdar Mountain to +100 mGal about 40 km NE of the mountain

57
(Figure 2.14). In the foreland region, in the southwest portions of the transect,
Bouguer values are uniform at about 40 mGal with ~20 mGal variation. As we
approach the Jabal Akhdar Mountain the Bouguer values decrease and reach their
minimum in the Jabal Akhdar Mountain. From this point northward, the Bouguer
gravity values increase sharply towards the continental margin. A shorter wavelength
positive anomaly is superimposed on the regional anomaly, just NE of the Jabal
Akhdar Mountain. This anomaly corresponds to the Nakhl ophiolite block. Farther
north, the anomaly increases to a maximum +60 mGal reflecting crustal thinning and
proximity to the oceanic crust of the Gulf of Oman. A superimposed negative anomaly
coupled with the ophiolite positive anomaly correspond to a small intramargin basin.
The ophiolite emplacement resulted in different grades of metamorphism in the
Northern Oman Mountains that varied from high temperature, low pressure,
amphibolite and green schist facies; at the base of the of ophiolite, to high pressure,
low temperature, eclogite and blueschist facies (ElShazly and Coleman, 1990). The
Saih Hatat structure is described to have been subject to high grades of metamorphism
forming eclogite facies in its northern bound at the coastline area (ElShazly and
Coleman, 1990). However, the Akhdar structure is categorized to have received only
early phases of welldeveloped cleavage deformation. (Le Metour et al., 1994). To
accommodate this low metamorphic gradient we included a density increase towards
the NE, across the Jabal Akhdar Mountain to the Coastal Zone. The low gradient
density increase affects lithologic units overlain by the Hawasina Sediments and the
Semail Ophiolites.

58
Gravity Analysis
ModelA
In general, basement topography in the foreland region is found to mimic the
observed gravity response (Figure 2.15, Model A). Gravity modeling shows a relative
basement high at ~7 km depth beneath the Jabal Qusaybah structure. The relative
anomaly beneath Jabal Qusaybah is part of a basement high, averaging ~ 9 km deep,
that extends for ~60 km from the MFZ to the center of Hamrat Ad Duru Zone.
Basement depth south of the MFZ and the northern end of the Hamrat Ad Duru Zone
averages at ~13 km. A small anomaly of less than 10 mGals corresponds to the
ophiolite body directly south of the Jabal Akhdar Mountain. Basement depth in the
core of Jabal Akhdar Mountain is shown at ~9 km and implies a thickened pre
Permian Sequence below the core of the Jabal Akhdar Mountain (Figure 2.15). The
considerably thickened prePermian Sequences at the core of Jabal Akhdar Mountain
corresponds to a short wavelength gravity response, that could not be compensated by
depth changes at the mountain root. The northern limb of the Jabal Akhdar Mountain,
however, shows an extensively thinned prePermian Sequence, below the
Allochthonous Sequence of the Semail Ophiolites and the Hawasina Sediment. North
of the Jabal Akhdar Mountain a positive and a negative anomaly couple, overrides the
regional anomaly and correspond to the north dipping ophiolite body and the intra
margin Tertiary basin, respectively. The determined average thickness of the ophiolite
block, north of Jabal Akhdar Mountain is ~5 km, and extends laterally for about 95 km
north. Below the ophiolite body, the Hawasina Sediments average in thickness to ~1
km along the Coastal Zone, but thicken extensively to ~4 km below the surface
outcrop of the ophiolite block, directly north of the Jabal Akhdar Mountain (Figure
2.15). Based on ModelA, the modeled Hawasina Sediments are substantial in
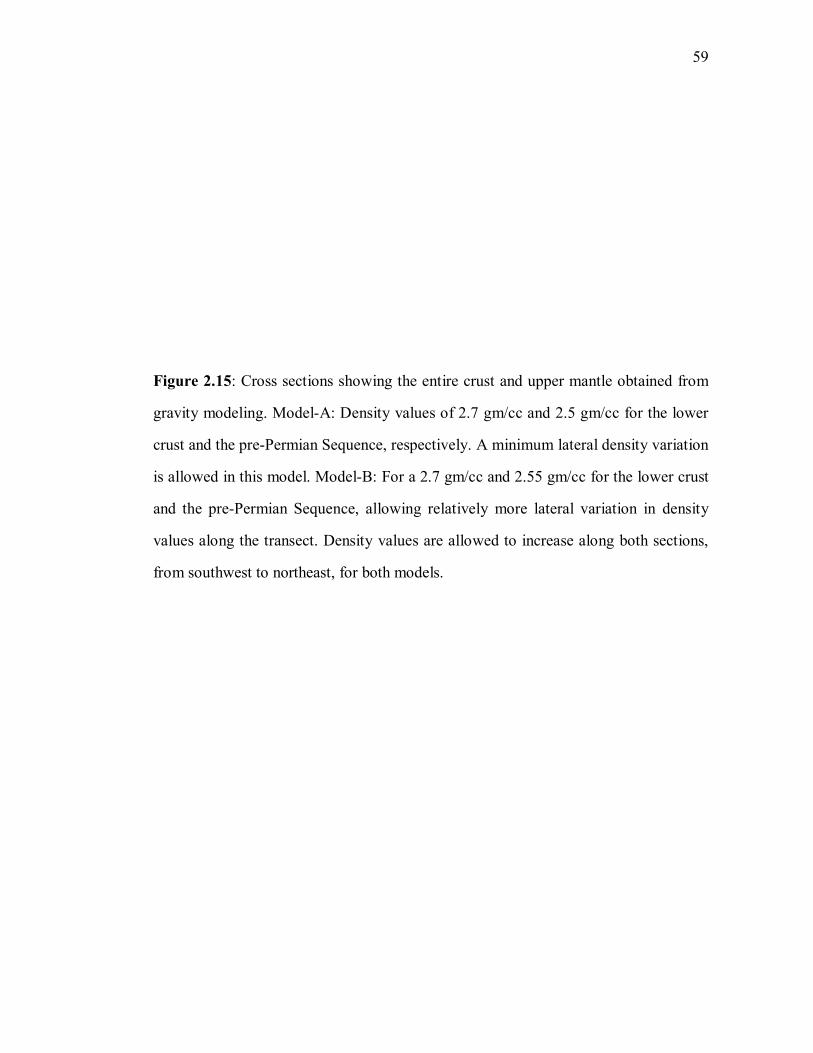
59
Figure 2.15: Cross sections showing the entire crust and upper mantle obtained from
gravity modeling. ModelA: Density values of 2.7 gm/cc and 2.5 gm/cc for the lower
crust and the prePermian Sequence, respectively. A minimum lateral density variation
is allowed in this model. ModelB: For a 2.7 gm/cc and 2.55 gm/cc for the lower crust
and the prePermian Sequence, allowing relatively more lateral variation in density
values along the transect. Density values are allowed to increase along both sections,
from southwest to northeast, for both models.
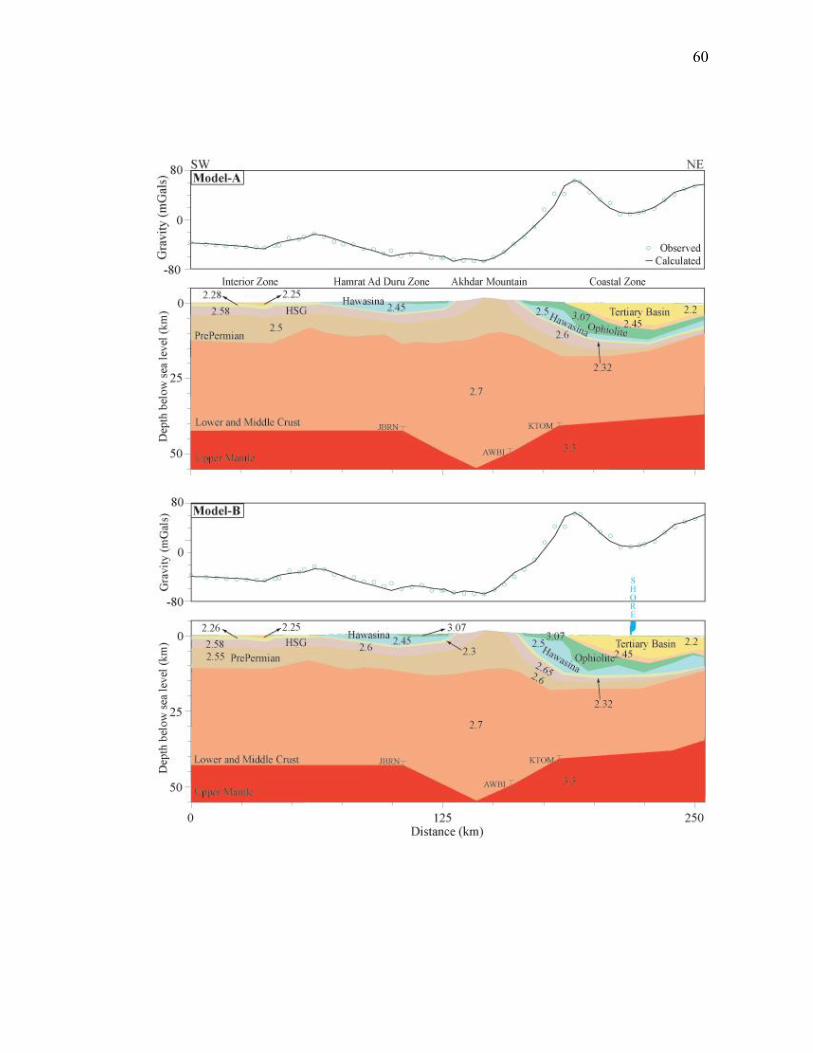
60

61
thickness and are comparable to the Hawasina Sediments south of the Jabal Akhdar
Mountain. Note the Hawasina Sediments south of Jabal Akhdar are fixed, since they
are constrained by seismic and well data. Geometry of the ophiolite body persisted in
all models in which it required a leading and a trailing wedge in various density
models, with variable thicknesses between 5 to 8 km. Depth to basement in the
Coastal Zone reaches its maximum at ~17 km below the surface outcrop of the
ophiolite body, and shallows towards the NE, imposing thinning of the HSG and pre
Permian Sequences (Figure 2.15).
ModelB
In this model we included a semigradual density increase of 0.05 g/cm 3 , from
SW to NE, for the PrePermian and HSG Sequences, the Hawasina Sediments, and the
Aruma Group (Figure 2.15). The depth to basement shallows by about 2.5 km in the
Interior and Hamrat Ad Duru Zones, with a 2.55 g/cm 3 prePermian Sequence density.
Since the density contrast between the prePermian Sequence and the lower crust is
reduced, the thickness of the prePermian Sequence was therefore reduced.
Consequently, only large topographic differences, such as Jabal Qusaybah anomaly
were clearly resolved in the foreland region. North of the Jabal Akhdar and the Coastal
Zone this density change results in a dip increase of the northern limb of the mountain
(Figure 2.15). This consequently increased the thickness of the Hawasina Sediments at
the expense of the ophiolite body. Thicknessdensity tradeoff between the Hawasina
Sediments and the ophiolite bodies resulted in an irregular ophiolite body, which we
did not consider the favoured ophiolite model. To further constrain the model in the
Coastal Zone, we require information on the extent of the HSG and prePermian
Sequences beneath the ophiolite body, or the knowledge of the ophiolite body
thickness in addition to the density of the lower and middle crust.

62
ModelA, is our favored model, but ModelB provides an alternative and an
error estimate for the preferred model (Figure 2.15).
DISCUSSION
Compilation of multidisciplinary results based on seismic reflection, well data,
receiver function analysis, and gravity modeling combined with surface geology
provided reliable constraints to construct a complete crustal transect across the
foreland region, the Mountain and the Coastal Zones (Figure 2.16). Furthermore, data
analysis and interpretation provided structural and stratigraphic relations that added to
the understanding of processes that accompanied the Semail Ophiolite emplacement
and later developments along the margin and the foreland region.
The Foreland Region
Robertson (1987), Boote et al. (1990), and Bechennec et al. (1994), amongst
other researchers, collectively summarized the nature of the Semail Ophiolite
emplacement along the Arabian margin and the foreland regions, and proposed three
distinct evolutionary processes: doming, complete margin subsidence, and final
foreland subsidence during and after the ophiolite advancement onto the margin and
inland. Based on the interpretation of seismic lines S50295 (Figure 2.6), R41019
(Figure 2.9) and other seismic lines in the foreland region (not shown on our map), our
seismic stratigraphy interpretation conforms well to their three observed processes.
The first process, doming in the Turonian period is marked by an erosion
unconformity off the top of Natih Formation (Albian) throughout the foreland
(Bechennec et al., 1994). We observe relatively more erosion of the top of Natih
Formation that has affected the Hamrat Ad Duru Zone and the Fahud area (FD1 well)
(Figure 2.5). The second stage of emplacement, where complete margin subsidence is
63
marked by the development of the Muti basin throughout the foreland region and the
Mountain Zone (Robertson, 1987; Boote et al., 1990; Bechennec et al., 1994). As
evident from seismic stratigraphy, the Muti Formation (TuronianSantonian) overlies
the Natih Formation throughout the foreland region, indicative of regional subsidence
(Figures 2.7, 2.8, and 2.9). The third stage of the emplacement is where the
advancement of the Allochthonous Sequence on the margin and inland is marked by
the development of the extensive Fiqa basin (CampanianMaastrichtian) (Bechennec
et al., 1994). The Fiqa Formation records the stratigraphic interaction as the
allochthonous body progresses towards the foreland (Figures 2.6 and 2.9). Southerly
prograding reflectors of the Fiqa Formation are interpreted to downlap the top of the
Muti Formation which is indicative of a localized topographic high moving
southwards (Figures 2.6 and 2.9). This localized high could be attributed to the Semail
Ophiolite emplacement peripheral bulge, migrating southwards. The southerly
prograding reflectors are shown to onlap the southwestern edge of the Fahud area
where, possibly, the advancing peripheral bulge ceased in the Interior Zone of Oman
(Figure 2.6). Our observations conform to Robertson (1987) and conflicts with
Warbuton et al. (1990) who advocate a nonemigrating peripheral bulge. Note that as
the peripheral bulge advanced, the region was submerged in deep open marine, outer
shelf to upper bathyal environment accumulating the Fiqa Formation (Robertson,
1987; Bechennec et al., 1994).
Structural development of Jabal Qusaybah is concluded to have occurred
during the Santonian. This is in agreement with Hanna and Smewing (1996) who
showed that the Jabal Salakh structural growth began in the Late Cretaceous period
during the Aruma Group deposition. Shown in Figure 8, the Muti Formation and HSG
Sequence are both folded, indicating a deformation time that postdates the deposition
of Muti Formation. Also, reflectors of the Fiqa Formation are shown to onlap the

64
Figure 2.16: The complete transect of the crust and parts of the upper mantle from the
interior of Oman in the southwest, across the Jabal Akhdar Mountain and in the
hinterland in the northeast. Also, shown observed and model Bouguer gravity values,
with the corresponding elevation along the transect. The transect depicts important
stratigraphic sequences and formations, and structural relations. Red lines indicate
faults and black arrows indicate relative motion along the fault. 2D seismic profiles
location along the transect are indicated by dashed blue and green rectangles. The
Semail Ophiolites frontal thrust is delineated at the sole of the Hawasina Sediments,
and a bold red line indicates the sole of the igneous ophiolite body. Dip information of
the Jabal Akhdar Mountain are shown along the surface of the structure. The transect
also shows locations of deployed seismic stations (yellow triangles) and the
corresponding, projected, impinging locations are shown as error bars.
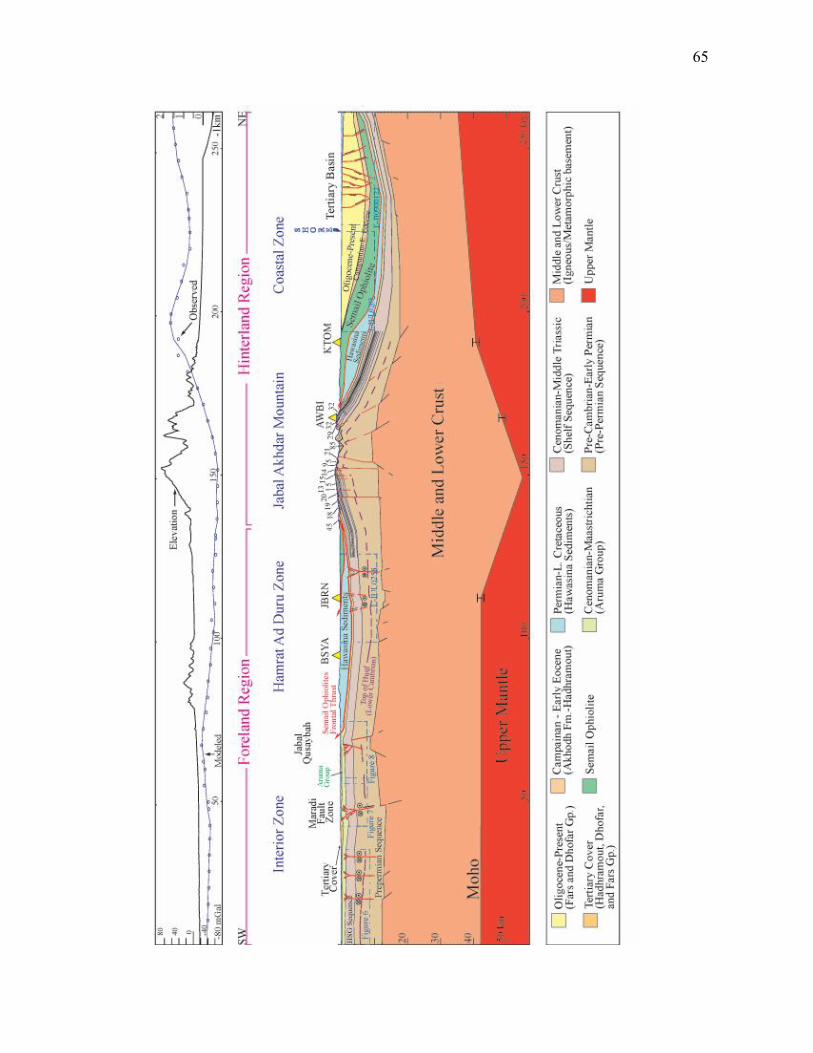
65
66
southern side of Jabal Qusaybah anticline (Figure 2.8). Reflectors below the HSG
Sequence, at ~2.0 s (twt) show no conclusive evidence of neither folding nor faulting,
which infer a salt supported structure.
Farther east, the Maradi Fault Zone is observed to act as a barrier, where NR1,
and HR1 wells, located north of the MFZ include no deposits of the Early Eocene
Pliocene Hadhramout and the Fars Group (Tertiary cover) (see Figures 2.5 and 2.17).
Also, in the NE side of the MFZ, the top of HSG Sequence is elevated at ~900 meters
relative to the SW side of the fault. The absence of the Tertiary cover NE of MFZ
could be the result of two possibilities: a differential uplift or diffrential subsidence.
Where in the former the Tertiary cover was removed by erosion in the higher NE and
in the latter case the Tertiary cover was not deposited at all in the NE side of MFZ.
Based on our observation, we interpret the MFZ to be a basement associated fault with
two styles of deformation: a reverse faulting component as a preMFZ (possibly
earlier in the late Cretaceous) and a strikeslip fault component dated as a Plio
Pliestocene event by Hanna and Nolan (1989) (see Figures 2.7 and 2.17).
Consistent observations, in different seismic profiles (some of which not
included in Figure 2.3), show flower structures that form a NWSE wrench fault
system affecting the entire HSG Sequence, the Muti Formation, and the Aruma Group
in the Interior Zone and the Hamrat Ad Duru Zones (Figures 2.6, 2.7, and 2.8). In
most seismic profiles the flower structure offsets are traced to continue to the
overlying Muti Formation and Fiqa Formation but in some cases faulting within the
Fiqa Formation becomes ambiguous as shown in Figure 2.6. In this study, we interpret
the Fahud and Natih structures to have developed as a double plunging pericline
structures possibly associated with the strike slip movement along the already
weakened zone of the preMFZ. The MFZ is parallel to the system of NWSE wrench
faults (Figure 2.17). The structures of Natih and Fahud strikes are at ~20 o with respect

67
Figure 2.17: A geology map extracted from 1:250,000 scale Oman Geological Maps,
(1992) of part of the foreland region (see Figure 2.3 for location). The map view
depicts the structural relations between the Maradi Fault Zone (MFZ) and the
structures of Natih and Fahud. Abbreviated text shown in the legend stands for the
following: MPlbz: MiocenePliocene Berzman Formation, Mda: Middle Miocene
Dam Formation, Edm: Middle Eocene Dammam Formation, Ers: Early Eocene Rus
Formatio, Eur: Early Eocene Um Er Radhuma Formation, LKfq: Late Cretaceous Fiqa
Formation, Ant: Albian Natih Formation, and HW: Hawasina Sediments. The map
shows locations of selected, depth converted section, with no vertical exaggeration.
The depth sections are used to infer subsurface structural relation between MZF,
Fahud and Natih structures with NWNE wrench faulting system, observed as flower
structures in each section. Within each depth section, red lines denote faults, with
black arrows showing the relative motion. Blue lines delineate random reflector to
enhance the structural attributes shown in each section. SectionA and SectionB are
interpreted as positive flower structures while SectionC as a negative flower
structure.

68

69
to the NWSE fault system (Figure 2.17). This wrench fault system is observed in
seismic lines throughout the foreland region which implies a regional event, possibly
transcurrent. In Figure 2.17, SectionB intersects the southeastern end of Natih
structure that shows a positive flower structure. As seen in the geology map of Figure
2.17 the deformation of the Natih and Fahud structures includes the MiocenePliocene
Berzman Formation that overlies the Hadhramout group. The timing of this event is in
agreement with earlier work by Hanna and Nolan (1989). These authors date the
Maradi Fault Zone as a reactivated PlioPliestocene, right lateral strikeslip fault.
Therefore, we suggest that the Tertiary deformation in the foreland region is largely
transcurrent with no conclusive evidence of a major compressioanl event during
Tertiary times (Figure 2.17).
The Hinterland Region
The present day Jabal Akhdar Mountain and the northern Oman Mountains
pose three important questions: (1) What is the support mechanism of the presentday
topography? (2) What type of structural style is involved in the architectural formation
of Jabal Akhdar Mountain, and its timing? And (3) What is the timing of uplift of the
Northern Oman Mountain?
In this study we conclusively answer (1) and propose a solution for (3). We are
not able to provide specific solutions for question (2) for it requires more detailed
structural analysis and deeper seismic imaging, but we do propose a mechanism for
the formation of the Jabal Akhdar Mountain.
Answering question (1), Moho depths determined from data produced by the
seismic stations JBRN, AWBI, and KTOM delineate the root beneath the Jabal
Akhdar Mountain. The root beneath the Jabal Akhdar Mountain is confirmed by
gravity modeling. Station AWBI, which shows the deepest Moho (4851 km) of the

70
three locations, does not correspond with the highest elevation in the mountain. As
shown in Figure 2.16, the highest topography coincides with the lowest gravity point,
located 10 km southwest of AWBI station. Assuming an isostatically compensated
Airy model, the highest elevation, 3000 m, would correspond to about 55 km Moho
depth (Figure 2.16). Manghnani and Coleman (1981) and Ravaut et al. (1997) gravity
modeling results gave a ~43 km and ~47 km maximum depth below the structure of
the Jabal Akhdar Mountain, respectively, which is shallower than Moho depth found
beneath AWBI station. Both Manghnani and Coleman (1981) and Ravaut et al. (1997)
used a density of 2.9 g/cm 3 average for the continental crust, which we find too high.
Our gravity modeling differ with both authors as well, where our initial model
includes more constrains on the upper 8 km of the sedimentary section and includes
determined Moho depths across the Jabal Akhdar Mountain, using new seismological
observations.
We associate the initiation of the thickening of the crust below the Jabal
Akhdar Mountain to the Late Cretaceous Semail Ophiolite emplacement where this
deformational event had a large southward compressional component.
Addressing question (2): two styles of deformation have been proposed to form
the presentday Jabal Akhdar Mountain by a fault bend fold (Michard et al., 1984;
Cawood et al., 1990; Hanna, 1990) or by a propagation fault fold (Mount et al., 1998).
We interpret the presentday structure of Jabal Akhdar Mountain as the result of
deformation concentrated along zones of weakness, perhaps shear zones, related to the
Permian rifting event. We infer the initiation of the development of the Jabal Akhdar
structure to be contemporaneous with the third stage of the Semail Ophiolite
emplacement, where the allochthonous load has finally collided with the margin edge.
Nolan et al. (1990) concluded that the Alkhawd Formation mapped around the flanks
of Jabal Nakhl and Saih Hatat includes clast composition that records the unroofing

71
and erosion of the Saih Hatat and Jabal Akhdar culminations. The proposed timing is
also deduced collectively from different observations described below.
Gravity modeling showed that the basement top in the core of the Jabal Akhdar
structure is at ~9 km depth, coinciding with the extensively deformed prePermian
Sequence, showing stratal dips of 85 o (Figure 2.16). The exposed HSG Sequence
flanking the prePermian Sequence does not show extreme deformation, but shows
gently dipping strata in the southern limb, and steeper dipping strata in the northern
limb of Jabal Akhdar Mountain. The southern limb strata average dip is ~15 o S, and
the northern limb strata average dip is ~28 o N. Also, gravity modeling shows
considerable thinning of the prePermian Sequence, in the northern limb of the Jabal
Akhdar Mountain. This sudden decrease in the prePermian Sequence thickness at the
northern limb could be associated with Permian rifting event forming the southeastern
edge of the Arabian Plate margin. Also shown in Figure 2.16 is that a considerable
load of the Semail Ophiolite and the Hawasina Sediments occur north of the mountain
which possibly contribute to the steepness of the northern limb of the mountain. Note
the density thickness tradeoff between the ophiolite and the Hawasian sediments in
the coastal zone.
Addressing question (3): Based on the observation of Figures 2.9 and 2.10 we
infer a major uplift episode starting in the Late Oligocene time. This conclusion is
confirmed by a number of observations. In line IUL0205 (Figure 10) north of the Jabal
Akhdar Mountain, interpretation of seismic stratigraphic units show 25 o 30 o N dipping
strata of the Alkhawd Formation and the Hadhramout Group (Tertiary Cover). This
observation provides a timing of the Northern Oman Mountain episodic uplift in the
Late Oligocene period. This timing is in agreement with fission track dating of the
uplift of the structure of the Jabal Akhdar Mountain by Mount et al. (1998). Moreover,
the Hamrat Ad Duru Zone seismic data show (Figure 2.9) southerly dipping reflectors

72
of the Fiqa Formation (forming downlaps) indicative of continued uplift in the
mountains, hence tipping the reflectors towards the south. This observation indicates
that the mountain uplift has continued after the Maastrichtian, i.e., after the deposition
of Fiqa Formation. This uplift episode is shown to affect the Interior Zone but with
lesser magnitude than that of the Hamrat Ad Duru and the Mountain Zones. In
summary, the uplift and unroofing of the Oman Mountain possibly started within the
Late Cretaceous period indicated by the intermontain deposits of Alkhawd Formation
and its equivalent in the Coastal Zone (Figure 2.10). The major uplift initiated in the
Late Oligocene time is probably related to nearby plate boundary processes including
the Zagros collision zone and the Makran subduction system. The end of the
Cretaceous and Tertiary boundary is an important time period where it should be
considered. Due to the lack of information about this particular boundary especially
well data, we were unable to cover it adequately in our discussion both in the foreland
region and the Coastal Zone. However, it is important to determine the unconformity
continuity or its absence at the subsurface in the Coastal Zone.
Finally, the offshore area shows the development of an extensive sedimentary
basin that postdates the Oligocene, which could be the extension of the Sohar basin
documented by Ravaut et al. (1998). The basin extends northwards for approximately
60 km at the end of the crustal model of Figure 2.16. The basin is deepest along the
shoreline, reaching a depth of about 7 km below sea level. The northernmost seismic
section in the offshore area is primarily characterized by gravity faults (Figure 2.16).
CONCLUSIONS
Four main results are presented in this study. (1) The southeastern Arabian
continental crust averages about ~40 km thickness in the foreland region, ~50 km
beneath the Jabal Akhdar Mountain, and ~35 km in the Coastal Zone. (2) Based on

73
gravity modeling, the prePermian Sequence in the core of the Jabal Akhdar Mountain
is estimated to be ~9 km thick. This observation conforms well with most structural
models of the Jabal Akhdar Mountain that require thickening, either by duplexing,
blind thrust faulting, or decollement below the core and the southern limb of the Jabal
Akhdar Mountain. (3) Based on surface, subsurface and gravity modeling, the Nakhl
Ophiolite block is found to extend beyond the shoreline for approximately 80
kilometers from its most southern surface outcrop. The Nakhl block averages in
thickness ~5 km, whereas the ophiolite body south of the Jabal Akhdar Mountain is
found to have a maximum thickness of 1 km. The underlying unit of the Hawasina
sediments is found to average in thickness between 23 km in the Hamrat Ad Duru
Zone and 2 km in the Coastal Zone. (4) Basementrelated wrench faulting system is
mapped in the foreland region striking NWSE, and predominantly transtensional.
These wrench faults are found to offset preexisting older structures such as the Salakh
Madmar range. Furthermore, we conclude that the Tertiary period does not show any
major compressional events within the foreland region.

74
ACKNOWLEDGMENTS
The authors would like to thank the Oman Ministry of Oil and Gas in allowing
the access to seismic reflection and well data in the study area. In particular, we thank
the Department of Minerals for their support throughout the study and also in
permitting us to use the gravity data. We also thank the Petroleum Development
Oman Company for providing and assistance in obtaining the seismic reflection and
well data. The receiver function data were made possible by the generosity of the
Department of Earth Sciences, Sultan Qaboos University. The recorded data are the
result of the dedicated staff of the Earthquake Monitoring Project under the leadership
of Waris Warsi. Special thanks to Samir Hanna, at the Department of Earth Sciences,
Sultan Qaboos University, for his valuable comments and suggestions on the
manuscript. We also thank our colleagues at Cornell University: Graham Brew,
Francisco Gomez, Alexander Calvert, Marisa Vallve, Carrie Brindisi, Christine
Sandvol, David Steer, and Khaled AlDamegh for their assistance and constructive
comments throughout this study.

75
REFERENCES AlHarthy, M.S., R.G. Coleman, M.W. HughesClarke, and S.S. Hanna 1991. Tertiary
basaltic intrusions in the Central Oman Mountains. In TJ. Peters, A. Nicolas and R.G. Coleman (Eds), Ophiolite Genesis and Evolution of the Oceanic Lithosphere, Ministry of Petroleum and Minerals, Sultanate of Oman, p. 675682.
Amoco Oman Petroleum Company, unpublished report, A.O.P., 1985. Barka1 well.
Badri, M. 1990. Crustal structure of central Saudi Arabia determined from seismic refraction profiles. Tectonophysics, v. 185, no. 34, p. 357374.
Bechennec, F., J. Le Metour, J.P. Platel and J. Roger 1994. Doming and down warping of the Arabian Platform in Oman in relation to Eoalpine tectonics. In M.I. AlHusseini (Eds.), Middle East Petroleum Geosciences, GEO'94, Gulf PetroLink, 2, p. 167178.
Bechennec, F., M Beurrier, G. Hutin and D. Rabu, 1986a. Geological map of Barka. Ministry of Petroleum and Minerals, Sultanate of Oman.
Bechennec, F., M. Beurrier, G. Hutin and D. Rabu, 1986b. Geological map of Bahla. Ministry of Petroleum and Minerals, Sultanate of Oman.
Beurrier, M., F. Bechennec, G. Hutin and D. Rabu, 1986. Geological map of Rustaq. Ministry of Petroleum and Minerals, Sultanate of Oman.
Boote, D.R.D., D. Mou and R.I. Waite 1990. Structural evolution of the Suneinah foreland, central Oman Mountains. In A.H.F. Robertson, M.P. Searle and A.C. Rice (Eds.), The Geology and Tectonics of Oman Mountains, Geological Society Special Publication, 49, p. 397418.
Boudier, F., J.L. Bouchez, A. Nicolas, M. Cannat, G. Ceuleneer, M. Misseri and R. Montigny 1985. Kinematic of oceanic thrusting in the Oman Ophiolite: Model for plate convergence. Earth and Planetary Sciences Letters, v. 75, p. 215222.
Boudier, F. and R.G. Coleman 1981. Cross section through the peridotite in the Semail Ophiolite, Southeastern Oman Mountains. Journal of Geophysical Research, v. 86, no. B4, p. 25732592.
Burdick, L.J. and A.C. Langston 1977. Modeling crustal structure through the use of converted phases in teleseismic bodywave forms. Bulletin of the Seimological Society of America, v. 67, no. 3, p. 677691.
Cassidy, J.F. 1992. Numerical experiments in broadband receiver function analysis. Bulletin of the Seimological Society of America, v. 82, no. 3, p. 14531474.

76
Cawood, P.A., F.K. Green and T.J. Calon 1990. Origin of culmination within the Southeast Oman Mountains at Jabal Majhool and Ibra Dome. In A.H.F. Robertson, M.P. Searle and C. Rice (Eds.), The Geology and Tectonics of the Oman Region, Geological Society Sepecial Publication, 49, p. 429445.
Chevrel, S., F. Bechennec, J. Le Metour, J. Roger and R. Wyns 1992. Geological map of Jubuayl Fahud. Ministry of Petroleum and Minerals, Sultanate of Oman.
Christensen, N.I. and J.D. Smewing 1981. Geology and seismic structure of the Northern section of the Oman Ophiolite. Journal of Geophysical Research, v. 86, no. B4, p. 25452555.
Clayton, R.W. and R.A. Wiggins 1976. Source shape estimation and deconvolution of teleseismic body waves. The Geophysical Journal of the Royal Astronomical Society, v. 47, p. 151177.
Coleman, R.G. 1981. Tectonic setting for Ophiolite obduction in Oman. Journal of Geophysical Research, v. 86, no. B4, p. 24972508.
ElShazly, A.K. and R.G. Coleman 1990. Metamorphism in the Oman Mountains in relation to the Semail Ophiolite emplacement. In A.H.F. Robertson, M.P. Searle and A.C. Ries (Eds.), Geology and Tectonics of the Oman Region, Geological Society Special Publication, 49, p. 473493.
Gardner, G.H., L.W. Gardner and A.R. Gregory 1974. Formation velocity and density the diagnostic basic for stratigraphic traps. Geophysics, v. 39, p. 770780.
Glennie, K.W., M.G.A. Boeuf, M.W.H. Clarke, M. MoodyStuart, W.F.H. Pilaar and B.M. Reinhardt 1973. Late Cretaceous nappes in Oman Mountains and their geologic evolution. Bulletin of the American Association of Petroleum Geologists, v. 57, p. 526.
Hanna, S.S. 1990. The Alpine deformation of the central Oman Mountains. In A.H.F. Robertson, M.P. Searle and A.C. Ries (Eds.), The Geology and Tectonics of the Oman Region, Geological Society Special Publication, 49, p. 341359.
Hanna, S.S. and S.C. Nolan 1989. The Maradi fault zone: evidence of Late Neogene tectonics in the Oman mountains. Journal of the Geological Society, London, v. 146, p. 867871.
Hanna, S.S. and J.D. Smewing 1996. The stratigraphy and structure of the Madamar SalakhQusaybah range and NatihFahud area in the Oman Mountains. Journal of Science and Technology, Sultan Qaboos University, Oman, v. 1, p. 119.

77
Hopson, C.A., R.G. Coleman, R.T. Gregory, J.S. Pallister and E.H. Baily 1981. Geologic section through the Semail Ophiolite and associated rocks along the MuscatIbra transect, Southeastern Oman Mountains. Journal of Geophysical Research, v. 86, p. 25272544.
Le Metour, J., F. Bechennec and J. Roger 1994. Late Permian birth of the NeoTethys and development of its southern continental margin in Oman. Gulf PetroLink, Bahrain, p. 643654.
Le Metour, J., J.C. Michel, F. Bechennec, J.P. Platel and J. Roger 1995. Geology and mineral wealth of the Sultanate of Oman. Ministry of Petroleum and Minerals Sultanate of Oman, 285 p.
Lippard, S.J. 1983. Cretaceous high pressure metamorphism in NE Oman and its relation to subduction and ophiolite nappe emplacement. Journal of the Geological Society of London, v. 140, p. 97104.
Manghnani, M.H. and R.G. Coleman 1981. Gravity profiles across the Semail Ophiolite, Oman. Journal of Geophysical Research, v. 86, no. B4, p. 25092525.
Mann, A. and S.S. Hanna 1990. The tectonic evolution of prePermian rocks, Central and Southeastern Oman Mountains. In A.H.F. Robertson, M.P. Searle and A.C. Ries (Eds.), The Geology and Tectonics of the Oman Region, Geological Society Special Publication, 49, p. 307325.
Mattes, B.W. and S.C. Morris 1990. Carbonate/evaporite deposition in the Late Precambrian Early Cambrian Ara Formation of Southern Oman. In A.H.F. Robertson, M.P. Searle and A.C. Ries (Eds.), The Geology and Tectonics of the Oman Region, Geological Society Special Publication, 49, p. 617636.
Michard, A., J.L. Bouchez and M. OuazzaniTouhami 1984. Obductionrelated planar and linear fabrics in Oman. Journal Structural Geology, v. 6, p. 3949.
Mooney, W.D., M.E. Gettings, H.R. Blank and J.H. Healy 1985. Saudi Arabian seismicrefraction profile: a travel time interpretation of crustal and upper mantle structure, Tectonophysics, v. 111, p. 173246.
Mount, V.S., R.I.S. Crawford and S.C. Bergman 1998. Regional structural style of the central and southern Oman Mountains: Jebel Akhdar, Saih Hatat, and the northern Ghaba Basin. GeoArabia, v. 3, no. 4, p. 475489.
Nicolas, A., F. Boudier and B. Ildefonse 1996. Variable crustal thickness in the Oman ophiolite: implication for oceanic crust. Journal of geophysical research, v. 101, no. B8, p. 17,94117,950.

78
Nolan, S.C., P.W. Skelton, B.P. Clissold and J.D. Smewing 1990. Maastrichtian to early Tertiary stratigraphy and palaeogeography of the Central and Northern Oman Mountains. In A.H.F. Robertson, M.P. Searle and A.C. Ries (Eds.), The Geology and Tectonics of the Oman Region, Geological Society Special Publication, 49, p. 495519.
Pallister, J.S. and C.A. Hopson 1981. Semail Ophiolite plutonic suite: Field relations, phase variation, cryptic variation and layering, and model for a spreading ridge magma chamber. Journal of Geophysical Research, v. 86, no. B4, p. 25932644.
Rabu, D., F. Bechennec, M Beurrier and G. Hutin, 1986. Geological map of Nakhl. Ministry of Petroleum and Minerals, Sultanate of Oman.
Ravaut, P. 1997. Le Anomalies De Pesanteur en Oman Implications sur la structure et l'evolution tectonique de la chaine nordomanaise, Universite Montpellier, Montpellier. Ph.D. Dissertation. p. 255.
Ravaut, P., D. Carbon, JF. Ritz, R. Bayer, H. Philip 1998. The Sohar Basin, western Gulf of Oman: description and mechanisms of formation from seismic and gravity data. Marine and Petroleum Geology, v. 15, no. 4, p. 359377.
Ravaut, P., R. Bayer, R. Hassani, D. Rousset and A.A. Yahya'ey 1997. Structure and evolution of the northern Oman margin: gravity and seismic constraints over the ZagrosMakranOman collision zone. Tectonophysics, v. 279, p. 253280.
Ravaut, P. and W. Warsi, 1997. Bouguer Anomaly Map of Oman. Ministry of Petroleum and Minerals, Sultanate of Oman, Muscat.
Robertson, A. 1987. The transition from a passive margin to an upper Cretaceous foreland basin related to ophiolite emplacement in the Oman Mountains. Geological Society of America Bulletin, v. 99, no. 11, p. 633653.
Sandvol, E., D. Seber, M. Barazangi, F. Vernon, R. Mellors and A. AlAmri 1998a. Lithospheric Seismic Velocity Discontinuities beneath the Arabian Shield. Geophysical Research Letters, v. 25, no. 15, p. 28732876.
Sandvol, E., D. Seber, A. Calvert and M. Barazangi 1998b. Grid search modeling of receiver functions: Implications for crustal structure in the Middle East and North Africa. Journal of Geophysical Research, v. 103, no. B11, p. 26,89926,917.
Searle, M. and J. Cox 1999. Tectonic setting, origin, and obduction of the Oman ophiolite. Geological Society of America Bulletin, v. 111, no. 1, p. 104122.
Shelton, A.W. 1990. The interpretation of gravity data in Oman: Constraints on the Ophiolite emplacement mechanism. In A.H.F. Robertson, M.P. Searle and A.C.

79
Rice (Eds.), The Geology and Tectonics of the Oman Region, Geological Society of London, 49, p. 459471.
Warbuton, J., T.J. Burnhill, R.H. Graham and K.P. Isaac 1990. The Evolution of the Oman Mountains foreland basin. In A.H.F. Robertson, M.P. Searle and A.C. Ries (Eds.), The Geology and Tectonics of Oman Region, Geological Society Sepecial Publication, 49, p. 419427.
Wyns, R., F. Bechennec, S. Chevrel, J. Le Metour, and J. Roger 1992. Geological map of Nazwa. Ministry of Petroleum and Minerals, Sultanate of Oman.
Zandt, G. and C.J. Ammon 1995. Continental Crust Composition Constrained by the Measurement of the Crustal Poisson's ratio. Nature, v. 374, no. 9, p. 152154.

80
CHAPTER THREE
Tomographic Pn velocity and anisotropy structure beneath the
Anatolian plateau (eastern Turkey) and the surrounding regions*
ABSTRACT
We use Pn phase travel time residuals to invert for mantle lid velocity and
anisotropy beneath northern Arabiaeastern Anatolia continentcontinent collision
zone. The primary phase data were obtained from the temporary 29station broadband
PASSCAL array of the Eastern Turkey Seismic Experiment. These data were
supplemented by phase data from available stations of the Turkish National Seismic
Network, the Syrian National Seismic Network, the Iranian Long Period Array, and
other stations around the southern Caspian Sea. In addition, we used carefully selected
catalog data from the International Seismological Centre and the National Earthquake
Information Center bulletins. Our results show that low (< 8 km/s) to very low (< 7.8
km/s) Pn velocity zones underlie the Anatolian plateau, the Caucasus, and
northwestern Iran. Such low velocities are used to infer the presence of partially
molten to absent mantle lid beneath these regions. In contrast, we observed a high Pn
velocity zone beneath northern Arabia directly south of the BitlisZagros suture
indicating the presence of a stable Arabian mantle lid. This sharp velocity contrast
across the suture zone suggests that Arabia is not underthrusting beneath the Anatolian
plateau and that the surface suture extends down to the uppermost mantle.
__________________________ * Willl be submitted to Geophysical Research Letters as "Tomographic Pn velocity and anisotropy
structure beneath the Anatolian plateau (eastern Turkey) and the surrounding region" by Ali I. Al
Lazki, Eric Sandvol, Dogan Seber, Muawia Barazangi, Niyazi Turkelli, and Randa Mohamad.

81
INTRODUCTION
This study focuses on the continentcontinent collision zone between the
Arabian and Eurasian plates and the resultant AnatolianIranian plateau (Figure 3.1).
Crustal processes at the ArabianEurasian convergent boundary and the nearby regions
received extensive analysis (e.g., Dewey et al., 1986; Reilinger et al., 1997). However,
the state of the mantle lithosphere and lithospheric dynamics of this young continent
continent collision zone are still debated (e.g., McKenzie, 1972; Rotstein and Kafka,
1982; Dewey et al., 1986).
The tectonic history of the region is complex. A twophase extension episode
in Late Eocene and Early Pliocene (Hempton, 1987) initiated the split of the Arabian
plate from the African plate along the Red Sea and the Gulf of Aqaba regions. Arabia's
continued northward motion and further separation from the African plate along the
Dead Sea Fault (DSF) in the Miocene/Pliocene resulted in the reorganization of
relative plate motions in the Anatolian Plateau (Bozkurt, 2001). In Early Pliocene, this
resulted in the westward extrusion of the Anatolian plate along the North Anatolian
Fault (NAF) and the East Anatolian Fault (EAF) zones (McKenzie, 1972; Sengor and
Yilmaz, 1981; Sengor et al., 1985). Farther north, the Lesser and Greater Caucasus
regions which are believed to partially accommodate the Arabian plate northward
motion (Philip et al., 2001) are undergoing thrust and strikeslip deformation.
Terminal suturing of the Arabian and Eurasian plates along the Bitlis Suture
(BS) is thought to have happened in the Middle Miocene (Yilmaz, 1993). The
ArabianEurasian collision is associated with extensive volcanism in eastern Anatolia,
starting in the Late Miocene and continuing to historical times (Yilmaz, 1990; Keskin
et al., 1998). The source of this volcanism is possibly derived form the lower portion
of the lithospheric mantle (Pearce et al., 1990). GPS data (Reilinger et al., 1997) have
shown that the Anatolian plate is escaping to the west and that there is horizontal

82
Figure 3.1. Simplified tectonic boundaries (black lines) of northern Arabian and
Eurasian plates atop hit counts basemap for every 1/6 o cell size. 1 = White triangles
are Eastern Turkey Seismic Experiment (ETSE) stations, and black triangles are
Syrian National Seismic Network (SNSN) stations; white hexagons are Turkish
National Seismic Network stations, black hexagons are temporary stations of the
southern Caspian experiment; white stars are the temporary station of the Iranian Long
Period Array (ILPA); and open triangles are other local stations obtained from the ISC
catalouge. 2 = Thrust, and 3 = strikeslip fault boundaries. BS = Bitlis Suture and ZS =
Zagros Suture, GC = Greater Caucasus, LC = Lesser Caucasus, NAF = North
Anatolian Fault, EAF = East Anatolian Fault, DSF = Dead Sea Fault.

83
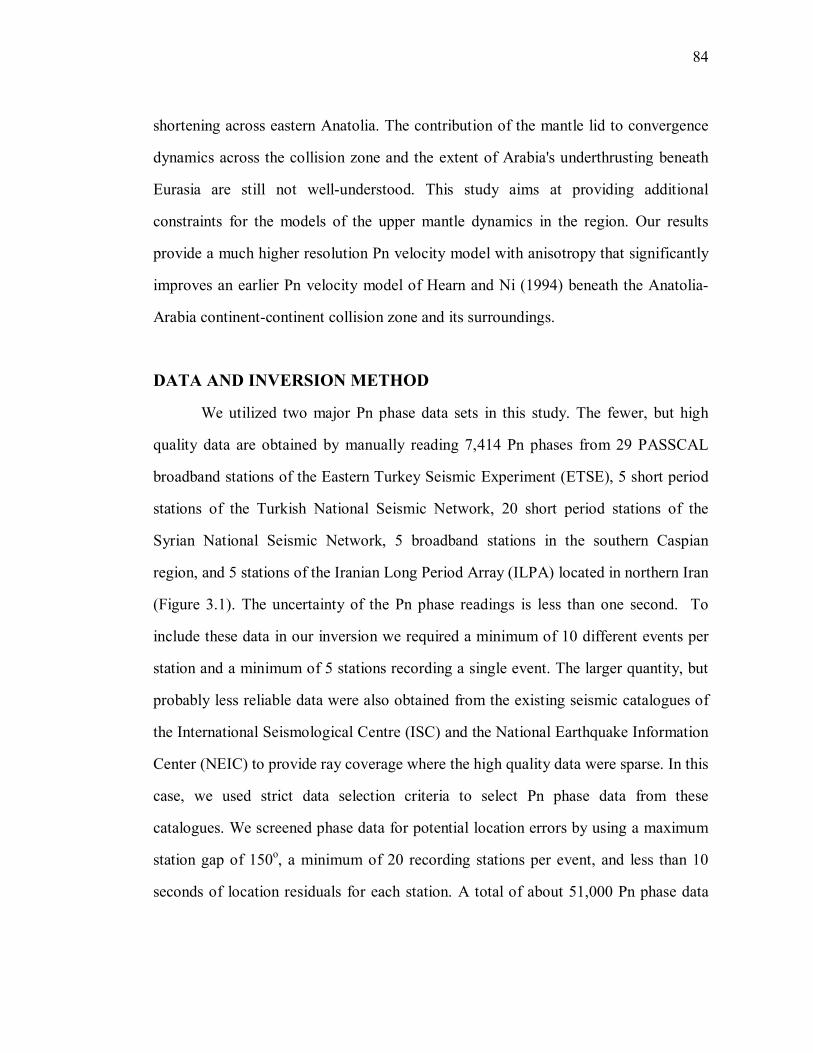
84
shortening across eastern Anatolia. The contribution of the mantle lid to convergence
dynamics across the collision zone and the extent of Arabia's underthrusting beneath
Eurasia are still not wellunderstood. This study aims at providing additional
constraints for the models of the upper mantle dynamics in the region. Our results
provide a much higher resolution Pn velocity model with anisotropy that significantly
improves an earlier Pn velocity model of Hearn and Ni (1994) beneath the Anatolia
Arabia continentcontinent collision zone and its surroundings.
DATA AND INVERSION METHOD
We utilized two major Pn phase data sets in this study. The fewer, but high
quality data are obtained by manually reading 7,414 Pn phases from 29 PASSCAL
broadband stations of the Eastern Turkey Seismic Experiment (ETSE), 5 short period
stations of the Turkish National Seismic Network, 20 short period stations of the
Syrian National Seismic Network, 5 broadband stations in the southern Caspian
region, and 5 stations of the Iranian Long Period Array (ILPA) located in northern Iran
(Figure 3.1). The uncertainty of the Pn phase readings is less than one second. To
include these data in our inversion we required a minimum of 10 different events per
station and a minimum of 5 stations recording a single event. The larger quantity, but
probably less reliable data were also obtained from the existing seismic catalogues of
the International Seismological Centre (ISC) and the National Earthquake Information
Center (NEIC) to provide ray coverage where the high quality data were sparse. In this
case, we used strict data selection criteria to select Pn phase data from these
catalogues. We screened phase data for potential location errors by using a maximum
station gap of 150 o , a minimum of 20 recording stations per event, and less than 10
seconds of location residuals for each station. A total of about 51,000 Pn phase data

85
were then used in the Pn tomography inversion for the area covering 30 o to 55 o E and
30 o to 45 o N.
A tomography method developed by Hearn (1996) is used to invert for Pn
wave velocity, anisotropy, as well as station and event delays. This method uses a least
squares algorithm (Paige and Saunders, 1982) to iteratively solve for all eventstation
pairs to obtain slowness, anisotropy, and station and event delays (Hearn, 1996). The
method includes damping parameters on both velocity and anisotropy to regularize
solution and reduce noise artifacts. Pwave travel time residuals (<10 s) from sources
at 1.8 o to 16 o were used to invert for uppermost mantle velocity and anisotropy models
at a 1/6 o cell size. For this tomography inversion we used mean uppermost mantle
velocity of 8 km/s and assumed a crustal thickness of 35 km and a crustal velocity of
6.2 km/s. Figure 3.1 shows seismic stations atop hit counts map for the study region
(Figure 3.1).
TOMOGRAPHY RESULTS
A broad zone of low (< 8 km/s) Pn velocity underlies northwestern Iran,
Turkey, and the Caucasus region. Within this broad low velocity anomaly, pockets of
very low (< 7.8 km/s) Pn velocity zones are observed in the Caucasus and eastern
Anatolia (Figure 3.2a). On the other hand, high Pn velocities underlie most of northern
Arabia, the Caspian Sea and Azerbaijan (eastern Greater Caucasus), the Black Sea,
and northeastern Mediterranean Sea (Figure 3.2a). In addition, smaller zones with high
Pn velocity are observed in areas in northwestern Iran, central Anatolia plate, and
central Greater Caucasus (Figure 3.2a).
To test the resolution of our tomographic inversion and the reliability of the anomalies
obtained (Figure 3.2a) we constructed a synthetic checkerboard model with alternating
high and low velocities in 2 o x2 o cells. We added 1 second random noise to

86
Figure 3.2. (a) A map showing inverted tomographic image of Pn velocity of the
study area. Red tones represent low Pn velocity zones (unstable to partially molten
mantle lid regions), while blue tones represent high Pn velocity (indicate stable mantle
lid regions). A broad scale low (< 8 km/s) Pn velocity anomaly underlies northwestern
Iran, the Caucasus region, Turkey, and northwestern Arabia, while smaller scale very
low (< 7.8 km/s) Pn velocity anomalies underlie the Lesser Caucasus, western Greater
Caucasus, and the easternmost portion of the NAF. High Pn velocity (> 8 km/s) zones
underlie northern and northeastern Arabia, the Caspian and Azerbaijan (eastern
Greater Caucasus), the Black Sea, and northeastern Mediterranean Sea. 1=
Neaogene/Quaternary volcanoes, 2= Thrust boundary, and 3= Strikeslip boundary.
(b) Checkerboard test results for 2 o x2 o cells inverted using the same station and event
distribution used in the velocity and anisotropy model shown in Figure 3.2a. Most of
the study area shows resolved checkerboard cells except for the northwestern Iran and
the southern Caspian Sea where partial NWSE smearing is observed to influence
inverted Pn velocity and anisotropy directions.
87

88
the synthetic travel times obtained from the checkerboard model. We used the same
earthquake and station distribution as in the observed data and inverted the synthetic
travel time anomalies using the same inversion parameters used (Figure 3.2b). The
checkerboard anomalies in most of the study area are well resolved except for
moderate smearing observed in northwestern Iran, the Caspian Sea, the Black Sea, and
southern parts of northern Arabia (Figure 3.2b). In these regions smearing is more
severe in the anisotropy resolution indicating that anisotropy orientations in these
regions are not reliable.
The event and station distributions in the study area are not uniform. While the
ETSE and Syrian National Seismic Network (SNSN) stations provide very dense
coverage in a small region, additional stations cover other parts of the region sparsely.
In order to take advantage of the high density station coverage of the ETSE and SNSN
and to obtain a higher resolution Pn image along the collision zone we conducted a
special, focused study by only using data from the ETSE and SNSN. All phase picks
for these stations came from digital data and read by the authors. This data set is
clearly higher quality than the global phase database in this region. Using this higher
quality subset of our data set we obtained a detailed Pn velocity image at this segment
of the collision zone (Figure 3.3a). We used the earlier model cell size (1/6 o ) and used
a smaller damping value (100 rather than 1000) on this data set since the noise in this
subset of data set is much lower. This resulted in a clearly defined northernmost
boundary of the Arabian plate along the EAF and the BS zones (Figure 3.3a). Figure
3.3b shows checkerboard test results obtained for this subset of data. In this case we
used 1.5 o x1.5 o sized checkerboard anomalies. The synthetic results show that the
resolution is high along the BS and the EAF zones (the area of interest) and at the
junction of the North and East Antolian Fault zones.

89
Figure 3.3. (a) A map showing our tomographic image of Pn velocity using only the
data picked and read by the authors. The upper bounds of high Pn velocity zone along
the EAF and the eastern BS are used to define the northern extent of the Arabian plate
boundary. (b) A map showing 1.5 o x1.5 o checkerboard test results inverted using the
same stations and events distribution for Figure 3a. The best resolution is along the
EAF, eastern BS zones, and at the intersection zone between the EAF and NAF zones.
Symbols are as in Figure 3.2.

90

91
Observed anisotropy orientations simultaneously inverted with Pn velocity show a
higher degree of lateral variability compared to Pn velocity (Figure 3.4). Anisotropy
orientations within the Anatolian plate and along the NAF vary from predominantly E
W in the center to more NS in the western parts of Turkey (Figure 3.4). Zones of NE
SW anisotropy orientations surround the easternmost portion of the NAF zone, and
along the Lesser Caucasus region. The latter two NESW anisotropy orientations
spatially correlate with zones of very low Pn velocities, and show anisotropy
magnitudes that are larger than their surroundings (Figure 3.4). In addition to upper
mantle velocity and anisotropy values, station delays simultaneously inverted with Pn
velocity and anisotropy are used to identify potential crustal velocity and thickness
variations from the preliminary model (velocity 6.2 km/s and thickness 35 km). A
station delay of 1 second corresponds to ~10 km difference in crustal thickness or 0.7
km/s crustal velocity change from the assumed model. Observed station delays vary
from 2 to 2 seconds, these delays could not be explained independently by velocity or
thickness variation only, but in most cases are explained by a combination of velocity
and thickness variations as well as possible location and picking errors in the data set
(Figure 3.5). We observed clusters of systematic positive or negative station delays in
parts of the study area (Figure 3.5). The central stations of the western leg of the ETSE
array show minor station delays (<0.5 s) and their values decrease towards the
northwest (Figure 3.5). The eastern leg of the ETSE array, however, shows relatively
uniform ~1 second station delays. A cluster of negative station delays occupies the
Lesser Caucasus and western Greater Caucasus region (Figure 3.5). This cluster of
negative station delays corresponds with the very low Pn velocity beneath the Lesser
and western Greater Caucasus.

92
Figure 3.4. A map showing Pn anisotropy inverted simultaneously with the velocity
model. See Figure 3.2a for text abbreviation in map.

93
94
Figure 3.5. A map of station delays representing the station leg residuals relative to
the assumed velocity model. Squares are positive station delays and indicate thick
and/or slow crust. Circles are negative station delays and indicate fast and/or thin crust
relative to the assumed velocity and thickness model of the crust. For abbreviated text,
see Figure 3.1. Eastern Turkey Seismic Experiment (ETSE) array shows a general
decrease in delay magnitudes from east to west. Stations located in the Caucasus
region show negative station delays.

95

96
DISCUSSION AND CONCLUSIONS
The geodynamic model governing the accommodation of the Arabian plate’s
northward motion has been the subject of an ongoing debate (McKenzie, 1972;
Rotstein and Kafka, 1982; Dewey et al., 1986). In this study, we presented evidence
on the state of the lithospheric mantle beneath this young continentcontinent collision
zone. Geologic data from eastern Anatolia and the Caucasus indicate that the latest
stage of collision related volcanism started in the Late Miocene and continued until
historical times (Yilmaz, 1990; Keskin et al., 1998). Upper mantle instability in this
region is also evidenced by young calcalkaline and alkaline volcanism (Figure 3.2a)
(Innocenti et al., 1976; Pearce et al., 1990). At the present time, we observe a broad
scale low and smaller scale very low Pn velocity anomalies beneath northwestern Iran,
Eastern Anatolian plateau, the Caucasus region, and most of the Anatolian plate
(Figure 3.2a). Comparably, Sn wave propagation anomalies in this region also show
high attenuation beneath the Anatolian plate, the Anatolian plateau, and the Caucasus
region (Gok et al., 2000; Sandvol et al., 2001). These results are also consistent with
mantle lid instability interpretation beneath the Eurasian side of the collision (i.e.,
northwestern Iran, eastern Anatolia, the Caucasus, and Anatolia plate). We interpret
that partially molten to eroded mantle lid exists in regions underlain by very low Pn
velocity anomalies, such as the easternmost portion of the NAF, and the Lesser and
western Greater Caucasus regions (Figure 3.2a). The very low Pn velocity may even
be interpreted to indicate the complete absence of mantle lid in these regions, and that
asthenospheric material is directly located beneath the crust. This interpretation rules
out the earlier proposed idea of mantle thickening of the lithosphere (Dewey et al.,
1986) beneath the Anatolian plateau and the Caucasus region. If there were ever a
lithospheric thickening in these regions, either delamination or convective removal of
the thickened mantle lithosphere might have eliminated the thick lithosphere.
97
Our results also invalidate the idea of Arabian plate subduction or
underthrusting beneath the eastern Anatolian plateau as suggested by Rotstein and
Kafka (1982). Stable mantle lid regions as identified by high Pn velocities underlie
only the northernmost portion of the Arabian plate. This stable region sharply stops
along the Bitlis suture zone (Figure 3.2a). Using a higher resolution subset of data we
show that the northern bounds of Arabia's stable mantle lid velocities follow the
western BS and the EAF lines relatively well (Figure 3.3a).
In continental settings anisotropy orientations are commonly described to
mimic regional tectonic trends (e.g., Kendall, 2000). Compared to Pn velocity, mantle
lid Pn anisotropy shows relatively more variations within a single plate (e.g.,
Anatolian plate) or along a single tectonic boundary (e.g., NAF). Observed Pn
anisotropy orientations do not seem to follow the tectonic trends. The more sudden
anisotropy variations in eastern Turkey and the Caucasus region may possibly reflect
more complex deformation processes in this region.

98
ACKNOWLEDGMENTS
The authors are grateful for the help and assistance of our colleagues E. Zor, R.
Gok, T. Bekler, R. Kay, S. Kuleli, K. AlDamegh, C. Brindisi, and F. Gomez. We are
thankful for the help of the federal and local governments of Turkey. This research is
supported by the National Science Foundation (Grant No. EAR9804780) and
Bogazici University Research Fund (Grant No. 99T206).

99
REFERENCES Bozkurt, E. 2001. Neotectonics of Turkey a synthesis. Geodinamica Acta : The
Europian Journal of Geodynamics, v. 14, no. 13, p. 330.
Dewey, J.F., M.R. Hempton, W.S.F. Kidd, F. Saroglu and A.M.C. Sengor 1986. Shortening of continental lithosphere: the neotectonics of Eastern Anatolia a young collision zone. In M.P. Coward and A.C. Ries (Eds.), Collision Tectonics, Geological Society Special Publication, No. 19, p. 336.
Gok, R., N. Turkelli, E. Sandvol, D. Seber and M. barazangi 2000. Regional wave propagation in Turkey and surrounding regions. Geophysical Research Letters, v. 27, no. 3, p. 429432.
Hearn, T.M. 1996. Anisotropic Pn tomography in the western United States. Journal of Geophysical Research, v. 101, no. B4, p. 84038414.
Hearn, T.M. and J.F. Ni 1994. Pn velocities beneath continental collision zones: the TurkishIranian Plateau. Geophysical Journal International, v. 117, p. 273283.
Hempton, M.R. 1987. Constraints on Arabian plate motion and extensional history of the Red Sea. Tectonics, v. 6, no. 5, p. 687705.
Innocenti, P., R. Mazzuoli, G. Pasquare, F.R.D. Brozolo and L. Villare 1976. Evolution of the volcanism in the area of interaction between Arabian, Anatolian and Iranian plates (Lake Van, eastern Turkey). J. Volcan. Geotherm. Res, v. 1, p. 103112.
Kendall, J.M. 2000. Seismic anisotropy in the boundary layers of the mantle. In S.i. Karato, A.M. Forte, R.C. Liebermann, G. Masters and L. Stixrude (Eds.), Deep Earth Interior: Mineral physics and tomography from the atomic to the global scale, American Geophysical Union, Geophysical Monograph 117, p. 115159.
Keskin, M., J.A. Pearce and J.G. Mitchell 1998. Volcanostratigraphy and geochemistry of collisionrelated volcanism on the ErzurumKars Plateau, northeastern Turkey. Journal of Volcanology and Geothermal Research, v. 85, p. 355404.
McKenzie, D. 1972. Active tectonics of the Mediterranean region. Geophysical Journal of the Royal Astronomical Society, v. 30, p. 109185.
Paige, C.C. and M.A. Saunders 1982. LSQR: Sparse linear equations and least squares problem. ACM Transactions on Mathematical Software, v. 8, no. 2, p. 195209.

100
Pearce, J.A., J.F. Bender, S.E. Delong, W.S.F. Kidd, P.J. Low, Y. Guner, F. Saroglee, Y. Yilmaz, S. Moorboath and J.G. Mitchell 1990. Gensis of collisional volcanism in eastern Anatolia, Turkey. J. Volc. geotherm. Res., v. 44, p. 189229.
Philip, H., A. Avagyan, A. Karakhanian, J.F. Ritz and S. Rebai 2001. Estimating slip rates and recurrence intervals for strong earthquake along an intracontinental fault: example of the PambakSevanSunik fault (Armenia). Tectonophysics, v. 343, p. 205232.
Reilinger, R.E., S.C. McClusky, M.B. Oral, R.W. King, M.N. Toksoz, A.A. Barka, I. Kinik, O. Lenk and I. Sanli 1997. Global Positioning System measurements of presentday crustal movements in the ArabiaAfricaEurasia plate collision zone. Journal of Geophysical Research, v. 102, no. B5, p. 99839999.
Rotstein, Y. and A.L. Kafka 1982. Seismotectonics of the southern boundary of Anatolia, eastern Mediterranean region; subduction, collision, and arc jumping. Journal of Geophysical Research, v. 87, no. 9, p. 76947706.
Sandvol, E., K. AlDamegh, A. Calvert, D. Seber, M. Barazangi, R. Mohamad, R. Gok, N. Turkelli and C. Gurbuz 2001. Tomographic imaging of Lg and Sn propagation in the Middle East. Pure and Applied Geophysics, v. 158, p. 1121 1163.
Sengor, A.M.C., N. Gorur and F. Sargolu 1985. Strikeslip faulting and related basin formation in zones of tectonic escape: Turkey as a case study. In K.T. Biddle and N. ChristieBlick (Eds.), Strikeslip faulting and basin formation, Society of Econ. Paleontol. Mineral. Special Publication, 37, p. 227264.
Sengor, A.M.C. and Y. Yilmaz 1981. Tethyan evolution of Turkey: a plate tectonic approach. Tectonophysics, v. 75, p. 181241.
Yilmaz, Y. 1990. Comparison of young volcanic associations of western and eastern Anatolia formed under a compressional regime: a review. Journal of Volcanology and Geothermal Research, v. 44, p. 6987.
Yilmaz, Y. 1993. New evidence and model on the evolution of the southeast Anatolian orogen. Geological Society of America Bulletin, v. 105, no. 2, p. 251271.

101
CHAPTER FOUR
Pn tomographic imaging of mantle lid velocity and anisotropy at the
junction of the Arabian, Eurasian, and African plates*
ABSTRACT
The Arabian plate's interaction with the Eurasian plate has played a major role
in building the young mountain belts along the ZagrosBitlis continentcontinent
collision zone. Arabia's northward motion is considered to be the primary driving
force behind the presentday westerly escape of the Anatolian plate along the North
and East Anatolian fault zones as well as the formation of the Turkish and the Iranian
plateaus. In this study we mapped Pn wave velocity and anisotropy structures at the
junction of the Arabian, Eurasian, and African plates in order to elucidate the upper
mantle dynamics in this region. Pn is a wave that propagates within the mantle lid of
the lithosphere and is often used to infer the rheology and fabric of the mantle
lithosphere. Using a strict selection criterion we used arrival times of 166,000 Pn
phases to invert for velocity and anisotropy in the region. Using a least squares
tomographic code, these data were analyzed to simultaneously solve for both velocity
and azimuthal anisotropy in the mantle lithosphere. We found that most of the
continental regions in our study area are underlain by low Pn velocity structures.
Broad scale (~500 km) zones of low (< 8 km/s) Pn velocity anomalies underlie the
Anatolian plate, the Anatolian plateau, the Caucasus region, northwestern Iran, and
northwestern Arabia and smaller scale (~200 km), very low (< 7.8 km/s) Pn velocity
__________________________ * Submitted to Geophysical Journal International on October 14, 2002 as "Pn tomographic imaging of mantle lid velocity and anisotropy at the junction of the Arabian, Eurasian, and African plates" by Ali I. AlLazki, Eric Sandvol, Dogan Seber, Muawia Barazangi, Niyazi Turkelli, and Randa Mohamad.

102
zones underlie southern Syria, the Lesser Caucasus, the Isparta Angle, central Turkey,
and the northern Aegean Sea. The broad scale low velocity regions are interpreted to
be hot and unstable mantle lid zones, whereas very low Pn velocity zones are
interpreted to be regions of no mantle lid. The low and very low Pn velocity zones in
eastern Turkey, northwestern Iran, and the Caucasus region may be associated with
the latest stage of intense volcanism that has been active since the Late Miocene. The
low Pn velocity zones beneath the Anatolian plate, eastern Turkey, and northwestern
Iran may in part be a result of the subducted Tethyan oceanic lithosphere beneath
Eurasia. We also found a major low velocity zone beneath northwestern Arabia and
the Dead Sea fault system. We interpret this anomaly to be a possible extension of the
hot and anomalous upper mantle of the Red Sea and East Africa rift system. High Pn
velocities (8.1 8.4 km/s) are observed to underlie the Mediterranean Sea, the Black
Sea, the Caspian Sea, and central and the eastern Arabian plate. Observed Pn
anisotropy showed a higher degree of lateral variations in comparison to the Pn
velocity structure. Though the Pn anisotropy varies even in a given tectonic region, in
eastern Anatolia very low Pn velocity and Pn anisotropy structures appear to be
coherent.
INTRODUCTION
The study area is located at the junction of the Arabian, Eurasian, and African plates.
This region encompasses diverse active plate boundaries and relatively modest active
intraplate deformation. Presentday boundaries of the Arabian plate are of several
types (Figure 4.1). In the southwest, a divergent plate boundary (Red Sea) exemplifies
early stages of continental rifting and sea floor spreading. In the northwest, the Dead
Sea Fault (DSF) transform system separates the Arabian plate from the Sinai and
Levantine subplates (Figure 4.1). In the north and northeast the boundary zone is a

103
Figure 4.1. Simplified tectonic map of the study area showing main plate boundaries.
AP: Anatolian Plate, BS: Bitlis Suture, CA: Cyprean Arc, CIM: Central Iranian
Microplate, DSF: Dead Sea Fault, EAF: East Anatolian Fault, GC: Greater Caucasus,
HA: Hellenic Arc, IA: Isparta Angle, KD: Kopeh Dagh, LC: Lesser Caucasus, LB: Lut
Block, SL: Sinai and Levantine subplate, NAF: North Anatolian Fault, NWIP: North
West Iranian Plate, TC: Transcaucasus, and ZS: Zagros Suture.

104

105
continentcontinent collision, where the Arabian plate is colliding with the Eurasian
plate along the Bitlis Suture (BS) and the Zagros Suture (ZS) zones (Figure 4.1).
Northward motion of Arabia is partially accommodated by the westerly extruding
Anatolian plate along the North Anatolian Fault (NAF) and the East Anatolian Fault
(EAF) zones (McKenzie, 1972; Sengor and Yilmaz, 1981; Sengor et al., 1985). The
escaping Anatolian plate is bounded in the west and south by the subduction zones of
the Hellenic and Cyprean arcs, respectively.
In this paper we use the Pn phase to study the mantle lid velocity and infer the
state of the lithosphere at the junction of the Arabian, Eurasian, and African plates. Pn
phase is a guided highfrequency compressional wave that propagates within a high
velocity mantle lid which acts like a waveguide bounded by the low velocity zone
(LVZ) below and the crust above (e.g., Menke and Richards, 1980; Beghoul et al.,
1993). Pn wave velocity is often used to infer uppermost mantle rheology. Variations
in Pn velocities are caused by changes in the physical parameters of uppermost mantle
rocks. Changes in temperature and composition, as well as presence of water and
volatiles are the main causes of velocity changes. Pn velocities are generally the
highest in oceanic lithosphere and could reach up to 8.4 km/s (Walker, 1977).
Continental lithosphere Pn velocities, however, vary significantly depending on the
rheology of the mantle lid. Higher Pn velocities (> 8 km/s) imply a tectonically stable
mantle lid, while very low Pn velocities (< 7.8 km/s) are usually an indication of
partial melt (Hearn, 1999; Calvert et al., 2000).
Pn velocities also show azimuthal variations. Seismic anisotropy has been
observed in the upper mantle in both oceanic (Backus, 1965) and continental settings
(Beghoul and Barazangi, 1990). Earlier studies have concluded that most of the
anisotropy occurs in the upper mantle, whereas between 600 km depth and the D"
discontinuity the mantle appears to be relatively isotropic (e.g., Savage, 1999;
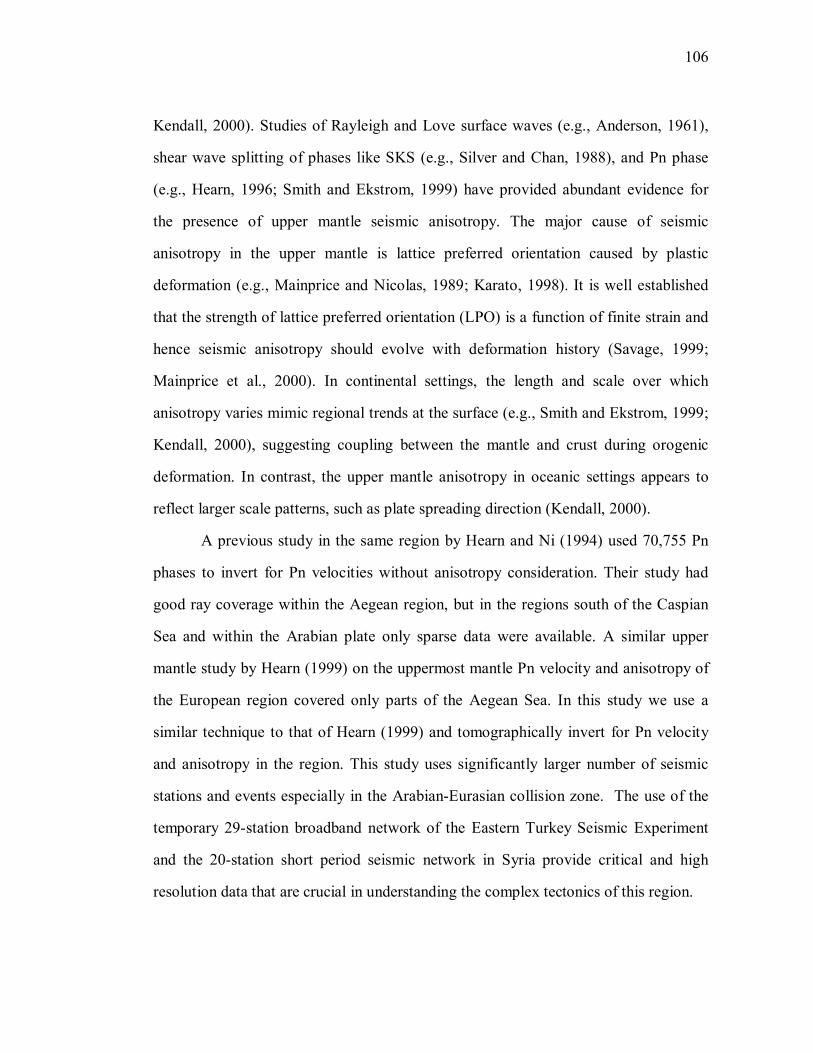
106
Kendall, 2000). Studies of Rayleigh and Love surface waves (e.g., Anderson, 1961),
shear wave splitting of phases like SKS (e.g., Silver and Chan, 1988), and Pn phase
(e.g., Hearn, 1996; Smith and Ekstrom, 1999) have provided abundant evidence for
the presence of upper mantle seismic anisotropy. The major cause of seismic
anisotropy in the upper mantle is lattice preferred orientation caused by plastic
deformation (e.g., Mainprice and Nicolas, 1989; Karato, 1998). It is well established
that the strength of lattice preferred orientation (LPO) is a function of finite strain and
hence seismic anisotropy should evolve with deformation history (Savage, 1999;
Mainprice et al., 2000). In continental settings, the length and scale over which
anisotropy varies mimic regional trends at the surface (e.g., Smith and Ekstrom, 1999;
Kendall, 2000), suggesting coupling between the mantle and crust during orogenic
deformation. In contrast, the upper mantle anisotropy in oceanic settings appears to
reflect larger scale patterns, such as plate spreading direction (Kendall, 2000).
A previous study in the same region by Hearn and Ni (1994) used 70,755 Pn
phases to invert for Pn velocities without anisotropy consideration. Their study had
good ray coverage within the Aegean region, but in the regions south of the Caspian
Sea and within the Arabian plate only sparse data were available. A similar upper
mantle study by Hearn (1999) on the uppermost mantle Pn velocity and anisotropy of
the European region covered only parts of the Aegean Sea. In this study we use a
similar technique to that of Hearn (1999) and tomographically invert for Pn velocity
and anisotropy in the region. This study uses significantly larger number of seismic
stations and events especially in the ArabianEurasian collision zone. The use of the
temporary 29station broadband network of the Eastern Turkey Seismic Experiment
and the 20station short period seismic network in Syria provide critical and high
resolution data that are crucial in understanding the complex tectonics of this region.

107
TECTONIC BACKGROUND
Along the northern and northeastern boundary of Arabia the opening of the
NeoTethys ocean began in the Late Permian and continued until the Late Cretaceous
times. Consumption of the NeoTethys oceanic lithosphere by subduction began in
Early Cretaceous along the eastern and northeastern boundaries of the Arabian
African plate. The timing of collision between Arabia and Eurasia along the Bitlis and
the Zagros sutures is still being debated, with proposed ages ranging from Late
Cretaceous (Takin, 1972) to Pliocene (Dewey et al., 1973). Hempton (1982, 1985)
proposed an initial suturing to have begun in Middle to Late Eocene.
Along the presentday southwestern boundary of the Arabian plate, the
opening of the Red Sea and the Gulf of Aden is thought to have occurred in two
extensional episodes, one in the MiddleLate Eocene period and the other occurred in
the Early Pliocene (e.g., Hempton, 1987). This separation of Arabia from Africa is
accommodated by the left lateral DSF system and is also considered to be responsible
for the reorganization of relative plate motions in the Anatolian plateau (Bozkurt,
2001). In the Early Pliocene, continued NS convergence between Arabia and Eurasia
resulted in the extrusion of the Anatolian plate along the North Anatolian Fault (NAF)
and the East Anatolian Fault (EAF) zones (e.g., Sengor and Yilmaz, 1981; Sengor et
al., 1985). The two fault systems separate an eastern domain experiencing mainly NS
compression from the westerly escaping Anatolian plate. The tectonic domains east of
NAF and EAF are comprised of several subdomains from north to south: Greater
Caucasus, Transcaucasus depression, Lesser Caucasus, the east Anatolian plateau, and
the Arabian platform (Kocyigit and Erol, 2001).
Extension behind the Aegean subduction system began in the middle to late
Miocene (1310 Ma) (Le Pichon and Angelier, 1979; Jackson, 1994) or possibly as
recent as 6 Ma (Mckenzie, 1978). Extension of up to 100% is thought to have affected

108
the Aegean region in an NS direction (Mckenzie, 1978), with the greatest extensional
strains located in the southern Aegean, north of Crete (Angelier et al., 1982; Jackson,
1994). Presentday extension occurring on the northern Aegean extending to ~31 o E
within the Anatolian plate (Angelier et al., 1982) is believed to be associated with the
retreating subduction of the African oceanic lithosphere (eastern Mediterranean)
beneath the Hellenic arc. This extension dies out in the area north of ~42 o N in
Bulgaria and northern Greece (Figure 4.1).
METHOD
Pwave travel time residuals from sources at 1.8 o to 16 o distances were
inverted to obtain the uppermost mantle velocity model for the region. A tomography
method based on observed travel time residuals developed by (Hearn, 1996) is used to
invert for Pn wave velocity, anisotropy, as well as event and station delays. The
method uses Pn travel time model paths between eventstation pairs. This path
includes three legs: an event leg, a mantle leg, and a station leg. The three segments of
Pn travel time path are described by the following travel time equation (Hearn, 1996):
tij = ai + bj + ∑ dijk (Sk + Ak cos 2 Φ + Bk sin 2 Φ ) (4.1)
where ai is the station time leg for i station, bj is the event time leg for the j event, dijk is
the distance traveled between j event and i station for cell k, Φ is the back azimuth
angle, Sk is the slowness value for the k cell and Ak and Bk are anisotropy coefficients
for the k cell (Hearn, 1996). Equation (4.1) is iteratively solved for all eventstation
pairs using LSQR algorithm that solves sparse linear equations and least squares
problems (Paige and Saunders, 1982) to obtain slowness, anisotropy, and station and
event delays (Hearn, 1996). This method then separates station and event leg travel

109
times based on the assumed crustal model. We assumed a 35 km thick crust with a 6.2
km/s average velocity and an upper mantle velocity of 8.0 km/s to calculate travel
times for each station and event leg. In our inversion we used cell sizes of 0.25 o x0.25 o
for the region, similar to previous studies.
Since traveltime data include a certain degree of noise and uneven ray
coverage, a damping parameter is used to regularize the solution (Paige and Saunders,
1982) and reduce noise artifacts. In this case damping parameters for both velocity and
anisotropy were used to control image smoothness and reduce artifacts in the model
(Hearn, 1996). In our inversion process, after a series of tests, we chose a final
damping value of 1000 for both velocity and anisotropy. This value was found to best
remove erroneous data noise and best balance the contribution of both anisotropy and
velocity on the inverted model. Damping values of less than 1000 were found to
produce spurious velocity anomalies, while values lager than 1000 significantly
reduced our model resolution.
DATA
In this study two categories of Pn phase data were used. The first are phase
data picked by the authors from the Eastern Turkey Seismic Experiment (29
PASSCAL broadband stations), the Syrian National Seismic Network (20 short period
stations), the southern Caspian broadband stations (5 stations), the Iranian Long Period
Array (ILPA) (5 stations), and the Turkish National Network (5 short period stations)
data (Figure 4.2a). The second category is phase data that were extracted from the
International Seismological Centre (ISC) and the National Earthquake Information
Center (NEIC) earthquake catalogs (Figures 4.2a and 4.2b). The second category of Pn
phase data include 729,819 phases that were extracted from the ISC data catalogue
and 95,716 phases from the NEIC data catalogue. A total of 7,414 Pn phase picks

110
Figure 4.2a. Map showing seismic stations used in this study. CA: southern Caspian
Sea stations, ETSE: Eastern Turkey Seismic Experiment stations, ILPA: Iran Long
Period Array, SN: Syrian National network, and TN: Turkish National network. Open
triangles correspond to selected stations from the National Earthquake Information
Center (NEIC) and the International Seismological Centre (ISC) catalogues. (See
Figure 4.1 for geographic locations).
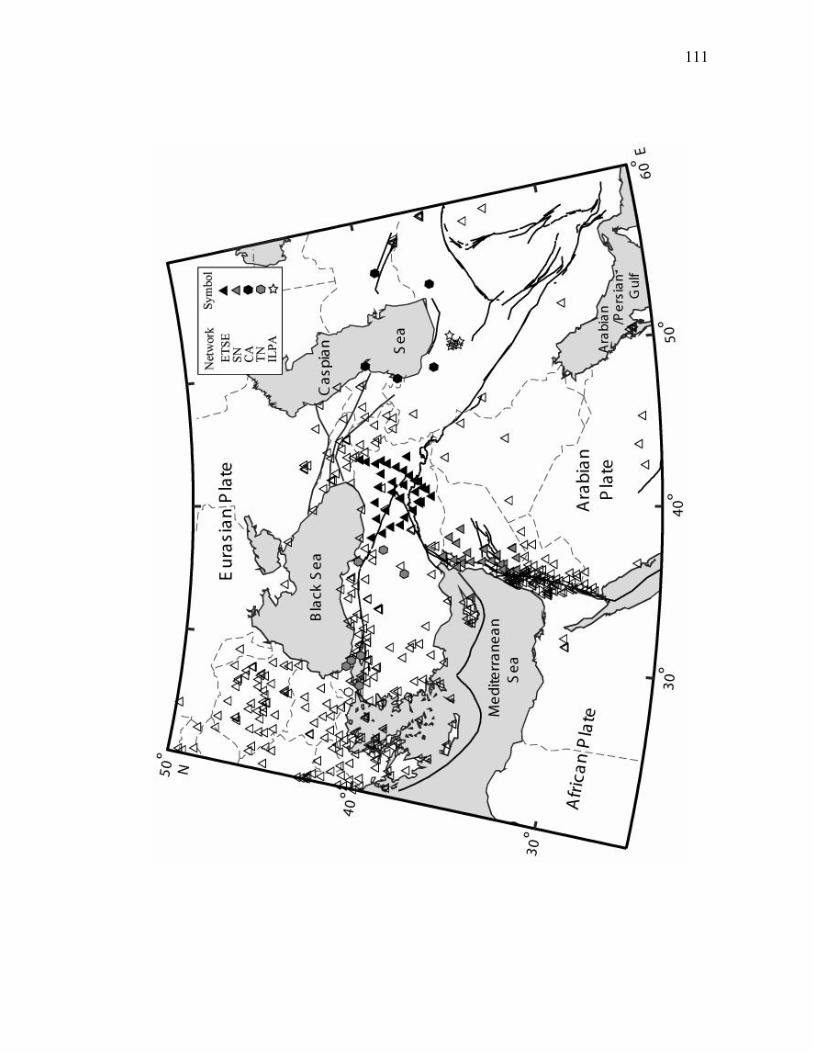
111

112
Figure 4.2b. Map showing seismic events (in circles) used in the Pn velocity and
anisotropy tomography inversion. (See Figure 4.1 for geographic locations).
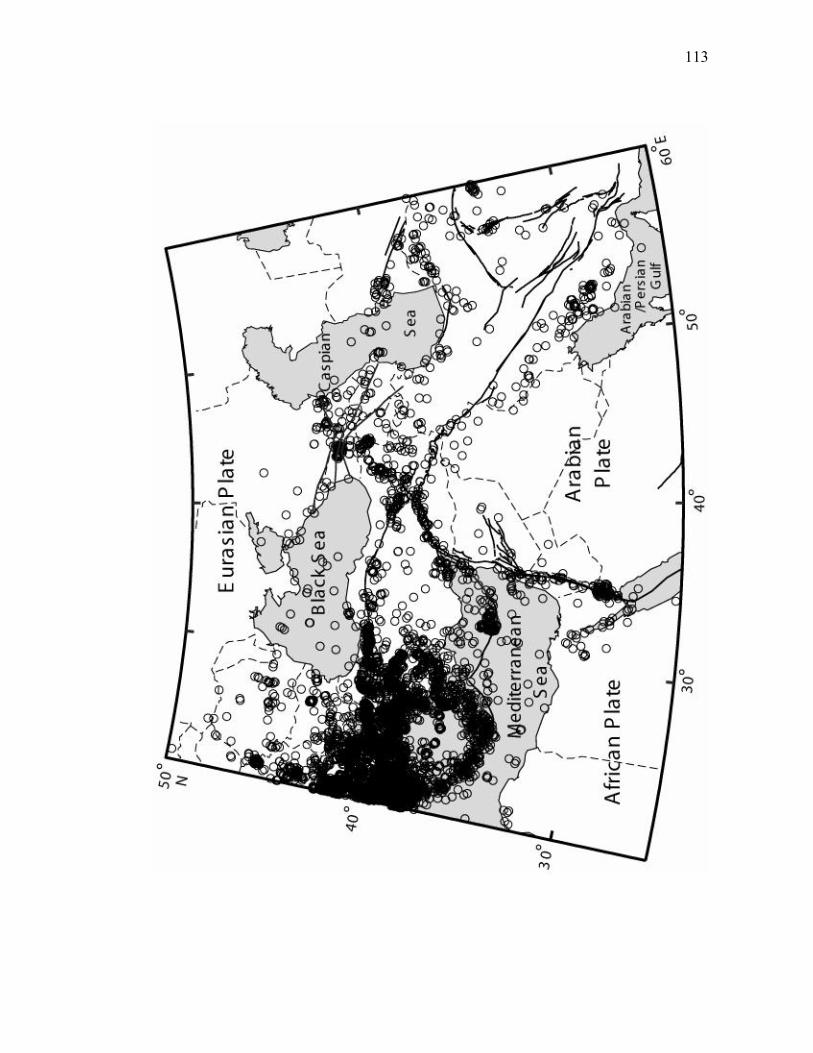
113

114
were read by the authors using the data from the ETSE, Syria network, ILPA, Caspian
stations, and the Turkish network. In addition, ETSE stations (Figure 4.2a) were used
to locate local seismicity in eastern Turkey. These local events amounted to a total of
2,715 phase picks, which provided a dense coverage within the 29station array
(Figures 4.2a and 4.2b).
Since the phase data might include many erroneous readings, especially those
obtained from catalogues, a rigorous selection method was used. In assessing data
quality and integrity we used 13 criteria to filter out possible erroneous phase data at
three levels. We screened phase data for both large location errors, pick precision, and
travel time errors. To minimize location errors, we used events only with location
azimuthal gaps less than 150 o , recorded by a minimum of 25 stations. We have
experimented with a number of more strict criteria in our ISC and NEIC data and
found that in regions where we maintained sufficient ray coverage and resolution our
resulting model was not affected. For the data picked by the authors, in terms of
picking precision we only used phases with estimated accuracy of one second or
better. Out of 8,944 events (Figure 4.2b) and their associated stations a total of
166,000 phases were selected using a maximum of 10 second travel time residual
(Figure 4.3a). Our tomographic inversion achieved a 35 % variance reduction from the
initial linear fit (Figure 4.3b).
The station density used in the Pn velocity inversion is highly variable in the
study area (Figure 4.4). High station density areas are located along the DSF system,
eastern Turkey, in and around the Caucasus mountain belts, in and around the Aegean
Sea and within the Bulgarian and Romania territories (Figure 4.2a). There is sparse
station coverage in central and northeastern Arabia platform and east of 45 o E
meridian (Figure 4.2a). The highest event density occurred in the Aegean
region and the lowest within the Arabian plate (Figure 4.2b). Path density for those
115
Figure 4.3. (a) Input travel time residuals (corrected for a 2D velocity fit). A 10
seconds cutoff is used in the Pn tomography inversion. The travel time residuals are
calculated using the study area’s Pn average velocity (8 km/s). (b) Travel time
residuals obtained using the Pn tomography results. A 35 % variance reduction is
obtained compared to the input 2D fit residuals. (See Figure 4.1 for geographic
locations).

116

117
Figure 4.4. Hit map coverage of the study area. Shades of gray show the number of
rays passing through a single 0.25 o x0.25 o cell.

118

119
events recorded at various stations is shown in Figure 4 as hit counts for each
0.25 o x0.25 o cell. Regions with the highest cell hit counts, > 64 hits, cover most of the
area west of the Caspian Sea including Turkey, Greece, the Aegean Sea, southern
Romania, eastern Mediterranean Sea, and the DSF system (Figure 4.4). Areas with
fewer number of ray hits, between 264 hits, occupy parts of northern Arabia, Iran,
southern Caspian Sea, central and northern Romania, and central and northern Black
Sea (Figure 4.4).
RESOLUTION ANALYSIS
Although it is customary to discuss resolution analysis after presenting the
inversion results, we will start discussing resolution analysis beforehand in order to
give the reader a feeling of the data resolution capacity in the study area. A synthetic
checkerboard model (2 o x2 o ), including a Gaussian random noise of one second
amplitude, was used to test data coverage resolution using the same damping
parameters of the tomographic model inversion. The input synthetic velocity
checkerboard (Figure 4.5a) is made of alternating high (+ 0.25 km/s) and low (0.25
km/s) velocity anomalies, while the anisotropy checkerboard (Figure 4.6a) was made
of alternating EW and NS fast directions with 0.25 km/s magnitude for both
orientations.
The velocity checkerboard test results could be categorized into two end
member levels of resolution in the study area. The highest level of resolution is in
regions where checkers’ shape, magnitude, and polarity are well resolved. This level
occurs in the Aegean region and western Turkey. The lowest level of resolution where
no shape, nor magnitude, nor polarity is clearly resolved occurs only in a small portion
of the border zone between Iraqi and Saudi Arabian territories and at the model edges
(Figure 4.5b) due to lack of data coverage in these regions. We have reasonably good

120
Figure 4.5a. Checkerboard synthetic velocity anomalies used to test the ability of the
available stations and events coverage to resolve a 2 o x2 o velocity checkers. The
anomaly amplitudes alternate between 0.25 km/s and +0.25 km/s velocity. (See
Figure 4.1 for geographic locations).

121

122
Figure 4.5b. Pn velocity checkerboard test result. (See Figure 4.1 for geographic
locations).

123

124
Figure 4.6a. Checkerboard synthetic anisotropy anomalies used to test the ability of
available stations and events coverage to resolve a 2 o x2 o anisotropy checkers. The
checkers are made of alternating NS and EW anisotropy orientations of a 0.25 km/s
magnitude. (See Figure 4.1 for geographic locations).

125

126
Figure 4.6b. Pn anisotropy checkerboard test result. (See Figure 4.1 for geographic
locations).

127

128
resolution of both the shape and magnitude of our test anomalies in central and eastern
Turkey. However, our model appears to have poor resolution in central and northern
Iran. The resolution is higher in southern and northeastern Iran in regions directly
northeast of the Arabian/Persian Gulf (Figure 4.5b).
The two endmember resolution levels also apply to the anisotropy
checkerboard test results (Figure 4.6b). The highest level of resolution, with complete
recovery of shape, magnitude, direction and polarity occurs within the Aegean region,
Greece, and western Turkey (Figure 4.6b). Reasonably good anisotropy resolution is
obtained along the DSF system, central to eastern Turkey, Romania, Bulgaria, and the
Caucasus region. Within these areas there is some smearing of our test anomalies. One
example is the southwestern portion of EAF zone where anisotropy directions are NE
SW oriented (Figure 4.6b). Because anisotropy involves the determination of
orientations, it is more prone to smearing effects due to uneven station and event
distributions. This is exemplified in northern Iran, where unresolved anisotropy
orientations form parallel zones of similar anisotropy orientations along the same areas
with the velocity smearing paths (Figure 4.6b). A zone with relatively improved shape
and orientation resolutions, but smaller magnitudes occupies the region directly
northeast the Arabian/Persian Gulf.
INVERSION RESULTS
Pn velocity anomalies
Pn velocity tomography with an anisotropy component shows two scales of
low Pn velocity anomalies (Figure 4.7a). First, a broader scale (~500 km) low (< 8
km/s) Pn velocity anomaly underlies northwestern Iran, eastern Anatolia, the
Caucasus, and most of the Anatolian plate. These broad scale low Pn velocity

129
Figure 4.7a. A map showing the Pn velocity tomographic results including Pn
anisotropy. The image shows a broader scale low Pn velocity (< 8 km/s) anomaly
underlying the boundary zone of Arabia and most of the Anatolian plate. Within the
broader low velocity zone anomalies shorter scale very low Pn velocity (< 7.8 km/s)
anomalies underlie southern Syria, the Lesser Caucasus region, the Isparta Angle, and
central Turkey. (See Figure 4.1 for geographic locations).

130

131
anomalies occupy regions within the Eurasian side of the EurasiaArabia collision
zone. In central Iran fast Pn velocities appear to extend beyond the Zagros suture line,
while in northwestern Iran and eastern Turkey the high Pn velocities are limited to the
region immediately south of the Bitlis suture and the EAF zone (Figure 4.7a). At the
northwestern boundary of the Arabian plate a broad, low Pn velocity anomaly
underlies the DSF system and western Arabia plate proper (Figure 4.7a). Farther south
the latter broad anomaly extends to underlie the Sinai and Levantine region (Figure
4.7a). Northwestern Arabia's broad low Pn velocity anomaly extends only as far north
as central and western Syria. Minor low velocity tongues, partly caused by smearing,
extend within the fast velocity zone south of the BS and EAF zone.
Second, five smaller scale (~200 km) anomalies with Pn velocities lower than
7.8 km/s are found to underlie areas within the broader scale low velocity anomalies.
Those shorter scale anomalies occur beneath southernmost Syria and northern Jordan,
the Lesser Caucasus, the Isparta Angle and central Turkey. An isolated shorter scale
low velocity anomaly underlies a region in the northern Aegean Sea and parts of
westernmost Turkey. Other low Pn velocity anomaly zones underlie western Greece,
Bulgaria, western Romania and easternmost Yugoslavia (Figure 4.7a).
Zones of high Pn velocities (88.4 km/s) underlie the interior of the Arabian
plate (including the Zagros fold belt), the southern Caspian Sea extending eastward
beneath the Kopeh Dagh and westwards beneath Azerbaijan, the Black Sea, and most
of the eastern Mediterranean Sea. Other regions showing high Pn velocity within the
broad low velocity anomalies underlie regions within the Central Iranian Microplate
(CIM) and a corridor directly south of the Caspian Sea that extends southwest to the
Zagros fold belt (in northern Iran), and two corridors in the eastern and western parts
of the Anatolian plate (Figure 4.7a). Also, we observe zones of very high Pn velocity
(> 8.2 km/s) beneath regions directly north of the Hellenic arc, the intersection
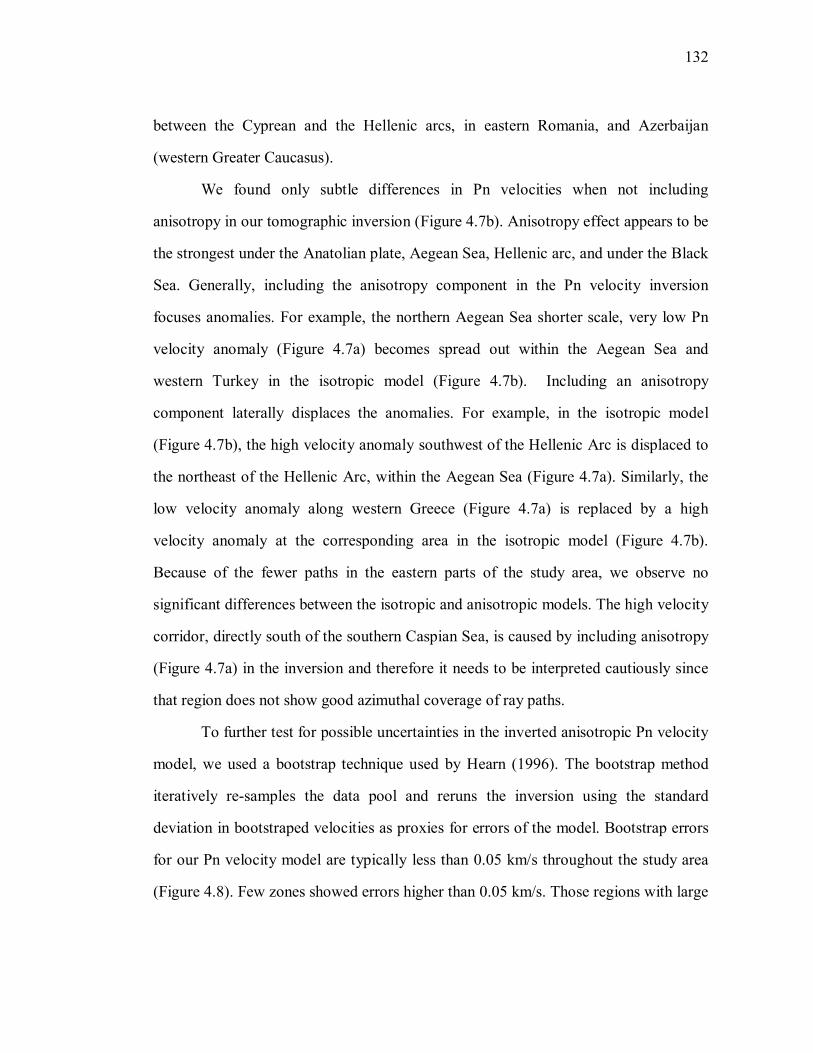
132
between the Cyprean and the Hellenic arcs, in eastern Romania, and Azerbaijan
(western Greater Caucasus).
We found only subtle differences in Pn velocities when not including
anisotropy in our tomographic inversion (Figure 4.7b). Anisotropy effect appears to be
the strongest under the Anatolian plate, Aegean Sea, Hellenic arc, and under the Black
Sea. Generally, including the anisotropy component in the Pn velocity inversion
focuses anomalies. For example, the northern Aegean Sea shorter scale, very low Pn
velocity anomaly (Figure 4.7a) becomes spread out within the Aegean Sea and
western Turkey in the isotropic model (Figure 4.7b). Including an anisotropy
component laterally displaces the anomalies. For example, in the isotropic model
(Figure 4.7b), the high velocity anomaly southwest of the Hellenic Arc is displaced to
the northeast of the Hellenic Arc, within the Aegean Sea (Figure 4.7a). Similarly, the
low velocity anomaly along western Greece (Figure 4.7a) is replaced by a high
velocity anomaly at the corresponding area in the isotropic model (Figure 4.7b).
Because of the fewer paths in the eastern parts of the study area, we observe no
significant differences between the isotropic and anisotropic models. The high velocity
corridor, directly south of the southern Caspian Sea, is caused by including anisotropy
(Figure 4.7a) in the inversion and therefore it needs to be interpreted cautiously since
that region does not show good azimuthal coverage of ray paths.
To further test for possible uncertainties in the inverted anisotropic Pn velocity
model, we used a bootstrap technique used by Hearn (1996). The bootstrap method
iteratively resamples the data pool and reruns the inversion using the standard
deviation in bootstraped velocities as proxies for errors of the model. Bootstrap errors
for our Pn velocity model are typically less than 0.05 km/s throughout the study area
(Figure 4.8). Few zones showed errors higher than 0.05 km/s. Those regions with large

133
Figure 4.7b. A map showing the optimal isotropic Pn velocity model. This model
shows minor differences from the anisotropic model of Figure 4.7a. Notice the
difference in the Aegean Sea region, where higher velocities south of the Hellenic arc
are displaced northwards inside the Sea of Crete and southern Aegean Sea. (See
Figure 4.1 for geographic locations).

134

135
Figure 4.8. A map showing Pn velocity errors calculated using 100 bootstrap
iterations. (See Figure 4.1 for geographic locations).

136

137
errors included the southeastern tip of the Caspian Sea, a small area along the northern
Zagros Fold Belt, and a small area along the NAF zone (Figure 4.8).
Pn anisotropy
Figure 4.9 shows the resulting anisotropy magnitudes and directions inverted
simultaneously with Pn velocity. Observed anisotropy magnitudes varied between 0.0
to 0.65 km/s. The largest anisotropy values occur within the Aegean Sea (~0.6 km/s),
the Hellenic arc (~0.65 km/s), southern portion of the Dead Sea fault system (~0.45
km/s), and across the easternmost segment of the NAF zone (~0.5 km/s). Smaller
anisotropy (~0.2 km/s) magnitudes are observed within the Arabian plate and the
zones east of it (Figure 4.9). These variations in anisotropy magnitudes could be in
part due to the uneven data coverage (i.e. we have damped our inversion in such a way
that in regions with poor resolution tend to have smaller anisotropy magnitudes).
Unlike the tomographic velocity anomalies, observed anisotropy anomalies
show a higher degree of lateral variability. We observed sudden anisotropy changes
across plates and along plate boundaries. Since not all anisotropy values are well
resolved we will address only those regions with good anisotropy resolution. Within
the Anatolian plate anisotropy fast axes are predominantly EW in the east, NS at the
center and EW in western Turkey. Similar sudden changes in anisotropy are observed
along the DSF system, where two different trends of anisotropy orientations are
observed (Figure 4.9). A predominantly EW fast anisotropy orientation is present
along the northern parts of the DSF system. A NESW anisotropy orientation is
imaged along the southern portion of the DSF system. Anisotropy orientations along
the DSF system show consistency along a narrower band in the inland regions. This
contrasts with wider zones of consistency in the Mediterranean Sea side (Figure 4.9).
The zone parallel to the DSF system’s restraining bend in southern Syria marks the

138
Figure 4.9. A map showing Pn azimuthal anisotropy orientations. Compared to Pn
velocity of Figure 4.7a, Pn anisotropy orientations display a higher degree of lateral
variations in the region. (See Figure 4.1 for geographic locations).

139
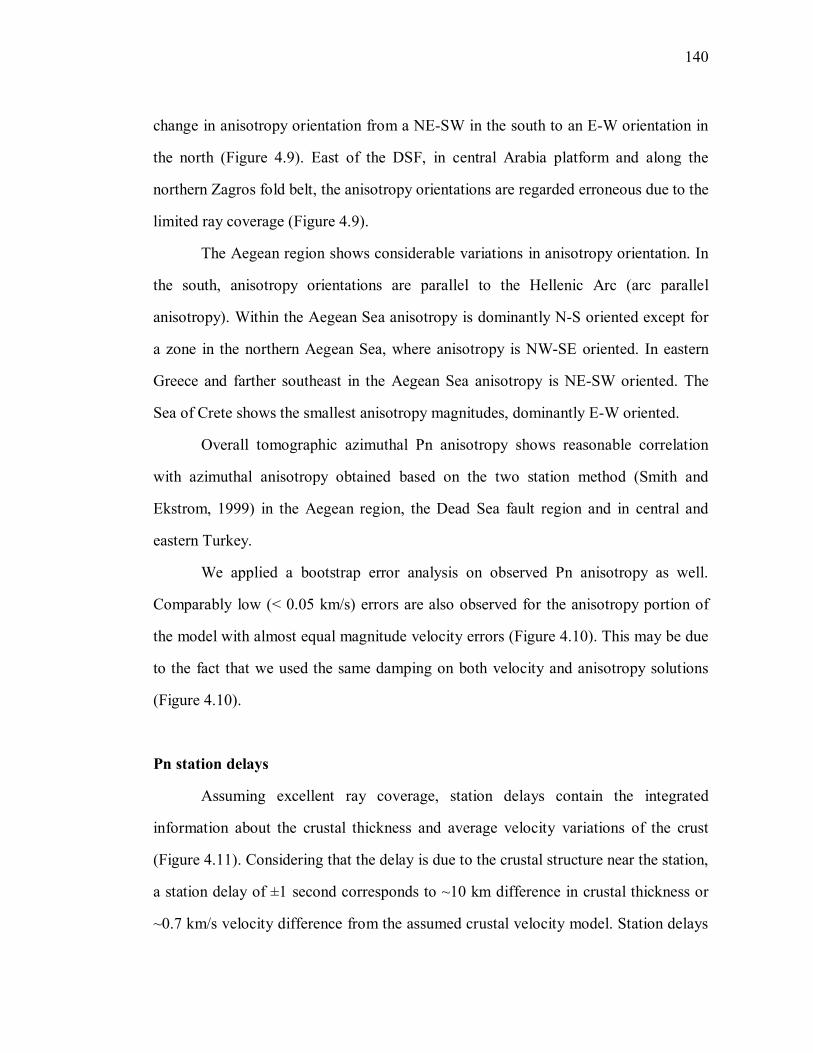
140
change in anisotropy orientation from a NESW in the south to an EW orientation in
the north (Figure 4.9). East of the DSF, in central Arabia platform and along the
northern Zagros fold belt, the anisotropy orientations are regarded erroneous due to the
limited ray coverage (Figure 4.9).
The Aegean region shows considerable variations in anisotropy orientation. In
the south, anisotropy orientations are parallel to the Hellenic Arc (arc parallel
anisotropy). Within the Aegean Sea anisotropy is dominantly NS oriented except for
a zone in the northern Aegean Sea, where anisotropy is NWSE oriented. In eastern
Greece and farther southeast in the Aegean Sea anisotropy is NESW oriented. The
Sea of Crete shows the smallest anisotropy magnitudes, dominantly EW oriented.
Overall tomographic azimuthal Pn anisotropy shows reasonable correlation
with azimuthal anisotropy obtained based on the two station method (Smith and
Ekstrom, 1999) in the Aegean region, the Dead Sea fault region and in central and
eastern Turkey.
We applied a bootstrap error analysis on observed Pn anisotropy as well.
Comparably low (< 0.05 km/s) errors are also observed for the anisotropy portion of
the model with almost equal magnitude velocity errors (Figure 4.10). This may be due
to the fact that we used the same damping on both velocity and anisotropy solutions
(Figure 4.10).
Pn station delays
Assuming excellent ray coverage, station delays contain the integrated
information about the crustal thickness and average velocity variations of the crust
(Figure 4.11). Considering that the delay is due to the crustal structure near the station,
a station delay of ±1 second corresponds to ~10 km difference in crustal thickness or
~0.7 km/s velocity difference from the assumed crustal velocity model. Station delays

141
Figure 4.10. A map showing Pn anisotropy errors using 100 bootstrap iterations. (See
Figure 4.1 for geographic locations).

142

143
Figure 4.11. A map showing stations delay. Squares represent thick and/or slow crust,
circles represent fast and/or thin crust (See Figure 4.1 for geographic locations).

144

145
obtained in our inversion varied between 3 seconds to +3 seconds. Anomalous station
delays in excess of 3 seconds are observed at a few stations and may indicate
systematic phase picking errors and/or systematic clock problems at those stations
(Grand, 1990; Hearn, 1996).
Clusters of systematic positive, negative, or mixed station delays observed at
different regions of the study area may bear some information about the crustal
structure (Figure 4.11). Positive station delays are mainly indicative of thick and/or
slow crust compared to the assumed model. Regions showing clusters of positive
station delays are located along the northern segment of the Dead Sea fault system, in
eastern Turkey (mostly ETSE stations), along the Cyprean and the Hellenic arcs, and
within Romanian territory (Figure 4.11). Negative station delays are indicative of a
thin and/or fast crust compared to the assumed model. Zones with negative station
delay clusters are those found in the northern Aegean Sea and areas around it
including eastern and northern Greece and northwestern Turkey (around the Sea of
Marmara), and along the southern portion of the DSF system (Figure 4.11).
DISCUSSION AND CONCLUSIONS
Rheology and structure
The Pn velocity results provide detailed insights about the rheology and dynamics of
the mantle processes in the region. High (> 8 km/s) Pn velocity zones found in
portions of Arabia, the Mediterranean, Black, and Caspian Seas are used to infer the
presence of stable mantle lid in these regions. Low Pn velocities found beneath the
junction of the Arabian, Eurasian, and African plates are used to infer the presence of
anomalously hot and/or thin mantle lid (Figure 4.12). The broad scale, low

146
Figure 4.12. A comparative map showing Pn velocity with anisotropy (base map, red
blue color, see Figure 4.7a), volcanic outcrops in green and pink polygons filled with
plus signs, Sn attenuation zones in yellow lines hatched areas enclosed by a solid gray
line (after Khaled AlDamegh, personal communication, June 2002), and volcanoes in
yellow triangles. (See Figure 4.1 for geographic locations).

147

148
Pn velocity anomalies beneath northwestern Iran, the Caucasus, and eastern Anatolia
is interpreted to originate from a different geodynamic process compared to the low Pn
velocity anomaly beneath the northwestern Arabia plate (Figure 4.12). The regions of
the Lut Block (LB) and the Central Iranian Microplate (CIM) are associated with
volcanic activity throughout the Paleogene and most of the Neogene times (Figures
4.1 and 4.12). However, a later stage of volcanic activity in eastern Turkey and
northwestern Iran is known to have started in the Late Miocene and continued to
historical times (e.g., Yilmaz, 1990; Keskin et al., 1998). This volcanic activity is
possibly related to earlier subduction of the NeoTethys oceanic lithosphere. A
lithospheric delamination event in the PlioQuaternary time may also significantly
contribute to the observed widespread volcanism. Such processes may explain the
anomalous nature of the lithosphere in these regions. Within the broad low Pn velocity
anomalies, zones of high Pn velocity (implying stable mantle lid) underlie the central
CIM, a corridor directly south of the Caspian Sea, and a small area in northwestern
Iran (Figures 4.1 and 4.12). The corridor directly south of the Caspian Sea is observed
only in the model with anisotropy and therefore should be considered cautiously due
to the poorly resolved anisotropy in that region (Figures 4.6b and 4.7b).
A careful examination of the boundary of the high Pn velocity zone beneath
the southern Zagros shows that the high velocity area extends for ~100 km northeast
of the Zagros suture line (Figures 4.12 and 4.7a). We interpret this region of high Pn
velocity to possibly indicate that stable Arabia is underthrusting the southern parts of
the SanandajSirjan region (Eurasia). This interpretation is in agreement with Snyder
and Barazangi (1986) who concluded that Arabia is being underthrust beneath the
southern parts of the SanandajSirjan region. The checkerboard resolution tests,
however, in this region show that our spatial resolution is poor, and, hence, this
interpretation may be incorrect. Farther north the high Pn velocity zone underlies only

149
regions directly south of the ZagrosBitlis suture line. We are confident based on our
resolution tests that in the northern parts of the ZagrosBitlis region underthrusting of
Arabia is very limited or absent as evidenced by a sudden change in Pn velocities
across the suture line.
One of the most important results of this study is the discovery of a low Pn
velocity zone beneath the Dead Sea fault system and the northwestern Arabian plate.
Sandvol et al. (2001a) showed that Sn is attenuated beneath the entire Dead Sea fault
system, but the extent and location of the anomaly was ambiguous due to limited
resolution. In this study, we use better eventstation distribution in the region to
quantify the mantle lid velocity beneath northwestern Arabia and the DSF system. We
find the broad, low Pn velocity anomaly is not centered along the DSF system, but
rather extends a considerable distance within the Arabian plate proper. Also, the very
low Pn velocity anomaly beneath southern Syria and northern Jordan is located east of
the DSF system axis. The anomalous low Pn velocity zone is asymmetrical relative to
the DSF. Whether or not this anomalous lithospheric mantle is a direct result of the
development of the DSF system is arguable. We argue against this possible
interpretation owing to the velocity anomaly's asymmetry with respect to the DSF
plate boundary and its extent eastwards beneath the northwestern Arabia plate proper.
The broad low Pn velocity zone underlying the DSF system and northwestern Arabia
coincides at the surface with relatively young volcanic outcrops
(Neogene/Quaternary), while the very low Pn velocity (7.6 km/s) anomaly is overlain
by Quaternary and Holocene volcanoes. We interpret the low Pn velocity anomaly
beneath the DSF system and northwestern Arabia as a possible northward extension of
the anomalous mantle beneath the Red Sea spreading system. This broad region of
thin, hot mantle lithosphere may have facilitated the development of the DSF system
in the Neogene time.

150
The presence of partial melt lowers normal lithospheric mantle velocities by at
least five to six per cent (Sato et al., 1989). If we are to consider 8.2 km/s is the normal
Pn velocity, then 6% slower Pn velocity would allow us to consider the smaller scale
very low Pn velocity anomalies beneath southern Syria, the Isparta Angle, central
Turkey, the Lesser Caucasus, and the northern Aegean Sea as zones of possible partial
melt, i.e. the lithospheric mantle is absent (Figure 4.12). These very low Pn velocity
anomalies correspond at the surface with Holocene volcanoes (Figure 4.12). The very
low Pn velocity (7.5 km/s) centered at the northern Aegean Sea is a region where the
largest presentday extensional strain rates are observed (Sonder and England, 1989).
The northern Aegean back arc extension region extends up to ~42 o N and 31 o E
(Angelier et al., 1982; Jackson, 1994), which is inclusive of the small very low Pn
velocity anomaly. The very low Pn velocity (~7.5 km/s) and the thinned crust (2632
km) beneath the Aegean (Makris and Vees, 1977) is comparable to a rifting system,
such as the East African rift system beneath Lake Turkana (Keller et al., 1994). This
very low Pn velocity reflects perhaps very thin to absent mantle lid, where Pn
propagation is actually sampling asthenospheric rather than lithospheric mantle.
Regions showing stable upper mantle (high Pn velocities) underlie central and
eastern Arabia, the southern Caspian Sea extending eastwards beneath the Kopeh
Dagh and westward underlying most of Azerbaijan (eastern Greater Caucasus), most
of the Black Sea, eastern portions of the Mediterranean Sea, the Sea of Crete and the
southern Aegean Sea (Figure 4.7a). The Zagros fold belt is underlain by fast Pn
velocity (Figure 4.7a). This is not surprising since the Zagros fold belt is geologically
an integral part of the leading edge of the Arabian plate. We also observed zones of
very high Pn velocity (> 8.3 km/s) beneath regions directly north of the Hellenic arc,
the intersection between the Cyprean and the Hellenic arcs, in eastern Romania, and
Azerbaijan (western Greater Caucasus). Finally, zones of high Pn velocity indicative
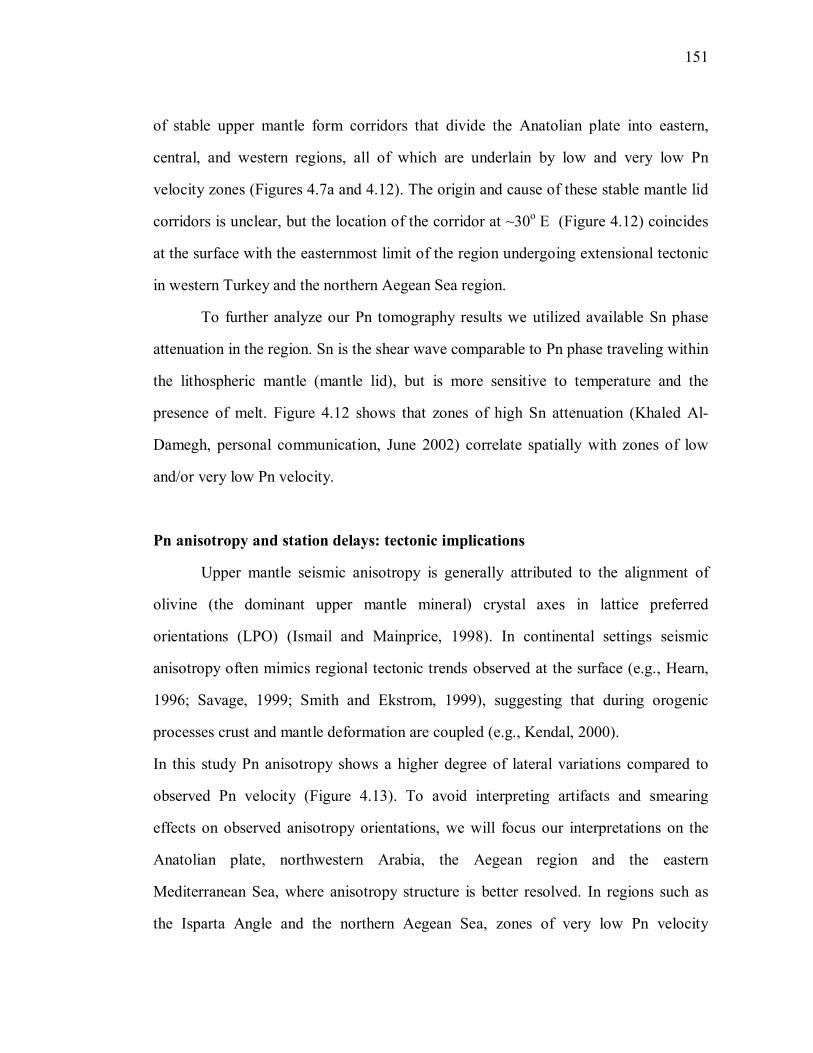
151
of stable upper mantle form corridors that divide the Anatolian plate into eastern,
central, and western regions, all of which are underlain by low and very low Pn
velocity zones (Figures 4.7a and 4.12). The origin and cause of these stable mantle lid
corridors is unclear, but the location of the corridor at ~30 o E (Figure 4.12) coincides
at the surface with the easternmost limit of the region undergoing extensional tectonic
in western Turkey and the northern Aegean Sea region.
To further analyze our Pn tomography results we utilized available Sn phase
attenuation in the region. Sn is the shear wave comparable to Pn phase traveling within
the lithospheric mantle (mantle lid), but is more sensitive to temperature and the
presence of melt. Figure 4.12 shows that zones of high Sn attenuation (Khaled Al
Damegh, personal communication, June 2002) correlate spatially with zones of low
and/or very low Pn velocity.
Pn anisotropy and station delays: tectonic implications
Upper mantle seismic anisotropy is generally attributed to the alignment of
olivine (the dominant upper mantle mineral) crystal axes in lattice preferred
orientations (LPO) (Ismail and Mainprice, 1998). In continental settings seismic
anisotropy often mimics regional tectonic trends observed at the surface (e.g., Hearn,
1996; Savage, 1999; Smith and Ekstrom, 1999), suggesting that during orogenic
processes crust and mantle deformation are coupled (e.g., Kendal, 2000).
In this study Pn anisotropy shows a higher degree of lateral variations compared to
observed Pn velocity (Figure 4.13). To avoid interpreting artifacts and smearing
effects on observed anisotropy orientations, we will focus our interpretations on the
Anatolian plate, northwestern Arabia, the Aegean region and the eastern
Mediterranean Sea, where anisotropy structure is better resolved. In regions such as
the Isparta Angle and the northern Aegean Sea, zones of very low Pn velocity

152
Figure 4.13. A comparative map showing Pn anisotropy in solid blue lines (see Figure
4.9), SKS shear wave splitting in green solid lines (after Sandvol et al. 2001b), and
GPS vector direction in pink solid lines (after McClusky et al. 2000). (See Figure 4.1
for geographic locations).

153

154
anomalies showed spatial correlation with zones of distinct and localized Pn
anisotropy orientations in the same region. At the convergent boundary between the
African and Anatolian plates Pn anisotropy is parallel to the arc trend (arc parallel)
between the Hellenic trench and its arc extending to ~40 O N, while no clear arc
parallel anisotropy is observed south of the Cyprean arc (Figure 4.13).
Along the major strike slip faults (i.e. the NAF and DSF) of the region
anisotropy also changes significantly along strike. Anisotropy orientations along the
NAF change from NESW in the east, to EW and NS in the central parts, and to
NWSE in the west close to the Sea of Marmara. Similarly, NESW oriented fast axis
in the southern portion of the DSF changes to EW directions north of the restraining
bend of the DSF. This change in anisotropy orientations at the restraining bend
coincides with changes in the polarity of station delays (Figures 4.11 and 4.13), where
the southern segment shows negative station delays and the northern segment shows
positive station delays (Figure 4.11). The negative station delays clustered along the
southern segment of the DSF system may partly be due to a thinned crust. The
systematic change of both station delay clusters and anisotropy orientations might
suggest that similar processes (influencing stations delays) influence anisotropy
orientations at depth. The station delays for the entire region are shown in Figure
4.11. Although these delays can be used as a first order indication for crustal thickness
and/or velocity variations in the crust, a cautious approach is needed in interpreting
these results as noise and site effects may also influence the results.
While Pn anisotropy is a measure of azimuthal anisotropy in the uppermost
mantle, shear wave (SKS) splitting results available in the region provide polarization
anisotropy information within the entire upper mantle. Fast SKS shear wave splitting
determined for ETSE stations in eastern Turkey and a station in central Turkey
(Sandvol et al., 2001b) generally showed NESW fast orientations, while a station in

155
the southern segment of the DSF system shows about NS orientation (Figure 4.13).
Along the NAF zone and farther southeast in eastern Turkey azimuthal Pn anisotropy
matched polarized anisotropy of SKS fast splitting orientations, while no obvious
match is observed in the rest of ETSE stations. NESW anisotropy orientations
surrounding the easternmost segment of the NAF also correspond with a zone of
relatively very low Pn velocity (Figures 4.12 and 4.13). This implies a thinned or
absent mantle lid in the region surrounding the easternmost portion of the NAF and
farther southeast directly north of BS, and that Pn anisotropy and SKS splitting are
both sampling asthenospheric deformation. While SKS orientations in central Turkey
show very good match with Pn azimuthal anisotropy, the stations along the southern
segment of the DSF system show clear discrepancy.
We also used available GPS measurements in the region to possibly relate
observed surface plate motion with Pn anisotropy orientations. Eurasia fixed GPS
vector directions (McClusky et al., 2000) within the Anatolian plate do not show a
clear relationship with observed Pn anisotropy orientations (Figure 4.13). The
observed sudden variations of Pn anisotropy orientations beneath the Anatolian plate
contrasts with the relatively uniform GPS observed westward motion of the Anatolian
plate.
Within the Aegean Sea NS oriented anisotropy conforms to observed NS
extension of the Aegean region (Mckenzie, 1978; Jackson, 1994). This suggests that
the observed anisotropy orientations within the mantle of the Aegean are influenced
by the dynamics of backarc processes beneath the Aegean Sea.
The lack of simple and consistent correlation between plate motion and Pn
anisotropy orientations possibly suggests that more complex processes seem to
influence Pn anisotropy orientations within the mantle lid. These processes could
include both crustal (nearby dominant tectonic stresses) and upper mantle deformation

156
(e.g. mantle flow). This interpretation is based on the following observations: (1)
anisotropy orientations that appear to be localized in regions underlain by very low Pn
velocity zones (e.g. the northern Aegean and the Isparta Angle), (2) anisotropy
orientations along the easternmost segment of the NAF zone are possibly sampling a
larger scale asthenospheric anomaly beneath thin to absent mantle lid, and (3) rapid
anisotropy variations.

157
ACKNOWLEDGMENTS
The authors are grateful for the help and assistance of our colleagues E. Zor, R. Gok,
T. Bekler, S. Kuleli, K. AlDamegh, G. Brew, A. Calvert, C. Brindisi, and F. Gomez.
Special thanks to T. Hearn for his help and assistance in using the Pn tomography
code. We are thankful for the help of the federal and local governments of Turkey
during the installation of our seismic network. We also acknowledge the very helpful
field assistance provided by the engineers of the IRIS/PASSCAL Instrument Center at
New Mexico Tech. This research is supported by the National Science Foundation
(Grant No. EAR9804780) and Bogazici University Research Fund (Grant No.
99T206).

158
REFERENCES Anderson, D.L. 1961. Elastic wave propagation in layered anisotropic media. Journal
of Geophysical Research, v. 66, p. 29532963.
Angelier, J., N. Lyberis, X.L. Pichon and P. Huchon 1982. The tectonic development of the Hellenic arc and the Sea of Crete: A synthesis. Tectonophysics, v. 86, p. 159 196.
Backus, G.E. 1965. Possible forms of seismic anisotropy of the uppermost mantle under oceans. Journal of Geophysical Research, v. 70, no. 14, p. 34293439.
Beghoul, N. and M. Barazangi 1990. Azimuthal anisotropy of velocity in the mantle lid beneath the Basin and Range Province. Nature, v. 348, no. 6301, p. 536538.
Beghoul, N., M. Barazangi and B.L. Isacks 1993. Lithospheric structure of Tibet and western North America; mechanisms of uplift and a comparative study. Journal of Geophysical Research, v. 98, no. 2, p. 19972016.
Bozkurt, E. 2001. Neotectonics of Turkey a synthesis. Geodinamica Acta : The Europian Journal of Geodynamics, v. 14, no. 13, p. 330.
Calvert, A., E. Sandvol, D. Seber, M. Barazangi, F. Vidal, G. Alguacil and N. Jabour 2000. Propagation of regional seismic phases (Lg and Sn) and Pn velocity structure along the AfricaIberia plate boundary zone: tectonic implications. Geophysical Journal International, v. 142, p. 384408.
Dewey, J.F., W.C. Pitman, W.B.F. Ryan and J. Bonnin 1973. Plate tectonics and the evolution of the Alpine system. Geological Society of America Bulletin, v. 84, p. 31373180.
Grand, S.P. 1990. A possible station bias in travel time measurement reported to ISC. Geophysical Research Letters, v. 17, p. 1720.
Hearn, T.M. 1996. Anisotropic Pn tomography in the western United States. Journal of Geophysical Research, v. 101, no. B4, p. 84038414.
Hearn, T.M. 1999. Uppermost mantle velocities and anisotropy beneath Europe. Journal of Geophysical Research, v. 104, no. B7, p. 15,12315,139.
Hearn, T.M. and J.F. Ni 1994. Pn velocities beneath continental collision zones: the TurkishIranian Plateau. Geophysical Journal International, v. 117, p. 273283.
Hempton, M.R. 1982. The North Anatolian Fault and complexities of continental escape. Journal of Structural Geology, v. 4, p. 502504.

159
Hempton, M.R. 1985. Structure and deformation history of Bitlis suture near lake Hazar, southeastern turkey. Bulletin of Geological Society of America, v. 96, p. 233243.
Hempton, M.R. 1987. Constraints on Arabian plate motion and extensional history of the Red Sea. Tectonics, v. 6, no. 5, p. 687705.
Ismail, W.B. and D. Mainprice 1998. An olivine database: An overview of upper mantle fabric and seismic anisotropy. Tectonophysics, v. 296, p. 145157.
Jackson, J. 1994. Active tectonics of the Aegean region. Annual Review of Earth and Planetary Sciences, v. 22, p. 239271.
Karato, S.I. 1998. Seismic anisotropy in the deep mantle, boundary layers and the geometry of mantle convection. Pure and Applied Geophysics, v. 151, p. 565587.
Keller, G.R., C. Prodehl, J. Mechie, K. Fuchs, M.A. Khan, P.K.H. Maguire, W.D. Mooney, U. Achauer, P.M. Davis, R.P. Meyer, L.W. Braile, I.O. Nyambok and G.A. Thompson 1994. The East African Rift system in the light of KRISP 90. Tectonophysics, v. 236, p. 465483.
Kendall, J.M. 2000. Seismic anisotropy in the boundary layers of the mantle. In S.i. Karato, A.M. Forte, R.C. Liebermann, G. Masters and L. Stixrude (Eds.), Deep Earth Interior: Mineral physics and tomography from the atomic to the global scale, American Geophysical Union, Geophysical Monograph 117, p. 115159.
Keskin, M., J.A. Pearce and J.G. Mitchell 1998. Volcanostratigraphy and geochemistry of collisionrelated volcanism on the ErzurumKars Plateau, northeastern Turkey. Journal of Volcanology and Geothermal Research, v. 85, p. 355404.
Kocyigit, A. and O. Erol 2001. A tectonic escape structure: Erciyes pullapart basin, Kayseri, centarl Anatolia, Turkey. Geodinamica Acta, v. 14, no. 13, p. 133145.
Le Pichon, X. and J. Angelier 1979. The Hellenic arc and trench system: A key to the neotectonic evolution of the eastern Mediterranean area. Tectonophysics, v. 60, p. 142.
Mainprice, D., G. Barruol and W.B. Ismail, Eds. (2000). The seismic anisotropy of the Earth's mantle: From single crystal to polycrystal. Earth's Deep Interior: Mantle physics and tomography from the atomic to the global scale, American Geophysical Union.
160
Mainprice, D. and A. Nicolas 1989. Development of shape and lattice preferred orientations: application to the seismic anisotropy of the lower crust. Journal of Structural Geology, v. 11, p. 175189.
Makris, J. and R. Vees 1977. Crustal structure of the central Aegean Sea and the islands of Evia and Crete, obtained by refractional seismic experiments. J. Geophys., v. 42, p. 329341.
McClusky, S., S. Balassanian, et al. 2000. Global positioning system constraints on plate kinematics and dynamics in the eastern Mediterranean and Caucasus. Journal of Geophysical Research, v. 105, no. 3, p. 56955719.
McKenzie, D. 1972. Active tectonics of the Mediterranean region. Geophysical Journal of the Royal Astronomical Society, v. 30, p. 109185.
Mckenzie, D. 1978. Active tectonics of the AlpineHimalayan belt: The Aegean Sea and surrounding regions. Geophys. J. R. Astron. Soc., v. 55, p. 217254.
Menke, W.H. and P.G. Richards 1980. Crustmantle whispering gallery phases: A deterministic model of teleseismic Pn wave propagation. Journal of Geophysical Research, v. 85, no. B10, p. 54165422.
Paige, C.C. and M.A. Saunders 1982. LSQR: Sparse linear equations and least squares problem. ACM Transactions on Mathematical Software, v. 8, no. 2, p. 195209.
Sandvol, E., K. AlDamegh, A. Calvert, D. Seber, M. Barazangi, R. Mohamad, R. Gok, N. Turkelli and C. Gurbuz 2001a. Tomographic imaging of Lg and Sn propagation in the Middle East. Pure and Applied Geophysics, v. 158, p. 1121 1163.
Sandvol, E., D. Seber, A. AlLazki, M. Barazangi, N. Turkelli, E. Zor, R. Gok, T. Bekler, G. Orgulu, H. Karabulut, C. Gurbuz, S. Kuleli and S. Bayraktutan 2001b. Crustal and upper mantle seismic velocity structure in eastern Anatolia: results from the eastern Turkey PASSCAL seismic experiment. Eos, Trans. Am. Geoph. Un, v. 82, no. 47.
Sato, H., I.S. Sacks and T. Murase 1989. The use of laboratory data for estimating temprature and partial melt fraction in the low velocity zone: Comparison with heat flow and electrical conductivity studies. Journal of Geophysical Research, v. 94, p. 56895704.
Savage, M.K. 1999. Seismic anisotropy and mantle deformation: What have we learned from shear wave splitting? Reviews of Geophysics, v. 37, no. 1, p. 65106.

161
Sengor, A.M.C., N. Gorur and F. Sargolu 1985. Strikeslip faulting and related basin formation in zones of tectonic escape: Turkey as a case study. In K.T. Biddle and N. ChristieBlick (Eds.), Strikeslip faulting and basin formation, Society of Econ. Paleontol. Mineral. Special Publication, 37, p. 227264.
Sengor, A.M.C. and Y. Yilmaz 1981. Tethyan evolution of Turkey: a plate tectonic approach. Tectonophysics, v. 75, p. 181241.
Silver, P.G. and W.W. Chan 1988. Implication for continental structure and evolution from seismic anisotropy. Nature, v. 335, p. 3439.
Smith, G.P. and G. Ekstrom 1999. A global study of Pn anisotropy beneath continents. Journal of Geophysical Research, v. 104, no. B1, p. 963980.
Snyder, D. and M. Barazangi 1986. Deep crustal structure and flexure of the Arabian plate beneath the Zagros collisional mountain belt as inferred from gravity observations. Tectonics, v. 5, no. 3, p. 361373.
Sonder, L.J. and P.C. England 1989. Effects of a temperaturedependent rheology on largescale continental extension. Journal of Geophysical Research, v. 94, no. B6, p. 76037619.
Takin, M. 1972. Iranian Geology and continental drift in the Middle East. Nature, v. 235, p. 147150.
Walker, D. 1977. Highfrequency Pn phases observed in the Pacific at great distances. Science, v. 19, p. 257259.
Yilmaz, Y. 1990. Comparison of young volcanic associations of western and eastern Anatolia formed under a compressional regime: a review. Journal of Volcanology and Geothermal Research, v. 44, p. 6987.


![Crustal and uppermost mantle structure in the central …ciei.colorado.edu/pubs/2013/jgrb50321.pdfVanSchmusetal.[1993]andCannon[1994]attributedthese features to a postrifting compressional](https://img.pdfslide.us/doc/110x75/5af5d0537f8b9a5b1e8e50aa/crustal-and-uppermost-mantle-structure-in-the-central-ciei-1993andcannon1994attributedthese.jpg)