Embed Size (px)
Citation preview
Crust and upper mantle structures of the Makran
subduction zone in south-east Iran by seismic ambient
noise tomography
M. Abdetedal1, Z. H. Shomali2 and M. R. Gheitanchi3
[1]{Institute of Geophysics, University of Tehran, Iran}
[2]{Department of Earth Sciences, Uppsala University, Uppsala, Sweden}, {Institute of
Geophysics, University of Tehran, Iran}
[3]{Institute of Geophysics, University of Tehran, Iran}
Correspondence to: Z. H. Shomali, [email protected]
Abstract
We applied seismic ambient noise surface wave tomography to estimate Rayleigh wave
empirical Green’s functions from cross-correlations to study crust and uppermost mantle
structure beneath the Makran region in south-east Iran. We analysed 12 months of continuous
data from January 2009 through January 2010 recorded at broadband seismic stations. We
obtained group velocity of the fundamental mode Rayleigh-wave dispersion curves from
empirical Green’s functions between 10 and 50 s periods by multiple-filter analysis and
inverted for Rayleigh wave group velocity maps.
The final results demonstrate significant agreement with known geological and tectonic
features. Our tomography maps display low-velocity anomaly with south-western north-
eastern trend, comparable with volcanic arc settings of the Makran region, which may be
attributable to the geometry of Arabian Plate subducting overriding lithosphere of the Lut
block. At short periods (<20s) there is a pattern of low to high velocity anomaly in northern
Makran near the Sistan Suture Zone. These results are evidence that surface wave tomography
based on cross correlations of long time-series of ambient noise yields higher resolution group
speed maps in those area with low level of seismicity or those region with few documented
1
1
2
3
4
5
6
7
8
9
10
11
12
13
14
15
16
17
18
19
20
21
22
23
24
25
26
27
1
large or moderate earthquake, compare to surface wave tomography based on traditional
earthquake-based measurements.
1 Introduction
The Iranian plateau is subject to several tectonic episodes, including active stages of intense
folding e.g., in the Zagros region, faulting and different types of tectonic domains. Makran
subduction zone is located in the south-east of Iran, from the Main Zagros Thrust (MZT) to
the western end of the Makran wedge and to the Ornach-Nal and Chaman fault zones in
south-western Pakistan, see Fig. 1. The transition between the Zagros continental-continental
collision and the western Makran subduction zone is marked by the Minab fault (see Fig. 1).
This subduction complex has been formed by the subduction of oceanic crust of the Arabian
Plate under the Eurasian Plate probably initiated from the Paleocene (Platt et al., 1988) and
accreted since Eocene (Byrne et al., 1992). Arabian plate is being subducted beneath Eurasian
plate along deformation front (Fig. 1a). The Eurasian Plate is dominated by the Lut block to
the west and the Helmand block to the east separated by the Sistan Suture Zone which
represents the subduction of Neotethys beneath the Helmand Block (Sengor et al., 1988;
Byrne et al., 1992; Berberian et al., 2000). The Sistan oceanic domain is interpreted as a
backarc setting or a branch of the Neo-Tethys (Tirrul et al., 1983) formed during Middle–Late
Cretaceous and was later closed during Paleocene–Eocene time through subduction. A
number of essentially non-metamorphic ophiolitic remnants are found in the upper plate
which represents backarc setting (Agard et al., 2006; Agard and Monié, 2009).
The latest activity in the Makran subduction occurred throughout Late Miocene and has
propagated up to now (Platt et al., 1985; Platt et al., 1988). The Arabian Plate convergence
rate is approximately 23-25 mm/yr in a northerly direction towards Eurasia according to GPS
measurements (Bayer et al., 2003; McClusky et al., 2003; Vernant et al., 2003; Bayer et al.,
2003; Masson et al., 2007). At the eastern boundary of Makran the convergence rate estimated
by DeMets et al., 1990 increases to 42.0 mm/yr. Convergence between the Arabia and Eurasia
is evidently taken up by rifting in the Red Sea with the spreading centre of the Murray Ridge
(Kukowski et al., 2000) which extends at the rate of 0.2 cm/yr (DeMets etal., 1990) see Fig.
1a, (inset map). This rifting divides the Arabian Plate, by Sonne Fault, a sinistral strike slip
fault, which causes the eastern part of the Arabian Plate moves northward (Kukowski et al.,
2000).
2
1
2
3
4
5
6
7
8
9
10
11
12
13
14
15
16
17
18
19
20
21
22
23
24
25
26
27
28
29
30
31
32
1
The level of seismicity in Makran is low and increases from west to east. The west and east
parts of subduction zone of Makran have different seismic and tectonic characteristics
(Byrne et al., 1992; Zarifi 2006) e.g., see Fig. 1a. The western part which is in the Iran
plateau has an abnormally very low level of deep seismicity. The Makran subduction
zone subducts at a higher convergence rate compared with the continental collision part
of Arabian Plate boundary, the Zagros Suture Zone, and this convergence rate is
increasing from west towards east of Makran (Vernant et al., 2003). The distance of the
volcanic arc and forearc setting increases eastward, suggesting that the slab is dipping
shallower eastward (Byrne et al., 1992; Zarifi, 2006). However, due to the lack of
presence of large earthquakes in western Makran, the seismic potential of the region is
much debated (Fig. 1)
The intermediate depths seismicity related to western Makran within the downgoing plate are
different from the dominant shallower seismicity of the Zagros region (Fig.1b). Across the
Sistan Suture Zone this seismicity pattern changes to low seismicity condition compared
to the Zagros region. Recent and active deformation in Sistan is dominated by right-
lateral strike-slip and thrust faults, related to the indentation of Iran by the Arabian
shield (Berberian et al., 2000). Large earthquakes with surface rupture are known
further north in the Sistan Suture Zone including the Mw 7.2 Zirkuh earthquake of
1997 (Berberian et al., 1999). The seismic activity in the mountain ranges including Taftan-
Bazman volcanic arc is very weak. In 1979 several right-lateral moderate-sized earthquake
occurred between the Lut and Helmand blocks while inside these two blocks there is little
seismicity. This seismic activity makes the possibility that the Sistan Suture Zone plays a role
in the segmentation between eastern and western Makran, therefore the continuity of this
structure could be defined as a boundary between western and eastern Makran (Byrne et al.,
1992). To the east the distance of the volcanic arc and forearc setting increases, this suggests
that the slab is dipping shallower eastward (Byrne et al., 1992; Zarifi, 2006; Shad Manaman et
al., 2011). The eastern part of Makran has relatively lowered dips comparing to the western
part (Zarifi, 2006). Eastern Makran, experienced most of its seismic activity near Chaman and
Ornach-Nal Faults (Zarifi, 2006).
In Makran subduction zone only few seismic tomography have been studied especially on the
structure of the upper mantle. Most of the tomographic studies performed on the Makran
region are limited to the global tomography surveys with low resolution and there are few
3
1
2
3
4
5
6
7
8
9
10
11
12
13
14
15
16
17
18
19
20
21
22
23
24
25
26
27
28
29
30
31
32
1
shallow seismic investigation of sedimentary structure of the Makran belt that reveal
heterogeneity of crust and upper mantle. Regional tomographic studies of the Iranian plateau
do not provide detailed information of structures in crust and upper mantle due to the lack of
well-documented earthquakes in Makran region and limited lateral resolution e.g. the order of
200 km (Maggi et al., 2005) and the order of 60-100 km (Shad Manaman et al., 2011).
Seismic ambient noise tomography yields results with resolution higher than traditional
surface waves tomography methods. The purpose of this study is to produce Rayleigh
wave group velocity maps with higher resolution than previous surface wave maps that
have been produced in the Makran region in order to study the crust and the upper
mantle structures/transitions in the Makran subduction zone. Compared to our
understanding of active tectonics, much less is known about the Makran subduction
zone and the seismic behaviour of the Makran subduction zone has remained largely
unknown. Also there are basic limitations to earthquake-based surface wave
tomography because of seismicity and poor station coverage.
Study of ambient noise seismic waves mitigates some of the problems affecting traditional
surface wave measurements. Recent theoretical works demonstrate that under the assumption
that seismic noise wave-field is diffuse, the empirical Green’s function between two stations
can be estimated by correlating noise recordings from these two sites (Weaver and Lobkis,
2001, 2003; Derode et al., 2003; Snieder, 2004; Wapenaar, 2004; Larose et al., 2005).
Recent studies show that the use of ambient noise to extract surface wave empirical
Green’s functions (EGFs) to infer Rayleigh and Love waves can provide important
information about the 3D shear wave velocity structure in the upper mantle both on a
global and regional scales. Shapiro and Campillo, 2004, inferred Rayleigh wave group
velocity map from ambient noise data recorded in station-pair separated by distances
from about one hundred to more than two thousand kilometres. Cho et al., 2007 and
Yan et al., 2007, also inferred group velocity maps at a regional scale. Shapiro et al.,
2005 and Sabra et al., 2005, extracted time-domain Green’s function from ambient
seismic noise at a local scale. Lin et al., 2008, presented seismic ambient noise
tomography for love wave. Nishida et al., 2008 also analysed Love waves to study seismic
ambient noise tomography, including the crustal overtones.
4
1
2
3
4
5
6
7
8
9
10
11
12
13
14
15
16
17
18
19
20
21
22
23
24
25
26
27
28
29
30
31
1
2 Method and data processing
In this study we perform the ambient noise tomography at periods from about 10 s to 50
s from the recordings of 41 stations between January 1, 2009 to January 1, 2010 to
measure dispersion curves of the fundamental mode of Rayleigh waves extracted from
the ambient noise, and then invert them to obtain a 2D group velocity image for crustal
and upper mantle structures of the region. We also studied the directionality and
seasonal variations of the noise sources. The difference between the causal and acausal
parts of the cross correlation results of station pairs was studied to measure the main
direction of the energy flux across the region. Finally, the resulting group velocity maps
for the Makran region prepared and interpreted.
This study is based on a variety of seismic sensor data from digital broadband instrument
(BH) recordings from the International Institute of Earthquake Engineering and Seismology
(IIEES), equipped with a CMG-3T broadband sensor (0.01-100 s) and also seismic data from
the Global Seismic Network (GSN), the Virtual European Broad-band Seismic Network
(VEBSN), the global seismograph network stations (GEOFON) and Tajikistan National
Seismic Network (TJ), as depicted in Fig. 1a, (inset map). We calculated EGFs for one
year of continuous vertical component seismograms recorded from January 1, 2009 to January
1, 2010. Using vertical-component seismic data implies that the resulting cross-correlations
contain only Rayleigh wave signals. We followed the data processing procedure as described
in detail by Bensen et al., 2007. First, we cut the continuous noise data into 1 day data files,
and then we chose those data with gaps less than 10 s. The instrument responses were then
removed from all the data, following by decimating the data to one sample per second to
reduce the amount of storage space and computational time required. The next step involved
removing the trend and mean value, zero-phase Butter-worth high-pass filtering with a corner
frequency of 0.01 Hz, whitening and bandpass filtering around the target frequency (between
10 s to 50 s period) as a function of inter-station distance (Cho et al., 2007; Pedersen et al.,
2007). The next processing step included temporal or time-domain normalization in order to
remove the furthermore contaminating effects of earthquakes on the noise correlations
(Bensen et al., 2007). Various methods of applying time domain normalization were described
by Bensen et al., 2007, however, we decided to use time-domain one-bit normalization for our
purposes. In one-bit normalization only the sign of the signal is retained and by all positive
amplitudes are replaced with a 1 and all negative amplitudes with a -1. Cross-correlations
5
1
2
3
4
5
6
7
8
9
10
11
12
13
14
15
16
17
18
19
20
21
22
23
24
25
26
27
28
29
30
31
32
1
were then calculated for each station pair, and the results were then stacked over the total time
period available for each pair to produce the resulting time-series.
To evaluate the quality of the stability of the stacking process quantitatively, we calculated the
signal-to-noise ratio (SNR) for each cross-correlation. SNR is defined as the ratio of the peak
amplitude within a time window around the expected arrival time of the fundamental mode
Rayleigh waves at a given period to the root-mean-square of noise trailing the signal arrival
window (Bensen et al., 2007). The signal window is determined using the arrival times of
Rayleigh waves at the minimum and maximum periods of the chosen passband frequency. All
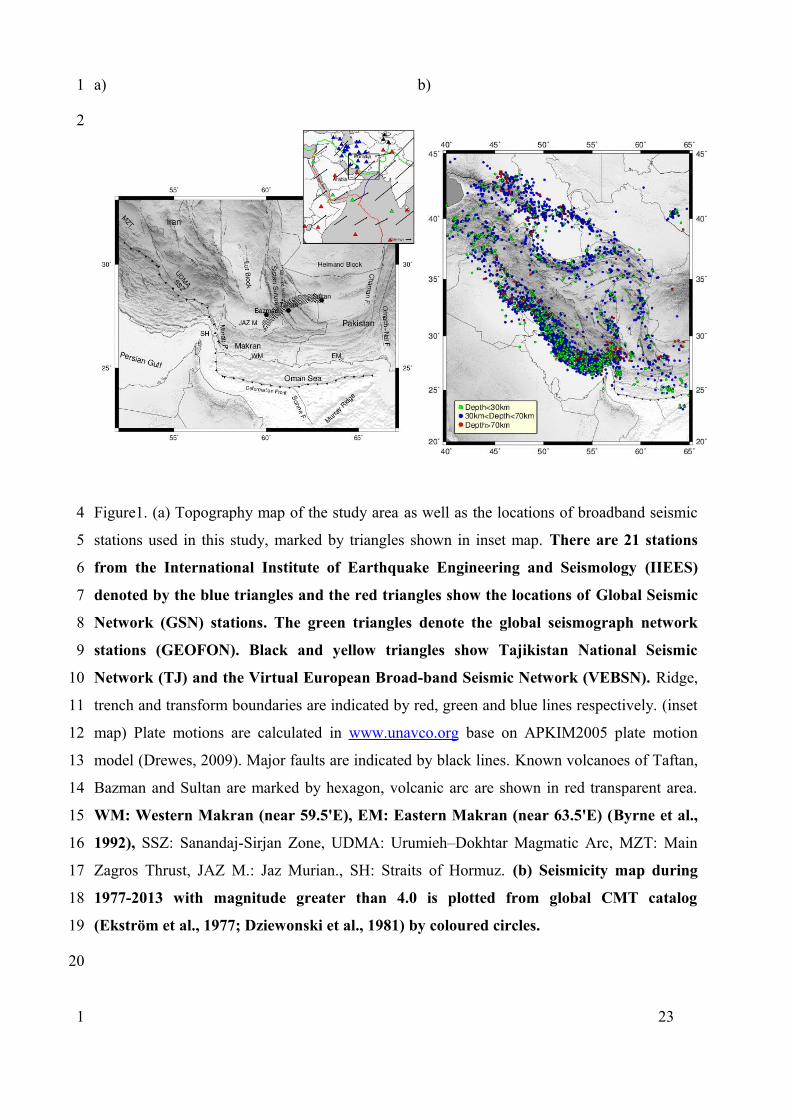
empirical Green's functions in the 10-50 s period band are plotted in Fig. 2 to evaluate
the quality of the cross-correlation functions. Both positive and negative correlation lags
show clear surface waves with an average apparent velocity of about 3 km/s. The group
velocities used to predict arrival times were calculated from AK135 velocity model, (Kennett,
1995). Fig. 3 shows an example of broad-band cross correlation for one station pair GHIR-
BNDS filtered into three frequency sub-bands. Rayleigh waves emerge clearly in each
frequency band with the earlier arriving waves being at longer periods. The resulting cross
correlations are time functions with two lags. Although the two signals coming from opposite
directions sample the same structure along the path linking the station pair but, the noise
characteristics in the two directions may be very different, consequently the cross correlations
differ in their spectral content appreciably. Therefore asymmetric cross correlation occurs and
in our study it is very common, because sources of microseism are likely associated with
coastlines, and the seismic noise is generated by the nonlinear interaction of the ocean swell
with the coast (Longuet-Higgens, 1950; Stehly et al., 2006) which in our study it is related to
Oman Sea and Persian Gulf. To enhance the SNR, we measured signal-to-noise levels by
applying a series of narrow bandpass filters for each station pair. The prediction window is
defined by expected Rayleigh wave group times taken from the model of Shad Manaman et
al., 2011. We also measured the RMS noise level in a 500 s noise window at the end of the
signal.
3 Directionality
In practice sometimes for different frequency bands, the ambient seismic noise are not
meeting the theoretical requirements i.e., the observed distribution of ambient noise is far
from homogeneous and this is what concerns seismologists (Stehly et al., 2006; Pedersen et
6
1
2
3
4
5
6
7
8
9
10
11
12
13
14
15
16
17
18
19
20
21
22
23
24
25
26
27
28
29
30
31
32
1
al., 2007). We observe that negative and positive parts of the cross correlation may strongly
differ in amplitude (e.g., see Fig. 3). Therefore we need to find out whether ambient noise
is well enough distributed in azimuth to return unbiased dispersion measurements for
use in tomography. Based on phase speed measurements from a three-station method,
Lin et al., 2008 present evidence that ambient noise is distributed sufficiently
isotropically in the frequency band they consider (6– 40 s period), so that phase velocity
measurements are returned largely unbiased. To quantify the effect of strongly
anisotropic background noise source distribution, Yang and Ritzwoller, 2008 performed
synthetic experiments and they found that in the presence of low level homogeneously
distributed ambient noise, less than 0.5% of measured phase velocities is affected by
much stronger ambient noise in an off-axis direction. According to Yang and Ritzwoller,
2008 we need to show that in all period ranges studied the useful amount of ambient
noise signals in all azimuths are above 50%.
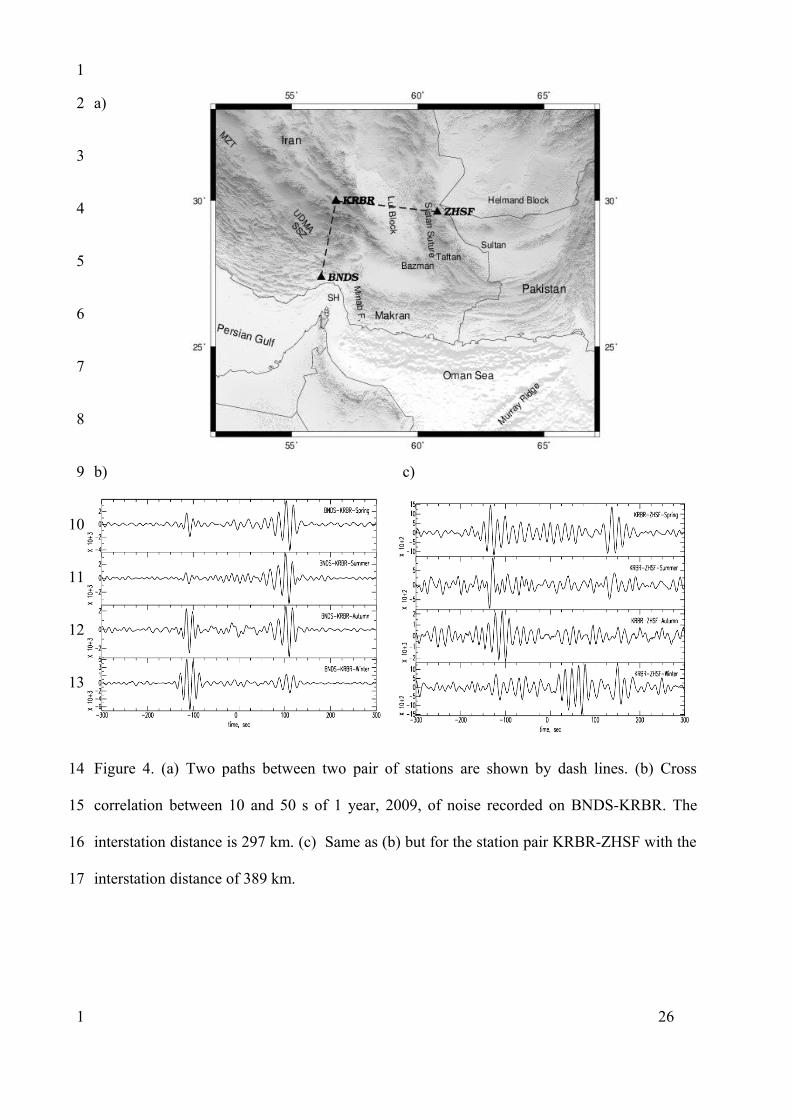
Seasonal variation of the cross-correlations for a period of 10-50 s were computed for two
station pairs perpendicular to each other (south-to-north BNDS-KRBR and west-to-east
KRBR-ZHSF), separated 297 and 389 km and are depicted in Fig. 4. One of our main
motivations to study the seasonal variability of the relatively continuous noise (between 10
and 50s) was to have a better understanding of the distribution of noise source in space and
time, which is needed for optimization of the noise-based seismic tomography. Using several
networks inside and outside Iran, we determine the direction of the average azimuthal
distribution of incoming ambient noise. Results of our analysis show that the sources of the
microseism exhibit variability in time but significant amount of ambient noise e.g. more than
at least 51% exist in all period studied. Before computing cross correlations, records were
band passed between 10-50 s the cross correlations were computed for different months.
Positive time delay indicates waves propagating from coastlines to continent (BNDS to
KRBR), whereas negative time indicates waves propagating from continent to coast (KRBR
to BNDS). For other pair of stations the positive lags indicates signals coming from KRBR to
ZHSF and from ZHSF to KRBR for negative time lags. Considering this period band (10 to
50 s) the cross correlations exhibit a clear seasonal variation (Fig. 4). In the spring and
summer periods, the result of cross correlations for the N–S station pair are dominated by
energy travelling from the coastline, as is evident from the one-sided cross correlation
functions. In autumn the cross-correlation shows fairly symmetry from indicating a similar
energy flux into the array from coastlines or continent. In winter time, the apparent
7
1
2
3
4
5
6
7
8
9
10
11
12
13
14
15
16
17
18
19
20
21
22
23
24
25
26
27
28
29
30
31
32
33
1
asymmetry of the data indicates that energy coming from the continent is much larger than
from the coastlines. All this shows that an important contribution of the noise observed in the
Makran region is coming from the south, coastlines, likely its source in the Persian Gulf and
Oman Sea.
For another pair of stations (KRBR-ZHSF) directionality is significant but with different
characteristics. In spring and summer it does not seem to have a preferred directionality,
however there is a clear pattern in autumn indicating that energy flux is coming from east to
the west and is completely opposite in winter.
To investigate the directions of the incoming ambient noise, we plotted the azimuthal
distribution of SNR for the positive and negative components of each cross correlation for the
four period bands 10-20, 20-30, 30-40 and 40-50 s in the northern winter (Oct. to Mar.) and
northern summer (May to Sept.) of 2009 (Fig. 5). Length of each line is the amplitude of
signal and the angel points in the direction from which the energy arrives. Each 20° azimuth
bin shows number of paths for both inter-station azimuth (causal) and back-azimuth (acausal)
parts of the cross correlation functions. Following Bensen et al., 2008, the average of
Rayleigh wave EGFs with SNR>10 were computed at all four periods, then in order to
compute the average fraction of yearly EGFs the number of paths with SNR >10 in a given
20° azimuth bin were divided by the total number of paths in that bin. The averaging results
over all azimuths, at four period bands of 10-20, 20-30, 30-40 and 40-50 s were of 0.53, 0.64,
0.69 and 0.51 respectively. In other words, these values reveal that the fraction of relatively
high SNR paths in all azimuths are above 50% in all period ranges studied and, hence, the
useful amount of ambient noise signals are sufficiently distributed in different azimuths.
Inspection of Fig. 5 reveals that the noise provenance has a clear directionality during the
whole year and most of the noise is coming from the north-east and the south-west (possibly
the coast). The main direction of the noise energy at all periods is similar and this similarity
suggests that the average microseism may originate from the same source as the longer-period
noise, which has been considered to be excited by the ocean waves.
4 Group velocity measurement
In the next step multiple-filter analysis (Herrmann, 2002) was used to measure group velocity
dispersion curves. Each of the frequency components of the surface wave is sensitive to
8
1
2
3
4
5
6
7
8
9
10
11
12
13
14
15
16
17
18
19
20
21
22
23
24
25
26
27
28
29
30
31
1
different depth interval. In general longer wavelength wave components which propagate
deeper will travel faster than the shallower ones because the seismic velocity of the Earth
increases radially downwards.
The technique known as phase-matched filtering was applied to determine the correct
dispersion curve. The waveforms were narrow band-pass-filtered with the operator exp[- α (f -
fc)2 / fc2], where fc is the centre frequency. There is a trade-off between resolution in the time
and frequency domains that is caused by filtering; larger values of α enhance the resolution in
the frequency domain, while it decreases resolution in the time domain (Herrmann 1973;
Levshin et al., 1989). We found α = 25 and 50 suitable for our measurements.
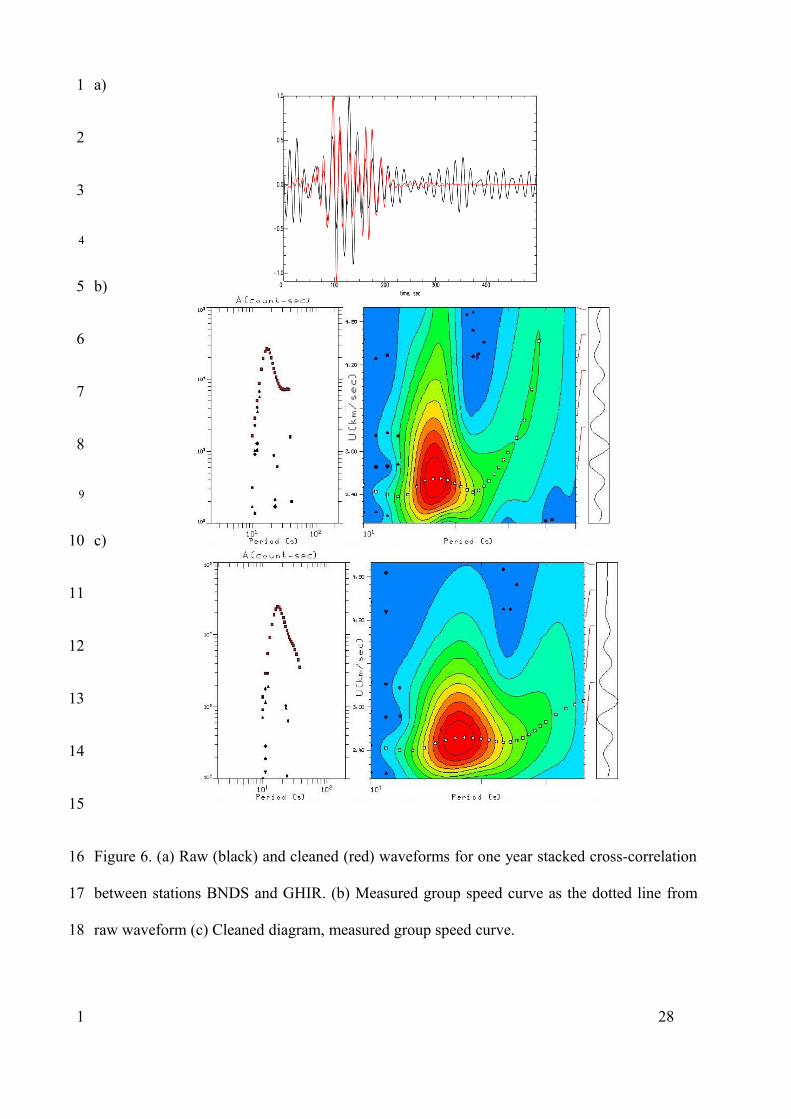
Fig. 6 shows the procedure graphically using the waveform obtained from 12-month
stacked cross-correlation between stations BNDS and GHIR. Fig. 6b illustrates the
dispersion ridge tracked as a function of period to obtain group speed curve. Then the
phase-matched filter is applied to clean the waveform. The cleaned waveform is
redispersed , following Bensen et al., 2007 and it is shown as the dotted line in Fig. 6c.
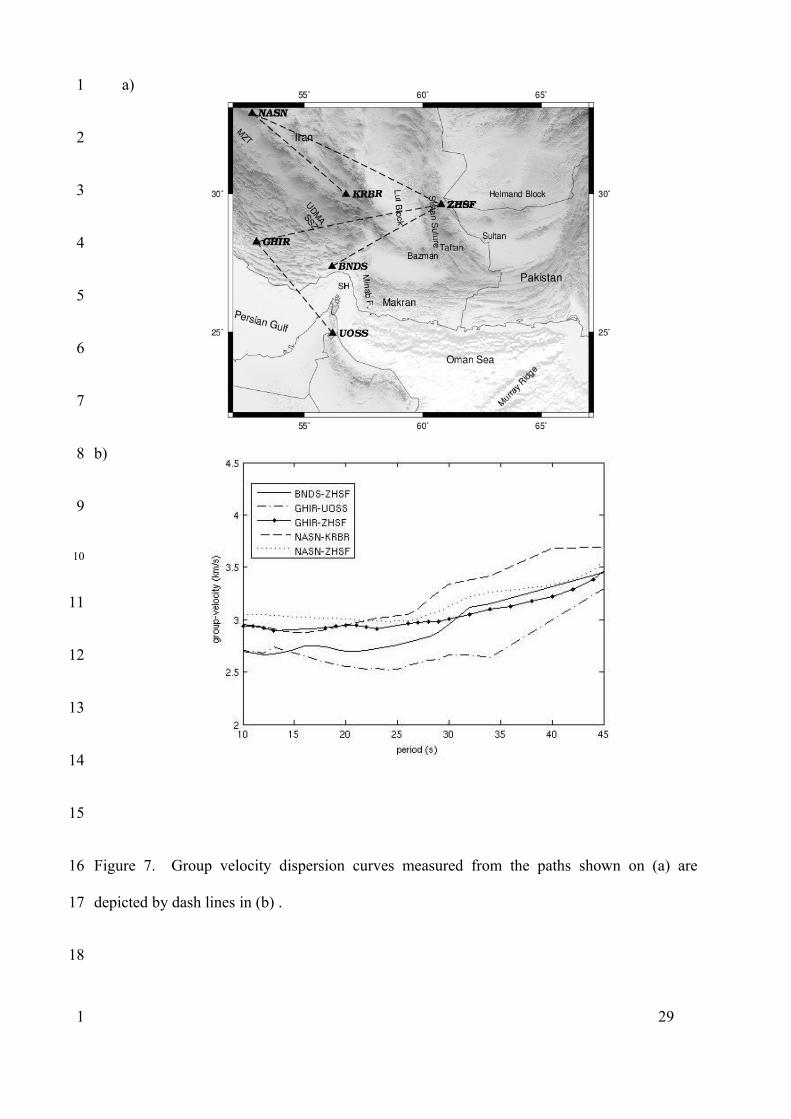
Selected dispersion curves were plotted in Fig. 7. The estimated uncertainties for group
velocities are based on seasonal variability due to the fact that dispersion measurements from
cross-correlations of ambient noise are naturally repetitive. To analyse the uncertainty we
selected 12 overlapping 3-month time-series for each station pair. The 3-month time windows
are reliable to obtain dispersion measurements and also contain the seasonal variation. Fig. 8
shows group velocity measurements for station pair BNDS-ZHSF with inter-station distance
of order of 513 km, obtained on twelve 3-month cross-correlations bandpass filtered from 10
to 50 s periods. The one year measurement is plotted as black line with the error bars
indicating the computed standard deviation. The uncertainty tends to increases with the
period, possibly because of decreasing amplitude of ambient noise above 20 s periods (Yang
et al., 2007). If the standard deviation was more than three times the average of the standard
deviations taken over all measurements, it was rejected as this indicates instability in the
measurement (Bensen et al., 2008).
5 Rayleigh wave tomography
We apply a 2-D tomographic inversion technique for calculating the group velocity variations
derived from the dispersion measurements of Rayleigh waves from 1 year cross-correlations,
9
1
2
3
4
5
6
7
8
9
10
11
12
13
14
15
16
17
18
19
20
21
22
23
24
25
26
27
28
29
30
31
1
recorded from January 1, 2009 to January 1, 2010. The main reason we used this data set was
the most data availability in this year. Before conducting ANT, we checked data availability
of all broadband stations inside and around Iran, and finally decided to use data from January
1, 2009 to January 1, 2010 because during this time-period continuous data from most stations
exist. We used the fast marching surface wave tomography (FMST), the iterative non-
linear inversion package developed by Rawlinson, 2005 and Rawlinson and Sambridge,
2005. This method includes the forward calculation and inversion procedure. The
inversion procedure is carried out with subspace method with the assumption of local
linearity. It is based on a local linearization of the problem about the current model to
seek the perturbation of the model parameters to match the group velocity
measurements. The inversion step allows both smoothing and damping regularization to
suppress the non-uniqueness of the solution. FMM is a grid-based numerical algorithm
base on the eikonal equation which is formulated to locate the first arrival phase of
surface waves rather than the group time. However, to describe the dissipation of the
group energy an eikonal solver can be used if multi-pathing is not included. In this case
the interfering waves cause the group energy to follow notably different paths.
Therefore when the phase and group velocities have similar geographic pattern
comparable results can be obtained (Arroucau et al. 2010; Saygin and Kennett 2010;
Young et al. 2011; Saygin and Kennett 2012). Young et al. 2011, obtained similar group
and phase velocity maps using FMM in south-eastern of Australia. The nonlinear
relationship between the travel-time and the group velocity could be explained by
applications of FMM and subspace inversions (Rawlinson 2005; Rawlinson and
Sambridge 2005). However, the nonlinearity is not significant for group velocity
measurements as compared to phase velocities because of great circle path
approximation, therefore the results produced by the first iteration were considered as
the optimal solutions (e.g., Shirzad et al., 2013).
The combination of the FMM for calculation of the forward problem and the subspace method
for inversion provides tomographic imaging. The potential resolution of the tomographic
results was evaluated with the checkerboard synthetic tests that used actual path distribution.
The synthetic travel times were calculated on a 1°×1° pattern size for 16, 20, 24, 30 and 40 s
with a maximum error of 5% noise signal with background velocity of 2.8 km/s, with
superimposed alternating high and low velocity anomalies as shown in Fig. 9. Checkerboard
test results of the observed data with optimal regularization parameters are shown in Figs. 10
10
1
2
3
4
5
6
7
8
9
10
11
12
13
14
15
16
17
18
19
20
21
22
23
24
25
26
27
28
29
30
31
32
33
1
and 11. The checkerboard results suggest that the resolution is fairly good in most periods,
however, for eastern and south-eastern part of the region, due to an inconvenient distribution
of stations the path coverage is not dense and most waves travel in parallel, therefore, the
resolution is limited and smearing effects are apparent in eastern part. As a rule of thumb,
surface-wave velocities are sensitive to structures at a depth of one-third of the wavelength
(e.g., Yang et al., 2007; Huang et al., 2010; Tibuleac et al., 2011) therefore the tomography
maps at different periods indicate the general features of structure at different depths. In
order to guide the interpretation, the sensitivity kernels for different periods were also
calculated from AK135 velocity model (Fig. 12a). In addition to shear wave speed (Vs)
we require P-wave speed (Vp) and density (ρ) as well for inversion. We use the average
continental Vp/Vs ratios of 1.75, from Yamini-Fard et al., 2007. Furthermore, surface
waves are less sensitive to Vp than Vs except in the uppermost crust. Density (ρ) is
assigned similarly using parameters of background model (AK135). Sensitivity kernels
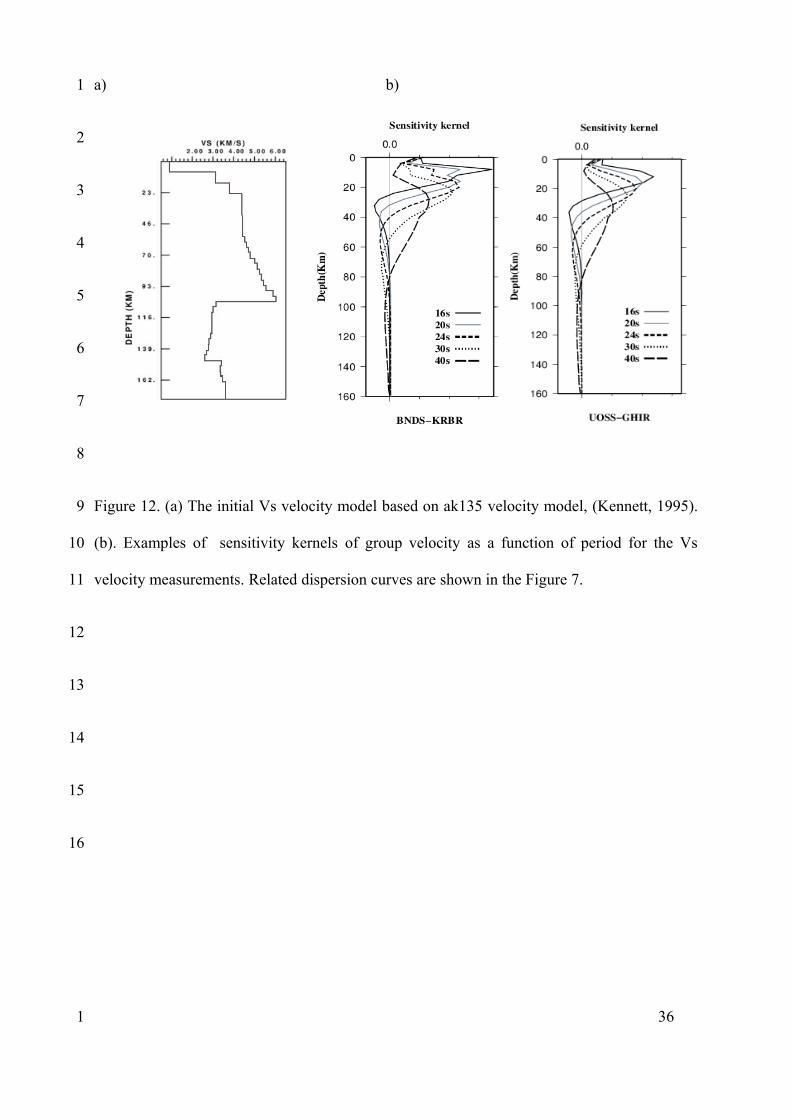
presented in Fig. 12b. The shortest period Rayleigh wave of 16 s has fair sensitivity to the
top 10 km and the longest period of 40 s has peak sensitivity at around 60 km depth and fair
sensitivity up to ∼80 km. Thus, using the dispersion curves from 16 to 40 s periods allows us
to constrain shear velocities from 10 km to ∼80 km depth.
6 Discussion
Few seismic tomography studies have been conducted on the crustal and upper mantle
structure of the Makran subduction zone. Giese et al., 1984 studied Moho depth using
refraction profile consisting of sparse recordings along a line from central Iran to the Straits of
Hormuz and indicated a crustal thickness of 40 km beneath central Iran. Using gravity
measurements and the seismic results of Giese et al., 1984, Dehghani and Makris, 1984
prepared the Moho map of the Iranian plateau and found that the crust beneath the Lut
depression is less than 40 km thick. Snyder and Barazangi, 1986 used the same data and found
the Moho depth almost 40 km beneath the Persian Gulf (Maggi and Priestley 2005). The
crustal thickness of the Makran region is less well known. There are few studies of deep
structure of the upper mantle in this area. Recent surface waveform tomography (Shad
Manaman et al., 2011) indicated that crustal thickness beneath the Oman seafloor and Makran
forearc setting is about 25-30 km, and is increasing to the volcanic arc. Moho depth increases
up to ∼48–50 km under the Taftan-Bazman volcanic arc (see Fig. 1a) where the subducting
11
1
2
3
4
5
6
7
8
9
10
11
12
13
14
15
16
17
18
19
20
21
22
23
24
25
26
27
28
29
30
31
32
1
plate bends. Again from the forearc setting to the volcanic arc in eastern Makran Moho depth
increases to ~40 km.
Seismic ambient noise tomography within the Makran region provides new images on the
crust and uppermost mantle in this region. Many of the prominent features in our results are
consistent with the known geological structures. The lateral resolution of the tomographic
maps obtained by seismic ambient noise tomography greatly depends on various parameters
including the path coverage and inter-station distances. In this study for the period range of 10
to 50 s, we kept only paths longer than 250 km (more than three wavelengths at 10 s).
Therefore we selected grid spacing to about 110 km.
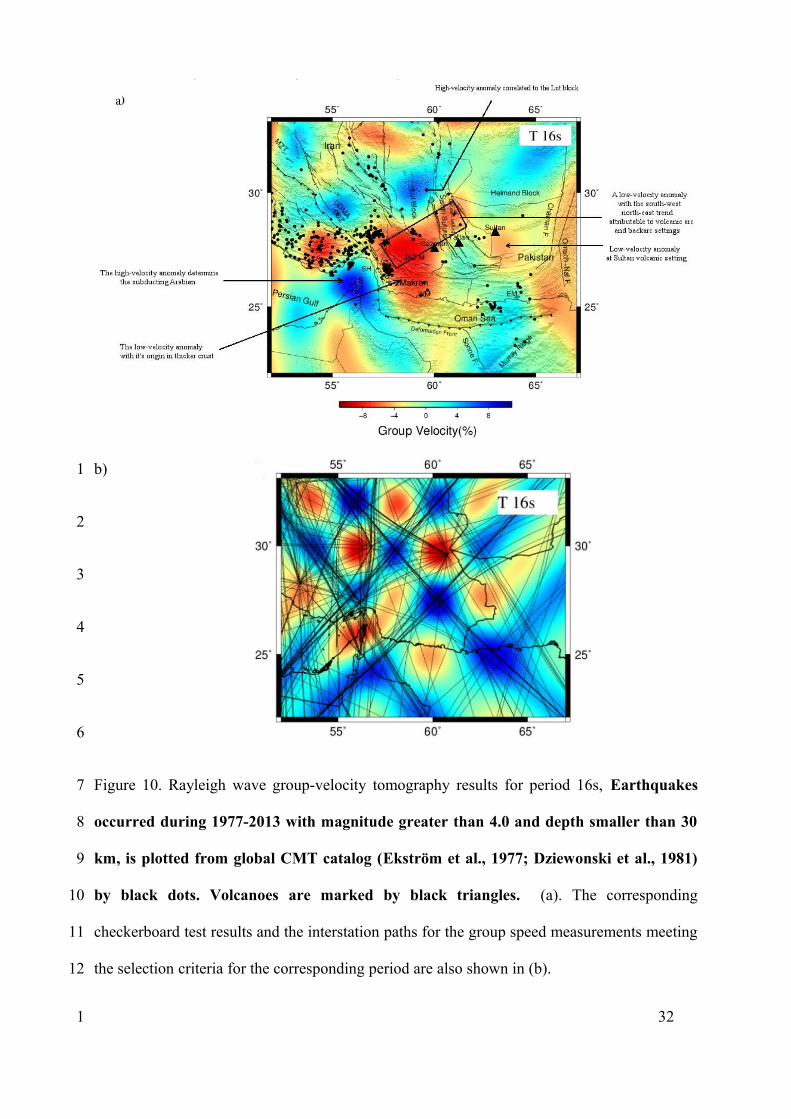
In the 16 s and 20 s maps, sensitive to the upper crust with approximately 25 to 30 km depth,
based on sensitivity curves in Fig. 12, there is a pronounced low-velocity anomaly extends
with the south-west north-east trend which is attributable to volcanic arc and backarc settings
of the Makran region, Bazman and Taftan volcanoes (see Figs. 10 and 11). Another low-
velocity anomaly is observable at Sultan volcanic setting; however this anomaly occurs at the
edges of the area with acceptable resolution. The trend of low-velocity anomaly indirectly
suggests geological and geophysical evidence for the geometry of slab. The northward
subducting Arabian Plate is determined by high-velocity anomaly along Straits of Hormuz in
this map. These low-velocity anomalies have their origin in thicker crust caused by a warm
lithosphere wedge overlying the subducting Arabian Plate, compared to the descending slab
that is older, denser and colder than the continental crust next to it. In central Makran
between the Sistan Suture Zone and the Lut block a transition from low to high velocity
is observable. Although Byrne et al., 1992 assumed that this suture zone separates Lut
and Helmand blocks, however, our results show that this suture dose not appear to
segment different blocks. At the western edge of Makran the Minab fault system with the
north-west trending is clearly depicted in 16 s and 20 s tomographic maps. The Minab fault as
an eastern edge of the Straits of Hormuz represents the boundary between continental crust of
the Arabian Plate to the west and oceanic crust of the Oman Sea to the east (White and Ross,
1979). The contrast between the sediments of Oman Sea in front of Makran deformation front
and the continental crust of downgoing plate is clearly indicated at the Minab fault system in
the map (Fig. 10) by a sharp transition boundary between low and high velocity zone.
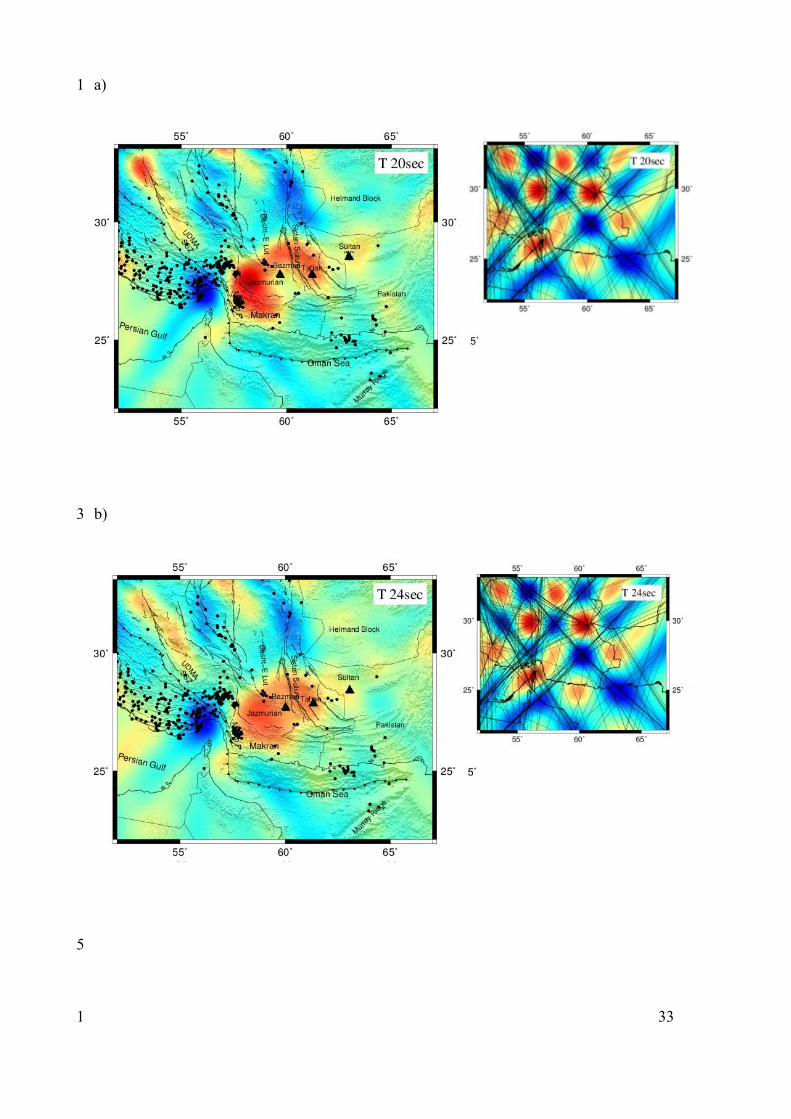
30 s and 40 s maps, shown in Fig. 11, are most sensitive down to a depth of approximately 60
to 80 km base on sensitivity curves in Fig. 12b, although these maps are of lower resolution
12
1
2
3
4
5
6
7
8
9
10
11
12
13
14
15
16
17
18
19
20
21
22
23
24
25
26
27
28
29
30
31
32
1
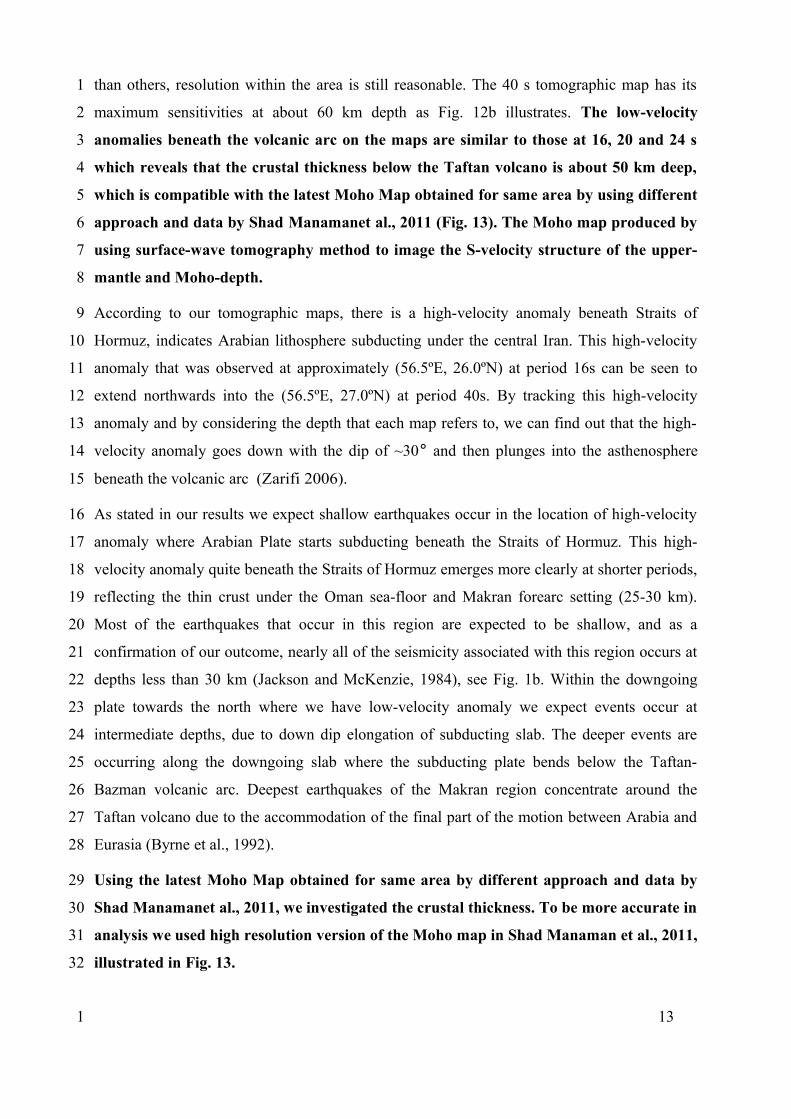
than others, resolution within the area is still reasonable. The 40 s tomographic map has its
maximum sensitivities at about 60 km depth as Fig. 12b illustrates. The low-velocity
anomalies beneath the volcanic arc on the maps are similar to those at 16, 20 and 24 s
which reveals that the crustal thickness below the Taftan volcano is about 50 km deep,
which is compatible with the latest Moho Map obtained for same area by using different
approach and data by Shad Manamanet al., 2011 (Fig. 13). The Moho map produced by
using surface-wave tomography method to image the S-velocity structure of the upper-
mantle and Moho-depth.
According to our tomographic maps, there is a high-velocity anomaly beneath Straits of
Hormuz, indicates Arabian lithosphere subducting under the central Iran. This high-velocity
anomaly that was observed at approximately (56.5ºE, 26.0ºN) at period 16s can be seen to
extend northwards into the (56.5ºE, 27.0ºN) at period 40s. By tracking this high-velocity
anomaly and by considering the depth that each map refers to, we can find out that the high-
velocity anomaly goes down with the dip of ~30° and then plunges into the asthenosphere
beneath the volcanic arc (Zarifi 2006).
As stated in our results we expect shallow earthquakes occur in the location of high-velocity
anomaly where Arabian Plate starts subducting beneath the Straits of Hormuz. This high-
velocity anomaly quite beneath the Straits of Hormuz emerges more clearly at shorter periods,
reflecting the thin crust under the Oman sea-floor and Makran forearc setting (25-30 km).
Most of the earthquakes that occur in this region are expected to be shallow, and as a
confirmation of our outcome, nearly all of the seismicity associated with this region occurs at
depths less than 30 km (Jackson and McKenzie, 1984), see Fig. 1b. Within the downgoing
plate towards the north where we have low-velocity anomaly we expect events occur at
intermediate depths, due to down dip elongation of subducting slab. The deeper events are
occurring along the downgoing slab where the subducting plate bends below the Taftan-
Bazman volcanic arc. Deepest earthquakes of the Makran region concentrate around the
Taftan volcano due to the accommodation of the final part of the motion between Arabia and
Eurasia (Byrne et al., 1992).
Using the latest Moho Map obtained for same area by different approach and data by
Shad Manamanet al., 2011, we investigated the crustal thickness. To be more accurate in
analysis we used high resolution version of the Moho map in Shad Manaman et al., 2011,
illustrated in Fig. 13.
13
1
2
3
4
5
6
7
8
9
10
11
12
13
14
15
16
17
18
19
20
21
22
23
24
25
26
27
28
29
30
31
32
1
Moho depth map in Fig. 13 reveals crustal thickness of about 45-50 km around the periphery
of Taftan-Bazman volcanic arc and Sistan Suture Zone associated with low-velocity anomaly
in 24, 30 and 40 s tomographic maps in Fig. 11. This low-velocity extended to the south up to
coastal region, giving the impression that the coastline is separated into two parts with
different characteristics, however checkerboard tests indicate smearing artefacts along this
region that likely causes this extension. Beneath the Oman Sea floor significant variations in
crustal thickness (20-25 km) can be observed consistent with high-velocity anomalies in lower
period maps. Another sharp increase in crustal thickness to about 50 km is under Sanandaj-
Sirjan Zone and Urmiah-Dokhtar Magmatic Arc (SSZ, UDMA; Fig. 13) which is in
accordance with low-velocity anomaly in 30 and 40 s period maps, however, due to limitation
in resolution, smearing effects the anomaly. According to our tomographic maps, at the
eastern edge of the Straits of Hormuz, the boundary between the thick continental and thin
oceanic crust of the Arabian plate, the subducted slab below the Makran belt is indicated with
high-velocity anomaly (Fig. 11), where thin crust expected, while the Moho map shows
approximately thick crust (35-45 km) (Fig. 13). As mentioned before the Straits of Hormuz is
the boundary between continental crust of the Arabian Shield and oceanic crust of the Oman
Sea and due to the fact that it is surrounded by different structural features such as Zagros fold
belt to the north-west, the Arabian platform to the south-east, the Makran region to the east
and the Oman Sea to the south, the Straits of Hormuz is considered as the most complicated
region. The underthrusting of different types of crust beneath the Eurasian Plate caused
different tectonic styles in this transition zone. This deformation zone accommodates and
transfers the convergence from the Eastern Zagros to the Makran subduction within a
transpressional tectonic regime at shallow depth (Yamini-Fard et al., 2007). The contrast
between the accretion of sedimentary cover the incoming plate in the Makran and evaporate
layers in the Zagros (Farhoudi, 1978) must contribute to the complicated tectonic styles and
reflects in tomographic results with the high-velocity anomaly in the region with unexpected
thick crust as shown in Fig. 10 and 11. Since the methodology and data is not very effective
in the tomography results (e.g., Yao et al., 2006) and also because of similarities between
our results and the results obtained by Shad Manamen et al., 2011 at main tectonic
structures such as Taftan-Bazman volcanic arc and Sistan Suture Zone, we came to the
conclusion that the difference at the eastern edge of the Straits of Hormuz is probably
due to resolution in the data. Results obtained by Shad Manamen et al., 2011 has poor
14
1
2
3
4
5
6
7
8
9
10
11
12
13
14
15
16
17
18
19
20
21
22
23
24
25
26
27
28
29
30
31
32
1
resolution in this region (2° × 2°), however, we reach to higher resolution in this region
(1° × 1°).
7 Conclusion
The following results were obtained from this study:
(1) In this research we described that in the Makran region sufficient noise energy can be
recorded at periods of 10 to 50 s, from which empirical Green's functions can be extracted. It
was also shown that Rayleigh wave Green's functions can be extracted by computing cross
correlations between records by using observations over 12 months at pairs of seismic
stations.
(2) Our results exhibit seasonal variability in the study area. This seasonal variation indicates
that the Green’s functions reconstructed by cross-correlation can be different in quality during
the summer and winter. Although we showed that coherent Rayleigh wave signals exist at all
periods and most azimuths across the Makran region, thus it is sufficiently isotropically
distributed in azimuth to reach accuracy in dispersion measurements when integrated over
long time such as year.
(3) In conclusion, various resolution tests showed that our data and methods are sufficient to
provide high resolution tomographic image of surface wave group velocities in the region.
Our group velocity maps show strong anomalies correlated with Arabian Plate subducting
under Eurasian Plate, volcanic arc, Lut block and Minab fault. At the shortest period, the
velocity images map matches quite well the surface geology and the main topographic
features. The trend of the velocity anomalies is consistent with the geometry of subducting
slab. These high-resolution maps provide valuable information on the structure and
seismotectonics in Makran and the group velocity anomalies are well correlated with known
geological features.
Acknowledgements
The seismic data used in this study were obtained from the GSN / IRIS Global Seismographic
Network (http://www.iris.edu/hq/programs/gsn), the Virtual European Broad-band seismic
Network (VEBSN) and international Institute of Earthquake Engineering and Seismology
15
1
2
3
4
5
6
7
8
9
10
11
12
13
14
15
16
17
18
19
20
21
22
23
24
25
26
27
28
29
30
1

(IIEES). Many of the figures in this paper were prepared using GMT (Wessel and Smith,
1998; www.soest.hawaii.edu/gmt, last accessed September 2013). We would like to thank Dr.
N. Shad Manaman (from Sahand University of Technology, Iran) for generously providing us
with his research results on the Moho depth and also Dr. N. Mirzaei (from University of
Tehran, Iran) for his valuable suggestions in this study. A special note of thanks goes to T.
Shirzad (from Islamic Azad University, Tehran, Iran) for his help and support. We also
appreciate the research council of Tehran University for their support of this research.
16
1
2
3
4
5
6
7
8
1
References
Agard, P., Monié, P., Gerber, W., Omrani, J., Molinaro, M., Meyer, B., Labrousse, L.,
Vrielynck, B., Jolivet, L., and Yamato., P.: Transient, synobduction exhumation of Zagros
blueschists inferred from P –T , deformation, time, and kinematic constraints: implications for
Neotethyan wedge dynamics, J. Geophys. Res.-Sol. Ea., 111, B11401,
doi:10.1029/2005JB004103, 2006.
Bayer, R., Shabanian, E., Regard, V., Doerflinger, E., Abbassi, M., Chery, J., Nilforoushan,
F.,Tatar, M., Vernant, P., and Bellier, O.: Active deformation in the Zagros–Makran transition
zone inferred from GPS measurements in the interval 2000–2002, Geophys. Res. Abstracts, 5,
05891, 2003.
Bayer, R., Chery, J., Tatar, M., Vernant, P., Abbassi, M., Masson, F., Nilforoushan, F., Doer-
flinger, E., Regard, V., and Bellier, O.: Active deformation in Zagros–Makran transition zone
inferred from GPS measurements, Geophys. J. Int., 165, 373–381, 2006.
Bensen, G. D., Ritzwoller, M. H., Barmin, M. P., Levshin, A. L., Lin, F., Moschetti, M. P.,
Shapiro, N. M., and Yang, Y.: Processing seismic ambient noise data to obtain reliable broad-
band surface wave dispersion measurements, Geophys. J. Int., 169, 1239–1260, 2007.
Bensen, G. D., Ritzwoller, M. H., and Shapiro, N. M.: Broadband ambient noise surface wave
tomography across the United States, J. Geophys. Res., 113, B05306,
doi:10.1029/2007JB005248, 2008.
Berberian, M. and Yeats, R. S.: Pattern of historical earthquake rupture in the Iranian plateau,
B. Seismol. Soc. Am., 89, 120–139, 2000.
Byrne, D. E., Sykes, A. R., and Davis, D. M.: Great thrust earthquakes and aseismic slip along
the plate boundary of the Makran subduction zone, J. Geophys. Res., 97, 449–478, 1992.
Berberian, M., J. A. Jackson, M. Qorashi, M. Talebian, M. Khatib, and K. Priestley.: The
1994 Sefidabeh earthquakes in eastern Iran: blind thrusting and bedding plane slip on a‐
growing anticline, and active tectonics of the Sistan suture zone. Geophys. J. Int., 142, 283-
299, 2000.
Cho, K. H., Herrmann, R. B., Ammon, C. J., and Lee, K.: Imaging the upper crust of the
Korean peninsula by surface-wave tomography, B. Seismol. Soc. Am., 97, 198–207, 2007.
17
1
2
3
4
5
6
7
8
9
10
11
12
13
14
15
16
17
18
19
20
21
22
23
24
25
26
27
28
29
1
Dehghani, G. and Makris, J.: The gravity field and crustal structure of Iran, Neues Jahrb.
Geol. P.-A., 168, 215–229, 1984.
DeMets, C., Gordon, R. G., Argus, D. F., and Stein, S.: Current plate motions, Geophys. J.
Int., 101, 425–478, 1990.
Derode, A., Larose, E., Tanter, M., de Rosny, J., Tourim, A., Campillo, M., and Fink, M.:
Recovering the Green’s function from field-field correlations in an open scattering medium, J.
Acoust. Soc. Am., 113, 2973–2976, 2003.
Drewes, H.: The actual plate kinematic and crustal deformation model APKIM2005 as basis
for a non-rotating ITRF, in: Geodetic Reference Frames, edited by: Drewes, H., IAG
Symposia, 134, Springer, 95–99, 2009.
Dziewonski, A. M., Chou, T. A., and Woodhouse, J. H.: Determination of earthquake source
parameters from waveform data for studies of global and regional seismicity, J. Geophys.
Res., 86, 2825–2852, 1981.
Ekström, G. and Nettles, M.: Calibration of the HGLP seismograph network and centroid-
moment tensor analysis of significant earthquakes of 1976, Phys. Earth Planet. In., 101, 219–
243, 1997.
Farhoudi, G.: Makran of Iran and Pakistan as an active arc system, Geology, 5, 664–668,
1977.
Farhoudi, G.: A comparison of Zagros geology to island arcs, J. Geol., 86, 323–334, 1978.
Giese, P., Makris, J., Akashe, B., Rower, P., Letz, H., and Mostaanpour, M.: Structure in
southern Iran derived from seismic explosion data, Neues Jahrb. Geol. P.-A., 168, 230–243,
1984.
Herrmann, R. B.: Some aspects of band-pass filtering of surface waves, B. Seismol. Soc. Am.,
63, 663–671, 1973.
Herrmann, R. B. and Ammon, C. J.: Computer Programs in Seismology – Surface Waves,
Receiver Functions and Crustal Structure, Saint Louis University, available at:
http://www.eas.slu.edu/People/RBHerrmann/ComputerPrograms.html (last access: 21
December 2013), 2002.
18
1
2
3
4
5
6
7
8
9
10
11
12
13
14
15
16
17
18
19
20
21
22
23
24
25
26
27
28
1
Huang, Y. C., Yao, H., Huang, B.-S., van der Hilst., R. D., Wen, K.-L., Huang, W.-G., and
Chen, C.-H.: Phase velocity variation at periods 0.5–3 s in the Taipei Basin of Taiwan from
correlation of ambient seismic noise, B. Seismol. Soc. Am., 100, 2250–2263, 2010.
Huang, Z., Su, W., Peng, Y., Zheng, Y., and Li, H.: Rayleigh wave tomography of China and
adjacent regions, J. Geophys. Res., 108, 2073, doi:10.1029/2001JB001696, 2003.
Jackson, J. and McKenzie, D.: Active tectonics of the Alpine—Himalayan Belt between
western Turkey and Pakistan, Geophys. J. Int., 77, 185–264, 1984.
Kennett, B.: Approximations for surface–wave propagation in laterally varying media,
Geophys. J. Int., 122, 470–478, 1995.
Kukowski, N., Schillhorn, T., Flueh, E., and Huhn, K.: Newly identified strike-slip plate
boundary in the northeastern Arabian Sea, Geology, 28, 355–358, 2000.
Larose, E., Derode, A., Corennec, D., Margerin, L., and Campillo, M.: Passive retrieval of
Rayleigh waves in disordered elastic media, Phys. Rev. E, 72, 046607,
doi:10.1103/PhysRevE.72.046607, 2005.
Levshin, A. L., Yanovskaya, T. B., Lander, A. V., Buckchin, B. G., Barmin, M. P., Ratnikova,
L. I., and Its, E. N.: Seismic Surface Waves in a Laterally Inhomogeneous Earth, edited by:
Keilis-Borok, V. I., Kluwer, Norwell, MA, 1989.
Lin, F. C., Ritzwoller, M. H., Townend, J., Bannister, S., and Savage, M. K.: Ambient noise
Rayleigh wave tomography of New Zealand, Geophys. J. Int., 170, 649–666, 2007.
Lin, F. C., Moschetti, M. P., and Ritzwoller, M. H.: Surface wave tomography of the western
United States from ambient seismic noise: Rayleigh and Love wave phase velocity maps,
Geophys. J. Int., 173, 281–298, 2008.
Longuet-Higgins, M S:.A theory of the origin of microseisms, Philos. Trans. R. Soc.
London, 243, 1-35, 1950.
Maggi, A. and Priestley, K.: Surface waveform tomography of the Turkish–Iranian plateau,
Geophys. J. Int., 160, 1068–1080, 2005.
Masson, F., Anvari, M., Djamour, Y., Walpersdorf, A., Tavakoli, F., Daignieres, M., Nankali,
H., and Van Gorp, S.: Large-scale velocity field and strain tensor in Iran inferred from GPS
measurements: new insight for the present-day deformation pattern within NE Iran, Geophys.
J. Int., 170, 436–440, 2007.
19
1
2
3
4
5
6
7
8
9
10
11
12
13
14
15
16
17
18
19
20
21
22
23
24
25
26
27
28
29
30
1
McClusky, S., Reilinger, R., Mahmoud, S., Ben Sari, D., and Tealeb, A.: GPS constraints on
Africa (Nubia) and Arabia plate motions, Geophys. J. Int., 155, 126–138, 2003.
Monie, P. and Agard, P.: Coeval blueschist exhumation along thousands of kilometers:
implications for subduction channel processes, Geochem. Geophy. Geosy., 10, Q07002,
doi:10.1029/2009GC002428, 2009.
Pedersen, H. A. and Krüger, F.: Influence of the seismic noise characteristics on noise
correlations in the Baltic shield, Geophys. J. Int., 168, 197–210, 2007.
Platt, J. P., Leggett, J. K., Young, J., Raza, H., and Alam, S.: Large-scale sediment
underplating in the Makran accretionary prism, southwest Pakistan, Geol. Soc. Am., 13, 507–
511, 1985.
Platt, J. P., Leggett, J. K., and Alam, S.: Slip vectors and fault mechanics in the Makran
accretionary edge, southwest Pakistan, Geophysics, 93, 7955-7973,
doi:10.1029/JB093iB07p07955, 1988.
Rawlinson, N.: FMST: Fast Marching Surface Tomography package, Research School of
Earth Sciences, Australian National University, Canberra, ACT, 200, 2005.
Rawlinson, N. and Sambridge, M.: The fast marching method: an effective tool for
tomographic imaging and tracking multiple phases in complex layered media, Explor.
Geophys., 36, 341–350, 2005.
Sabra, K. G., Gerstoft, P., Roux, P., Kuperman, W. A., and Fehler, M. C.: Extracting time-
domain Green’s function estimates from ambient seismic noise, Geophys. Res. Lett., 32,
L03310, doi:10.1029/2004GL021862, 2005.
Sengor, A. M. C., Altiner, D., Cin, A., and Ustaomer, T.: Origin and assembly of the
Tethyside orogenic collage at the expens of Gondwana Land, in: Gondwana and Tethys,
edited by: Audley Charles, M. G. and Flallam, A., Geol. Soc. Spec. Publ., 37, 119–181, 1988.
Shad Manaman, N. M., Shomali, Z. H., and Koyi, H.: New constraints on upper-mantle S-
velocity structure and crustal thickness of the Iranian plateau using partitioned waveform
inversion, Geophys. J. Int., 184, 247–267, 2011.
Shapiro, N. M. and Campillo, M.: Emergence of broadband Rayleigh waves from correlations
of the ambient seismic noise, Geophys. Res. Lett., 31, L07614, doi:10.1029/2004GL019491,
2004.
20
1
2
3
4
5
6
7
8
9
10
11
12
13
14
15
16
17
18
19
20
21
22
23
24
25
26
27
28
29
30
1
Shapiro, N. M., Campillo, M., Stehly, L., and Ritzwoller, M. H.: High-resolution surface-
wave tomography from ambient seismic noise, Science, 307, 1615–1618, 2005
Shirzad, T., Shomali, Z. H., and Riahi, M. A.: An Application of Ambient Noise and
Earthquake Tomography in the Rigan Area, Southeast of Iran, Seismological Research
Letters, 84(6), 1014-1020, 2013.
Simons, F. J. and van der Hilst, R. D.: Age-dependent seismic thickness and mechanical
strength of the Australian lithosphere, Geophys. Res. Lett., 29, 1529,
doi:10.1029/2002GL014962, 2002.
Snieder, R.: Extracting the Green’s function from the correlation of coda waves: a derivation
based on stationary phase, Phys. Rev. E, 69, 046610, doi:10.1103/PhysRevE.69.046610,
2004. Snyder, D. B. and Barazangi, M.: Deep crustal structure and flexure of the Arabian
plate beneath the Zagros collisional mountain belt as inferred from gravity observations,
Tectonics, 5, 361–373, 1986.
Stehly, L., Campillo, M., and Shapiro, N.: A study of seismic noise from its long-range
correlation properties, J. Geophys. Res., 111, B10306, doi:10.1029/2005JB004237, 2006.
Tibuleac, I. M., von Seggern, D. H., Anderson, J. G., and Louie, J. N.: Computing Green’s
functions rom ambient noise recorded by accelerometers and analog, broadband, and narrow-
band seismometers, Seismol. Res. Lett., 82, 661–675, 2011.
Tirrul, R., Bell, I. R., Griffis, R. J., and Camp., V. E.: The Sistan suture zone of eastern Iran,
Geol. Soc. Am. Bull., 94, 134–150, 1983.
Vernant, C., Nilforoushan, F., Masson, F., Vigny, P., Martinod, J., Abbassi, M., Nankali, H.,
Hatzfeld, D., Bayer, R., Tavakoli, F., Ashtiani, A., Doerflinger, E., Daignières, M., Collard,
P., and Chéry, J.: GPS network monitors the Arabia–Eurasia collision deformation in Iran, J.
Geodesy, 77, 411–422, 2003.
Wapenaar, C. P. A.: Retrieving the elastodynamic Green’s function of an arbitrary
inhomogeneous medium by cross correlation, Phys. Rev. Lett., 95, 254–301, 2004.
Weaver, R. L. and Lobkis, O. I.: Ultrasonics without a source: thermal fluctuation correlation
at MHz frequencies, Phys. Rev. Lett., 87, 134301–134304, 2001.
Weaver, R. L. and Lobkis, O. I.: Elastic wave thermal fluctuations, ultrasonic waveforms by
correlation of thermal phonons, J. Acoust. Soc. Am., 113, 2611–2621, 2003.
21
1
2
3
4
5
6
7
8
9
10
11
12
13
14
15
16
17
18
19
20
21
22
23
24
25
26
27
28
29
30
1
Wessel, P. and Smith, W.H.F.: New, improved version of generic mapping tools released, Eos
Trans. Am. geophys. Un., 79, 579, 1998.
White, R. S. and Ross., D. A.: Tectonics of the western Gulf of Oman, J. Geophys. Res.-Sol.
Ea., 84, 3479–3489, doi:10.1029/JB084iB07p03479, 1979.
Yamini-Fard, F., Hatzfeld, D., Farahbod, A. M., Paul, A., and Mokhtari, M.: The diffuse
transition between the Zagros continental collision and the Makran oceanic subduction (Iran):
microearthquake seismicity and crustal structure, Geophys. J. Int., 170, 182–194, 2007.
Yang, Y., Ritzwoller, M. H., Levshin, A. L., and Shapiro, N. M.: Ambient noise Rayleigh
wave tomography across Europe, Geophys. J. Int., 168, 259–274, 2007.
Yang, Y. J., Li, A. B., and Ritzwoller, M. H.: Crustal and uppermost mantle structure in
southern Africa revealed from ambient noise and teleseismic tomography, Geophys. J. Int.,
174, 235–248, 2008.
Yao, H., van der Hilst, R. D., and de Hoop, M. V.: Surface-wave array tomography in SE
Tibet from ambient seismic noise and two-station analysis – I. Phase velocity maps, Geophys.
J.Int., 166, 732–744, 2006.
Young, M. K., Rawlinson, N., Arroucau, P., Reading, A. M., and Tkalčić, H.: High-frequency
ambient noise tomography of southeast Australia: new constraints on Tasmania’s tectonic
past, Geophys. Res. Lett., 38, L13313, doi:10.1029/2011GL047971, 2011.
Zarifi, Z.: Unusual subduction zones: case studies in Colombia and Iran, PhD thesis,
University of Bergen, Norway, 2006.
Zielhuis, A. and Nolet, G.: Shear wave velocity variations in the upper mantle under central
Europe, Geophys. J. Int., 117, 695–715, 1994.
22
1
2
3
4
5
6
7
8
9
10
11
12
13
14
15
16
17
18
19
20
21
22
23
24
25
26
27
28
1
a) b)
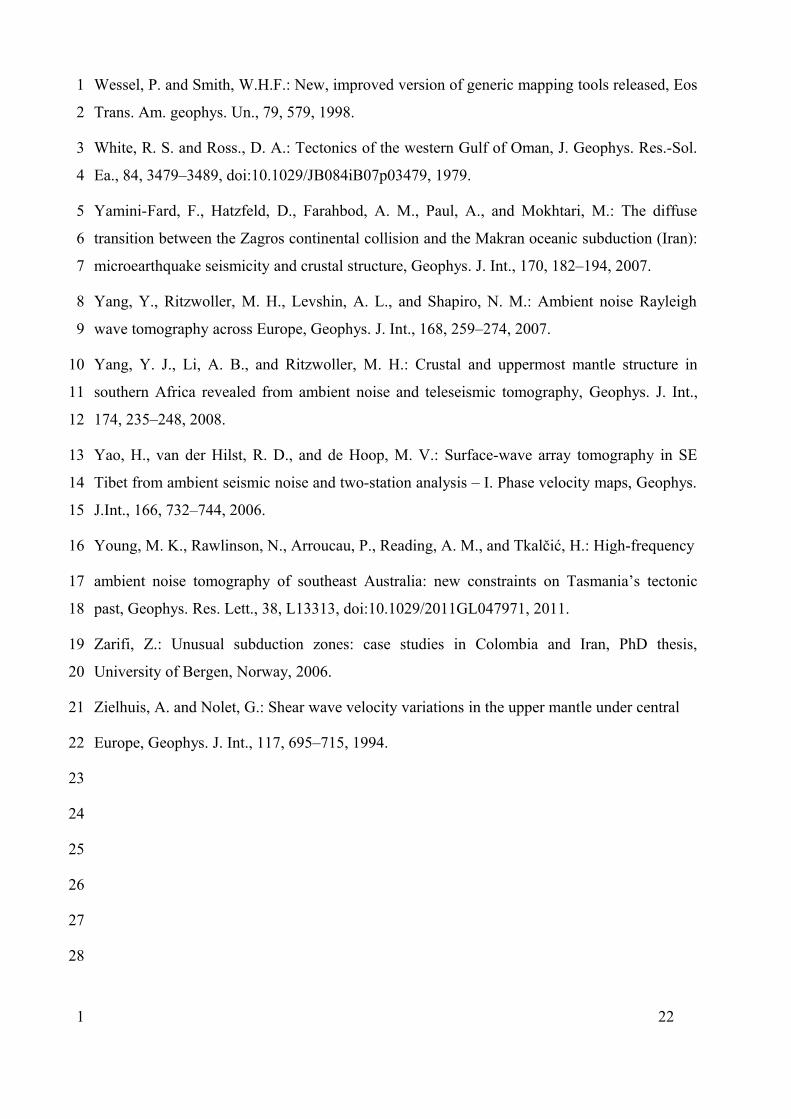
Figure1. (a) Topography map of the study area as well as the locations of broadband seismic
stations used in this study, marked by triangles shown in inset map. There are 21 stations
from the International Institute of Earthquake Engineering and Seismology (IIEES)
denoted by the blue triangles and the red triangles show the locations of Global Seismic
Network (GSN) stations. The green triangles denote the global seismograph network
stations (GEOFON). Black and yellow triangles show Tajikistan National Seismic
Network (TJ) and the Virtual European Broad-band Seismic Network (VEBSN). Ridge,
trench and transform boundaries are indicated by red, green and blue lines respectively. (inset
map) Plate motions are calculated in www.unavco.org base on APKIM2005 plate motion
model (Drewes, 2009). Major faults are indicated by black lines. Known volcanoes of Taftan,
Bazman and Sultan are marked by hexagon, volcanic arc are shown in red transparent area.
WM: Western Makran (near 59.5'E), EM: Eastern Makran (near 63.5'E) (Byrne et al.,
1992), SSZ: Sanandaj-Sirjan Zone, UDMA: Urumieh–Dokhtar Magmatic Arc, MZT: Main
Zagros Thrust, JAZ M.: Jaz Murian., SH: Straits of Hormuz. (b) Seismicity map during
1977-2013 with magnitude greater than 4.0 is plotted from global CMT catalog
(Ekström et al., 1977; Dziewonski et al., 1981) by coloured circles.
23
1
2
4
5
6
7
8
9
10
11
12
13
14
15
16
17
18
19
20
1
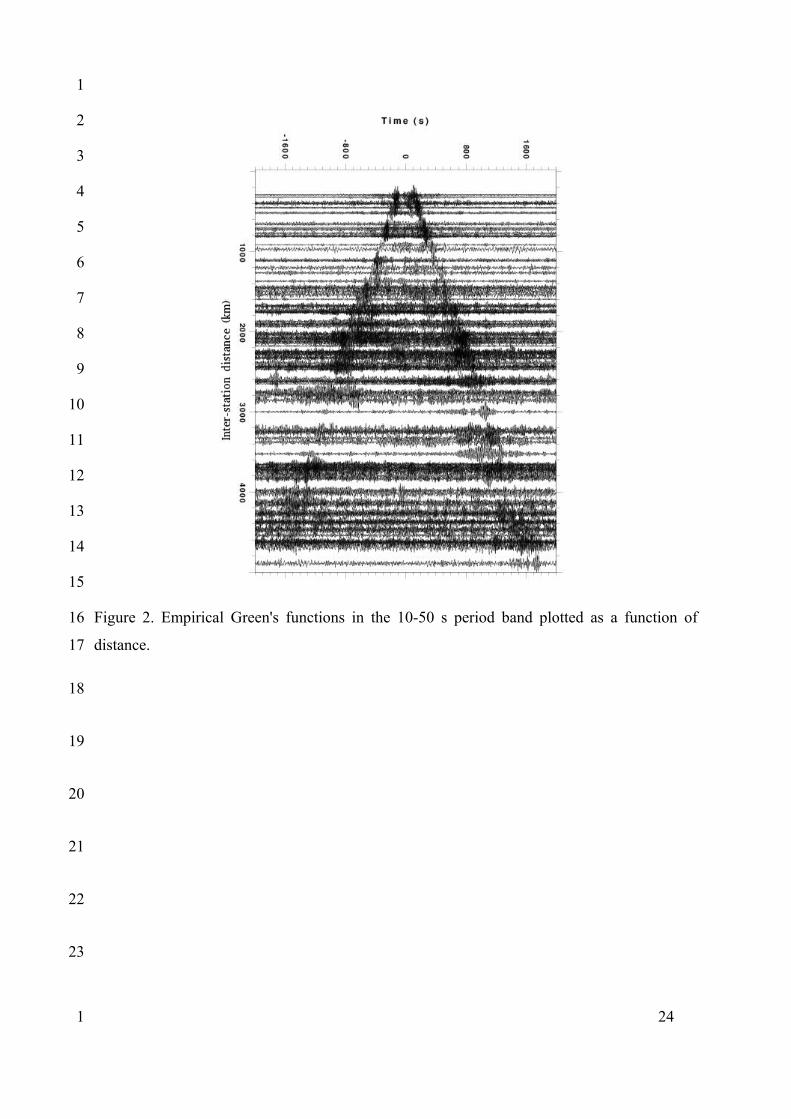
Figure 2. Empirical Green's functions in the 10-50 s period band plotted as a function of
distance.
24
1
2
3
4
5
6
7
8
9
10
11
12
13
14
15
16
17
18
19
20
21
22
23
1
Figure 3. An example of broad-band cross correlation (10 – 50 s) for one station pair GHIR-
BNDS with the narrow band-pass filtered time series (Left). Location of two stations is also
shown (Right).
25
1
2
4
5
6
7
8
9
10
11
12
13
14
15
1
a)
b) c)
Figure 4. (a) Two paths between two pair of stations are shown by dash lines. (b) Cross
correlation between 10 and 50 s of 1 year, 2009, of noise recorded on BNDS-KRBR. The
interstation distance is 297 km. (c) Same as (b) but for the station pair KRBR-ZHSF with the
interstation distance of 389 km.
26
1
2
3
4
5
6
7
8
9
10
11
12
13
14
15
16
17
1
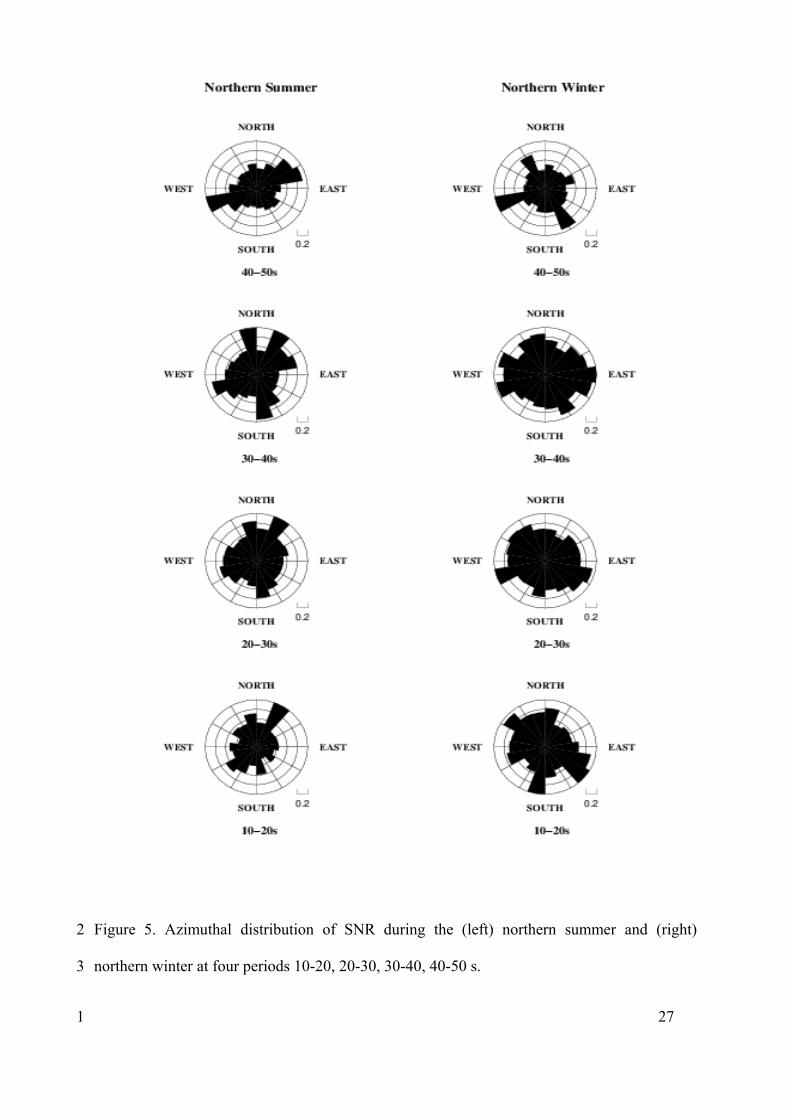
Figure 5. Azimuthal distribution of SNR during the (left) northern summer and (right)
northern winter at four periods 10-20, 20-30, 30-40, 40-50 s.
27
2
3
1
a)
b)
c)
Figure 6. (a) Raw (black) and cleaned (red) waveforms for one year stacked cross-correlation
between stations BNDS and GHIR. (b) Measured group speed curve as the dotted line from
raw waveform (c) Cleaned diagram, measured group speed curve.
28
1
2
3
4
5
6
7
8
9
10
11
12
13
14
15
16
17
18
1
a)
b)
Figure 7. Group velocity dispersion curves measured from the paths shown on (a) are
depicted by dash lines in (b) .
29
1
2
3
4
5
6
7
8
9
10
11
12
13
14
15
16
17
18
1
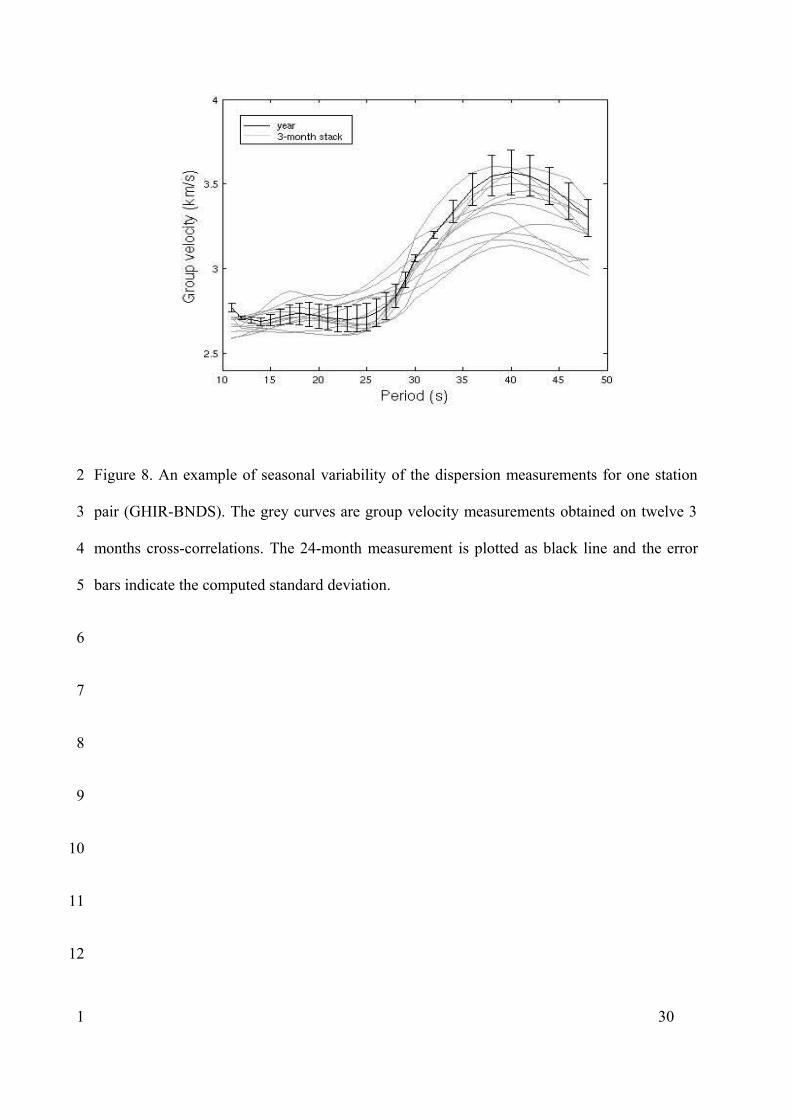
Figure 8. An example of seasonal variability of the dispersion measurements for one station
pair (GHIR-BNDS). The grey curves are group velocity measurements obtained on twelve 3
months cross-correlations. The 24-month measurement is plotted as black line and the error
bars indicate the computed standard deviation.
30
2
3
4
5
6
7
8
9
10
11
12
1
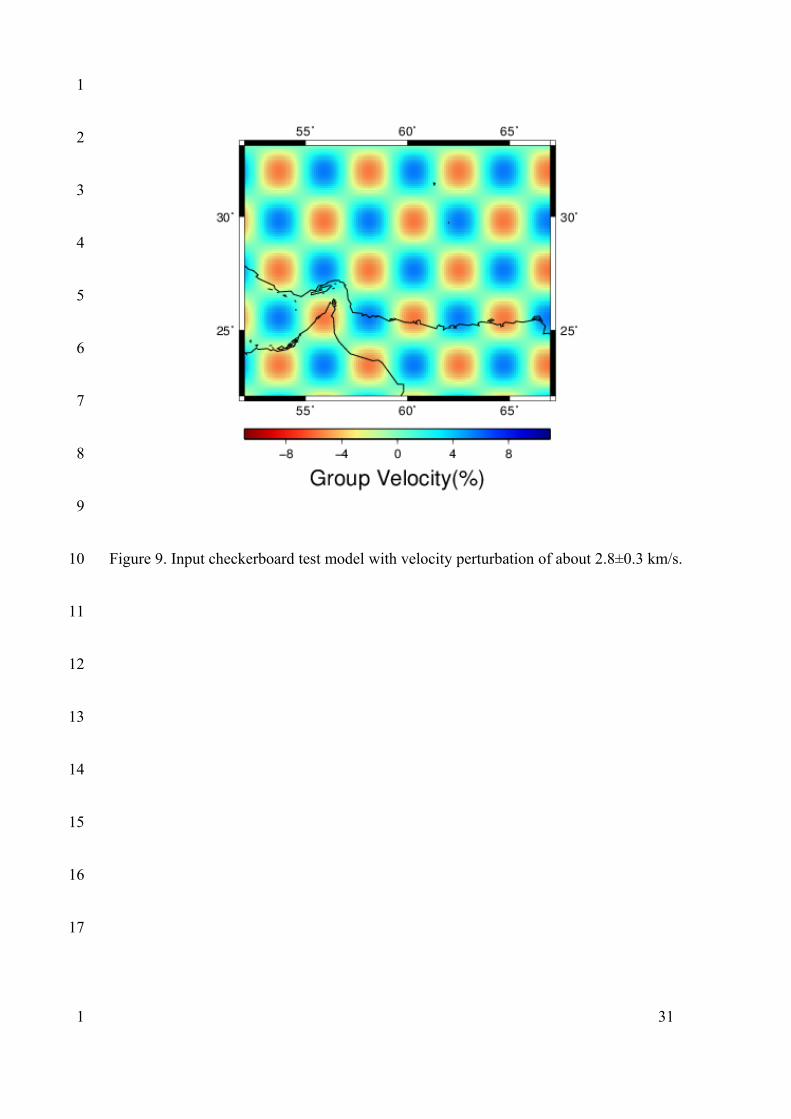
Figure 9. Input checkerboard test model with velocity perturbation of about 2.8±0.3 km/s.
31
1
2
3
4
5
6
7
8
9
10
11
12
13
14
15
16
17
1
b)
Figure 10. Rayleigh wave group-velocity tomography results for period 16s, Earthquakes
occurred during 1977-2013 with magnitude greater than 4.0 and depth smaller than 30
km, is plotted from global CMT catalog (Ekström et al., 1977; Dziewonski et al., 1981)
by black dots. Volcanoes are marked by black triangles. (a). The corresponding
checkerboard test results and the interstation paths for the group speed measurements meeting
the selection criteria for the corresponding period are also shown in (b).
32
1
2
3
4
5
6
7
8
9
10
11
12
1
a)
b)
33
1
3
5
1
c)
d)
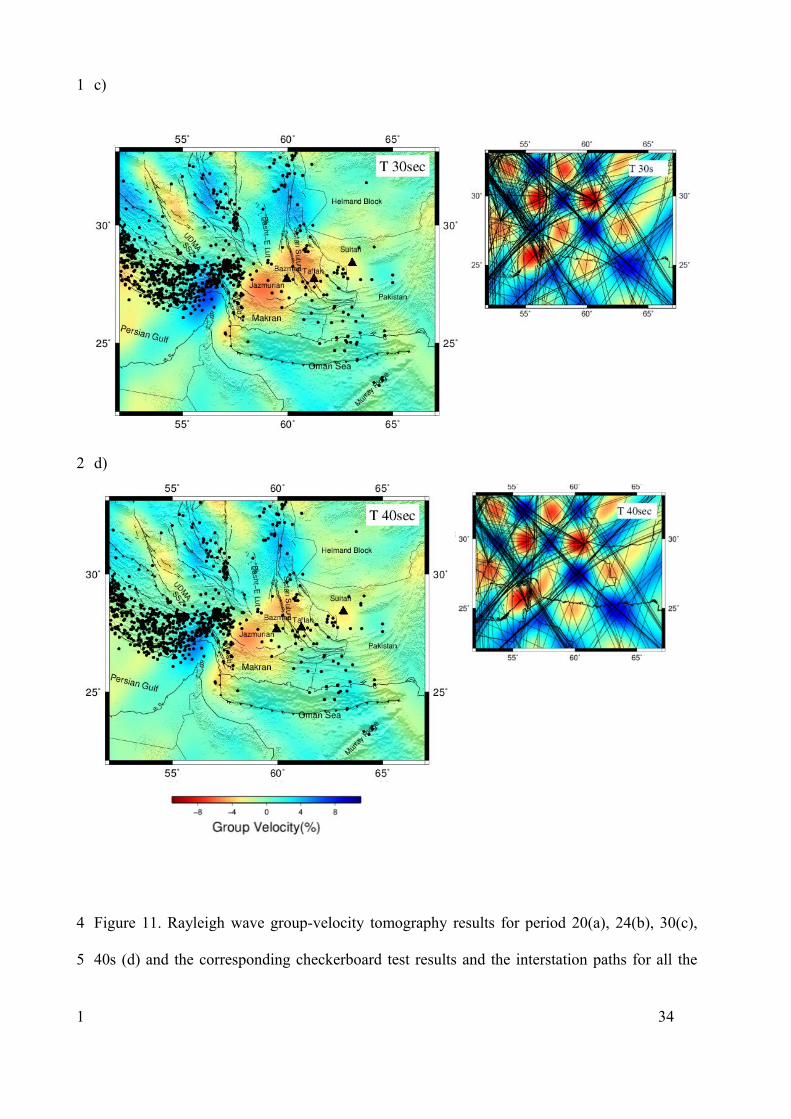
Figure 11. Rayleigh wave group-velocity tomography results for period 20(a), 24(b), 30(c),
40s (d) and the corresponding checkerboard test results and the interstation paths for all the
34
1
2
4
5
1

group speed measurements meeting the selection criteria for each period. Earthquakes
occurred during 1977-2013 with magnitude greater than 4.0 and depth between 30 to 70
km for periods 20 and 24s and greater than 70 km for periods 30 and 40s, is plotted
from global CMT catalog (Ekström et al., 1977; Dziewonski et al., 1981) by black dots.
Volcanoes are marked by black triangles.
35
1
2
3
4
5
6
7
8
9
10
11
12
13
14
15
16
17
18
19
1
a) b)
Figure 12. (a) The initial Vs velocity model based on ak135 velocity model, (Kennett, 1995).
(b). Examples of sensitivity kernels of group velocity as a function of period for the Vs
velocity measurements. Related dispersion curves are shown in the Figure 7.
36
1
2
3
4
5
6
7
8
9
10
11
12
13
14
15
16
1
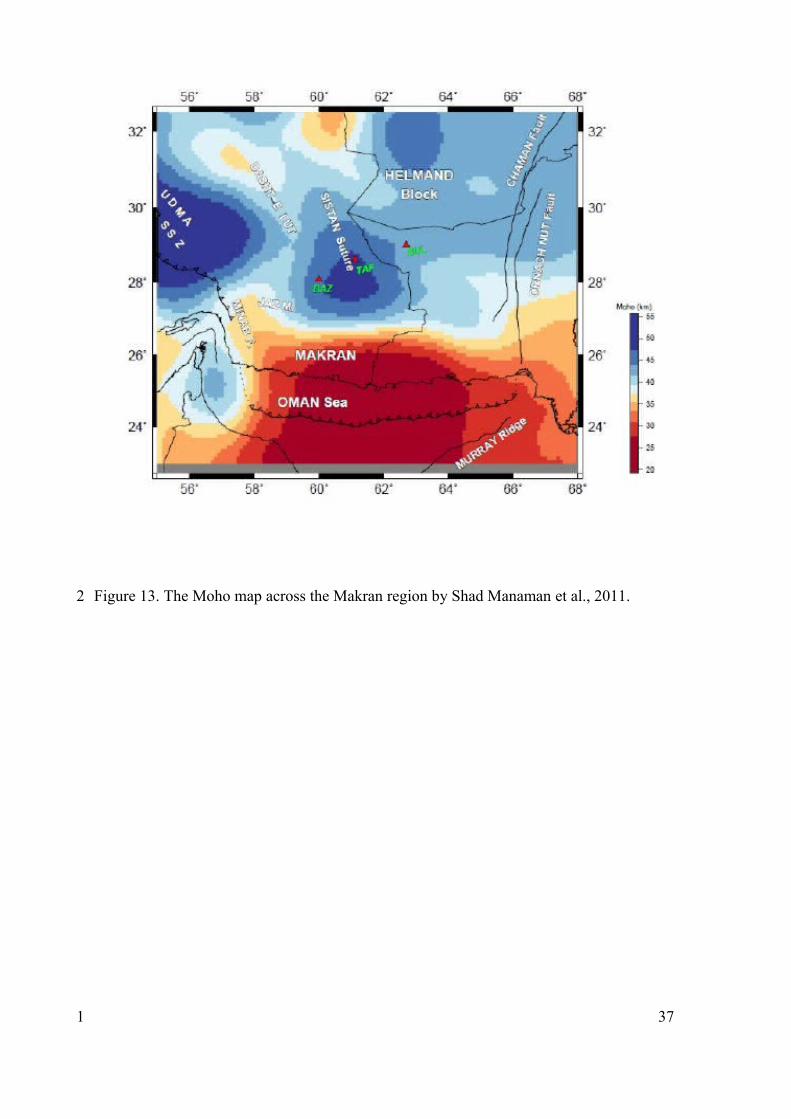
Figure 13. The Moho map across the Makran region by Shad Manaman et al., 2011.
37
2
1