Embed Size (px)
Citation preview

Cruise Ship Wastewater Management Report
August 2007

Cruise Ship Wastewater Management Report
August 2007
King Street Center, KSC-NR-0512
201 South Jackson Street Seattle, WA 98104
http://dnr.metrokc.gov/wtd/
For comments or questions, contact: Mark Buscher, CSI Project Manager King County Wastewater Treatment Division 201 South Jackson Street M.S. KSC-NR-0512 Seattle, WA 98104-3856 206-684-1242 [email protected] Alternate Formats Available 206-684-1242 TTY Relay: 711

Cruise Ship Wastewater Management Report, August 2007 i
Contents
1 Executive Summary .............................................................................................................1 1.1 Summary of Findings & Conclusions ................................................................................... 1 1.2 Analytical Report Contents ................................................................................................... 2
2 Cruise Shipping in Puget Sound ..........................................................................................3 3 Port Facilities for Cruise Shipping.......................................................................................3 4 Overview of Cruise Ship Wastewater Management Operations .........................................4 5 Oversight of Cruise Shipping in Washington ......................................................................5 6 Cruise Ship Effluent Analysis..............................................................................................9
6.1 Cruise Ship Effluent Volumes............................................................................................... 9 6.2 Summary of Cruise Ship Effluent Tests Conducted by the Department of Ecology
in 2006................................................................................................................................. 10 6.3 Comparative Evaluation of Cruise Ship Effluent Samples with Effluent Samples
from the West Point Treatment Plant .................................................................................. 10 6.4 The Impacts of Cruise Ship Wastewater Discharge on Alaska Waters - Summary of
Conclusions ......................................................................................................................... 11 7 Cruise Ship Biomass Management ....................................................................................12 8 Capacity of the Regional Wastewater System to Receive Wastewater or Biomass from
Cruise Ships .......................................................................................................................13 8.1 Treatment Capacity ............................................................................................................. 13 8.2 Conveyance Capacity .......................................................................................................... 13 8.3 Biomass Treatment Capacity............................................................................................... 16
9 Cruise Ship Wastewater Management Study Results........................................................17 Tables Table 1. 2007 Commercial Passenger Vessel Association & Discharge Status ........................................... 8 Table 2. Comparison of Cruise Ship and West Point TP Effluent Test Results ......................................... 11 Table 3. Probability of a Cruise Ship Being Docked at Pier 91 on a CSO Day.......................................... 15 Table 4. Preliminary Cost Estimate for Improvements at Pier 91 to Channel Wastewater from Cruise
Ships............................................................................................................................................... 18 Figures Figure 1. Map of Wastewater Conveyance Facilities Near Pier 91 .............................................................. 4 Figure 2. Navigational Chart of Northwest Washington Waters Subject to the Cruise Operations MOU ... 6 Figure 3. Map of Pier 91 and Regional Conveyance System ..................................................................... 14 Figure 4. Schematic of Treatment and Biosolids Reuse Process at the South Treatment Plant ................. 16


Cruise Ship Wastewater Management Report, August 2007 1
1 Executive Summary In April 2007, the King County Council passed Motion No. 12498, which directed the Wastewater Treatment Division to work cooperatively with the Port of Seattle and other affected agencies to undertake a study of the potential for processing marine cruise industry-generated wastewater through the county’s wastewater treatment system. The Council’s Motion directed that the following elements be included in the study:
• Impacts to the environment that can be avoided through the diversion, of waste from cruise ships through the county's wastewater management system;
• The capacity of the county's wastewater treatment system to receive and process the volumes of waste generated by the marine cruise ships which visit local port facilities, now and in the future;
• A summary of piping, coupling and other mechanisms needed to channel waste from visiting cruise ships to the county's wastewater management system;
• Any displaced future opportunity for wastewater processing capacity utilization by resident users of the wastewater management system;
• Costs for waste diversion, and any appropriate financial arrangements to address costs; • Economic or other impacts to the cruise ship industry; and • A recommendation regarding any appropriate council action.
1.1 Summary of Findings & Conclusions To address each element of the Council’s Motion, the Wastewater Treatment Division gathered information about how the cruise ship industry currently manages wastewater; and evaluated the capacity, potential environmental benefits, and costs to the cruise industry of processing cruise ship waste within the regional wastewater system. The following findings and conclusions are based on these information gathering and analytical tasks:
1. There is no identified benefit of channeling wastewater from cruise ships to the regional conveyance and treatment system. The cruise industry actively treats wastewater aboard their cruise ships. Most cruise ships operate advanced wastewater treatment systems (AWTS). Based on a review of effluent sampling results prepared by the State Department of Ecology, and on a comparative analysis of effluent samples from some cruise ships with effluent produced at the West Point Treatment Plant, the cruise ships sampled are producing and discharging effluent that is at least as clean as effluent from West Point.
2. The partially-treated solids residuals from the wastewater treatment process aboard cruise ships, also referred to as “biomass” by the cruise industry, could be managed in a more environmentally beneficial manner. The South Treatment Plant could receive and incorporate biomass into the existing treatment process without any expansion or modification of the South Treatment Plant. King County recycles all of its biosolids.

2 Cruise Ship Wastewater Management Report, August 2007
3. Though not necessary, it is technically feasible to construct piping, coupling and other mechanisms needed to channel waste from visiting cruise ships to the county’s wastewater management system. The estimated capital cost for making these improvements is approximately $3-million. This capital cost estimate does not include costs that the cruise industry would have to absorb for retrofitting their ships to be compatible with any piping and coupling equipment that would be constructed by the county. Additional ongoing operational and maintenance costs for any infrastructure constructed to channel waste from visiting cruise ships to the county’s wastewater management system have also not been calculated.
4. Accepting biomass from cruise ships at the South Treatment Plant will not result in displacing any future opportunity for wastewater processing capacity utilization by resident users of the wastewater management system. Other feasibility issues, including the possible need to retrofit of ships to offload biomass to shore, and odor control during the offloading process require additional investigation.
5. No preliminary costs for treating biomass that could be trucked to the South Treatment Plant have been calculated for this study. The Department of Ecology, representatives of the cruise ship industry, and the Port of Seattle have committed to discuss options for managing biomass. Once they begin, information developed for the use options can be used to estimate costs for managing biomass. Appropriate financial arrangements for addressing costs can also be developed.
6. A change in management practices that involves off-loading biomass from cruise ships for treatment will represent a change in management practices. This could have economic and operational impacts to the cruise lines because it would involve employing a trucking operation to off-load and transport biomass to the South Treatment Plant. Additionally, the cruise lines would have to pay the cost of discharge and treatment at the South Plant. Therefore, costs would be incurred by the cruise lines for each port call at the Port of Seattle if biomass was off-loaded for additional treatment. It is anticipated that these cost impacts will be further defined and quantified as the Department of Ecology, the cruise lines, and the Port discuss other management options.
7. It is recommended that the Council direct the Wastewater Treatment Division to continue to work cooperatively with the Department of Ecology, the cruise lines, and the Port of Seattle and provide technical assistance as they work to develop biomass management options. The timeline for developing management options should be governed by the entities party to the Memorandum of Understanding; the Department of Ecology and the cruise lines, and the Port of Seattle.
1.2 Analytical Report Contents What follows is the complete analytical report that provides an overview of cruise shipping activity through the Port of Seattle, outlines the information gathered to study the potential for processing marine cruise industry-generated wastewater through the county’s wastewater treatment system, and addresses each study element identified by the County Council’ Motion.

Cruise Ship Wastewater Management Report, August 2007 3
2 Cruise Shipping in Puget Sound Cruise shipping is a growing industry in Seattle. The primary destination for cruise ships home-ported in Seattle is Alaska. According to the Port of Seattle nearly 200 cruise ship visits accommodating approximately 750,000 passengers will occur during the 2007 cruise season. The cruise ship season typically runs from April into September of each year. These numbers are significantly larger than the 6 cruise ship visits that accommodated 6,600 passengers in 1999. At present, ships arrive and depart on Fridays, Saturdays, and Sundays during the cruise season. The number of ship calls and the length of the cruise season have the potential to expand over time as the popularity of cruising grows.
3 Port Facilities for Cruise Shipping In 2007, the cruise lines operating at port facilities are Norwegian Cruise Line, Royal Caribbean, Celebrity Cruises, Holland America Line, Princess Cruises, and America West. Norwegian Cruise Line, Royal Caribbean and Celebrity Cruises homeport at the Bell Street Pier Cruise Terminal at Pier 66. Holland America Line and Princess Cruises will homeport at the Terminal 30 Cruise Facility.
The Port of Seattle has plans to move their cruise shipping operations at Terminal 30 to Pier 91 near Magnolia by April of 2009. This Study looks at the feasibility of processing marine cruise industry-generated wastewater from ships that would utilize Pier 91. The Study focuses on Pier 91 because it allows for the incorporation of wastewater offloading infrastructure to be incorporated into the design and construction of the new cruise terminal. In turn, this allowed for the most favorable analysis of the costs associated with providing off-loading services. Figure 1 shows the location of the planned new cruise terminal in relation to the county’s existing wastewater conveyance facilities.

4 Cruise Ship Wastewater Management Report, August 2007
Figure 1. Map of Wastewater Conveyance Facilities Near Pier 91
4 Overview of Cruise Ship Wastewater Management Operations Cruise ships that operate in Seattle typically offer seven day cruises to Alaska. A large cruise ship will use about 300,000 gallons of potable water per day, for drinking, washing, food prep, wastewater flushing, laundry, etc. Ships with fewer passengers and crew, of course, use less. A cruise ship’s waste water consists of both “gray” and “black” water. Graywater comes from cabin sinks and showers, laundering, galley sinks, air conditioning condensate, and salon sinks. Blackwater is wastewater from toilets and medical facility sinks.
Gray and black water is processed through the ship's wastewater treatment system. The treated water is discharged overboard when permitted at a rate of approximately 13,000 gallons per hour. As cruise ships treat their wastewater, they have the capacity to hold treated effluent for one to two days if they are not permitted to discharge in inland waters (see Section 5). No cruise ship has the ability to hold an entire weeks worth of untreated wastewater. Cruise ships have a nominal amount of wastewater storage capability, but this is typically held empty in case a ship’s wastewater treatment system experiences any problems or upsets. Constant discharge of treated effluent is also necessary to maintain proper trim and stability of the ship, and to accommodate fuel and potable water storage. During a seven day cruise to and from Alaska, cruise ships spend most of their time outside of Washington waters. This means that most wastewater produced on a
Planned Cruise Ship Terminal

Cruise Ship Wastewater Management Report, August 2007 5
cruise ship traveling between Seattle and Alaska is treated and discharged while the ship is outside of the State and Puget Sound.
All cruise ships have wastewater treatment systems on board for their gray and black water. There are primarily two types of wastewater treatment systems on board cruise ships; marine sanitation device (MSD) systems or advanced wastewater treatment systems (AWTS). Some ships have unique wastewater treatment systems that are more advanced than MSD systems but pre-date (technologically) AWTS systems. MSD systems are an older technology that is being phased out of use within the cruise industry. They are a two-stage treatment system that consists of bio-reaction and disinfection of wastewater with chlorine prior to discharge. Advanced Wastewater Treatment Systems are rapidly becoming the standard type of treatment system on cruise ships. These systems typically consist of a multi-stage treatment process that includes filtration of solids, bio-reaction, ultra-filtration to remove remaining solids, and disinfection of wastewater with ultra-violet light prior to discharge.
5 Oversight of Cruise Shipping in Washington Most cruise ships that operate in Seattle are members of the Northwest Cruise Association (NWCA). According to information provided by the Department of Ecology, all large cruise ship port calls in 2006 were made by NWCA-member cruise lines. In 2007, 15 of 16 ships that will visit the Port of Seattle during the cruise season belong to the NWCA. According to the Port of Seattle’s cruise schedule, the one non-member ship is scheduled to have only 2 visits during the season.
NWCA-member ships that operate in Seattle are subject to a Memorandum of Understanding (MOU) between the Department of Ecology, the NWCA, and the Port of Seattle and that establishes, among other things, operational practices for the management of wastewater for cruise ships operating within Washington waters. The MOU prohibits the discharge of untreated black or gray water from cruise ships within the State. It also sets standards and a process for receiving permission to discharge treated effluent within Washington waters. Figure 2 shows the waters subject to the MOU.

6 Cruise Ship Wastewater Management Report, August 2007
Figure 2. Navigational Chart of Northwest Washington Waters Subject to the Cruise
Operations MOU According to Section 2.1, Wastewater Management, of the MOU, each cruise ship must provide the following information in order to receive permission to discharge treated effluent within the State. To receive discharge approval at one nautical mile at 6-knots, cruise ships must provide the following:
• Documentation on the type of treatment system in use on the ship including schematic diagrams of the system.
• Documentation that the system is certified by the United States Coast Guard for continuous discharge in Alaska1. If the certification has not yet been provided by the Coast Guard at the time the other documentation is submitted to Ecology, it may be submitted less than 60 days prior to commencement of discharge but in no event less than 30 days prior to commencement of discharge.
1 The State of Alaska employs higher standards and testing regimes for cruise ships than what is possible in the State of Washington. This is because only the State of Alaska has a specific authority in the Federal Clean Water Act to enact regulatory standards for cruise ships. Though not specifically addressed in the MOU, Canadian law does not allow cruise ships to discharge untreated wastewater in Canadian waters. All Cruise ships are subject to Canadian law while operating in their waters.
MOU Boundary
Seattle

Cruise Ship Wastewater Management Report, August 2007 7
To receive approval for continuous discharge cruise ships must provide the information listed above as well as the following:
• Provision for daily twenty-four hour continuous turbidity or equivalent monitoring of the quality of the effluent generated by the AWTS.
• Documentation of system design that demonstrates the AWTS can be automatically shut down if monitoring of treated effluent indicates a system upset; or documentation that demonstrates that operational controls exist to insure system shut down if monitoring of treated effluent indicates a system upset. An example of an acceptable operational control is a system that has the continuous monitoring device alarmed as to immediately alert engineering staff on watch to shut down overboard discharges from the system in the event of high turbidity levels in the treated effluent.
• Documentation that all treated effluent will receive final polishing with ultraviolet (UV) light immediately prior to discharge.
• Copies of water quality tests results taken from the AWTS effluent during the preceding six months.
• A vessel specific plan that: identifies how effluent will be stored until the AWTS is repaired and which indicates the storage capacity of holding tanks; and includes a notification protocol for notifying Ecology of system shut down which occurs while within waters subject to this MOU.
Any cruise ship approved for discharge from an AWTS in waters subject to the MOU agrees to:
a. Sample the quality of the treated effluent2 using a Washington state-certified laboratory at least one time per month while at port in Washington during each cruise season using the sampling requirements established per the United States Coast Guard, Captain of the Port, Southeast Alaska Policy for conventional pollutants continued compliance monitoring regime and as referenced in Appendix vi. Parameters sampled include pH, Biochemical Oxygen Demand (BOD), Fecal Coliform, Total Suspended Solids (TSS), and Residual Chlorine (RC).
b. Meet the limitations on discharge as set in Alaska regulations for BOD, TSS, pH, Fecal Coliform and Residual Chlorine3.
c. Split samples with Ecology upon Ecology’s request when sampling is conducted in Washington waters.
d. Conduct Whole Effluent Toxicity (WET) Testing once every two years for vessels homeported4 in Washington and once every 40 port calls or turnarounds to a port in Washington for all other vessels.
2 Samples are obtained from a test port in the wastewater discharge line in order to ensure that samples are representative of treated effluent that is actually being discharged. 3 For the MOU, there is a presumption that meeting Alaska’s standards means that Washington’s Water Quality Standards are likely being met and that if Alaska’s standards are not being met, Washington’s Water Quality Standards are not being met. 4 The MOU defines “homeported vessel” as a vessel that makes a call or does a turnaround at a port in Washington at least 20 times per year.
8 Cruise Ship Wastewater Management Report, August 2007
e. Provide Ecology with duplicates of test results obtained for and provided to the State of Alaska to enable Ecology to monitor the quality of the effluent from such systems.
f. Notify Ecology at least a week in advance of sampling and to allow Ecology staff access to the ship in order to observe sampling events.
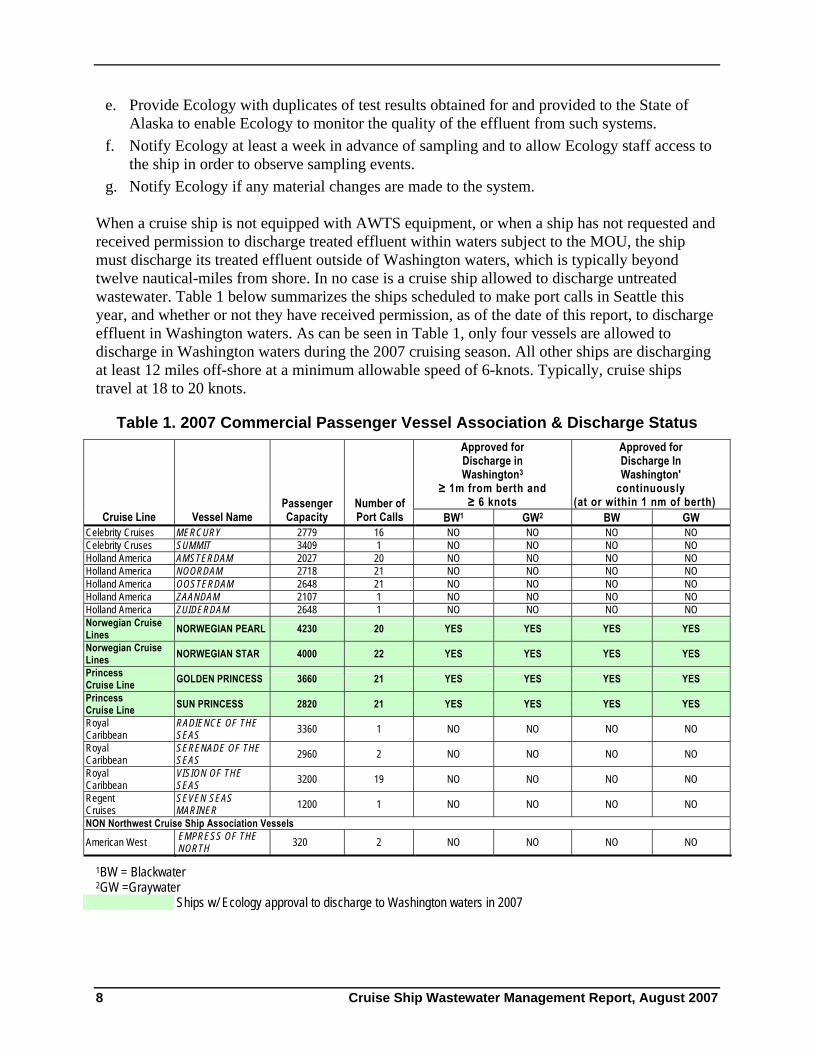
g. Notify Ecology if any material changes are made to the system. When a cruise ship is not equipped with AWTS equipment, or when a ship has not requested and received permission to discharge treated effluent within waters subject to the MOU, the ship must discharge its treated effluent outside of Washington waters, which is typically beyond twelve nautical-miles from shore. In no case is a cruise ship allowed to discharge untreated wastewater. Table 1 below summarizes the ships scheduled to make port calls in Seattle this year, and whether or not they have received permission, as of the date of this report, to discharge effluent in Washington waters. As can be seen in Table 1, only four vessels are allowed to discharge in Washington waters during the 2007 cruising season. All other ships are discharging at least 12 miles off-shore at a minimum allowable speed of 6-knots. Typically, cruise ships travel at 18 to 20 knots.
Table 1. 2007 Commercial Passenger Vessel Association & Discharge Status Approved for Discharge in Washington3
≥ 1m from berth and ≥ 6 knots
Approved for Discharge In Washington'
continuously (at or within 1 nm of berth)
Cruise Line Vessel Name Passenger Capacity
Number of Port Calls BW1 GW2 BW GW
Celebrity Cruises MERCURY 2779 16 NO NO NO NO Celebrity Cruses SUMMIT 3409 1 NO NO NO NO Holland America AMSTERDAM 2027 20 NO NO NO NO Holland America NOORDAM 2718 21 NO NO NO NO Holland America OOSTERDAM 2648 21 NO NO NO NO Holland America ZAANDAM 2107 1 NO NO NO NO Holland America ZUIDERDAM 2648 1 NO NO NO NO Norwegian Cruise Lines NORWEGIAN PEARL 4230 20 YES YES YES YES
Norwegian Cruise Lines NORWEGIAN STAR 4000 22 YES YES YES YES
Princess Cruise Line GOLDEN PRINCESS 3660 21 YES YES YES YES
Princess Cruise Line SUN PRINCESS 2820 21 YES YES YES YES
Royal Caribbean
RADIENCE OF THE SEAS 3360 1 NO NO NO NO
Royal Caribbean
SERENADE OF THE SEAS 2960 2 NO NO NO NO
Royal Caribbean
VISION OF THE SEAS 3200 19 NO NO NO NO
Regent Cruises
SEVEN SEAS MARINER 1200 1 NO NO NO NO
NON Northwest Cruise Ship Association Vessels
American West EMPRESS OF THE NORTH 320 2 NO NO NO NO
1BW = Blackwater 2GW =Graywater
Ships w/ Ecology approval to discharge to Washington waters in 2007
Cruise Ship Wastewater Management Report, August 2007 9
The MOU does have limitations. Compliance with the MOU is voluntary. It also only applies to cruise ships that are members of the NWCA and make port calls in Washington. Any enforcement actions are via federal law, State of Washington Water Quality Standards, or the Revised Code of Washington.
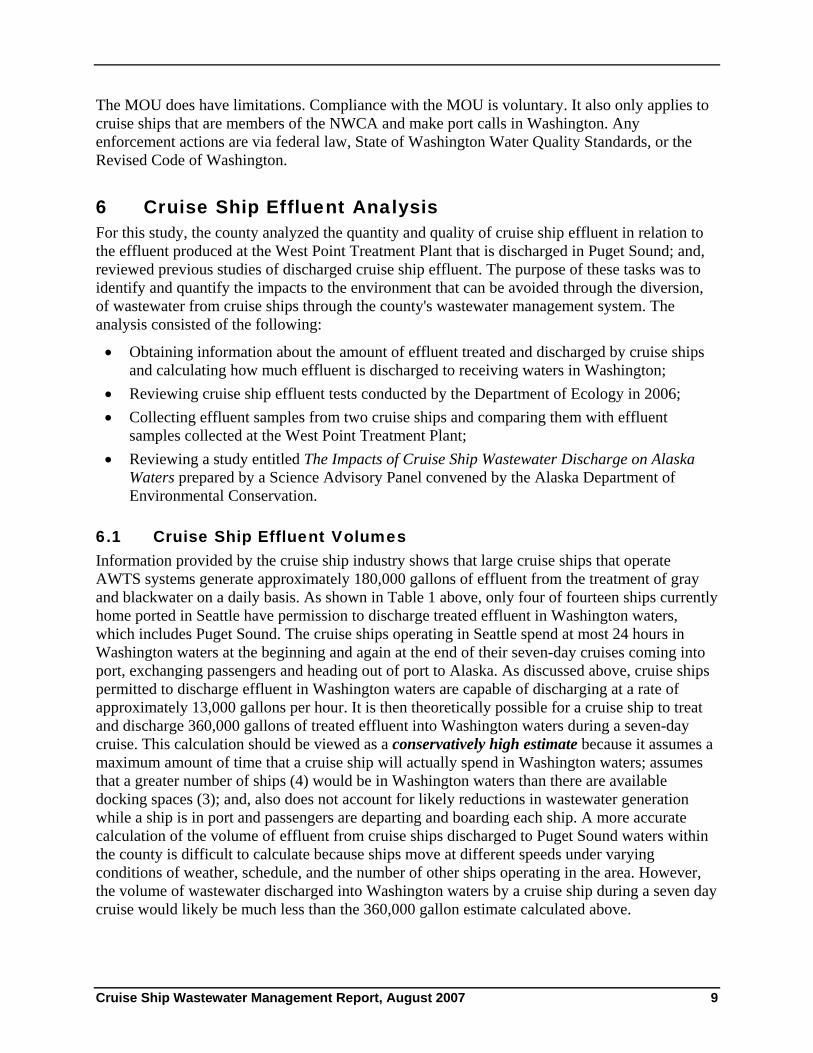
6 Cruise Ship Effluent Analysis For this study, the county analyzed the quantity and quality of cruise ship effluent in relation to the effluent produced at the West Point Treatment Plant that is discharged in Puget Sound; and, reviewed previous studies of discharged cruise ship effluent. The purpose of these tasks was to identify and quantify the impacts to the environment that can be avoided through the diversion, of wastewater from cruise ships through the county's wastewater management system. The analysis consisted of the following:
• Obtaining information about the amount of effluent treated and discharged by cruise ships and calculating how much effluent is discharged to receiving waters in Washington;
• Reviewing cruise ship effluent tests conducted by the Department of Ecology in 2006; • Collecting effluent samples from two cruise ships and comparing them with effluent
samples collected at the West Point Treatment Plant; • Reviewing a study entitled The Impacts of Cruise Ship Wastewater Discharge on Alaska
Waters prepared by a Science Advisory Panel convened by the Alaska Department of Environmental Conservation.
6.1 Cruise Ship Effluent Volumes Information provided by the cruise ship industry shows that large cruise ships that operate AWTS systems generate approximately 180,000 gallons of effluent from the treatment of gray and blackwater on a daily basis. As shown in Table 1 above, only four of fourteen ships currently home ported in Seattle have permission to discharge treated effluent in Washington waters, which includes Puget Sound. The cruise ships operating in Seattle spend at most 24 hours in Washington waters at the beginning and again at the end of their seven-day cruises coming into port, exchanging passengers and heading out of port to Alaska. As discussed above, cruise ships permitted to discharge effluent in Washington waters are capable of discharging at a rate of approximately 13,000 gallons per hour. It is then theoretically possible for a cruise ship to treat and discharge 360,000 gallons of treated effluent into Washington waters during a seven-day cruise. This calculation should be viewed as a conservatively high estimate because it assumes a maximum amount of time that a cruise ship will actually spend in Washington waters; assumes that a greater number of ships (4) would be in Washington waters than there are available docking spaces (3); and, also does not account for likely reductions in wastewater generation while a ship is in port and passengers are departing and boarding each ship. A more accurate calculation of the volume of effluent from cruise ships discharged to Puget Sound waters within the county is difficult to calculate because ships move at different speeds under varying conditions of weather, schedule, and the number of other ships operating in the area. However, the volume of wastewater discharged into Washington waters by a cruise ship during a seven day cruise would likely be much less than the 360,000 gallon estimate calculated above.

10 Cruise Ship Wastewater Management Report, August 2007
The daily volume of treated effluent produced and discharged by a cruise ship is much smaller in relation to the average volume of effluent discharged daily by the West Point Treatment Plant. West Point produces and discharges approximately 91-million gallons a day during the April through September cruise season. As stated above, a cruise ship could generate and discharge approximately 180,000 gallons of effluent a day, or less that two-tenths of one-percent of the average daily output of West Point.
6.2 Summary of Cruise Ship Effluent Tests Conducted by the Department of Ecology in 2006 As a part of the MOU between Ecology, the NWCA, and the Port, Ecology annually assesses the performance of cruise ships operating in Washington for environmental impacts during the cruise season. Per the MOU, Ecology received and analyzed two Whole Effluent Test (WET) samples from cruise ships in 2005 and four in 20065 as well as conducting MOU compliance sampling. Ecology reported their test results in a report entitled “2006 Assessment of Cruise Ship Environmental Effects in Washington”. In their 2006 Assessment, Ecology concluded that the “majority of the lines and vessels operating with the MOU had a successful season and were in compliance throughout”. The sampling results continued to “show excellent effluent quality”.
Ecology’s tests found that while the sampling results were in compliance with the Washington MOU and Alaska limits, the results would have violated Washington’s water quality standards for pH, and chlorine residual at the point of discharge. However, it must be noted that discharge of effluent from the cruise ships does not account for a mixing zone. On-land sewage treatment plants have mixing zones. Accordingly, Ecology reported that a group of toxicity testing experts, cruise line representatives, Port of Seattle staff, and Ecology staff will begin evaluating testing protocols and guidelines. Still, Ecology concluded that the “results from the cruise ships are of a far better quality than most of the on-land [treatment] plants”.
Ecology’s complete 2006 Assessment can be viewed at http://www.ecy.wa.gov/pubs/0710029.pdf
6.3 Comparative Evaluation of Cruise Ship Effluent Samples with Effluent Samples from the West Point Treatment Plant On July 1, 2007 Wastewater Treatment Division staff collected two grab samples6 of effluent from cruise ships docked at the Port of Seattle’s Terminal 30 and Terminal 66. Each ship operates AWTS treatment systems. Grab samples were taken from the effluent discharge lines of each ship. The samples were transported to the lab at the county’s West Point Treatment Plant for testing.
5 The MOU requires WET testing once every two years for homeported vessels (20 or more calls/turnarounds per season) and once per forty port calls or turnarounds for all other vessels. 6 Grab samples are samples taken from a single point in a treatment process at a specific time. Test results represent a snapshot of the quality of effluent being produced by treatment process. Grab samples are commonly used for testing by the wastewater treatment industry, including the county’s Wastewater Treatment Division.

Cruise Ship Wastewater Management Report, August 2007 11
Testing was conducted to determine the levels of total suspended solids (TSS), total solids, fecal coliform, and carbonaceous biochemical oxygen (cBOD) demand7 in each sample. Samples of effluent from the West Point Treatment Plant were also tested in order to compare the quality of effluent from the cruise ships with effluent produced and discharged from West Point. Table 2 below summarizes the comparative test results. As can be seen in the table, the cruise ship effluent test results for the total suspended solids, total solids, and fecal coliforms show higher removal levels than the effluent from the West Point Treatment Plant. The test results for cBOD are better at the West Point Treatment Plant than the cruise ship samples. However, the higher cBOD levels are within the normal range of variation of effluent test results for the West Point Treatment Plant. Overall, the effluent from the cruise ship samples is of at least as high a quality of the effluent produced and discharged from the West Point Treatment Plant.
Table 2. Comparison of Cruise Ship and West Point TP Effluent Test Results
Ship 1 Ship 2 West Point Total Suspended Solids (mg/l) 0 11 13 Total Solids (% solids) 0.035 0.05 0.05 cBOD (mg/l) >16 23 11 Fecal Coliforms 0 0 0
6.4 The Impacts of Cruise Ship Wastewater Discharge on Alaska Waters - Summary of Conclusions In November of 2002, a Science Advisory Panel (the Panel) convened by the State of Alaska released its “Report of the Impacts of Cruise Ship Wastewater Discharge on Alaska Waters” (the Report). The purpose of the Report was to identify and evaluate the potential impacts of cruise ship wastewater discharges on Alaska’s marine waters. The Panel studied the potential impacts of fecal coliform bacteria on human health and water quality, the potential for nutrients to promote unwanted blooms of phytoplankton in receiving waters, and the potential for cruise ship wastewater discharges to contaminate marine sediments.
Briefly, the Panel concluded that the discharge of treated effluent from moving cruise ships was within established water quality standards. This was due to treatment as well as the effects of dilution that occur from discharging effluent from moving ships. “Because of the nearly immediate dilution behind a large cruise ship it would be difficult for an individual to attain any significant exposure to the discharge”. The Panel also concluded that the volume of dissolved nitrogen present in the discharge of effluent from large cruise ships is not large enough to promote unwanted blooms of phytoplankton in receiving waters. The panel calculated that approximately 0.07 milligrams of dissolved nitrogen were present in each discharge liter of treated effluent (0.07 mg/liter). Given the effects of dilution, they concluded that the total nitrogen concentrations from cruise ships are just one-tenth to one-hundredth of the lowest background concentration of dissolved nitrogen in Alaskan marine waters. Finally, the Panel
7 BOD testing measures organic loading in water. This test can be affected by the presence of nitrogen in water, and can result in false positive test results. cBOD testing measures carbon-based organics only, which results in more accurate test results.

12 Cruise Ship Wastewater Management Report, August 2007
evaluated cruise ship effluent discharges to determine how metals and suspended solids might impact marine sediments. Copper was the focus of the evaluation as it was the contaminant most likely to cause a concern. Based on a series of analyses described in Section V of the Report, the Panel concluded that copper in cruise ship discharges “is not expected to produce problems in marine sediments.” The Panel also concluded that the same type of analysis for other constituents “would most likely produce similar demonstrations of non-problems”.
The complete Report can be viewed at http://www.dec.state.ak.us/water/cruise_ships/pdfs/impactofcruiseship.pdf.
7 Cruise Ship Biomass Management Like land-based sewage treatment plants, wastewater treatment systems aboard cruise ships produce a semi-solid residual that must be managed separately from treated effluent that is discharged to receiving waters. Referred to as “biomass” by the cruise ship industry, it is typically composed of screenings and semi-solids retained in the AWTS equipment. Biomass has passed through a primary filter and has dwelled in the bio-reactor phase of the treatment process.
Based on information provided by the cruise industry, cruise ships generate approximately 35 tons (including water content) of biomass from the treatment of blackwater each day. Currently, most cruise ships discharge this partially-treated material beyond 12 nautical miles from Washington’s shoreline and outside the Olympic Coast National Marine Sanctuary at a minimum allowable speed of 6 knots. As stated earlier, cruise ships typically travel at 18 to 20 knots in open waters. The 12-nautical mile and 6-knot minimum speed limits are established by the International Convention for the Prevention of Pollution from Ships, widely known as the MARPOL Convention8. Some cruise ships de-water their biomass and incinerate them. The ash can be discharged beyond the 12-mile limit, or can be off-loaded on shore as a solid waste. Currently, one ship that homeports in Seattle burns its biomass and off-loads it to shore.
Residual biomass from wastewater treatment processes can be treated and turned in to ‘biosolids”, a nutrient-rich organic byproduct that can be put to beneficial re-use as a soil amendment. The county’s Wastewater Treatment Division has been producing and recycling biosolids for over thirty years. Today, biosolids are used extensively to grow wheat and other grains on farms throughout Douglas County; and to improve soils and fertilize a variety of irrigated crops, including tree fruit, grapes, corn, hops and pasture grass, and for dry-land wheat in the Yakima Valley. Biosolids are also used to fertilize forests in eastern King County that are part of the Mountains to Sound Greenway. The biomass produced by cruise ships could be treated further and turned into reusable biosolids.
The Department of Ecology and the cruise shipping industry in Washington have recognized that biomass from cruise ships could be managed in environmentally beneficial means. As a part of the MOU, Ecology, representatives from NWCA-member cruise lines, and the Port of Seattle meet annually to discuss issues and opportunities. At their last annual meeting on December 8 2006, Ecology, cruise line representatives, and the Port agreed to participate in further 8http://www.oceansatlas.com/servlet/CDSServlet?status=ND00MTQzMCZjdG5faW5mb192aWV3X3NpemU9Y3RuX2luZm9fdmlld19mdWxsJjY9ZW4mMzM9KiYzNz1rb3M~

Cruise Ship Wastewater Management Report, August 2007 13
discussions on beneficial use options for biomass from cruise ships. To date, a working group is being formed and the commitment of all parties to discuss options appears to remain intact.
8 Capacity of the Regional Wastewater System to Receive Wastewater or Biomass from Cruise Ships The following section summarizes the capacity to treat effluent that could be channeled to the regional wastewater treatment and conveyance system, as well as to receive and treat partially treated biomass from cruise ships.
8.1 Treatment Capacity As shown in Section 6.1, the volume of effluent discharged from cruise ships is extremely small (less than one-percent) of the average daily volume of wastewater treated and discharged from the West Point Treatment Plant during the April through September cruising season. Average daily volumes of wastewater treated and discharged from the West Point Treatment during the wetter winter months approach 130-million gallons per day. Therefore, the West Point Treatment Plant has plenty of capacity to receive and treat effluent from cruise ships.
8.2 Conveyance Capacity There are potential capacity constraints within the regional conveyance system that would affect the ability of the system to receive effluent from cruise ships. The discharge point for wastewater flows from the planned new cruise ship terminal at Pier 91 in Seattle is located within the combined sewer system. In a combined sewer system, runoff from roofs and roads is directed into the sewer system. Consequently, there are large amounts of storm flow added to the sanitary flows on rainy days. This means that the available system capacity differs, depending on whether the weather is rainy or dry.
If wastewater from cruise ships was to be channeled to the regional wastewater treatment system, those wastewater volumes would be discharged into the South Magnolia Trunk. That trunk flows to the Interbay Pump Station, which also conveys flow from the much larger Elliott Bay Interceptor (EBI). Figure 3 shows the location of the proposed new cruise ship terminal at Pier 91 in relation to the portion of the regional conveyance system that serves the Magnolia/Interbay area.
Flow in excess of the system capacity results in combined sewer overflows (CSO’s) at the South Magnolia weir, or increased inflows to the Elliott West CSO treatment plant from the EBI, or increased outflows from that plant or CSO’s at the Interbay weir. These parameters can be used to determine when the conveyance system capacity is exceeded.
While there is some population growth anticipated due to densification within the areas contributing flow to the conveyance elements downstream of the discharge point, water conservation measures are expected to offset that growth. No net increase in sewage flows are expected to this part of the regional conveyance system due to population growth through 2050.

14 Cruise Ship Wastewater Management Report, August 2007
#
#
#
#
#
#
#
#
#
#
## ### # #
### #### # ## %U##
# ## ###
###
###
#
#
#
#
#
#S#
N
##
#
#
#
##
#
South Magnolia Trunk
Interbay PS
Elliott Bay Interceptor
South Magnolia CSO
Pier 91
Figure 3. Map of Pier 91 and Regional Conveyance System A cruise ship generates about 180,000 gallons of wastewater per day. According to the Port of Seattle, cruise ships are typically docked for 9 hours in Seattle. If it is assumed that equalizing storage is used to average the daily flow rate, the discharge rate to the regional wastewater system would be 0.18 Million Gallons per Day (MGD) or 0.28 Cubic Feet per Second (CFS) during the docking period. Typically two ships would be docked at Pier 91, so the flow rate is doubled to 0.36 MGD or 0.56 CFS. This flow would occur during the cruise ship season, defined as April 1st to September 30th. The cruise ships currently utilize the port 3 days per week, Friday through Sunday. However, the usage of facilities may well extend to more weekdays as the industry grows.
A dry day analysis of flows can be performed using the numerical model data. Rainfall days, and the days after rainfall days are excluded from the analysis.

Cruise Ship Wastewater Management Report, August 2007 15
The overall daily average and overall average of the daily peak flows are as follows:
Daily Average (MGD) Daily Peak (MGD) South Magnolia Trunk 0.9 1.4 Interbay Pump Station 52 71 The capacities of the conveyance elements are as follows: Capacity (MGD) South Magnolia Trunk 5.5 to 7.6 Interbay Pump Station 128 The excess dry day capacity is well in excess of the anticipated average flow rate from the cruise ships.
There are periods when the wet weather flow to King County’s system exceeds the system capacity. During those periods there are combined sewer overflows (CSO’s). Based on historical records of CSO events in the South Magnolia/Interbay area during the cruising season (April through September), it is possible to calculate the probability that a cruise ship would be docked during a CSO event. Table 3 below shows the probabilities of a CSO event occurring while cruise ships would be docked at Pier 91 during the cruising season. The probabilities vary by month. The mid-summer months have lower probabilities than the spring and early autumn months. Also, the probabilities increase as the number of days in a week that Pier 91 could be utilized increases.
Table 3. Probability of a Cruise Ship Being Docked at Pier 91 on a CSO Day
Days/Week Apr May Jun Jul Aug Sept 3 60.6% 38.6% 34.3% 4.3% 38.6% 38.6% 4 74.9% 51.4% 45.7% 5.7% 51.4% 51.4% 5 86.2% 64.3% 57.1% 7.1% 64.3% 64.3% 6 94.6% 77.1% 68.6% 8.6% 77.1% 77.1% 7 100.0% 90.0% 80.0% 10.0% 90.0% 90.0%
Currently, the Wastewater Treatment Division is developing CSO control options for the South Magnolia area. Options under investigation include developing storage for peak flows, reducing flows of storm wand groundwater into the wastewater conveyance system, and treating peak flows during large storm events. These options will either reduce the incidence of CSO events in the future, or limit their impact to receiving waters through treatment. At present, the schedule is as follows.
• 2007 – Identify evaluation criteria, alternatives, and sites for reducing CSOs • 2008 – Predesign work for selected alternatives • 2009-2010 – Final design, environmental review, and permitting • 2011-2012 - Construction

16 Cruise Ship Wastewater Management Report, August 2007
8.3 Biomass Treatment Capacity The South Treatment Plant in Renton has an established septage input facility for septage and other wet vactored waste products that are trucked to South Plant for treatment. The septage input facility could be used to accept biomass from cruise ships if they could be off-loaded into trucks. No expansion or modification of the septage input facility would be necessary. Figure 4 below illustrates how biomass from cruise ships could be delivered to the South Treatment Plant for treatment and eventual incorporation into the county’s biosolids program.
Figure 4. Schematic of Treatment and Biosolids Reuse Process at the South Treatment Plant
Potential Delivery Point for Biomass from Cruise Ships

Cruise Ship Wastewater Management Report, August 2007 17
9 Cruise Ship Wastewater Management Study Results The following presents study results for the seven elements contained in County Council Motion No. 12498.
1. Impacts to the environment that can be avoided through the diversion, of waste from cruise ships through the county's wastewater management system; Cruise ships actively treat their wastewater and the effluent they discharge is consistent with the quality of effluent produced by the county’s West Point Treatment Plant. Several independent studies also confirm that effluent from cruise ships is not causing environmental impacts to receiving waters due to the level of treatment performed by ships using AWTS equipment, and due to the fact that the movement of ships through receiving waters while discharging significantly dilutes the effluent – a function that is considered “essential” for evaluating the exposure and ecological/health risks associated with discharges.
Some ships homeported in Washington still use older MSD wastewater treatment systems that do not provide the same level of disinfection of effluent that AWTS wastewater systems provide. However, these ships are not allowed to discharge their effluent in Washington waters. Additionally, the cruise lines are actively phasing out the use of MSD systems through retrofitting, and building new ships.
The management of residual biomass from wastewater treatment aboard cruise ships appears to provide an opportunity for beneficial use rather than discharge beyond 12 nautical miles from shore. As discussed above, the county has been recycling the biosolids that it produces for over thirty years. The Department of Ecology, the cruise lines, and the Port of Seattle have agreed to participate in further discussions on beneficial use options for biomass from cruise ships. The county could assist with this process by providing information about uses and markets for treated biosolids. Additionally, the county could provide a receiving point for biomass from cruise ships. If the Department of Ecology, the cruise lines, and the Port determine a method for off-loading biomass into trucks, they could be trucked to the South Treatment Plant in Renton and discharged into the Plant’s septage input facility. The biomass from the cruise ships would then be treated and mixed with the biosolids produced at the Plant. They would then be distributed for beneficial use as a part of the established biosolids program.
2. The capacity of the county’s wastewater treatment system to receive and process the
volumes of waste generated by the marine cruise ships which visit local port facilities, now and in the future; As discussed above, the West Point Treatment Plant has capacity to receive and treat effluent from cruise ships. However, the regional conveyance system has potential capacity constraints that can occur if cruise ships are in port and channeling their effluent to the regional conveyance system during a CSO event. Since the cruise ships are already treating their wastewater to a standard that is at least comparable to the effluent standards achieved at the West Point Treatment Plant, there does not appear to be any reason to channel effluent from cruise ships to the regional wastewater system. Therefore, potential capacity constraints within the regional conveyance system do not appear to be a concern unless the cruise industry stopped using its treatment systems and offloaded untreated sewage on-shore.

18 Cruise Ship Wastewater Management Report, August 2007
The receipt of biomass from cruise ships at the South Plant appears to provide an opportunity for these materials to be managed in an environmentally beneficial manner. The septage input facility at the South Treatment Plant has the capability of receiving biomass from cruise ships without any modification or expansion.
3. A summary of piping, coupling and other mechanisms needed to channel waste from visiting cruise ships to the county’s wastewater management system; If the county were to be the discharge point for biomass from cruise ships, no additional piping, coupling, or other mechanisms necessary to receive this material would be necessary. Biomass is not suitable for transmission in wastewater pipes due to its sludge-like to semi-solid make-up. Pumping biomass from cruise ships into trucks for transport appears to be the most feasible method of off-loading and transporting this material. The South Treatment Plant already has all the necessary equipment and capacity to receive and treat this material. The overall feasibility of off-loading biomass from cruise ships is not known at this time. Details related to storage capacity for biomass aboard cruise ships, the ability of cruise ships to pump biomass to shore, availability of dock space while ships are being re-supplied, and issues related to odor control require further investigation.
The study results do not identify an environmental benefit that would result from offloading wastewater from cruise ships (treated or untreated). However, a preliminary cost estimate of the piping, coupling, and other mechanisms necessary to channel wastewater from cruise ships at the Port’s proposed new cruise terminal at Pier 91 to the county’s wastewater management system was developed for reference. Table 4 below summarizes the preliminary capital cost estimate.
Table 4. Preliminary Cost Estimate for Improvements at Pier 91 to Channel Wastewater from Cruise Ships
King County Wastewater Treatment Division Project Cost Factors Allied Costs 53% Project Contingency 40% Construction Contingency 10% Sales Tax 8.8% Effective Project Cost Factor: 112% Estimated Materials & Labor Costs ($, 2007) 4000-LF Pressure Line under Pier 91 $704,000.00 Pier 91 Gravity-feed Connecting Pipeline $717,000.00 ESTIMATED MATERIALS & LABOR COST $1,421,000.00 Estimated Project Costs (Materials, Labor, and All Contingency Costs) 4000-LF Pressure Line under Pier 91 $1,492,000.00 Pier 91 Gravity-feed Connecting Pipeline $1,519,000.00 ESTIMATED PROJECT COST $3,011,000.00
Notes: 1. The site for the connecting pipeline has not yet been determined, but is expected to extend 1,000 ft
due north from a pump station north of the existing Carnitech Building on Pier 91 to the King County South Magnolia Trunk between manholes W10-90 and W10-91. More detailed site investigation would be required to avoid existing underground utilities, and minimize disruptions to port operations during construction.

Cruise Ship Wastewater Management Report, August 2007 19
2. No easement or land acquisition costs have been included in the estimate. It is assumed that the Port owns all the property required for the connecting pipeline. Easement costs could otherwise prove significant.
3. The cost estimate does not provide for upgrades, replacements, or additions to existing pump stations to handle cruise ship discharge.
4. Additional environmental permitting costs may be required for construction in the shoreline area. 5. All costs are in 2007 dollars. An end of year Engineering New Record Construction Cost Index (ENR-
CCI) of 8899 has been assumed for use in Tabula by inflating the Dec 2006 Seattle ENR-CCI of 8641 by 3%.
The costs listed above do not address the potentially substantial costs that would accrue to the cruise lines for ship modifications and operational changes that would be necessary to physically connect the wastewater systems aboard cruise ships to any piping and coupling equipment that would be installed on Pier 91. Each ship within each cruise line’s fleet may require unique modifications as well. This is because each cruise line fleet has ships of varying designs and ages. Ongoing operational and maintenance costs for the infrastructure necessary to offload wastewater from cruise ships are also not included.
4. Any displaced future opportunity for wastewater processing capacity utilization by resident
users of the wastewater management system; The study results indicate that cruise ship wastewater volumes are small, in comparison to system for treatment, it is unlikely that future opportunities for wastewater processing would be displaced. Although the timing of future upgrades and expansions could be affected. As a regional service provider, the County is obligated to provide sewer service to customers that wish to hook up. If biomass from cruise ships were delivered via truck to the septage input port at the South Treatment Plant, no impact to the Plant’s capacity to process existing or projected volumes of septage from other sources is anticipated.
5. Costs for waste diversion, and any appropriate financial arrangements to address costs;
For this study, only a preliminary cost estimate for the piping and other mechanisms necessary to channel wastewater from cruise ships to the county’s wastewater system have been developed. The preliminary cost estimate is $3-million for capital construction only (see Table 4). No preliminary costs for treating biomass from cruise ships that could be trucked to the South Treatment Plant have been calculated for this study. The Department of Ecology, the cruise lines, and the Port of Seattle have committed to develop beneficial use options for managing biomass from cruise ships. Once they begin, information developed for the beneficial use options can be used to develop management costs. Appropriate financial arrangements for addressing costs can also be developed.
6. Economic or other impacts to the cruise ship industry; and
Channeling wastewater from cruise ships to the county’s wastewater system is not necessary. Therefore, no economic or other impacts to the cruise ship industry for modifying their own ships and operational procedures, as well as for covering the costs of discharging their effluent to the regional wastewater system are identified.

20 Cruise Ship Wastewater Management Report, August 2007
Beneficial use options for biomass have not been developed yet. However, a change in management practices that involves off-loading biomass from cruise ships for treatment rather than discharge beyond the 12 nautical-mile limit would represent a significant change in management practices. This could have economic and operational impacts to the cruise lines because it would involve employing a trucking operation to off-load and transport biomass to the South Treatment Plant. It may also require modifications to each ship to pump biomass to shore as well as manage potential odors and other impacts. Additionally, the cruise lines would have to pay the cost of discharge and treatment at the South Plant. As mentioned earlier, each cruise ship generates, approximately 35 tons (including water content) of biomass per day. Therefore, costs would be incurred by the cruise lines for each port call at the Port of Seattle if biomass were off-loaded for treatment and beneficial use. It is anticipated that these cost impacts will be further defined and quantified as the Department of Ecology, the cruise lines, and the Port discuss beneficial use options.
7. A recommendation regarding any appropriate council action; and
Based on the results of the study, it is recommended that the Wastewater Treatment Division provide technical assistance to the Department of Ecology, the cruise lines, and the Port of Seattle as they work to develop options for managing biomass from cruise ships. At this time, appropriate Council actions could include directing that the Wastewater Treatment Division to continue to work cooperatively with these three entities. Additionally, the Council could direct the Wastewater Treatment Division to report back to the Council, or an appropriate Council Subcommittee(s), on progress made by all parties in the development of management options for biomass from cruise ships.