Embed Size (px)
Citation preview

BAS Ref.: JR50 Copy No: 1
CRUISE REPORT
RRS James Clark Ross
Cruise JR50
July 2000
R.D. Larter
Completed 26/7/2000
Distribut ion:
1. Headquarters - Archives2. Headquarters - Geological Sciences Division (for circulation)3. RRS James Clark Ross (for circulation)4. Dr R D Larter5. JR50 participants (for circulation)6. Directorate (for circulation)7. BAS Technical Services (for circulation)8. Prof. J A Dowdeswell (University of Bristol)

RRS James Clark RossCruise JR50
July 2000
R.D. Larter, Chief Scientist
26/7/2000
C.R. Elliott, Master
26/7/2000
This unpublished report contains initial observations and conclusions. It is not to be cited without written permission of the Director, British Antarctic Survey.

Contents
Page
1 Summary 1
2 List of Personnel 2
3 Timetable of Events 4
4 List of Scientific Equipment Used 5
5 Introduction 6
6 Equipment Performance
6.1 EM120 Multibeam Echo Sounder 96.2 Neptune, Poseidon and MB-System Software 136.3 TOPAS Sub-Bottom Profiler and Post-Processing Software 166.4 Networking of Sonar Workstations 206.5 Sound Velocity Profiling System 226.6 Seapath Vessel Motion Monitoring System 256.7 Kongsberg Simrad Sonar Synchronisation Unit 256.8 Pre-Existing Echo Sounders 266.9 Sound Velocity Monitor 276.10 XBT System 286.11 Shipboard Three-Component Magnetometers 296.12 Navigation Systems 306.13 NOAA Shipboard Computing System (Data Logging System) 31
7 Recommendations 33
Appendices
A1 JCR Sonar Workstations 38
A2 Source Code for Sound Velocity Monitor 42
Figures
Page
1 JR50 cruise track overlaid on shaded-relief display of regional bathymetry 72 Detailed track chart showing sonar Sea Acceptance Test surveys in the Aegir 8
Ridge area3 Shaded-relief and contour display of bathymetric data collected with the 10
EM120 system during part of the Sea Acceptance Test survey, post-processed by Kongsberg Simrad personnel using Neptune software
4 Shaded-relief display of a single swath of bathymetric data collected with the 12EM120 system in the Faeroe-Shetland Channel prior to calibration
5 Bathymetric map of the southwestern tip of the Aegir Ridge axial rift, 14produced by processing EM120 data from lines 1–5 using Neptune software while the survey was still in progress
6 Shaded-relief display of the Aegir Ridge bathymetric data shown in Figure 5, 15also produced using Neptune while the survey was still in progress
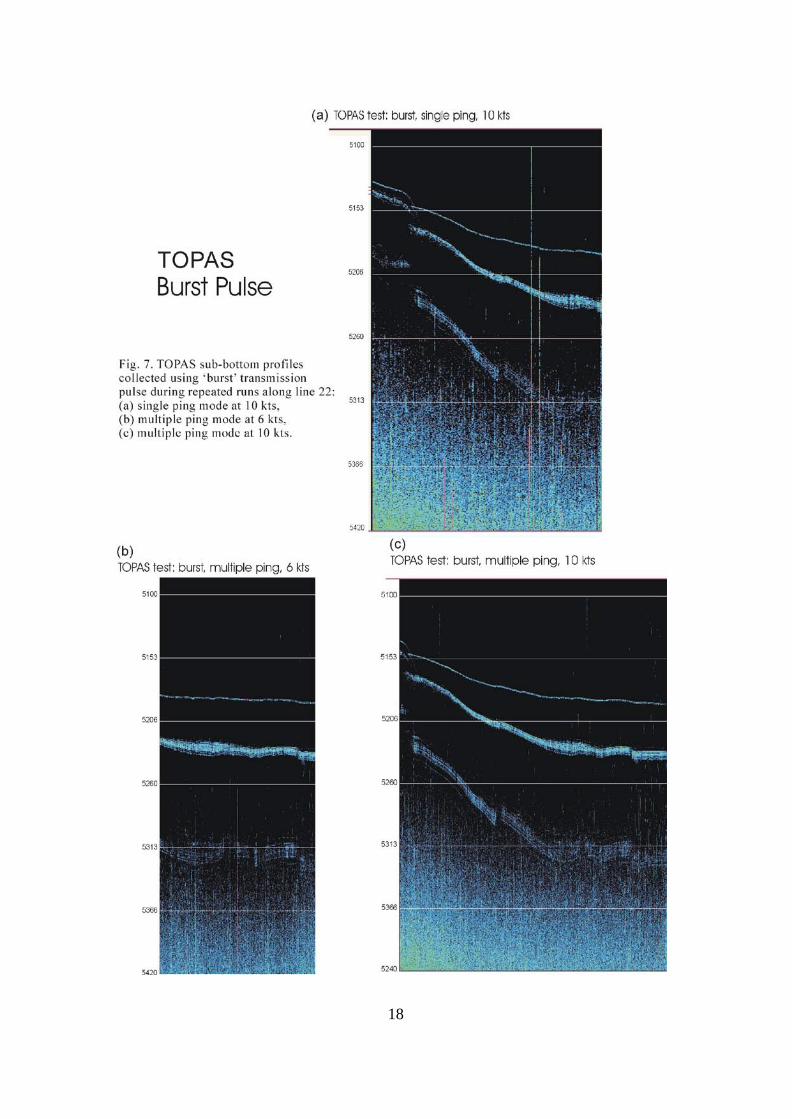
7 TOPAS sub-bottom profiles collected using ‘burst’ transmission pulse 17during repeated runs along line 22: (a) single ping mode at 10 kts, (b) multiple ping mode at 6 kts, (c) multiple ping mode at 10 kts
8 TOPAS sub-bottom profiles collected using ‘chirp’ transmission pulse 18during repeated runs along line 22: (a) single ping mode at 10 kts, (b) multiple ping mode at 6 kts, (c) multiple ping mode at 10 kts
9 Comparison of sound velocity profile from SVP station 3 with that derived 28from XBT station 3 assuming constant salinity
Plates
Frontispiece Photomontage of scenes during installation of the multibeam echo sounder at A&P Tyne Ltd, Wallsend, together with an image of RRS James Clark Ross operating in Antarctica (P. Bucktrout, BAS)
1 JR50 Scientific and Technical Party 32 EM120 and TOPAS operation centre 113 The SVplus sound velocity probe 224 Deployment of the sound velocity probe using the CTD wire and 23
midships gantry
Tables
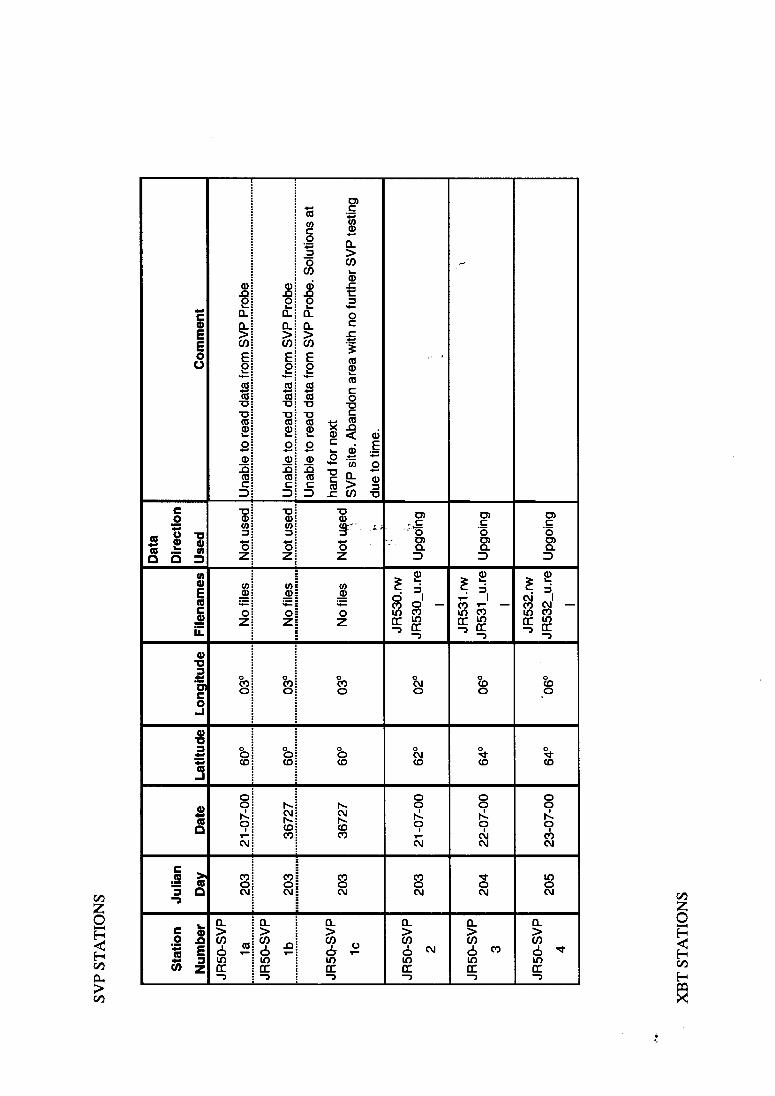
1 Survey lines - Aegir Ridge region 352 SVP stations 363 XBT stations 37
1
1. SUMMARY
Cruise JR50 comprised trials of new scientific equipment installed on RRS James Clark Ross
during the summer refit. These trials mainly consisted of Sea Acceptance Tests of the new
multibeam echo sounder and sub-bottom profiler, the purchase and installation of which was
funded by an award from the Joint Infrastructure Fund. The cruise also provided an opportunity
to test pre-existing echo sounding systems following refitting of transducers, and to prove the
newly-installed NOAA Scientific Computing System.
The Sea Acceptance Tests were successful and demonstrated that the new EM120 multibeam
echo sounder can provide higher resolution sea-floor imagery than any other multibeam system
presently in operation on a civilian vessel. Following the cruise there were some minor issues to
resolve before the new sonar systems could be accepted, but these were second order problems
which mainly related to some of the ancillary equipment. The fact that these systems worked so
well from the outset is a t ribute to the hard work, skill and dedication of everyone working for
Kongsberg Simrad, BAS Technical Services, Burness Corlett & Partners, and A & P Tyne Ltd
who was involved in their installation.

2
2. LIST OF PERSONNEL
2.1 Scientific and Technical (21)
R.D. Larter BAS Chief ScientistR.A. Livermore BAS GeophysicistL. Vanneste BAS GeophysicistJ. Evans BAS Sedimentologist/Mar ine GeologistP. Morris BAS Geophysicist/Database ManagerA.P. Cunningham BAS GeophysicistC. O’Cofaigh Bristol University Sedimentologist/Marine GeologistJ. Taylor Bristol University GeophysicistD.M. Blake BAS Head of Technical ServicesS.F. Bremner BAS Head of ETS (Mechanical Engineer)M.O. Preston BAS ETS (Electronic Engineer)J.K. Summers BAS Manager of ITS (Computer Engineer)B.J. Lamden BAS ITS (Computer Engineer)A.T. Barker BAS ITS (Computer Engineer)P.C.D. Lens BAS ITS (Computer Engineer)J. Dyberdal Kongsberg TOPAS EngineerM. Krangsas Kongsberg TOPAS EngineerS.-I. Solum Kongsberg TOPAS EngineerG.F. Skogen Kongsberg Swath Bathymetry EngineerK. Aasekjer Kongsberg Swath Bathymetry EngineerN.J. Roberts BAS Paramedic
2.2 Ship’s Officers (13)
C.R. Elliott MasterR.C. Paterson Chief OfficerD.B.G. Gooberman 2nd OfficerP. Heslop 3rd OfficerJ.W. Summers Deck OfficerD.J. Cutting Chief EngineerW.R. Kerswell 2nd EngineerR.A. Coe 3rd EngineerS.J. Eadie 4th EngineerC.A. Waddicor Radio OfficerS.A. Wright Deck EngineerN.E. Thomas Electrica l EngineerK.R. Olley Caterin g Officer
2.3 Crew (15)
G. Stewart Bosun C.R. Prat ley Senior StewardD.O. Williams Bosun’s mate T.N. Dixon StewardP.I. Clarke Seaman F. Hardacre StewardJ.J.M. McGowan Seaman J. Newall StewardJ.A. Baker Seaman M.A. Blaby Seaman J.P. Kennedy Seaman S.F. Smith MotormanM.A. Robinshaw MotormanR.W. Fox Chief CookD.P. McLean 2nd Cook
3
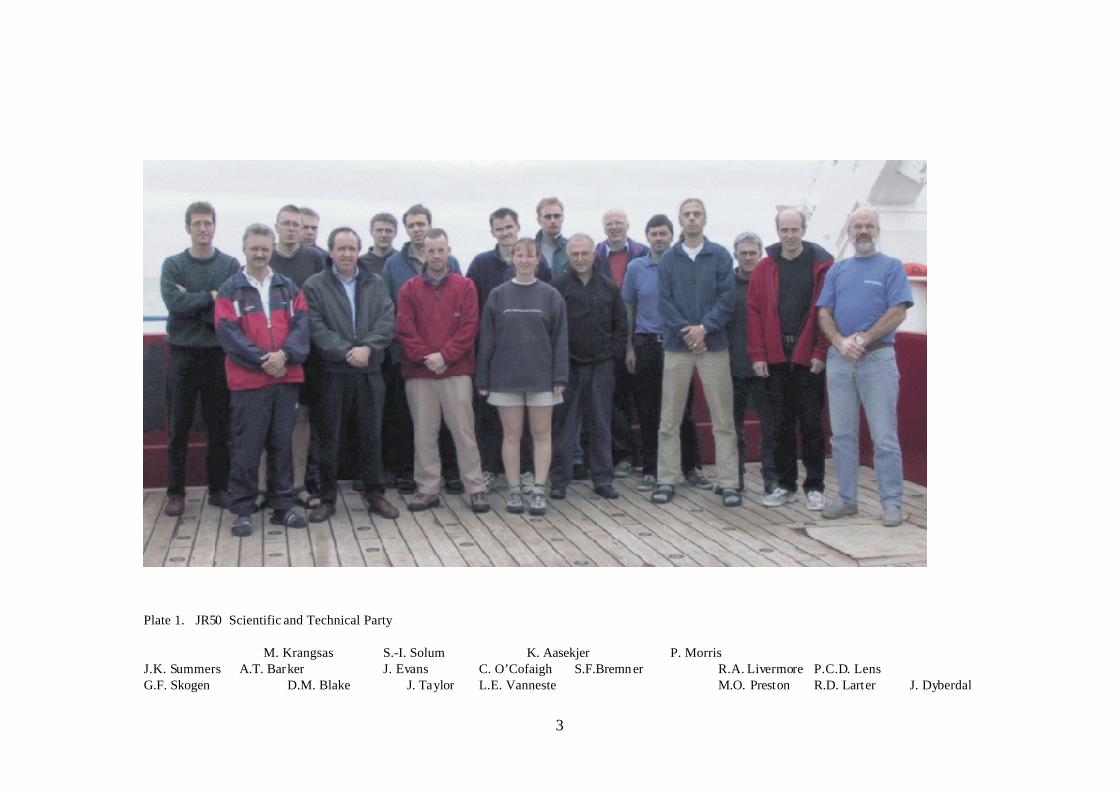
Plate 1. JR50 Scientific and Technical Party
M. Krangsas S.-I. Solum K. Aasekjer P. MorrisJ.K. Summers A.T. Barker J. Evans C. O’Cofaigh S.F.Bremner R.A. Livermore P.C.D. LensG.F. Skogen D.M. Blake J. Taylor L.E. Vanneste M.O. Preston R.D. Larter J. Dyberdal

4
Not on photograph: A.P. Cunningham, B.J. Lamden
5
3. TIMETABLE OF EVENTS
July 2000
13 RRS James Clark Ross leaves dry dock after refit and transducer installation.
14 Harbour Acceptance Trials and commissioning of new sonar systems.
15-18 Mobilisation of equipment for subsequent Arctic cruise (JR51).
19 Ship departs from A&P Tyne at 13:30 GMT and engine trials are carried out offshore
from the Tyne.
20 Passage to Faeroe-Shetland Channel (FSC). Start logging dat from Shipboard Three-
Component Magnetometer and EA500 echo sounder at 20:00.
21 First short, uncalibrated EM120 multibeam echo sounder test line along slope on
southeastern flank of FSC, then first Sound Velocity Profiler (SVP) deployment. Carry
out noise and interference tests on EM120 and TOPAS sub-bottom profiler while heading
NNE across FSC, then second SVP station, first XBT deployment and EM120 calibration
manoeuvres near northwestern flank of FSC.
22 Passage to Aegir Ridge. EM120 Tx stopped during first part of passage to allow
monitoring of Seapath system. On arrival at Aegir Ridge, carry out third SVP station on.
Commence EM120 trial survey. Deploy two more XBTs (one failed to log).
23 Continue EM120 trial survey, deploying fourth XBT and stopping for fourth SVP station.
24 Complete EM120 trial survey, then run TOPAS trial lines in axial trough of Aegir Ridge.
Commence passage to Bodø, continuing operation of EM120 and TOPAS.
25 Continue passage to Bodø into strong headwind. Kongsberg Simrad personnel hold
training courses on EM120 and TOPAS operation.
26 Arrive Bodø at 14:00 GMT.

6
4. LIST OF SCIENTIFIC EQUIPMENT USED
4.1 Echo Sounders
Kongsberg Simrad EM120 multibeam echo sounderKongsberg Simrad TOPAS PS018 sub-bottom profilerKongsberg Simrad EA500 (Bridge navigational echo sounder)Kongsberg Simrad EK500 (biological echo sounder)Kongsberg Simrad sonar synchronisation unit
4.2 Potential Field Equipment
2 x Shipboard three-component magnetometers
4.3 Sound velocity profiling systems
2 x Sound velocity probesXBTs Acoustic Doppler Current Profiler (ADCP )Thermosalinograph
4.4 Navigation
Trimble 4000DS GPS receiverSkyfix differential GPS demodulator (input to Trimble receiver)Ashtech G24 GPS+GLONASS receiverLeica MX 400 2 x Ashtech G12Ashtech 3D GPS receiver Seapath (input to EM120 and TOPAS)TSS300 heave, roll and pitch sensorChernikeeff Aquaprobe Mk5 electromagnetic speed logSperry doppler speed logGyro
4.5 Data Logging
NOAA Scientific Computer System (SCS) system
4.6 Winches
CTD wire on 10-ton traction winch (for sound velocity profiler deployment)
7
5. INTRODUCTION
The main purpose of Cruise JR50 was to carry out Sea Acceptance Tests of new sonar systems
and ancillary equipment which had been installed on RRS James Clark Ross (JCR) during the
preceding few weeks. The purchase and installation of the new sonar systems was funded by an
award from the Joint Infrastructure Fund (ref. GR3/JIF/02) to the University of Bristol, which
resulted from a consortium bid by scientists from the University of Bristol, BAS, and the
University of Oxford. Following a multiple tender exercise the new systems were purchased from
the Norwegian company Kongsberg Simrad. These systems are a deep-water multibeam echo
sounder (EM120) with 1°x1° acoustic beams, and a parametric sub-bottom profiler (TOPAS). As
JCR is regularly required to operate in areas of dense sea ice and in areas where the draught of
the vessel is of critical importance, the transducers had to be recessed into the ship in such a way
that the covering windows were flush with the hull. The size of the transducer arrays combined
with the fact that JCR is an ice-strengthened vessel presented a major engineering challenge.
Both the EM120 and TOPAS systems are designed primarily for operation in oceanic water
depths, and therefore to conduct rigorous tests it was necessary to go to an area with water
depths greater than 3000 m. The nearest area to the Tyne, where the systems were installed, with
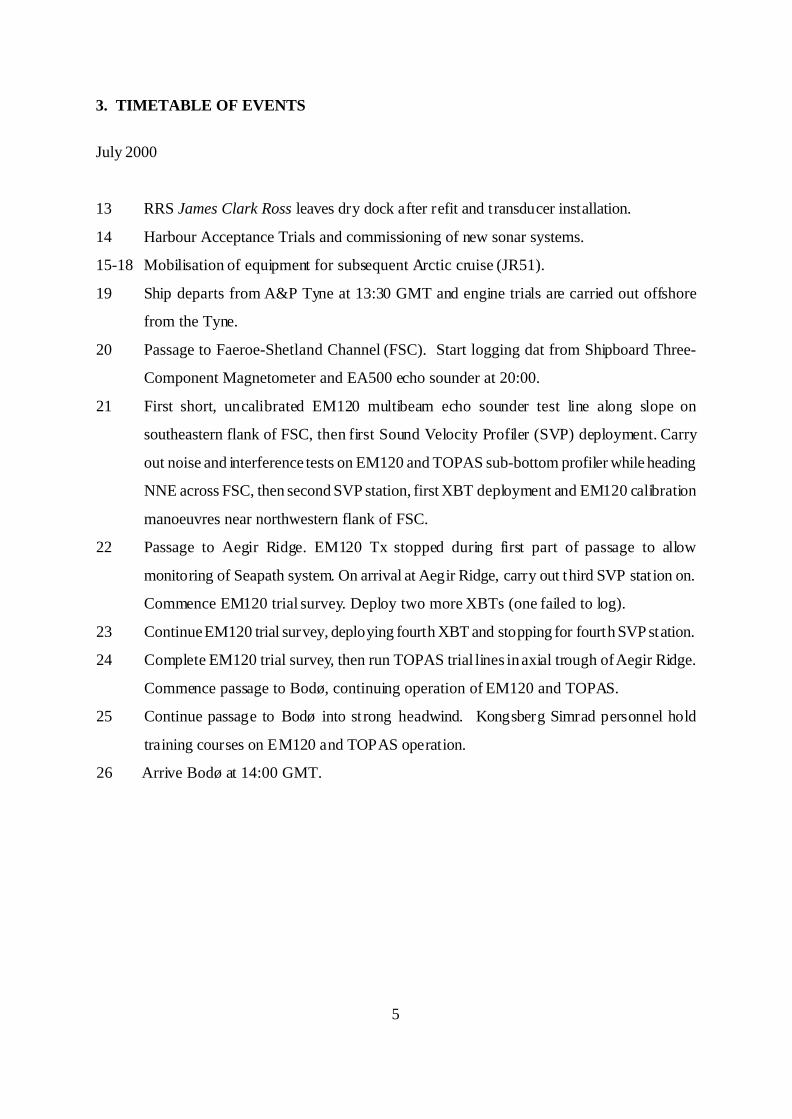
such deep water is in the Norwegian Sea (Figs 1 and 2). Furthermore, the working areas for the
following cruise were further north in the Norwegian-Greenland Sea, so carrying out the Sea
Acceptance Tests between the Tyne and Bodø minimized the time spent on passage. Fortuitously,
the area which these considerations dictated we go to is also of considerable geological interest,
containing a fossil spreading ridge which was part of the plate boundary between Europe and
North America until about 25 million years ago.
In addition to testing the EM120 and TOPAS systems themselves, the Sea Acceptance Tests also
involved trials of a range of ancillary systems provided as part of the contract with Kongsberg
Simrad. These included the Seapath vessel motion monitoring system, the sonar synchronisation
unit, the sound velocity profiling system, and software for post-processing EM120 and TOPAS
data. It was also necessary to test the performance of pre-existing echo sounding systems on the
vessel, the transducers for which had been removed during the installation of the new systems and
subsequently refitted. The degree to which the pre-existing and new sonar systems would
interfere with one another, both with an without sequencing, also required evaluation. Finally the
cruise provided an opportunity to test both the newly-installed NOAA Scientific Computing
System, and a novel approach to real-time monitoring of variations in acoustic velocity of surface
water.
8
Fig 1. JR50 cruise track overlaid on shaded-relief display of regional bathymetry.
9
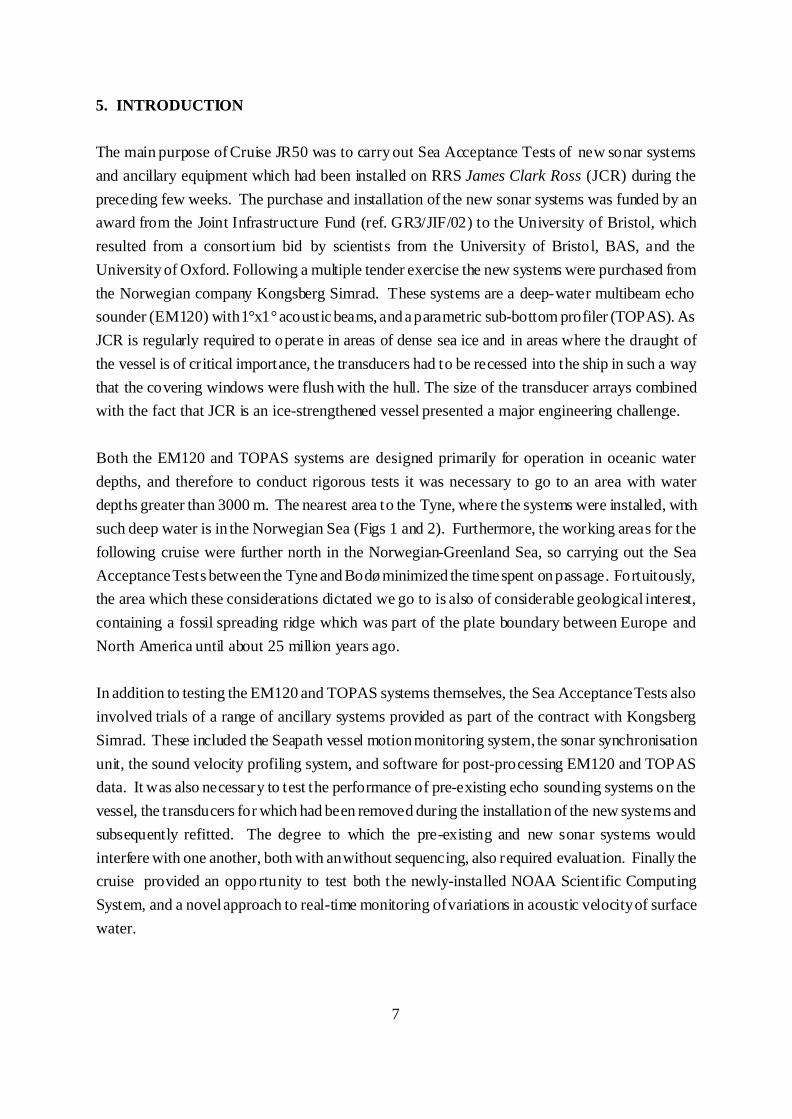
Fig 2. Detailed track chart showing sonar Sea Acceptance Test surveys in the Aegir Ridge area.
Annotations in blue and red indicate time and date. Numbers annotated in black on cruise track are
survey line numbers as listed in Table 1.
10
6. EQUIPMENT PERFORMANCE
6.1 EM120 Multibeam Echo Sounder (RDL)
6.1.1 Introduction
During JR50 the Kongsberg Simrad EM120 multibeam echo sounder was operated for the first
time on RRS James Clark Ross. This system is the first EM120 to be delivered with 1°x1°
acoustic beam widths, and will provide UK marine scientists with the opportunity to image the
deep ocean floor at unprecedented resolution. It is to be hoped that maximum advantage will be
taken of this opportunity, particularly during the year or two before other research vessels are
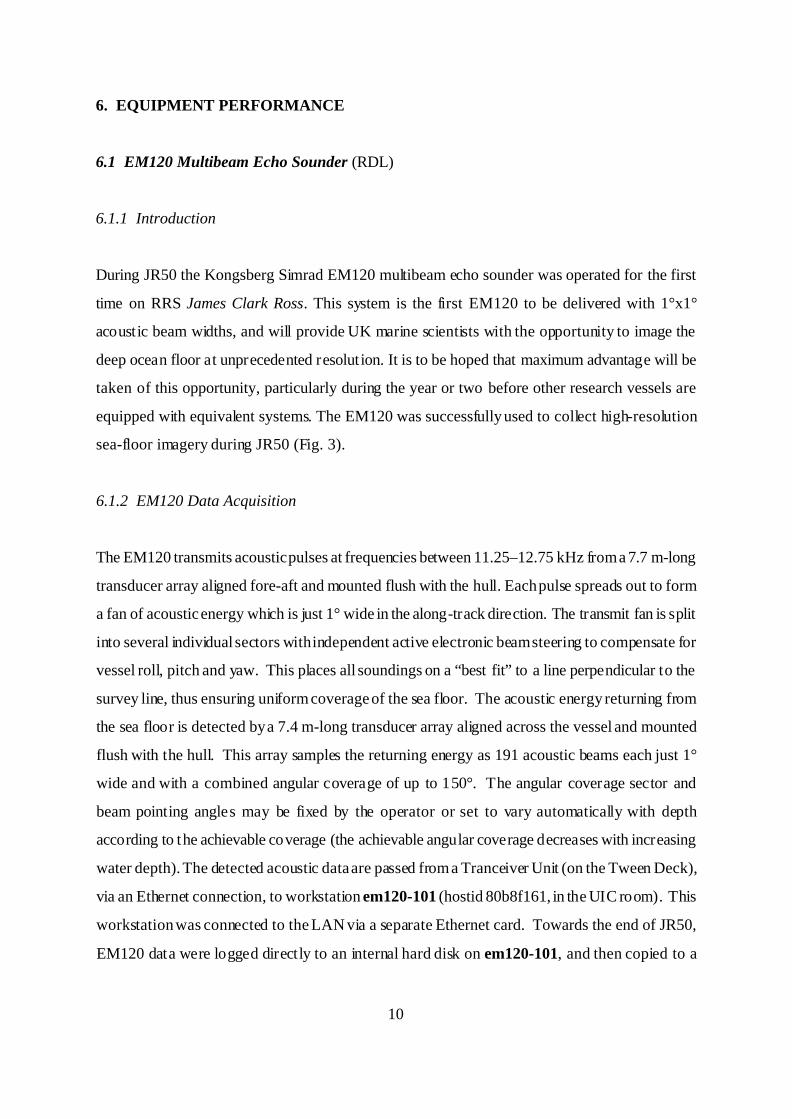
equipped with equivalent systems. The EM120 was successfully used to collect high-resolution
sea-floor imagery during JR50 (Fig. 3).
6.1.2 EM120 Data Acquisition
The EM120 transmits acoustic pulses at frequencies between 11.25–12.75 kHz from a 7.7 m-long
transducer array aligned fore-aft and mounted flush with the hull. Each pulse spreads out to form
a fan of acoustic energy which is just 1° wide in the along-track direction. The transmit fan is split
into several individual sectors with independent active electronic beam steering to compensate for
vessel roll, pitch and yaw. This places all soundings on a “best fit” to a line perpendicular to the
survey line, thus ensuring uniform coverage of the sea floor. The acoustic energy returning from
the sea floor is detected by a 7.4 m-long transducer array aligned across the vessel and mounted
flush with the hull. This array samples the returning energy as 191 acoustic beams each just 1°
wide and with a combined angular coverage of up to 150°. The angular coverage sector and
beam pointing angles may be fixed by the operator or set to vary automatically with depth
according to the achievable coverage (the achievable angular coverage decreases with increasing
water depth). The detected acoustic data are passed from a Tranceiver Unit (on the Tween Deck),
via an Ethernet connection, to workstation em120-101 (hostid 80b8f161, in the UIC room). This
workstation was connected to the LAN via a separate Ethernet card. Towards the end of JR50,
EM120 data were logged directly to an internal hard disk on em120-101, and then copied to a
11
separate RAID system, to prevent the local disk from filling to capacity. This configuration was
chosen to prevent the interruption of EM120 data logging in the event of the workstation hosting
the RAID being rebooted, or any other problem with that machine or the RAID.
Fig.3. Shaded-relief and contour display of bathymetric data collected with the EM120 system during
part of the Sea Acceptance Test survey, post-processed by Kongsberg Simrad personnel using Neptune
software.

12
Plate 2. EM120 and TOPAS operation centre in forward
starboard corner of the Underway Instrumentation and
Control (UIC) room. This space was previously a dark
room.
6.1.3 EM120 Operation and Performance
The EM120 system was first operated, for a brief period, on 21st July on a track along the slope
on the southeastern flank of the Faeroe-Shetland Channel. A single swath of multibeam echo
sounder data was recorded on the approach to Sound Velocity Profiler (SVP) station 1a (Table
2). At this t ime no calibration of roll, pitch or heading offset had been carried out, and no
information about water velocity structure had been entered into the system. As a result the
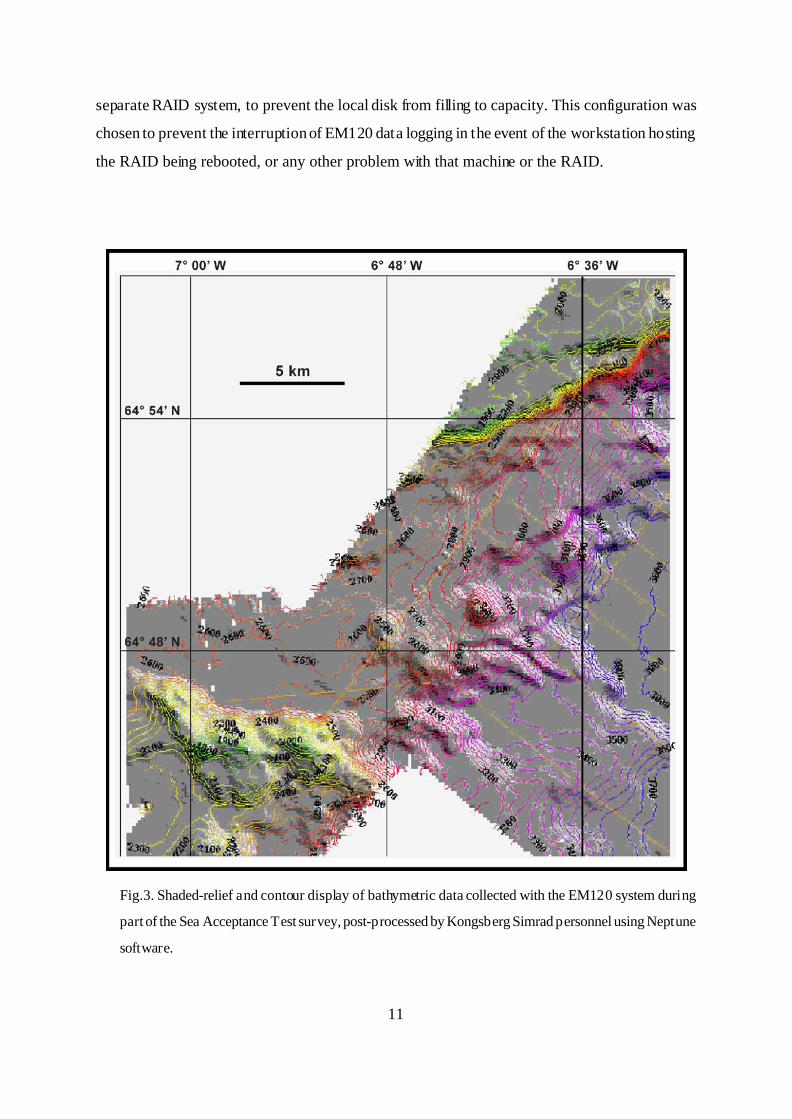
depths recorded along this swath are unreliable. Nevertheless, a shaded-relief display of the data
on this swath showed that, even prior to any calibration, the EM120 was able to resolve small
channels in water depths of 800–900 m (Fig. 4). These channels had previously been imaged
using the TOBI deep-towed sonar and are known to be 50–250 m wide and up to 40 m deep. No
further data were collected in this area because there were some initial difficulties in operating the
SVP, and it was decided that we would continue on passage while these were resolved.
A successful SVP deployment (SVP station 2) was carried out near the northwestern flank of the
Faeroe-Shet land Channel later the same day. After downloading the SVP data to the EM120
operator station (workstation em120-101), data were collected along several short tracks for
system calibration. Evaluation of data from these tracks and subsequent reversed tracks in the
Aegir Ridge area (tracks 2, 2a and 2b in Table 1) resulted in a final estimate of roll offset of 0.30°,
and final estimates of pitch and heading offsets of 0.00°. As expected, the calibration tracks
indicated no position time delay, since GPS was used for navigation and time stamping of data.
13
Fig. 4. Shaded-relief display of a single swath of bathymetric data collected with the EM120 system
in the Faeroe-Shetland Channel pr ior to calibration.
Earlier on 21st July, measurements were made of the noise levels recorded by the EM120 at
different speeds, both with and without the EA500 and TOPAS systems in operation.
Measurements were made at 4, 6, 8, 10 and 12.5 knots. An interesting result of these
measurements is that ambient noise levels were lower at 10 knots than at either 8 or 12.5 knots,
and only very slightly higher than at 6 knots. This suggests that the optimum speed for collecting
high quality multibeam echo sounder data on JCR, while maintaining a fairly rapid rate of
progress, is about 10 knots.
The main Sea Acceptance Test survey in the Aegir Ridge area commenced shortly after 2100 on
22nd July (Figs 1 and 2). A SVP deployment (SVP station 3) was carried out immediately before
the start of the survey, and the measured water velocity structure was used during the survey to
correct for beam refraction effects. The first five survey lines were run at a spacing of 2 km (see
Fig. 2 and Table 1), less than one quarter of the achievable swath width over the 3800 m-deep

14
axial trough of the Aegir Ridge. This permitted verification that depths determined from beams
near the edge of the swath were consistent with those measured directly beneath the vessel.
These first five lines were run at 10 knots. Subsequently it was not possible to increase speed
because of dense fog. The fog eventually cleared at 1250 on 23rd July, at the start of line 10, and
this and subsequent EM120 survey lines were run at 12 knots.
The only significant problem encountered during the survey was when a reboot of the post-
processing workstation (em120-102) crashed both the EM120 and TOPAS operator stations at
0010 on 23rd July. This occurred because the operator stations were initially configured to log
data directly to the RAID system, which is attached to the post-processing workstation. As a
result of this experience a different workstation network arrangement has been implemented for
future cruises (see above section and section 6.4.3).
An observation relevant to any possible environmental impact of the EM120 and TOPAS systems
is that a pod of six killer whales passed within half a mile of the post side of the vessel between
1410–1415 on 23rd July, near the start of line 12, when both systems were operating. It is
interesting to note that they did not choose to avoid such a close approach to the ship.
6.2 Neptune, Poseidon and MB-System Software (RDL)
The Kongsberg Simrad Neptune software provides facilities for post-processing of bathymetric
data collected by multibeam echo sounders. It includes tools for cleaning and filtering of
navigation data, analysis and correction of depth data, tidal height adjustment, automated data
cleaning based on statistical rules, manual editing, and export of processed sounding data.
The Kongsberg Simrad Poseidon software provides facilities for post-processing of acoustic
amplitude (“sidescan”) data collected by multibeam echo sounders. It includes tools for editing
and interpolation of sidescan data, compensation for range-dependent amplitude variations,
mosaicing, and export of processed sidescan data.
15
Both Neptune and Poseidon were installed on workstation em120-102 (host id 80c05482, in the
UIC room). As evaluation of the data collected during JR50 constituted a key element of the Sea
Acceptance Tests, it was agreed that all processing of multibeam echo sounder data during the
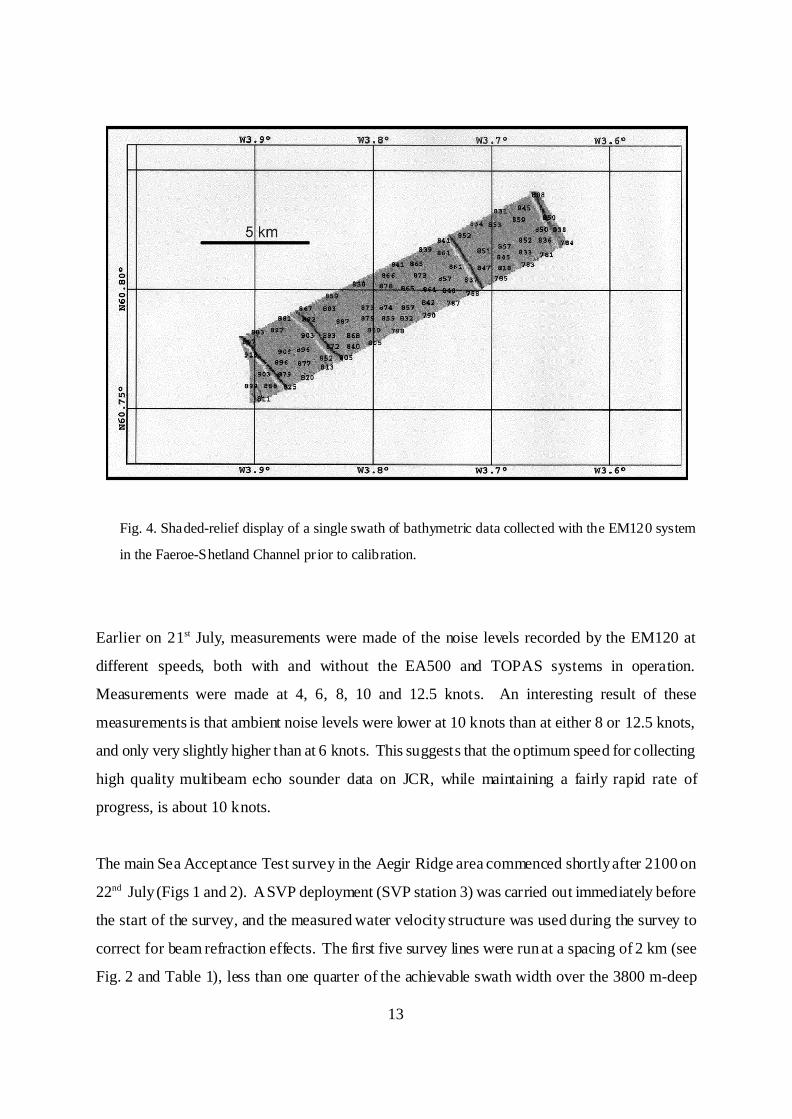
cruise would be carried out by Kongsberg Simrad personnel. Neptune was used to produce
interim bathymetric charts of the Aegir Ridge area while the Sea Acceptance Test survey was still
in progress (Figs 5 and 6). This demonstrated that charts showing preliminary processed data can
be produced using Neptune within half an hour of completing data acquisition. Poseidon was
not used extensively during JR50, but a number of people from BAS Geological Sciences
Divisions and the University of Bristol attended Neptune and Poseidon training courses shortly
before the cruise and are familiar with operation of both software packages.
Fig. 5. Bathymetric map of the southwestern tip of the Aegir Ridge axial rift, produced by processing
EM120 data from lines 1–5 using Neptune software while the survey was still in progress.
16
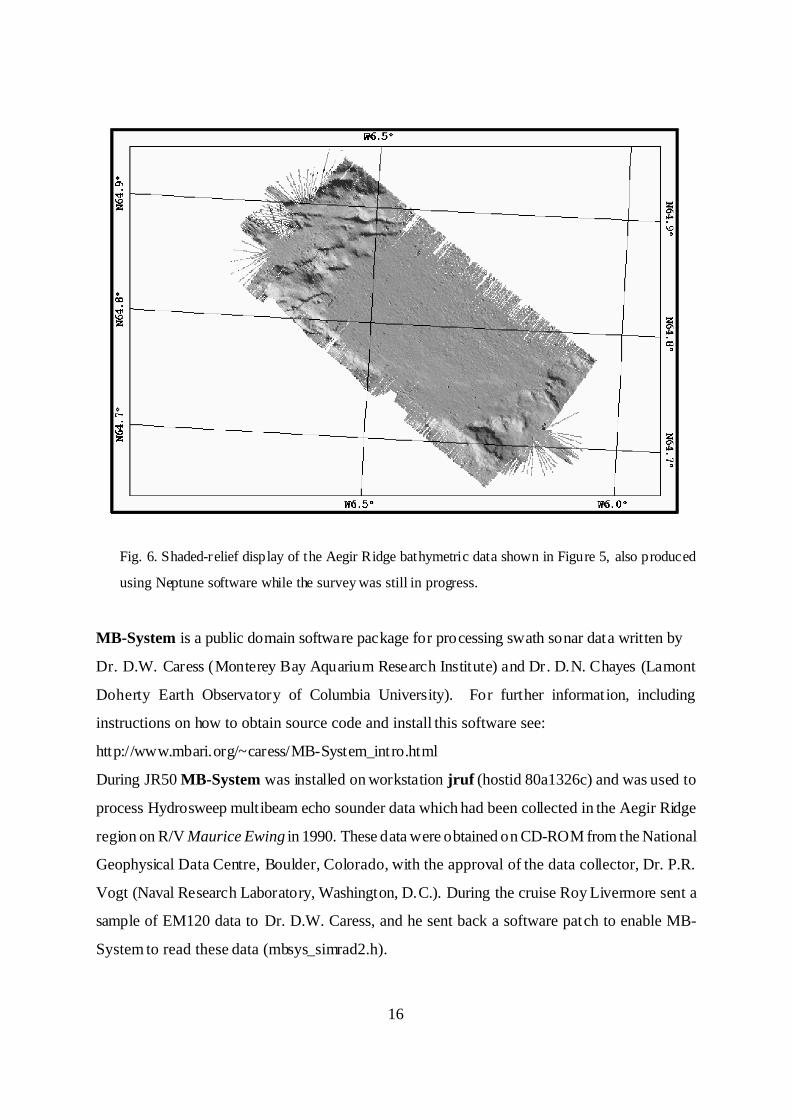
Fig. 6. Shaded-relief display of the Aegir Ridge bathymetric data shown in Figure 5, also produced
using Neptune software while the survey was still in progress.
MB-System is a public domain software package for processing swath sonar data written by
Dr. D.W. Caress (Monterey Bay Aquarium Research Institute) and Dr. D.N. Chayes (Lamont
Doherty Earth Observatory of Columbia University). For further information, including
instructions on how to obtain source code and install this software see:
http://www.mbari.org/~caress/MB-System_intro.html
During JR50 MB-System was installed on workstation jruf (hostid 80a1326c) and was used to
process Hydrosweep multibeam echo sounder data which had been collected in the Aegir Ridge
region on R/V Maurice Ewing in 1990. These data were obtained on CD-ROM from the National
Geophysical Data Centre, Boulder, Colorado, with the approval of the data collector, Dr. P.R.
Vogt (Naval Research Laboratory, Washington, D.C.). During the cruise Roy Livermore sent a
sample of EM120 data to Dr. D.W. Caress, and he sent back a software patch to enable MB-
System to read these data (mbsys_simrad2.h).

17
6.3 TOPAS Sub-Bottom Profiler and Post-Processing Software (APC)
6.3.1 Introduction
During JR50, the Kongsberg Simrad TOPAS sub-bottom profiler was operated for the first t ime
on RRS James Clark Ross. TOPAS was successfully used to collect high-resolution sub-bottom
profiles on passage and test tracks (Figs 7 and 8), and during periods of EM120 multibeam
survey.
6.3.2 TOPAS Data Acquisition
The TOPAS system transmits and receives acoustic pulses via an array of 64 hull-mounted
transducers, and uses effects of non-linear propagation and interference in the water column to
generate a variety of signatures, including Ricker and zero-phase ‘burst’ wavelets and swept-
frequency chirps. Each ‘ping’ is recorded with att itude data supplied by a vertical reference unit,
and navigation data provided by the Seapath system. The attitude data are used to compute and
apply phase adjustments to the signals from each of the 64 transducers in order to steer the
transmitted and recorded signal. During periods of EM120 survey, the TOPAS transmission was
synchronised with that of the multibeam system to prevent interference. However, TOPAS data
were also collected using higher ping rates on passage and test tracks. The recorded acoustic data
were passed via analogue and real-time processors to workstation topas (host id 80c56df9). The
real-time processor is housed in an enclosure fitted above the workstation in the UIC room, and
is connected to it via a dedicated ethernet connect ion. Kongsberg Simrad engineers recommend
the use of a dedicated ethernet because of the high data transfer rates achieved during survey. The
logging workstation was connected to the LAN via a separate Ethernet card. Towards the end
of JR50, TOPAS data were logged directly to an internal hard disk on topas, and then copied to
a separate RAID system, to prevent the local disk from filling to capacity. This configuration was
chosen to prevent the interruption of TOPAS data logging in the event of the workstation hosting
the RAID being rebooted, or any other problem with that machine or the RAID.
18

19
20
6.3.3 TOPAS Post-Processing Software.
TOPAS software (version 2.1, release date 15/6/00) was also mounted on workstation jruf
(hostid 80a1326c) to enable post processing of the recorded data. Kongsberg Simrad engineers
reported ‘no significant’ problems with the installation of the software, or incompatibilities with
the LAN. The TOPAS package and accompanying AVS graphics software were licensed using
‘Flexlm’ software, which requires installation of a separate license key. The license key consists
of an ASCII file containing encrypted information which includes the hostid and nodename of the
parent workstation. During installation, environment variables describing paths for the TOPAS
and licensing software, and data logging directories, were set in the TOPAS user .cshrc file.
TOPAS software includes algorithms for gain recovery, automat ic gain control, bandpass filtering,
deconvolution and the generation of complex trace attributes. These procedures were used during
JR50 to generate a real-time display of processed data. The software also provides a facility to
replay, process and display recorded data. However, version 2.1 does not provide any means to
output processed data to a digital data file. Hence, data processed during JR50 could only be
displayed on the workstation console or the real-time plotter attached to the acquisition system.
It is recommended that future software versions have the capability to export processed data to
output files. The TOPAS package also includes a program ‘TOPAS2Segy’ to convert TOPAS
data files to SEG–Y format, although the format of the output files remains untested by us.
6.3.4 TOPAS Operation and Performance
During operation, it was necessary to periodically adjust the recording gain and delay with
variations in water depth. Recording gains were typically set between 6 and 24 dB, and delays
were set so that the recording window tracked the sea floor. Kongsberg Simrad engineers
suggested that, in future, it would be possible to trigger recording using a two-way-time based
on the centre beam depth provided by the EM120. This could greatly reduce the need for user
intervention during future passage legs. During JR50, the length of the recording window varied
in time according to the sampling rate, but the number of recorded samples was fixed at 8000 per
trace. The system provides a real-time display of the recorded data using the ‘raw trace’ display

21
option. Kongsberg Simrad engineers suggested that the logged data would clip if the amplitude
of the recorded t race exceeded that of the display window, and it is important to check this
regularly during operat ion. Processed traces were also displayed on the workstation console, and
plotted on Waverley and EPC plotters attached to the system. The recorded acoustic, attitude and
navigation data were written to disk using a system-specific disk format.
During JR50, no significant sources of instrumental or mechanical noise were identified in the
TOPAS data. However, cultural noise associated with the maintenance of the ship was recorded
on test profiles (collected to assess the effectiveness of different transmitted pulses). The recorded
signal also deteriorated badly during turns due to aeration under the hull. Similar effects have been
observed in data obtained with the 3.5 kHz system previously installed on the ship.
6.4 Networking of Sonar Workstations (BJL)
There are three Sun Ultra5 workstations associated with the EM120 and TOPAS systems:
em120-101 for EM120 operation and logging; topas for TOPAS operat ion and logging; and
em120-102 for post processing. All three workstations are on the ship's193.61.88 network and
have their system clocks synchronised to the clock on the NOAA Scientific Computer System
(which in turn is synchronised to GPS time from the Trimble 4000DS receiver). See appendix
1 for details relating to these workstat ions.
6.4.1 EM120 Logging Software
This software writes to three directories on the logging system: raw, proc, and shared. The
contents of these directories need to be made available to the Neptune and Poseidon packages
(these packages also use a fourth directory: xyz). It is therefore necessary to copy files across to
the em120-102 RAID system.
If available disk space on the logging system drops below 50MB then logging will automatically
stop. Space can be recovered by deleting older files from the raw and proc directories.
22
The shared directory contains velocity profiles and can be selectively cleared out at the end of
a cruise but the 1500.asvp file must be retained at all times.
New EM120 raw files are started at a set interval. This interval is configurable and 30 minutes
is recommended.
The logging software is run from the em120 user ID.
6.4.2 TOPAS Logging Software
Like the EM120 system the TOPAS data files, stored in /data, need to be copied to the em120-
102 RAID system and older files deleted to make room for logging. There is no need to retain
files between logging sessions.
The logging software is run from the topas user ID.
6.4.3 Data Logging and Backup Arrangements
It was initially thought that it might be possible to log both the EM120 and TOPAS data directly
to the RAID system. However, after an incident when a reboot of em120-102 crashed both
logging workstations simultaneously, it was felt safer to log the data to the local disks on the
em120-101 and topas machines and copy the files to the RAID system later. For the next cruise
a system has been implemented using a program ‘rsync’ which automatically copies new data from
the local disks to the RAID every minute.
Provided that a copy of the raw, proc, and shared directories (for EM120) and /data (for
TOPAS) are kept on the RAID, it is not necessary to backup the local em120-101 and topas
disks regularly. However, it is wise to do this from time to time to aid recovery from system disk
failure. Since data is copied to the em120-102 RAID system, this will need routine daily backups.
23
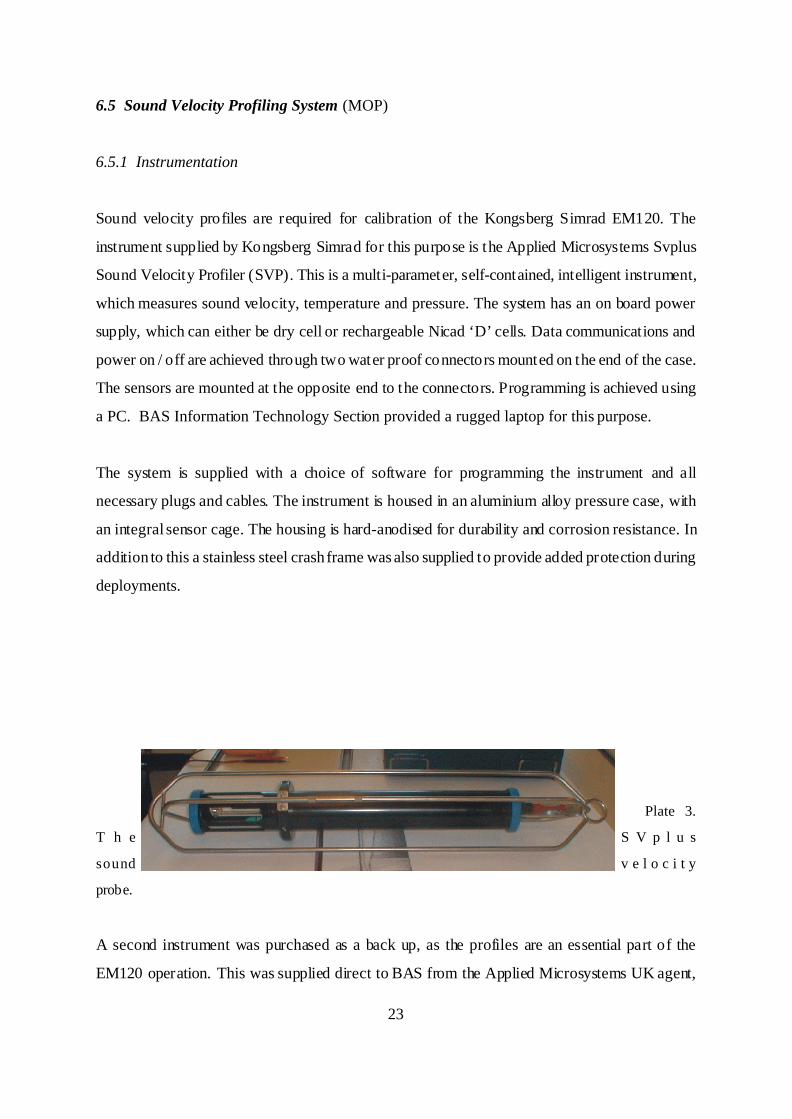
6.5 Sound Velocity Profiling System (MOP)
6.5.1 Instrumentation
Sound velocity profiles are required for calibration of the Kongsberg Simrad EM120. The
instrument supplied by Kongsberg Simrad for this purpose is the Applied Microsystems Svplus
Sound Velocity Profiler (SVP). This is a multi-parameter, self-contained, intelligent instrument,
which measures sound velocity, temperature and pressure. The system has an on board power
supply, which can either be dry cell or rechargeable Nicad ‘D’ cells. Data communications and
power on / off are achieved through two water proof connectors mounted on the end of the case.
The sensors are mounted at the opposite end to the connectors. Programming is achieved using
a PC. BAS Information Technology Section provided a rugged laptop for this purpose.
The system is supplied with a choice of software for programming the instrument and all
necessary plugs and cables. The instrument is housed in an aluminium alloy pressure case, with
an integral sensor cage. The housing is hard-anodised for durability and corrosion resistance. In
addition to this a stainless steel crash frame was also supplied to provide added protection during
deployments.
Plate 3.
T h e S V p l u s
sound v e l o c i t y
probe.
A second instrument was purchased as a back up, as the profiles are an essential part of the
EM120 operation. This was supplied direct to BAS from the Applied Microsystems UK agent,

24
Ocean Scientific. The second unit is identical to the one supplied by Kongsberg Simrad, with the
exception that one has rechargeable batteries, the other Alkaline ‘D’ cells.
6.5.2 SVP Operation
For the purposes of the trials cruise it was decided that the traction winch and the CTD wire
would be used to deploy the system. Although not ideal the arrangement was effective.
Plate 4. Deployment of the sound velocity probe using
the CTD wire and midships gantry. This was a
temporary arrangement, as a dedicated winch is being
installed for deployment of the probe on future cruises.
The two software packages provided with the
instrument are called Total System Software V1.67
and Procomm. According to the manual the software requires a Windows 95 or DOS operat ing
system. The rugged laptop provided was running on NT. For the purposes of the trials NT was
removed and DOS 6.22 was installed. After installing the Total System Software the instrument
was programmed for a trial deployment. It was decided that the first deployment should be 1000
metres. The instrument was interrogated after the deployment and although there appeared to be
a large file no data could be seen. A second shallow drop was completed with similar results.
After considerable investigation it was discovered that with the sample rate set to 10Hz, the SVP
would turn itself off and start a new file if the instrument was dipped and then raised from the
water by sea swell. This has the affect of nesting the data within the main file. The system allows
this to be done up to 10 times. By setting the sample rate to 1Hz it is possible to make it unlikely
25
that the SVP will start a sub-file as the instrument would have to be lifted out of the water for
more than 10 seconds.
Further deployments were successfully completed (Table 2) and data was transferred via the serial
port on the laptop to the em120-101 workstation. Mark Preston and Alex Cunningham have
written a list of instructions for carrying out this procedure.
6.5.3 Conclusions
The SVP is a very robust and appears to be a reliable instrument. The software and
documentation, however, is rather vague in some areas. Kongsberg Simrad have recent ly
developed a routine for programming the SVP and downloading the data directly to the EM120
operating station (i.e. em120-101 workstation on JCR). This procedure appears to be quite
straightforward but as yet is undocumented, although training has been provided. Kongsberg
Simrad have been tasked to provide adequate documentation.
6.5.4 Future Improvements
In future the SVP will be deployed from a dedicated hydraulic winch which will be situated on the
port side, forecastle deck and will replace the 3.5 kHz towfish deployment winch. This installation
will be completed when the vessel returns to Grimsby after the JR51 Arctic cruise. Data transfer
will be via a dedicated serial cable through the computer room port bulkhead to the em120-101
workstation. It is envisaged that the SVP will be permanently connected to the winch cable.
Communications will be achieved through a waterproof plug and socket arrangement on the port
bulkhead with a suitable cable to the SVP.
6.6 Seapath Vessel Motion Monitoring System (PM)
26
This is the GPS based instrument which provides position, and directional data for the swath
system. It uses two antennae 2.5 m apart on a horizontal beam. This is mounted near the top of
the main mast; a site with excellent sky visibility in all directions. The instrument is also linked to
the MRU (motion reference unit) installed in the Gravity Meter Room, which measures heave,
roll and pitch.
In general the instrument has worked well but there have been a few periods when poor satellite
availability have meant that although it has been able to provide a reasonable ships position the
relative accuracy of the positions from the two receivers has been insufficient to provide a reliable
direction measurement. This is a potentially serious situation as the swath system needs this
direction for correct operation. The ships Ashtech 3D GPS system which works in a similar way
drops out quite frequently on Antarctic cruises, often for significant periods of time. The ships
gyro has now been linked into the system and this should start providing an emergency direction
reading within 2 seconds of any GPS dropout. No further problems have been noted but a close
eye should be kept on the unit during the next season.
6.7 Kongsberg Simrad Sonar Synchronisation Unit (DMB)
The operating frequencies of the EM120 multibeam and TOPAS are adjacent to the centre
frequencies of the existing echo sounder, affording potential for interference and cross
modulation. As part of the multibeam and TOPAS package, a Sonar Synchronisation Unit (SSU)
was specified to sequence gate systems with similar transmit frequencies and avoid interference.
The Kongsberg Simrad SSU was not fully effective during trials and further work will be
necessary between BAS and KS. For the equipment combinations with similar frequencies:
! The EA500 navigation echo sounder is significantly impacted by the EM120 multibeam. The
bottom depth measurement is not reliable and the echogram display is impacted by noise and
spurious traces. It was agreed that for navigation purposes, the EM120 helmsman display
would be used for depth measurement when the multibeam is operating. The mult ibeam will
27
not normally be used in depths of less than 200 metres unless specifically agreed with the
ship’s Master. The EA500 works normally when the multibeam is not transmitting.
! The TOPAS has a limited impact on the operation of the EK500. Although bottom depths
can be measured on the EK500, the TOPAS transmission does cause interference on the
echogram. The EK500 works normally when the TOPAS is not transmitting. As it is very
unlikely that the TOPAS and EK500 will be used concurrently, the interfence generated by
the TOPAS is not considered to be a significant issue of concern.
! The EK500 is not significantly impacted by the EM120 and can operate concurrently with the
multibeam.
! The 10 KHz PES is affected by the EM120 multibeam with significant noise on the echogram,
although bottom depth measurements are still possible.
6.8 Pre-Existing Echo Sounders (DMB)
6.8.1 Introduction
The RRS James Clark Ross was fitted with echo sounders at build, to support a range of
applications:
! Kongsberg Simrad EA500 for navigation
! Kongsberg Simrad EK500 for fish studies
! Acoustic Doppler Current Profiler (ADCP)
! IOS 10 kHz Precision Echo Sounder (PES) for general purpose scientific applications
! IOS 3.5 kHz sub-bottom profiler (SBP) for sediment studies
During the installation of the EM120 multibeam and TOPAS SBP, the transducers for the existing
echo sounders were removed to avoid damage. Before departure for trials the transducers were
28
re–installed in the ship’s hull, with the exception of the IOS 3.5 kHz SBP, and electrical
connections re-made.
6.8.2 Operation of Existing Echo Sounders
During sea trials, the existing echo sounders were powered and checked to determine whether
they operated effectively. All systems acquired and displayed data although the full effectiveness
of the ADCP will require further interpretation.
The opportunity was taken to initiate the permanent installation of the EK500 to improve system
reliability and reduce the chance of equipment damage. A console to house the system will be
installed upon arrival of the ship at Grimsby.
The long term future of the 10 KHz PES needs to be determined once the EM120 multibeam is
in routine operation.
6.9 Sound Velocity Monitor (ATB)
A system has been developed which constantly monitors the speed of sound in the water beneath
the hull. This system was developed to enable operators of the EM120 multibeam system to make
informed decisions about when changes in surface water conditions are great enough to merit
measurement of a new sound velocity profile. The system relies on sea-surface temperature,
temperature at thermosalinograph intake and conductivity from the OceanLogger pc. This
information is logged on the SCS system and then sent via TCP/IP sockets to the remote display
PC in the UIC room.
Using the thermosalinograph temperature and conductivity we can calculate salinity. Then using
salinity and sea-surface temperature it is possible to calculate sound velocity.
The sound velocity system works out a 5 minute average and writes this to a plain text file.

29
Java Source Code containing salinity and velocity calculations is included in appendix 2.
6.10 XBT System (MOP)
The XBT system has been updated and improved recently; the deck unit replaced by a dedicated
card in a PC and the DOS software replaced with a windows 3.11 package. It should be noted
that the software is not Y2K compliant, however this did not seem to affect operation. The system
worked well and three successful XBT profiles were recorded (Table 3).
F i
g. 9. Comparison of sound velocity profile from SVP station 3 with that derived from XBT station 3
assuming constant salinity. Surface water salinity measured by the thermosalinograph was used in the
calculation of sound velocity from the XBT data. The two stations are 20 km apart (see Tables 2 and 3),
but the velocity estimates differ by less than 4 m/s throughout the common depth range.

30
A good correlation between post-processed sound velocity from the XBT and the sound velocity
measurements made with the SVplus was found (Fig. 9), leading to the possibility that XBTs
might be used for the multibeam sound velocity calibration on occasions when it is not feasible
to stop to use the SVP.
It should also be noted that past experience has shown that the XBT card in the PC is very
sensitive to its physical installation in the PC. When it fails to function this can usually be traced
to the card not being exactly in line with the motherboard connector in the PC.
6.11 Shipboard Three-Component Magnetometers (PM)
Only the newer of the two STCM’s on the ship was working at the start of the voyage; the older
one having been declared electrically unsafe. This problem was soon corrected by adding a
suitable earth lead. After updating the software the old STCM then logged to the NOAA system
without problems. The new STCM, however, produced a Level A output which the NOAA
system could not handle. As a suitable compiler was not available with which to modify the
software, the data from this instrument had to be logged separately, using a specially written Java
program.
No calibration turns were carried out during the cruise but it was found possible to use data from
two periods when the ship was turning frequently to calculate two rough sets of calibration
constants. One of these appeared to give much better compensation than the other and was used
to correct all of the data..
As on recent cruises the old STCM is still giving far better quality data than the new one, which
should be remounted elsewhere. The top of the foremast could be an excellent site if it was
possible to run a suitable cable to that position.
31
6.12 Navigation Systems (LEV)
The navigational systems on board comprised:
6.12.1 Trimble 4000DS GPS Receiver
This was the principal scientific navigation unit and operated in differential location mode. The
differential corrections were derived from a Racal Skyfix unit via an Inmarsat feed and applied in
real time by the GPS receiver. The position fixes calculated by the GPS unit were logged to the
NOAA Scientific Computing System (SCS).
6.12.2 Ashtech GG24 GPS/GLONASS Receiver
This was operated throughout the cruise and is known to produce fixes which are more accurate
than those of the standalone (i.e. non-differential) GPS receivers. It was not connected to the
NOAA SCS.
6.12.3 Ashtech G12 GPS System
This dual redundant GPS setup is available for dynamic positioning of the ship. This facility was
not used on JR50.
6.12.4 Leica MX 400 GPS Receiver
This was the primary navigation system used by the bridge. The data from this differential GPS
were logged onto a navigation PC on the bridge but not by the NOAA SCS.
6.12.5 Ashtech 3D GPS and TSSHRP Systems
These instruments provide heading, pitch, roll and heave information. Data from both systems
were logged to the NOAA SCS.

32
6.12.6 Seapath System
This combined differential GPS and motion reference unit provides the navigational data for the
Kongsberg Simrad EM120 multibeam and TOPAS sub-bottom profiler systems (see also section
10). The data were logged by the Kongsberg Simrad systems but not by the NOAA SCS. An
input from the Racal Skyfix unit was added on the afternoon of 21st July (day 203), so after this
the system operated in differential location mode.
6.12.7 Track Planning
A 106 km-long track between a pair of waypoints during the trials revealed a difference between
the methods being used for determining the intended track by the EM120 software and the
SysOps system on the Bridge. The position of the track midway between the two waypoints
calculated by the two systems showed a discrepancy of more than 100 m. We suspect that this
difference resulted from the SysOps being set up to use Mercator projection for track planning
(i.e. tracks are rhumb lines) and the EM120 operating on a UTM projection. It is recommended
that the EM120 track planning software should be configured to operate on the same projection
as the SysOps at the start of future cruises.
6.13 NOAA Shipboard Computing System (Data Logging System) (ATB)
The ABC data logging system on the RRS James Clark Ross has been replaced this summer with
a Windows NT based logging system, provided by the U.S. National Oceanic and Atmospheric
Administration (NOAA) called the Scientific Computer System (SCS).
The SCS program allows data to be logged centrally on a Compaq server featuring RAID disk
tolerance. The SCS package has worked well throughout the JR50 trials. One of the advantages
of the SCS system is the ability to use workstations around the ship as remote displays for the real
time data. Currently we have two remote displays, these are located in the UIC room and the
33
Main Lab. Another advantage of the SCS software is the ability to distribute data over the
network using industry standards such as TCP/IP sockets.
The Data on the SCS system is stored in two formats:
RAW data written to disk in exactly the same format it was sent from the instrument.
ACO ASCII Comma Delimited, data is stored in plain ASCII text.
Once the Data has been logged to disk the ACO files are exported to the Level C using NFS. A
process on the Level C reads the data in and writes to the Level C database. The Level C is being
used primarily to allow scientists to use existing routines to extract the data.
The SCS system cannot log some old Level A applications. These are the winch, gyro and
new_stcm. The solution for this has been to develop some Java applications onboard which can
interface to the Level A’s and log the data direct ly to the Compaq server. The ADCP currently
logs directly to the Level C.
A data monitor program for the winch, gyro and new_stcm has been developed which allows real
time monitoring of data being logged by the Java applications. The DataMon program has three
status levels, green means that the instrument has sent data in the last 30 seconds, yellow denotes
no data received for 30 seconds and red denotes that no data has been received for the last
minute.
Time stamping of data is achieved by synchronising to a GPS receiver. The SCS is also a NTP
server which allows other machines onboard to synchronise their time. With this NTP system in
place we can ensure that the time stamping of data between the SCS system and the new sonar
systems is consistent.

34
7. RECOMMENDATIONS
The following is a list specific recommendations arising from section 6 of this report:
1. When minimising the ambient noise recorded by the EM120 is more important than maximising
rate of progress, the optimum ship speed appears to be about 10 knots.
2. Kongsberg Simrad must be reminded that they have promised to provide an upgrade to the
TOPAS post-processing software which includes the capability to export processed data to digital
files.
3. Kongsberg Simrad should be encouraged implement a real-t ime link between the TOPAS and
the EM120 so that the former can use the centre beam depth from the latter to make its recording
window track the sea floor.
4. During cruises when the EM120 and TOPAS are operated, either separately or together, daily
backups must be made from the RAID system hosted by the post-processing workstation.
5. To minimise the likelihood of the Sound Velocity Profiler concealing data in sub-files a sample
rate of 1 Hz is recommended.
6. Kongsberg Simrad must be reminded that they have promised to provide documentation for
the procedure for downloading Sound Velocity Profiler data directly to the EM120 operating
station.
7. There were some intervals when the GPS input to the Seapath system did not provide reliable
heading information. The Seapath performance should be monitored closely on forthcoming
cruises.
8. Kongsberg Simrad must be reminded that further work is required to improve the performance
of the Sonar Synchronisation Unit.

35
9. When the EM120 is operating the EA500 single-beam echo sounder should be switched off and
depth measurements provided by the EM120 helmsman display should be used for navigational
purposes. The EM120 should not normally be used in water depths of less than 200 m unless
specifically agreed with the ship’s Master.
10. The long term future of the 10 kHz Precision Echo Sounder should be reassessed once the
EM120 multibeam is in routine operation. There may still be a role for it in monitoring and
communicating with acoustic pingers and beacons, many of which operate at 10 kHz.
11. The sensors for the new STCM should be remounted elsewhere. The top of the foremast
could be an excellent site if it was possible to run a suitable cable to that position.
12. At the start of cruises on which the EM120 is to be used it is important to check that the
survey planning tools in the EM120 operating software are configured to operate on the same
projection as the SysOps system.
36
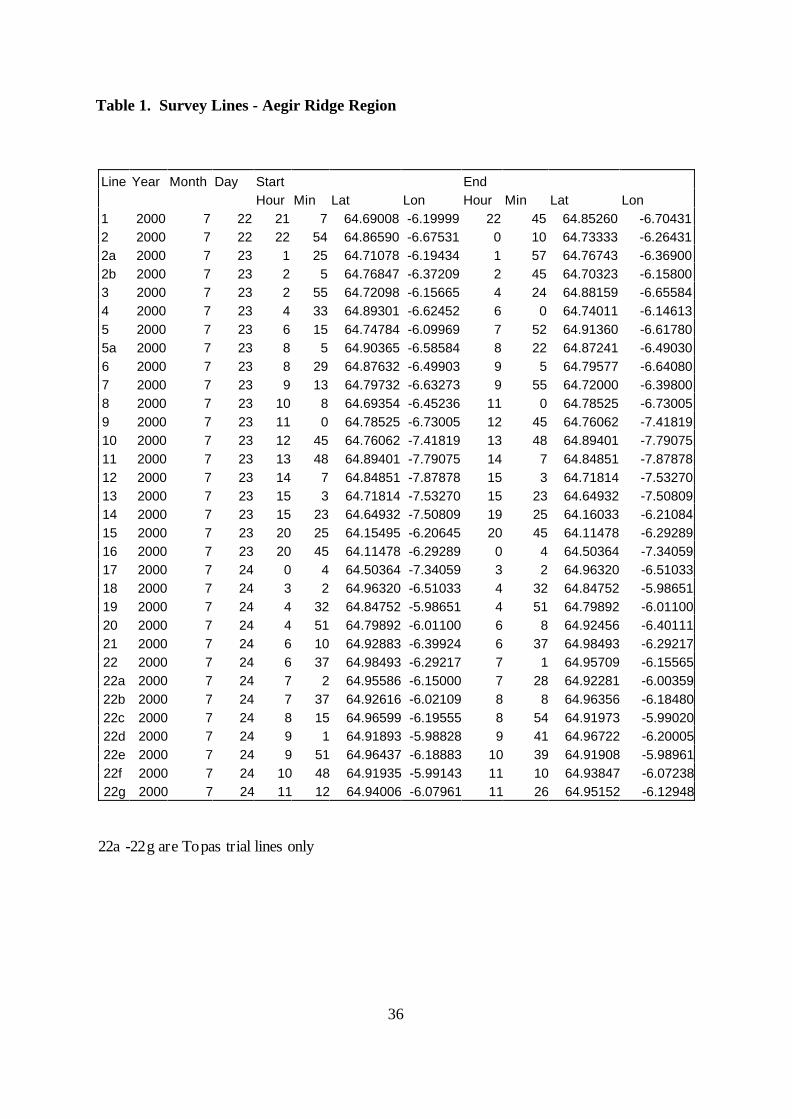
Table 1. Survey Lines - Aegir Ridge Region
Line Year Month Day Start End
Hour Min Lat Lon Hour Min Lat Lon
1 2000 7 22 21 7 64.69008 -6.19999 22 45 64.85260 -6.70431
2 2000 7 22 22 54 64.86590 -6.67531 0 10 64.73333 -6.26431
2a 2000 7 23 1 25 64.71078 -6.19434 1 57 64.76743 -6.36900
2b 2000 7 23 2 5 64.76847 -6.37209 2 45 64.70323 -6.15800
3 2000 7 23 2 55 64.72098 -6.15665 4 24 64.88159 -6.65584
4 2000 7 23 4 33 64.89301 -6.62452 6 0 64.74011 -6.14613
5 2000 7 23 6 15 64.74784 -6.09969 7 52 64.91360 -6.61780
5a 2000 7 23 8 5 64.90365 -6.58584 8 22 64.87241 -6.49030
6 2000 7 23 8 29 64.87632 -6.49903 9 5 64.79577 -6.64080
7 2000 7 23 9 13 64.79732 -6.63273 9 55 64.72000 -6.39800
8 2000 7 23 10 8 64.69354 -6.45236 11 0 64.78525 -6.73005
9 2000 7 23 11 0 64.78525 -6.73005 12 45 64.76062 -7.41819
10 2000 7 23 12 45 64.76062 -7.41819 13 48 64.89401 -7.79075
11 2000 7 23 13 48 64.89401 -7.79075 14 7 64.84851 -7.87878
12 2000 7 23 14 7 64.84851 -7.87878 15 3 64.71814 -7.53270
13 2000 7 23 15 3 64.71814 -7.53270 15 23 64.64932 -7.50809
14 2000 7 23 15 23 64.64932 -7.50809 19 25 64.16033 -6.21084
15 2000 7 23 20 25 64.15495 -6.20645 20 45 64.11478 -6.29289
16 2000 7 23 20 45 64.11478 -6.29289 0 4 64.50364 -7.34059
17 2000 7 24 0 4 64.50364 -7.34059 3 2 64.96320 -6.51033
18 2000 7 24 3 2 64.96320 -6.51033 4 32 64.84752 -5.98651
19 2000 7 24 4 32 64.84752 -5.98651 4 51 64.79892 -6.01100
20 2000 7 24 4 51 64.79892 -6.01100 6 8 64.92456 -6.40111
21 2000 7 24 6 10 64.92883 -6.39924 6 37 64.98493 -6.29217
22 2000 7 24 6 37 64.98493 -6.29217 7 1 64.95709 -6.15565
22a 2000 7 24 7 2 64.95586 -6.15000 7 28 64.92281 -6.00359
22b 2000 7 24 7 37 64.92616 -6.02109 8 8 64.96356 -6.18480
22c 2000 7 24 8 15 64.96599 -6.19555 8 54 64.91973 -5.99020
22d 2000 7 24 9 1 64.91893 -5.98828 9 41 64.96722 -6.20005
22e 2000 7 24 9 51 64.96437 -6.18883 10 39 64.91908 -5.98961
22f 2000 7 24 10 48 64.91935 -5.99143 11 10 64.93847 -6.07238
22g 2000 7 24 11 12 64.94006 -6.07961 11 26 64.95152 -6.12948
22a -22g are Topas trial lines only


39
APPENDIX 1
JCR SONAR WORKSTATIONS (BJL)
There are Sun Ultra5 workstations associated with the EM120 and TOPAS systems: em120-101
for EM120 operation and logging; topas for TOPAS operation and logging; and em120-102 for
post processing. All three workstations are on the ship's193.61.88 network.
A1.1 em120-101
Hostid: 80b8f161
IP Addresses:
157.237.14.30 (/etc/hostnames.hme0) to transceiver units
193.61.88.70 (/etc/hostnames.hme1) to JCR main LAN
Disk Partioning:
Part Tag Flag Cylinders Size Blocks
0 root wm 0 - 4146 1.99GB (4147/0/0) 4180176
1 swap wu 4147 - 5162 500.06MB (1016/0/0) 1024128
2 backup wm 0 - 17659 8.49GB (17660/0/0) 17801280
3 unassigned wm 0 0 (0/0/0) 0
4 unassigned wm 0 0 (0/0/0) 0
5 unassigned wm 5163 - 17353 5.86GB (12191/0/0) 12288528
6 unassigned wm 0 0 (0/0/0) 0
7 var wm 17354 - 17658 150.12MB (305/0/0) 307440
Mount Points (/etc/vfstab):
#device device mount FS fsck mount mount
#to mount to fsck point type pass at boot options
#
#/dev/dsk/c1d0s2 /dev/rdsk/c1d0s2 /usr ufs 1 yes -
fd - /dev/fd fd - no -
/proc - /proc proc - no -
/dev/dsk/c0t0d0s1 - - swap - no -
/dev/dsk/c0t0d0s0 /dev/rdsk/c0t0d0s0 / ufs 1 no -
/dev/dsk/c0t0d0s7 /dev/rdsk/c0t0d0s7 /var ufs 1 no -
/dev/dsk/c0t0d0s5 /dev/rdsk/c0t0d0s5 /data1 ufs 2 yes -
swap - /tmp tmpfs - yes -
40
#em120-102:/data2/em120 - /data2 nfs - yes rw,bg,soft,intr
Peripherals:
DDS 3 DLT (/dev/rmt/0)
Software:
em120 logging software
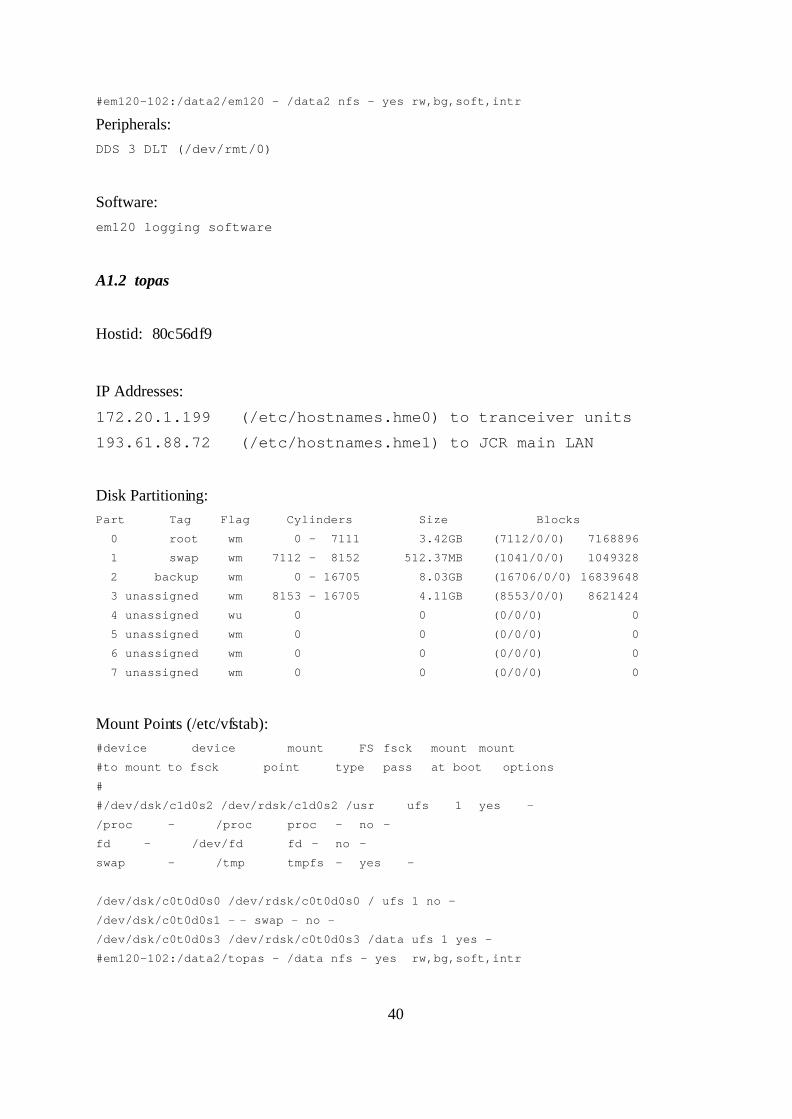
A1.2 topas
Hostid: 80c56df9
IP Addresses:
172.20.1.199 (/etc/hostnames.hme0) to tranceiver units
193.61.88.72 (/etc/hostnames.hme1) to JCR main LAN
Disk Partitioning:
Part Tag Flag Cylinders Size Blocks
0 root wm 0 - 7111 3.42GB (7112/0/0) 7168896
1 swap wm 7112 - 8152 512.37MB (1041/0/0) 1049328
2 backup wm 0 - 16705 8.03GB (16706/0/0) 16839648
3 unassigned wm 8153 - 16705 4.11GB (8553/0/0) 8621424
4 unassigned wu 0 0 (0/0/0) 0
5 unassigned wm 0 0 (0/0/0) 0
6 unassigned wm 0 0 (0/0/0) 0
7 unassigned wm 0 0 (0/0/0) 0
Mount Points (/etc/vfstab):
#device device mount FS fsck mount mount
#to mount to fsck point type pass at boot options
#
#/dev/dsk/c1d0s2 /dev/rdsk/c1d0s2 /usr ufs 1 yes -
/proc - /proc proc - no -
fd - /dev/fd fd - no -
swap - /tmp tmpfs - yes -
/dev/dsk/c0t0d0s0 /dev/rdsk/c0t0d0s0 / ufs 1 no -
/dev/dsk/c0t0d0s1 - - swap - no -
/dev/dsk/c0t0d0s3 /dev/rdsk/c0t0d0s3 /data ufs 1 yes -
#em120-102:/data2/topas - /data nfs - yes rw,bg,soft,intr
41
Peripherals:
None
Software:
topas logging software
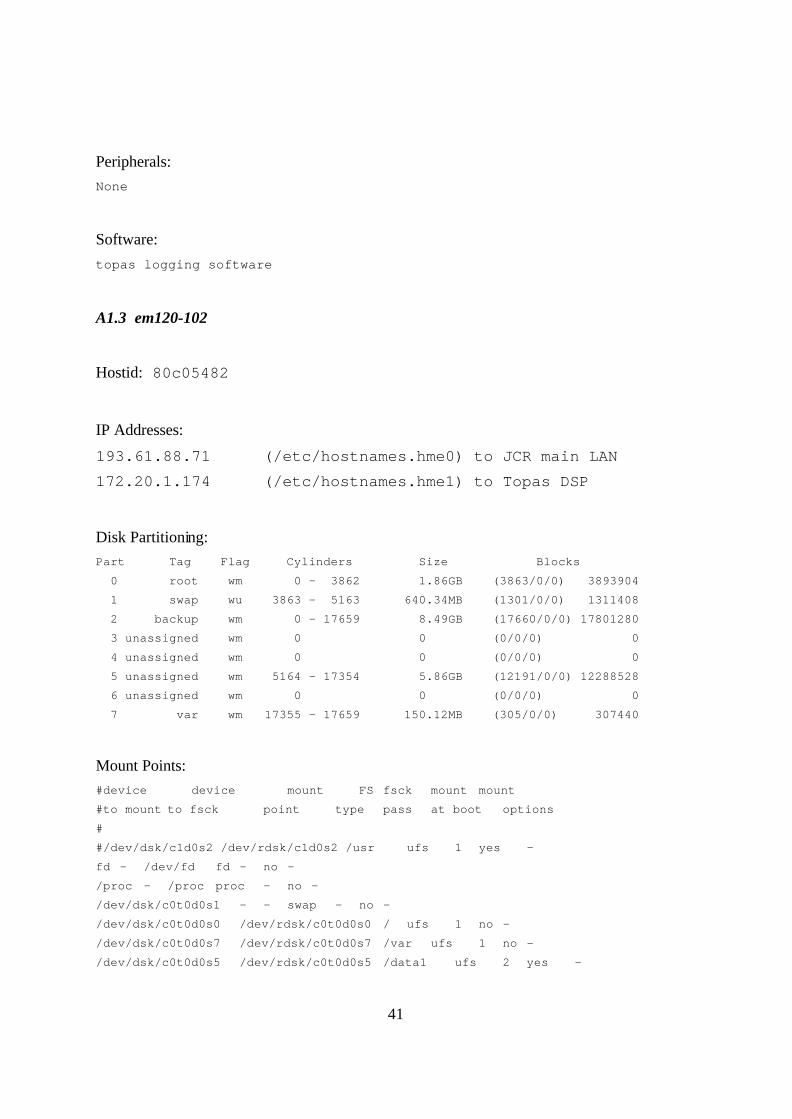
A1.3 em120-102
Hostid: 80c05482
IP Addresses:
193.61.88.71 (/etc/hostnames.hme0) to JCR main LAN
172.20.1.174 (/etc/hostnames.hme1) to Topas DSP
Disk Partitioning:
Part Tag Flag Cylinders Size Blocks
0 root wm 0 - 3862 1.86GB (3863/0/0) 3893904
1 swap wu 3863 - 5163 640.34MB (1301/0/0) 1311408
2 backup wm 0 - 17659 8.49GB (17660/0/0) 17801280
3 unassigned wm 0 0 (0/0/0) 0
4 unassigned wm 0 0 (0/0/0) 0
5 unassigned wm 5164 - 17354 5.86GB (12191/0/0) 12288528
6 unassigned wm 0 0 (0/0/0) 0
7 var wm 17355 - 17659 150.12MB (305/0/0) 307440
Mount Points:
#device device mount FS fsck mount mount
#to mount to fsck point type pass at boot options
#
#/dev/dsk/c1d0s2 /dev/rdsk/c1d0s2 /usr ufs 1 yes -
fd - /dev/fd fd - no -
/proc - /proc proc - no -
/dev/dsk/c0t0d0s1 - - swap - no -
/dev/dsk/c0t0d0s0 /dev/rdsk/c0t0d0s0 / ufs 1 no -
/dev/dsk/c0t0d0s7 /dev/rdsk/c0t0d0s7 /var ufs 1 no -
/dev/dsk/c0t0d0s5 /dev/rdsk/c0t0d0s5 /data1 ufs 2 yes -
42
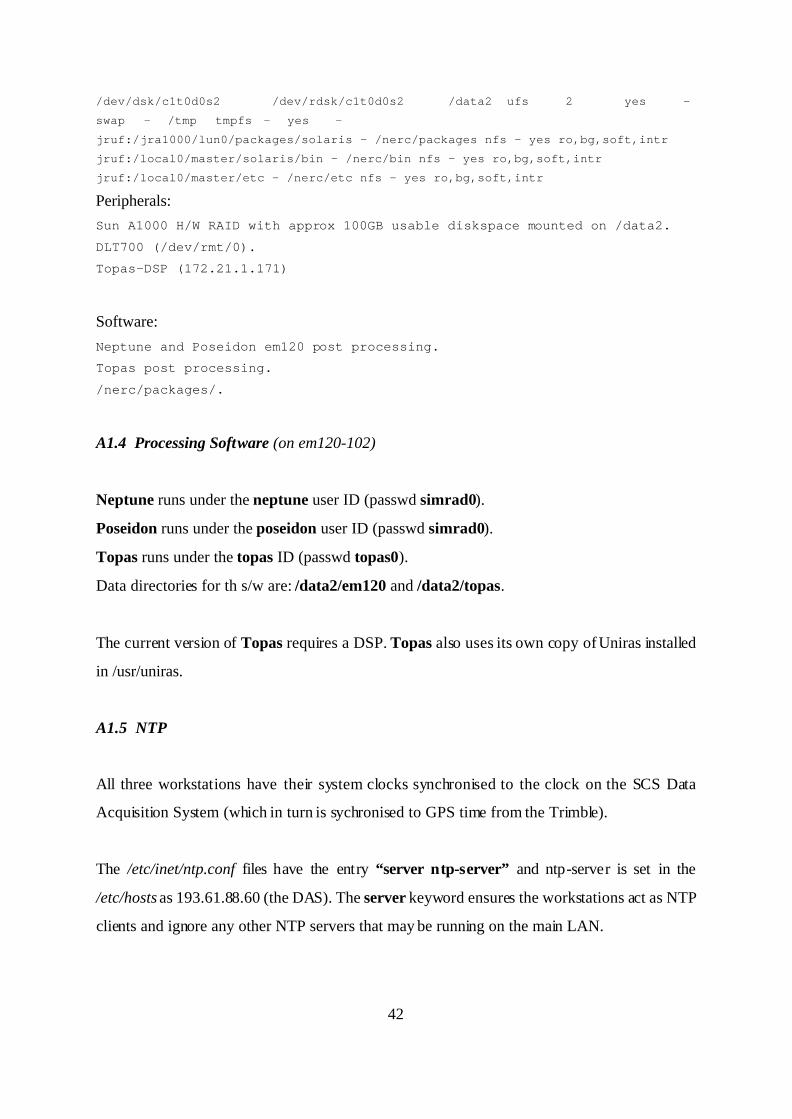
/dev/dsk/c1t0d0s2 /dev/rdsk/c1t0d0s2 /data2 ufs 2 yes -
swap - /tmp tmpfs - yes -
jruf:/jra1000/lun0/packages/solaris - /nerc/packages nfs - yes ro,bg,soft,intr
jruf:/local0/master/solaris/bin - /nerc/bin nfs - yes ro,bg,soft,intr
jruf:/local0/master/etc - /nerc/etc nfs - yes ro,bg,soft,intr
Peripherals:
Sun A1000 H/W RAID with approx 100GB usable diskspace mounted on /data2.
DLT700 (/dev/rmt/0).
Topas-DSP (172.21.1.171)
Software:
Neptune and Poseidon em120 post processing.
Topas post processing.
/nerc/packages/.
A1.4 Processing Software (on em120-102)
Neptune runs under the neptune user ID (passwd simrad0).
Poseidon runs under the poseidon user ID (passwd simrad0).
Topas runs under the topas ID (passwd topas0).
Data directories for th s/w are: /data2/em120 and /data2/topas.
The current version of Topas requires a DSP. Topas also uses its own copy of Uniras installed
in /usr/uniras.
A1.5 NTP
All three workstations have their system clocks synchronised to the clock on the SCS Data
Acquisition System (which in turn is sychronised to GPS time from the Trimble).
The /etc/inet/ntp.conf files have the entry “server ntp-server” and ntp-server is set in the
/etc/hosts as 193.61.88.60 (the DAS). The server keyword ensures the workstations act as NTP
clients and ignore any other NTP servers that may be running on the main LAN.

43
44
APPENDIX 2
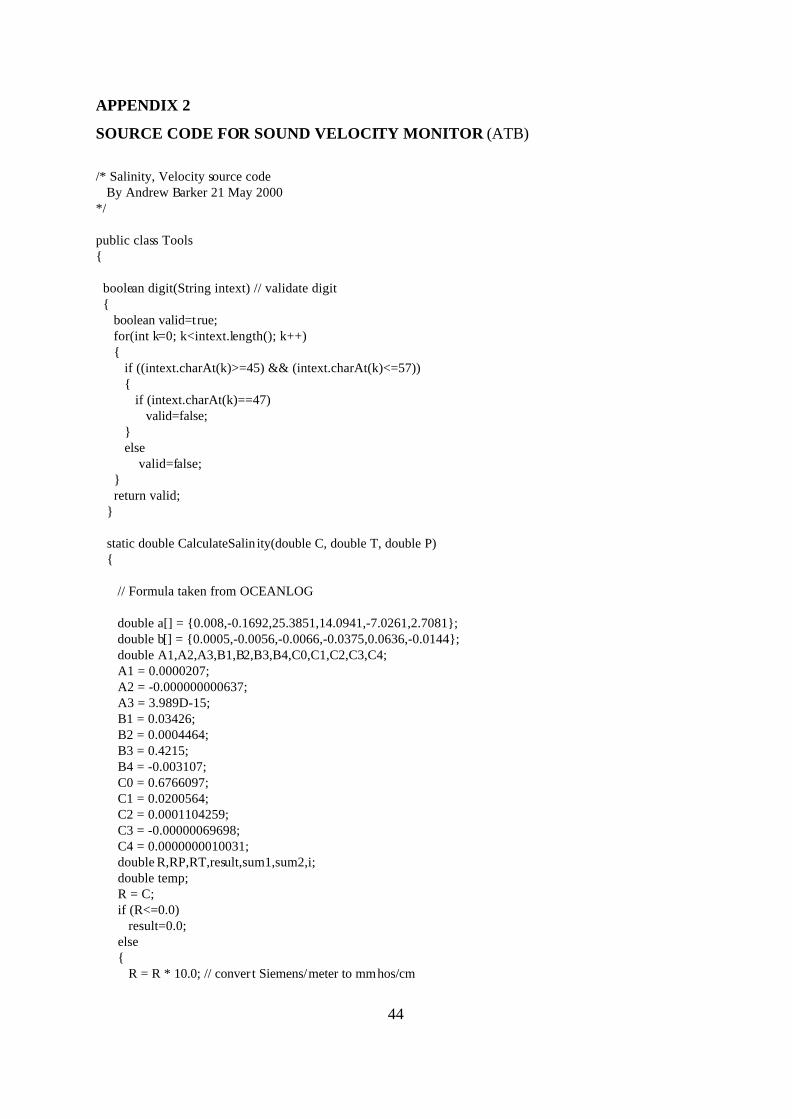
SOURCE CODE FOR SOUND VELOCITY MONITOR (ATB)
/* Salinity, Velocity source code By Andrew Barker 21 May 2000*/
public class Tools{
boolean digit(String intext) // validate digit { boolean valid=true; for(int k=0; k<intext.length(); k++) { if ((intext.charAt(k)>=45) && (intext.charAt(k)<=57)) { if (intext.charAt(k)==47) valid=false; } else valid=false; } return valid; }
static double CalculateSalin ity(double C, double T, double P) { // Formula taken from OCEANLOG
double a[] = {0.008,-0.1692,25.3851,14.0941,-7.0261,2.7081}; double b[] = {0.0005,-0.0056,-0.0066,-0.0375,0.0636,-0.0144}; double A1,A2,A3,B1,B2,B3,B4,C0,C1,C2,C3,C4; A1 = 0.0000207; A2 = -0.000000000637; A3 = 3.989D-15; B1 = 0.03426; B2 = 0.0004464; B3 = 0.4215; B4 = -0.003107; C0 = 0.6766097; C1 = 0.0200564; C2 = 0.0001104259; C3 = -0.00000069698; C4 = 0.0000000010031; double R,RP,RT,result,sum1,sum2,i; double temp; R = C; if (R<=0.0) result=0.0; else { R = R * 10.0; // conver t Siemens/meter to mmhos/cm

45
R = R / 42.914; RP = 1.0 + P * (A1 + P * (A2 + P * A3)) / (1.0 + B1 * T + B2 * T * T + B3 * R + B4 * R *T); RT = R / (RP * (C0 + T * (C1 + T * (C2 + T * (C3 + T * C4 ))))); sum1 = 0.0; sum2 = 0.0; i=0; while (i < 6) { temp = Math.pow (RT,(i/2.0)); sum1 = sum1 + a[(int)i] * temp; sum2 = sum2 + b[(int)i] * temp; i++; } result = sum1 + sum2 * (T- 15.0) / (1.0 + 0.0162 * (T - 15.0)); } return result; }
static double CalculateSpeedSound(double Lat, double Temp, double Sal, double Depth) { double Press; if (Sal==0) Sal = 35; // set salinity if it was defaulted if (Lat!=0) Lat = Math.toRadians(Lat); // * (3.1415926/180) // Convert degrees to radians if (Lat<0) Lat = Lat * -1; // make sure lati tude is posit ive
// First calculate the Pressure term (Press) in decibars from depth in meters // This conversion is from Coates, 1989, Page 4.
Press=1.0052405 * ( 1+ 5.28E-3 * ((Math.sin(Lat)) * (Math.sin(Lat)))) * Depth + 2.36E-6 * (Depth * Depth);
// Then calculate SV according to DelGrosso
double P1,c0; double dltact,dltacs,dltacp,dcstp; P1 = Press * 0.1019716; // to pressure in kg/cm**2 gauge c0 = 1402.392;
dltact = Temp*( 0.501109398873E1 + Temp*(-0.550946843172E-1+ Temp * 0.221535969240E-3));
dltacs = Sal*(0.132952290781E1 + Sal* 0.128955756844E-3); dltacp = P1*( 0.156059257041E0 + P1*( 0.24499868841E-4 + P1*(-0.883392332513E-8))); dcstp = Temp*(-0.127562783426E-1*Sal + P1*( 0.635191613389E-2 + P1*( 0.265484716608E-7*Temp + -0.159349479045E-5 + 0.522116437235E-9*P1) +

46
(-0.438031096213E-6)*Temp*Temp)) + Sal*((-0.161674495909E-8)*Sal*P1*P1 + Temp*( 0.968403156410E-4*Temp + P1*( 0.485639620015E-5*Sal + (-0.340597039004E-3))));
double velocity; velocity = c0 + dltact + dltacs + dltacp + dcstp; return velocity; }}