Embed Size (px)
Citation preview
CRUISE REPORT MR06-5, MISMO
Sea Surface Skin Temperature Measurement withISAR (Infrared Sea Surface Temperature Autonomous Radiometer)
R. Michael ReynoldsRemote Measurements and Research Company (RMR Co.)
March 15, 2007
Abstract
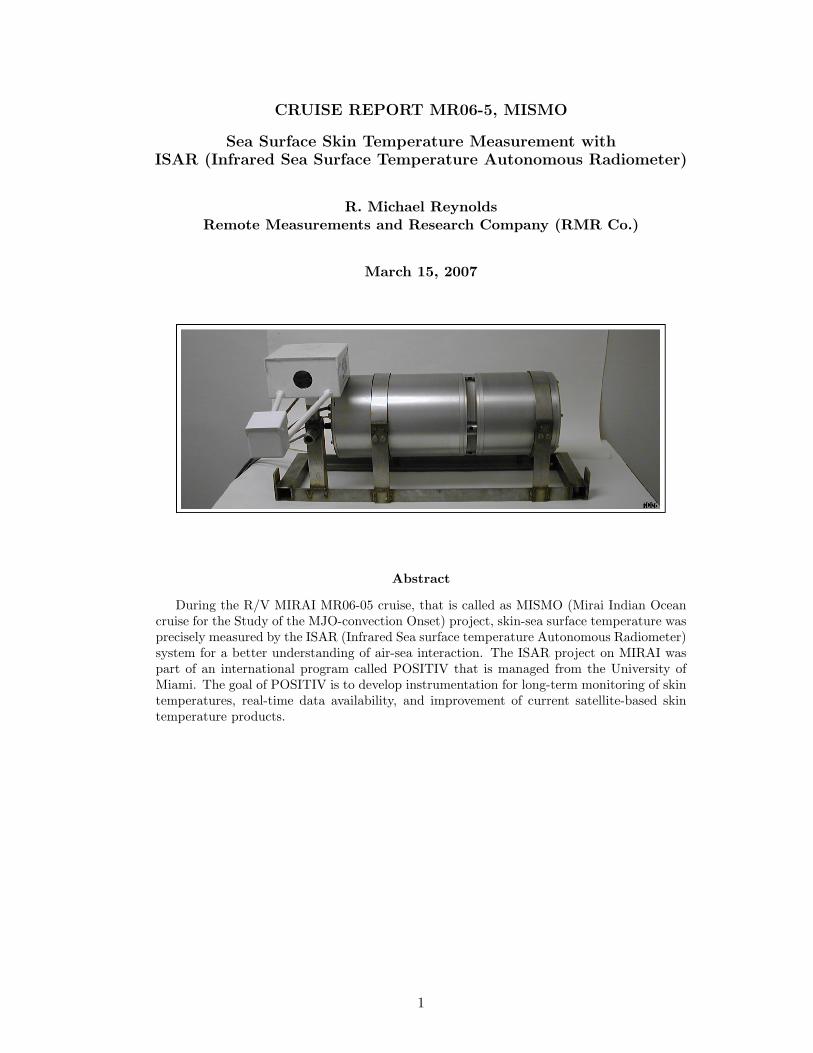
During the R/V MIRAI MR06-05 cruise, that is called as MISMO (Mirai Indian Oceancruise for the Study of the MJO-convection Onset) project, skin-sea surface temperature wasprecisely measured by the ISAR (Infrared Sea surface temperature Autonomous Radiometer)system for a better understanding of air-sea interaction. The ISAR project on MIRAI waspart of an international program called POSITIV that is managed from the University ofMiami. The goal of POSITIV is to develop instrumentation for long-term monitoring of skintemperatures, real-time data availability, and improvement of current satellite-based skintemperature products.
1
MR06-5 Report, SSST Measurement by ISAR 2
CRUISE REPORT MR06-5, MISMO
Sea Surface Skin Temperature Measurement withISAR (Infrared Sea Surface Temperature Autonomous Radiometer)1
R. Michael ReynoldsRemote Measurements and Research Company (RMR Co.)
March 15, 2007
Contents
1 Introduction 3
1.1 Deployment Overview . . . . . . . . . . . . . . . . . . . . . . . . . . . . . . . . . . . . . . 4
1.2 Definition of Sea Surface Skin Temperature . . . . . . . . . . . . . . . . . . . . . . . . . . 6
2 ISAR 8
2.1 Instrument Description . . . . . . . . . . . . . . . . . . . . . . . . . . . . . . . . . . . . . . 8
2.2 Iridium Communications . . . . . . . . . . . . . . . . . . . . . . . . . . . . . . . . . . . . . 9
2.3 Installation on MIRAI . . . . . . . . . . . . . . . . . . . . . . . . . . . . . . . . . . . . . . 11
3 Supporting Ship Measurements 13
4 Results 15
4.1 ISAR Averaged SSST Time Series . . . . . . . . . . . . . . . . . . . . . . . . . . . . . . . 15
4.2 Merging Data Sets . . . . . . . . . . . . . . . . . . . . . . . . . . . . . . . . . . . . . . . . 16
5 Conclusions 17
1File pubs/2007/MismoCruiseRept rmrco.tex
MR06-5 Report, SSST Measurement by ISAR 3
1 Introduction
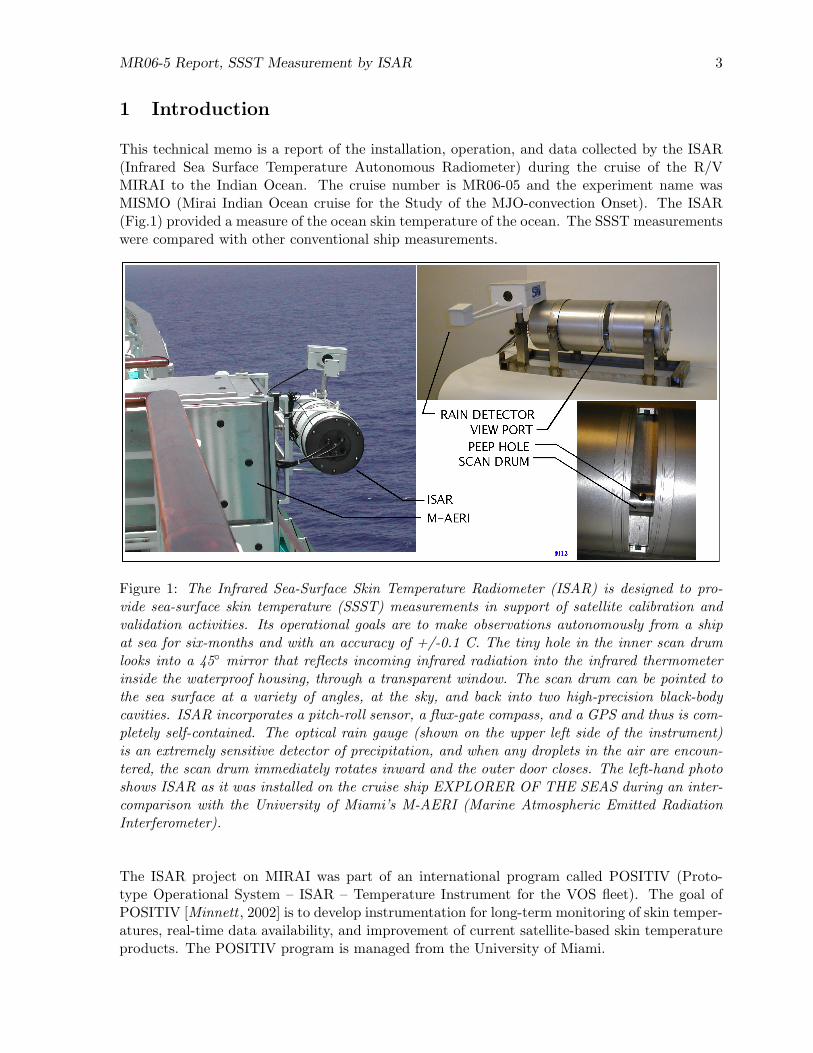
This technical memo is a report of the installation, operation, and data collected by the ISAR(Infrared Sea Surface Temperature Autonomous Radiometer) during the cruise of the R/VMIRAI to the Indian Ocean. The cruise number is MR06-05 and the experiment name wasMISMO (Mirai Indian Ocean cruise for the Study of the MJO-convection Onset). The ISAR(Fig.1) provided a measure of the ocean skin temperature of the ocean. The SSST measurementswere compared with other conventional ship measurements.
Figure 1: The Infrared Sea-Surface Skin Temperature Radiometer (ISAR) is designed to pro-vide sea-surface skin temperature (SSST) measurements in support of satellite calibration andvalidation activities. Its operational goals are to make observations autonomously from a shipat sea for six-months and with an accuracy of +/-0.1 C. The tiny hole in the inner scan drumlooks into a 45◦ mirror that reflects incoming infrared radiation into the infrared thermometerinside the waterproof housing, through a transparent window. The scan drum can be pointed tothe sea surface at a variety of angles, at the sky, and back into two high-precision black-bodycavities. ISAR incorporates a pitch-roll sensor, a flux-gate compass, and a GPS and thus is com-pletely self-contained. The optical rain gauge (shown on the upper left side of the instrument)is an extremely sensitive detector of precipitation, and when any droplets in the air are encoun-tered, the scan drum immediately rotates inward and the outer door closes. The left-hand photoshows ISAR as it was installed on the cruise ship EXPLORER OF THE SEAS during an inter-comparison with the University of Miami’s M-AERI (Marine Atmospheric Emitted RadiationInterferometer).
The ISAR project on MIRAI was part of an international program called POSITIV (Proto-type Operational System – ISAR – Temperature Instrument for the VOS fleet). The goal ofPOSITIV [Minnett , 2002] is to develop instrumentation for long-term monitoring of skin temper-atures, real-time data availability, and improvement of current satellite-based skin temperatureproducts. The POSITIV program is managed from the University of Miami.
MR06-5 Report, SSST Measurement by ISAR 4
1.1 Deployment Overview
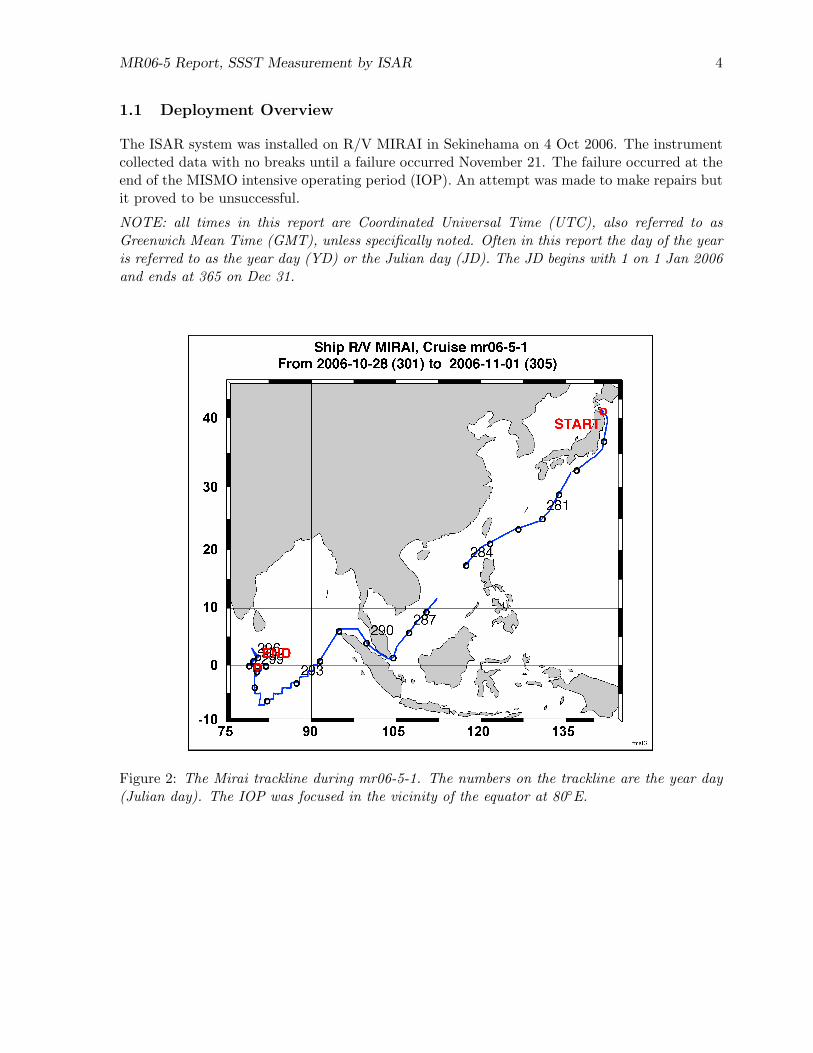
The ISAR system was installed on R/V MIRAI in Sekinehama on 4 Oct 2006. The instrumentcollected data with no breaks until a failure occurred November 21. The failure occurred at theend of the MISMO intensive operating period (IOP). An attempt was made to make repairs butit proved to be unsuccessful.
NOTE: all times in this report are Coordinated Universal Time (UTC), also referred to asGreenwich Mean Time (GMT), unless specifically noted. Often in this report the day of the yearis referred to as the year day (YD) or the Julian day (JD). The JD begins with 1 on 1 Jan 2006and ends at 365 on Dec 31.
Figure 2: The Mirai trackline during mr06-5-1. The numbers on the trackline are the year day(Julian day). The IOP was focused in the vicinity of the equator at 80◦E.
MR06-5 Report, SSST Measurement by ISAR 5
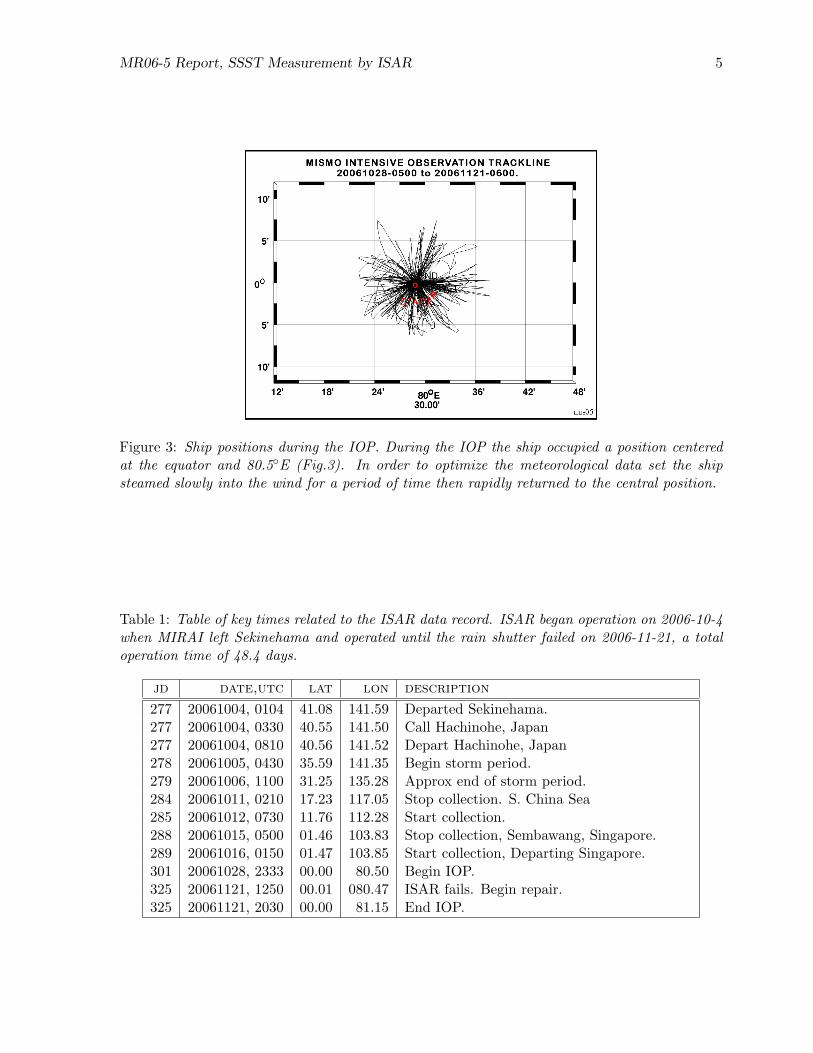
Figure 3: Ship positions during the IOP. During the IOP the ship occupied a position centeredat the equator and 80.5◦E (Fig.3). In order to optimize the meteorological data set the shipsteamed slowly into the wind for a period of time then rapidly returned to the central position.
Table 1: Table of key times related to the ISAR data record. ISAR began operation on 2006-10-4when MIRAI left Sekinehama and operated until the rain shutter failed on 2006-11-21, a totaloperation time of 48.4 days.
jd date,utc lat lon description
277 20061004, 0104 41.08 141.59 Departed Sekinehama.277 20061004, 0330 40.55 141.50 Call Hachinohe, Japan277 20061004, 0810 40.56 141.52 Depart Hachinohe, Japan278 20061005, 0430 35.59 141.35 Begin storm period.279 20061006, 1100 31.25 135.28 Approx end of storm period.284 20061011, 0210 17.23 117.05 Stop collection. S. China Sea285 20061012, 0730 11.76 112.28 Start collection.288 20061015, 0500 01.46 103.83 Stop collection, Sembawang, Singapore.289 20061016, 0150 01.47 103.85 Start collection, Departing Singapore.301 20061028, 2333 00.00 80.50 Begin IOP.325 20061121, 1250 00.01 080.47 ISAR fails. Begin repair.325 20061121, 2030 00.00 81.15 End IOP.
MR06-5 Report, SSST Measurement by ISAR 6
1.2 Definition of Sea Surface Skin Temperature
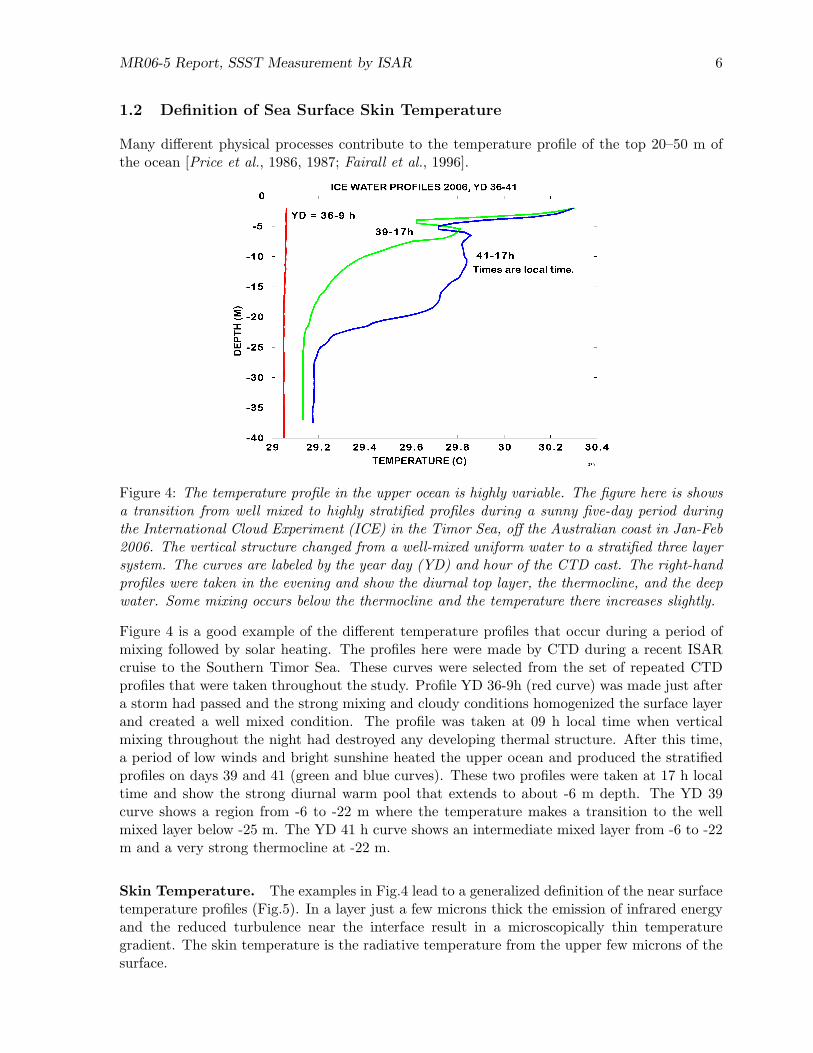
Many different physical processes contribute to the temperature profile of the top 20–50 m ofthe ocean [Price et al., 1986, 1987; Fairall et al., 1996].
Figure 4: The temperature profile in the upper ocean is highly variable. The figure here is showsa transition from well mixed to highly stratified profiles during a sunny five-day period duringthe International Cloud Experiment (ICE) in the Timor Sea, off the Australian coast in Jan-Feb2006. The vertical structure changed from a well-mixed uniform water to a stratified three layersystem. The curves are labeled by the year day (YD) and hour of the CTD cast. The right-handprofiles were taken in the evening and show the diurnal top layer, the thermocline, and the deepwater. Some mixing occurs below the thermocline and the temperature there increases slightly.
Figure 4 is a good example of the different temperature profiles that occur during a period ofmixing followed by solar heating. The profiles here were made by CTD during a recent ISARcruise to the Southern Timor Sea. These curves were selected from the set of repeated CTDprofiles that were taken throughout the study. Profile YD 36-9h (red curve) was made just aftera storm had passed and the strong mixing and cloudy conditions homogenized the surface layerand created a well mixed condition. The profile was taken at 09 h local time when verticalmixing throughout the night had destroyed any developing thermal structure. After this time,a period of low winds and bright sunshine heated the upper ocean and produced the stratifiedprofiles on days 39 and 41 (green and blue curves). These two profiles were taken at 17 h localtime and show the strong diurnal warm pool that extends to about -6 m depth. The YD 39curve shows a region from -6 to -22 m where the temperature makes a transition to the wellmixed layer below -25 m. The YD 41 h curve shows an intermediate mixed layer from -6 to -22m and a very strong thermocline at -22 m.
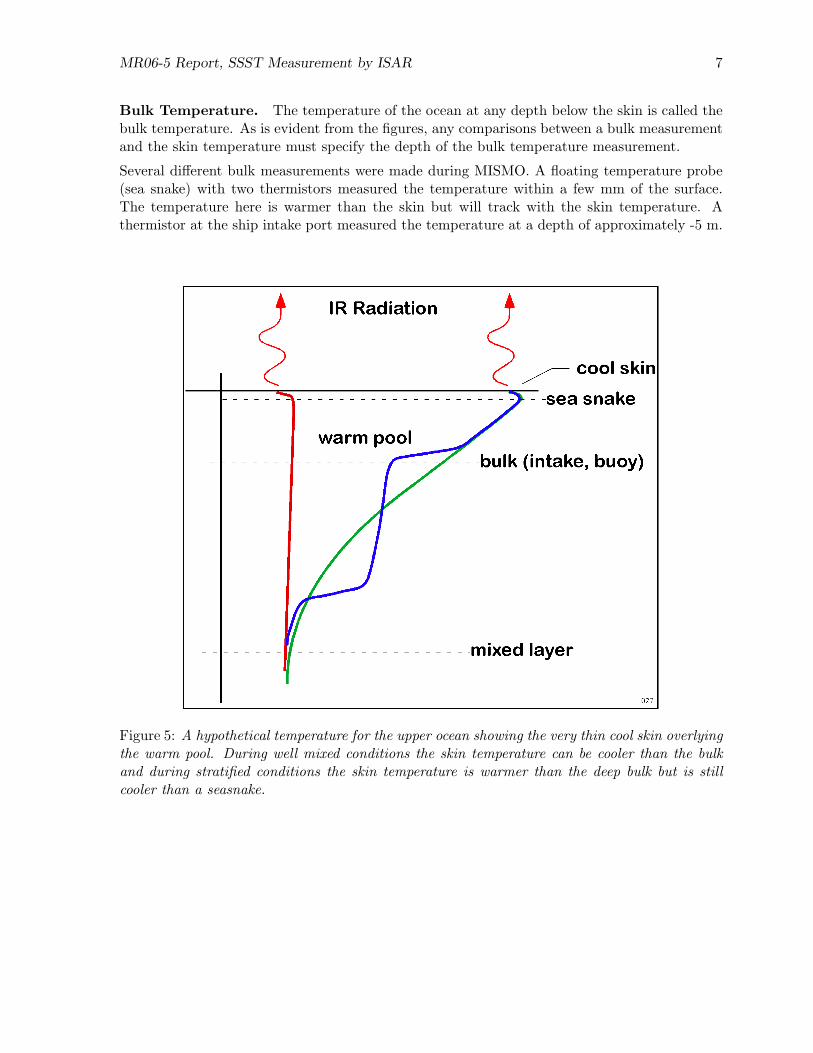
Skin Temperature. The examples in Fig.4 lead to a generalized definition of the near surfacetemperature profiles (Fig.5). In a layer just a few microns thick the emission of infrared energyand the reduced turbulence near the interface result in a microscopically thin temperaturegradient. The skin temperature is the radiative temperature from the upper few microns of thesurface.
MR06-5 Report, SSST Measurement by ISAR 7
Bulk Temperature. The temperature of the ocean at any depth below the skin is called thebulk temperature. As is evident from the figures, any comparisons between a bulk measurementand the skin temperature must specify the depth of the bulk temperature measurement.
Several different bulk measurements were made during MISMO. A floating temperature probe(sea snake) with two thermistors measured the temperature within a few mm of the surface.The temperature here is warmer than the skin but will track with the skin temperature. Athermistor at the ship intake port measured the temperature at a depth of approximately -5 m.
Figure 5: A hypothetical temperature for the upper ocean showing the very thin cool skin overlyingthe warm pool. During well mixed conditions the skin temperature can be cooler than the bulkand during stratified conditions the skin temperature is warmer than the deep bulk but is stillcooler than a seasnake.
MR06-5 Report, SSST Measurement by ISAR 8
2 ISAR
2.1 Instrument Description
A thorough description of the ISAR is provided by Donlon et al. [2007]. An alternate review ofthe theory and algorithms is provided by Reynolds [2007]. This section gives a brief descriptionof the instrument as an aid to understanding the data.
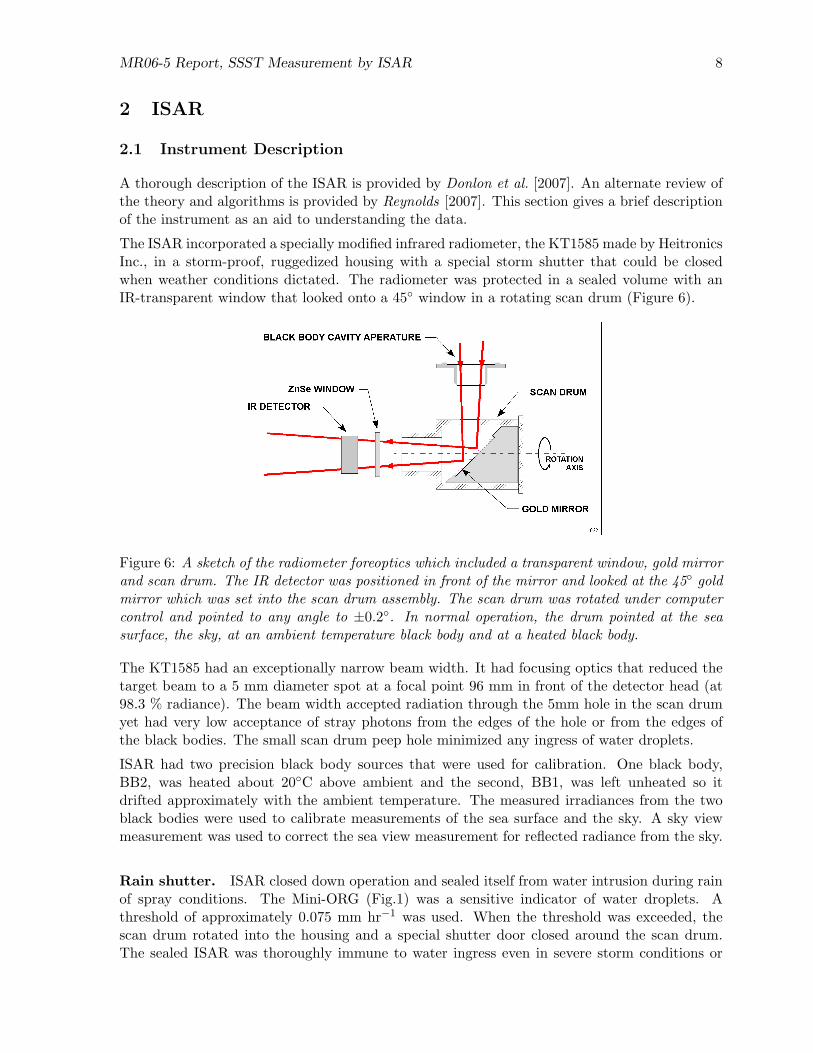
The ISAR incorporated a specially modified infrared radiometer, the KT1585 made by HeitronicsInc., in a storm-proof, ruggedized housing with a special storm shutter that could be closedwhen weather conditions dictated. The radiometer was protected in a sealed volume with anIR-transparent window that looked onto a 45◦ window in a rotating scan drum (Figure 6).
Figure 6: A sketch of the radiometer foreoptics which included a transparent window, gold mirrorand scan drum. The IR detector was positioned in front of the mirror and looked at the 45◦ goldmirror which was set into the scan drum assembly. The scan drum was rotated under computercontrol and pointed to any angle to ±0.2◦. In normal operation, the drum pointed at the seasurface, the sky, at an ambient temperature black body and at a heated black body.
The KT1585 had an exceptionally narrow beam width. It had focusing optics that reduced thetarget beam to a 5 mm diameter spot at a focal point 96 mm in front of the detector head (at98.3 % radiance). The beam width accepted radiation through the 5mm hole in the scan drumyet had very low acceptance of stray photons from the edges of the hole or from the edges ofthe black bodies. The small scan drum peep hole minimized any ingress of water droplets.
ISAR had two precision black body sources that were used for calibration. One black body,BB2, was heated about 20◦C above ambient and the second, BB1, was left unheated so itdrifted approximately with the ambient temperature. The measured irradiances from the twoblack bodies were used to calibrate measurements of the sea surface and the sky. A sky viewmeasurement was used to correct the sea view measurement for reflected radiance from the sky.
Rain shutter. ISAR closed down operation and sealed itself from water intrusion during rainof spray conditions. The Mini-ORG (Fig.1) was a sensitive indicator of water droplets. Athreshold of approximately 0.075 mm hr−1 was used. When the threshold was exceeded, thescan drum rotated into the housing and a special shutter door closed around the scan drum.The sealed ISAR was thoroughly immune to water ingress even in severe storm conditions or
MR06-5 Report, SSST Measurement by ISAR 9
mild spray.
2.2 Iridium Communications
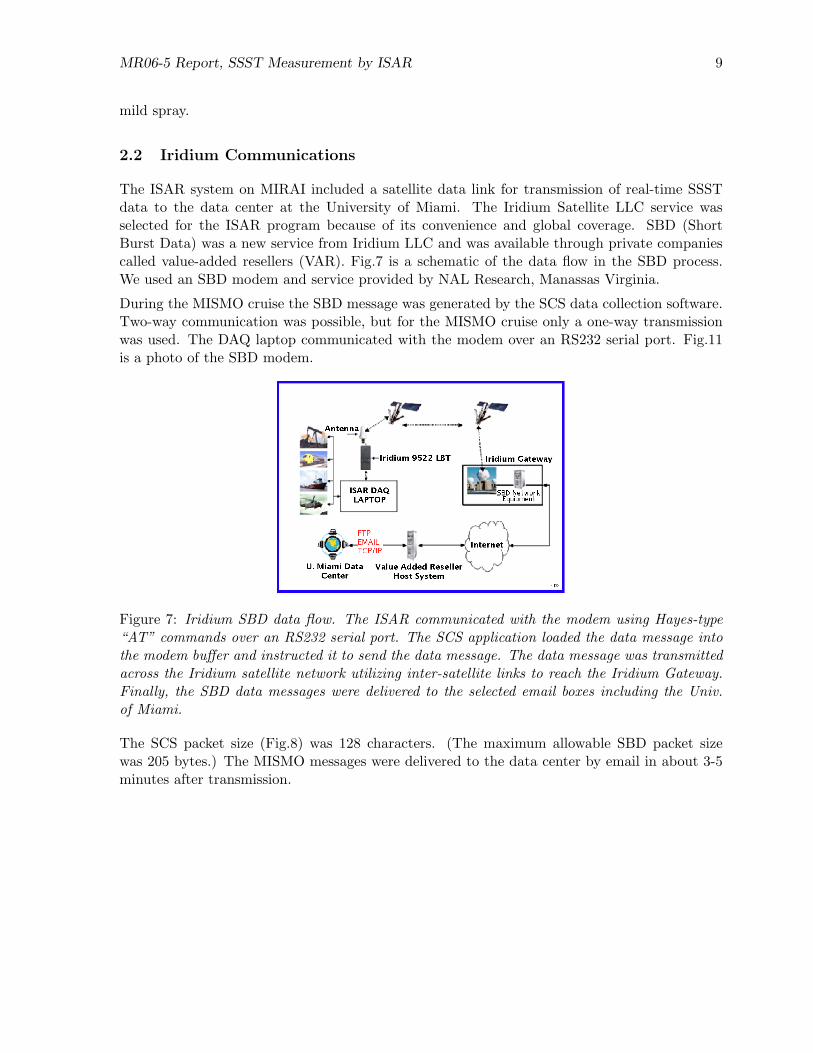
The ISAR system on MIRAI included a satellite data link for transmission of real-time SSSTdata to the data center at the University of Miami. The Iridium Satellite LLC service wasselected for the ISAR program because of its convenience and global coverage. SBD (ShortBurst Data) was a new service from Iridium LLC and was available through private companiescalled value-added resellers (VAR). Fig.7 is a schematic of the data flow in the SBD process.We used an SBD modem and service provided by NAL Research, Manassas Virginia.
During the MISMO cruise the SBD message was generated by the SCS data collection software.Two-way communication was possible, but for the MISMO cruise only a one-way transmissionwas used. The DAQ laptop communicated with the modem over an RS232 serial port. Fig.11is a photo of the SBD modem.
Figure 7: Iridium SBD data flow. The ISAR communicated with the modem using Hayes-type“AT” commands over an RS232 serial port. The SCS application loaded the data message intothe modem buffer and instructed it to send the data message. The data message was transmittedacross the Iridium satellite network utilizing inter-satellite links to reach the Iridium Gateway.Finally, the SBD data messages were delivered to the selected email boxes including the Univ.of Miami.
The SCS packet size (Fig.8) was 128 characters. (The maximum allowable SBD packet sizewas 205 bytes.) The MISMO messages were delivered to the data center by email in about 3-5minutes after transmission.
MR06-5 Report, SSST Measurement by ISAR 10
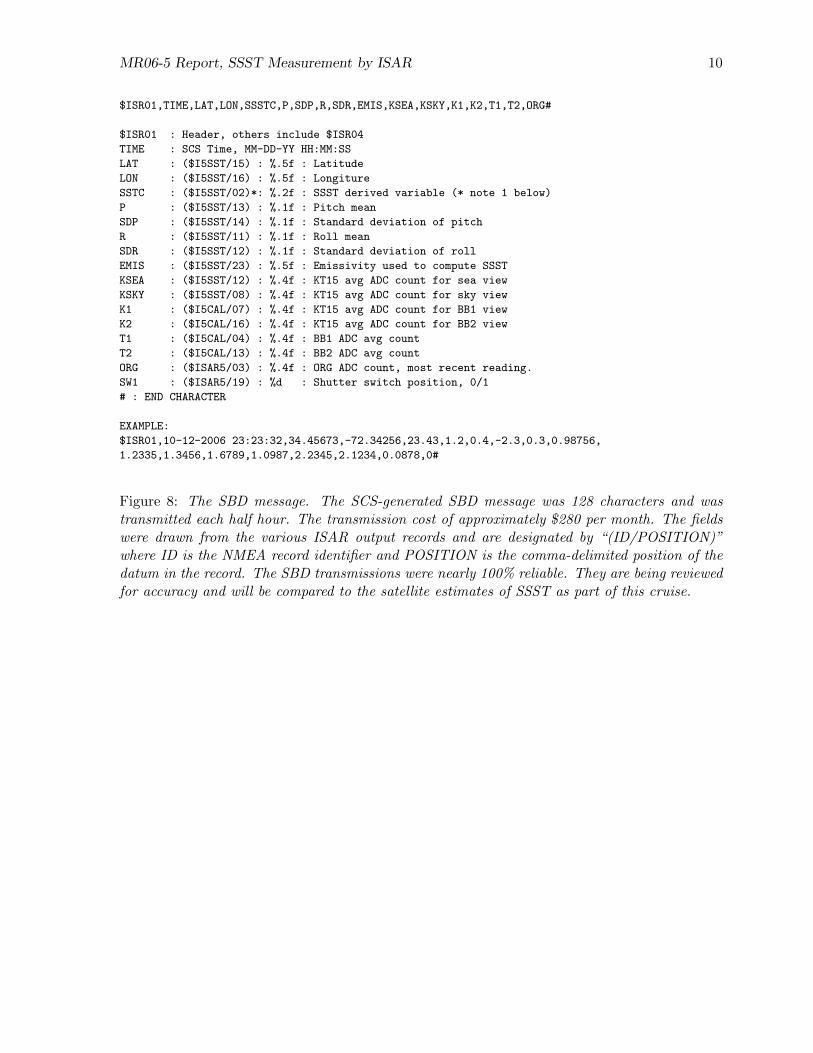
$ISR01,TIME,LAT,LON,SSSTC,P,SDP,R,SDR,EMIS,KSEA,KSKY,K1,K2,T1,T2,ORG#
$ISR01 : Header, others include $ISR04
TIME : SCS Time, MM-DD-YY HH:MM:SS
LAT : ($I5SST/15) : %.5f : Latitude
LON : ($I5SST/16) : %.5f : Longiture
SSTC : ($I5SST/02)*: %.2f : SSST derived variable (* note 1 below)
P : ($I5SST/13) : %.1f : Pitch mean
SDP : ($I5SST/14) : %.1f : Standard deviation of pitch
R : ($I5SST/11) : %.1f : Roll mean
SDR : ($I5SST/12) : %.1f : Standard deviation of roll
EMIS : ($I5SST/23) : %.5f : Emissivity used to compute SSST
KSEA : ($I5SST/12) : %.4f : KT15 avg ADC count for sea view
KSKY : ($I5SST/08) : %.4f : KT15 avg ADC count for sky view
K1 : ($I5CAL/07) : %.4f : KT15 avg ADC count for BB1 view
K2 : ($I5CAL/16) : %.4f : KT15 avg ADC count for BB2 view
T1 : ($I5CAL/04) : %.4f : BB1 ADC avg count
T2 : ($I5CAL/13) : %.4f : BB2 ADC avg count
ORG : ($ISAR5/03) : %.4f : ORG ADC count, most recent reading.
SW1 : ($ISAR5/19) : %d : Shutter switch position, 0/1
# : END CHARACTER
EXAMPLE:
$ISR01,10-12-2006 23:23:32,34.45673,-72.34256,23.43,1.2,0.4,-2.3,0.3,0.98756,
1.2335,1.3456,1.6789,1.0987,2.2345,2.1234,0.0878,0#
Figure 8: The SBD message. The SCS-generated SBD message was 128 characters and wastransmitted each half hour. The transmission cost of approximately $280 per month. The fieldswere drawn from the various ISAR output records and are designated by “(ID/POSITION)”where ID is the NMEA record identifier and POSITION is the comma-delimited position of thedatum in the record. The SBD transmissions were nearly 100% reliable. They are being reviewedfor accuracy and will be compared to the satellite estimates of SSST as part of this cruise.
MR06-5 Report, SSST Measurement by ISAR 11
2.3 Installation on MIRAI
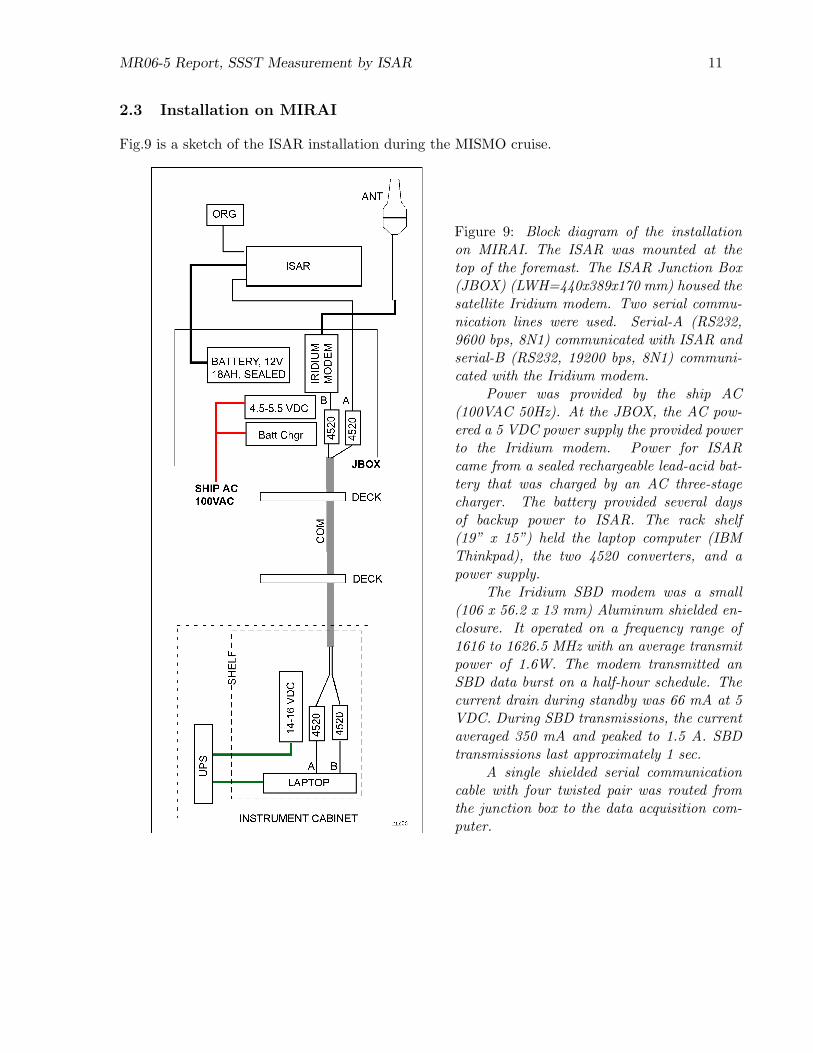
Fig.9 is a sketch of the ISAR installation during the MISMO cruise.
Figure 9: Block diagram of the installationon MIRAI. The ISAR was mounted at thetop of the foremast. The ISAR Junction Box(JBOX) (LWH=440x389x170 mm) housed thesatellite Iridium modem. Two serial commu-nication lines were used. Serial-A (RS232,9600 bps, 8N1) communicated with ISAR andserial-B (RS232, 19200 bps, 8N1) communi-cated with the Iridium modem.
Power was provided by the ship AC(100VAC 50Hz). At the JBOX, the AC pow-ered a 5 VDC power supply the provided powerto the Iridium modem. Power for ISARcame from a sealed rechargeable lead-acid bat-tery that was charged by an AC three-stagecharger. The battery provided several daysof backup power to ISAR. The rack shelf(19” x 15”) held the laptop computer (IBMThinkpad), the two 4520 converters, and apower supply.
The Iridium SBD modem was a small(106 x 56.2 x 13 mm) Aluminum shielded en-closure. It operated on a frequency range of1616 to 1626.5 MHz with an average transmitpower of 1.6W. The modem transmitted anSBD data burst on a half-hour schedule. Thecurrent drain during standby was 66 mA at 5VDC. During SBD transmissions, the currentaveraged 350 mA and peaked to 1.5 A. SBDtransmissions last approximately 1 sec.
A single shielded serial communicationcable with four twisted pair was routed fromthe junction box to the data acquisition com-puter.
MR06-5 Report, SSST Measurement by ISAR 12
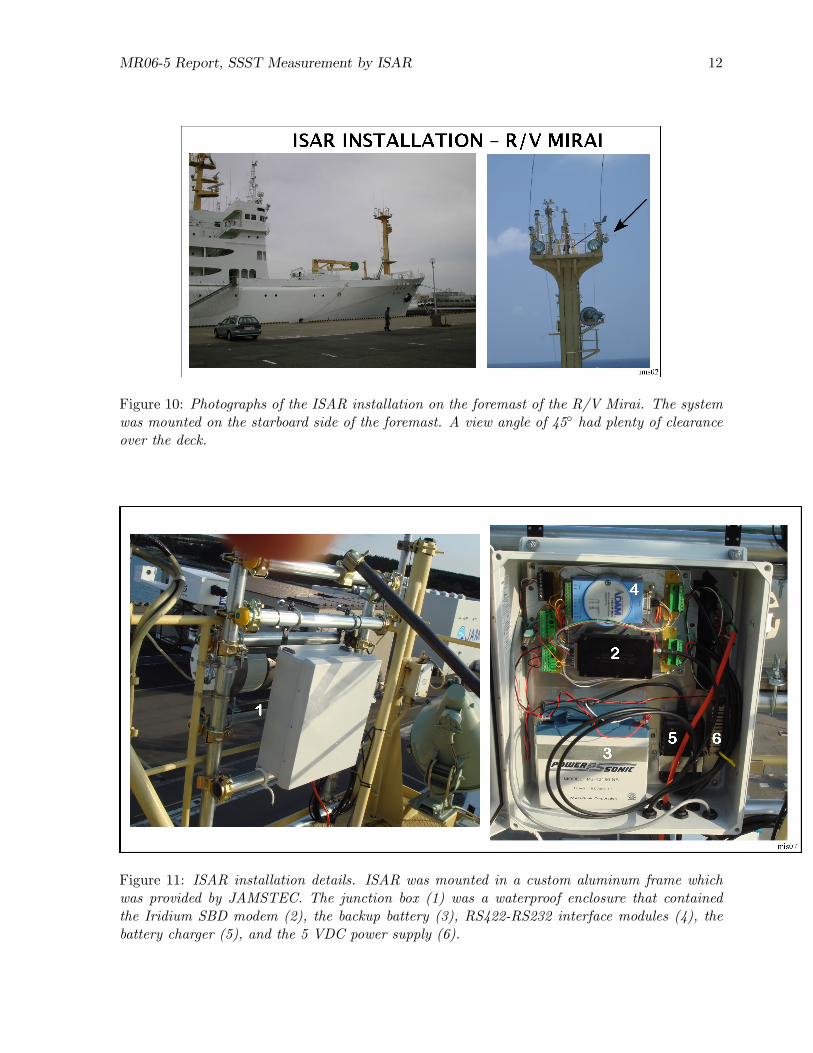
Figure 10: Photographs of the ISAR installation on the foremast of the R/V Mirai. The systemwas mounted on the starboard side of the foremast. A view angle of 45◦ had plenty of clearanceover the deck.
Figure 11: ISAR installation details. ISAR was mounted in a custom aluminum frame whichwas provided by JAMSTEC. The junction box (1) was a waterproof enclosure that containedthe Iridium SBD modem (2), the backup battery (3), RS422-RS232 interface modules (4), thebattery charger (5), and the 5 VDC power supply (6).
MR06-5 Report, SSST Measurement by ISAR 13
3 Supporting Ship Measurements
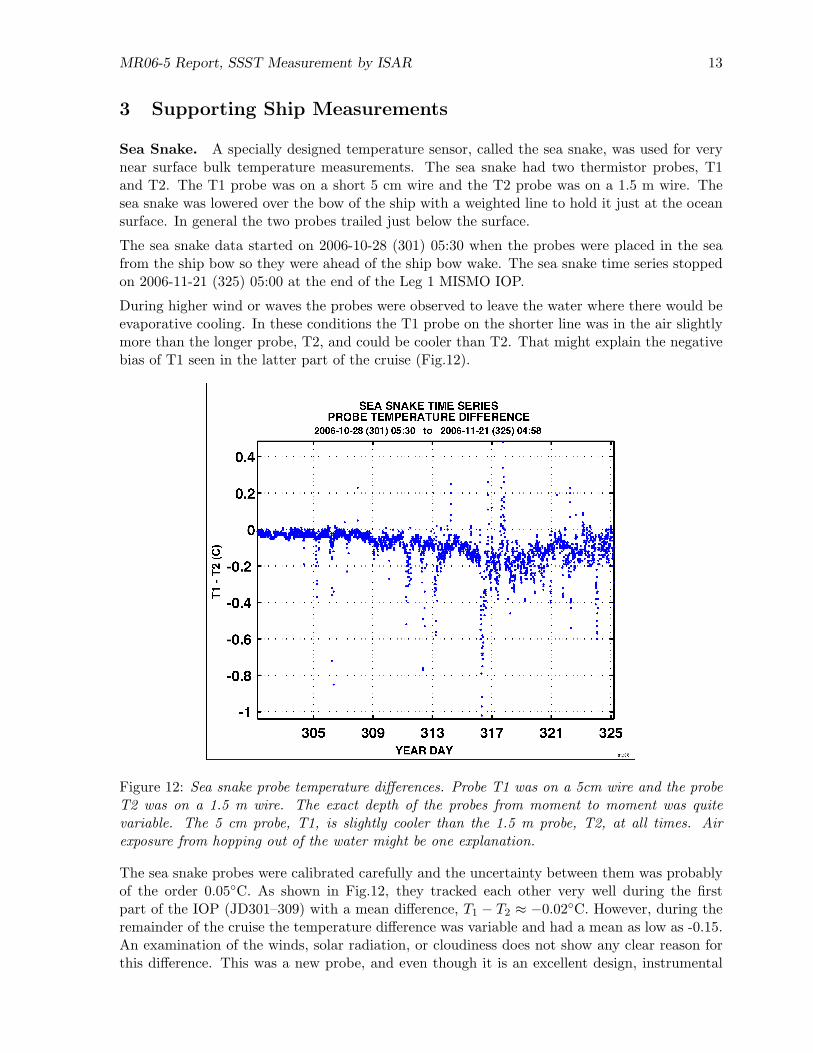
Sea Snake. A specially designed temperature sensor, called the sea snake, was used for verynear surface bulk temperature measurements. The sea snake had two thermistor probes, T1and T2. The T1 probe was on a short 5 cm wire and the T2 probe was on a 1.5 m wire. Thesea snake was lowered over the bow of the ship with a weighted line to hold it just at the oceansurface. In general the two probes trailed just below the surface.
The sea snake data started on 2006-10-28 (301) 05:30 when the probes were placed in the seafrom the ship bow so they were ahead of the ship bow wake. The sea snake time series stoppedon 2006-11-21 (325) 05:00 at the end of the Leg 1 MISMO IOP.
During higher wind or waves the probes were observed to leave the water where there would beevaporative cooling. In these conditions the T1 probe on the shorter line was in the air slightlymore than the longer probe, T2, and could be cooler than T2. That might explain the negativebias of T1 seen in the latter part of the cruise (Fig.12).
Figure 12: Sea snake probe temperature differences. Probe T1 was on a 5cm wire and the probeT2 was on a 1.5 m wire. The exact depth of the probes from moment to moment was quitevariable. The 5 cm probe, T1, is slightly cooler than the 1.5 m probe, T2, at all times. Airexposure from hopping out of the water might be one explanation.
The sea snake probes were calibrated carefully and the uncertainty between them was probablyof the order 0.05◦C. As shown in Fig.12, they tracked each other very well during the firstpart of the IOP (JD301–309) with a mean difference, T1 − T2 ≈ −0.02◦C. However, during theremainder of the cruise the temperature difference was variable and had a mean as low as -0.15.An examination of the winds, solar radiation, or cloudiness does not show any clear reason forthis difference. This was a new probe, and even though it is an excellent design, instrumental
MR06-5 Report, SSST Measurement by ISAR 14
problems should investigated.
Intake Temperature. A temperature probe was located at the mouth of the ocean waterintake pipe. The depth of the probe was, nominally, -5 m. The intake temperature was recordedeach 10 sec in the SOJ data file (described below).
CTD. The conductivity-temperature-depth (CTD) instrument was operated on a regular basisduring the cruise, especially during the intensive period. The CTD data were collected forcomparison to the other bulk measurements. Comparisons of the intake temperature with theCTD casts shown excellent agreement.
SCS Data The SCS (Scientific Computer System) data logging program was used to collectdata from the ISAR. SCS was also used for MIRAI meteorological data collection. SCS ingestedthe raw ISAR records ($ISAR5) and stored them into it’s RAW data folder.
SCS was designed by NOAA to meet the demands of collecting this diverse sensor data and makeit available to scientists on a real-time basis. It was developed by engineers from the Office ofMarine & Aviation Operations (OMAO) in conjunction with NOAA scientists. SCS can bequickly configured to utilize new sensors and mission parameters without requiring softwaremodifications. SCS is currently installed on NOAA ships with missions that range from fisheriesstock assessments and research to global deep-ocean and atmospheric research. It is used on USuniversity research ships and many international vessels including the MIRAI.
The ISAR data acquisition computer was operating SCS during its MISMO operation, as isdiscussed in Section 2.2.
SOJ Data The MIRAI ship information system was called SOJ. The SOJ files were completerecords of the ship navigation, standard meteorology, intake water temperature, and other usefuldata. SOJ record period was 10 seconds.
MR06-5 Report, SSST Measurement by ISAR 15
4 Results
4.1 ISAR Averaged SSST Time Series
The ISAR produced raw data records at a period of about 3 sec. The basic measurement cycleinvolved rotating the scan drum to each of the four proscribed view angles (sea, sky, Blackbody-1,Blackbody-2) and taking a series of raw samples at each position. Each raw sample was a set ofmeasurements that required approximately 1.5 seconds to complete and included (1) The eight-channel precision ADC, (2) The eight-channel 12-bit ADC, (3) The digital flux-gate compasswith pitch and roll, (4) The digital GPS for latitude and longitude, and (5) The KT15 digitaloutput, case and target temperatures.
A complete viewing cycle (BB1, BB2, sea, sky) required approximately 180 sec to complete,including the time required to rotate the scan drum to a new position. The cycles continuedwithout pause, unless they were interrupted by precipitation, at which time the ISAR closed upand waited for the next opportunity to re-open and continue sampling.
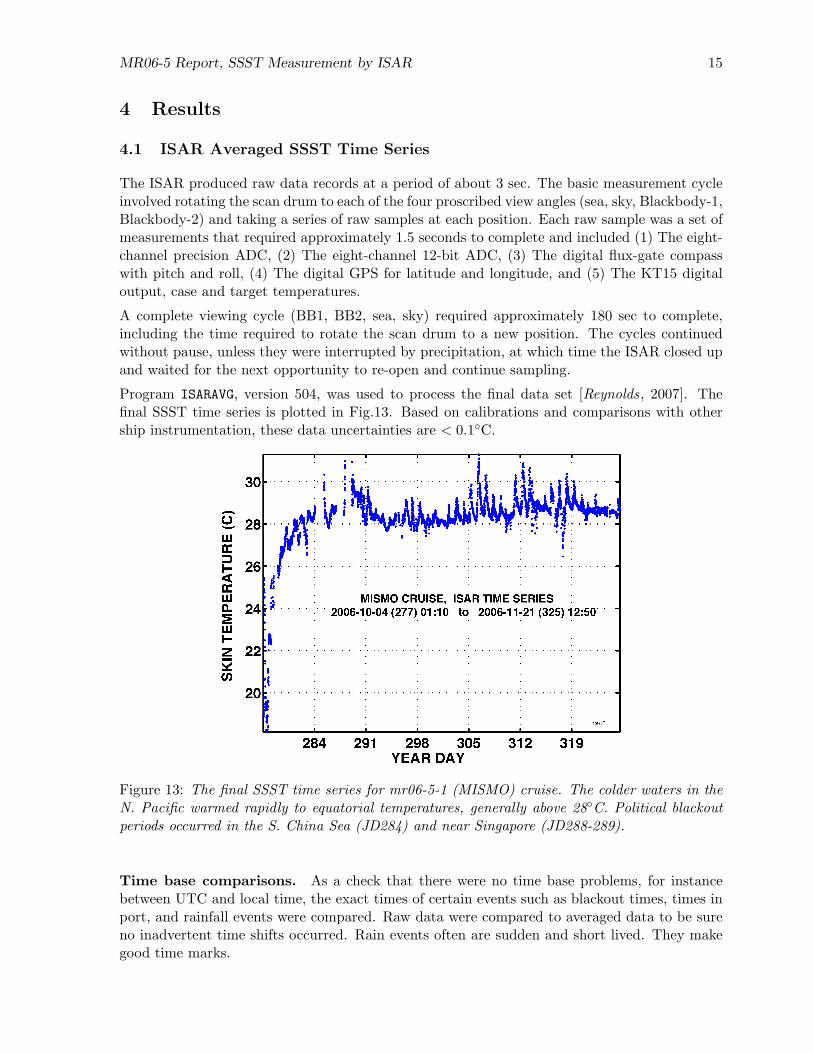
Program ISARAVG, version 504, was used to process the final data set [Reynolds, 2007]. Thefinal SSST time series is plotted in Fig.13. Based on calibrations and comparisons with othership instrumentation, these data uncertainties are < 0.1◦C.
Figure 13: The final SSST time series for mr06-5-1 (MISMO) cruise. The colder waters in theN. Pacific warmed rapidly to equatorial temperatures, generally above 28◦C. Political blackoutperiods occurred in the S. China Sea (JD284) and near Singapore (JD288-289).
Time base comparisons. As a check that there were no time base problems, for instancebetween UTC and local time, the exact times of certain events such as blackout times, times inport, and rainfall events were compared. Raw data were compared to averaged data to be sureno inadvertent time shifts occurred. Rain events often are sudden and short lived. They makegood time marks.
MR06-5 Report, SSST Measurement by ISAR 16
4.2 Merging Data Sets
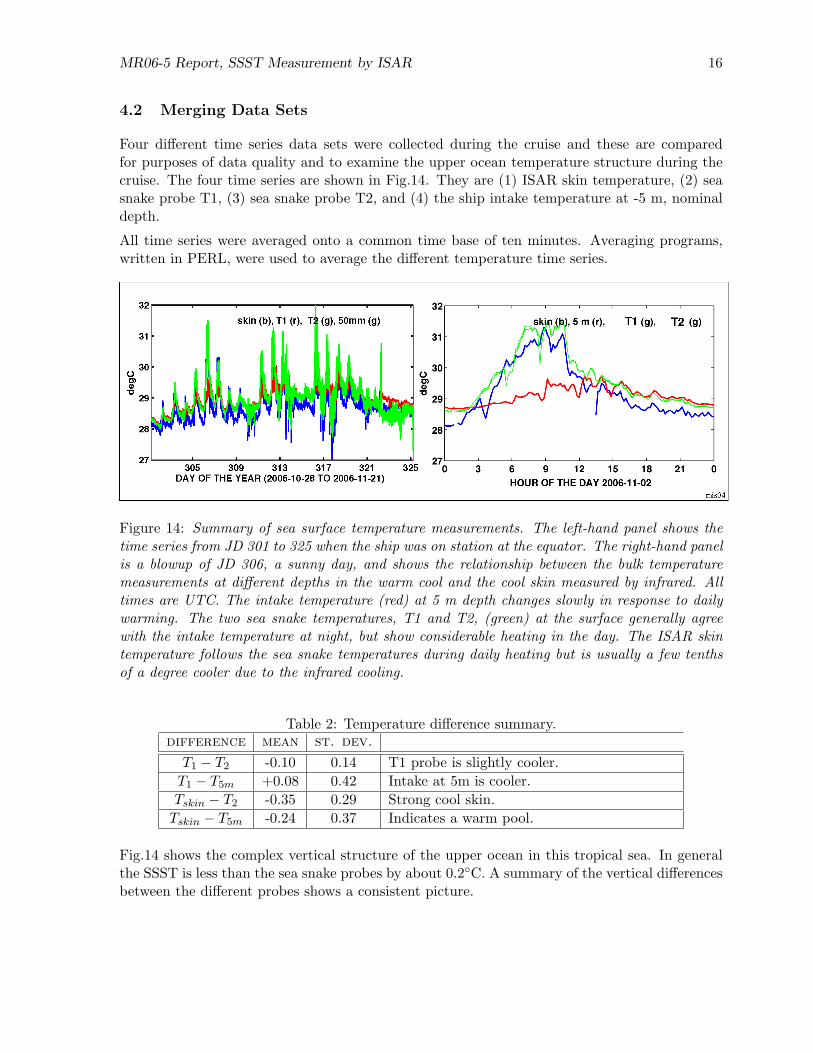
Four different time series data sets were collected during the cruise and these are comparedfor purposes of data quality and to examine the upper ocean temperature structure during thecruise. The four time series are shown in Fig.14. They are (1) ISAR skin temperature, (2) seasnake probe T1, (3) sea snake probe T2, and (4) the ship intake temperature at -5 m, nominaldepth.
All time series were averaged onto a common time base of ten minutes. Averaging programs,written in PERL, were used to average the different temperature time series.
Figure 14: Summary of sea surface temperature measurements. The left-hand panel shows thetime series from JD 301 to 325 when the ship was on station at the equator. The right-hand panelis a blowup of JD 306, a sunny day, and shows the relationship between the bulk temperaturemeasurements at different depths in the warm cool and the cool skin measured by infrared. Alltimes are UTC. The intake temperature (red) at 5 m depth changes slowly in response to dailywarming. The two sea snake temperatures, T1 and T2, (green) at the surface generally agreewith the intake temperature at night, but show considerable heating in the day. The ISAR skintemperature follows the sea snake temperatures during daily heating but is usually a few tenthsof a degree cooler due to the infrared cooling.
Table 2: Temperature difference summary.difference mean st. dev.
T1 − T2 -0.10 0.14 T1 probe is slightly cooler.T1 − T5m +0.08 0.42 Intake at 5m is cooler.Tskin − T2 -0.35 0.29 Strong cool skin.
Tskin − T5m -0.24 0.37 Indicates a warm pool.
Fig.14 shows the complex vertical structure of the upper ocean in this tropical sea. In generalthe SSST is less than the sea snake probes by about 0.2◦C. A summary of the vertical differencesbetween the different probes shows a consistent picture.
MR06-5 Report, SSST Measurement by ISAR 17
5 Conclusions
The ISAR (Infrared Sea Surface Temperature Autonomous Radiometer) instrument was installedon the R/V MIRAI to participate in the MISMO cruise to the Indian Ocean. It operated asdesigned from the ship departure from Sekinehama until the end of Leg 1 and the MISMO IOP.At that time, a problem with the shutter system made the instrument unreliable. Repairs atsea failed.
The data taken throughout Leg 1 is of excellent quality. We estimate the measurement uncer-tainty is less than 0.1◦C which is the instrument accuracy specification.
Data were transmitted successfully via the Iridium SBD data link. This means of communicationwill be used on future installations.
References
Donlon, C., I. S. Robinson, M. Reynolds, W. Wimmer, G. Fisher, R. Edwards, and T. J.Nightingale, An autonomous infrared sea surface temperature radiometer (ISAR) for deploy-ment aboard volunteer observing ships (VOS), J. Atmos. Oceanic Technol.–accepted , 2007.
Fairall, C. W., E. F. Bradley, G. S. Godfrey, G. A. Wick, J. B. Edson, and G. S. Young, Cool-skin and warm-layer effects on sea surface temperature, J. Geophys. Res., 101 , 1295–1308,1996.
Minnett, P. J., Positiv: Prototype operational system – ISAR – temperature instrument forthe VOS fleet., proposal submitted pursuant to the Broad Agency Announcement, dated 20February 2002, entitled ”National Ocean Partnership Program”, topic A(3).
Price, J. F., R. A. Weller, and R. Pinkel, Diurnal cycling: observations and models of the upperocean response to diurnal heating, cooling, and wind mixing, J. Geophys. Res., 91 , 8411–8427,1986.
Price, J. F., R. A. Weller, C. M. Bowers, and M. G. Briscoe, Diurnal response of the sea surfacetemperature observed at the long-term upper ocean study (34◦N, 7-◦W) in the Sargasso sea,J. Geophys. Res., 92 , 14,480–14,490, 1987.
Reynolds, R. M., Program ISARAVG for converting raw ISAR measurements to averagedskin temperature: Theory and algorithms, RMR Co. Technical Memo. Available fromhttp://www.rmrco.com/links.