Embed Size (px)
Citation preview

CRUISE INDUSTRY SOURCE MARKET REPORTOcean Cruise PassengersNew Zealand 2016
CLIA Global and Australasia Regional Ocean Cruise Line Members
PEARL SEASC R U I S E S™
This report is based on 2016 calendar year passenger statistics provided by CLIA’s ocean cruise line members, representing over 95% of the global cruise industry. The research is based on a methodology that is used in similar studies around the world. The consistency of approach facilitates comparisons with other major cruise markets.

Contents
Executive Summary. . . . . . . . . . . . . . . . . . . . .2-3
Total Passengers . . . . . . . . . . . . . . . . . . . . . . . . 4
World Perspective . . . . . . . . . . . . . . . . . . . . . . . 5
Key Destinations . . . . . . . . . . . . . . . . . . . . . . . . 6
Demographics . . . . . . . . . . . . . . . . . . . . . . . . . . 7
Cruise Duration . . . . . . . . . . . . . . . . . . . . . . . . . 8
Established in 1975, Cruise Lines International Association (CLIA) is the world’s largest cruise industry trade association, providing a unified voice and leading authority of the global cruise community. CLIA supports policies and practices that foster a safe, secure, healthy and sustainable cruise ship environment and is dedicated to promoting the cruise travel experience.
CLIA’s Mission:
CLIA is the unified global organization that helps its members succeed by advocating, educating and promoting for the common interests of the cruise community.
CLIA represents the interests of three critically important members:
• 60 Cruise Line Members – From ocean to river to specialty cruise ships, CLIA member lines represent more than 95 per cent of global cruise capacity.
• 300 Executive Partner Members – As key suppliers and partners to the cruise lines, executive partners play a major role in the successful operation of cruising, including ports & destinations, ship development, suppliers and business services.
• 15,000 Global Travel Agency and 25,000 Travel Agent Members – Our travel agency members include the largest agencies, hosts, franchises and consortia in the world.
• CLIA Cruise Line Members serve more than 24 million passengers annually.
www.cruising.org.au | 1

EXECUTIVE SUMMARY
More New Zealanders than ever before cruised in 2016, with ocean cruise passenger numbers growing by 36 per cent to a record high of 90,184.
New Zealand was one of just four international markets to record a double-digit increase in 2016, with only emerging hot spot China reporting stronger growth.
Over the past 10 years New Zealand ocean cruise passenger numbers have risen by an average of 15 per cent per year, with the New Zealand passenger market doubling in five years.
The growth in 2016 was led by an increase in New Zealanders cruising locally, increasing by 12,041 in 2016 (up 177 per cent). New Zealand passengers cruising in the South Pacific increased by 10,668 (up 50 per cent).
New Zealand’s growth rate saw the nation increase its market penetration rate to almost 2 per cent, ranking it sixth in the world, ahead of many established cruise markets.
2 | www.cruising.org.au
Key Findings:
• The South Pacific maintained its place as the most popular destination for Kiwi cruisers with the region attracting more than one in three of the nation’s ocean cruise passengers
• New Zealand jumped into second place with 18,853 New Zealanders choosing to cruise close to home, driven primarily by the increased local deployment by P&O Cruises
• The number of New Zealanders cruising in local waters experienced the largest growth in 2016 - an impressive 177 per cent
• Europe fell to third place with 11,338 New Zealanders heading to the region for a fly-cruise holiday, falling by 10 per cent
• The equivalent of 2 per cent of New Zealand’s population took an ocean cruise last year, giving the nation a greater market penetration rate than established cruise markets like Italy, Spain and France (all around 1 per cent)
• The most popular cruise duration was 8-14 days, with more than half of all passengers (46,470) opting for this length, though shorter voyages of 1-4 days saw the biggest jump of 142 per cent
• All age brackets remained consistent with 2015, with around 38 per cent of New Zealand cruisers under the age of 50, and about 62 per cent aged over 50
• New Zealand cruise passengers spent 871,952 days at sea in 2016, up 29 per cent from 2015
New Zealand Hits 90,184
Ocean Cruise Passengers

www.cruising.org.au | 3
New Zealand Hits 90,184
Ocean Cruise Passengers
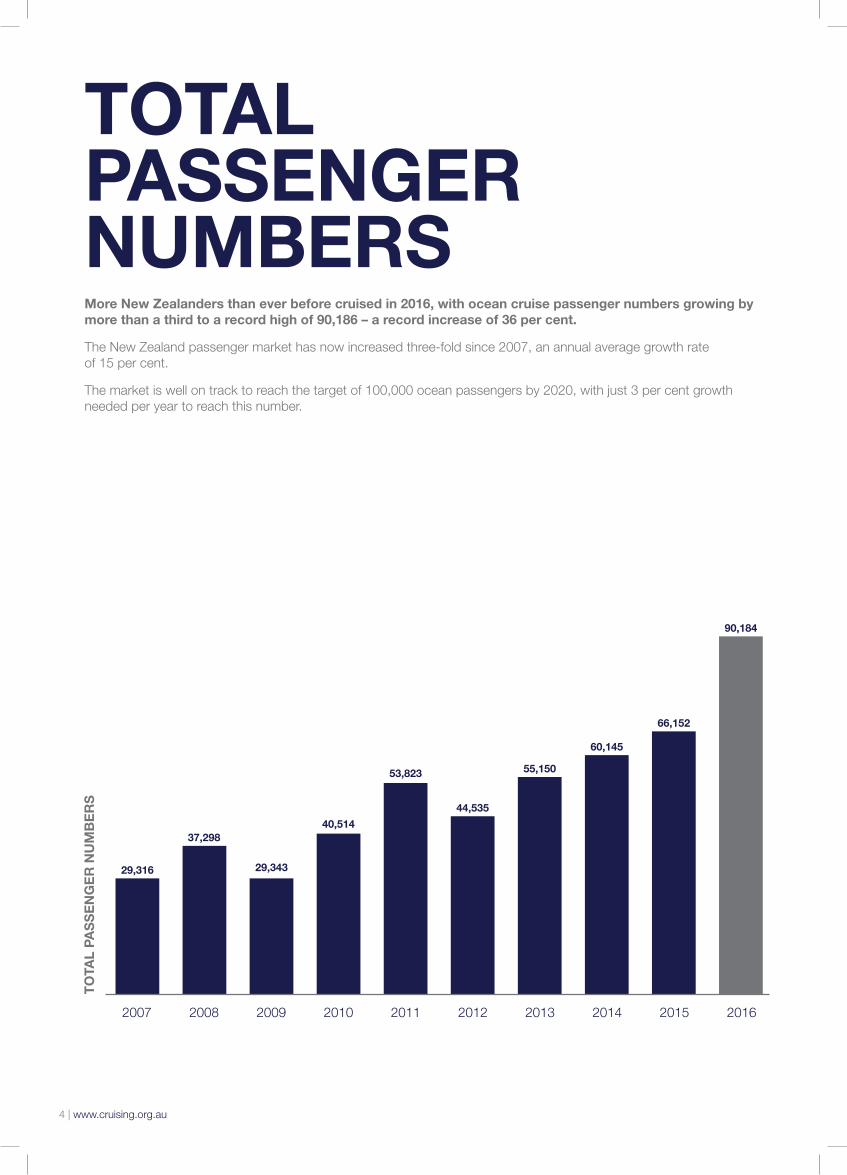
TOTAL PASSENGER NUMBERSMore New Zealanders than ever before cruised in 2016, with ocean cruise passenger numbers growing by more than a third to a record high of 90,186 – a record increase of 36 per cent.
The New Zealand passenger market has now increased three-fold since 2007, an annual average growth rate of 15 per cent.
The market is well on track to reach the target of 100,000 ocean passengers by 2020, with just 3 per cent growth needed per year to reach this number.
4 | www.cruising.org.au
TO
TAL
PAS
SE
NG
ER
NU
MB
ER
S
29,316
37,298
29,343
40,514
53,823
44,535
55,150
60,145
66,152
90,184
2007 2008 2009 2010 2011 2012 2013 2014 2015 2016
WORLD PERSPECTIVE
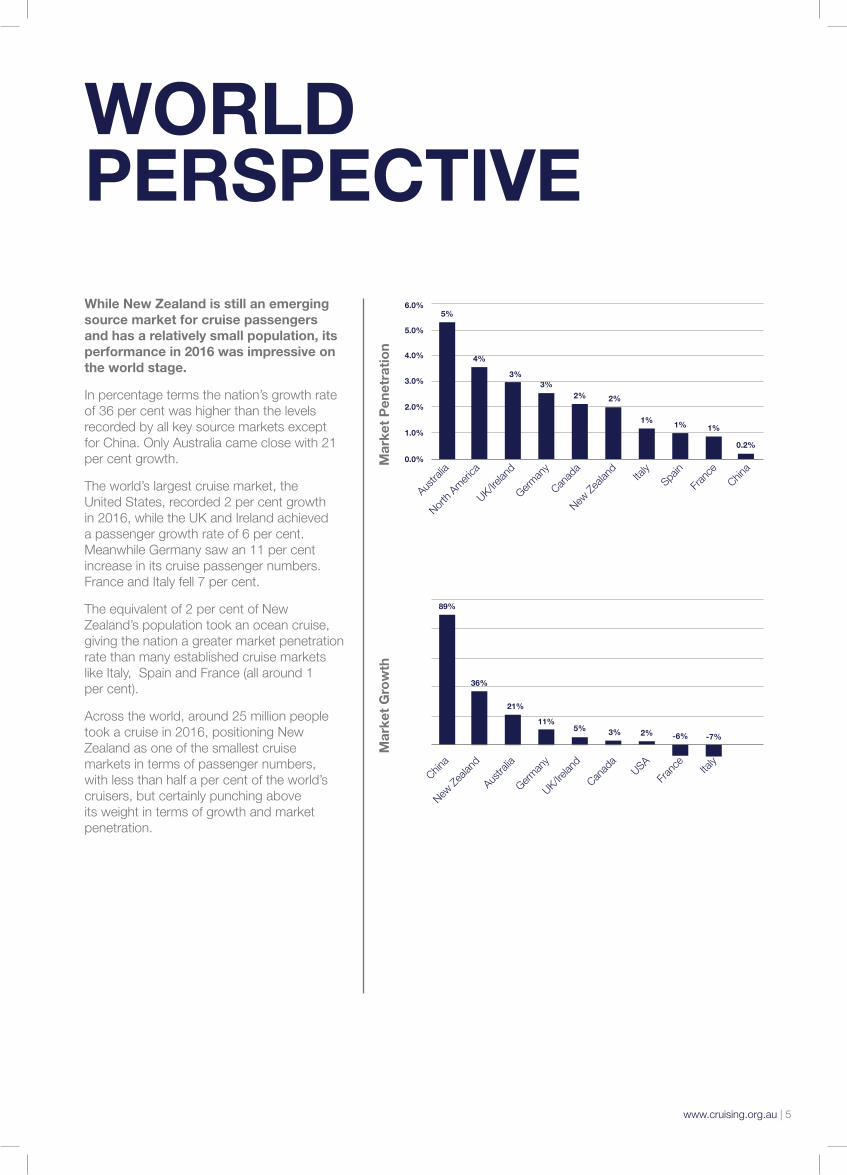
While New Zealand is still an emerging source market for cruise passengers and has a relatively small population, its performance in 2016 was impressive on the world stage.
In percentage terms the nation’s growth rate of 36 per cent was higher than the levels recorded by all key source markets except for China. Only Australia came close with 21 per cent growth.
The world’s largest cruise market, the United States, recorded 2 per cent growth in 2016, while the UK and Ireland achieved a passenger growth rate of 6 per cent. Meanwhile Germany saw an 11 per cent increase in its cruise passenger numbers. France and Italy fell 7 per cent.
The equivalent of 2 per cent of New Zealand’s population took an ocean cruise, giving the nation a greater market penetration rate than many established cruise markets like Italy, Spain and France (all around 1 per cent).
Across the world, around 25 million people took a cruise in 2016, positioning New Zealand as one of the smallest cruise markets in terms of passenger numbers, with less than half a per cent of the world’s cruisers, but certainly punching above its weight in terms of growth and market penetration.
www.cruising.org.au | 5
Mar
ket
Pen
etra
tio
n M
arke
t G
row
th
Austra
lia
China
North
America
New Z
ealan
d
UK/Irela
nd
Austra
lia
German
y
German
y
Canad
a
UK/Irela
nd
New Z
ealan
d
Canad
a
Italy
USA
Spain
Fran
ce
Fran
ce
Italy
China
5%
89%
36%
0.0%
1.0%
2.0%
3.0%
4.0%
5.0%
6.0%
4%
3%
21%
3%
11%
2%
5%
2%
3%
1%
2%
1%
-6%
1%
-7%
0.2%

KEY DESTINATIONS
With P&O now offering an extended NZ season and more short coastal itineraries, as well as an increasing number of ships offering trans-Tasman itineraries, cruising in local waters to the destinations of Australia, New Zealand and the South Pacific accounted for 64 per cent of cruise passengers in 2016, a 9 per cent increase.
The South Pacific continued to hold the most allure for Kiwi cruisers, attracting one third (32,164) of the nation’s total ocean cruise passengers, almost 50 per cent growth.
New Zealand cruising experienced the strongest growth with passenger numbers rising 177 per cent to 18,853, accounting for 21 per cent of total New Zealand passengers
PASSENGER GROWTH PER DESTINATION
Cruise Region 2015 2016 Variance
New Zealand 6,812 18,853 12,041 177%
World Voyages 932 2,506 1,574 169%
South America 426 655 229 54%
South Pacific 21,496 32,164 10,668 50%
Asia 3,750 4,764 1,014 27%
Other America 1,798 2,145 347 19%
Alaska 4,559 5,294 735 16%
Caribbean 3,697 4,230 533 14%
Northern Europe 2,770 2,785 15 1%
Mexico 1,473 1,457 -16 -1%
Meditteranean 9,819 8,553 -1,266 -13%
Other Destinations 682 538 -144 -21%
Australia 7,938 6,239 -1,699 -21%
TOTAL 66,152 90,184 24,032 36%
6 | www.cruising.org.au
Australia as a destination for New Zealand passengers fell to fourth place, after New Zealand, the South Pacific and Europe with 6,239 passengers, down 21 per cent. This can be attributed to the increased selection of ships and itineraries available locally for New Zealanders.
Asia continues to rise in popularity with numbers up 27 per cent to 4,764, while Alaska increased by 16 per cent to 5,294.
Long-haul fly-cruise to Europe fell in 2016 by 10 per cent, largely reflecting the impact of geo-political events. Europe remained the most popular long-haul destination and was the third most popular overall, attracting 11,338 New Zealanders last year.

www.cruising.org.au | 7
DEMOGRAPHICSBOOKING PATTERNSThe majority (92 per cent) of New Zealanders booked their cruise holiday within 12 months of departure with just over half booking their trip within six months of sailing, equally split between less than 3 months and 3-6 months.
Most categories remained consistent with 2015, except for bookings made within 90 days of departure, which increased by almost 5 per cent.
PASSENGER AGENew Zealand cruisers continue to come from across the age spectrum, underlying the wide array of cruises and destinations now on offer.
The distribution pattern has remained largely unchanged for the past 4 years, reflecting the appeal of all types of cruising and the diversity of itineraries across the board.
Less than90 days
27%
6-12 months
38%
12 monthsplus8%
3-6 months27%
< 4024%
41-456%
46-508%
51-5511%56-60
10%
61-6511%
66-7012%
70>18%
Rob Suisted

CRUISE DURATIONThe most popular cruise duration in 2016 was 8-14 days, with more than half of all passengers (46,470) opting for this.
Shorter voyages of 1-4 days saw the biggest jump of 142 per cent reflecting the increased interest in shorter “close-to-home” itineraries.
Overall, 88 per cent of New Zealand cruisers took a cruise of 14 days or less.
Measuring the total number of days spent at sea by New Zealand cruise passengers also provides a perspective on the market’s growth.
CLIA data shows that New Zealand passengers spent a record 871,952 days at sea in 2016 – an increase of 29 per cent on 2015, and a 187 per cent increase in 5 years.
Reflecting the increased interest in shorter cruises, the average length of a cruise holiday for New Zealanders in 2016 was 9.7 days, down from 10.2 days in 2015.
8 | www.cruising.org.au
LENGTH OF CRUISE
ESTIMATED SEA DAYS
2016
0
5,000
10,000
15,000
20,000
25,000
30,000
35,000
40,000
45,000
50,000
2015
2014
2013
2012
0 200,000 400,000 600,000 800,000
1-4Days
2014 2015 2016
5-7Days
8-14Days
15-21 Days
22+Days
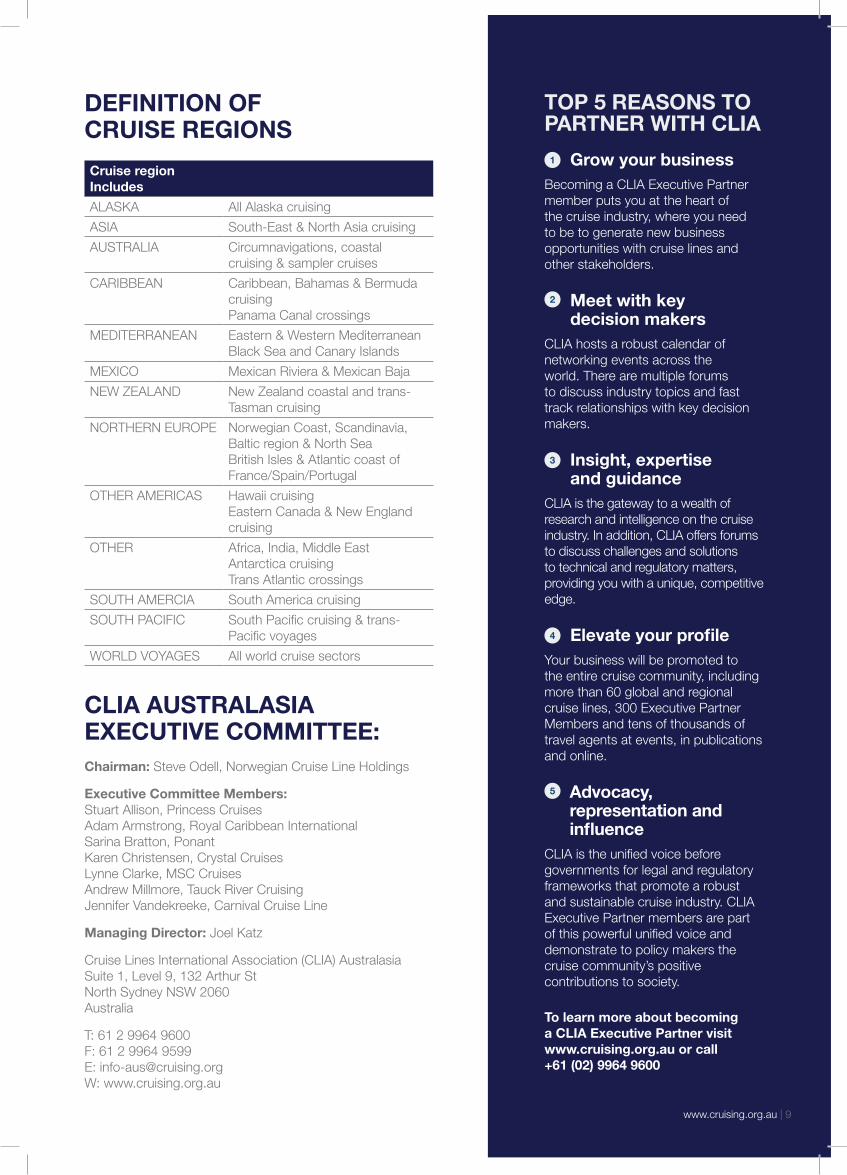
Cruise region Includes
ALASKA All Alaska cruising
ASIA South-East & North Asia cruising
AUSTRALIA Circumnavigations, coastal cruising & sampler cruises
CARIBBEAN Caribbean, Bahamas & Bermuda cruising Panama Canal crossings
MEDITERRANEAN Eastern & Western Mediterranean Black Sea and Canary Islands
MEXICO Mexican Riviera & Mexican Baja
NEW ZEALAND New Zealand coastal and trans-Tasman cruising
NORTHERN EUROPE Norwegian Coast, Scandinavia, Baltic region & North Sea British Isles & Atlantic coast of France/Spain/Portugal
OTHER AMERICAS Hawaii cruising Eastern Canada & New England cruising
OTHER Africa, India, Middle East Antarctica cruising Trans Atlantic crossings
SOUTH AMERCIA South America cruising
SOUTH PACIFIC South Pacific cruising & trans-Pacific voyages
WORLD VOYAGES All world cruise sectors
Chairman: Steve Odell, Norwegian Cruise Line Holdings
Executive Committee Members: Stuart Allison, Princess Cruises Adam Armstrong, Royal Caribbean International Sarina Bratton, Ponant Karen Christensen, Crystal Cruises Lynne Clarke, MSC Cruises Andrew Millmore, Tauck River Cruising Jennifer Vandekreeke, Carnival Cruise Line
Managing Director: Joel Katz
Cruise Lines International Association (CLIA) Australasia Suite 1, Level 9, 132 Arthur St North Sydney NSW 2060 Australia
T: 61 2 9964 9600 F: 61 2 9964 9599 E: [email protected] W: www.cruising.org.au
DEFINITION OF CRUISE REGIONS
CLIA AUSTRALASIA EXECUTIVE COMMITTEE:
TOP 5 REASONS TO PARTNER WITH CLIA
1 Grow your businessBecoming a CLIA Executive Partner member puts you at the heart of the cruise industry, where you need to be to generate new business opportunities with cruise lines and other stakeholders.
2 Meet with key decision makers
CLIA hosts a robust calendar of networking events across the world. There are multiple forums to discuss industry topics and fast track relationships with key decision makers.
3 Insight, expertise and guidance
CLIA is the gateway to a wealth of research and intelligence on the cruise industry. In addition, CLIA offers forums to discuss challenges and solutions to technical and regulatory matters, providing you with a unique, competitive edge.
4 Elevate your profileYour business will be promoted to the entire cruise community, including more than 60 global and regional cruise lines, 300 Executive Partner Members and tens of thousands of travel agents at events, in publications and online.
5 Advocacy, representation and influence
CLIA is the unified voice before governments for legal and regulatory frameworks that promote a robust and sustainable cruise industry. CLIA Executive Partner members are part of this powerful unified voice and demonstrate to policy makers the cruise community’s positive contributions to society.
To learn more about becoming a CLIA Executive Partner visit www.cruising.org.au or call +61 (02) 9964 9600
www.cruising.org.au | 9

Milford Sound, Fiordland
newzealand.com
14071 - TNZ Cruise Insight Magazine FP-v1.indd 1 27/02/17 8:46 AM