Embed Size (px)
Citation preview
Philip K. VerlegerPKVerleger LLCDenver, ColoradoMay 23, 2019
Crude as a Casualty of the Trade WarIs China Moving Deliberately to Depress Crude Prices?
We are experiencing the severest petroleum market disruption ever. Why, then, are prices so stable?
Production collapse in Venezuela Tightened sanctions on Iran Contamination of Russian crude pipeline Civil war in Libya
2
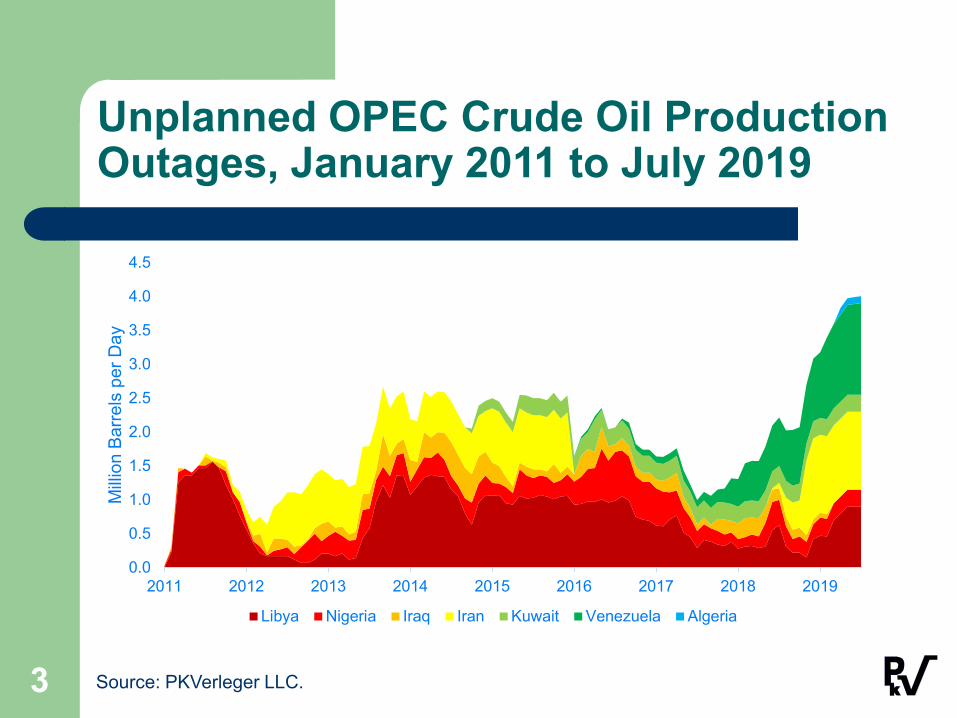
Unplanned OPEC Crude Oil Production Outages, January 2011 to July 2019
0.0
0.5
1.0
1.5
2.0
2.5
3.0
3.5
4.0
4.5
2011 2012 2013 2014 2015 2016 2017 2018 2019
Milli
on B
arre
ls p
er D
ay
Libya Nigeria Iraq Iran Kuwait Venezuela Algeria
3 Source: PKVerleger LLC.
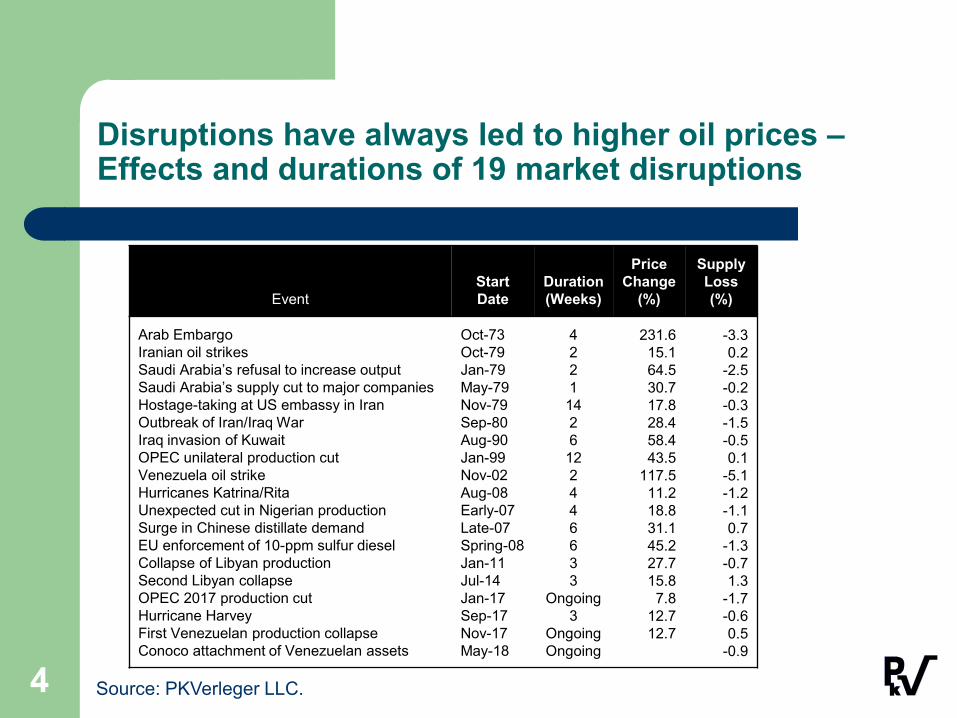
Disruptions have always led to higher oil prices –Effects and durations of 19 market disruptions
4
EventStart Date
Duration (Weeks)
Price Change
(%)
Supply Loss (%)
Arab EmbargoIranian oil strikesSaudi Arabia’s refusal to increase outputSaudi Arabia’s supply cut to major companiesHostage-taking at US embassy in IranOutbreak of Iran/Iraq WarIraq invasion of KuwaitOPEC unilateral production cutVenezuela oil strikeHurricanes Katrina/RitaUnexpected cut in Nigerian production Surge in Chinese distillate demandEU enforcement of 10-ppm sulfur dieselCollapse of Libyan productionSecond Libyan collapseOPEC 2017 production cutHurricane HarveyFirst Venezuelan production collapseConoco attachment of Venezuelan assets
Oct-73Oct-79Jan-79May-79Nov-79Sep-80Aug-90Jan-99Nov-02Aug-08Early-07Late-07Spring-08Jan-11Jul-14Jan-17Sep-17Nov-17May-18
42211426122446633
Ongoing3
OngoingOngoing
231.615.164.530.717.828.458.443.5
117.511.218.831.145.227.715.87.8
12.712.7
-3.30.2
-2.5-0.2-0.3-1.5-0.50.1
-5.1-1.2-1.10.7
-1.3-0.71.3
-1.7-0.60.5
-0.9
Source: PKVerleger LLC.
This disruption will rank with the worst – if OPEC+ oil-exporting countries do not increase supply.
Saudi Arabia has predicated increases in output on declines in global crude oil stocks.
Saudi minister al-Falih stated that he wants to drive inventories down “gently.”
There are no indications of production increases to offset losses.
The modeling suggests prices could rise to $120 if past episodes are a guide.
5
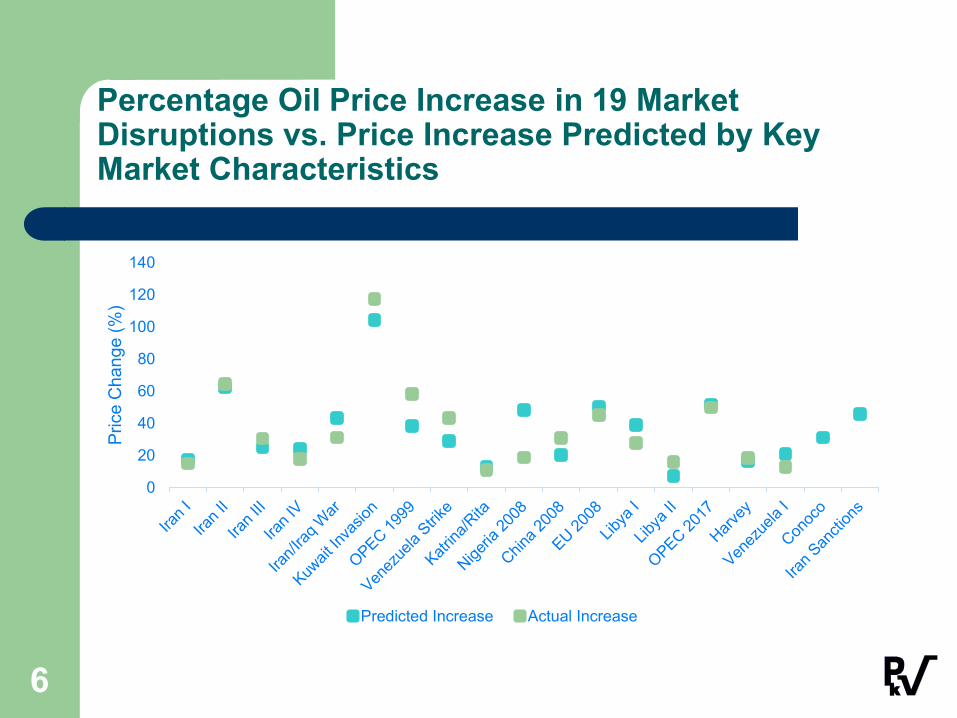
Percentage Oil Price Increase in 19 Market Disruptions vs. Price Increase Predicted by Key Market Characteristics
0
20
40
60
80
100
120
140
Pric
e C
hang
e (%
)
Predicted Increase Actual Increase
6
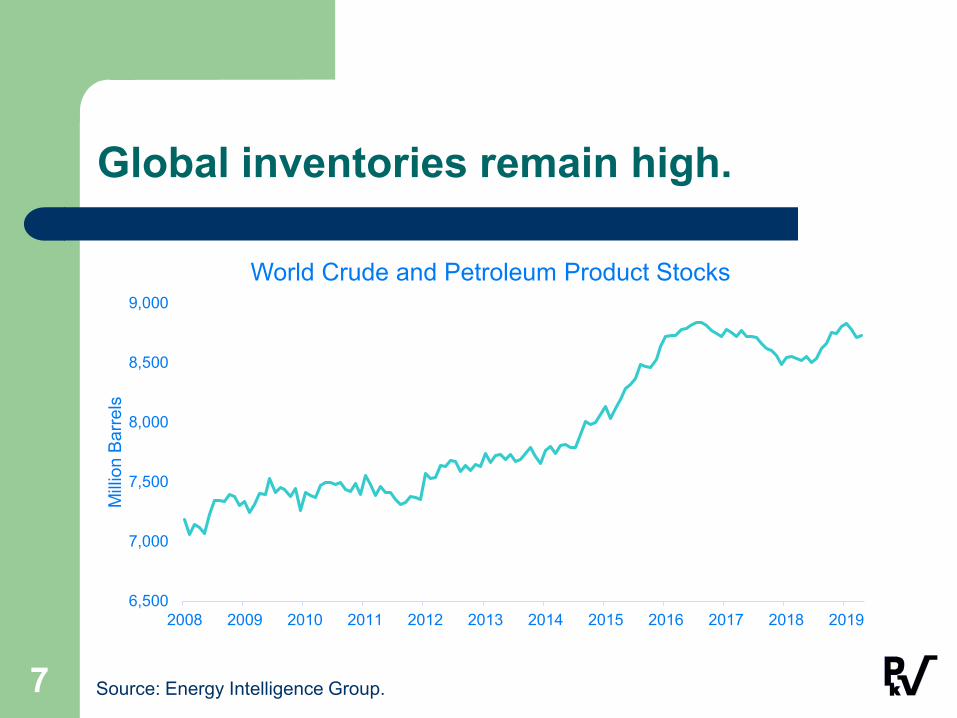
Global inventories remain high.
6,500
7,000
7,500
8,000
8,500
9,000
2008 2009 2010 2011 2012 2013 2014 2015 2016 2017 2018 2019
Milli
on B
arre
ls
World Crude and Petroleum Product Stocks
7 Source: Energy Intelligence Group.
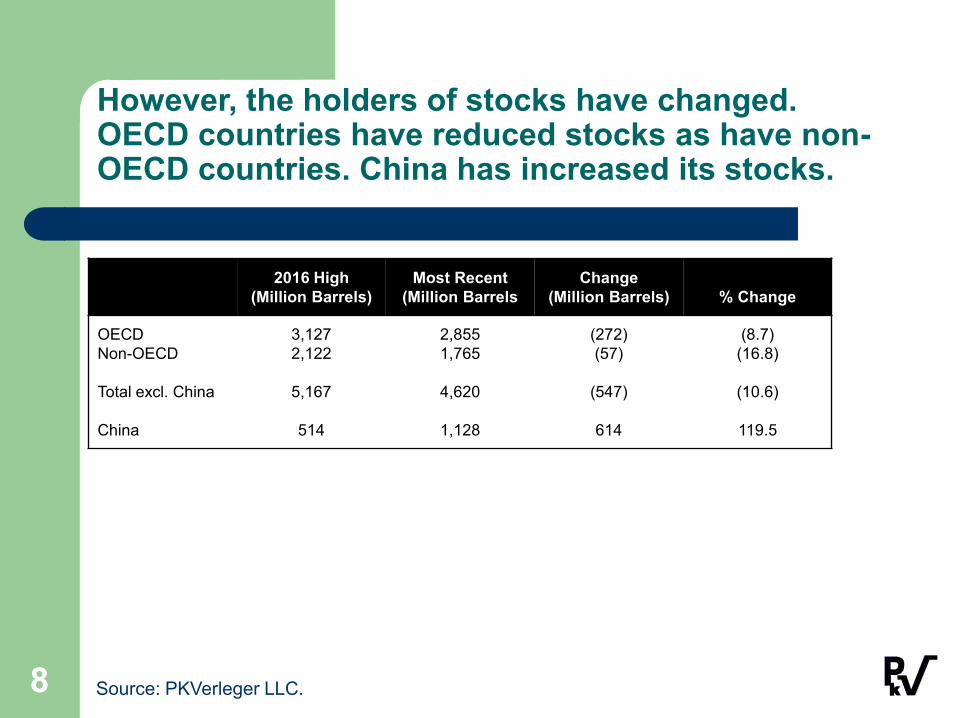
However, the holders of stocks have changed. OECD countries have reduced stocks as have non-OECD countries. China has increased its stocks.
8
2016 High(Million Barrels)
Most Recent(Million Barrels
Change(Million Barrels) % Change
OECDNon-OECD
Total excl. China
China
3,1272,122
5,167
514
2,8551,765
4,620
1,128
(272)(57)
(547)
614
(8.7)(16.8)
(10.6)
119.5
Source: PKVerleger LLC.
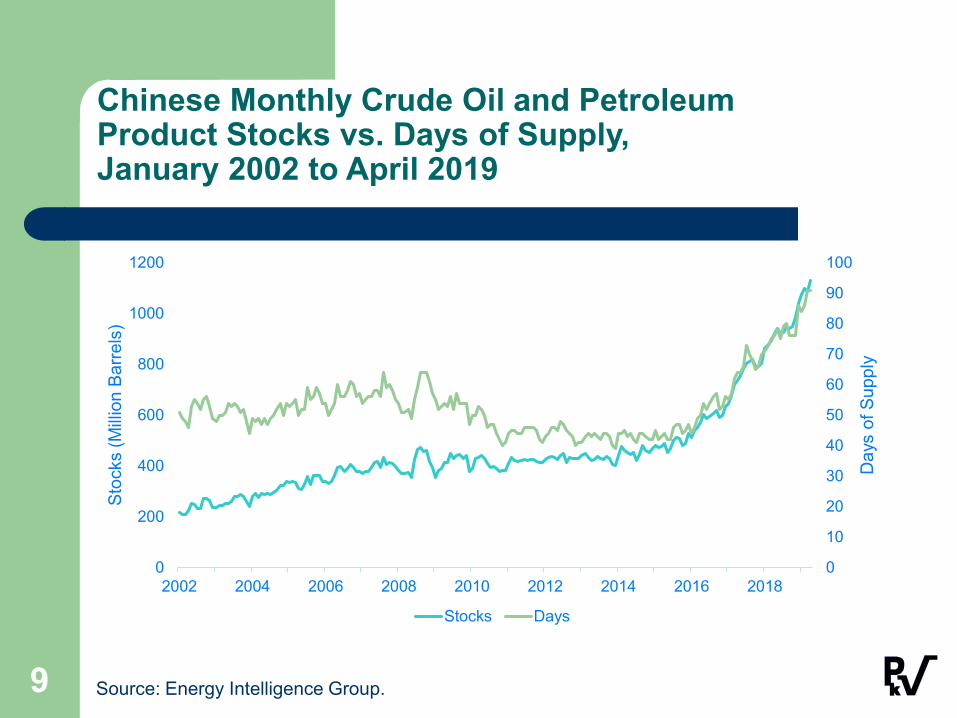
Chinese Monthly Crude Oil and PetroleumProduct Stocks vs. Days of Supply,January 2002 to April 2019
0
10
20
30
40
50
60
70
80
90
100
0
200
400
600
800
1000
1200
2002 2004 2006 2008 2010 2012 2014 2016 2018
Day
s of
Sup
ply
Stoc
ks (M
illion
Bar
rels
)
Stocks Days
9 Source: Energy Intelligence Group.
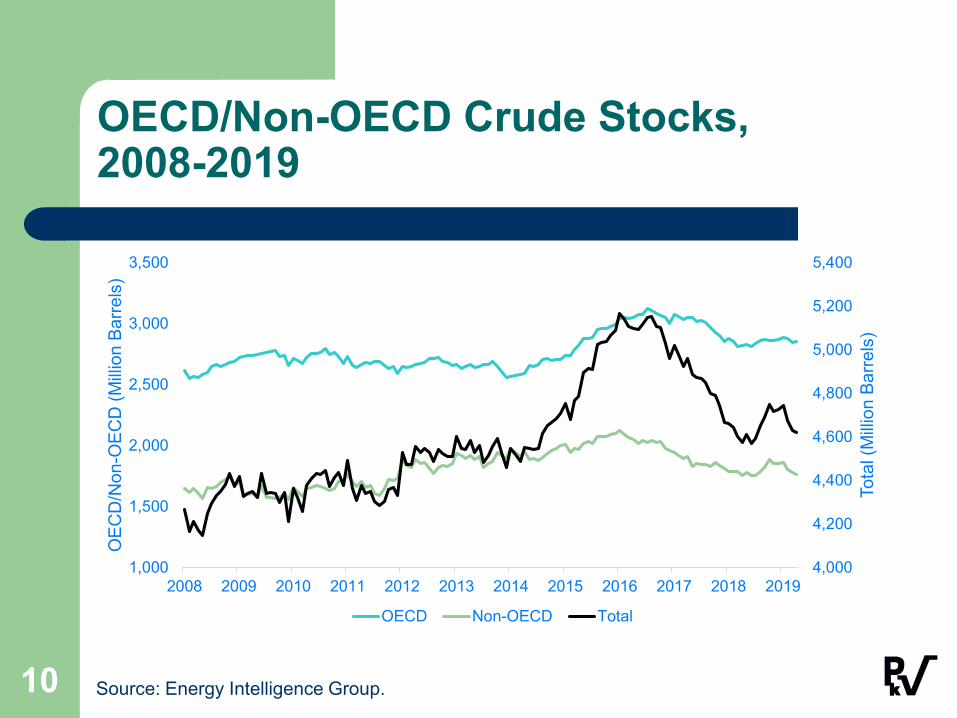
OECD/Non-OECD Crude Stocks,2008-2019
4,000
4,200
4,400
4,600
4,800
5,000
5,200
5,400
1,000
1,500
2,000
2,500
3,000
3,500
2008 2009 2010 2011 2012 2013 2014 2015 2016 2017 2018 2019
Tota
l (M
illion
Bar
rels
)
OEC
D/N
on-O
ECD
(Milli
on B
arre
ls)
OECD Non-OECD Total
10 Source: Energy Intelligence Group.
The increase in China’s inventories may matter.
Exports account for 18% of China’s GDP. Exports to US are threatened by US trade actions.
The US accounts for 19% of China’s exports. These exports will decline.
Thirty percent of China’s exports go to underdeveloped countries that are vulnerable to oil price increases.
China’s economy could suffer greatly from lost sales to these nations should oil prices rise.
11
China can prevent oil price increases. China can even cause a decline.
A key but unacknowledged fact is that product prices lead crude prices.
– Refiners look to product prices to set their bids for crude.– Product netbacks are the key determinant.– Rising product prices have pulled up crude in almost all
prior disruptions. China has expanded its refining capacity in a
massive way.– Chinese refiners account for 14% of world capacity.– China has 45% of Asia’s refining capacity.
12
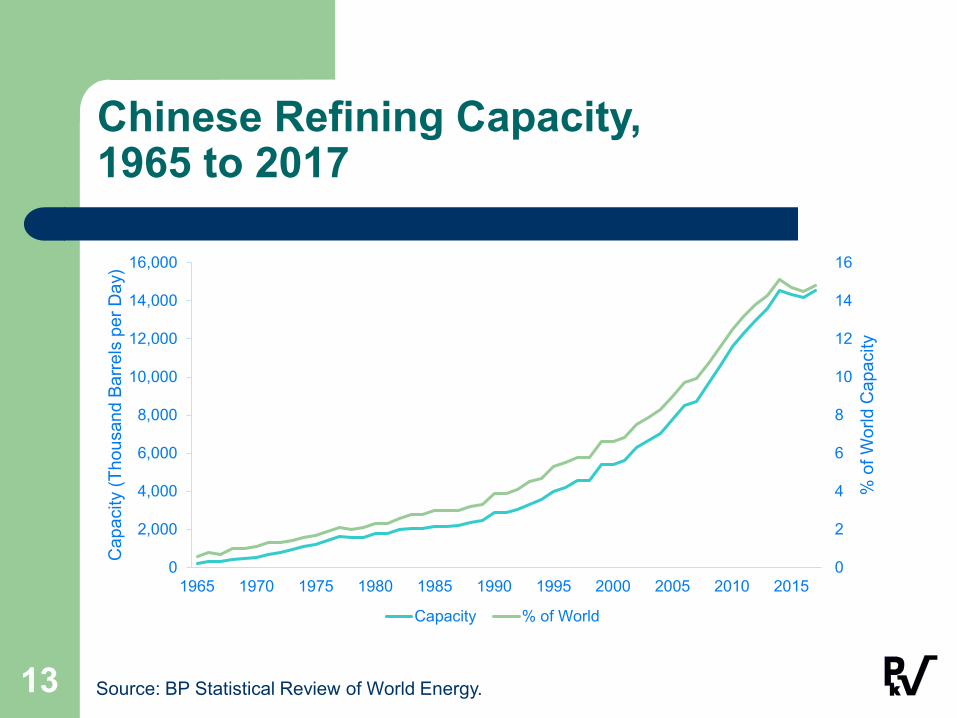
Chinese Refining Capacity,1965 to 2017
0
2
4
6
8
10
12
14
16
0
2,000
4,000
6,000
8,000
10,000
12,000
14,000
16,000
1965 1970 1975 1980 1985 1990 1995 2000 2005 2010 2015
% o
f Wor
ld C
apac
ity
Cap
acity
(Tho
usan
d Ba
rrels
per
Day
)
Capacity % of World
13 Source: BP Statistical Review of World Energy.
China’s threat to the petroleum market was noted in January by The Wall Street Journal.
“An economic slowdown will curb China’s appetite for gasoline this year. That could mean a flood of exports to the rest of Asia, further pressuring regional refiners’ margins” (Kevin Kingsbury, “China’s Slowdown Is a Drag for Fuel Refineries, January 23, 2019).
The economic slowdown in China has limited its gasoline use. Government policies pushing conservation and electric vehicles add further downward pressure.
Export quotas granted to refiners increased 35% in 2018 in response to the slowdown.
These quotas have risen another 10% in 2019 through May.
14
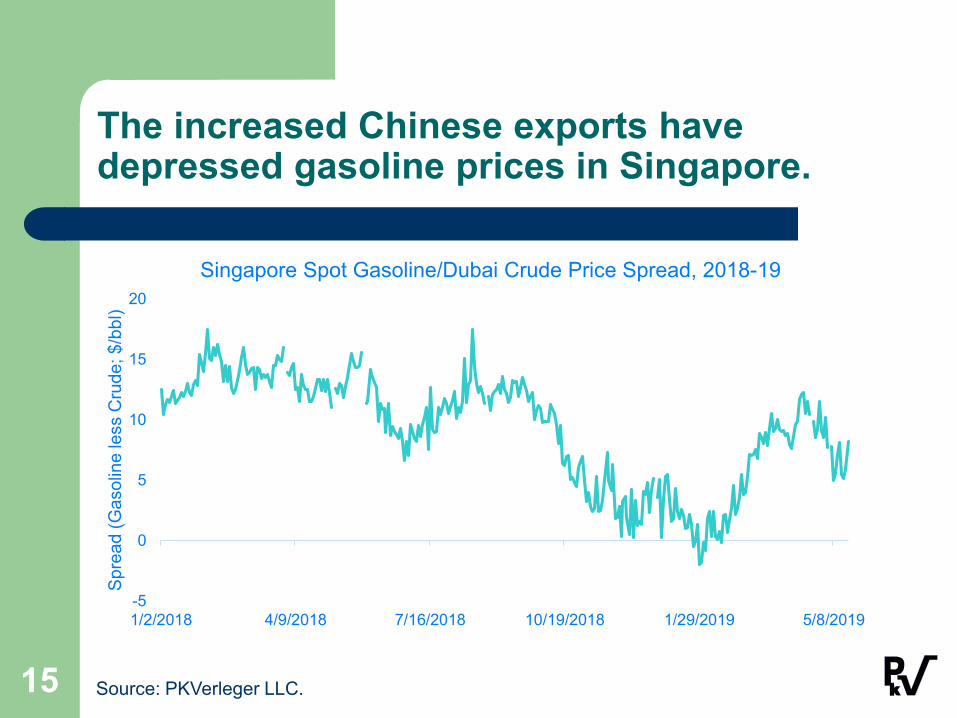
The increased Chinese exports have depressed gasoline prices in Singapore.
-5
0
5
10
15
20
1/2/2018 4/9/2018 7/16/2018 10/19/2018 1/29/2019 5/8/2019
Spre
ad (G
asol
ine
less
Cru
de; $
/bbl
)
Singapore Spot Gasoline/Dubai Crude Price Spread, 2018-19
15 Source: PKVerleger LLC.
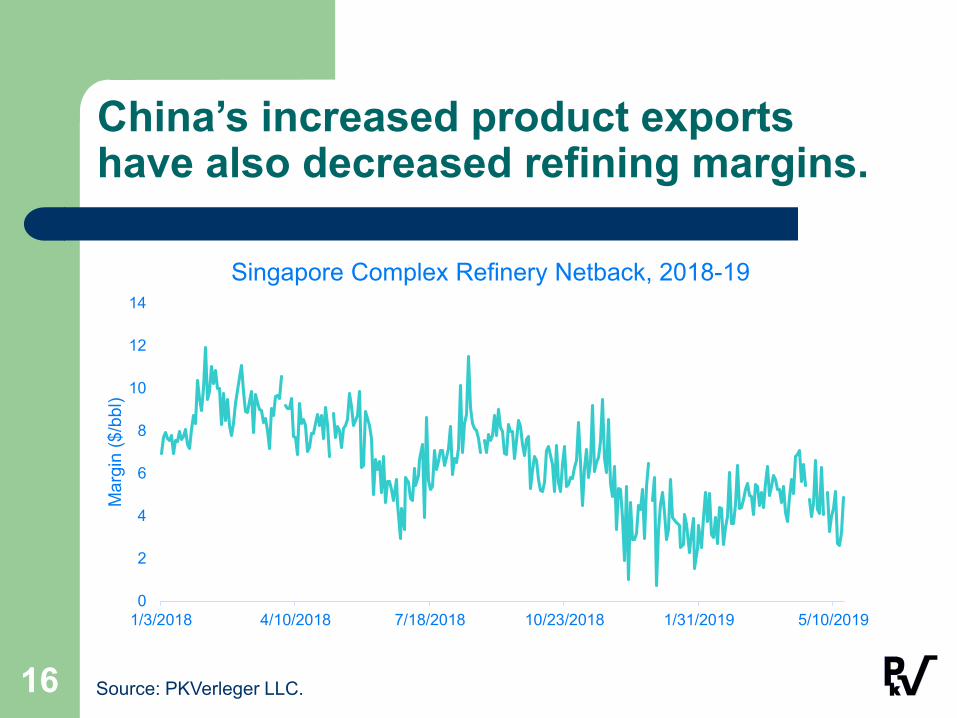
China’s increased product exports have also decreased refining margins.
0
2
4
6
8
10
12
14
1/3/2018 4/10/2018 7/18/2018 10/23/2018 1/31/2019 5/10/2019
Mar
gin
($/b
bl)
Singapore Complex Refinery Netback, 2018-19
16 Source: PKVerleger LLC.
There is historical precedence for China’s action. South Korean refiners did the same thing during the Asian debt crisis.
South Korea had expanded refining capacity prior to the Asian debt crisis.
South Korean petroleum demand dropped 14% in one year during the crisis.
The country’s refiners continued to process and pushed product into Singapore to maintain cash flow.
In doing so, they pushed crude prices down almost 60%.
17
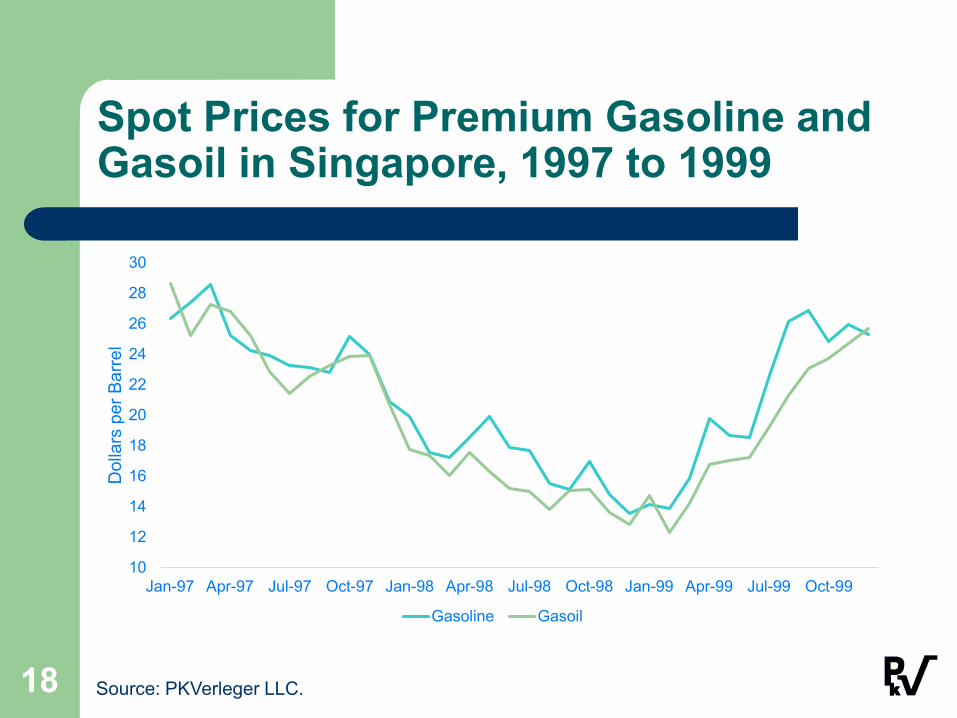
Spot Prices for Premium Gasoline and Gasoil in Singapore, 1997 to 1999
10
12
14
16
18
20
22
24
26
28
30
Jan-97 Apr-97 Jul-97 Oct-97 Jan-98 Apr-98 Jul-98 Oct-98 Jan-99 Apr-99 Jul-99 Oct-99
Dol
lars
per
Bar
rel
Gasoline Gasoil
18 Source: PKVerleger LLC.
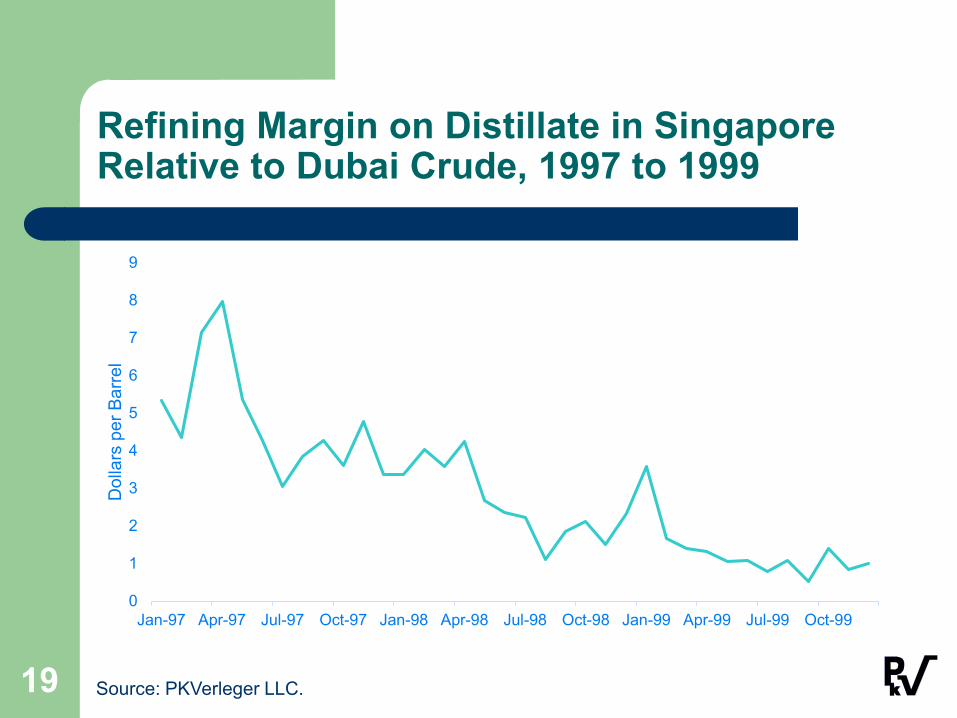
Refining Margin on Distillate in Singapore Relative to Dubai Crude, 1997 to 1999
0
1
2
3
4
5
6
7
8
9
Jan-97 Apr-97 Jul-97 Oct-97 Jan-98 Apr-98 Jul-98 Oct-98 Jan-99 Apr-99 Jul-99 Oct-99
Dol
lars
per
Bar
rel
19 Source: PKVerleger LLC.
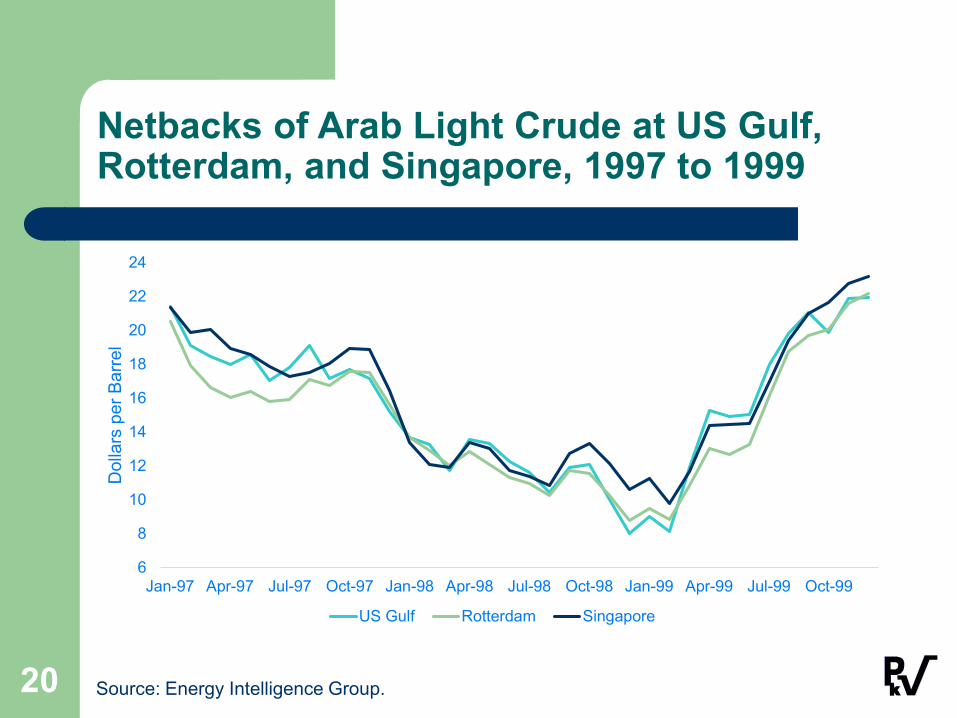
Netbacks of Arab Light Crude at US Gulf, Rotterdam, and Singapore, 1997 to 1999
6
8
10
12
14
16
18
20
22
24
Jan-97 Apr-97 Jul-97 Oct-97 Jan-98 Apr-98 Jul-98 Oct-98 Jan-99 Apr-99 Jul-99 Oct-99
Dol
lars
per
Bar
rel
US Gulf Rotterdam Singapore
20 Source: Energy Intelligence Group.
China has the oil, the refining capacity, and perhaps the need to push crude prices down. All that is required is an economic recession.
US trade actions threaten recession in China. China has yet to indicate that it will capitulate in the trade
war. US limits on selling computer chips to China could cripple
some Chinese industries. A Chinese ban on selling rare earth minerals to the US
could cripple US chip manufacturers. A flood of petroleum products into Singapore could drive
global crude prices down to or below last December’s low.
Trade wars are not easy to win.
21