Embed Size (px)
Citation preview

CROWN LIMITEDCROWN LIMITEDANNUAL REPORT 2008ANNUAL REPORT 2008
CONTENTS
Executive Chairman’s Letter 1
Crown’s Gaming Portfolio 2
Chief Executive Officer’s Report 4
Australian Casinos
• Crown Melbourne 8
• Burswood 13
US Casino Acquisition
• Cannery Casino Resorts 16
Joint Venture Businesses
• Melco Crown Entertainment 17
• Gateway 19
• Aspinalls 20
• Betfair Australia 20
• Other US Investments 20
Community and the Environment 21
Corporate Governance Statement 24
Remuneration Report 32
Directors’ Statutory Report 53
Auditor’s Independence Declaration 63
Independent Auditor’s Report 64
Directors’ Declaration 66
Financial Report 67
Shareholder Information 131
Additional Information 133
Corporate Information Inside Back Cover
ANNUAL GENERAL MEETING
Tuesday 28th October, 11.00am River Room, Level 1, Crown Towers
8 Whiteman Street, Southbank Victoria 3006
FINANCIAL CALENDAR
Payment of fi nal dividend 17 October 2008
Annual General Meeting 28 October 2008
2009 interim results Second half of February 2009
Crown Limited ABN 39 125 709 953
Executive Chairman’s Letter
Dear fellow shareholder,
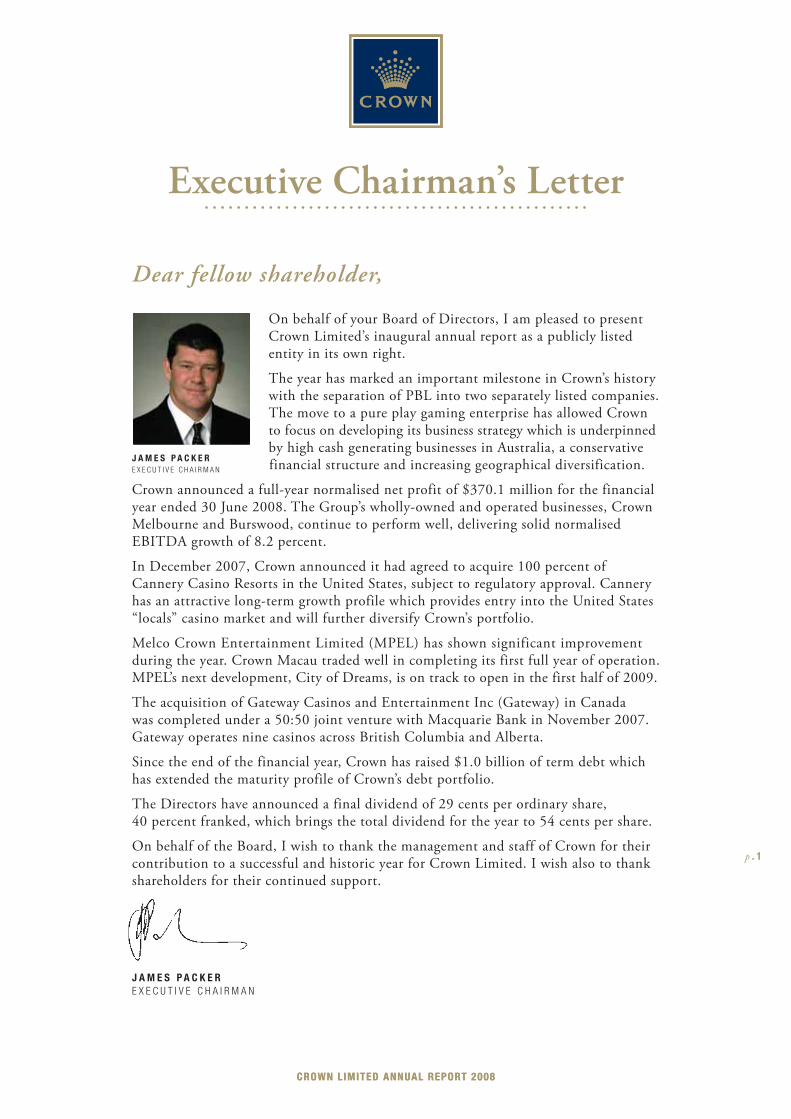
On behalf of your Board of Directors, I am pleased to present Crown Limited’s inaugural annual report as a publicly listed entity in its own right.
The year has marked an important milestone in Crown’s history with the separation of PBL into two separately listed companies. The move to a pure play gaming enterprise has allowed Crown to focus on developing its business strategy which is underpinned by high cash generating businesses in Australia, a conservative financial structure and increasing geographical diversification.
Crown announced a full-year normalised net profit of $370.1 million for the financial year ended 30 June 2008. The Group’s wholly-owned and operated businesses, Crown Melbourne and Burswood, continue to perform well, delivering solid normalised EBITDA growth of 8.2 percent.
In December 2007, Crown announced it had agreed to acquire 100 percent of Cannery Casino Resorts in the United States, subject to regulatory approval. Cannery has an attractive long-term growth profile which provides entry into the United States “locals” casino market and will further diversify Crown’s portfolio.
Melco Crown Entertainment Limited (MPEL) has shown significant improvement during the year. Crown Macau traded well in completing its first full year of operation. MPEL’s next development, City of Dreams, is on track to open in the first half of 2009.
The acquisition of Gateway Casinos and Entertainment Inc (Gateway) in Canada was completed under a 50:50 joint venture with Macquarie Bank in November 2007. Gateway operates nine casinos across British Columbia and Alberta.
Since the end of the financial year, Crown has raised $1.0 billion of term debt which has extended the maturity profile of Crown’s debt portfolio.
The Directors have announced a final dividend of 29 cents per ordinary share, 40 percent franked, which brings the total dividend for the year to 54 cents per share.
On behalf of the Board, I wish to thank the management and staff of Crown for their contribution to a successful and historic year for Crown Limited. I wish also to thank shareholders for their continued support.
J A M E S P A C K E RE X E C U T I V E C H A I R M A N
J A M E S P A C K E RE X E C U T I V E C H A I R M A N
p . 1
CROWN LIMITED ANNUAL REPORT 2008CROWN LIMITED ANNUAL REPORT 2008

• 2,500 slot machines• 350 table games• Two hotels with 950 rooms• Third hotel under
construction (658 rooms)• The Palms 900 seat showroom
• The Palladium 2000 seat ballroom
• 50 restaurants and bars• International designer
boutiques• 13 cinemas
MELBOURNE AUSTRALIA100% OWNED
• 1,750 slot machines• 170 table games• Two hotels with 693 rooms• 20,000 seat Burswood Dome
• Burswood Theatre & Convention Centre
• 14 restaurants and bars• Retail outlets
PERTH AUSTRALIA100% OWNED
Crown’s Gaming Portfolio
p . 2
• US “locals” casino operator with one casino in Pittsburgh and three in Las Vegas.
• The Meadows permanent facility in Pittsburgh is due for completion in April 2009.
• Eastside Cannery opened in Las Vegas in August 2008.
• Cannery will operate approximately 9,000 slot machines, 73 table games and 514 hotel rooms on completion of the Meadows permanent facility.
PITTSBURGH AND LAS VEGAS USA. WILL BE
100% OWNED, SUBJECT TO REGULATORY APPROVAL.

Crown Macau• 240 slot machines• 240 table gamesMocha Clubs• A portfolio of gaming lounges
operating approximately 1,100 slot machines.
City of Dreams• Upon completion in 2009
it is expected to have 1,500 slot machines and 550 table games.
MACAU37.9%
INTEREST
• Operates nine casinos in Western Canada.
• Gateway will operate more than 5,400 slot machines and over 200 tables together with 277 hotel rooms upon completion of current development projects.
CANADA50% INTEREST
• Betfair Australasia operates a betting exchange for customers who are residents of Australia or New Zealand.
AUST & NZ50% INTEREST
• Aspinalls operates four casinos in the United Kingdom with a total of 200 slot machines and 120 table games.
UK50% INTEREST
Crown’s Gaming Portfolio
p . 3
CROWN LIMITED ANNUAL REPORT 2008
For the year ended 30 June 2008 $million*Operating revenue 2,026.2
Net operating expenses (1,437.4)
Earning before interest, taxation, depreciation and amortisation (EBITDA) 588.8
Earning before interest and taxation (EBIT) 456.0
Net profi t after tax (NPAT) 370.1
*Normalised and excluding discontinued operations and non-recurring items
Chief Executive Officer’s Report
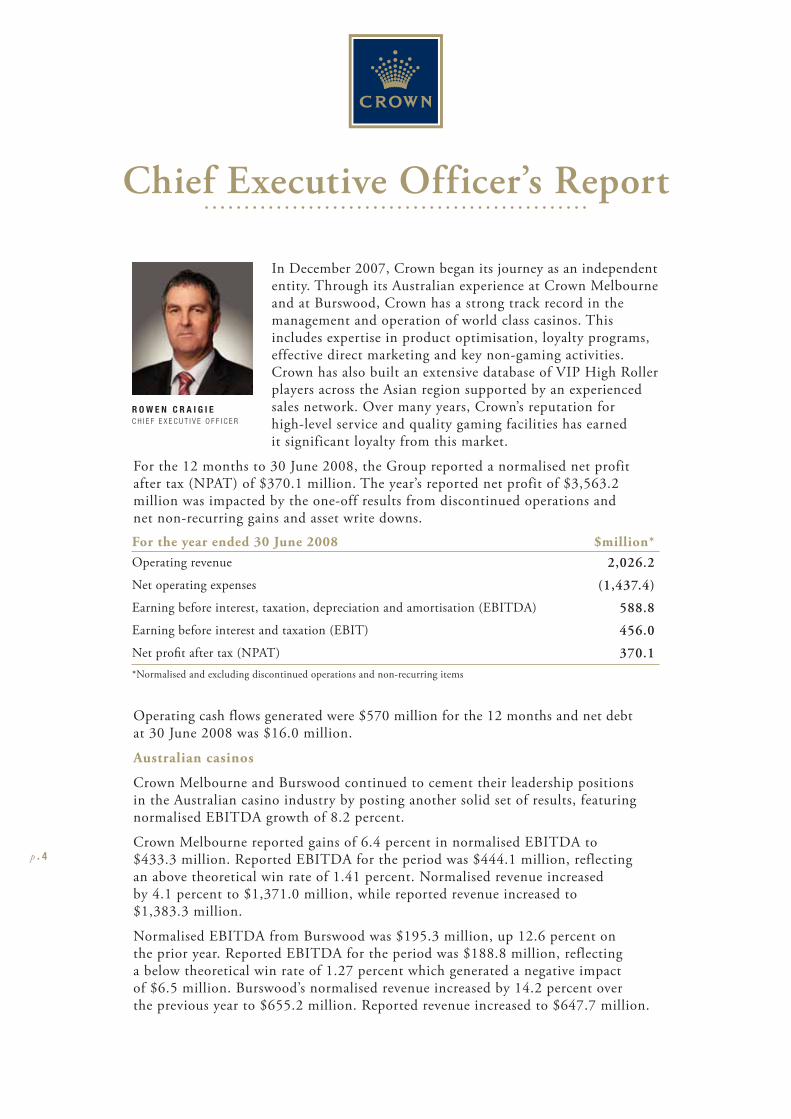
In December 2007, Crown began its journey as an independent entity. Through its Australian experience at Crown Melbourne and at Burswood, Crown has a strong track record in the management and operation of world class casinos. This includes expertise in product optimisation, loyalty programs, effective direct marketing and key non-gaming activities. Crown has also built an extensive database of VIP High Roller players across the Asian region supported by an experienced sales network. Over many years, Crown’s reputation for high-level service and quality gaming facilities has earned it significant loyalty from this market.
For the 12 months to 30 June 2008, the Group reported a normalised net profit after tax (NPAT) of $370.1 million. The year’s reported net profit of $3,563.2 million was impacted by the one-off results from discontinued operations and net non-recurring gains and asset write downs.
Operating cash flows generated were $570 million for the 12 months and net debt at 30 June 2008 was $16.0 million.
Australian casinos
Crown Melbourne and Burswood continued to cement their leadership positions in the Australian casino industry by posting another solid set of results, featuring normalised EBITDA growth of 8.2 percent.
Crown Melbourne reported gains of 6.4 percent in normalised EBITDA to $433.3 million. Reported EBITDA for the period was $444.1 million, reflecting an above theoretical win rate of 1.41 percent. Normalised revenue increased by 4.1 percent to $1,371.0 million, while reported revenue increased to $1,383.3 million.
Normalised EBITDA from Burswood was $195.3 million, up 12.6 percent on the prior year. Reported EBITDA for the period was $188.8 million, reflecting a below theoretical win rate of 1.27 percent which generated a negative impact of $6.5 million. Burswood’s normalised revenue increased by 14.2 percent over the previous year to $655.2 million. Reported revenue increased to $647.7 million.
R O W E N C R A I G I EC H I E F E X E C U T I V E O F F I C E R
p . 4
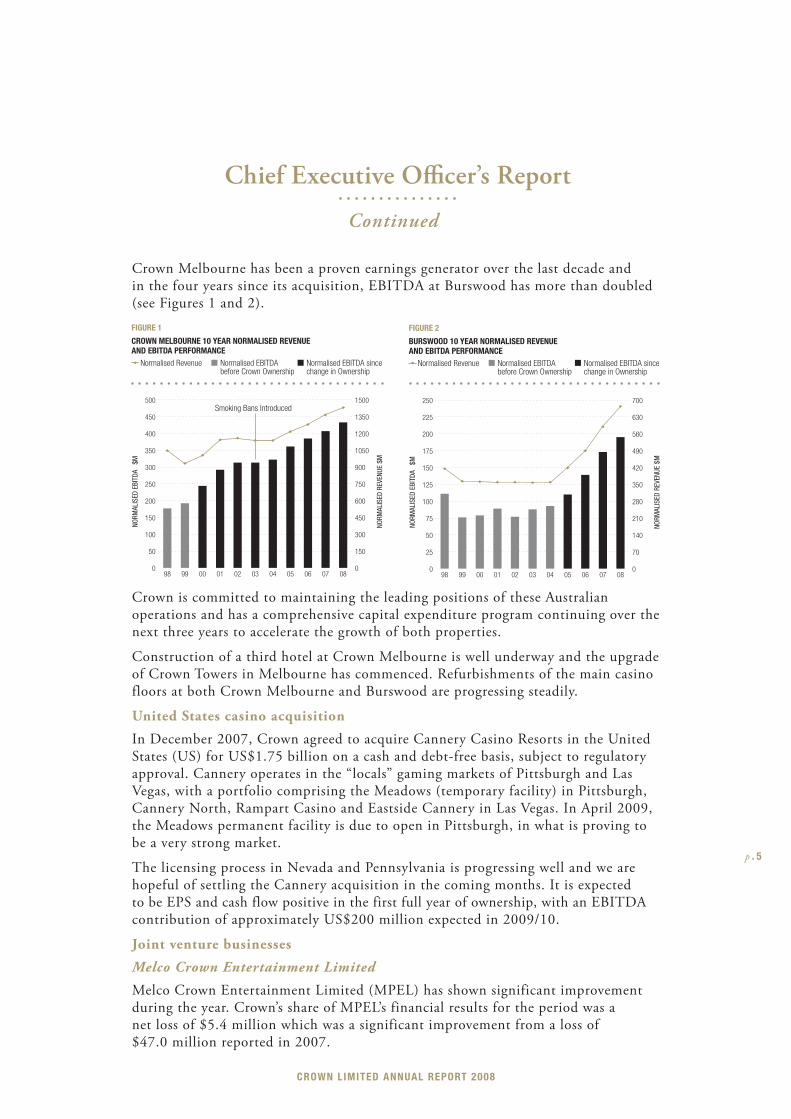
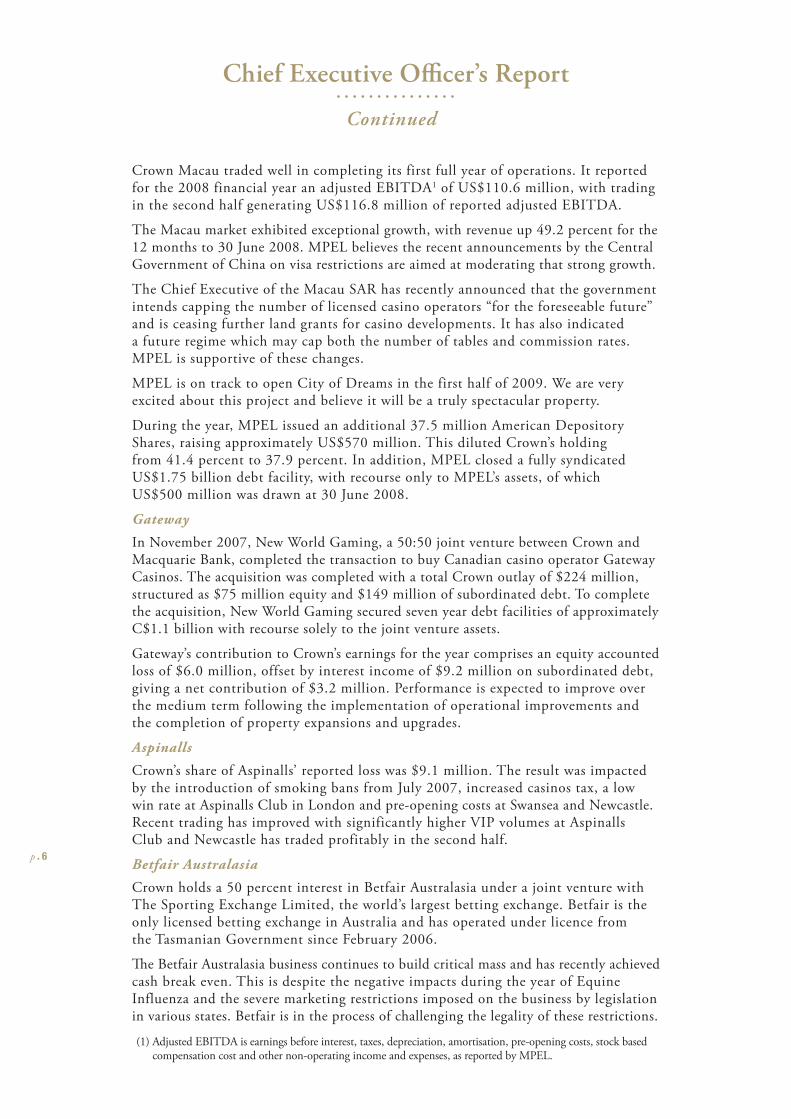
Crown Melbourne has been a proven earnings generator over the last decade and in the four years since its acquisition, EBITDA at Burswood has more than doubled (see Figures 1 and 2).
Crown is committed to maintaining the leading positions of these Australian operations and has a comprehensive capital expenditure program continuing over the next three years to accelerate the growth of both properties.
Construction of a third hotel at Crown Melbourne is well underway and the upgrade of Crown Towers in Melbourne has commenced. Refurbishments of the main casino floors at both Crown Melbourne and Burswood are progressing steadily.
United States casino acquisition
In December 2007, Crown agreed to acquire Cannery Casino Resorts in the United States (US) for US$1.75 billion on a cash and debt-free basis, subject to regulatory approval. Cannery operates in the “locals” gaming markets of Pittsburgh and Las Vegas, with a portfolio comprising the Meadows (temporary facility) in Pittsburgh, Cannery North, Rampart Casino and Eastside Cannery in Las Vegas. In April 2009, the Meadows permanent facility is due to open in Pittsburgh, in what is proving to be a very strong market.
The licensing process in Nevada and Pennsylvania is progressing well and we are hopeful of settling the Cannery acquisition in the coming months. It is expected to be EPS and cash flow positive in the first full year of ownership, with an EBITDA contribution of approximately US$200 million expected in 2009/10.
Joint venture businesses
Melco Crown Entertainment Limited
Melco Crown Entertainment Limited (MPEL) has shown significant improvement during the year. Crown’s share of MPEL’s financial results for the period was a net loss of $5.4 million which was a significant improvement from a loss of $47.0 million reported in 2007.
0
25
50
75
100
125
150
175
200
225
250
0807060504030201009998
NORM
ALIS
ED E
BITD
A $
M
NORM
ALIS
ED R
EVEN
UE $
M
FIGURE 2
BURSWOOD 10 YEAR NORMALISED REVENUE AND EBITDA PERFORMANCE
Normalised Revenue Normalised EBITDAbefore Crown Ownership
Normalised EBITDA sincechange in Ownership
0
70
140
210
280
350
420
490
560
630
700
0
50
100
150
200
250
300
350
400
450
500
0807060504030201009998
NORM
ALIS
ED E
BITD
A $
M
NORM
ALIS
ED R
EVEN
UE $
M
FIGURE 1
CROWN MELBOURNE 10 YEAR NORMALISED REVENUE AND EBITDA PERFORMANCE
Normalised Revenue
Smoking Bans Introduced
Normalised EBITDAbefore Crown Ownership
Normalised EBITDA sincechange in Ownership
0
150
300
450
600
750
900
1050
1200
1350
1500
p . 5
CROWN LIMITED ANNUAL REPORT 2008
Chief Executive Offi cer’s Report
Continued
Crown Macau traded well in completing its first full year of operations. It reported for the 2008 financial year an adjusted EBITDA1 of US$110.6 million, with trading in the second half generating US$116.8 million of reported adjusted EBITDA.
The Macau market exhibited exceptional growth, with revenue up 49.2 percent for the 12 months to 30 June 2008. MPEL believes the recent announcements by the Central Government of China on visa restrictions are aimed at moderating that strong growth.
The Chief Executive of the Macau SAR has recently announced that the government intends capping the number of licensed casino operators “for the foreseeable future” and is ceasing further land grants for casino developments. It has also indicated a future regime which may cap both the number of tables and commission rates. MPEL is supportive of these changes.
MPEL is on track to open City of Dreams in the first half of 2009. We are very excited about this project and believe it will be a truly spectacular property.
During the year, MPEL issued an additional 37.5 million American Depository Shares, raising approximately US$570 million. This diluted Crown’s holding from 41.4 percent to 37.9 percent. In addition, MPEL closed a fully syndicated US$1.75 billion debt facility, with recourse only to MPEL’s assets, of which US$500 million was drawn at 30 June 2008.
Gateway
In November 2007, New World Gaming, a 50:50 joint venture between Crown and Macquarie Bank, completed the transaction to buy Canadian casino operator Gateway Casinos. The acquisition was completed with a total Crown outlay of $224 million, structured as $75 million equity and $149 million of subordinated debt. To complete the acquisition, New World Gaming secured seven year debt facilities of approximately C$1.1 billion with recourse solely to the joint venture assets.
Gateway’s contribution to Crown’s earnings for the year comprises an equity accounted loss of $6.0 million, offset by interest income of $9.2 million on subordinated debt, giving a net contribution of $3.2 million. Performance is expected to improve over the medium term following the implementation of operational improvements and the completion of property expansions and upgrades.
Aspinalls
Crown’s share of Aspinalls’ reported loss was $9.1 million. The result was impacted by the introduction of smoking bans from July 2007, increased casinos tax, a low win rate at Aspinalls Club in London and pre-opening costs at Swansea and Newcastle. Recent trading has improved with significantly higher VIP volumes at Aspinalls Club and Newcastle has traded profitably in the second half.
Betfair Australasia
Crown holds a 50 percent interest in Betfair Australasia under a joint venture with The Sporting Exchange Limited, the world’s largest betting exchange. Betfair is the only licensed betting exchange in Australia and has operated under licence from the Tasmanian Government since February 2006.
Th e Betfair Australasia business continues to build critical mass and has recently achieved cash break even. This is despite the negative impacts during the year of Equine Influenza and the severe marketing restrictions imposed on the business by legislation in various states. Betfair is in the process of challenging the legality of these restrictions.
(1) Adjusted EBITDA is earnings before interest, taxes, depreciation, amortisation, pre-opening costs, stock based compensation cost and other non-operating income and expenses, as reported by MPEL.
p . 6
Chief Executive Offi cer’s Report
Continued
Other US investments
Crown holds a 19.6 percent interest in Fontainebleau Resorts LLC, a United States venture that is developing a major new casino resort and entertainment complex in Las Vegas and redeveloping a hotel resort in Miami. In April 2008, Fontainebleau diluted its interest in Fontainebleau Miami through the sale of a 50 percent interest to Dubai-based Nakheel Hotels.
During the year, Crown purchased a 4.9 percent fully diluted stake in Station Casinos and a 2.5 percent stake in Harrah’s Entertainment Inc.
Crown has completed a review of the carrying value of each of the above US casino investments (categorised under Australian Accounting Standards as “Available for Sale Financial Assets”). Th is review has seen the book value of these assets written down to $462 million, with $181 million expensed and $77 million taken to foreign exchange reserves. Crown remains comfortable with the long-term prospects of each of these investments.
Crown has written off its $45 million investment in LVTI, a joint venture company in which Crown held a 37.5 percent interest, following LVTI’s decision not to exercise its option to acquire a 27 acre site in Las Vegas.
Debt refinancing
In August 2008, Crown announced it had raised $1.01 billion in new debt facilities. These new facilities have been used to partly repay Crown’s existing $2.15 billion Syndicated Loan Facility which is due to mature in August 2010.
Crown has commenced a program to fix interest rate exposure for more than 75 percent of its prospective net debt (post–Cannery settlement). Currently approximately $1 billion of debt denominated in US dollars has been fixed for between five and 12 years at a cost of approximately 5.9 percent per annum.
Outlook
Crown management’s focus over the coming twelve months will be on consolidating the performance of recent international acquisitions, delivering forecast earnings and managing the major capital expenditure programs at its existing Australian properties.
I would like to sincerely thank the Board, management and staff for their dedicated contribution in 2008.
R O W E N C R A I G I EC H I E F E X E C U T I V E O F F I C E R
More information
More information regarding calculations of normalised results is included in Crown’s 2008 Full Year Results Announcement, which is available on Crown’s website at: www.crownlimited.com under the heading Investors – Presentations and Briefings.
p . 7
CROWN LIMITED ANNUAL REPORT 2008
Chief Executive Offi cer’s Report
Continued
Crown Melbourne
Overview
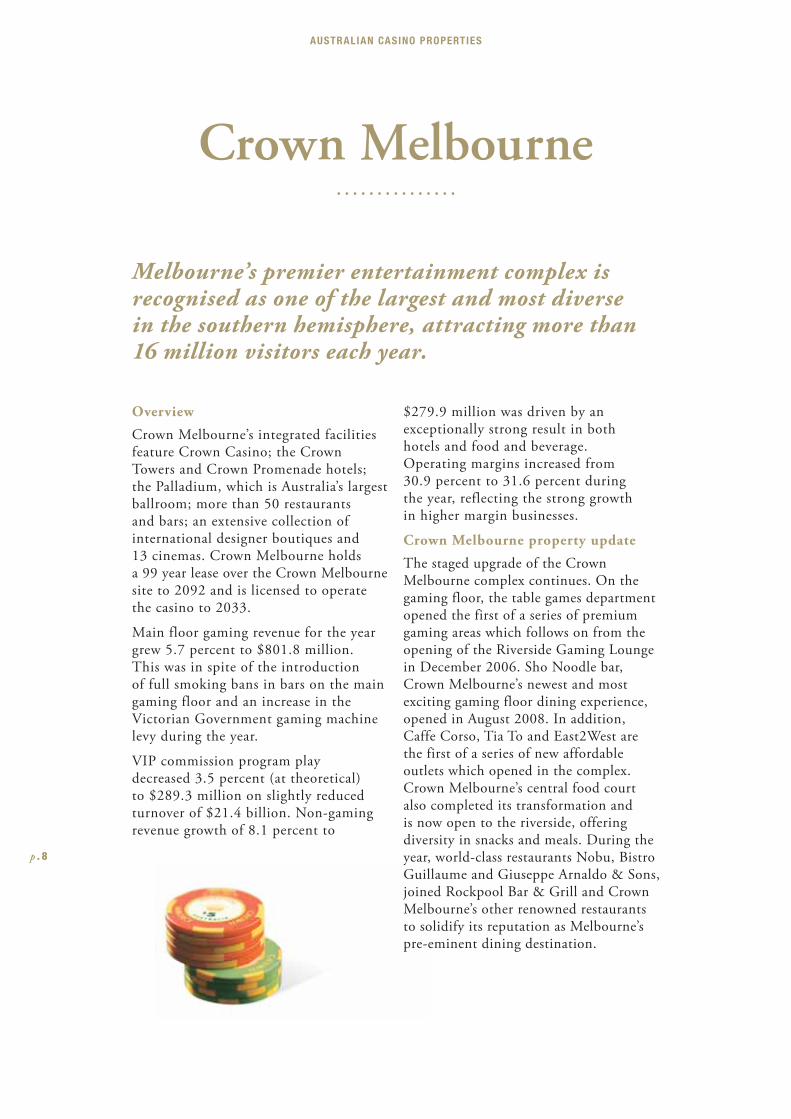
Crown Melbourne’s integrated facilities feature Crown Casino; the Crown Towers and Crown Promenade hotels; the Palladium, which is Australia’s largest ballroom; more than 50 restaurants and bars; an extensive collection of international designer boutiques and 13 cinemas. Crown Melbourne holds a 99 year lease over the Crown Melbourne site to 2092 and is licensed to operate the casino to 2033.
Main floor gaming revenue for the year grew 5.7 percent to $801.8 million. This was in spite of the introduction of full smoking bans in bars on the main gaming floor and an increase in the Victorian Government gaming machine levy during the year.
VIP commission program play decreased 3.5 percent (at theoretical) to $289.3 million on slightly reduced turnover of $21.4 billion. Non-gaming revenue growth of 8.1 percent to
$279.9 million was driven by an exceptionally strong result in both hotels and food and beverage. Operating margins increased from 30.9 percent to 31.6 percent during the year, reflecting the strong growth in higher margin businesses.
Crown Melbourne property update
The staged upgrade of the Crown Melbourne complex continues. On the gaming floor, the table games department opened the first of a series of premium gaming areas which follows on from the opening of the Riverside Gaming Lounge in December 2006. Sho Noodle bar, Crown Melbourne’s newest and most exciting gaming floor dining experience, opened in August 2008. In addition, Caffe Corso, Tia To and East2West are the first of a series of new affordable outlets which opened in the complex. Crown Melbourne’s central food court also completed its transformation and is now open to the riverside, offering diversity in snacks and meals. During the year, world-class restaurants Nobu, Bistro Guillaume and Giuseppe Arnaldo & Sons, joined Rockpool Bar & Grill and Crown Melbourne’s other renowned restaurants to solidify its reputation as Melbourne’s pre-eminent dining destination.
Melbourne’s premier entertainment complex is recognised as one of the largest and most diverse in the southern hemisphere, attracting more than 16 million visitors each year.
p . 8p . 8
AUSTRALIAN CASINO PROPERTIES

View of Crown Melbourne looking south from the CBD with an artist’s impression of the third hotel (currently under construction)
CROWN LIMITED ANNUAL REPORT 2008CROWN LIMITED ANNUAL REPORT 2008
Crown Melbourne Continued
The upgrade of Crown Towers has commenced and construction of a new five star 658-room hotel is advancing steadily, which will bring the total rooms available at the complex to more than 1,600.
These property upgrades will underpin future revenue growth at Crown Melbourne.
Local gaming and Crown Club
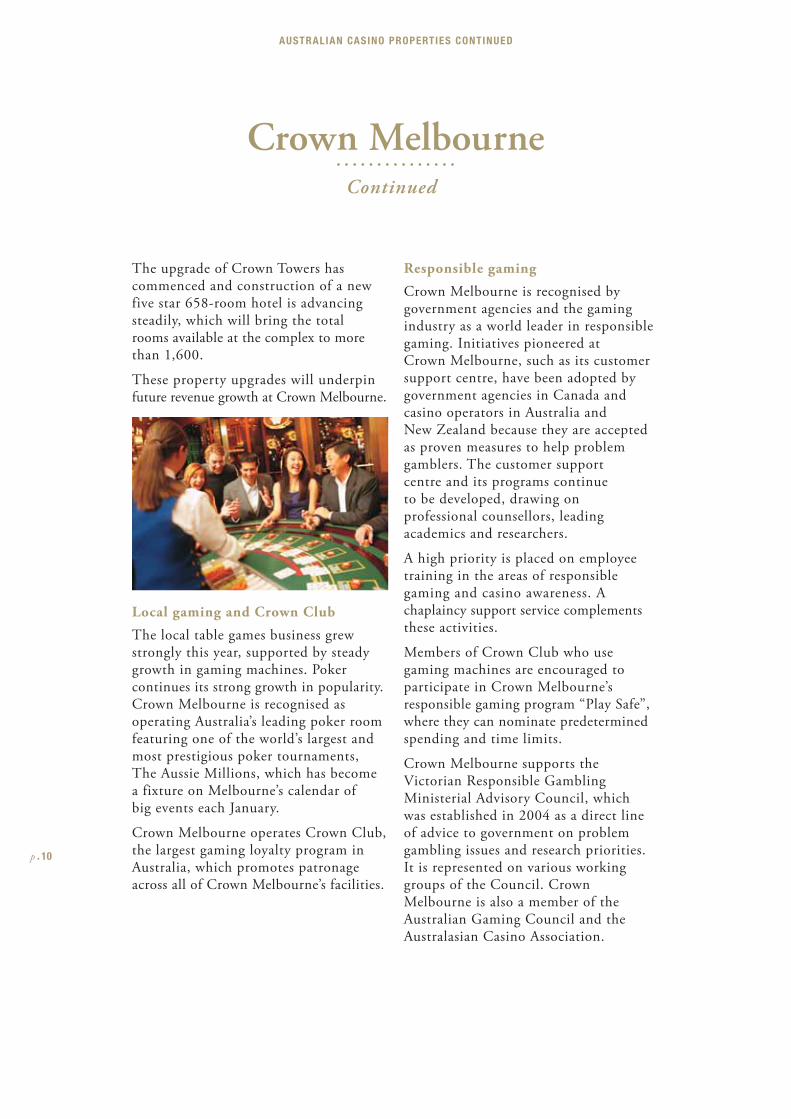
The local table games business grew strongly this year, supported by steady growth in gaming machines. Poker continues its strong growth in popularity. Crown Melbourne is recognised as operating Australia’s leading poker room featuring one of the world’s largest and most prestigious poker tournaments, The Aussie Millions, which has become a fixture on Melbourne’s calendar of big events each January.
Crown Melbourne operates Crown Club, the largest gaming loyalty program in Australia, which promotes patronage across all of Crown Melbourne’s facilities.
Responsible gaming
Crown Melbourne is recognised by government agencies and the gaming industry as a world leader in responsible gaming. Initiatives pioneered at Crown Melbourne, such as its customer support centre, have been adopted by government agencies in Canada and casino operators in Australia and New Zealand because they are accepted as proven measures to help problem gamblers. The customer support centre and its programs continue to be developed, drawing on professional counsellors, leading academics and researchers.
A high priority is placed on employee training in the areas of responsible gaming and casino awareness. A chaplaincy support service complements these activities.
Members of Crown Club who use gaming machines are encouraged to participate in Crown Melbourne’s responsible gaming program “Play Safe”, where they can nominate predetermined spending and time limits.
Crown Melbourne supports the Victorian Responsible Gambling Ministerial Advisory Council, which was established in 2004 as a direct line of advice to government on problem gambling issues and research priorities. It is represented on various working groups of the Council. Crown Melbourne is also a member of the Australian Gaming Council and the Australasian Casino Association.
p . 10
AUSTRALIAN CASINO PROPERTIES CONTINUED
VIP commission program play
Crown Melbourne has one of the largest single-site VIP gaming operations in the world. The complex is strongly marketed throughout Asia, a feature of which is the promotion of Melbourne and Victoria as attractive tourist destinations.
Along with major events that Melbourne offers, Crown Melbourne hosts its own attractions to stimulate international VIP visitation. This covers activities like concerts, golf and baccarat tournaments, karaoke, gala balls and dinners with world renowned chefs, lucky draws and other competitions and promotions.
Sales resources have been expanded in Greater China, including Hong Kong and Macau to capitalise on emerging opportunities. Select customers have access to Crown Towers Villas, the Crown corporate jet services, the private golf course Capital, as well as Crown Towers luxurious spa, international standard shopping and world class restaurants.
Hotels and conferences
Crown Towers maintained its leading position in the luxury five-star hotel segment and Crown Promenade has cemented its position as Melbourne’s leading four-and-a-half star hotel. Hotel occupancy at Crown Towers was 90 percent with an average room rate of $294 and at the Crown Promenade 94 percent and $203 respectively.
At Crown Towers, the corporate and conferencing segments contributed the most significant increases, and average room rates also grew across all market segments. This year, Crown Towers was
awarded Top Hotel – Australia / Pacific in the U.S. Conde Nast Traveller Readers’ Choice Awards and the Best Business Hotel in Australia, as judged by readers of Business Asia Magazine.
At Crown Promenade, all market segments recorded increases in room night activity, with the property’s average room rate achieving strong growth. The Promenade Conference Centre performed strongly, supported by the combined 900 room inventory across the two hotels. Crown Promenade won both the Victorian and the Australian 2007 Tourism Awards for the Best Deluxe Accommodation.
Crown Melbourne’s third hotel is on track for completion mid-2010. It is expected to leverage its prime position next to the Melbourne Convention and Exhibition Centre.
Crown Melbourne Continued
p . 11
CROWN LIMITED ANNUAL REPORT 2008
AUSTRALIAN CASINO PROPERTIES CONTINUED
Restaurants and bars
Food and beverage operations at Crown Melbourne achieved outstanding growth, particularly from bars and banqueting. At the 2008 Victorian Restaurant and Catering Awards for Excellence, Crown Melbourne’s Food and Beverage team was inducted into the Hall of Fame following its third consecutive award for Excellence in Professional Development.
Since year-end, four of Crown Melbourne’s high performing restaurants were awarded the 2009 Age Good Food Guide’s coveted chef ’s hats: Bistro Guillame, Rockpool Bar & Grill, the brasserie by Philippe Mouchel and Giuseppe Arnaldo & Sons. In addition, Bistro Guillaume was named Best New Restaurant and Giuseppe Arnaldo & Sons won Best New Interior Design.
Crown Melbourne’s more established restaurants continue to demonstrate the quality and breadth of our offering. Koko, Silks, Number 8 and the brasserie by Philippe Mouchel were all recipients of esteemed industry awards during the year.
Crown Melbourne’s new entertainment venue, Fusion, opened in November 2007 and the well established Odeon is currently undergoing refurbishment and will reopen in November 2008.
Entertainment and events
Crown Melbourne presented a diverse range of shows, events, festivals, attractions and exhibitions. The Palladium ballroom hosted a significant number of high profile charity events including the ever popular ‘Million Dollar Lunch’ and ‘Starry Starry Night’ with each event attended by over 1,000 guests. It was also venue of choice for the TV Week Logie Awards, the AFL Brownlow Medal, the Cricket Australia Allan Border Medal, the Formula 1 Australian Grand Prix Ball and a variety of Victoria Racing Club Spring Carnival events including the Call of the Card and the Oaks Club Ladies Lunch.
New for the 2007 Melbourne Cup Carnival was Crown Melbourne’s “Live Site” at Southbank, which attracted an estimated 80,000 people over the eight days and featured all the racing action on a super screen, live entertainment, celebrities, fashion parades, roving performers, press conferences and giveaways.
Other events included the Christmas Spectacular in the Atrium, Chinese New Year festivities on the riverside, as well as the ‘My Last Supper’ photography exhibition and associated dining hosted by leading Crown Melbourne chefs as part of the Melbourne Food and Wine Festival.
For the second consecutive year, Crown Melbourne joined the State Government of Victoria and the City of Melbourne as a Venue Partner in the 2008 Melbourne Jazz Festival. Celebrating its 10th anniversary, the festival was an action-packed six day program, featuring legendary jazz performers playing in some of Melbourne’s finest venues including The Palms at Crown.
Our people
Crown Melbourne is Victoria’s largest single-site employer. It is focused on attracting and retaining staff, building organisational capability and providing a safe and rewarding workplace for all employees. A key initiative this year was the launch of the Leadership Development Program to develop supervisory and leadership skills for employees in customer facing roles. Crown Melbourne’s commitment to the training and development of staff was recognised by the 2008 Minister’s Award for Excellence for Employers of Australian Apprentices. Crown Melbourne’s Chef Apprentices were also recognised in the prestigious Capaldi Apprentice Challenge, a competition which determines the best apprentices in Victoria.
Crown Melbourne Continued
p . 12
AUSTRALIAN CASINO PROPERTIES CONTINUED
Burswood
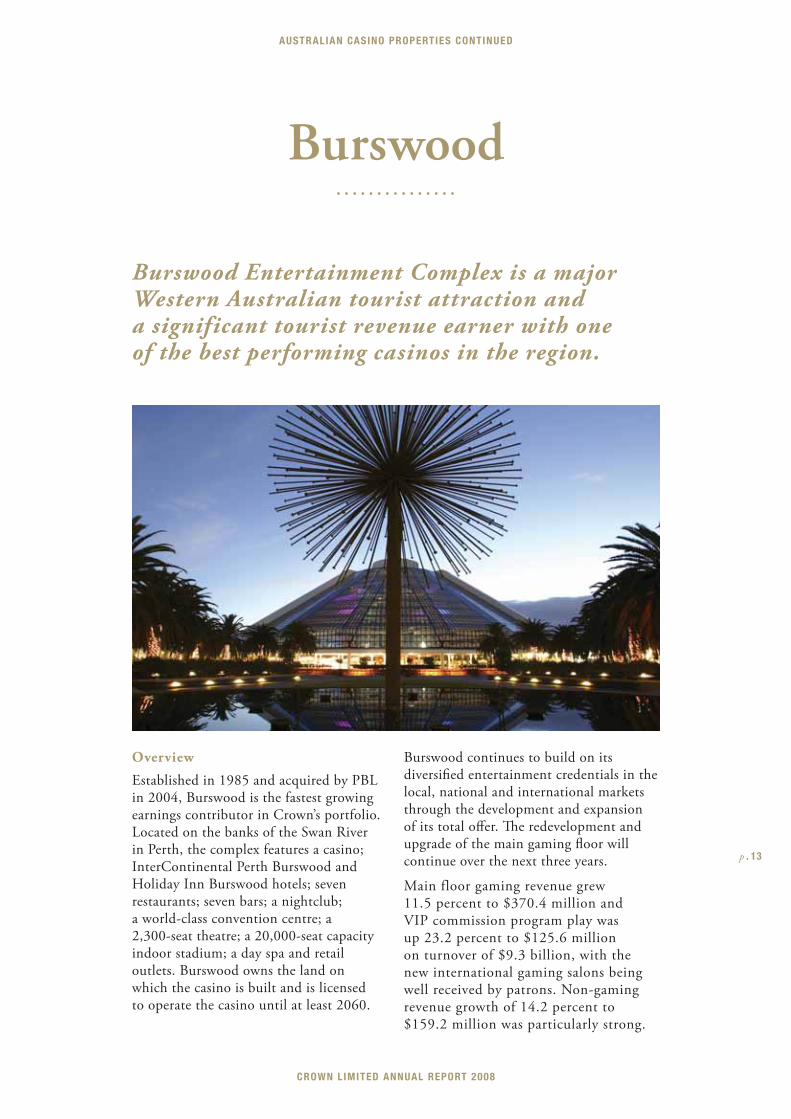
Burswood Entertainment Complex is a major Western Australian tourist attraction and a significant tourist revenue earner with one of the best performing casinos in the region.
Overview
Established in 1985 and acquired by PBL in 2004, Burswood is the fastest growing earnings contributor in Crown’s portfolio. Located on the banks of the Swan River in Perth, the complex features a casino; InterContinental Perth Burswood and Holiday Inn Burswood hotels; seven restaurants; seven bars; a nightclub; a world-class convention centre; a 2,300-seat theatre; a 20,000-seat capacity indoor stadium; a day spa and retail outlets. Burswood owns the land on which the casino is built and is licensed to operate the casino until at least 2060.
Burswood continues to build on its diversifi ed entertainment credentials in the local, national and international markets through the development and expansion of its total off er. Th e redevelopment and upgrade of the main gaming fl oor will continue over the next three years.
Main floor gaming revenue grew 11.5 percent to $370.4 million and VIP commission program play was up 23.2 percent to $125.6 million on turnover of $9.3 billion, with the new international gaming salons being well received by patrons. Non-gaming revenue growth of 14.2 percent to $159.2 million was particularly strong.
p . 13
CROWN LIMITED ANNUAL REPORT 2008
AUSTRALIAN CASINO PROPERTIES CONTINUED
Burswood Continued
Operating margins at Burswood decreased slightly from 30.2 percent to 29.8 percent, reflecting the tight labour market in Perth which has increased wage and overtime costs, higher marketing costs and an increase in lower margin VIP commission program business.
Local gaming and Club Burswood
Local gaming earnings continued to grow, with solid contributions from both table games and electronic games. Underpinning performance was the opening of the Riviera Room in July 2007 and the continuing refurbishment of the main gaming floor.
Electronic gaming continued its new product growth, with approval for 10 new games in 2008. The table games department expanded the Touchbet links, introduced Texas Hold’Em Progressive and installed a new Rapid Baccarat product in the second half, which has shown steady results. Membership of Burswood’s loyalty program, Club Burswood, grew strongly during the year. The introduction of improved offers and promotions proved successful.
Responsible gaming
Burswood is committed to providing responsible gaming services through the promotion of effective and responsible gambling programs, information, assistance and services. It has continued to implement initiatives to reinforce this commitment following the appointments of a community relations manager and an experienced adviser.
A new dedicated web site, gambleresponsibly.com.au, was developed and launched. Participation
in the national Responsible Gambling Awareness Week, improvements to the self-exclusion program and gaming personnel training were successful in promoting awareness. Work is underway for a new Responsible Service of Gambling Information Centre for patrons of Burswood.
VIP commission program play
Solid revenue growth was achieved in international gaming through a stronger sales and marketing campaign, together with the introduction of two new $4 million Infinity Suites at InterContinental Perth Burswood to high-end customers from Asia.
A comprehensive international event schedule included a Passport to Golf promotion featuring seven golf tournaments, the annual Baccarat Tournament, and elaborate Chinese New Year festivities.
Hotel properties
InterContinental Perth Burswood maintained its position as the leading luxury hotel in Perth. The continued integration of Holiday Inn Burswood as the mid-scale accommodation offer contributed also to increased leisure and corporate spend. The extensive global branding and guest loyalty program from both hotels attracted guests to the complex.p . 14
AUSTRALIAN CASINO PROPERTIES CONTINUED
Burswood Continued
Hotel occupancy at InterContinental Perth Burswood was 78 percent with an average room rate of $223 and at the Holiday Inn it was 89 percent and $173 respectively. These solid levels across both properties were assisted by growth in city-wide market demand driven by stronger than expected corporate travel and an increase in leisure arrivals by air.
Restaurants and bars
Burswood’s restaurants and bars portfolio continued to deliver exceptional growth. A continued focus on the delivery of contemporary, innovative and diversified product offerings underpinned the result, highlighted by the opening of MINQ Bar and Lounge in August 2007 and Carbon Sports Bar in December 2007.
Effective advertising, additional traffic generated from the main gaming floor and a comprehensive marketing and event programs in all key outlets have contributed to the strong performance. Established restaurants Yú, Victoria Station, Atrium and (A)LURE were all nominated for multiple AHA and industry awards throughout the year.
A key initiative during the year was the introduction of dedicated Responsible Service of Alcohol Officers responsible for patrolling the complex during peak operating hours.
Entertainment and events
Major events presented at Burswood included the opening and closing parties for Miss Saigon, the launch of the Perth Fashion Festival held in Sirocco Restaurant, the (A)LURE Lawn party at Ascot’s Spring Racing Carnival, the ‘Zestinations’ series in the Atrium, a two-day Hawker’s Bazaar and a premium dining series shared across the portfolio. Burswood also hosted various high profile charity events and record cover numbers were achieved during the festive season.
Burswood Dome and Burswood Theatre performed solidly, driven by the strong West Australian economy and high Australian dollar appealing to promoters. Contributing to the success was Burswood Dome’s unique position as the only large capacity concert venue with weather protection in Perth, underpinned by comprehensive technical and marketing support. The accomplishments of the entertainment team were recognised by its second consecutive AHA Award for Excellence in Live Entertainment.
Conventions and events saw strong growth continue. The Astral, Burswood’s refurbished ballroom, further added to performance credentials in this financial year recording increased revenues significantly.
p . 15
CROWN LIMITED ANNUAL REPORT 2008
AUSTRALIAN CASINO PROPERTIES CONTINUED

Cannery
(pending – subject to regulatory approval)
Cannery Casino Resorts operates casinos in Pennsylvania and Nevada in the United States, catering to “locals” customers.
Overview
Crown agreed in December 2007 to acquire 100 percent of Cannery Casino Resorts on a cash and debt-free basis for US$1,752 million plus acquisition costs. This transaction is subject to regulatory approval.
Cannery is a well established US “locals” casino operator, operating the Meadows, Pittsburgh (temporary facility), Cannery North, Rampart (leased property) and the recently opened Eastside Cannery in Las Vegas. A permanent facility for the Meadows is due to open in April 2009.
Current trading performance
Crown has not yet settled the acquisition and has therefore not reported earnings from Cannery. Th e existing Cannery management have provided recent trading data.
Th e Meadows has continued to improve its operating performance as the year has progressed, with revenue in July 2008 up 18 percent on last July (the first available year-on-year monthly comparison). Cannery North and Rampart have performed comparatively well in their markets. Total revenue in the seven months from January to July 2008 is less than
one percent below the previous corresponding seven month period, despite the overall Las Vegas “locals” market being down approximately 5 percent in the six months ended 30 June 2008.
Outlook
On completion of the Meadows development, Cannery will operate approximately 9,000 slot machines and 73 table games, together with 514 hotel rooms. The market in Pennsylvania remains an immature one and is expected to continue to grow strongly in the coming year.
Eastside Cannery is the first new property in 10 years on the Boulder Strip, Las Vegas and we expect it to perform well in that market.
Crown is hopeful of receiving approvals from the Nevada and Pennsylvania Gaming Control Boards in the coming months and finalising this acquisition shortly thereafter. It is expected that the Cannery acquisition will be EPS and cash flow positive in the full first year of ownership. Cannery EBITDA in 2009/10 is expected to be approximately US$200 million.
p . 16
US CASINO ACQUISITION
Melco Crown Entertainment
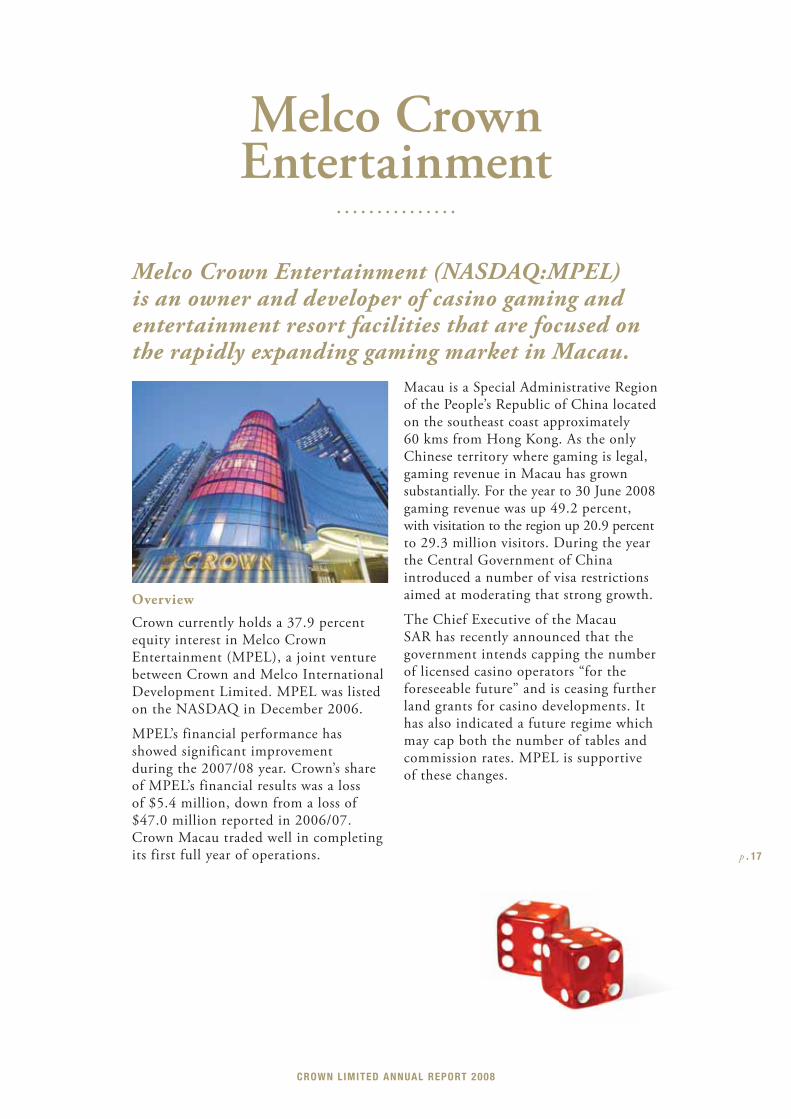
Melco Crown Entertainment (NASDAQ:MPEL) is an owner and developer of casino gaming and entertainment resort facilities that are focused on the rapidly expanding gaming market in Macau.
Overview
Crown currently holds a 37.9 percent equity interest in Melco Crown Entertainment (MPEL), a joint venture between Crown and Melco International Development Limited. MPEL was listed on the NASDAQ in December 2006.
MPEL’s financial performance has showed significant improvement during the 2007/08 year. Crown’s share of MPEL’s financial results was a loss of $5.4 million, down from a loss of $47.0 million reported in 2006/07. Crown Macau traded well in completing its first full year of operations.
Macau is a Special Administrative Region of the People’s Republic of China located on the southeast coast approximately 60 kms from Hong Kong. As the only Chinese territory where gaming is legal, gaming revenue in Macau has grown substantially. For the year to 30 June 2008 gaming revenue was up 49.2 percent, with visitation to the region up 20.9 percent to 29.3 million visitors. During the year the Central Government of China introduced a number of visa restrictions aimed at moderating that strong growth.
The Chief Executive of the Macau SAR has recently announced that the government intends capping the number of licensed casino operators “for the foreseeable future” and is ceasing further land grants for casino developments. It has also indicated a future regime which may cap both the number of tables and commission rates. MPEL is supportive of these changes.
p . 17
CROWN LIMITED ANNUAL REPORT 2008
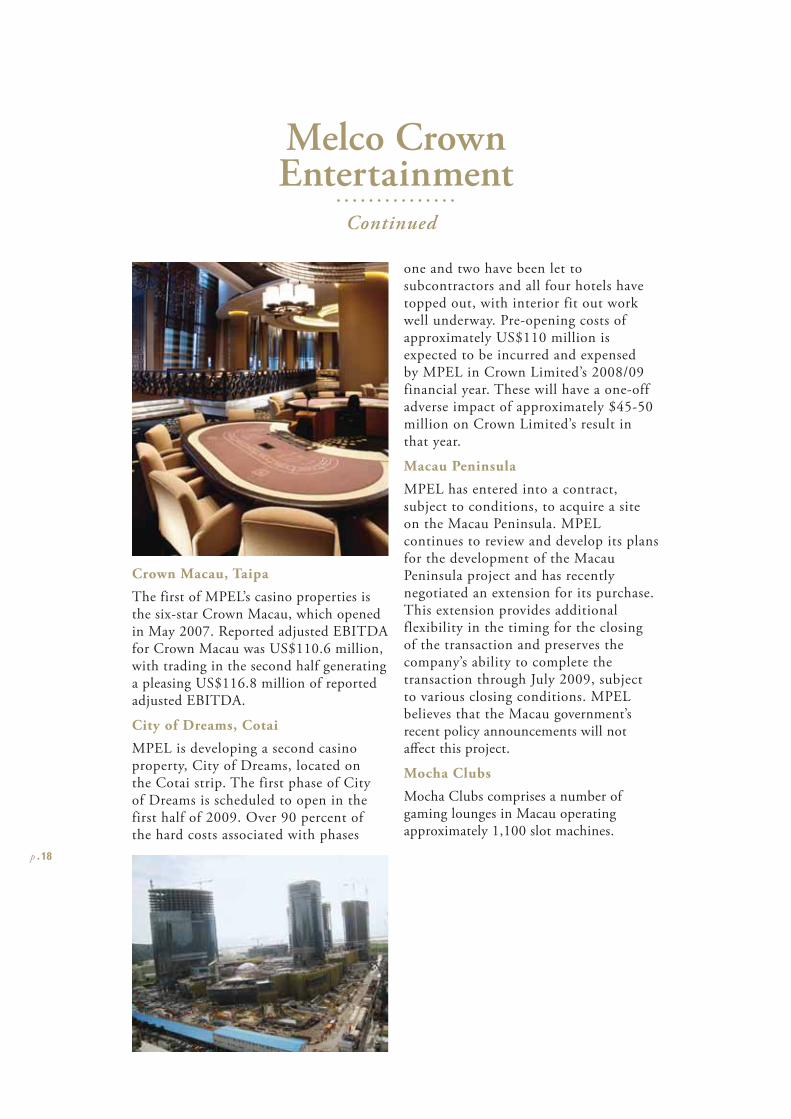
Crown Macau, Taipa
The first of MPEL’s casino properties is the six-star Crown Macau, which opened in May 2007. Reported adjusted EBITDA for Crown Macau was US$110.6 million, with trading in the second half generating a pleasing US$116.8 million of reported adjusted EBITDA.
City of Dreams, Cotai
MPEL is developing a second casino property, City of Dreams, located on the Cotai strip. The first phase of City of Dreams is scheduled to open in the first half of 2009. Over 90 percent of the hard costs associated with phases
one and two have been let to subcontractors and all four hotels have topped out, with interior fit out work well underway. Pre-opening costs of approximately US$110 million is expected to be incurred and expensed by MPEL in Crown Limited’s 2008/09 financial year. These will have a one-off adverse impact of approximately $45-50 million on Crown Limited’s result in that year.
Macau Peninsula
MPEL has entered into a contract, subject to conditions, to acquire a site on the Macau Peninsula. MPEL continues to review and develop its plans for the development of the Macau Peninsula project and has recently negotiated an extension for its purchase. This extension provides additional flexibility in the timing for the closing of the transaction and preserves the company’s ability to complete the transaction through July 2009, subject to various closing conditions. MPEL believes that the Macau government’s recent policy announcements will not aff ect this project.
Mocha Clubs
Mocha Clubs comprises a number of gaming lounges in Macau operating approximately 1,100 slot machines.
p . 18
Melco Crown Entertainment
Continued
Gateway
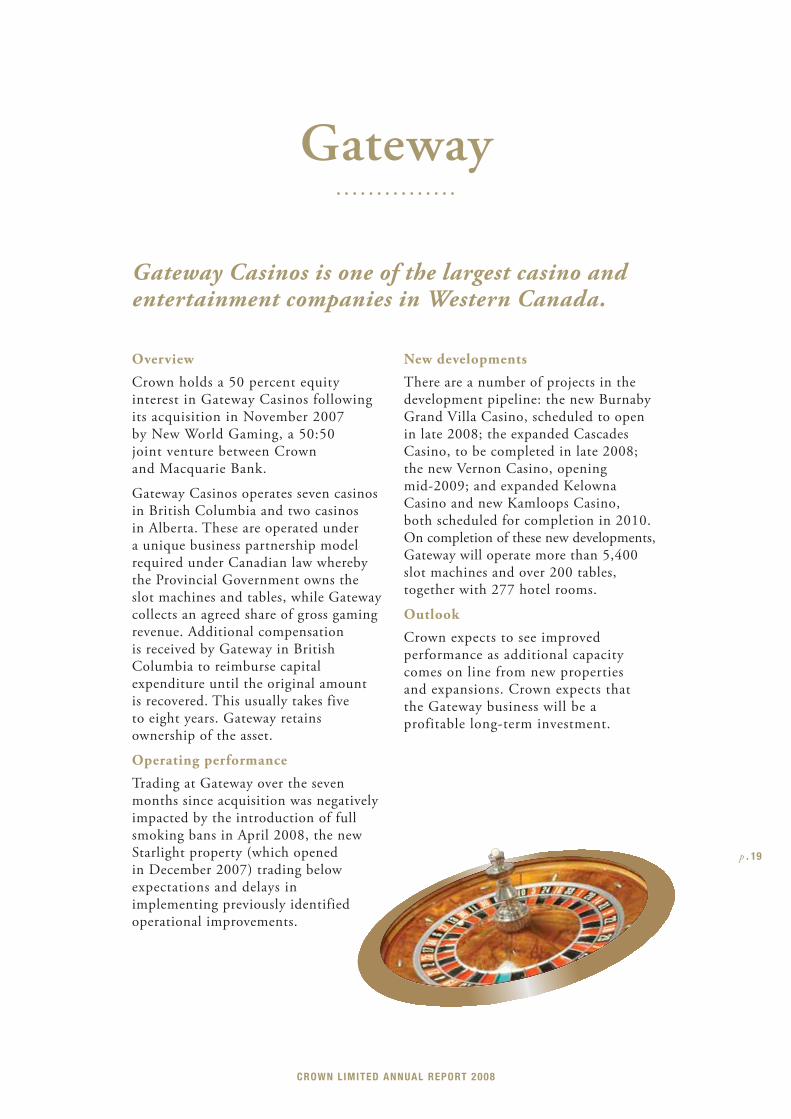
Gateway Casinos is one of the largest casino and entertainment companies in Western Canada.
Overview
Crown holds a 50 percent equity interest in Gateway Casinos following its acquisition in November 2007 by New World Gaming, a 50:50 joint venture between Crown and Macquarie Bank.
Gateway Casinos operates seven casinos in British Columbia and two casinos in Alberta. These are operated under a unique business partnership model required under Canadian law whereby the Provincial Government owns the slot machines and tables, while Gateway collects an agreed share of gross gaming revenue. Additional compensation is received by Gateway in British Columbia to reimburse capital expenditure until the original amount is recovered. This usually takes five to eight years. Gateway retains ownership of the asset.
Operating performance
Trading at Gateway over the seven months since acquisition was negatively impacted by the introduction of full smoking bans in April 2008, the new Starlight property (which opened in December 2007) trading below expectations and delays in implementing previously identified operational improvements.
New developments
There are a number of projects in the development pipeline: the new Burnaby Grand Villa Casino, scheduled to open in late 2008; the expanded Cascades Casino, to be completed in late 2008; the new Vernon Casino, opening mid-2009; and expanded Kelowna Casino and new Kamloops Casino, both scheduled for completion in 2010. On completion of these new developments, Gateway will operate more than 5,400 slot machines and over 200 tables, together with 277 hotel rooms.
Outlook
Crown expects to see improved performance as additional capacity comes on line from new properties and expansions. Crown expects that the Gateway business will be a profitable long-term investment.
p . 19
CROWN LIMITED ANNUAL REPORT 2008
AspinallsCrown holds a 50 percent interest in Aspinalls
under a joint venture with the Aspinall Group,
Britain’s longest established gaming operator.
Aspinalls currently operates four casinos in
the United Kingdom: Aspinalls Club in
London’s Mayfair; and three regional casinos
in Newcastle, Swansea (opened in September
2007) and Northampton (opened in June
2008 under a joint venture with Kerzner UK).
Trading during the past year was impacted
by the introduction of smoking bans in
July 2007, an increase in the levels of casino
tax, a low win rate at Aspinalls Club and pre-
opening costs for Swansea and Northampton.
Recent trading has improved with
significantly higher VIP volumes at Aspinalls
Club and Newcastle has traded profitably in
the second half. Further revenue enhancing
strategies are being implemented in order
to improve performance.
Other US InvestmentsCrown holds a 19.6 percent equity interest in
Fontainebleau Resorts, which is constructing a
casino resort on the strip in Las Vegas, scheduled
to open in late 2009. Fontainebleau also owns
a 50 percent interest in a resort hotel complex in
Miami, following the sale of 50 percent to Dubai-
based Nakheel Hotels for US$375 million in
April 2008. Fontainebleau Miami is undergoing
a major renovation and will open in late 2008.
Crown purchased a 4.9 percent fully diluted
stake in Station Casinos, which pioneered the
“locals” gaming market in
Las Vegas and caters primarily to local workers
and residents. The Station Casinos franchise
includes eight major gaming and entertainment
complexes and fi ve smaller casinos.
Crown also purchased a 2.5 percent stake
in Harrah’s Entertainment Inc. Harrah’s is
the world’s largest provider of branded casino
entertainment, owning or managing casino
resorts on four continents. Th e company’s
properties operate primarily under the
Harrah’s, Caesars and Horseshoe brand names.
Crown holds a 50 percent interest in Betfair
Australasia under a joint venture with Th e
Sporting Exchange Limited, the world’s
largest betting exchange.
Betfair is the only licensed betting exchange in
Australia and has operated under licence from
the Tasmanian Government since February
2006. For the past 12 months, revenue grew
13 percent to $23.1 million despite some
signifi cant challenges. Th ese were the negative
impact of Equine Infl uenza on horse racing,
together with a ban on betting exchanges in
Western Australia which was unanimously
overturned by the High Court of Australia
in March 2008.
Betfair has subsequently reinstated its business
in Western Australia and has challenged
advertising restrictions in New South Wales
and Victoria.
Betfair is now experiencing strong underlying
growth, with registrations up 94 percent,
funded accounts up 62 percent and active
customers up 43 percent in June 2008.
Th e company also recently launched the
“Tote at Betfair” web interface and has
fi nalised agreements with all major sporting
and racing bodies in Australia. Betfair
employs 100 people in Hobart and Melbourne.
Betfair Australasia
p . 20
Community and the Environment
The communityCrown is proud to support the local communities in which it operates through financial and in-kind donations, participation and support of non-profit events, employee volunteer contributions and sponsorships.
Crown Melbourne
Crown Melbourne contributes to the Victorian community through its financial support of community organisations and charities including the Royal Children’s Hospital (including the RCH 1000 and the Neonatal Unit programs), the Heartwell Foundation, Make-A-Wish and KOALA Foundation (Kids Oncology and Leukaemia Action Group), Open Family Australia, Challenge, Kids Under Cover and the
Neuroscience Foundation. Crown Melbourne also assists hundreds of community-based associations, from schools and sporting clubs to fire brigades, police units and ethnic groups, by donating in-kind prizes, such as accommodation, for fundraising activities.
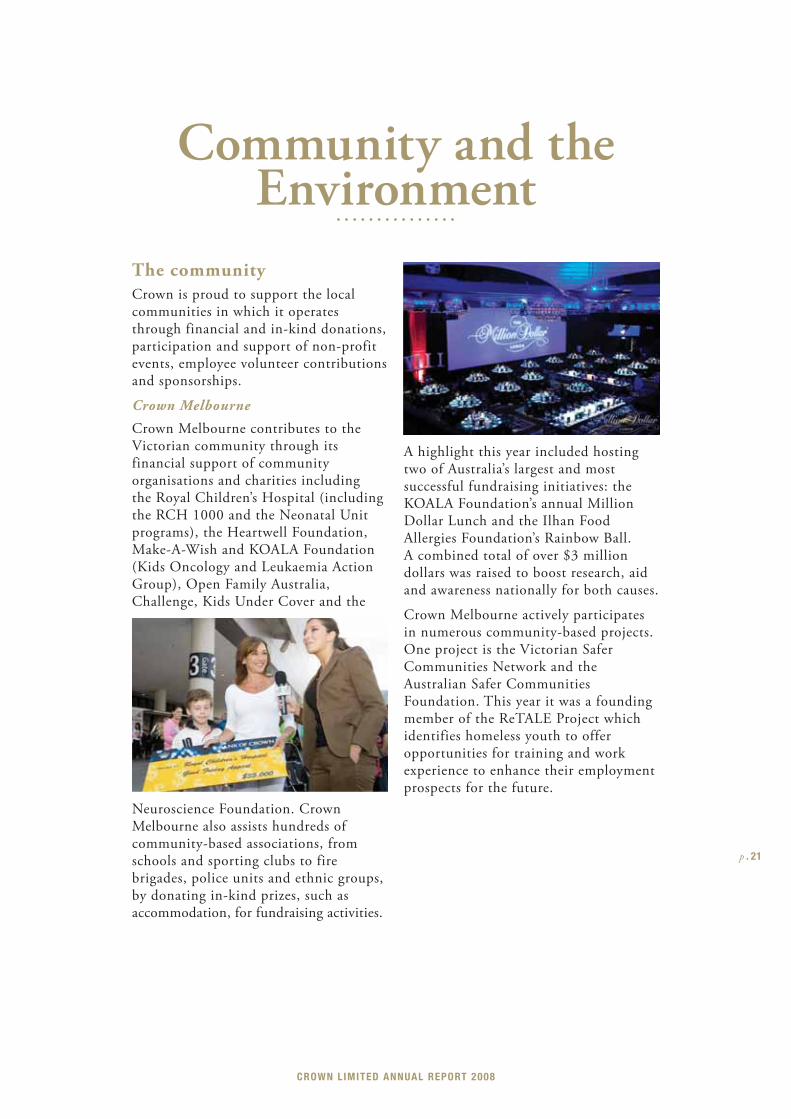
A highlight this year included hosting two of Australia’s largest and most successful fundraising initiatives: the KOALA Foundation’s annual Million Dollar Lunch and the Ilhan Food Allergies Foundation’s Rainbow Ball. A combined total of over $3 million dollars was raised to boost research, aid and awareness nationally for both causes.
Crown Melbourne actively participates in numerous community-based projects. One project is the Victorian Safer Communities Network and the Australian Safer Communities Foundation. This year it was a founding member of the ReTALE Project which identifies homeless youth to offer opportunities for training and work experience to enhance their employment prospects for the future.
p . 21
CROWN LIMITED ANNUAL REPORT 2008
Burswood
Burswood contributes to the Western Australian community under its community partnerships program, ‘A Brighter Future’. With 80 percent of front line staff between 18 and 30 years of age, Burswood’s current focus is on supporting this demographic, with the aim of making a sustainable difference to a group that is representative of the future.
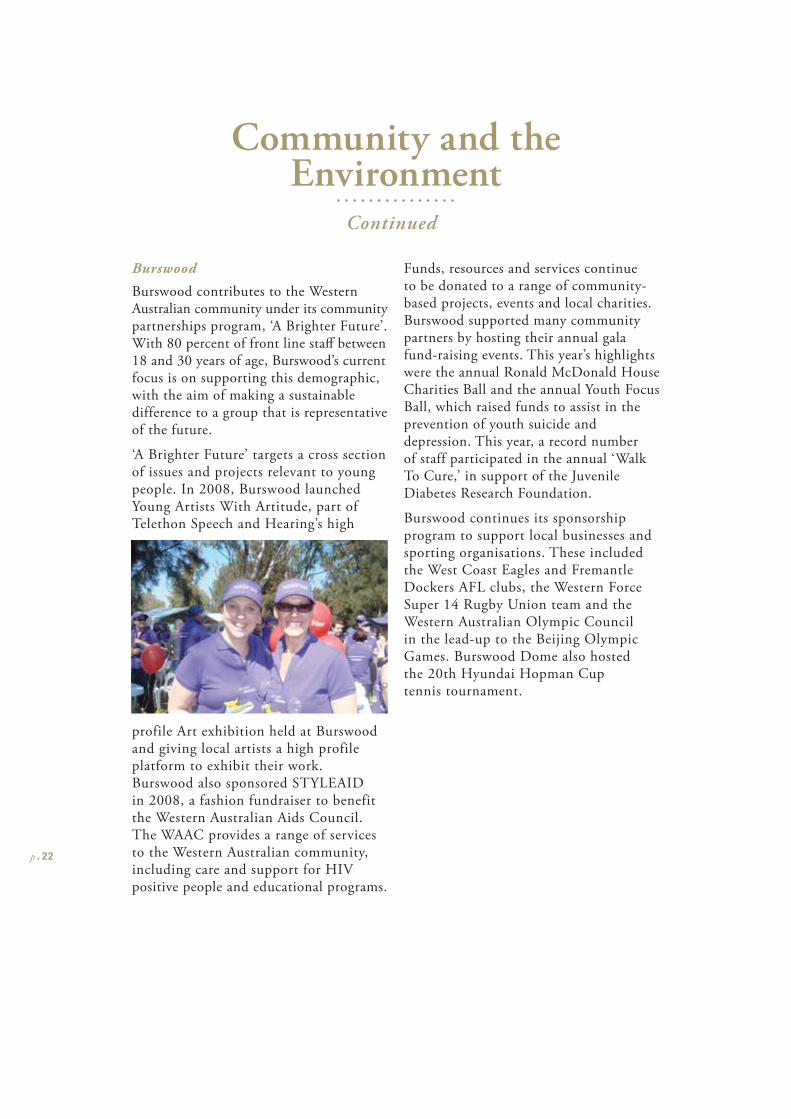
‘A Brighter Future’ targets a cross section of issues and projects relevant to young people. In 2008, Burswood launched Young Artists With Artitude, part of Telethon Speech and Hearing’s high
profile Art exhibition held at Burswood and giving local artists a high profile platform to exhibit their work. Burswood also sponsored STYLEAID in 2008, a fashion fundraiser to benefit the Western Australian Aids Council. The WAAC provides a range of services to the Western Australian community, including care and support for HIV positive people and educational programs.
Funds, resources and services continue to be donated to a range of community-based projects, events and local charities. Burswood supported many community partners by hosting their annual gala fund-raising events. This year’s highlights were the annual Ronald McDonald House Charities Ball and the annual Youth Focus Ball, which raised funds to assist in the prevention of youth suicide and depression. This year, a record number of staff participated in the annual ‘Walk To Cure,’ in support of the Juvenile Diabetes Research Foundation.
Burswood continues its sponsorship program to support local businesses and sporting organisations. These included the West Coast Eagles and Fremantle Dockers AFL clubs, the Western Force Super 14 Rugby Union team and the Western Australian Olympic Council in the lead-up to the Beijing Olympic Games. Burswood Dome also hosted the 20th Hyundai Hopman Cup tennis tournament.
p . 22
Community and the Environment
Continued
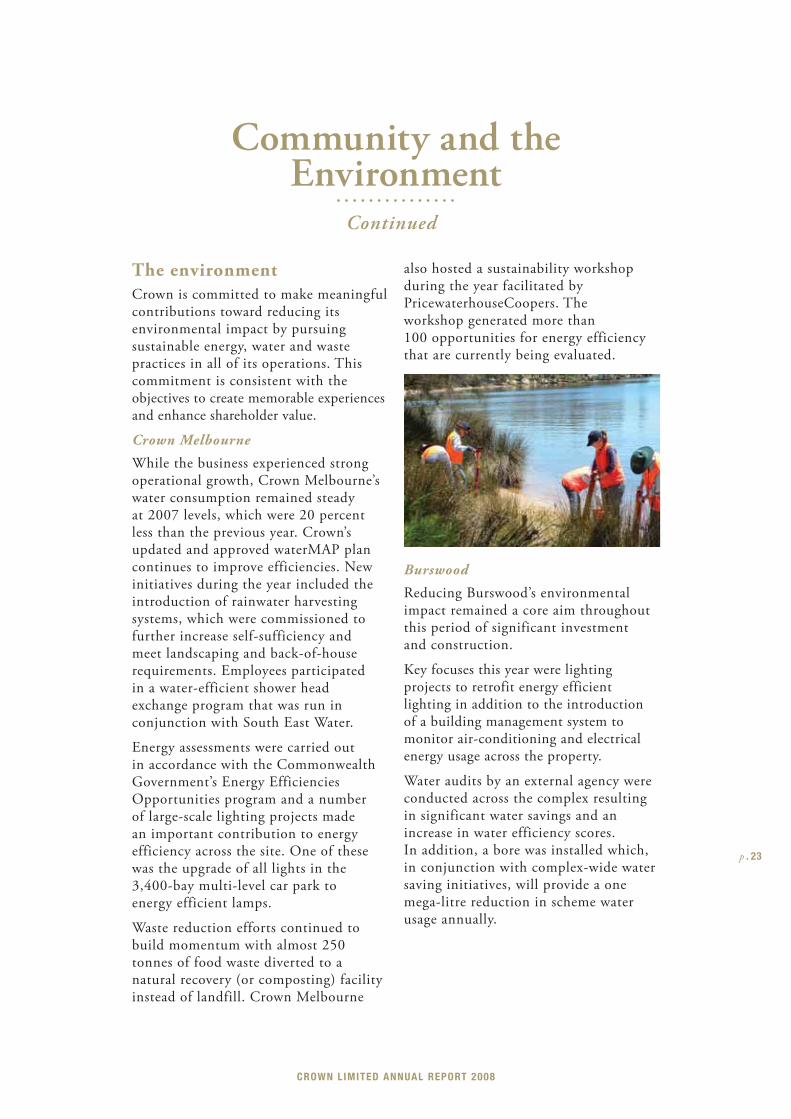
The environmentCrown is committed to make meaningful contributions toward reducing its environmental impact by pursuing sustainable energy, water and waste practices in all of its operations. This commitment is consistent with the objectives to create memorable experiences and enhance shareholder value.
Crown Melbourne
While the business experienced strong operational growth, Crown Melbourne’s water consumption remained steady at 2007 levels, which were 20 percent less than the previous year. Crown’s updated and approved waterMAP plan continues to improve efficiencies. New initiatives during the year included the introduction of rainwater harvesting systems, which were commissioned to further increase self-sufficiency and meet landscaping and back-of-house requirements. Employees participated in a water-efficient shower head exchange program that was run in conjunction with South East Water.
Energy assessments were carried out in accordance with the Commonwealth Government’s Energy Efficiencies Opportunities program and a number of large-scale lighting projects made an important contribution to energy efficiency across the site. One of these was the upgrade of all lights in the 3,400-bay multi-level car park to energy efficient lamps.
Waste reduction efforts continued to build momentum with almost 250 tonnes of food waste diverted to a natural recovery (or composting) facility instead of landfill. Crown Melbourne
also hosted a sustainability workshop during the year facilitated by PricewaterhouseCoopers. The workshop generated more than 100 opportunities for energy efficiency that are currently being evaluated.
Burswood
Reducing Burswood’s environmental impact remained a core aim throughout this period of significant investment and construction.
Key focuses this year were lighting projects to retrofit energy efficient lighting in addition to the introduction of a building management system to monitor air-conditioning and electrical energy usage across the property.
Water audits by an external agency were conducted across the complex resulting in significant water savings and an increase in water efficiency scores. In addition, a bore was installed which, in conjunction with complex-wide water saving initiatives, will provide a one mega-litre reduction in scheme water usage annually.
p . 23
CROWN LIMITED ANNUAL REPORT 2008
Community and the Environment
Continued
The Crown Limited Board is committed to the implementation and maintenance of good corporate governance practices.
Crown was admitted to the official list of the ASX on 3 December 2007 (Listing) and has been subject to the ASX Listing Rules since that time.
As a newly listed entity, Crown has taken the opportunity to establish structured corporate governance practices appropriate to Crown and the industry in which it operates.
Th is Statement sets out the extent to which Crown Limited (Crown) has followed the best practice recommendations set by the ASX Corporate Governance Council during the period commencing from its Listing to 30 June 2008.
Crown has elected to report against the Corporate Governance Principles and Recommendations (Revised Principles) released by the Council on 2 August 2007.
Principle 1Lay solid foundations for management and oversight
Functions reserved for the Board
The Board is responsible for guiding and monitoring Crown on behalf of its shareholders. In addition, the Board is responsible for identifying areas of significant business risk and ensuring arrangements are in place to adequately manage those risks.
The Board has adopted a formal Board Charter which sets out a list of specific functions which are reserved for the Board.
Functions delegated to Senior Management
Management has responsibility for matters which are not specifically reserved for the Board (such as the day-to-day management of the operations and administration of Crown).
Process for evaluating performance of senior executives
Crown has established processes for evaluating the performance of its senior executives. In summary, each senior executive is evaluated against the achievement of pre-agreed performance objectives. The evaluation process is conducted annually and is followed by the determination of appropriate remuneration of the relevant senior executive.
Detailed information regarding Crown’s remuneration practices is provided in the Remuneration Report, commencing at page 33.
Induction process for new senior executives
Crown senior executives are required to undertake formal induction training through Crown’s on-site accredited training facility – Crown College.
Corporate Governance Statement
p . 24
The program involves training about:
• the history and development of the Crown brand and business;
• the main legal and regulatory obligations affecting the Crown business; and
• the rights and obligations of Crown employees.
As part of the induction program, senior executives are required to successfully complete a series of online training modules and to pass the associated assessment.
More information
A full copy of the Crown Board Charter is available on its website at: www.crownlimited.com under the heading Corporate Governance – Charters.
Principle 2Structure the board to add value
Composition of the Board
As at the date of this Statement, the Board comprises the following eleven directors:
• James D Packer Executive Chairman
• John H Alexander BA Executive Deputy Chairman
• Christopher J Anderson BEc Non-independent, non-executive Director
• Christopher D Corrigan Independent, non-executive Director
• Rowen B Craigie BEc (Hons) Chief Executive Officer and Managing Director
• Rowena Danziger BA, TC, MACE Independent, non-executive Director
• Geoffrey J Dixon Independent, non-executive Director
• Ashok P Jacob MBA Non-independent, non-executive Director
• Michael R Johnston BEc, CA Non-independent, non-executive Director
• David H Lowy AM, BCom Independent, non-executive Director
• Richard W Turner AM, BEc, FCA Independent, non-executive Director
Information about each director’s qualifications, experience and period in office is set out in the Directors’ Statutory Report, commencing at page 56.
The roles of Chair and Chief Executive Officer are exercised by separate persons. James Packer acts as Executive Chairman and Rowen Craigie as Chief Executive Officer and Managing Director.
p . 25
CROWN LIMITED ANNUAL REPORT 2008
Relationships affecting independence
Of Crown’s eleven directors, five are independent directors. The independence of directors is assessed against a list of criteria and materiality thresholds. Those criteria have been formally enshrined in the Crown Board Charter. Each director who is listed as an independent director complies with the relevant criteria for independence set out in the Crown Board Charter.
Departure from Recommendation 2.1: The Revised Principles recommend that a majority of the Board should be independent directors. Crown does not comply with this recommendation. The Board, however, considers that its shareholders are best served by ensuring that directors have appropriate skills and experience to manage the business of Crown, notwithstanding that they may not be characterised as independent. Almost half of Crown’s directors are, however, independent. In addition, all directors have access to independent advice to assist in the discharge of their duties (see further below).
Departure from Recommendation 2.2: The Revised Principles recommend that the chair of the Board should be an independent director. Crown’s Chairman is not an independent director. The Board believes that the interests of shareholders are best served by a Chairman who would be sanctioned by shareholders and who would act in the best interests of shareholders as a whole. As the Chairman has a significant relevant interest in Crown, he is well placed to act on behalf of shareholders and in their best interests.
Procedure for selection and appointment of new directors
In the event that a new director appointment is required, the Board will adhere to procedures including the following:
• the experience and skills appropriate for an appointee, having regard to those of the existing Board members and likely changes to the Board will be considered;
• upon identifying a potential appointee, specific consideration will be given to that candidate’s:
• competencies and qualifications;
• independence;
• other directorships and time availability; and
• the effect that their appointment would have on the overall balance and composition of the Board; and
• finally, all existing Board members must consent to the proposed appointment.
Departure from Recommendation 2.4: The Revised Principles recommend that the Board should establish a Nomination Committee. The Board has not established a Nomination Committee as it does not consider that the process for determining potential directors would be made more efficient by doing so. The appointment of new directors is a matter specifically reserved to the Board. In appropriate circumstances, the Board may delegate some or all of this process to a relevant Committee.
Process for evaluating performance of the Board, its Committees and its members
A performance evaluation of the Board and of its Committees is undertaken annually, following completion of each fi nancial year, by way of a questionnaire sent to each Board and Committee member.
The questionnaire covers the role, composition, procedure and practices of the Board and its Committees. The individual responses to the questionnaire are confidential to each Board/Committee member, with questionnaire responses to be provided to the Chairman of the Audit & Corporate Governance Committee for his consideration and provision to the Executive Chairman of the Board.
p . 26
CORPORATE GOVERNANCE STATEMENT CONTINUED
Procedures for taking independent advice
To enable Crown’s Board to fulfil its role, each director may obtain independent advice on relevant matters at Crown’s expense. In these circumstances, the director must notify the Executive Chairman of the nature of the advice sought prior to obtaining that advice, so that the Executive Chairman can take steps to ensure that the party from whom advice is sought has no material conflict of interest with Crown. The Executive Chairman is also responsible for approving payment of invoices in relation to the external advice.
In addition, each Board Committee has the full authority of the Board to:
• communicate and consult with external and internal persons and organisations concerning matters delegated to the Committee; and
• appoint independent experts to provide advice on matters delegated to the Committee.
Crown Board Committees
To assist in carrying out its responsibilities, the Crown Board has established the following Committees:
Committees Current Members Meetings held since Listing
Attended by
Audit & Corporate Governance Richard Turner (Chair)
Michael Johnston
Rowena Danziger
19 February 2008
20 May 2008
All members
Finance* Geoffrey Dixon (Chair)
Michael Johnston
Richard Turner
Investment* James Packer (Chair)
John Alexander
Ashok Jacob
Rowen Craigie
Occupational Health & Safety
Rowena Danziger (Chair)
Michael Johnston
Rowen Craigie
13 March 2008
20 May 2008
All members
Remuneration** James Packer (Chair)
John Alexander
Geoffrey Dixon
Risk Management Geoffrey Dixon (Chair)
Rowena Danziger
Rowen Craigie
13 June 2008 All members
* Th e Investment Committee and the Finance Committee have not met since Listing.** Th e primary role of the Remuneration Committee is to review non-executive director remuneration. Th e Committee meets once
a year to review performance for the previous year. Accordingly, the Committee has not met since Listing.
Each Committee has adopted a formal Charter that outlines its duties and responsibilities.
More information
A full copy of each of Crown’s Committee Charters is available on its website at: www.crownlimited.com under the heading Corporate Governance – Charters.
A description of the procedure for selection, appointment and re-election of directors is available on the Crown website at: www.crownlimited.com under the heading Corporate Governance – Policies.
p . 27
CROWN LIMITED ANNUAL REPORT 2008
Principle 3Promote ethical and responsible decision-making
Codes of conduct
Crown has established separate Codes of Conduct that outline the standard of ethical behaviour that is expected of its Directors and of its employees at all times.
The Code of Conduct for Employees is a detailed statement of the:
• practices required by employees to maintain confidence in Crown’s integrity;
• the legal obligations of employees and the reasonable expectations of their stakeholders; and
• the responsibility and accountability of individuals for reporting and investigating reports of unethical practices.
Policy concerning trading in company securities
Crown has adopted a formal Securities Trading Policy which details Crown’s policy concerning trading in company securities by directors, senior executives and employees.
The Securities Trading Policy:
• includes a requirement that employees do not buy and sell Crown shares and securities within a 12 month period (ie that they do not short trade);
• establishes formal “trading windows” during which Crown employees can and cannot trade in Crown shares and securities;
• sets out Crown’s policy on entering into transactions in associated products which limit economic risk; and
• summarises the application of the insider trading provisions of the Corporations Act and the consequences of contravention thereof.
More information
Full copies of Crown’s Code of Conduct for Directors and Code of Conduct for Employees are available on its website at: www.crownlimited.com under the heading Corporate Governance – Codes.
A full copy of Crown’s Securities Trading Policy is available on its website at: www.crownlimited.com under the heading Corporate Governance – Policies.
p . 28
CORPORATE GOVERNANCE STATEMENT CONTINUED
Principle 4Safeguard integrity in financial reporting
Crown Audit Committee and Charter
As indicated above, Crown has established a formal Audit & Corporate Governance Committee to review the integrity of Crown’s financial reporting and to oversee the independence of Crown’s external auditors.
The members of the Audit & Corporate Governance Committee are Richard Turner (Chair), Rowena Danziger and Michael Johnston. All members of the Committee are non-executive directors and a majority of those Committee members are independent directors.
The Chairman of the Audit & Corporate Governance Committee, Mr Richard Turner is an independent director who has extensive financial qualifications and experience, having been an audit partner at Ernst & Young and having held the position of Chief Executive Officer of Ernst & Young prior to his retirement in 1994.
Further information about each Committee member’s qualifications and experience is set out in the Directors’ Statutory Report, commencing at page 56.
The Audit & Corporate Governance Committee has adopted a formal Charter that outlines its duties and responsibilities.
The Charter includes information on the procedures for selection and appointment of the external auditor of Crown and for the rotation of external audit engagement partners.
More information
A full copy of Crown’s Audit & Corporate Governance Committee Charter is available on its website at: www.crownlimited.com under the heading Corporate Governance – Charters.
Principle 5Make timely and balanced disclosure
Policy to ensure compliance with ASX Listing Rule disclosure requirements
Crown has a formal Continuous Disclosure Policy in place which is designed to ensure compliance with ASX Listing Rule requirements. The Policy details processes for:
• ensuring material information is communicated to Crown’s Chief Executive Officer, its General Counsel and Company Secretary or a member of the Audit & Corporate Governance Committee;
• the assessment of information and for the disclosure of Material Information to the market; and
• the broader publication of Material Information to Crown’s shareholders and the media.
More information
A full copy of Crown’s Continuous Disclosure Policy is available on its website at: www.crownlimited.com under the heading Corporate Governance – Policies.
p . 29
CROWN LIMITED ANNUAL REPORT 2008
Principle 6Respect the rights of shareholders
Promotion of effective communication with shareholders
Crown has designed a Communications Policy which seeks to promote effective communication with its shareholders. The Policy explains how information concerning Crown will be communicated to shareholders. The communication channels include:
• Crown’s Full Financial Annual Report;
• disclosures made to ASX; and
• notices of meeting and other explanatory memoranda.
Crown has a dedicated corporate website which includes copies of all communications and other company information.
More information
A full copy of Crown’s Communication Policy is available on its website at: www.crownlimited.com under the heading Corporate Governance – Policies.
Principle 7Recognise and manage risk
Policy for the oversight and management of material business risks
Crown has established policies for the oversight and management of material business risks and has adopted a formal Risk Management Policy. Risk management is an integral part of the industry in which Crown operates.
Design and implementation of risk management and internal control systems
The Board requires Crown’s management to devise and implement risk management systems and to monitor the effectiveness of those systems. The Board convened Risk Management Committee is charged with administering Crown’s Risk Management Policy.
The Policy sets out procedures which are designed to identify, assess, monitor and manage risk at each of Crown’s controlled businesses and requires that the results of those procedures are reported to the Crown Board.
The Board has received, and will continue to receive, periodic reports through the Risk Management Committee, summarising the results of risk management initiatives at Crown.
Chief Executive Officer and Chief Financial Officer assurances
The Crown Board has received assurance from the Chief Executive Officer and the Chief Financial Officer that the declaration provided in accordance with section 295A of the Corporations Act is founded on a sound system of risk management and internal control and that the system is operating effectively in all material respects in relation to financial reporting risks.
More information
A full copy of Crown’s Risk Management Committee Charter is available on its website at: www.crownlimited.com under the heading Corporate Governance – Charters.
A full copy of Crown’s Risk Management Policy is available on its website at: www.crownlimited.com under the heading Corporate Governance – Policies.
p . 30
CORPORATE GOVERNANCE STATEMENT CONTINUED
Principle 8Remunerate fairly and responsibly
Remuneration of Board members and Senior Executives
As indicated earlier, Crown has established a formal Remuneration Committee. The role of the Remuneration Committee is to review and recommend appropriate Directors’ Fees to be paid to non-executive Directors. At the discretion of the Crown Board, the role of this Committee may be extended to the remuneration policies to be applied to executives, including any equity-based remuneration plan that may be considered, subject to shareholder approval (where required).
The current members of the Remuneration Committee are James Packer (Chair), John Alexander and Geoffrey Dixon.
Information about each Committee member’s qualifications and experience is set out in the Directors’ Statutory Report, commencing at page 56.
The Remuneration Committee has adopted a formal Charter that outlines its duties and responsibilities.
A summary of current remuneration arrangements is set out more fully in the Remuneration Report, commencing at page 33.
The objective of Crown’s remuneration policy is to ensure that:
• senior executives are motivated to pursue the long-term growth and success of Crown; and
• there is a clear relationship between senior executives’ performance and remuneration.
Departure from Recommendation 8.1: The Revised Principles recommend that the Remuneration Committee should be structured so that it consists of a majority of independent directors, is chaired by an independent director and has at least three members.
Whilst the composition and responsibilities of the Committee are not consistent with the recommendations in the Revised Principles, the Committee provides an effective and efficient mechanism for consideration of appropriate remuneration policy for Crown, responsibility for which ultimately lies with the Crown Board.
Policy on entering into transactions in associated products which limit economic risk
Crown’s policy on directors and employees entering into transactions in associated products which limit economic risk is referred to in its Securities Trading Policy.
The Policy provides that in accordance with the Rules of the Executive Share Plan (ESP) operated by Crown those “Directors and employees of the Crown Group” who hold Crown shares under the ESP must not, without the prior consent in writing of Crown, sell, create a security interest in, or otherwise dispose or deal with their Crown shares or any of their interests in any of those Crown shares.
More information
A full copy of Crown’s Remuneration Committee Charter is available on its website at: www.crownlimited.com under the heading Corporate Governance – Charters.
A full copy of Crown’s Remuneration Policy is available on its website at: www.crownlimited.com under the heading Corporate Governance – Policies.
p . 31
CROWN LIMITED ANNUAL REPORT 2008
Introduction
Content of the Report
This Remuneration Report outlines the director and executive remuneration arrangements of Crown in accordance with the requirements of the Corporations Act 2001 and its Regulations. It also provides the remuneration disclosures required by AASB 124 Related Party Disclosures.
Structure of disclosures
As shareholders are aware, Crown acquired the majority of its gaming assets via two schemes of arrangement between the then Publishing and Broadcasting Limited (PBL) (now Consolidated Media Holdings Limited (CMH)), Crown and their respective shareholders. Under the first scheme, the “PBL Scheme”, Crown acquired all of the shares in PBL. Under the second scheme, the “Demerger Scheme”, the non gaming assets of PBL were demerged from the Crown group.
The disclosure document used in connection with the schemes of arrangement (the PBL Scheme Booklet) is available on Crown’s website www.crownlimited.com. The PBL Scheme Booklet describes in detail how the PBL Scheme and the Demerger Scheme were effected and provides useful context and background to this Report.
Crown is principally a gaming and entertainment business managed by its Board and key gaming executives. The application of Australian Accounting Standards, however, requires that this Report provide information in relation to persons who at any time during the financial year were members of the consolidated Crown group. Due to the way in which the two schemes were effected, application of Australian Accounting Standards requires Crown to provide information in relation to both “gaming” directors and executives as well as other ex PBL “media” executives who have not participated in the gaming business of Crown during the year but have been part of the “Crown consolidated group” during the year.
Crown has attempted to present the contents of this Report in a way which clearly distinguishes between “gaming” directors and executives who have principally been involved in furthering the business of Crown and “media” directors and executives, so as to provide meaningful and relevant information to shareholders.
Persons to whom Report applies
The remuneration disclosures in this Report cover the following persons:
Non-executive directors
• Christopher J Anderson
• Christopher D Corrigan
• Rowena Danziger
• Geoffrey J Dixon
• Ashok P Jacob
• Michael R Johnston
• David H Lowy
• Christopher J Mackay (resigned 7 March 2008)
• Richard W Turner
Remuneration Report
p . 32
Executive directors
• James D Packer (Executive Chairman)
• John H Alexander (Executive Deputy Chairman)
• Rowen B Craigie (Managing Director and Chief Executive Officer)
Other company executives and key management personnel
• David G Courtney (Chief Executive Officer, Crown Melbourne Limited)
• Barry J Felstead (Chief Executive Officer, Burswood Limited)
• Geoffrey R Kleemann (Chief Financial Officer)
Media company executives and key management personnel
As mentioned above, due to the application of Australian Accounting Standards, this Report also sets out remuneration disclosures in relation to:
• Martin P Dalgleish
• Guy Jalland
Mr Dalgleish and Mr Jalland held executive roles within the PBL group prior to the PBL Scheme. Following implementation of the two schemes, Mr Dalgleish moved to a different position within the CMH group. Mr Jalland ceased employment with the PBL group on 21 December 2007.
In this Report the group of persons comprised of the Executive Directors and the other company executives and key management personnel (both gaming and media) are referred to as “Senior Executives”. The Senior Executives above include the five most highly remunerated executives of the Crown consolidated group.
Overview of remuneration policy
Philosophy
The performance of the Crown group is dependent upon the quality of its directors, senior executives and employees. Crown seeks to attract, retain and motivate skilled directors and senior executives of the highest calibre.
Crown’s remuneration philosophy is to ensure that remuneration packages properly reflect a person’s duties and responsibilities, that remuneration is appropriate and competitive both internally and as against comparable companies and that there is a direct link between remuneration and performance.
Crown has differing remuneration structures in place for non-executive directors and Senior Executives.
Non-executive directors
The process for determining remuneration of the non-executive directors has the objective of ensuring maximum benefit for Crown by the retention of a high quality board.
The Remuneration Committee bears the responsibility of determining the appropriate remuneration for non-executive directors. Non-executive directors’ fees are reviewed periodically by the Remuneration Committee with reference taken to the fees paid to the non-executive directors of comparable companies. The Remuneration Committee is subject to the direction and control of the Board.
In forming a view of the appropriate level of Board fees to be paid to non-executive directors, the Committee may also elect to receive advice from independent remuneration consultants if necessary.
p . 33
CROWN LIMITED ANNUAL REPORT 2008
Details regarding the composition of the Committee and its main objectives are outlined in the Corporate Governance Statement. The Board deems it appropriate that Mr James Packer, who is not an independent director of Crown and does not receive remuneration from Crown, chair this Committee.
No performance based fees are paid to non-executive directors. Non-executive directors are not entitled to participate in the Executive Share Plan.
Non-executive directors are not provided with retirement benefits other than statutory superannuation at the rate prescribed under the Superannuation Guarantee legislation. Notwithstanding, the Executive Chairman and Executive Deputy Chairman may consider making a payment to a retiring non-executive director having regard to the length of service and contribution of the retiring non-executive director and will consider the appropriateness and reasonableness of the amount in light of payments made by comparable companies.
Senior Executives
The remuneration structure incorporates a mix of fixed and performance based remuneration. The following section provides an overview of the relevant elements of executive remuneration. Th e summary tables provided later in this Report indicate which elements apply to each Senior Executive.
Details of Senior Executive remuneration structure
Fixed remuneration
The objective of fixed remuneration is to provide a base level of remuneration which is appropriate to the Senior Executive’s responsibilities, the geographic location of the Senior Executive and competitive standing in the appropriate market.
Fixed remuneration is therefore determined with reference to available market data, the scope and any unique aspects of an individual’s role and having regard to the calibre of the individual. The company seeks a range of specialist advice to establish the competitive remuneration for its Senior Executives.
Fixed remuneration typically includes base salary and superannuation at the rate prescribed under the Superannuation Guarantee legislation and at the election of the Senior Executive, may include other benefits such as a motor vehicle or motor vehicle allowance, car parking, mobile telephone costs and club membership, aggregated with fringe benefits tax to represent the total employment cost (TEC) of the relevant Senior Executive to Crown.
Fixed remuneration for the Senior Executives (except the Chief Executive Officer and Managing Director) is reviewed annually by the Chief Executive Officer and Managing Director of Crown and is approved by the Executive Chairman and Executive Deputy Chairman.
The review process includes consideration of the performance of the Senior Executive as measured by achievements against agreed Key Performance Indicators (see further below), performance of Crown and the business in which the Senior Executive is employed, relevant comparative remuneration in the market and external advice.
Fixed remuneration for the Chief Executive Officer and Managing Director is reviewed and set annually following consideration by the Executive Chairman of the performance of the Chief Executive Officer and Managing Director.
Any payments relating to redundancy or retirement are as specified in each relevant Senior Executive’s contract of employment. For summaries of Senior Executive contracts of employment, see page 42.
p . 34
REMUNERATION REPORT CONTINUED
Performance based remuneration
The performance based components of remuneration for Senior Executives seek to align the rewards attainable by Senior Executives with the achievement of particular annual and long term objectives of Crown and the creation of shareholder value over the short and long term. The performance based components which applied during the year are as follows:
• Short Term Incentives (STIs);
• Long Term Incentives (LTIs); and
• An Executive Share Plan.
Short Term Incentives
The remuneration of the Senior Executives is linked to Crown’s short term annual performance through a cash-based STI. Individuals may be paid an STI following an assessment of the performance of the Crown group in the previous year and the performance of the individual against agreed Key Performance Indicators (KPIs). The employment contracts of some Senior Executives may specify an indicative STI subject to the Crown group’s performance and, if applicable, this indicative STI is set out in the summary of their employment contract below.
The basis for payment of an STI is the achievement of the Senior Executive’s KPIs established at the beginning of each financial year. The focus is on the achievement of the Crown group’s annual business plan and budget.
Financial performance objectives (including performance against budgeted EBITDA) have been chosen as Crown considers they are the best way to align performance outcomes with shareholder value.
Appropriate non-financial performance objectives (such as strategic goals, operational efficiencies and people development) are also chosen where they are within a Senior Executive’s sphere of influence and are relevant to the Senior Executive’s area of work, as these metrics are aligned with the achievement of Crown’s business plan.
The performance of each Senior Executive against the financial and non-financial KPIs is reviewed on an annual basis. Whether KPIs have been achieved is determined by the Chief Executive Officer and Managing Director having regard to the operational performance of the business in which the Senior Executive is involved and the Chief Executive Officer and Managing Director’s assessment of the attainment of the individual’s KPIs.
Th e Chief Executive Offi cer and Managing Director reviews performance based remuneration entitlements and determines the STI payments subject to fi nal approval by the Executive Chairman.
Th e Chief Executive Offi cer and Managing Director’s eligibility for an STI is determined by the Executive Chairman on behalf of the Board.
As at the date of this Report, the approval process for STI payments for gaming Senior Executives for the 2008 fi nancial year has not been completed. Accordingly, the remuneration tables set out in this Report do not disclose an STI payment for the 2008 fi nancial year. STI payments, if any, will therefore be disclosed in Crown’s 2009 Annual Report.
p . 35
CROWN LIMITED ANNUAL REPORT 2008
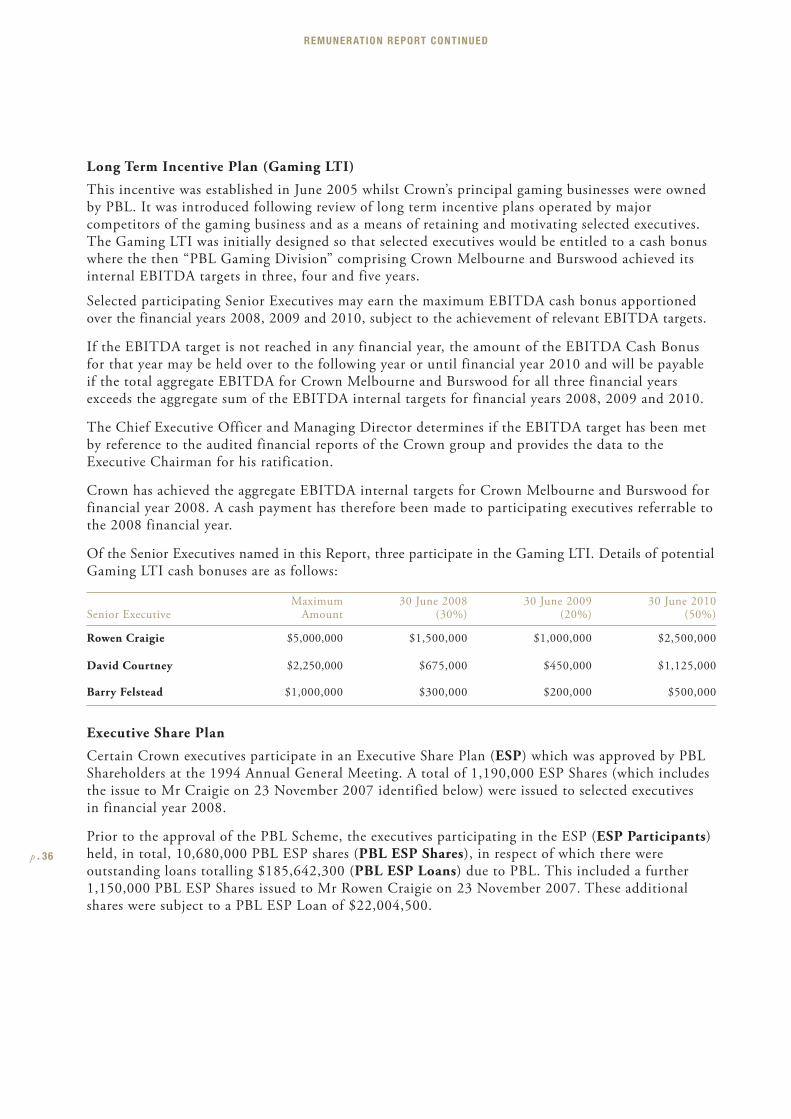
Long Term Incentive Plan (Gaming LTI)
This incentive was established in June 2005 whilst Crown’s principal gaming businesses were owned by PBL. It was introduced following review of long term incentive plans operated by major competitors of the gaming business and as a means of retaining and motivating selected executives. The Gaming LTI was initially designed so that selected executives would be entitled to a cash bonus where the then “PBL Gaming Division” comprising Crown Melbourne and Burswood achieved its internal EBITDA targets in three, four and five years.
Selected participating Senior Executives may earn the maximum EBITDA cash bonus apportioned over the financial years 2008, 2009 and 2010, subject to the achievement of relevant EBITDA targets.
If the EBITDA target is not reached in any financial year, the amount of the EBITDA Cash Bonus for that year may be held over to the following year or until financial year 2010 and will be payable if the total aggregate EBITDA for Crown Melbourne and Burswood for all three financial years exceeds the aggregate sum of the EBITDA internal targets for financial years 2008, 2009 and 2010.
The Chief Executive Officer and Managing Director determines if the EBITDA target has been met by reference to the audited financial reports of the Crown group and provides the data to the Executive Chairman for his ratification.
Crown has achieved the aggregate EBITDA internal targets for Crown Melbourne and Burswood for financial year 2008. A cash payment has therefore been made to participating executives referrable to the 2008 financial year.
Of the Senior Executives named in this Report, three participate in the Gaming LTI. Details of potential Gaming LTI cash bonuses are as follows:
Senior ExecutiveMaximum
Amount30 June 2008
(30%)30 June 2009
(20%)30 June 2010
(50%)
Rowen Craigie $5,000,000 $1,500,000 $1,000,000 $2,500,000
David Courtney $2,250,000 $675,000 $450,000 $1,125,000
Barry Felstead $1,000,000 $300,000 $200,000 $500,000
Executive Share Plan
Certain Crown executives participate in an Executive Share Plan (ESP) which was approved by PBL Shareholders at the 1994 Annual General Meeting. A total of 1,190,000 ESP Shares (which includes the issue to Mr Craigie on 23 November 2007 identified below) were issued to selected executives in financial year 2008.
Prior to the approval of the PBL Scheme, the executives participating in the ESP (ESP Participants) held, in total, 10,680,000 PBL ESP shares (PBL ESP Shares), in respect of which there were outstanding loans totalling $185,642,300 (PBL ESP Loans) due to PBL. This included a further 1,150,000 PBL ESP Shares issued to Mr Rowen Craigie on 23 November 2007. These additional shares were subject to a PBL ESP Loan of $22,004,500.
p . 36
REMUNERATION REPORT CONTINUED
Variations to the ESP and the key ESP terms: As disclosed in the PBL Scheme Booklet (at page 133), the rules governing the operation of the ESP were varied to enable ESP Participants to participate in the PBL Scheme (and continue to participate in the ESP) as follows:
Restrictions were lifted to permit ESP Participants to participate in the PBL Scheme: The restrictions on transfer of the PBL ESP Shares were lifted to allow the PBL ESP Shares to participate in the PBL Scheme in the same manner as all PBL shareholders. A total of 10,680,000 PBL ESP Shares participated in the PBL Scheme.
ESP Participants now hold Crown ESP shares and CMH ESP shares under the ESP: Subject to the consideration election made by the ESP Participants under the PBL Scheme, ESP Participants were issued with Crown shares under the PBL Scheme and they had CMH shares transferred to them under the Demerger Scheme. ESP Participants no longer hold PBL ESP Shares.
ESP Participants receiving standard consideration saw a reduction in their PBL ESP Loan by the cash consideration amount: For those ESP Participants electing the standard consideration (1 Crown ESP share and $3 for each PBL ESP Share), the cash component of the PBL Scheme consideration that ESP Participants received in respect of their PBL ESP Shares was applied to reduce the PBL ESP Loan. ESP Participants that elected the maximum share consideration did not receive cash consideration and accordingly there was no reduction of their PBL ESP Loan.
The PBL ESP Loans were then apportioned 75 percent to Crown and 25 percent to CMH: The PBL ESP Loan for each ESP Participant was then apportioned 75 percent to Crown (Crown ESP Loan) and 25 percent to CMH (CMH ESP Loan). Each of the Crown ESP Loan and CMH ESP Loan is repayable the earlier of five years from the original date of issue of the PBL ESP Shares (Expiry Date) or when the ESP Participant ceases employment. The loan funds are on a limited recourse basis.
The Crown ESP Loan is applied against the Crown ESP shares: Where an ESP Participant sells all or a portion of their Crown ESP shares, the proceeds of sale of those Crown shares must be applied to repay the equivalent proportion of their outstanding Crown ESP Loan. When an ESP Participant sells all or a portion of their CMH ESP shares, the proceeds of sale of those shares must be applied to repay the equivalent proportion of the outstanding CMH ESP Loan. In each case, the ESP Participant is entitled to retain the net proceeds of sale after the respective Crown ESP Loan or CMH ESP Loan repayment.
The share price performance hurdle of seven percent was retained: The share price performance hurdles requiring a compound share price appreciation of seven percent per annum based on the issue price of the PBL ESP Shares were retained and substituted with equivalent performance hurdles (seven percent compounding share price accumulation) imposed separately on the Crown shares and the CMH shares.
A determination that hurdles have been achieved is provided to the Chief Executive Officer and Managing Director by the Crown Company Secretary (for Crown) and to the Executive Chairman by the CMH Company Secretary (for CMH), following a review by each Company Secretary of the volume weighted average price (VWAP) of the Crown and the CMH shares for the 20 days up to and including the anniversary of the issue date of the ESP Participant’s PBL ESP Shares.
p . 37
CROWN LIMITED ANNUAL REPORT 2008
Remaining key terms: All other key terms of the ESP remain and apply to the Crown ESP shares and the CMH ESP shares:
• The restrictions which permit only 25 percent of the PBL ESP shares to be released from vesting conditions each year after issue will continue to apply to the Crown ESP shares and the CMH ESP shares that ESP Participants received under the Demerger.
• Interest payable on the Crown ESP Loan and CMH ESP Loan is equal to dividends received on the relevant Crown ESP shares and CMH ESP shares respectively from time to time.
• ESP Participants may only sell their vested Crown ESP shares and CMH ESP shares within a period 28 days after the relevant company lodges its Appendix 4D or Appendix 4E with ASX. ESP Participants may only sell their Crown ESP shares and CMH ESP shares during this time if they are capable of repaying the equivalent proportion of their Crown ESP Loan or and CMH ESP loan. Crown executives are also bound by the terms of the Crown Securities Trading Policy when trading their Crown ESP shares.
• The total number of Crown ESP shares and CMH ESP shares issued under the ESP is limited to a maximum of two percent of the issued capital of Crown, and a maximum of two percent of the issued capital of CMH.
• An ESP Participant must not, without the prior written consent of Crown in writing, sell, create a security interest in (for instance, create a lien, pledge, charge, mortgage or other encumbrance of whatever nature) or otherwise dispose of their Crown ESP shares or any of the ESP Participant’s interest in his or her Crown ESP shares. Should an ESP Participant wish to limit his or her exposure to risk in relation to the Crown ESP shares, he or she must contact the Company Secretary immediately, with consent in writing only provided following the assessment and approval by the Board or a delegate of its choosing.
At the date of this Report, a total of 66 ESP Participants hold, in total, 11,449,826 Crown ESP shares or 1.66 percent of Crown’s issued capital. There are outstanding Crown ESP Loans totalling $125,751,938 due to Crown. It is not proposed that any further issues will be made under the ESP.
No Crown ESP Loans were repaid by the Senior Executives or lapsed this year. The Senior Executives who have Crown ESP shares for which Crown ESP Loans are still outstanding are as follows:
p . 38
REMUNERATION REPORT CONTINUED
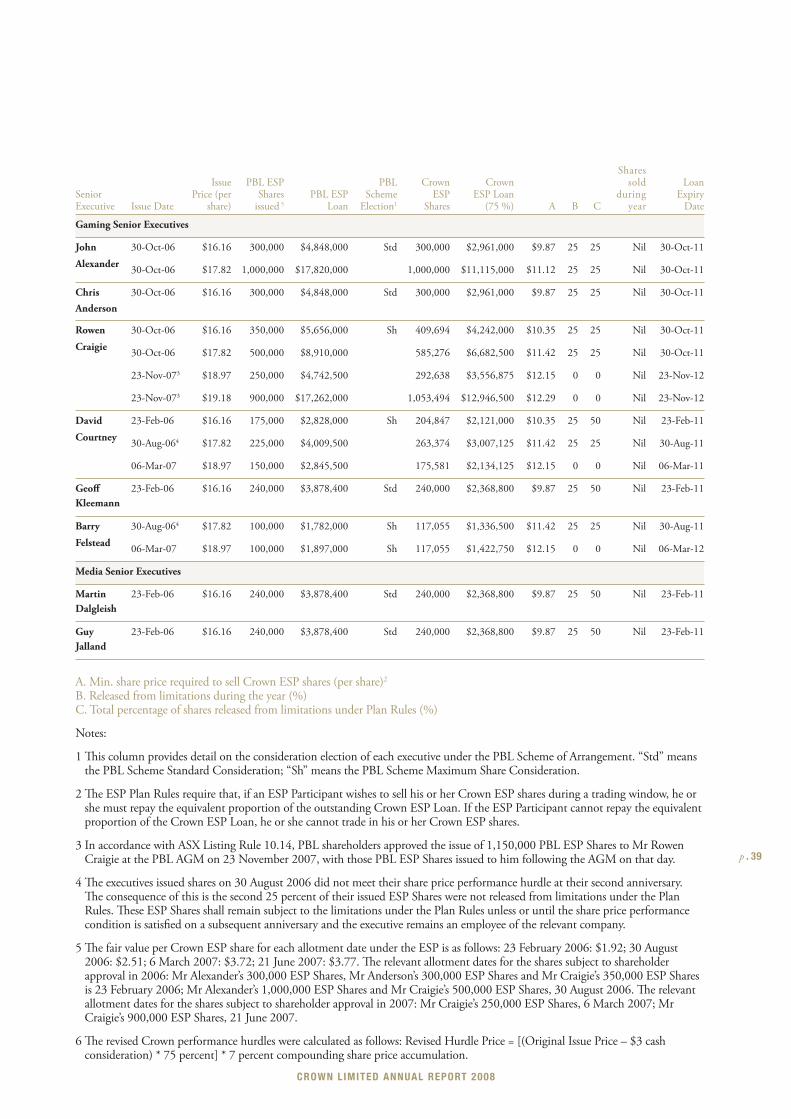
Senior Executive Issue Date
Issue Price (per
share)
PBL ESP Shares
issued 5
PBL ESP Loan
PBL Scheme
Election1
Crown ESP
Shares
Crown ESP Loan
(75 %) A B C
Shares sold
during year
Loan Expiry
Date
Gaming Senior Executives
John
Alexander
30-Oct-06 $16.16 300,000 $4,848,000 Std 300,000 $2,961,000 $9.87 25 25 Nil 30-Oct-11
30-Oct-06 $17.82 1,000,000 $17,820,000 1,000,000 $11,115,000 $11.12 25 25 Nil 30-Oct-11
Chris Anderson
30-Oct-06 $16.16 300,000 $4,848,000 Std 300,000 $2,961,000 $9.87 25 25 Nil 30-Oct-11
Rowen
Craigie
30-Oct-06 $16.16 350,000 $5,656,000 Sh 409,694 $4,242,000 $10.35 25 25 Nil 30-Oct-11
30-Oct-06 $17.82 500,000 $8,910,000 585,276 $6,682,500 $11.42 25 25 Nil 30-Oct-11
23-Nov-073 $18.97 250,000 $4,742,500 292,638 $3,556,875 $12.15 0 0 Nil 23-Nov-12
23-Nov-073 $19.18 900,000 $17,262,000 1,053,494 $12,946,500 $12.29 0 0 Nil 23-Nov-12
David
Courtney
23-Feb-06 $16.16 175,000 $2,828,000 Sh 204,847 $2,121,000 $10.35 25 50 Nil 23-Feb-11
30-Aug-064 $17.82 225,000 $4,009,500 263,374 $3,007,125 $11.42 25 25 Nil 30-Aug-11
06-Mar-07 $18.97 150,000 $2,845,500 175,581 $2,134,125 $12.15 0 0 Nil 06-Mar-11
Geoff Kleemann
23-Feb-06 $16.16 240,000 $3,878,400 Std 240,000 $2,368,800 $9.87 25 50 Nil 23-Feb-11
Barry
Felstead
30-Aug-064 $17.82 100,000 $1,782,000 Sh 117,055 $1,336,500 $11.42 25 25 Nil 30-Aug-11
06-Mar-07 $18.97 100,000 $1,897,000 Sh 117,055 $1,422,750 $12.15 0 0 Nil 06-Mar-12
Media Senior Executives
Martin Dalgleish
23-Feb-06 $16.16 240,000 $3,878,400 Std 240,000 $2,368,800 $9.87 25 50 Nil 23-Feb-11
Guy Jalland
23-Feb-06 $16.16 240,000 $3,878,400 Std 240,000 $2,368,800 $9.87 25 50 Nil 23-Feb-11
A. Min. share price required to sell Crown ESP shares (per share)2
B. Released from limitations during the year (%)C. Total percentage of shares released from limitations under Plan Rules (%)
Notes:
1 Th is column provides detail on the consideration election of each executive under the PBL Scheme of Arrangement. “Std” means the PBL Scheme Standard Consideration; “Sh” means the PBL Scheme Maximum Share Consideration.
2 Th e ESP Plan Rules require that, if an ESP Participant wishes to sell his or her Crown ESP shares during a trading window, he or she must repay the equivalent proportion of the outstanding Crown ESP Loan. If the ESP Participant cannot repay the equivalent proportion of the Crown ESP Loan, he or she cannot trade in his or her Crown ESP shares.
3 In accordance with ASX Listing Rule 10.14, PBL shareholders approved the issue of 1,150,000 PBL ESP Shares to Mr Rowen Craigie at the PBL AGM on 23 November 2007, with those PBL ESP Shares issued to him following the AGM on that day.
4 Th e executives issued shares on 30 August 2006 did not meet their share price performance hurdle at their second anniversary. Th e consequence of this is the second 25 percent of their issued ESP Shares were not released from limitations under the Plan Rules. Th ese ESP Shares shall remain subject to the limitations under the Plan Rules unless or until the share price performance condition is satisfi ed on a subsequent anniversary and the executive remains an employee of the relevant company.
5 Th e fair value per Crown ESP share for each allotment date under the ESP is as follows: 23 February 2006: $1.92; 30 August 2006: $2.51; 6 March 2007: $3.72; 21 June 2007: $3.77. Th e relevant allotment dates for the shares subject to shareholder approval in 2006: Mr Alexander’s 300,000 ESP Shares, Mr Anderson’s 300,000 ESP Shares and Mr Craigie’s 350,000 ESP Shares is 23 February 2006; Mr Alexander’s 1,000,000 ESP Shares and Mr Craigie’s 500,000 ESP Shares, 30 August 2006. Th e relevant allotment dates for the shares subject to shareholder approval in 2007: Mr Craigie’s 250,000 ESP Shares, 6 March 2007; Mr Craigie’s 900,000 ESP Shares, 21 June 2007.
6 Th e revised Crown performance hurdles were calculated as follows: Revised Hurdle Price = [(Original Issue Price – $3 cash consideration) * 75 percent] * 7 percent compounding share price accumulation.
p . 39
CROWN LIMITED ANNUAL REPORT 2008
As described above, all securities received by selected Senior Executives under the ESP are subject to performance hurdles. There have been no issues of securities as part of remuneration that are not subject to performance conditions.
Relationship between policy and performance
As detailed above, various elements of Crown’s remuneration policy are linked to company performance, either by requiring the achievement of a predetermined share price or level of EBITDA. In summary:
• An STI may be payable if Crown achieves its budgeted financial objectives and where an individual achieves his or her KPIs, assessed using a combination of financial measures and non-financial measures;
• The Gaming LTI may be payable where Crown Melbourne and Burswood achieves predetermined EBITDA targets; and
• The terms of the ESP include share price performance hurdles.
This year, normalised EBITDA generated by Crown Melbourne and Burswood, Crown’s wholly owned Australian casinos, grew by 8.2%. The compound average normalised EBITDA growth for Crown’s wholly owned Australian casinos for the five year period commencing from financial year 2003 through to financial year 2008 was 15.8%. Please note that during financial years 2003 and 2004 Crown Melbourne was the only gaming asset of PBL. Burswood was acquired by PBL in September 2004 and the impact of the Burswood acquisition on normalised EBITDA growth is included within the five year number above.
Shareholder wealth, measured by earnings per Crown share (excluding the effect of discontinued operations and specific items), grew during financial year 2008 by 9.2%. Prior to the PBL Scheme, PBL operated a mix of gaming and media businesses. Crown is now a stand alone gaming and entertainment business. A five year earnings per share comparison of the two different companies would not produce a meaningful result.
Policy on entering into transactions in associated products which limit economic risk
Crown’s policy on directors and Senior Executives entering into transactions in associated products which limit economic risk is described earlier in the Corporate Governance Statement.
Remuneration details for non-executive directors and Senior Executives
Non-executive directors
During the year the non-executive directors received a base fee of $100,000 per annum for acting as a director of Crown.
A non-executive director who acts on the Board of Crown Melbourne Limited received a further Directors’ fee of $60,000 per annum.p . 40
REMUNERATION REPORT CONTINUED
In addition, non-executive directors of Crown are entitled:
• $20,000 per annum for acting as Chair of a Board Committee; or
• $10,000 per annum for acting as a member of a Board Committee.
In accordance with Crown’s constitution, non-executive directors’ fees are determined within an aggregate non-executive directors’ fee cap of $1,000,000 per annum.
Senior Executives
Senior Executives are employed under service agreements with Crown or a business of the Crown group. Common features to these service agreements include (unless noted otherwise):
• an annual review of the executive’s fixed remuneration, with any increases at the discretion of the Chief Executive Officer and Managing Director or Executive Chairman and dependent on Crown’s financial performance and the individual’s KPI performance and market changes;
• competitive performance based incentive payments annually and in the long term, dependent upon Crown achieving its objectives and the Senior Executive achieving his or her KPIs;
• Crown may ask the executive to act as an officer of Crown or as an officer or director of a member or associate of the Crown group for no additional remuneration;
• a prohibition from gambling at any property within the Crown group during the term of employment and for three months following termination and a requirement that the executive maintain licences required and issued by relevant regulatory authorities (such as the Victorian Commission for Gambling Regulation and the Western Australian Gaming and Wagering Commission);
• where post-employment restraints apply, a restraint covering, amongst other things, competitive activities to those of the Crown group. Restraint periods vary and have been noted in each instance;
• where an employment agreement is terminated by Crown, notice may be given in writing or payment may be made (wholly or partly) in lieu of notice; and
• all contracts may be terminated without notice by Crown for serious misconduct.
Specific details of each Senior Executive’s contract of employment are summarised below. Where a Senior Executive has had more than one contract of employment during the year the most recent contract is listed and changes from the previous contract are noted. Where a key clause in a Senior Executive’s contract has been updated (for instance, remuneration (TEC)) the change is noted. The summaries should be read in conjunction with the Remuneration Policy above.
p . 41
CROWN LIMITED ANNUAL REPORT 2008
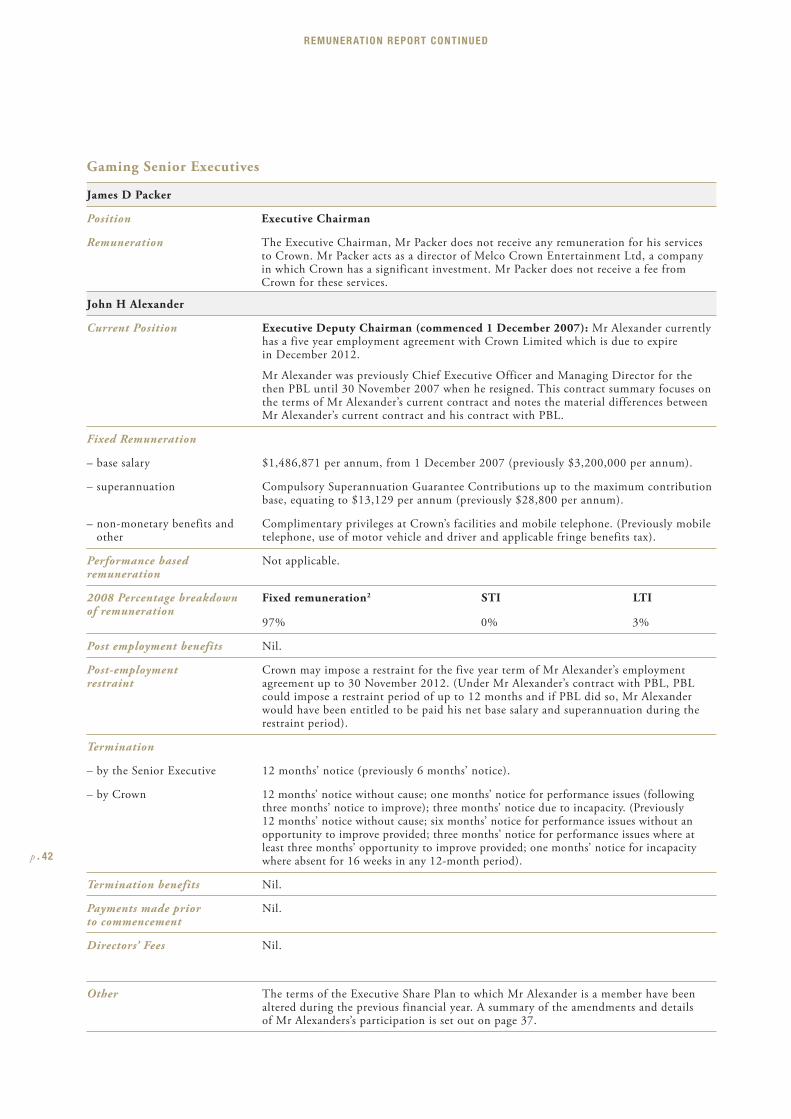
Gaming Senior Executives
James D Packer
Position Executive Chairman
Remuneration The Executive Chairman, Mr Packer does not receive any remuneration for his services to Crown. Mr Packer acts as a director of Melco Crown Entertainment Ltd, a company in which Crown has a significant investment. Mr Packer does not receive a fee from Crown for these services.
John H Alexander
Current Position Executive Deputy Chairman (commenced 1 December 2007): Mr Alexander currently has a five year employment agreement with Crown Limited which is due to expire in December 2012.
Mr Alexander was previously Chief Executive Officer and Managing Director for the then PBL until 30 November 2007 when he resigned. This contract summary focuses on the terms of Mr Alexander’s current contract and notes the material differences between Mr Alexander’s current contract and his contract with PBL.
Fixed Remuneration
– base salary $1,486,871 per annum, from 1 December 2007 (previously $3,200,000 per annum).
– superannuation Compulsory Superannuation Guarantee Contributions up to the maximum contribution base, equating to $13,129 per annum (previously $28,800 per annum).
– non-monetary benefits and other
Complimentary privileges at Crown’s facilities and mobile telephone. (Previously mobile telephone, use of motor vehicle and driver and applicable fringe benefits tax).
Performance based remuneration
Not applicable.
2008 Percentage breakdown of remuneration
Fixed remuneration2
97%
STI
0%
LTI
3%
Post employment benefits Nil.
Post-employment restraint
Crown may impose a restraint for the five year term of Mr Alexander’s employment agreement up to 30 November 2012. (Under Mr Alexander’s contract with PBL, PBL could impose a restraint period of up to 12 months and if PBL did so, Mr Alexander would have been entitled to be paid his net base salary and superannuation during the restraint period).
Termination
– by the Senior Executive 12 months’ notice (previously 6 months’ notice).
– by Crown 12 months’ notice without cause; one months’ notice for performance issues (following three months’ notice to improve); three months’ notice due to incapacity. (Previously 12 months’ notice without cause; six months’ notice for performance issues without an opportunity to improve provided; three months’ notice for performance issues where at least three months’ opportunity to improve provided; one months’ notice for incapacity where absent for 16 weeks in any 12-month period).
Termination benefits Nil.
Payments made prior to commencement
Nil.
Directors’ Fees Nil.
Other The terms of the Executive Share Plan to which Mr Alexander is a member have been altered during the previous financial year. A summary of the amendments and details of Mr Alexanders’s participation is set out on page 37.
p . 42
REMUNERATION REPORT CONTINUED
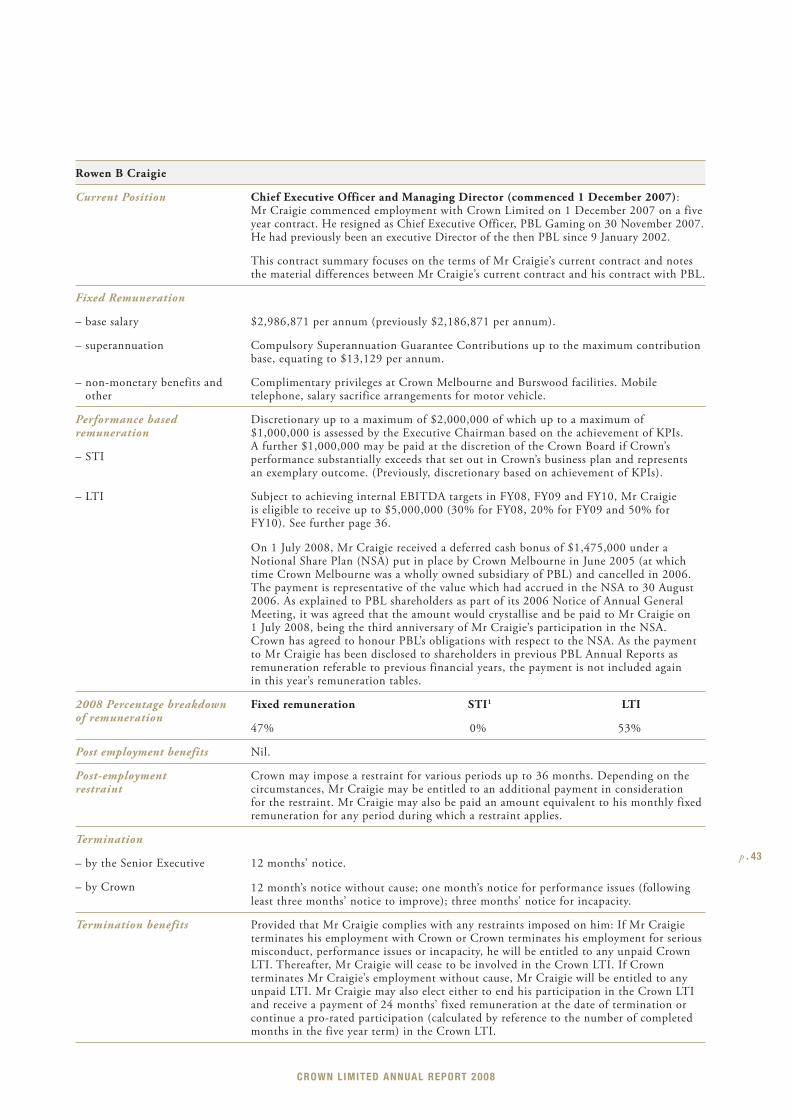
Rowen B Craigie
Current Position Chief Executive Officer and Managing Director (commenced 1 December 2007): Mr Craigie commenced employment with Crown Limited on 1 December 2007 on a five year contract. He resigned as Chief Executive Officer, PBL Gaming on 30 November 2007. He had previously been an executive Director of the then PBL since 9 January 2002.
This contract summary focuses on the terms of Mr Craigie’s current contract and notes the material differences between Mr Craigie’s current contract and his contract with PBL.
Fixed Remuneration
– base salary $2,986,871 per annum (previously $2,186,871 per annum).
– superannuation Compulsory Superannuation Guarantee Contributions up to the maximum contribution base, equating to $13,129 per annum.
– non-monetary benefits and other
Complimentary privileges at Crown Melbourne and Burswood facilities. Mobile telephone, salary sacrifice arrangements for motor vehicle.
Performance based remuneration
Discretionary up to a maximum of $2,000,000 of which up to a maximum of $1,000,000 is assessed by the Executive Chairman based on the achievement of KPIs. A further $1,000,000 may be paid at the discretion of the Crown Board if Crown’s performance substantially exceeds that set out in Crown’s business plan and represents an exemplary outcome. (Previously, discretionary based on achievement of KPIs).
– STI
– LTI Subject to achieving internal EBITDA targets in FY08, FY09 and FY10, Mr Craigie is eligible to receive up to $5,000,000 (30% for FY08, 20% for FY09 and 50% for FY10). See further page 36.
On 1 July 2008, Mr Craigie received a deferred cash bonus of $1,475,000 under a Notional Share Plan (NSA) put in place by Crown Melbourne in June 2005 (at which time Crown Melbourne was a wholly owned subsidiary of PBL) and cancelled in 2006. The payment is representative of the value which had accrued in the NSA to 30 August 2006. As explained to PBL shareholders as part of its 2006 Notice of Annual General Meeting, it was agreed that the amount would crystallise and be paid to Mr Craigie on 1 July 2008, being the third anniversary of Mr Craigie’s participation in the NSA. Crown has agreed to honour PBL’s obligations with respect to the NSA. As the payment to Mr Craigie has been disclosed to shareholders in previous PBL Annual Reports as remuneration referable to previous financial years, the payment is not included again in this year’s remuneration tables.
2008 Percentage breakdown of remuneration
Fixed remuneration STI1 LTI
47% 0% 53%
Post employment benefits Nil.
Post-employment restraint
Crown may impose a restraint for various periods up to 36 months. Depending on the circumstances, Mr Craigie may be entitled to an additional payment in consideration for the restraint. Mr Craigie may also be paid an amount equivalent to his monthly fixed remuneration for any period during which a restraint applies.
Termination
– by the Senior Executive 12 months’ notice.
12 month’s notice without cause; one month’s notice for performance issues (following least three months’ notice to improve); three months’ notice for incapacity.
– by Crown
Termination benefits Provided that Mr Craigie complies with any restraints imposed on him: If Mr Craigie terminates his employment with Crown or Crown terminates his employment for serious misconduct, performance issues or incapacity, he will be entitled to any unpaid Crown LTI. Thereafter, Mr Craigie will cease to be involved in the Crown LTI. If Crown terminates Mr Craigie’s employment without cause, Mr Craigie will be entitled to any unpaid LTI. Mr Craigie may also elect either to end his participation in the Crown LTI and receive a payment of 24 months’ fixed remuneration at the date of termination or continue a pro-rated participation (calculated by reference to the number of completed months in the five year term) in the Crown LTI.
p . 43
CROWN LIMITED ANNUAL REPORT 2008
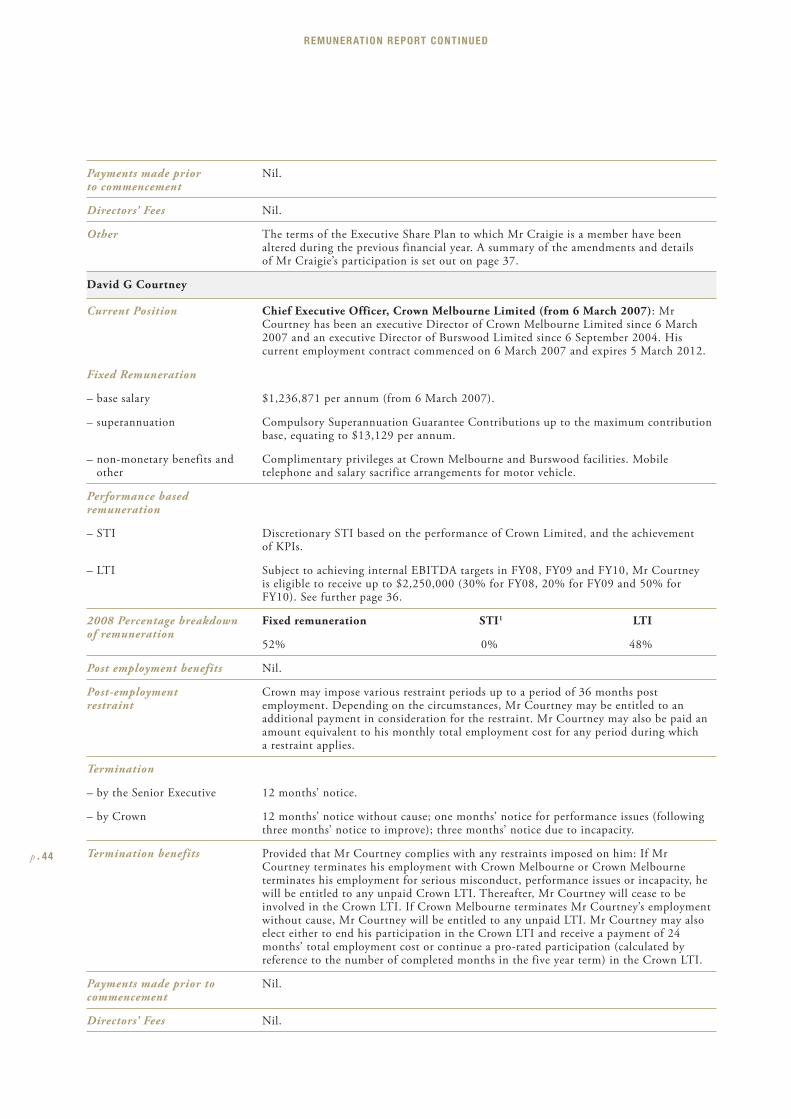
Payments made prior to commencement
Nil.
Directors’ Fees Nil.
Other The terms of the Executive Share Plan to which Mr Craigie is a member have been altered during the previous financial year. A summary of the amendments and details of Mr Craigie’s participation is set out on page 37.
David G Courtney
Current Position Chief Executive Officer, Crown Melbourne Limited (from 6 March 2007): Mr Courtney has been an executive Director of Crown Melbourne Limited since 6 March 2007 and an executive Director of Burswood Limited since 6 September 2004. His current employment contract commenced on 6 March 2007 and expires 5 March 2012.
Fixed Remuneration
– base salary $1,236,871 per annum (from 6 March 2007).
– superannuation Compulsory Superannuation Guarantee Contributions up to the maximum contribution base, equating to $13,129 per annum.
– non-monetary benefits and other
Complimentary privileges at Crown Melbourne and Burswood facilities. Mobile telephone and salary sacrifice arrangements for motor vehicle.
Performance based remuneration
– STI Discretionary STI based on the performance of Crown Limited, and the achievement of KPIs.
– LTI Subject to achieving internal EBITDA targets in FY08, FY09 and FY10, Mr Courtney is eligible to receive up to $2,250,000 (30% for FY08, 20% for FY09 and 50% for FY10). See further page 36.
2008 Percentage breakdown of remuneration
Fixed remuneration STI1 LTI
52% 0% 48%
Post employment benefits Nil.
Post-employment restraint
Crown may impose various restraint periods up to a period of 36 months post employment. Depending on the circumstances, Mr Courtney may be entitled to an additional payment in consideration for the restraint. Mr Courtney may also be paid an amount equivalent to his monthly total employment cost for any period during which a restraint applies.
Termination
– by the Senior Executive 12 months’ notice.
– by Crown 12 months’ notice without cause; one months’ notice for performance issues (following three months’ notice to improve); three months’ notice due to incapacity.
Termination benefits Provided that Mr Courtney complies with any restraints imposed on him: If Mr Courtney terminates his employment with Crown Melbourne or Crown Melbourne terminates his employment for serious misconduct, performance issues or incapacity, he will be entitled to any unpaid Crown LTI. Thereafter, Mr Courtney will cease to be involved in the Crown LTI. If Crown Melbourne terminates Mr Courtney’s employment without cause, Mr Courtney will be entitled to any unpaid LTI. Mr Courtney may also elect either to end his participation in the Crown LTI and receive a payment of 24 months’ total employment cost or continue a pro-rated participation (calculated by reference to the number of completed months in the five year term) in the Crown LTI.
Payments made prior to commencement
Nil.
Directors’ Fees Nil.
p . 44
REMUNERATION REPORT CONTINUED
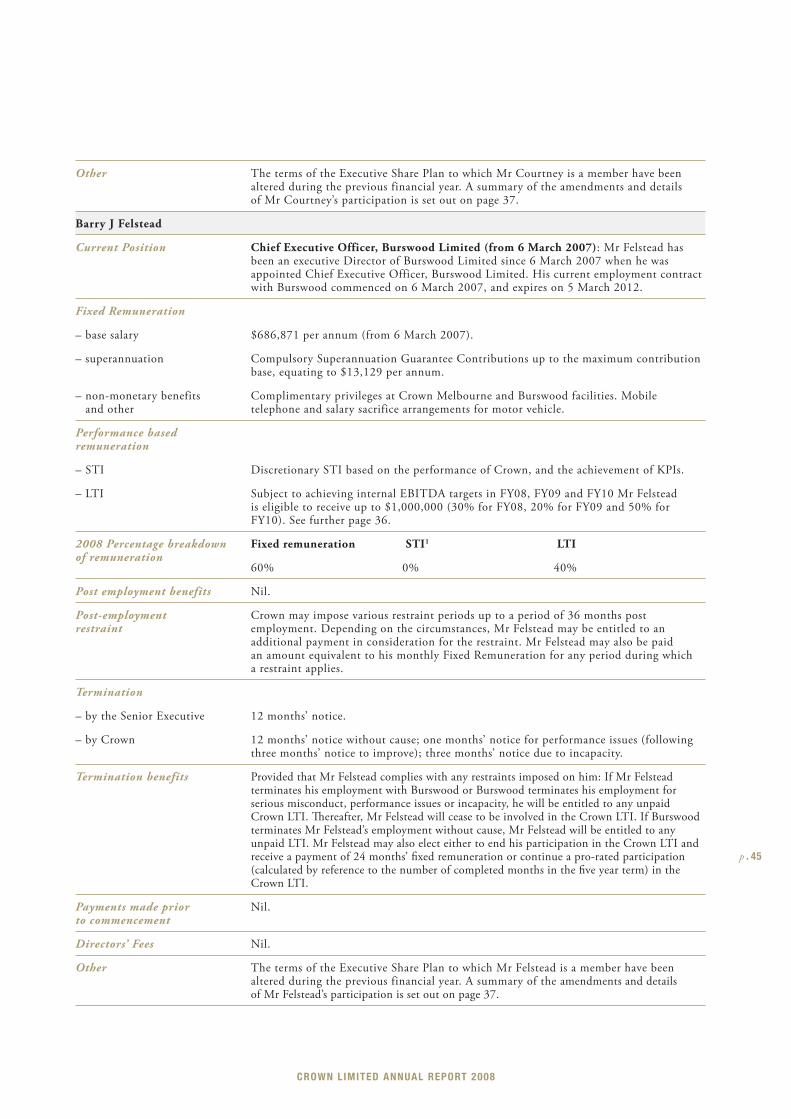
Other The terms of the Executive Share Plan to which Mr Courtney is a member have been altered during the previous financial year. A summary of the amendments and details of Mr Courtney’s participation is set out on page 37.
Barry J Felstead
Current Position Chief Executive Officer, Burswood Limited (from 6 March 2007): Mr Felstead has been an executive Director of Burswood Limited since 6 March 2007 when he was appointed Chief Executive Officer, Burswood Limited. His current employment contract with Burswood commenced on 6 March 2007, and expires on 5 March 2012.
Fixed Remuneration
– base salary $686,871 per annum (from 6 March 2007).
– superannuation Compulsory Superannuation Guarantee Contributions up to the maximum contribution base, equating to $13,129 per annum.
– non-monetary benefits and other
Complimentary privileges at Crown Melbourne and Burswood facilities. Mobile telephone and salary sacrifice arrangements for motor vehicle.
Performance based remuneration
– STI Discretionary STI based on the performance of Crown, and the achievement of KPIs.
– LTI Subject to achieving internal EBITDA targets in FY08, FY09 and FY10 Mr Felstead is eligible to receive up to $1,000,000 (30% for FY08, 20% for FY09 and 50% for FY10). See further page 36.
2008 Percentage breakdown of remuneration
Fixed remuneration STI1 LTI
60% 0% 40%
Post employment benefits Nil.
Post-employment restraint
Crown may impose various restraint periods up to a period of 36 months post employment. Depending on the circumstances, Mr Felstead may be entitled to an additional payment in consideration for the restraint. Mr Felstead may also be paid an amount equivalent to his monthly Fixed Remuneration for any period during which a restraint applies.
Termination
– by the Senior Executive 12 months’ notice.
– by Crown 12 months’ notice without cause; one months’ notice for performance issues (following three months’ notice to improve); three months’ notice due to incapacity.
Termination benefits Provided that Mr Felstead complies with any restraints imposed on him: If Mr Felstead terminates his employment with Burswood or Burswood terminates his employment for serious misconduct, performance issues or incapacity, he will be entitled to any unpaid Crown LTI. Th ereafter, Mr Felstead will cease to be involved in the Crown LTI. If Burswood terminates Mr Felstead’s employment without cause, Mr Felstead will be entitled to any unpaid LTI. Mr Felstead may also elect either to end his participation in the Crown LTI and receive a payment of 24 months’ fi xed remuneration or continue a pro-rated participation (calculated by reference to the number of completed months in the fi ve year term) in the Crown LTI.
Payments made prior to commencement
Nil.
Directors’ Fees Nil.
Other The terms of the Executive Share Plan to which Mr Felstead is a member have been altered during the previous financial year. A summary of the amendments and details of Mr Felstead’s participation is set out on page 37.
p . 45
CROWN LIMITED ANNUAL REPORT 2008
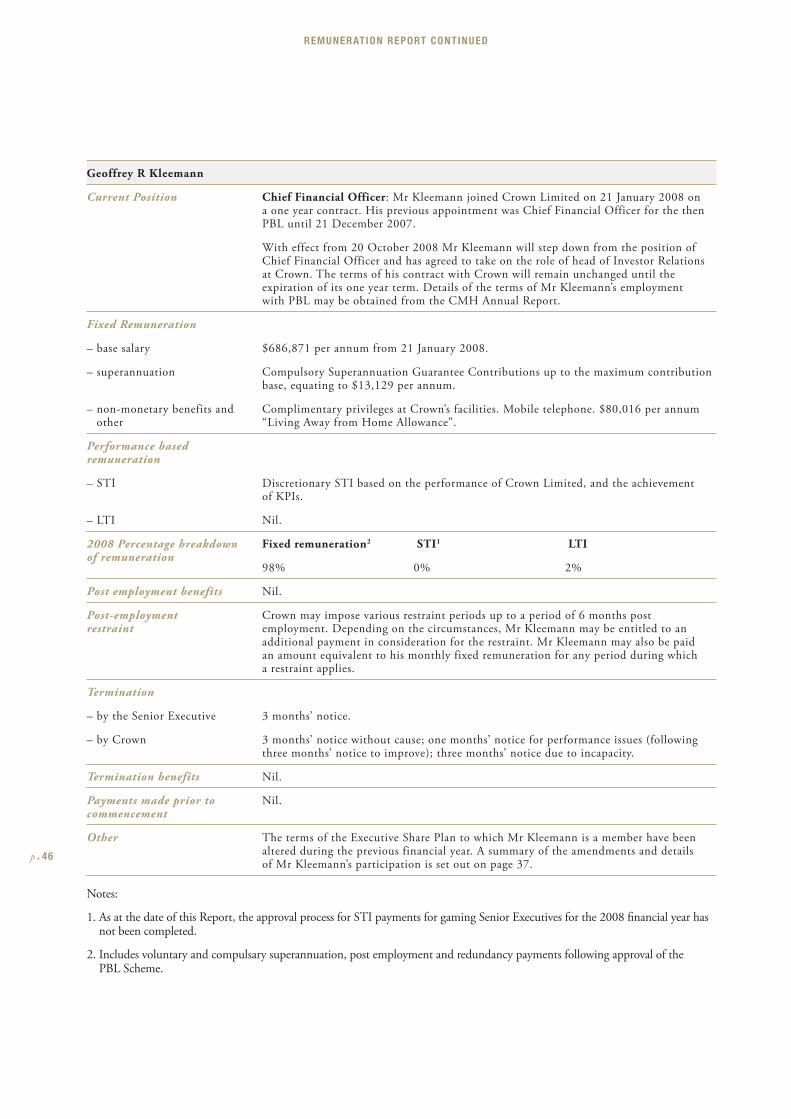
Geoffrey R Kleemann
Current Position Chief Financial Officer: Mr Kleemann joined Crown Limited on 21 January 2008 on a one year contract. His previous appointment was Chief Financial Officer for the then PBL until 21 December 2007.
With effect from 20 October 2008 Mr Kleemann will step down from the position of Chief Financial Officer and has agreed to take on the role of head of Investor Relations at Crown. The terms of his contract with Crown will remain unchanged until the expiration of its one year term. Details of the terms of Mr Kleemann’s employment with PBL may be obtained from the CMH Annual Report.
Fixed Remuneration
– base salary $686,871 per annum from 21 January 2008.
– superannuation Compulsory Superannuation Guarantee Contributions up to the maximum contribution base, equating to $13,129 per annum.
– non-monetary benefits and other
Complimentary privileges at Crown’s facilities. Mobile telephone. $80,016 per annum “Living Away from Home Allowance”.
Performance based remuneration
– STI Discretionary STI based on the performance of Crown Limited, and the achievement of KPIs.
– LTI Nil.
2008 Percentage breakdown of remuneration
Fixed remuneration2 STI1 LTI
98% 0% 2%
Post employment benefits Nil.
Post-employment restraint
Crown may impose various restraint periods up to a period of 6 months post employment. Depending on the circumstances, Mr Kleemann may be entitled to an additional payment in consideration for the restraint. Mr Kleemann may also be paid an amount equivalent to his monthly fixed remuneration for any period during which a restraint applies.
Termination
– by the Senior Executive 3 months’ notice.
– by Crown 3 months’ notice without cause; one months’ notice for performance issues (following three months’ notice to improve); three months’ notice due to incapacity.
Termination benefits Nil.
Payments made prior to commencement
Nil.
Other The terms of the Executive Share Plan to which Mr Kleemann is a member have been altered during the previous financial year. A summary of the amendments and details of Mr Kleemann’s participation is set out on page 37.
Notes:
1. As at the date of this Report, the approval process for STI payments for gaming Senior Executives for the 2008 fi nancial year has not been completed.
2. Includes voluntary and compulsary superannuation, post employment and redundancy payments following approval of the PBL Scheme.
p . 46
REMUNERATION REPORT CONTINUED
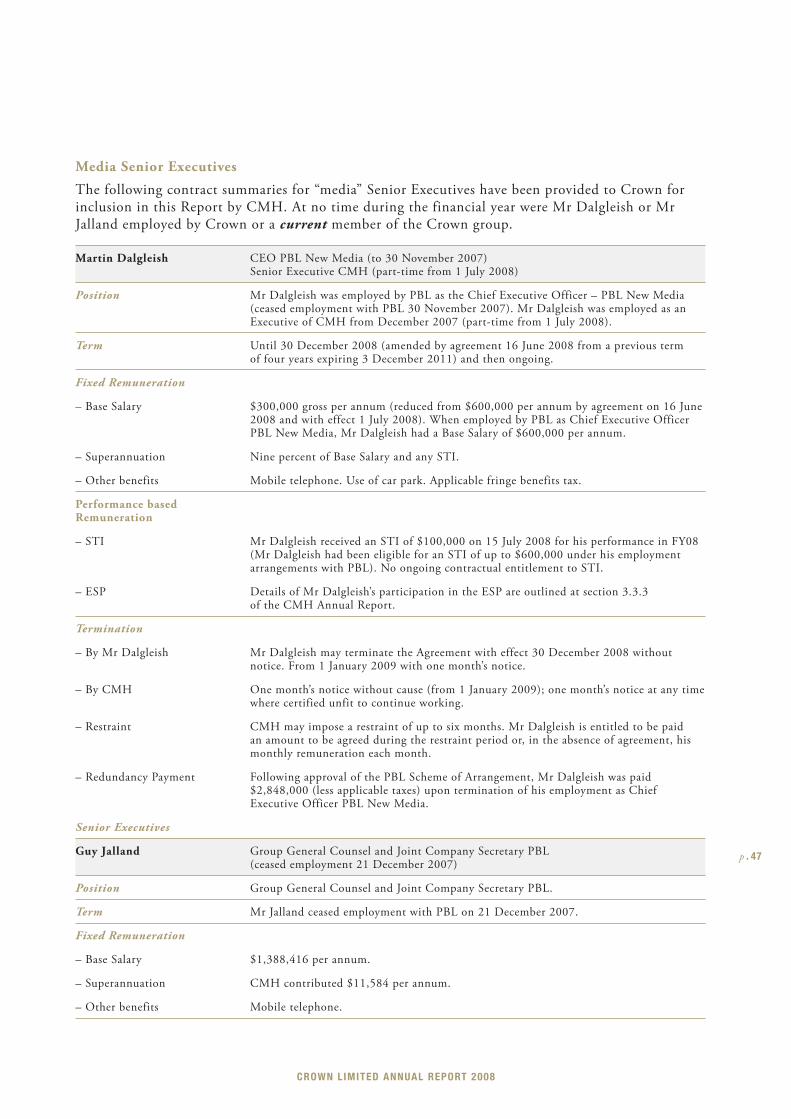
Media Senior Executives
The following contract summaries for “media” Senior Executives have been provided to Crown for inclusion in this Report by CMH. At no time during the financial year were Mr Dalgleish or Mr Jalland employed by Crown or a current member of the Crown group.
Martin Dalgleish CEO PBL New Media (to 30 November 2007) Senior Executive CMH (part-time from 1 July 2008)
Position Mr Dalgleish was employed by PBL as the Chief Executive Officer – PBL New Media (ceased employment with PBL 30 November 2007). Mr Dalgleish was employed as an Executive of CMH from December 2007 (part-time from 1 July 2008).
Term Until 30 December 2008 (amended by agreement 16 June 2008 from a previous term of four years expiring 3 December 2011) and then ongoing.
Fixed Remuneration
– Base Salary $300,000 gross per annum (reduced from $600,000 per annum by agreement on 16 June 2008 and with effect 1 July 2008). When employed by PBL as Chief Executive Officer PBL New Media, Mr Dalgleish had a Base Salary of $600,000 per annum.
– Superannuation Nine percent of Base Salary and any STI.
– Other benefits Mobile telephone. Use of car park. Applicable fringe benefits tax.
Performance based Remuneration
– STI Mr Dalgleish received an STI of $100,000 on 15 July 2008 for his performance in FY08 (Mr Dalgleish had been eligible for an STI of up to $600,000 under his employment arrangements with PBL). No ongoing contractual entitlement to STI.
– ESP Details of Mr Dalgleish’s participation in the ESP are outlined at section 3.3.3 of the CMH Annual Report.
Termination
– By Mr Dalgleish Mr Dalgleish may terminate the Agreement with effect 30 December 2008 without notice. From 1 January 2009 with one month’s notice.
– By CMH One month’s notice without cause (from 1 January 2009); one month’s notice at any time where certified unfit to continue working.
– Restraint CMH may impose a restraint of up to six months. Mr Dalgleish is entitled to be paid an amount to be agreed during the restraint period or, in the absence of agreement, his monthly remuneration each month.
– Redundancy Payment Following approval of the PBL Scheme of Arrangement, Mr Dalgleish was paid $2,848,000 (less applicable taxes) upon termination of his employment as Chief Executive Officer PBL New Media.
Senior Executives
Guy Jalland Group General Counsel and Joint Company Secretary PBL(ceased employment 21 December 2007)
Position Group General Counsel and Joint Company Secretary PBL.
Term Mr Jalland ceased employment with PBL on 21 December 2007.
Fixed Remuneration
– Base Salary $1,388,416 per annum.
– Superannuation CMH contributed $11,584 per annum.
– Other benefits Mobile telephone.
p . 47
CROWN LIMITED ANNUAL REPORT 2008
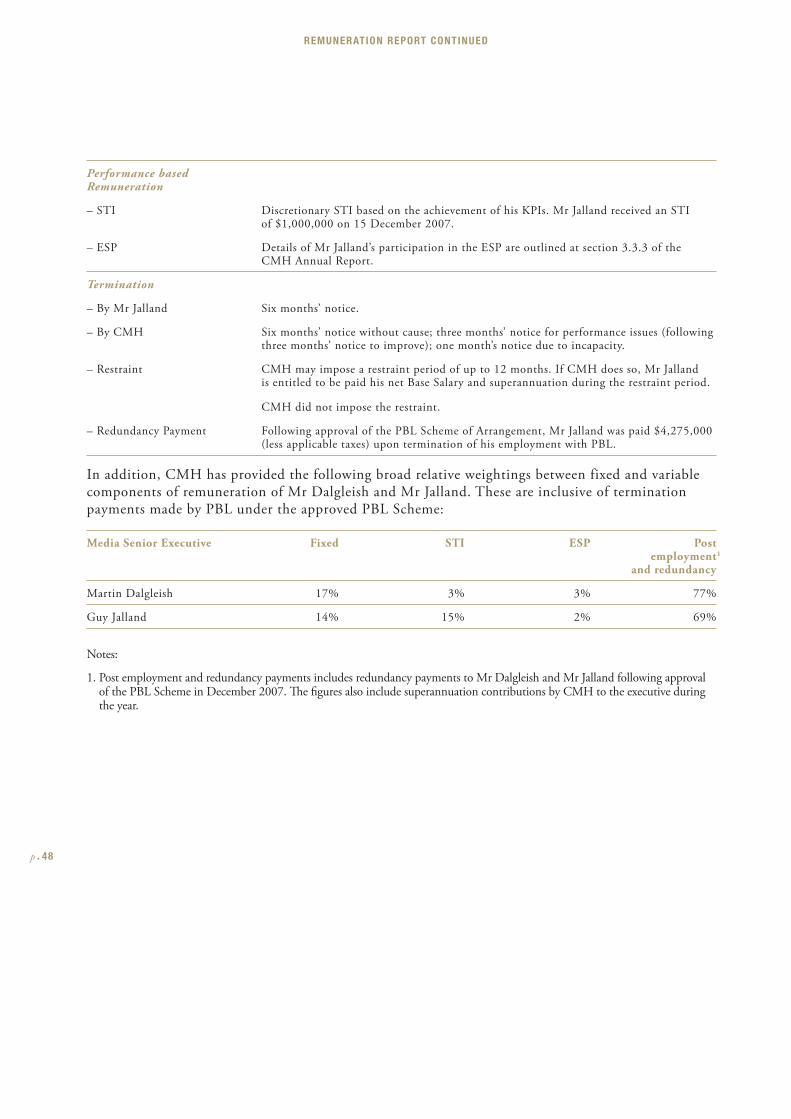
Performance based Remuneration
– STI Discretionary STI based on the achievement of his KPIs. Mr Jalland received an STI of $1,000,000 on 15 December 2007.
– ESP Details of Mr Jalland’s participation in the ESP are outlined at section 3.3.3 of the CMH Annual Report.
Termination
– By Mr Jalland Six months’ notice.
– By CMH Six months’ notice without cause; three months’ notice for performance issues (following three months’ notice to improve); one month’s notice due to incapacity.
– Restraint CMH may impose a restraint period of up to 12 months. If CMH does so, Mr Jalland is entitled to be paid his net Base Salary and superannuation during the restraint period.
CMH did not impose the restraint.
– Redundancy Payment Following approval of the PBL Scheme of Arrangement, Mr Jalland was paid $4,275,000 (less applicable taxes) upon termination of his employment with PBL.
In addition, CMH has provided the following broad relative weightings between fixed and variable components of remuneration of Mr Dalgleish and Mr Jalland. These are inclusive of termination payments made by PBL under the approved PBL Scheme:
Media Senior Executive Fixed STI ESP Postemployment
and redundancy
Martin Dalgleish 17% 3% 3% 77%
Guy Jalland 14% 15% 2% 69%
Notes:
1. Post employment and redundancy payments includes redundancy payments to Mr Dalgleish and Mr Jalland following approval of the PBL Scheme in December 2007. Th e fi gures also include superannuation contributions by CMH to the executive during the year.
1
p . 48
REMUNERATION REPORT CONTINUED
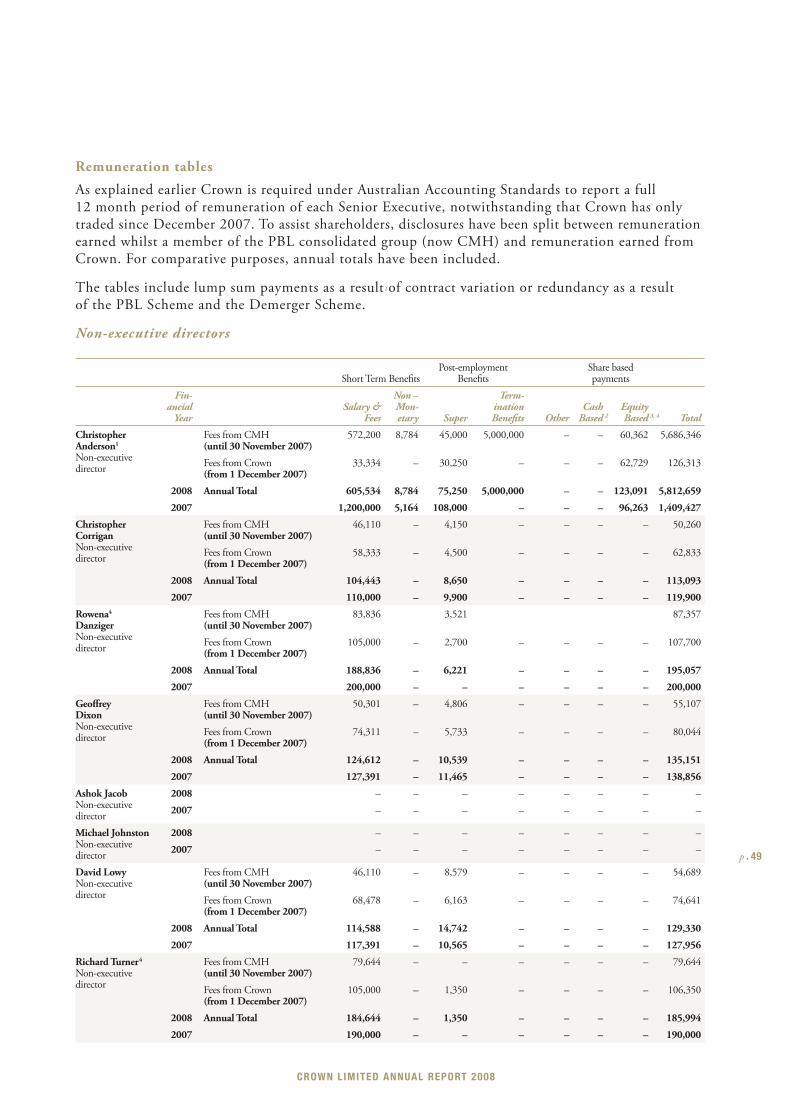
Remuneration tables
As explained earlier Crown is required under Australian Accounting Standards to report a full 12 month period of remuneration of each Senior Executive, notwithstanding that Crown has only traded since December 2007. To assist shareholders, disclosures have been split between remuneration earned whilst a member of the PBL consolidated group (now CMH) and remuneration earned from Crown. For comparative purposes, annual totals have been included.
The tables include lump sum payments as a result of contract variation or redundancy as a result of the PBL Scheme and the Demerger Scheme.
Non-executive directors
Short Term Benefi tsPost-employment
Benefi tsShare based payments
Fin-ancial
YearSalary &
Fees
Non –Mon-etary Super
Term-ination Benefi ts Other
CashBased
EquityBased Total
Christopher Anderson1
Non-executive director
Fees from CMH(until 30 November 2007)
572,200 8,784 45,000 5,000,000 – – 60,362 5,686,346
Fees from Crown(from 1 December 2007)
33,334 – 30,250 – – – 62,729 126,313
2008 Annual Total 605,534 8,784 75,250 5,000,000 – – 123,091 5,812,659
2007 1,200,000 5,164 108,000 – – – 96,263 1,409,427
Christopher Corrigan Non-executive director
Fees from CMH(until 30 November 2007)
46,110 – 4,150 – – – – 50,260
Fees from Crown(from 1 December 2007)
58,333 – 4,500 – – – – 62,833
2008 Annual Total 104,443 – 8,650 – – – – 113,093
2007 110,000 – 9,900 – – – – 119,900
Rowena4 DanzigerNon-executive director
Fees from CMH(until 30 November 2007)
83,836 3,521 87,357
Fees from Crown(from 1 December 2007)
105,000 – 2,700 – – – – 107,700
2008 Annual Total 188,836 – 6,221 – – – – 195,057
2007 200,000 – – – – – – 200,000
Geoff rey DixonNon-executive director
Fees from CMH(until 30 November 2007)
50,301 – 4,806 – – – – 55,107
Fees from Crown(from 1 December 2007)
74,311 – 5,733 – – – – 80,044
2008 Annual Total 124,612 – 10,539 – – – – 135,151
2007 127,391 – 11,465 – – – – 138,856
Ashok JacobNon-executive director
2008 – – – – – – – –
2007 – – – – – – – –
Michael JohnstonNon-executive director
2008 – – – – – – – –
2007 – – – – – – – –
David Lowy Non-executive director
Fees from CMH(until 30 November 2007)
46,110 – 8,579 – – – – 54,689
Fees from Crown(from 1 December 2007)
68,478 – 6,163 – – – – 74,641
2008 Annual Total 114,588 – 14,742 – – – – 129,330
2007 117,391 – 10,565 – – – – 127,956
Richard Turner4
Non-executive director
Fees from CMH(until 30 November 2007)
79,644 – – – – – – 79,644
Fees from Crown(from 1 December 2007)
105,000 – 1,350 – – – – 106,350
2008 Annual Total 184,644 – 1,350 – – – – 185,994
2007 190,000 – – – – – – 190,000
2 3, 4
1
p . 49
CROWN LIMITED ANNUAL REPORT 2008
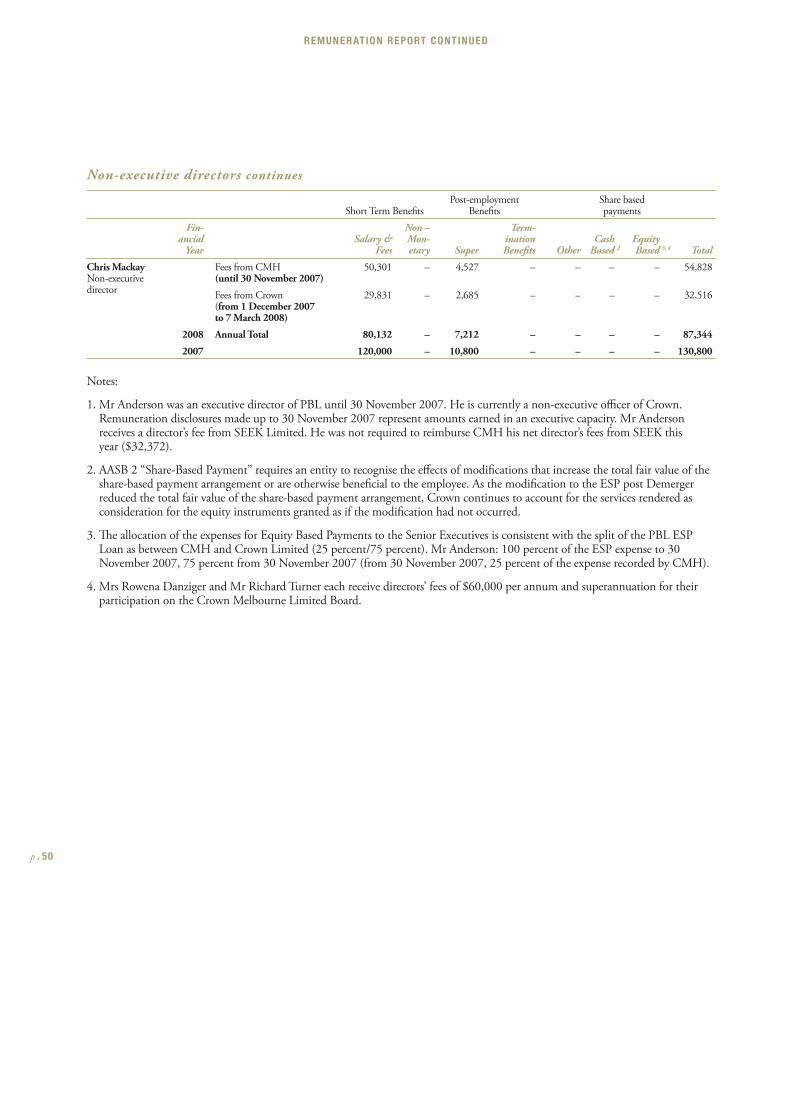
Non-executive directors continues
Short Term Benefi tsPost-employment
Benefi tsShare based payments
Fin-ancial
YearSalary &
Fees
Non –Mon-etary Super
Term-ination Benefi ts Other
CashBased
EquityBased Total
Chris MackayNon-executive director
Fees from CMH(until 30 November 2007)
50,301 – 4,527 – – – – 54,828
Fees from Crown(from 1 December 2007 to 7 March 2008)
29,831 – 2,685 – – – – 32,516
2008 Annual Total 80,132 – 7,212 – – – – 87,344
2007 120,000 – 10,800 – – – – 130,800
Notes:
1. Mr Anderson was an executive director of PBL until 30 November 2007. He is currently a non-executive offi cer of Crown. Remuneration disclosures made up to 30 November 2007 represent amounts earned in an executive capacity. Mr Anderson receives a director’s fee from SEEK Limited. He was not required to reimburse CMH his net director’s fees from SEEK this year ($32,372).
2. AASB 2 “Share-Based Payment” requires an entity to recognise the eff ects of modifi cations that increase the total fair value of the share-based payment arrangement or are otherwise benefi cial to the employee. As the modifi cation to the ESP post Demerger reduced the total fair value of the share-based payment arrangement, Crown continues to account for the services rendered as consideration for the equity instruments granted as if the modifi cation had not occurred.
3. Th e allocation of the expenses for Equity Based Payments to the Senior Executives is consistent with the split of the PBL ESP Loan as between CMH and Crown Limited (25 percent/75 percent). Mr Anderson: 100 percent of the ESP expense to 30 November 2007, 75 percent from 30 November 2007 (from 30 November 2007, 25 percent of the expense recorded by CMH).
4. Mrs Rowena Danziger and Mr Richard Turner each receive directors’ fees of $60,000 per annum and superannuation for their participation on the Crown Melbourne Limited Board.
2 3, 4
p . 50
REMUNERATION REPORT CONTINUED
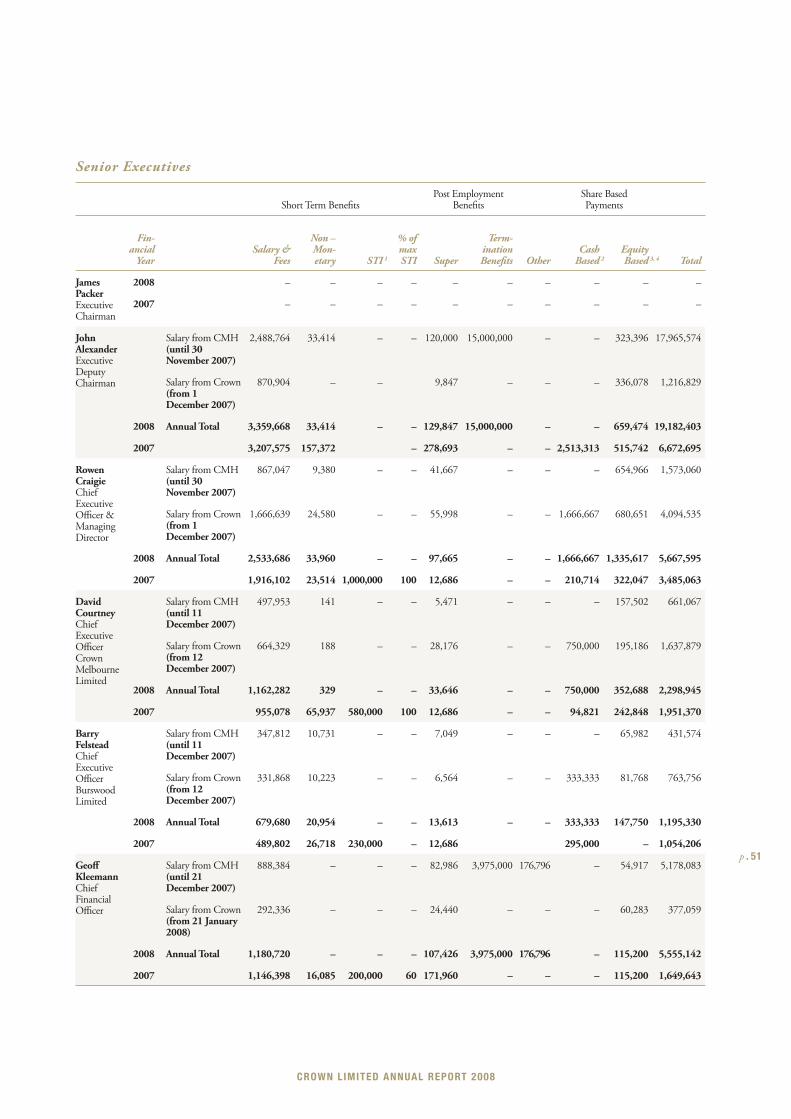
Senior Executives
Short Term Benefi tsPost Employment
Benefi tsShare Based Payments
Fin-ancial
YearSalary &
Fees
Non –Mon-etary STI
% of max STI Super
Term-ination Benefi ts Other
CashBased
EquityBased Total
James Packer Executive Chairman
2008 – – – – – – – – – –
2007 – – – – – – – – – –
John Alexander Executive Deputy Chairman
Salary from CMH(until 30 November 2007)
2,488,764 33,414 – – 120,000 15,000,000 – – 323,396 17,965,574
Salary from Crown(from 1 December 2007)
870,904 – – 9,847 – – – 336,078 1,216,829
2008 Annual Total 3,359,668 33,414 – – 129,847 15,000,000 – – 659,474 19,182,403
2007 3,207,575 157,372 – 278,693 – – 2,513,313 515,742 6,672,695
Rowen Craigie Chief Executive Offi cer & Managing Director
Salary from CMH(until 30 November 2007)
867,047 9,380 – – 41,667 – – – 654,966 1,573,060
Salary from Crown(from 1 December 2007)
1,666,639 24,580 – – 55,998 – – 1,666,667 680,651 4,094,535
2008 Annual Total 2,533,686 33,960 – – 97,665 – – 1,666,667 1,335,617 5,667,595
2007 1,916,102 23,514 1,000,000 100 12,686 – – 210,714 322,047 3,485,063
David Courtney Chief Executive Offi cer Crown Melbourne Limited
Salary from CMH(until 11 December 2007)
497,953 141 – – 5,471 – – – 157,502 661,067
Salary from Crown(from 12 December 2007)
664,329 188 – – 28,176 – – 750,000 195,186 1,637,879
2008 Annual Total 1,162,282 329 – – 33,646 – – 750,000 352,688 2,298,945
2007 955,078 65,937 580,000 100 12,686 – – 94,821 242,848 1,951,370
Barry Felstead Chief Executive Offi cer Burswood Limited
Salary from CMH(until 11 December 2007)
347,812 10,731 – – 7,049 – – – 65,982 431,574
Salary from Crown(from 12 December 2007)
331,868 10,223 – – 6,564 – – 333,333 81,768 763,756
2008 Annual Total 679,680 20,954 – – 13,613 – – 333,333 147,750 1,195,330
2007 489,802 26,718 230,000 – 12,686 295,000 – 1,054,206
Geoff Kleemann Chief Financial Offi cer
Salary from CMH(until 21 December 2007)
888,384 – – – 82,986 3,975,000 176,796 – 54,917 5,178,083
Salary from Crown(from 21 January 2008)
292,336 – – – 24,440 – – – 60,283 377,059
2008 Annual Total 1,180,720 – – – 107,426 3,975,000 176,796 – 115,200 5,555,142
2007 1,146,398 16,085 200,000 60 171,960 – – – 115,200 1,649,643
2 3, 41
p . 51
CROWN LIMITED ANNUAL REPORT 2008
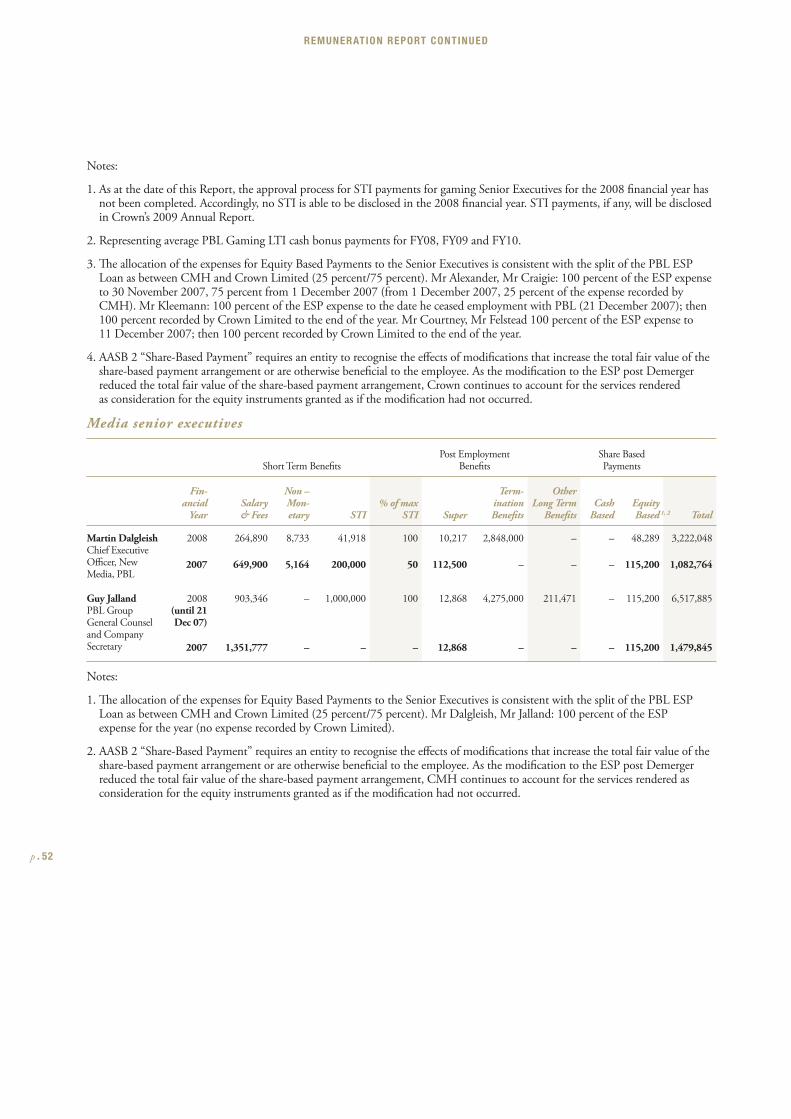
Notes:
1. As at the date of this Report, the approval process for STI payments for gaming Senior Executives for the 2008 fi nancial year has not been completed. Accordingly, no STI is able to be disclosed in the 2008 fi nancial year. STI payments, if any, will be disclosed in Crown’s 2009 Annual Report.
2. Representing average PBL Gaming LTI cash bonus payments for FY08, FY09 and FY10.
3. Th e allocation of the expenses for Equity Based Payments to the Senior Executives is consistent with the split of the PBL ESP Loan as between CMH and Crown Limited (25 percent/75 percent). Mr Alexander, Mr Craigie: 100 percent of the ESP expense to 30 November 2007, 75 percent from 1 December 2007 (from 1 December 2007, 25 percent of the expense recorded by CMH). Mr Kleemann: 100 percent of the ESP expense to the date he ceased employment with PBL (21 December 2007); then 100 percent recorded by Crown Limited to the end of the year. Mr Courtney, Mr Felstead 100 percent of the ESP expense to 11 December 2007; then 100 percent recorded by Crown Limited to the end of the year.
4. AASB 2 “Share-Based Payment” requires an entity to recognise the eff ects of modifi cations that increase the total fair value of the share-based payment arrangement or are otherwise benefi cial to the employee. As the modifi cation to the ESP post Demerger reduced the total fair value of the share-based payment arrangement, Crown continues to account for the services rendered as consideration for the equity instruments granted as if the modifi cation had not occurred.
Media senior executives
Short Term Benefi tsPost Employment
Benefi tsShare Based Payments
Fin-ancial
YearSalary & Fees
Non –Mon-etary STI
% of max STI Super
Term-ination Benefi ts
Other Long Term
Benefi tsCash
Based Equity
Based Total
Martin DalgleishChief Executive Offi cer, New Media, PBL
2008 264,890 8,733 41,918 100 10,217 2,848,000 – – 48,289 3,222,048
2007 649,900 5,164 200,000 50 112,500 – – – 115,200 1,082,764
Guy JallandPBL Group General Counsel and Company Secretary
2008(until 21 Dec 07)
903,346 – 1,000,000 100 12,868 4,275,000 211,471 – 115,200 6,517,885
2007 1,351,777 – – – 12,868 – – – 115,200 1,479,845
Notes:
1. Th e allocation of the expenses for Equity Based Payments to the Senior Executives is consistent with the split of the PBL ESP Loan as between CMH and Crown Limited (25 percent/75 percent). Mr Dalgleish, Mr Jalland: 100 percent of the ESP expense for the year (no expense recorded by Crown Limited).
2. AASB 2 “Share-Based Payment” requires an entity to recognise the eff ects of modifi cations that increase the total fair value of the share-based payment arrangement or are otherwise benefi cial to the employee. As the modifi cation to the ESP post Demerger reduced the total fair value of the share-based payment arrangement, CMH continues to account for the services rendered as consideration for the equity instruments granted as if the modifi cation had not occurred.
1, 2
p . 52
REMUNERATION REPORT CONTINUED
Crown Limited was incorporated on 31 May 2007. On incorporation, the company’s name was Arterial Limited. The company changed its name to Crown Limited on 15 June 2007.
As previously mentioned, Crown was admitted to the official list of the ASX on 3 December 2007 (Listing) and has been subject to the ASX Listing Rules since that time. Accordingly, where the Corporations Act requires this Report to include specific information for listed entities, that information has been provided for Crown in respect of the period commencing from Listing.
Company Information
Review of operations
A review of operations of the Crown group for the financial year ended 30 June 2008 and the results of those operations is detailed on pages 4 to 23.
The principal activity of the entities within the Crown group is gaming and entertainment.
Prior to the PBL Scheme Crown’s business operated within the PBL group of companies. PBL’s activities extended to:
• television and broadcasting and program production;
• magazine publishing and distribution; and
• investment in the internet, subscription television and other media and entertainment sectors.
Significant changes in state of affairs
The PBL Scheme was effected on 10 December 2007. The gaming and entertainment activities of the current Crown group have only traded since that time. In accordance with Australian Accounting Standards and the Corporations Act, Crown’s 2008 Financial Report reflects the activities of the PBL group until the date the scheme of arrangement was effected and the activities of the newly formed Crown group from demerger until 30 June 2008. The results relating to the non gaming activities have been disclosed as discontinued operations.
Accordingly, the following are some of the significant changes in the state of affairs of the consolidated group since 1 July 2007:
• In September 2007, Melco Crown Entertainment Limited (MPEL) secured US$1.75 billion of senior secured debt facilities to be utilised to finance construction of the City of Dreams project. The facilities are non recourse to Crown. However, Crown and Melco International Development Limited (which currently owns 37.9% of MPEL along with Crown) have each provided a Letter of Credit for US$125 million which will be able to be used, if necessary, to support completion of the City of Dreams should the facilities and MPEL’s internally generated cash flow be insufficient to fund completion;
• In November 2007, MPEL issued American Depositary Shares to the public, raising approximately US$570 million for MPEL, and reducing Crown’s stake to 37.9%;
• In November 2007, Crown completed the acquisition of a 50% interest in Gateway Casinos and Entertainment Inc in Canada, under a joint venture with Macquarie Bank;
Directors’ Statutory Report
p . 53
CROWN LIMITED ANNUAL REPORT 2008
• On 3 December 2007, Crown was admitted to the official list of the ASX;
• On 12 December 2007, the separation of PBL into two separately listed companies was completed by way of two court ordered schemes of arrangement;
• In December 2007, Crown completed the sale of the PBL group’s interest in Hoyts. Beneficial ownership was transferred to Crown as part of the PBL Scheme and gross proceeds of sale of $150 million were received by Crown in mid December 2007. The equity profit and the loss on sale (after costs associated with the sale) have been included in discontinued businesses;
• In December 2007, Crown announced, subject to regulatory approval, its agreement to purchase 100% of Cannery Casino Resorts in the United States; and
• In April 2008 Crown announced that it had sold its 25.4% stake in Monarchy Enterprise Holdings B.V. (the owner of New Regency Productions) for US$189.4 million (including interest) which will be paid in broadly equal instalments over five years with Crown having already received the initial instalment.
Significant events after Balance Date
Subsequent to 30 June 2008, the directors of Crown announced a final dividend on ordinary shares in respect of the year ending 30 June 2008. The total amount of the dividend is $196.7 million, which represents 29 cents per share. The final dividend will be 40% franked and the unfranked component of the dividend will be conduit foreign income. The dividend has not been provided for in the 30 June 2008 financial statements.
On 13 August 2008, Crown announced that it had raised A$1.01 billion of new debt facilities. The refinancing was undertaken so as to extend the maturity profile of Crown’s debt portfolio. The new debt finance comprises the following new facilities:
A$600 million Syndicated Loan Facility
Lender(s): Fully syndicated among 11 Australian and International banks
Maturity: 5 years
A$200 million Bilateral Loan Facility
Lender: National Australia Bank
Maturity: 5 years
US$200 million US Private Placement
Arrangers: Bank of America and Royal Bank of Scotland as co lead arrangers with Westpac and Commonwealth Bank as co agents
Maturity: 7, 10 and 12 years
Likely developments
Other than the developments described in this Report and the accompanying review of operations, the directors are of the opinion that no other matter or circumstance will significantly affect the operations and expected results for the Crown group.
Environmental regulation
The Crown group is not subject to any particular or significant environmental regulation under Australian law. Environmental issues are, however, important to Crown and it has taken a number of initiatives in this regard. A description of those initiatives is set out on page 21.
p . 54
DIRECTORS’ STATUTORY REPORT CONTINUED
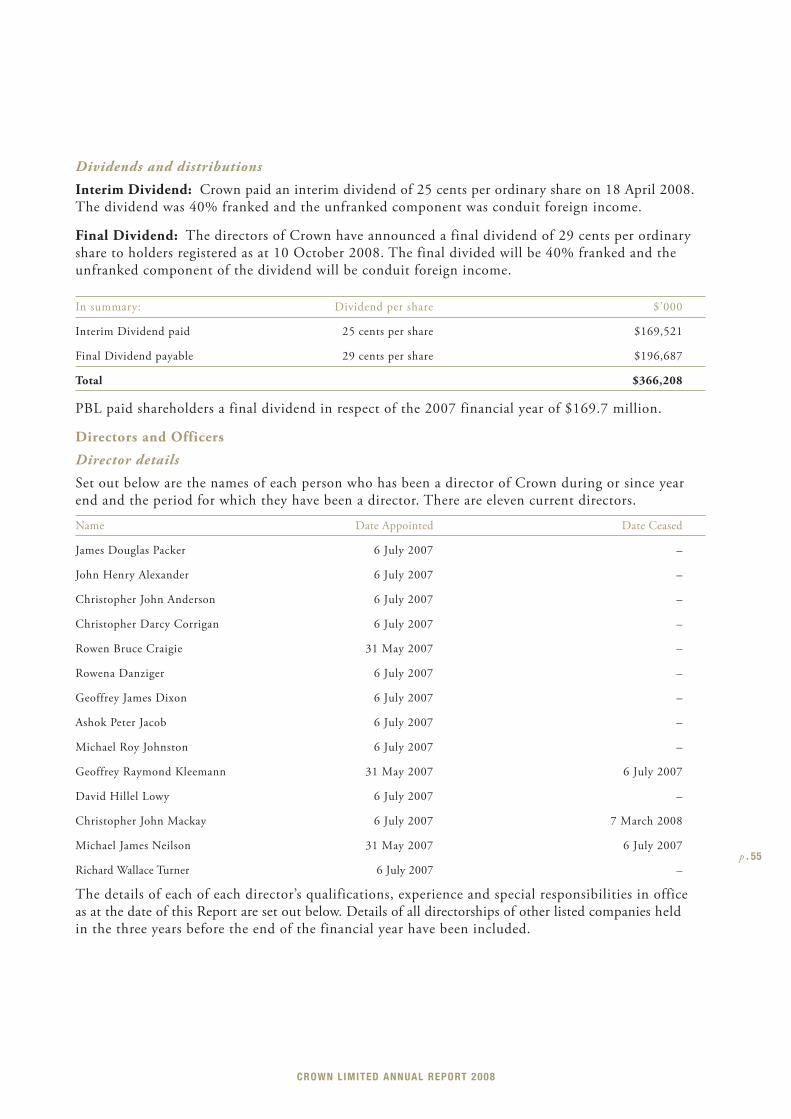
Dividends and distributions
Interim Dividend: Crown paid an interim dividend of 25 cents per ordinary share on 18 April 2008. The dividend was 40% franked and the unfranked component was conduit foreign income.
Final Dividend: The directors of Crown have announced a final dividend of 29 cents per ordinary share to holders registered as at 10 October 2008. The final divided will be 40% franked and the unfranked component of the dividend will be conduit foreign income.
In summary: Dividend per share $’000
Interim Dividend paid 25 cents per share $169,521
Final Dividend payable 29 cents per share $196,687
Total $366,208
PBL paid shareholders a final dividend in respect of the 2007 financial year of $169.7 million.
Directors and Officers
Director details
Set out below are the names of each person who has been a director of Crown during or since year end and the period for which they have been a director. There are eleven current directors.
Name Date Appointed Date Ceased
James Douglas Packer 6 July 2007 –
John Henry Alexander 6 July 2007 –
Christopher John Anderson 6 July 2007 –
Christopher Darcy Corrigan 6 July 2007 –
Rowen Bruce Craigie 31 May 2007 –
Rowena Danziger 6 July 2007 –
Geoffrey James Dixon 6 July 2007 –
Ashok Peter Jacob 6 July 2007 –
Michael Roy Johnston 6 July 2007 –
Geoffrey Raymond Kleemann 31 May 2007 6 July 2007
David Hillel Lowy 6 July 2007 –
Christopher John Mackay 6 July 2007 7 March 2008
Michael James Neilson 31 May 2007 6 July 2007
Richard Wallace Turner 6 July 2007 –
The details of each of each director’s qualifications, experience and special responsibilities in office as at the date of this Report are set out below. Details of all directorships of other listed companies held in the three years before the end of the financial year have been included.
p . 55
CROWN LIMITED ANNUAL REPORT 2008
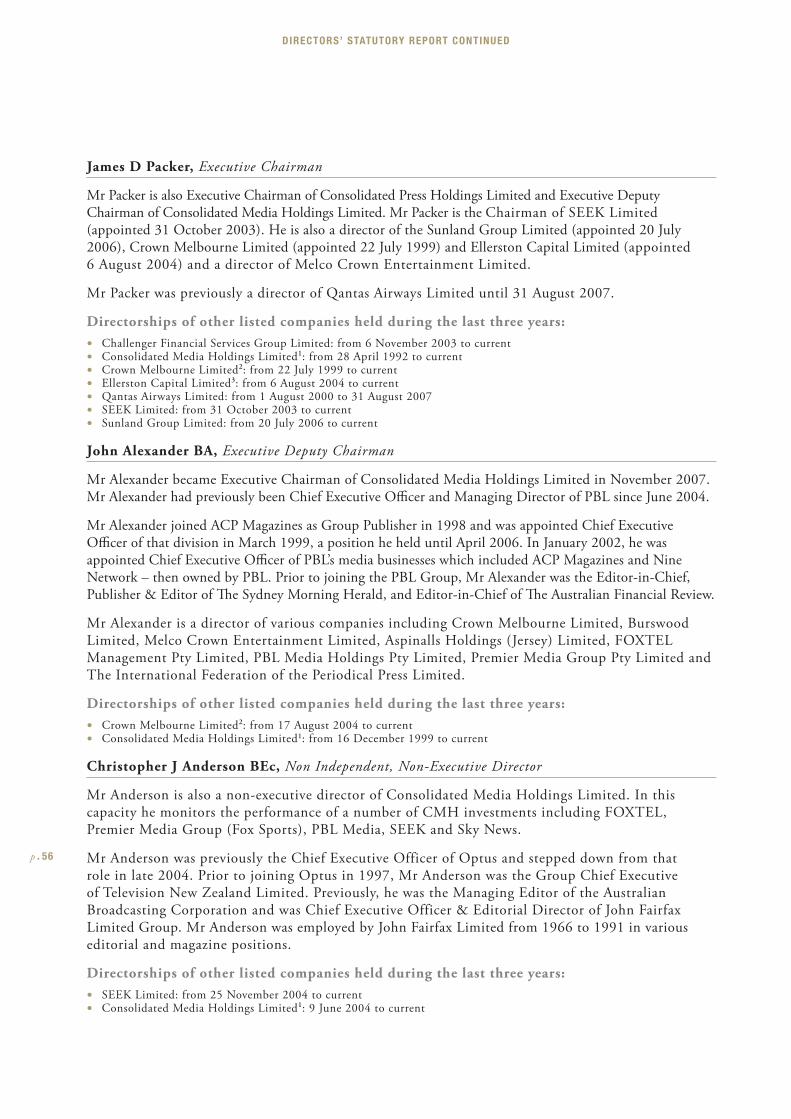
James D Packer, Executive Chairman
Mr Packer is also Executive Chairman of Consolidated Press Holdings Limited and Executive Deputy Chairman of Consolidated Media Holdings Limited. Mr Packer is the Chairman of SEEK Limited (appointed 31 October 2003). He is also a director of the Sunland Group Limited (appointed 20 July 2006), Crown Melbourne Limited (appointed 22 July 1999) and Ellerston Capital Limited (appointed 6 August 2004) and a director of Melco Crown Entertainment Limited.
Mr Packer was previously a director of Qantas Airways Limited until 31 August 2007.
Directorships of other listed companies held during the last three years:
• Challenger Financial Services Group Limited: from 6 November 2003 to current
• Consolidated Media Holdings Limited1: from 28 April 1992 to current
• Crown Melbourne Limited2: from 22 July 1999 to current
• Ellerston Capital Limited3: from 6 August 2004 to current
• Qantas Airways Limited: from 1 August 2000 to 31 August 2007
• SEEK Limited: from 31 October 2003 to current
• Sunland Group Limited: from 20 July 2006 to current
John Alexander BA, Executive Deputy Chairman
Mr Alexander became Executive Chairman of Consolidated Media Holdings Limited in November 2007. Mr Alexander had previously been Chief Executive Offi cer and Managing Director of PBL since June 2004.
Mr Alexander joined ACP Magazines as Group Publisher in 1998 and was appointed Chief Executive Offi cer of that division in March 1999, a position he held until April 2006. In January 2002, he was appointed Chief Executive Offi cer of PBL’s media businesses which included ACP Magazines and Nine Network – then owned by PBL. Prior to joining the PBL Group, Mr Alexander was the Editor-in-Chief, Publisher & Editor of Th e Sydney Morning Herald, and Editor-in-Chief of Th e Australian Financial Review.
Mr Alexander is a director of various companies including Crown Melbourne Limited, Burswood Limited, Melco Crown Entertainment Limited, Aspinalls Holdings (Jersey) Limited, FOXTEL Management Pty Limited, PBL Media Holdings Pty Limited, Premier Media Group Pty Limited and The International Federation of the Periodical Press Limited.
Directorships of other listed companies held during the last three years:
• Crown Melbourne Limited2: from 17 August 2004 to current
• Consolidated Media Holdings Limited1: from 16 December 1999 to current
Christopher J Anderson BEc, Non Independent, Non-Executive Director
Mr Anderson is also a non-executive director of Consolidated Media Holdings Limited. In this capacity he monitors the performance of a number of CMH investments including FOXTEL, Premier Media Group (Fox Sports), PBL Media, SEEK and Sky News.
Mr Anderson was previously the Chief Executive Officer of Optus and stepped down from that role in late 2004. Prior to joining Optus in 1997, Mr Anderson was the Group Chief Executive of Television New Zealand Limited. Previously, he was the Managing Editor of the Australian Broadcasting Corporation and was Chief Executive Officer & Editorial Director of John Fairfax Limited Group. Mr Anderson was employed by John Fairfax Limited from 1966 to 1991 in various editorial and magazine positions.
Directorships of other listed companies held during the last three years:
• SEEK Limited: from 25 November 2004 to current
• Consolidated Media Holdings Limited1: 9 June 2004 to current
p . 56
DIRECTORS’ STATUTORY REPORT CONTINUED
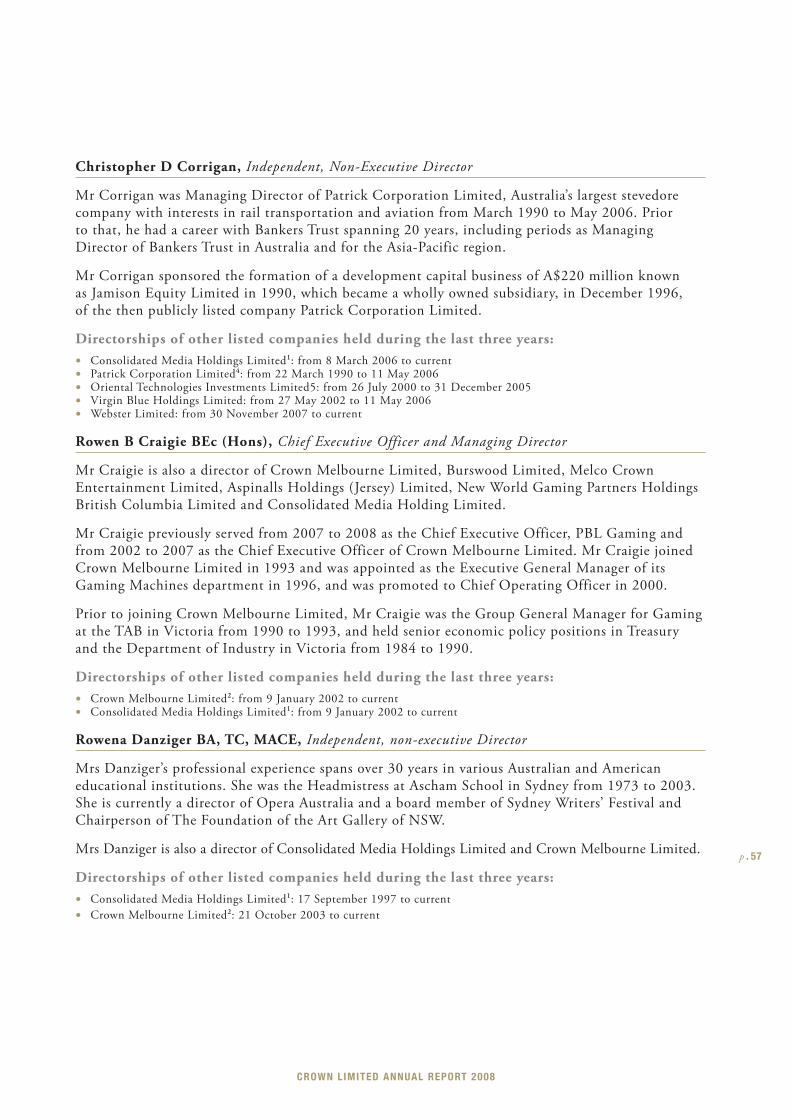
Christopher D Corrigan, Independent, Non-Executive Director
Mr Corrigan was Managing Director of Patrick Corporation Limited, Australia’s largest stevedore company with interests in rail transportation and aviation from March 1990 to May 2006. Prior to that, he had a career with Bankers Trust spanning 20 years, including periods as Managing Director of Bankers Trust in Australia and for the Asia-Pacific region.
Mr Corrigan sponsored the formation of a development capital business of A$220 million known as Jamison Equity Limited in 1990, which became a wholly owned subsidiary, in December 1996, of the then publicly listed company Patrick Corporation Limited.
Directorships of other listed companies held during the last three years:
• Consolidated Media Holdings Limited1: from 8 March 2006 to current
• Patrick Corporation Limited4: from 22 March 1990 to 11 May 2006
• Oriental Technologies Investments Limited5: from 26 July 2000 to 31 December 2005
• Virgin Blue Holdings Limited: from 27 May 2002 to 11 May 2006
• Webster Limited: from 30 November 2007 to current
Rowen B Craigie BEc (Hons), Chief Executive Officer and Managing Director
Mr Craigie is also a director of Crown Melbourne Limited, Burswood Limited, Melco Crown Entertainment Limited, Aspinalls Holdings (Jersey) Limited, New World Gaming Partners Holdings British Columbia Limited and Consolidated Media Holding Limited.
Mr Craigie previously served from 2007 to 2008 as the Chief Executive Officer, PBL Gaming and from 2002 to 2007 as the Chief Executive Officer of Crown Melbourne Limited. Mr Craigie joined Crown Melbourne Limited in 1993 and was appointed as the Executive General Manager of its Gaming Machines department in 1996, and was promoted to Chief Operating Officer in 2000.
Prior to joining Crown Melbourne Limited, Mr Craigie was the Group General Manager for Gaming at the TAB in Victoria from 1990 to 1993, and held senior economic policy positions in Treasury and the Department of Industry in Victoria from 1984 to 1990.
Directorships of other listed companies held during the last three years:
• Crown Melbourne Limited2: from 9 January 2002 to current
• Consolidated Media Holdings Limited1: from 9 January 2002 to current
Rowena Danziger BA, TC, MACE, Independent, non-executive Director
Mrs Danziger’s professional experience spans over 30 years in various Australian and American educational institutions. She was the Headmistress at Ascham School in Sydney from 1973 to 2003. She is currently a director of Opera Australia and a board member of Sydney Writers’ Festival and Chairperson of The Foundation of the Art Gallery of NSW.
Mrs Danziger is also a director of Consolidated Media Holdings Limited and Crown Melbourne Limited.
Directorships of other listed companies held during the last three years:
• Consolidated Media Holdings Limited1: 17 September 1997 to current
• Crown Melbourne Limited2: 21 October 2003 to current
p . 57
CROWN LIMITED ANNUAL REPORT 2008
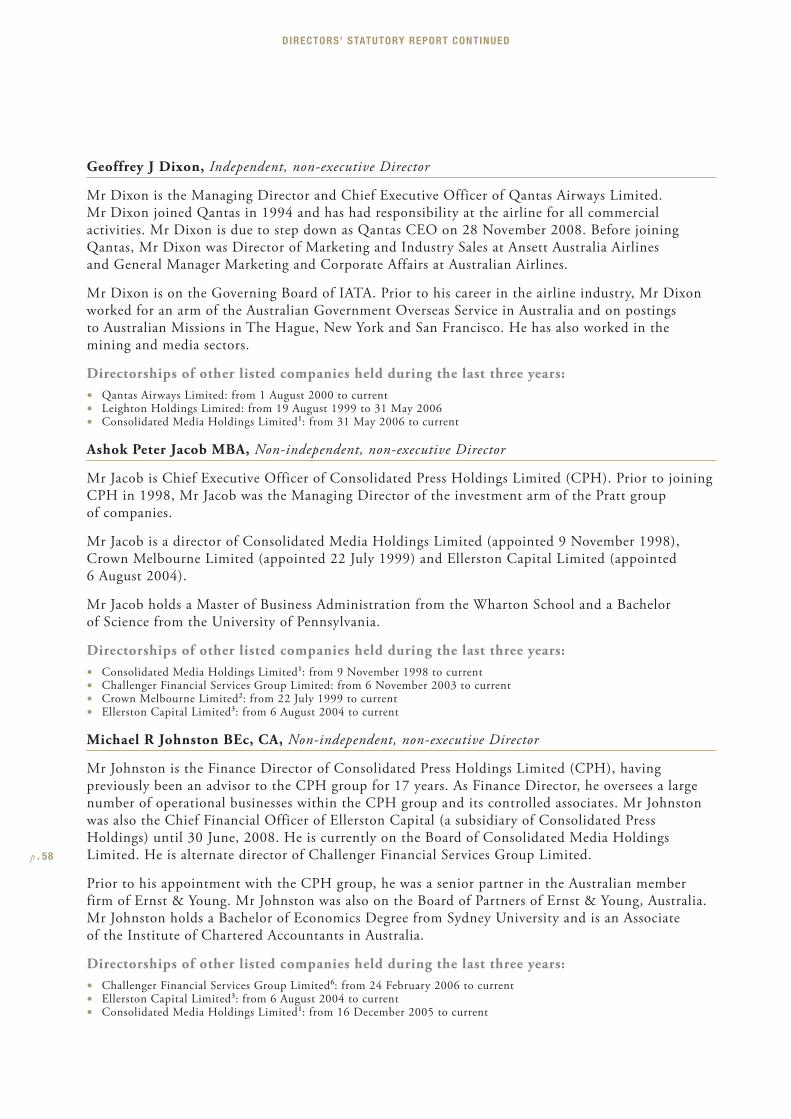
Geoffrey J Dixon, Independent, non-executive Director
Mr Dixon is the Managing Director and Chief Executive Officer of Qantas Airways Limited. Mr Dixon joined Qantas in 1994 and has had responsibility at the airline for all commercial activities. Mr Dixon is due to step down as Qantas CEO on 28 November 2008. Before joining Qantas, Mr Dixon was Director of Marketing and Industry Sales at Ansett Australia Airlines and General Manager Marketing and Corporate Affairs at Australian Airlines.
Mr Dixon is on the Governing Board of IATA. Prior to his career in the airline industry, Mr Dixon worked for an arm of the Australian Government Overseas Service in Australia and on postings to Australian Missions in The Hague, New York and San Francisco. He has also worked in the mining and media sectors.
Directorships of other listed companies held during the last three years:
• Qantas Airways Limited: from 1 August 2000 to current
• Leighton Holdings Limited: from 19 August 1999 to 31 May 2006
• Consolidated Media Holdings Limited1: from 31 May 2006 to current
Ashok Peter Jacob MBA, Non-independent, non-executive Director
Mr Jacob is Chief Executive Officer of Consolidated Press Holdings Limited (CPH). Prior to joining CPH in 1998, Mr Jacob was the Managing Director of the investment arm of the Pratt group of companies.
Mr Jacob is a director of Consolidated Media Holdings Limited (appointed 9 November 1998), Crown Melbourne Limited (appointed 22 July 1999) and Ellerston Capital Limited (appointed 6 August 2004).
Mr Jacob holds a Master of Business Administration from the Wharton School and a Bachelor of Science from the University of Pennsylvania.
Directorships of other listed companies held during the last three years:
• Consolidated Media Holdings Limited1: from 9 November 1998 to current
• Challenger Financial Services Group Limited: from 6 November 2003 to current
• Crown Melbourne Limited2: from 22 July 1999 to current
• Ellerston Capital Limited3: from 6 August 2004 to current
Michael R Johnston BEc, CA, Non-independent, non-executive Director
Mr Johnston is the Finance Director of Consolidated Press Holdings Limited (CPH), having previously been an advisor to the CPH group for 17 years. As Finance Director, he oversees a large number of operational businesses within the CPH group and its controlled associates. Mr Johnston was also the Chief Financial Officer of Ellerston Capital (a subsidiary of Consolidated Press Holdings) until 30 June, 2008. He is currently on the Board of Consolidated Media Holdings Limited. He is alternate director of Challenger Financial Services Group Limited.
Prior to his appointment with the CPH group, he was a senior partner in the Australian member firm of Ernst & Young. Mr Johnston was also on the Board of Partners of Ernst & Young, Australia. Mr Johnston holds a Bachelor of Economics Degree from Sydney University and is an Associate of the Institute of Chartered Accountants in Australia.
Directorships of other listed companies held during the last three years:
• Challenger Financial Services Group Limited6: from 24 February 2006 to current
• Ellerston Capital Limited3: from 6 August 2004 to current
• Consolidated Media Holdings Limited1: from 16 December 2005 to current
p . 58
DIRECTORS’ STATUTORY REPORT CONTINUED
David H Lowy AM, BCom, Independent, non-executive Director
David Lowy is a principal of LFG Holdings, non-executive deputy chairman of Westfield Holdings Limited and a Director of Consolidated Media Holdings Limited. He is also the Founder and President of the Temora Aviation Museum and a director of The Lowy Institute for International Policy. He holds a Bachelor of Commerce degree from the University of NSW.
Directorships of other listed companies held during the last three years:
• Westfield Group: from 5 July 2004 to current
• Westfield America Management Limited: from 13 July 2004 to current
• Consolidated Media Holdings Limited1: from 31 May 2006 to current
Richard W Turner AM, BEc, FCA, Independent, non-executive Director
Before his retirement in 1994, Mr Turner had been the Chief Executive Officer of Ernst & Young, having had a successful 36 year career as an audit partner. Mr Turner is a Fellow of the Institute of Chartered Accountants in Australia. He is a director of HBOS Australia Limited, Bankwest Limited, Mirvac Ltd and its group companies. He was past President and director of The Smith Family and past Chairman and a current director of the Institute of Pain Management Limited.
Mr Turner is also a director of Consolidated Media Holdings Limited, Crown Melbourne Limited, and is Chairperson of Crown Limited’s Audit & Corporate Governance Committee.
Directorships of other listed companies held during the last three years:
• Crown Melbourne Limited2: from 21 October 2003 to current
• Consolidated Media Holdings Limited1: from 9 November 1998 to current
• The Mirvac Group: from 7 January 2005 to current
Notes:
1. Consolidated media Holdings Limited (previously Publishing and Broadcasting Limited, ASX Code: PBL).
2. Crown Melbourne Limited (previously Crown Limited, “Crown Melbourne”) was classifi ed as a listed company while it had a series of unsecured notes (ASX Code: CROHB) quoted on the ASX. Th ese notes were redeemed on 15 August 2005 and Crown Melbourne was removed from the ASX’s offi cial list on 2 September 2005.
3. Ellerston Capital Limited is the manager and responsible entity for the Ellerston Gems Fund (EGF), admitted to the Offi cial List of ASX Limited on 29 June 2007.
4. Removed from the ASX’s offi cial list on 3 July 2006.
5. Removed from the ASX’s offi cial list on 17 March 2006.
6. Alternate director to Mr James Packer and Mr Ashok Jacob.
Company secretary details
Michael J Neilson BA, LLB: Mr Neilson is Crown’s General Counsel and Joint Company Secretary. Prior to his appointment with Crown, he was General Counsel for Crown Melbourne Limited, a position he held from 2004 to 2007.
Prior to joining the Crown group, Mr Neilson spent 10 years in a commercial legal practice in Melbourne before joining the Lend Lease Group in Sydney in 1997 as General Counsel for Lend Lease Property Management.
In 1998, he was appointed General Counsel and Company Secretary of General Property Trust, the position he held until joining Crown Melbourne Limited in 2004.
p . 59
CROWN LIMITED ANNUAL REPORT 2008
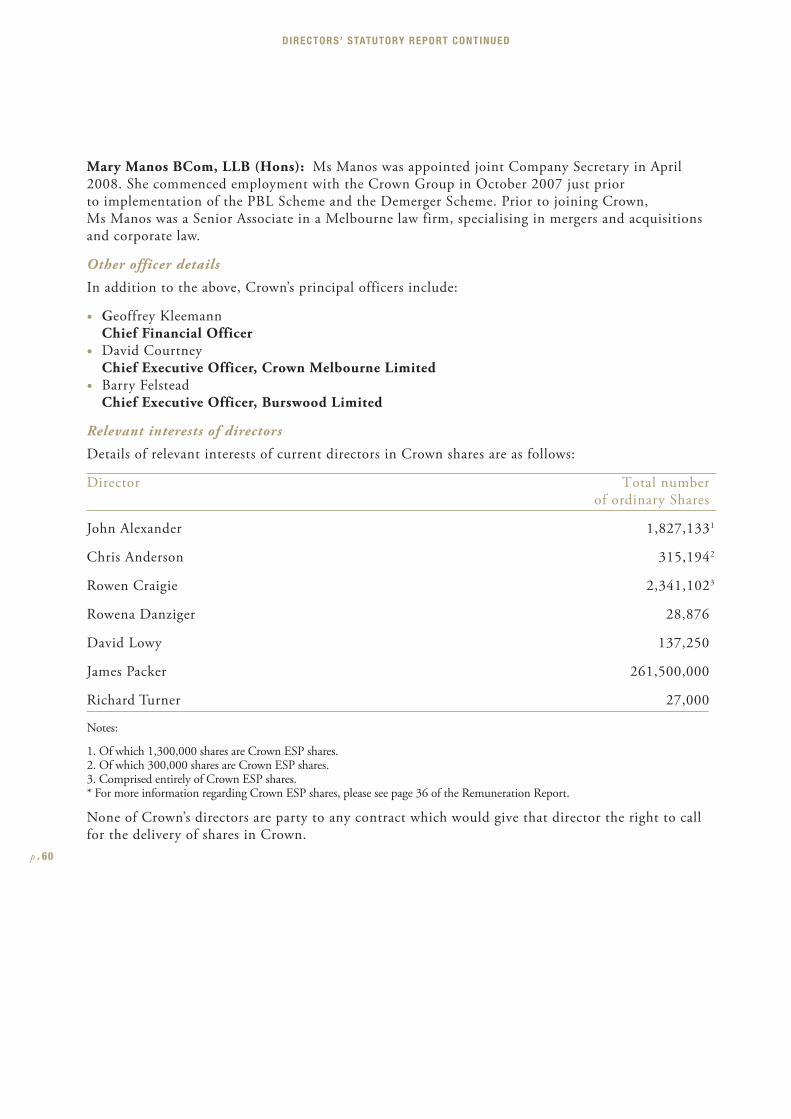
Mary Manos BCom, LLB (Hons): Ms Manos was appointed joint Company Secretary in April 2008. She commenced employment with the Crown Group in October 2007 just prior to implementation of the PBL Scheme and the Demerger Scheme. Prior to joining Crown, Ms Manos was a Senior Associate in a Melbourne law firm, specialising in mergers and acquisitions and corporate law.
Other officer details
In addition to the above, Crown’s principal officers include:
• Geoffrey Kleemann Chief Financial Officer
• David Courtney Chief Executive Officer, Crown Melbourne Limited
• Barry Felstead Chief Executive Officer, Burswood Limited
Relevant interests of directors
Details of relevant interests of current directors in Crown shares are as follows:
Director Total number of ordinary Shares
John Alexander 1,827,1331
Chris Anderson 315,1942
Rowen Craigie 2,341,1023
Rowena Danziger 28,876
David Lowy 137,250
James Packer 261,500,000
Richard Turner 27,000
Notes:
1. Of which 1,300,000 shares are Crown ESP shares.2. Of which 300,000 shares are Crown ESP shares.3. Comprised entirely of Crown ESP shares.* For more information regarding Crown ESP shares, please see page 36 of the Remuneration Report.
None of Crown’s directors are party to any contract which would give that director the right to call for the delivery of shares in Crown.
p . 60
DIRECTORS’ STATUTORY REPORT CONTINUED
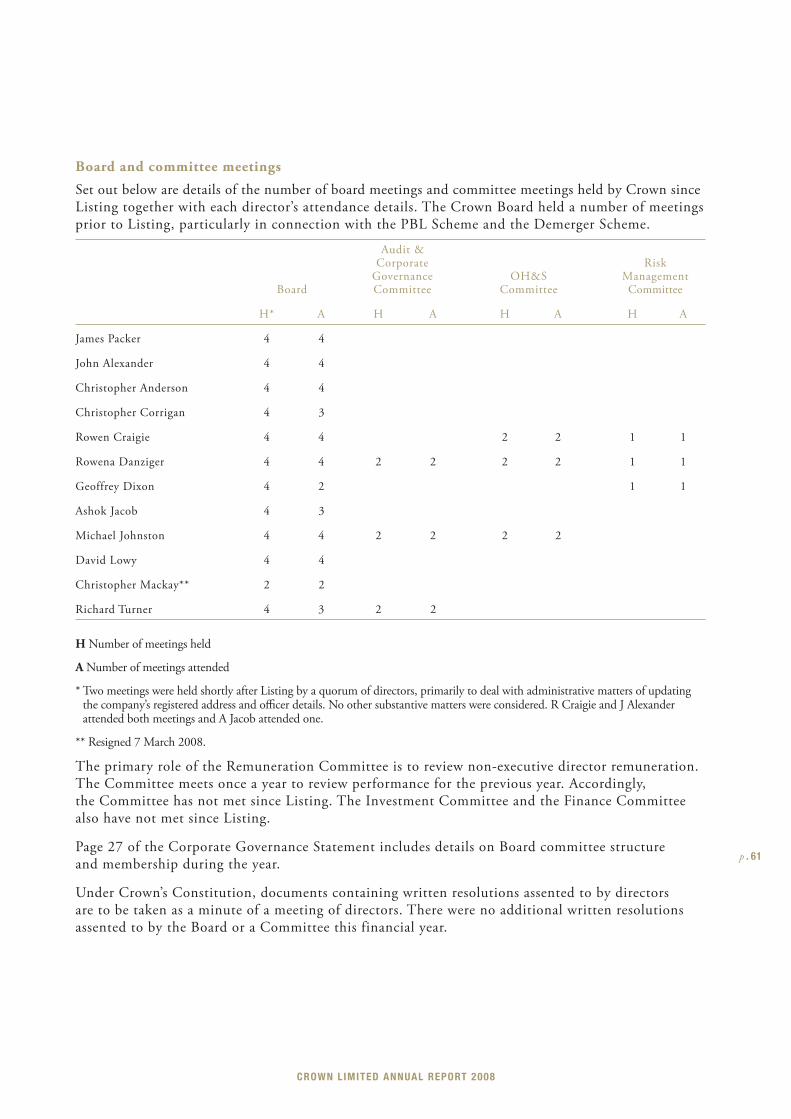
Board and committee meetings
Set out below are details of the number of board meetings and committee meetings held by Crown since Listing together with each director’s attendance details. The Crown Board held a number of meetings prior to Listing, particularly in connection with the PBL Scheme and the Demerger Scheme.
Audit & Corporate Risk Governance OH&S Management Board Committee Committee Committee
H* A H A H A H A
James Packer 4 4
John Alexander 4 4
Christopher Anderson 4 4
Christopher Corrigan 4 3
Rowen Craigie 4 4 2 2 1 1
Rowena Danziger 4 4 2 2 2 2 1 1
Geoffrey Dixon 4 2 1 1
Ashok Jacob 4 3
Michael Johnston 4 4 2 2 2 2
David Lowy 4 4
Christopher Mackay** 2 2
Richard Turner 4 3 2 2
H Number of meetings held
A Number of meetings attended
* Two meetings were held shortly after Listing by a quorum of directors, primarily to deal with administrative matters of updating the company’s registered address and offi cer details. No other substantive matters were considered. R Craigie and J Alexander attended both meetings and A Jacob attended one.
** Resigned 7 March 2008.
The primary role of the Remuneration Committee is to review non-executive director remuneration. The Committee meets once a year to review performance for the previous year. Accordingly, the Committee has not met since Listing. The Investment Committee and the Finance Committee also have not met since Listing.
Page 27 of the Corporate Governance Statement includes details on Board committee structure and membership during the year.
Under Crown’s Constitution, documents containing written resolutions assented to by directors are to be taken as a minute of a meeting of directors. There were no additional written resolutions assented to by the Board or a Committee this financial year.
p . 61
CROWN LIMITED ANNUAL REPORT 2008
Shares and Options
Crown has not granted any options over unissued shares. There are no unissued shares or interests under option. No shares or interests have been issued during or since year end as a result of option exercise.
Indemnity and insurance of officers and auditors
Director and officer indemnities
Crown indemnifies certain persons as detailed in its Constitution in accordance with the terms of the Crown Constitution.
D&O Insurance
During the year Crown has paid insurance premiums to insure officers of the Crown group against certain liabilities.
The insurance contract prohibits disclosure of the nature of the insurance cover and the amount of the insurance payable.
Auditor Information
Auditor details
Ernst & Young has been appointed Crown’s auditor.
Mr Brett Kallio is the Ernst & Young partner responsible for the audit of Crown’s accounts.
True and fair information
There is no additional true and fair information included in the financial report.
Non-audit services
Details of the amounts paid or payable to the auditor for non-audit services provided during the year by the auditor are outlined in Note 30.
The directors are satisfied that the non-audit services are compatible with the general standard of independence for auditors imposed by the Corporations Act. The board considers that the nature and scope of the services provided do not affect auditor independence.
Rounding
The amounts contained in the financial statements have been rounded off to the nearest thousand dollars (where rounding is applicable) under the option available to Crown under ASIC Class Order 98/0100. Crown is an entity to which the Class Order applies.
Signed in accordance with a resolution of the Directors.
J D PackerDirector
R B CraigieDirector
Melbourne, 17th day of September, 2008
p . 62
DIRECTORS’ STATUTORY REPORT CONTINUED
p . 63
CROWN LIMITED ANNUAL REPORT 2008
p . 64
DIRECTORS’ STATUTORY REPORT CONTINUED
p . 65
CROWN LIMITED ANNUAL REPORT 2008

Directors’ Declaration
p . 66
In accordance with a resolution of the directors, we declare as follows:
1. In the directors’ opinion:
a) there are reasonable grounds to believe that Crown will be able to pay its debts as and when they become due and payable; and
b) the financial statements and notes are in accordance with the Corporations Act, including:
(i) Section 296 (compliance with accounting standards); and
(ii) Section 297 (true and fair view); and
2. The directors have received declarations in relation to Crown’s financial statements for the financial year ended 30 June 2008, by its Chief Executive Officer and its Chief Financial Officer in accordance with section 295A of the Corporations Act.
In the opinion of Directors, at the date of this declaration, there are reasonable grounds to believe that the members of the Closed Group identified in note 35 will be able to meet any obligations or liabilities to which they are or may become subject to, by virtue of the Deed of Cross Guarantee.
On behalf of the Board
J D PackerDirector
R B CraigieDirector
Melbourne, 17th day of September, 2008
CROWN LIMITED ANNUAL REPORT 2008ABN 39 125 709 953
Financial Report
CONTENTS
Income Statement 68
Balance Sheet 69
Cash Flow Statement 70
Notes to the Financial Statements 72
MORE INFORMATION
More information regarding calculations of normalised results is included in Crown’s
2008 Full Year Results Announcement, which is available on Crown’s website at:
www.crownlimited.com under the heading Investors – Presentations and Briefings.
p . 6 7
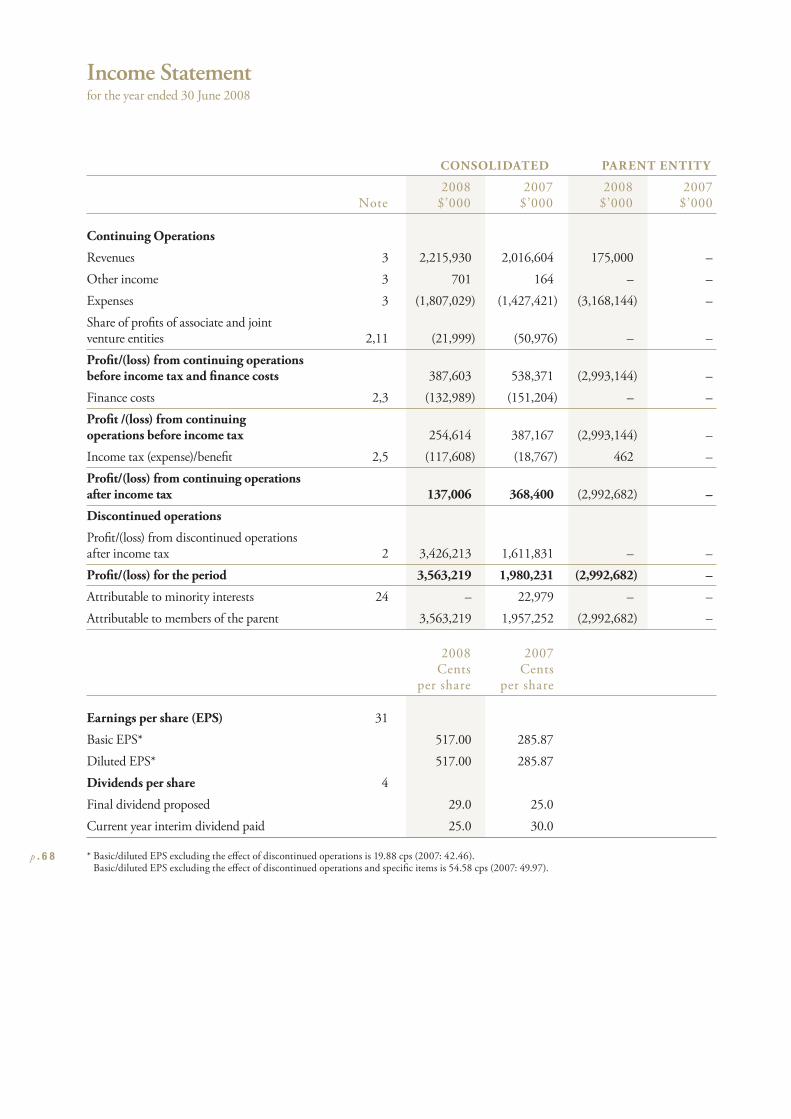
p . 6 8
CONSOLIDATED PARENT ENTITY
2008 2007 2008 2007 Note $’000 $’000 $’000 $’000
Continuing Operations
Revenues 3 2,215,930 2,016,604 175,000 –
Other income 3 701 164 – –
Expenses 3 (1,807,029) (1,427,421) (3,168,144) –
Share of profi ts of associate and joint venture entities 2,11 (21,999) (50,976) – –
Profi t/(loss) from continuing operations before income tax and fi nance costs 387,603 538,371 (2,993,144) –
Finance costs 2,3 (132,989) (151,204) – –
Profi t /(loss) from continuing operations before income tax 254,614 387,167 (2,993,144) –
Income tax (expense)/benefi t 2,5 (117,608) (18,767) 462 –
Profi t/(loss) from continuing operations after income tax 137,006 368,400 (2,992,682) –
Discontinued operations
Profi t/(loss) from discontinued operations after income tax 2 3,426,213 1,611,831 – –
Profi t/(loss) for the period 3,563,219 1,980,231 (2,992,682) –
Attributable to minority interests 24 – 22,979 – –
Attributable to members of the parent 3,563,219 1,957,252 (2,992,682) –
2008 2007 Cents Cents per share per share
Earnings per share (EPS) 31
Basic EPS* 517.00 285.87
Diluted EPS* 517.00 285.87
Dividends per share 4
Final dividend proposed 29.0 25.0
Current year interim dividend paid 25.0 30.0
* Basic/diluted EPS excluding the eff ect of discontinued operations is 19.88 cps (2007: 42.46).Basic/diluted EPS excluding the eff ect of discontinued operations and specifi c items is 54.58 cps (2007: 49.97).
Income Statementfor the year ended 30 June 2008
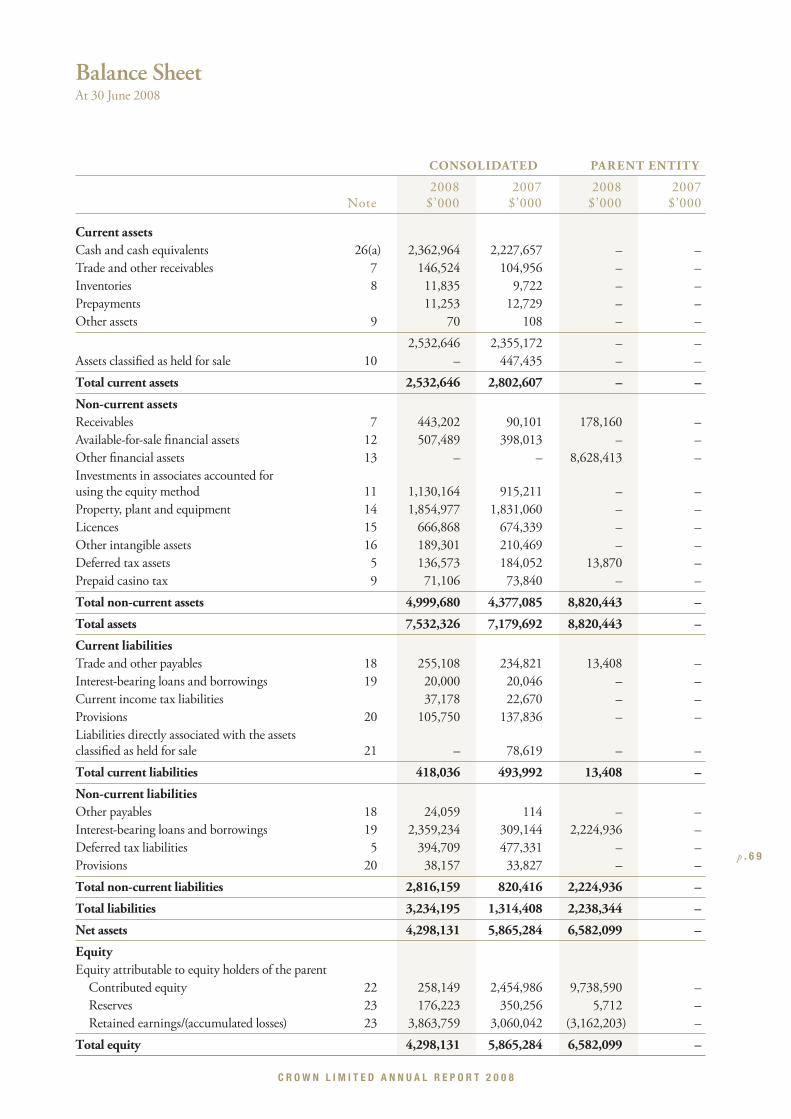
C R O W N L I M I T E D A N N U A L R E P O R T 2 0 0 8
p . 6 9
CONSOLIDATED PARENT ENTITY
2008 2007 2008 2007 Note $’000 $’000 $’000 $’000
Current assetsCash and cash equivalents 26(a) 2,362,964 2,227,657 – –
Trade and other receivables 7 146,524 104,956 – –
Inventories 8 11,835 9,722 – –
Prepayments 11,253 12,729 – –
Other assets 9 70 108 – –
2,532,646 2,355,172 – –
Assets classifi ed as held for sale 10 – 447,435 – –
Total current assets 2,532,646 2,802,607 – –
Non-current assetsReceivables 7 443,202 90,101 178,160 –
Available-for-sale fi nancial assets 12 507,489 398,013 – –
Other fi nancial assets 13 – – 8,628,413 –
Investments in associates accounted for using the equity method 11 1,130,164 915,211 – –
Property, plant and equipment 14 1,854,977 1,831,060 – –
Licences 15 666,868 674,339 – –
Other intangible assets 16 189,301 210,469 – –
Deferred tax assets 5 136,573 184,052 13,870 –
Prepaid casino tax 9 71,106 73,840 – –
Total non-current assets 4,999,680 4,377,085 8,820,443 –
Total assets 7,532,326 7,179,692 8,820,443 –
Current liabilitiesTrade and other payables 18 255,108 234,821 13,408 –
Interest-bearing loans and borrowings 19 20,000 20,046 – –
Current income tax liabilities 37,178 22,670 – –
Provisions 20 105,750 137,836 – –
Liabilities directly associated with the assets classifi ed as held for sale 21 – 78,619 – –
Total current liabilities 418,036 493,992 13,408 –
Non-current liabilitiesOther payables 18 24,059 114 – –
Interest-bearing loans and borrowings 19 2,359,234 309,144 2,224,936 –
Deferred tax liabilities 5 394,709 477,331 – –
Provisions 20 38,157 33,827 – –
Total non-current liabilities 2,816,159 820,416 2,224,936 –
Total liabilities 3,234,195 1,314,408 2,238,344 –
Net assets 4,298,131 5,865,284 6,582,099 –
EquityEquity attributable to equity holders of the parent
Contributed equity 22 258,149 2,454,986 9,738,590 –
Reserves 23 176,223 350,256 5,712 –
Retained earnings/(accumulated losses) 23 3,863,759 3,060,042 (3,162,203) –
Total equity 4,298,131 5,865,284 6,582,099 –
Balance SheetAt 30 June 2008
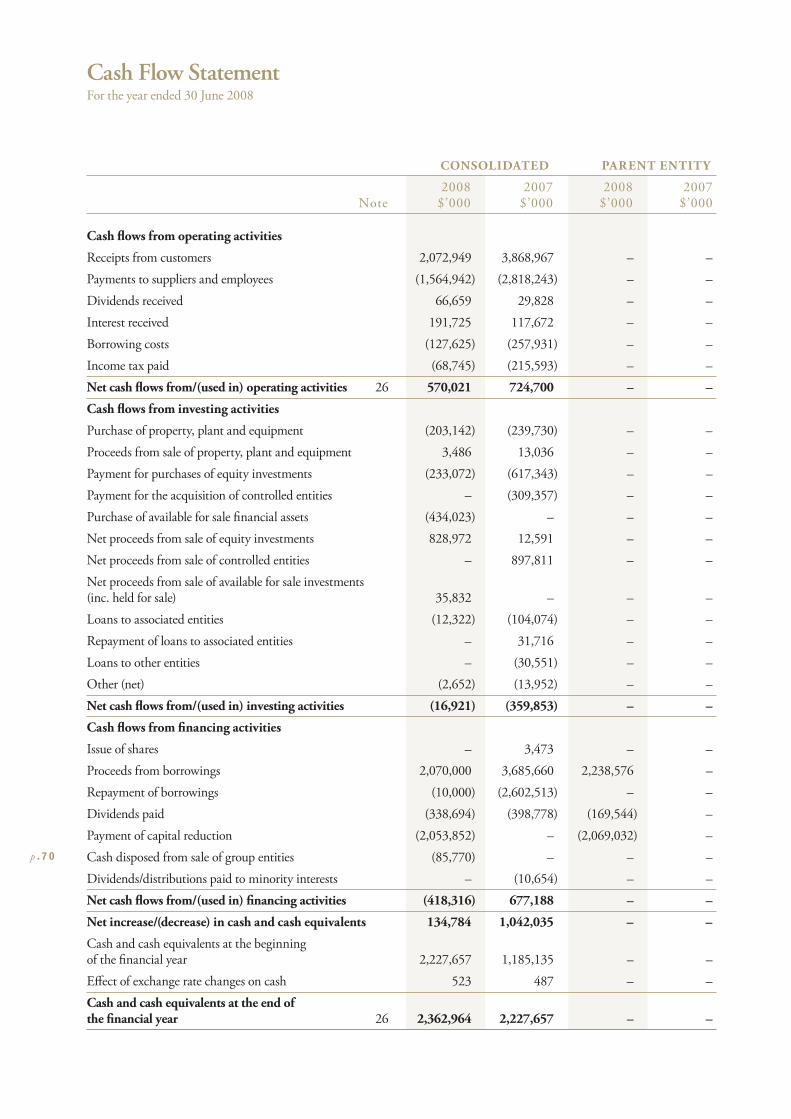
p . 7 0
CONSOLIDATED PARENT ENTITY
2008 2007 2008 2007 Note $’000 $’000 $’000 $’000
Cash fl ows from operating activities
Receipts from customers 2,072,949 3,868,967 – –
Payments to suppliers and employees (1,564,942) (2,818,243) – –
Dividends received 66,659 29,828 – –
Interest received 191,725 117,672 – –
Borrowing costs (127,625) (257,931) – –
Income tax paid (68,745) (215,593) – –
Net cash fl ows from/(used in) operating activities 26 570,021 724,700 – –
Cash fl ows from investing activities
Purchase of property, plant and equipment (203,142) (239,730) – –
Proceeds from sale of property, plant and equipment 3,486 13,036 – –
Payment for purchases of equity investments (233,072) (617,343) – –
Payment for the acquisition of controlled entities – (309,357) – –
Purchase of available for sale fi nancial assets (434,023) – – –
Net proceeds from sale of equity investments 828,972 12,591 – –
Net proceeds from sale of controlled entities – 897,811 – –
Net proceeds from sale of available for sale investments (inc. held for sale) 35,832 – – –
Loans to associated entities (12,322) (104,074) – –
Repayment of loans to associated entities – 31,716 – –
Loans to other entities – (30,551) – –
Other (net) (2,652) (13,952) – –
Net cash fl ows from/(used in) investing activities (16,921) (359,853) – –
Cash fl ows from fi nancing activities
Issue of shares – 3,473 – –
Proceeds from borrowings 2,070,000 3,685,660 2,238,576 –
Repayment of borrowings (10,000) (2,602,513) – –
Dividends paid (338,694) (398,778) (169,544) –
Payment of capital reduction (2,053,852) – (2,069,032) –
Cash disposed from sale of group entities (85,770) – – –
Dividends/distributions paid to minority interests – (10,654) – –
Net cash fl ows from/(used in) fi nancing activities (418,316) 677,188 – –
Net increase/(decrease) in cash and cash equivalents 134,784 1,042,035 – –
Cash and cash equivalents at the beginning of the fi nancial year 2,227,657 1,185,135 – –
Eff ect of exchange rate changes on cash 523 487 – –
Cash and cash equivalents at the end of the fi nancial year 26 2,362,964 2,227,657 – –
Cash Flow StatementFor the year ended 30 June 2008
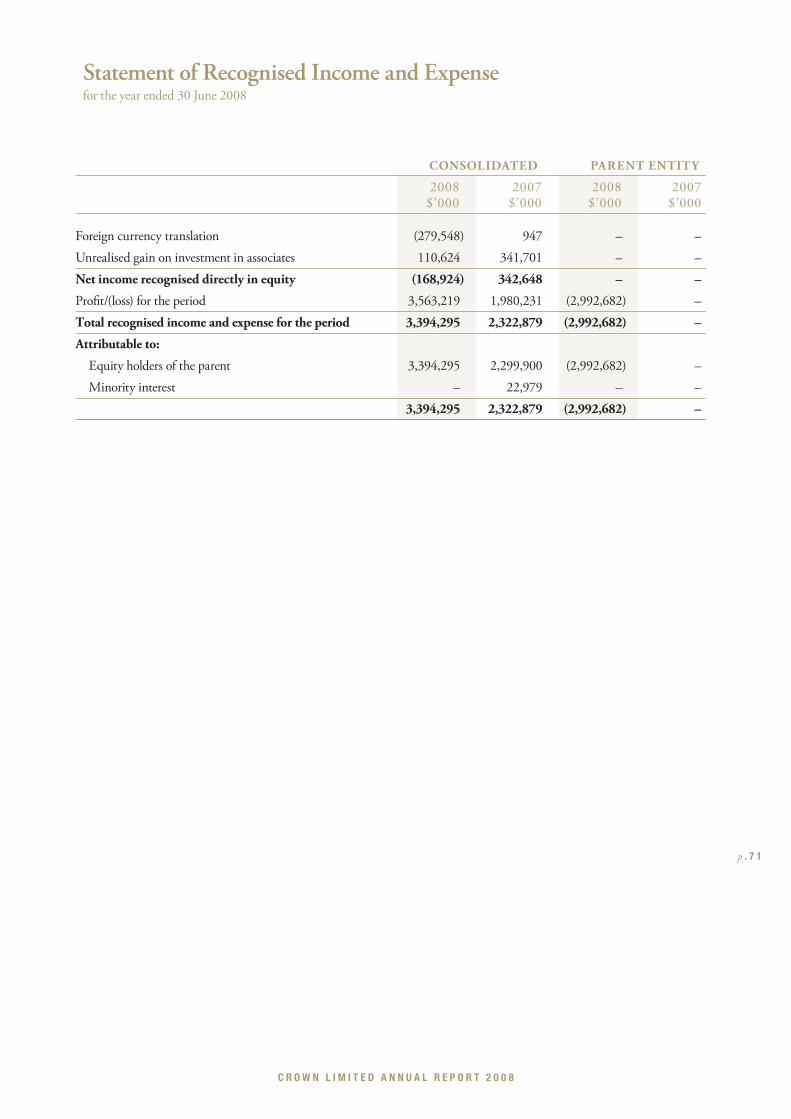
C R O W N L I M I T E D A N N U A L R E P O R T 2 0 0 8
p . 7 1
CONSOLIDATED PARENT ENTITY
2008 2007 2008 2007 $’000 $’000 $’000 $’000
Foreign currency translation (279,548) 947 – –
Unrealised gain on investment in associates 110,624 341,701 – –
Net income recognised directly in equity (168,924) 342,648 – –
Profi t/(loss) for the period 3,563,219 1,980,231 (2,992,682) –
Total recognised income and expense for the period 3,394,295 2,322,879 (2,992,682) –
Attributable to:
Equity holders of the parent 3,394,295 2,299,900 (2,992,682) –
Minority interest – 22,979 – –
3,394,295 2,322,879 (2,992,682) –
Statement of Recognised Income and Expensefor the year ended 30 June 2008
p . 7 2
1. SUMMARY OF SIGNIFICANT ACCOUNTING POLICIES
(a) Basis of preparation
Th is fi nancial report is a general-purpose fi nancial report, which has been prepared in accordance with the requirements of the Corporations Act 2001 and Australian Accounting Standards. Th e fi nancial report has also been prepared on a historical cost basis, except for derivative fi nancial instruments and available-for-sale fi nancial assets that have been measured at fair value and investments in associates accounted for using the equity method. Th e carrying values of recognised assets and liabilities that are hedged with fair value hedges are adjusted to record changes in the fair values attributable to the risks that are being hedged.
Th e fi nancial report is presented in Australian dollars and all values are rounded to the nearest thousand dollars ($’000) unless otherwise stated under the option available
to the Company under ASIC Class Order 98/100. Th e Company is an entity to which the class order applies.
Th e fi nancial report of Crown Limited and its controlled entities for the year ended 30 June 2008 was authorised for issue in accordance with a resolution of directors on 18 August 2008 subject to fi nal approval by a sub committee which approval was received on 17 September 2008.
(b) Statement of compliance
Th e fi nancial report complies with Australian Accounting Standards as issued by the Australian Accounting Standards Board and International Financial Reporting Standards (IFRS) as issued by the International Accounting Standards Board.
Australian Accounting Standards and Interpretations that have recently been issued or amended but are not yet eff ective have not been adopted by the Group for the reporting period ending 30 June 2008. Th ese are outlined in the table below.
Reference TitleApplication date of
standard* Impact on Group fi nancial report
Application date for Group*
AASB Int. 13 Customer Loyalty Programmes
1 July
2008
Th e Group accounts for its customer loyalty programmes in such a manner that this standard is not expected to have any material impact on the Group’s fi nancial report.
1 July 2008
AASB 8 and AASB 2007-3
Operating Segments and consequential amendments to other Australian Accounting Standards
1 January 2009
AASB 8 is a disclosure standard so therefore will have no direct impact on the amounts included in the Group’s fi nancial statements. In addition, the amendments may have an impact on the Group’s segment disclosures.
1 July
2009
AASB 123 (Revised) and AASB 2007-6
Borrowing Costs and consequential amendments to other Australian Accounting Standards
1 January 2009
Th ese amendments to AASB 123 require that all borrowing costs associated with a qualifying asset be capitalised. Th e Group already capitalises borrowing costs associated with qualifying assets and as such the amendments are not expected to have any impact on the Group’s fi nancial report.
1 July
2009
AASB 101 (Revised) and AASB 2007-8
Presentation of Financial Statements and consequential amendments to other Australian Accounting Standards
1 January 2009
Th ese amendments are only expected to aff ect the presentation of the Group’s fi nancial report and will not have a direct impact on the measurement and recognition of amounts disclosed in the fi nancial report. Th e Group has not determined at this stage whether to present a single statement of comprehensive income or two separate statements.
1 July
2009
Notes to the Financial StatementsFor the year ended 30 June 2008
1. SUMMARY OF SIGNIFICANT ACCOUNTING POLICIES continued
(b) Statement of compliance continued
C R O W N L I M I T E D A N N U A L R E P O R T 2 0 0 8
p . 7 3
Reference TitleApplication date of
standard* Impact on Group fi nancial report
Application date for Group*
AASB
2008-1
Amendments to Australian Accounting Standard – Share-based Payments: Vesting Conditions and Cancellations
1 January 2009
Th e Group has share-based payment arrangements that may be aff ected by these amendments. However, the Group has not yet determined the extent of the impact, if any.
1 July
2009
AASB
2008-2
Amendments to Australian Accounting Standards – Puttable Financial Instruments and Obligations arising on Liquidation
1 January 2009
Th ese amendments are not expected to have any impact on the Group’s fi nancial report as the Group does not have on issue or expect to issue any puttable fi nancial instruments as defi ned by the amendments.
1 July
2009
AASB 3 (Revised)
Business Combinations 1 July 2009
Th e Group may enter into some business combinations during the next fi nancial year and may therefore consider early adopting the revised standard. Th e Group has not yet assessed the impact of early adoption, including which accounting policy to adopt.
1 July
2009
AASB 127 (Revised)
Consolidated and Separate Financial Statements
1 July 2009
If the Group changes its ownership interest in existing subsidiaries in the future, the change will be accounted for as an equity transaction. Th is will have no impact on goodwill, nor will it give rise to a gain or a loss in the Group’s income statement.
1 July
2007
AASB 2008-7 Cost of an Investment in a Subsidiary, Jointly Controlled Entity or Associate
1 January 2009
Recognising all dividends received from subsidiaries, jointly controlled entities and associates as income will likely give rise to greater income being recognised by the parent entity after adoption of these amendments.
In addition, if the Group enters into any group reorganisation establishing new parent entities, an assessment will need to be made to determine if the reorganisation meets the conditions imposed to be eff ectively accounted for on a ‘carry-over basis’ rather than at fair value.
1 July
2007
AASB 2008-5 and 2008-6
Improvements to IFRSs 1 January 2009 except for amendments to IFRS
5, which are eff ective from 1 July 2009.
Th e Group has not yet determined the extent of the impact of the amendments, if any.
1 July
2009
Notes to the Financial Statements continued
For the year ended 30 June 2008
p . 7 4
Reference TitleApplication date of
standard* Impact on Group fi nancial report
Application date for Group*
IFRIC 16** Hedges of a Net Investment in a Foreign Operation
1 January 2009
Th e Interpretation is unlikely to have any impact on the Group since it does not signifi cantly restrict the hedged risk or where the hedging instrument can be held.
1 July
2009
AASB Int. 12 and AASB 2007-2
Service Concession Arrangements and consequential amendments to other Australian Accounting Standards
1 January 2008
Unless the Group enters into service concession arrangements or public-private-partnerships (PPP), the amendments are not expected to have any impact on the Group’s fi nancial report.
1 July
2008
* Designates the beginning of the applicable annual reporting period unless otherwise stated
** Pronouncements that have been issued by the IASB and IFRIC but have not yet been issued by the AASB. Entities must disclose the impact of these pronouncements in order to make the statement of compliance with IFRS under AASB 101.14.
(d) Signifi cant accounting estimates and assumptions
Th e carrying amounts of certain assets and liabilities are often determined based on estimates and assumptions of future events. Th e key estimates and assumptions that have a signifi cant risk of causing a material adjustment to the carrying amounts of certain assets and liabilities within the next annual reporting period are:
Impairment of goodwill and casino licences with indefi nite useful lives
Th e Group determines whether goodwill and casino licences with indefi nite useful lives are impaired at least on an annual basis. Th is requires an estimation of the recoverable amount of the cash-generating units to which the goodwill and casino licences with indefi nite useful lives are allocated. Th e assumptions used in this estimation of recoverable amount and the carrying amount of goodwill and casino licences with indefi nite useful lives are discussed in note 17.
Share-based payment transactions
Th e Group measures the cost of equity-settled transactions with employees by reference to the fair value of the equity instruments at the date at which they are granted. Th e fair value is determined with the assistance of an external valuer, using the assumptions detailed in note 28.
Specifi c Items
Management determines specifi c items based on the nature and size.
Th e Group has adopted AASB 7 ‘Financial Instruments: Disclosures’ and all consequential amendments which became applicable on 1 July 2007. Th e adoption of this standard has only impacted the disclosure in these fi nancial statements. Th ere has been no impact on profi t and loss or the fi nancial position of the entity.
(c) Basis of consolidation
Th e consolidated fi nancial statements are those of the consolidated entity, comprising Crown Limited (the parent entity) and all entities that Crown Limited controlled from time to time during the year and at reporting date.
Information from the fi nancial statements of subsidiaries is included from the date the parent entity obtains control until such time as control ceases. Where there is loss of control of a subsidiary, the consolidated fi nancial statements include the results for the part of the reporting period during which the parent entity has control.
Subsidiary acquisitions are accounted for using the purchase method of accounting. Th e fi nancial statements of subsidiaries are prepared for the same reporting period as the parent entity, using consistent accounting policies. Adjustments are made to bring into line any dissimilar accounting policies that may exist.
Investments in subsidiaries, as recorded in the parent entity (Crown Limited) accounts, are carried at cost.
All intercompany balances and transactions, including unrealised profi ts arising from intra-group transactions, have been eliminated in full. Unrealised losses are eliminated unless costs cannot be recovered.
Th e accounting policies adopted have been applied consistently throughout the two reporting periods.
1. SUMMARY OF SIGNIFICANT ACCOUNTING POLICIES continued
(b) Statement of compliance continued
C R O W N L I M I T E D A N N U A L R E P O R T 2 0 0 8
p . 7 5
1. SUMMARY OF SIGNIFICANT ACCOUNTING POLICIES continued
(e) Income tax
Current tax assets and liabilities for the current and prior periods are measured at the amount expected to be recovered from or paid to the taxation authorities based on the current period’s taxable income. Th e tax rates and tax laws used to compute the amount are those that are enacted or substantively enacted by the balance sheet date.
Deferred income tax is provided on all temporary diff erences at the balance sheet date between the tax bases of assets and liabilities and their carrying amounts for fi nancial reporting purposes.
Deferred income tax liabilities are recognised for all taxable temporary diff erences:
• except where the deferred income tax liability arises from the initial recognition of an asset or liability in a transaction that is not a business combination and, at the time of the transaction, aff ects neither the accounting profi t nor taxable profi t or loss; or
• in respect of taxable temporary diff erences associated with investments in subsidiaries, associates and interests in joint ventures, except where the timing of the reversal of the temporary diff erences can be controlled and it is probable that the temporary diff erences will not reverse in the foreseeable future.
Deferred income tax assets are recognised for all deductible temporary diff erences, carry-forward of unused tax assets and unused tax losses, to the extent that it is probable that taxable profi t will be available against which the deductible temporary diff erences, and the carry-forward of unused tax assets and unused tax losses can be utilised:
• except where the deferred income tax asset relating to the deductible temporary diff erence arises from the initial recognition of an asset or liability in a transaction that is not a business combination and, at the time of the transaction, aff ects neither the accounting profi t not taxable profi t or loss; or
• in respect of deductible temporary diff erences associated with investments in subsidiaries, associates and interests in joint ventures, deferred tax assets are only recognised to the extent that it is probable that the temporary diff erences will reverse in the foreseeable future and taxable profi t will be available against which the temporary diff erences can be utilised.
Th e carrying amount of deferred income tax assets is reviewed at each balance sheet date and reduced to the extent that it is no longer probable that suffi cient taxable profi t will be available to allow all or part of the deferred income tax asset to be utilised.
Deferred income tax assets and liabilities are measured at the tax rates that are expected to apply to the year when the asset is realised or the liability is settled, based on tax rates (and tax laws) that have been enacted or substantively enacted at the balance sheet date.
Income taxes relating to items recognised directly in equity are recognised in equity and not in the income statement.
(f) Other taxes
Revenues, expenses and assets are recognised net of the amount of GST except:
• where the GST incurred on a purchase of goods and services is not recoverable from the taxation authority, in which case the GST is recognised as part of the cost of acquisition of the asset or as part of the expense item as applicable;
• Gaming revenues, due to the GST being off set against casino taxes; and
• receivables and payables are stated with the amount of GST included.
Th e net amount of GST recoverable from, or payable to, the taxation authority is included as part of receivables or payables in the balance sheet.
Cash fl ows are included in the Cash Flow Statement on a gross basis and the GST component of cash fl ows arising from investing and fi nancing activities, which is recoverable from, or payable to, the taxation authority are classifi ed as operating cash fl ows.
Commitments and contingencies are disclosed net of the amount of GST recoverable from, or payable to, the taxation authority.
(g) Foreign currency translation
Both the functional and presentation currency of Crown Limited and its Australian subsidiaries is Australian dollars (A$). Each foreign entity in the Group determines its own functional currency and items included in the fi nancial statements of each foreign entity are measured using that functional currency.
Transactions in foreign currencies are initially recorded in the functional currency at the exchange rates ruling at the date of the transaction. Monetary assets and liabilities denominated in foreign currencies are retranslated at the rate of exchange ruling at the balance sheet date. All diff erences in the consolidated fi nancial report are taken to the income statement.
Non-monetary items that are measured in terms of historical cost in a foreign currency are translated using the exchange rate as at the date of the initial transaction. Non-monetary items measured at fair value in a foreign currency are translated using the exchange rates at the date when the fair value was determined.
Notes to the Financial Statements continued
For the year ended 30 June 2008
p . 7 6
1. SUMMARY OF SIGNIFICANT ACCOUNTING POLICIES continued
(g) Foreign currency translation continued
As at the reporting date the assets and liabilities of overseas subsidiaries are translated into the presentation currency of Crown Limited at the rate of exchange ruling at the balance sheet date and the income statements are translated at the weighted average exchange rates for the period. Th e exchange diff erences arising on the retranslation are taken directly to a separate component of equity.
On disposal of a foreign entity, the deferred cumulative amount recognised in equity relating to that particular foreign operation is recognised in the income statement.
(h) Cash and cash equivalents
Cash and short term deposits in the balance sheet comprise cash at bank and on hand, and short term deposits.
For the purposes of the Cash Flow Statement, cash and cash equivalents consist of cash and cash equivalents as defi ned above, net of outstanding bank overdrafts.
(i) Trade and other receivables
Trade receivables are recognised and carried at original invoice amount less an allowance for any uncollectible amounts.
An estimate for doubtful debts is made when there is objective evidence that the full amount may not be collected. Bad debts are written off when identifi ed.
Receivables from associates and other related parties are carried at amortised cost. Interest, when charged is taken up as income on an accrual basis.
(j) InventoriesInventories are valued at the lower of cost and net realisable value.
Costs incurred in bringing each product to its present location and condition are accounted for as follows:
Gaming inventories which include food, beverages and general stores are costed on a weighted average basis.
Net realisable value is the estimated selling price in the ordinary course of business, less estimated costs of completion and the estimated costs necessary to make the sale.
(k) Investments in associates
Th e Group’s investment in its associates are accounted for under the equity method of accounting in the consolidated fi nancial statements. Th ese are entities in which the Group has signifi cant infl uence and which are not subsidiaries.
Th e fi nancial statements of the associates are used by the Group to apply the equity method. Where associates apply diff erent accounting policies to the Group, adjustments are made upon application of the equity method.
Investments in the associates, as recorded in the parent entity (Crown Limited) accounts, are carried at cost.
Th e investment in the associates is carried in the consolidated balance sheet at cost plus post-acquisition changes in the Group’s share of net assets of the associates, less any impairment in value. Th e consolidated income statement refl ects the Group’s share of the results of operations of the associates.
Where there has been a change recognised directly in the associates’ equity, the Group recognises its share of any changes and discloses this, when applicable in the consolidated statement of recognised income and expense.
(l) Investments
All investments are initially recognised at cost, being the fair value of the consideration given and including acquisition charges associated with the investment.
After initial recognition, investments, which are classifi ed as available-for-sale, are measured at fair value. Gains or losses on available-for-sale investments are recognised as a separate component of equity until the investment is sold, collected or otherwise disposed of, or until the investment is determined to be impaired, at which time the cumulative gain or loss previously reported in equity is included in the income statement.
Non-derivative fi nancial assets with fi xed or determinable payments and fi xed maturity are classifi ed as held-to-maturity when the Group has the positive intention and ability to hold to maturity. Investments intended to be held for an undefi ned period are not included in this classifi cation.
Other long-term investments that are intended to be held-to-maturity, such as bonds, are subsequently measured at amortised cost using the eff ective interest method. Amortised cost is calculated by taking into account any discount or premium on acquisition, over the period to maturity.
For investments carried at amortised cost, gains and losses are recognised in income when the investments are derecognised or impaired, as well as through the amortisation process.
For investments that are actively traded in organised fi nancial markets, fair value is determined by reference to Stock Exchange quoted market bid prices at the close of business on the balance sheet date. For investments where there is no quoted market price, fair value is determined by reference to the current market value of another instrument which is substantially the same or is calculated based on the expected cash fl ows of the underlying net asset base of the investment.
(m) Property, plant and equipment
Property, plant and equipment is stated at cost less accumulated depreciation and any impairment in value.
Depreciation and amortisation is calculated on a straight-line basis over the estimated useful life of the asset as follows:
Freehold buildings – 40 to 75 yearsLeasehold improvements – lease termPlant and equipment – 2 to 15 years
C R O W N L I M I T E D A N N U A L R E P O R T 2 0 0 8
p . 7 7
1. SUMMARY OF SIGNIFICANT ACCOUNTING POLICIES continued
(m) Property, plant and equipment continued
ImpairmentTh e carrying values of property, plant and equipment are reviewed for impairment when events or changes in circumstances indicate the carrying value may not be recoverable. For an asset that does not generate largely independent cash infl ows, the recoverable amount is determined for the cash-generating unit to which the asset belongs. If any such indication exists and where the carrying values exceed the estimated recoverable amount, the assets or cash-generating units are written down to their recoverable amount.
Th e recoverable amount of property, plant and equipment is the greater of fair value less costs to sell and value in use. In assessing value in use, the estimated future cash fl ows are discounted to their present value using a pre-tax discount rate that refl ects current market assessments of the time value of money and the risks specifi c to the asset.
An item of property, plant and equipment is derecognised upon disposal or when no future economic benefi ts are expected to arise from the continued use of the asset.
Any gain or loss arising on derecognition of the asset (calculated as the diff erence between the net disposal proceeds and the carrying amount of the item) is included in the income statement in the period the item is derecognised.
(n) Intangible assets
LicencesLicences are carried at cost.
Th e directors regularly assess the carrying value of casino licences so as to ensure they are not carried at a value greater than their recoverable amount.
Th e casino licence premiums are carried at cost of acquisition. Th e Crown Melbourne licence is being amortised on a straight-line basis over the remaining life of the licence from the time PBL acquired Crown Melbourne, being 34 years. Th e Burswood licence is perpetual and, as such, no amortisation is charged. Th e Burswood licence is subject to an annual impairment assessment.
GoodwillGoodwill on acquisition is initially measured at cost being the excess of the cost of the business combination over the acquirer’s interest in the net fair value of the identifi able assets, liabilities and contingent liabilities. Following initial recognition, goodwill is measured at cost less any accumulated impairment losses. Goodwill is not amortised.
As at the acquisition date, any goodwill acquired is allocated to each of the cash-generating units expected to benefi t from the combination’s synergies.
Goodwill is reviewed for impairment, annually or more frequently if events or changes in circumstances indicate
that the carrying value may be impaired. Impairment is determined by assessing the recoverable amount of the cash generating unit to which the goodwill relates. Where the recoverable amount of the cash-generating unit is less than the carrying amount, an impairment loss is recognised.
Where goodwill forms part of a cash-generating unit and part of the operation within that unit is disposed of, the goodwill associated with the operation disposed of is included in the carrying amount of the operation when determining the gain or loss on disposal of the operation. Goodwill disposed of in this circumstance is measured on the basis of the relative values of the operation disposed of and the portion of the cash-generating unit retained.
Development costsDevelopment expenditure incurred on an individual project is carried forward when its future recoverability can reasonably be regarded as assured.
Following the initial recognition of the development expenditure, the cost model is applied requiring the asset to be carried at cost less any accumulated amortisation and accumulated impairment losses. Any expenditure carried forward is amortised over the period of expected future sales from the related project.
Th e carrying value of development costs is reviewed for impairment annually when the asset is not yet in use, or more frequently when an indicator of impairment arises during the reporting year indicating that the carrying value may not be recoverable.
Other intangible assets
Acquired both separately and from a business combination.
Intangible assets acquired separately are capitalised at cost and from a business combination are capitalised at fair value as at the date of acquisition. Following initial recognition, the cost model is applied to the class of intangible assets.
Th e useful lives of these intangible assets are assessed to be either fi nite or indefi nite. Where amortisation is charged on assets with fi nite lives, this expense is taken to the income statement.
Intangible assets, excluding development costs, created within the business are not capitalised and expenditure is charged against profi ts in the period in which the expenditure is incurred.
Intangible assets are tested for impairment where an indicator of impairment exists, and in the case of indefi nite lived intangibles annually, either individually or at the cash generating unit level. Useful lives are also examined on an annual basis and adjustments, where applicable, are made on a prospective basis.
Gains or losses arising from derecognition of an intangible asset are measured as the diff erence between the net disposal proceeds and the carrying amount of the asset and are recognised in the income statement when the net asset is derecognised.
Notes to the Financial Statements continued
For the year ended 30 June 2008
p . 7 8
1. SUMMARY OF SIGNIFICANT ACCOUNTING POLICIES continued
(o) Recoverable amount of assets
At each reporting date, the Group assesses whether there is any indication that an asset may be impaired. Where an indicator of impairment exists, the Group makes a formal estimate of recoverable amount. Where the carrying amount of an asset exceeds its recoverable amount the asset is considered impaired and is written down to its recoverable amount.
Recoverable amount is the greater of fair value less costs to sell and value in use. It is determined for an individual asset, unless the asset’s value in use cannot be estimated to be close to its fair value less costs to sell and it does not generate cash infl ows that are largely independent of those from other assets or groups of assets, in which case, the recoverable amount is determined for the cash-generating unit to which the asset belongs. In assessing value in use, the estimated future cash fl ows are discounted to their present value using a pre-tax discount rate that refl ects current market assessments of the time value of money and the risks specifi c to the asset.
(p) Trade and other payables
Liabilities are brought to account for amounts payable in relation to goods received and services rendered, whether or not billed to the Group at reporting date. Th e Group operates in a number of diverse markets, and accordingly the terms of trade vary by business.
(q) Interest-bearing loans and borrowings
All loans and borrowings are initially recognised at cost, being the fair value of the consideration received net of issue costs associated with the borrowing.
After initial recognition, interest-bearing loans and borrowings are subsequently measured at amortised cost using the eff ective interest method. Amortised cost is calculated by taking into account any issue costs, and any discount or premium on settlement.
Gains and losses are recognised in the income statement when the liabilities are derecognised and as well as through the amortisation process.
Borrowing costsBorrowing costs are capitalised on qualifying assets. Other borrowing costs are recognised as an expense when incurred.
(r) Provisions
Provisions are recognised when the economic entity has a legal or constructive obligation to make a future sacrifi ce of economic benefi ts to other entities as a result of past transactions or other events, it is probable that a future sacrifi ce of economic benefi t will be required and a reliable estimate can be made of the amount of the obligation.
If the eff ect of the time value of money is material, provisions are discounted using a current pre-tax rate that refl ects the risks specifi c to the liability. When discounting is used, the increase in the provision due to the passage of time is recognised as a borrowing cost.
A provision for dividends is not recognised as a liability unless the dividends are declared, determined or publicly recommended on or before the reporting date.
(s) Employee benefi ts
Provision is made for employee benefi ts accumulated as a result of employees rendering services up to balance date including related on-costs. Th e benefi ts include wages and salaries, incentives, compensated absences and other benefi ts, which are charged against profi ts in their respective expense categories when services are provided or benefi ts vest with the employee.
Th e provision for employee benefi ts is measured at the remuneration rates expected to be paid when the liability is settled. Benefi ts expected to be settled after twelve months from the reporting date are measured at the present value of the estimated future cash outfl ows to be made in respect of services provided by employees up to the reporting date.
Th e liability for long service leave is recognised in the provision for employee benefi ts and measured as the present value of expected future payments to be made in respect of services provided by employees up to the reporting date using the projected unit credit method. Consideration is given to expected future wage and salary levels, experience of employee departures, and periods of service. Expected future payments are discounted using market yields at the reporting date on national government bonds with terms to maturity and currencies that match, as closely as possible, the estimated future cash outfl ows.
(t) Share-based payment transactions
Equity settled transactionsTh e Group provides benefi ts to senior executives in the form of share-based payments, whereby executives render services in exchange for shares or rights over shares (equity-settled transactions).
Th e plan in place to provide these benefi ts is the Executive Share Plan (ESP).
Th e cost of these equity-settled transactions with executives is measured by reference to the fair value of the equity instruments at the date which they are granted. Th e fair value is determined by an external valuer using the Monte Carlo model, further details of which are given in note 30.
In valuing equity-settled transactions, no account is taken of any performance conditions, other than conditions linked to the price of the shares of Crown Limited, further details of which are given in note 28.
C R O W N L I M I T E D A N N U A L R E P O R T 2 0 0 8
p . 7 9
1. SUMMARY OF SIGNIFICANT ACCOUNTING POLICIES continued
(t) Share-based payment transactions continued
Equity settled transactions continued
Th e cost of equity-settled transactions is recognised, together with a corresponding increase in equity, over the period in which the performance and/or service conditions are fulfi lled, ending on the date on which the relevant executives become fully entitled to the award (the vesting period).
Th e cumulative expense recognised for equity-settled transactions at each reporting date until vesting dates refl ects:
(i) the extent to which the vesting period has expired and
(ii) the Groups best estimate of the number of equity instruments that will ultimately vest.
No adjustment is made for the likelihood of market performance conditions being met as the eff ect of these conditions is included in the determination of fair value at grant date. Th e income statement charge or credit for a period represents the movement in cumulative expense recognised as at the beginning and end of that period.
(u) Leases
Finance leases, which transfer to the Group substantially all the risks and benefi ts incidental to ownership of the leased item, are capitalised at the inception of the lease at the fair value of the leased property or, if lower, at the present value of the minimum lease payments.
Lease payments are apportioned between the fi nance charges and reduction of the leased liability so as to achieve a constant rate of interest on the remaining balance of the liability.
Operating lease payments are recognised as an expense in the income statement on a straight-line basis over the lease term.
(v) Derecognition of fi nancial instruments
Th e derecognition of a fi nancial instrument takes place when the Group no longer controls the contractual rights that comprise the fi nancial instrument, which is normally the case when the instrument is sold, or all the cash fl ows attributable to the instrument are passed through to an independent third party.
(w) Derivative fi nancial instruments
Th e Group uses derivative fi nancial instruments such as foreign currency contracts and interest rate swaps to hedge its risks associated with interest rate and foreign currency fl uctuations. Such derivative fi nancial instruments are stated at fair value.
Th e fair value of forward exchange contracts is calculated by reference to current forward exchange rates for contracts with similar maturity profi les. Th e fair value of interest rate
swap contracts is determined by reference to market values for similar instruments.
For the purposes of hedge accounting, hedges are classifi ed as either fair value hedges when they hedge the exposure to changes in the fair value of a recognised asset or liability; or cash fl ow hedges where they hedge exposure to variability in cash fl ows that is either attributable to a particular risk associated with a recognised asset or liability or a forecasted transaction.
In relation to fair value hedges (interest rate swaps) which meet the conditions for special hedge accounting, any gain or loss from remeasuring the hedging instrument at fair value is recognised immediately in the income statement.
Any gain or loss attributable to the hedged risk on remeasurement of the hedged item is adjusted against the carrying amount of the hedged item and recognised in the income statement. Where the adjustment is to the carrying amount of a hedged interest-bearing fi nancial instrument, the adjustment is amortised to the income statement such that it is fully amortised by maturity.
In relation to cash fl ow hedges (forward foreign exchange contracts) to hedge fi rm commitments which meet the conditions for special hedge accounting, the portion of the gain or loss on the hedging instrument that is determined to be an eff ective hedge is recognised directly in equity and the ineff ective portion is recognised in the income statement. When the hedged fi rm commitment results in the recognition of an asset or a liability, then, at the time the asset or liability is recognised, the associated gains or losses that had previously been recognised in equity are included in the initial measurement of the acquisition cost or other carrying amount of the asset or liability.
For all other cash fl ow hedges, the gains or losses that are recognised in equity are transferred to the income statement in the same year in which the hedged fi rm commitment aff ects the net profi t and loss, for example when the future sale actually occurs.
For derivatives that do not qualify for hedge accounting, any gains or losses arising from changes in fair value are taken directly to the income statement.
Hedge accounting is discontinued when the hedging instrument expires or is sold, terminated or exercised, or no longer qualifi es for hedge accounting. At that point in time, any cumulative gain or loss on the hedging instrument recognised in equity is kept in equity until the forecasted transaction occurs. If a hedged transaction is no longer expected to occur, the net cumulative gain or loss recognised in equity is transferred to the income statement.
(x) Impairment of fi nancial assets
Th e Group assesses at each balance sheet date whether a fi nancial asset or group of fi nancial assets is impaired.
Notes to the Financial Statements continued
For the year ended 30 June 2008
p . 8 0
1. SUMMARY OF SIGNIFICANT ACCOUNTING POLICIES continued
(x) Impairment of fi nancial assets continued
(i) Financial assets carried at amortised costIf there is objective evidence that an impairment loss on loans and receivables carried at amortised cost has been incurred, the amount of the loss is measured as the diff erence between the assets carrying amount and the present value of estimated future cash fl ows (excluding future credit losses that have not been incurred) discounted at the fi nancial assets original eff ective interest rate (ie: the eff ective interest rate computed at initial recognition). Th e carrying amount of the asset is reduced either directly or through use of an allowance account. Th e amount of the loss is recognised in profi t or loss.
Th e Group fi rst assesses whether objective evidence of impairment exists individually for fi nancial assets that are individually signifi cant, and individually or collectively for fi nancial assets that are not individually signifi cant. If it is determined that no objective evidence of impairment exists for an individually assessed fi nancial asset, whether signifi cant or not, the asset is included in a group of fi nancial assets with similar credit risk characteristics and that group of fi nancial assets is collectively assessed for impairment. Assets that are individually assessed for impairment and for which an impairment loss is or continues to be recognised are not included in a collective assessment of impairment.
If, in a subsequent period, the amount of the impairment loss decreases and the decrease can be related objectively to an event occurring after the impairment was recognised, the previously recognised impairment loss is reversed. Any subsequent reversal of an impairment loss is recognised in profi t or loss, to the extent that the carrying value of the asset does not exceed its amortised cost at the reversal date.
(ii) Financial assets carried at costIf there is objective evidence that an impairment loss has been incurred on an unquoted equity instrument that is not carried at fair value (because its fair value cannot be reliably measured), or on a derivative asset that is linked to and must be settled by delivery of such an unquoted equity instrument, the amount of the loss is measured as the diff erence between the assets carrying amount and the present value of estimated cash fl ows, discounted at the current market rate of return for a similar fi nancial asset.
(iii) Available-for-sale investmentsIf there is objective evidence that an available-for-sale investment is impaired, an amount comprising the diff erence between its cost (net of any principal repayment and amortisation) and its current fair value, less any impairment loss previously recognised in profi t or loss, is transferred from equity to the income statement. Reversals of impairment losses for equity instruments classifi ed as available-for-sale are not recognised in profi t. Reversals
of impairment losses for debt instruments are reversed through profi t or loss if the increase in an instruments fair value can be objectively related to an event occurring after the impairment loss was recognised in profi t or loss.
(y) Contributed equity
Ordinary shares are classifi ed as equity. Issued capital is recognised at the fair value of the consideration received by the Company, less transaction costs.
(z) Revenue
Revenue is recognised to the extent that it is probable that the economic benefi ts will fl ow to the Group and the revenue can be reliably measured. Th e following specifi c recognition criteria must also be met before revenue is recognised:
Sale of goodsRevenue is recognised when the signifi cant risks and rewards of ownership of the goods have passed to the buyer and can be measured reliably. Risks and rewards are considered passed to the buyer at the time of delivery of the goods to the customer.
Rendering of servicesControl of the right to be compensated for the services and the stage of completion can be reliably measured.
Casino revenues are the net of gaming wins and losses.
InterestRevenue is recognised as the interest accrues (using the eff ective interest method, which is the rate that exactly discounts estimated future cash receipts through the expected life of the fi nancial instrument) to the net carrying amount of the fi nancial asset.
DividendsRevenue is recognised when the shareholders’ right to receive the payment is established.
(aa) Earnings per share
Basic EPS is calculated as net profi t attributable to members of the parent, adjusted to exclude any costs of servicing equity (other than dividends) and preference share dividends, divided by the weighted average number of ordinary shares, adjusted for any bonus element.
Diluted EPS is calculated as net profi t attributable to members of the parent, adjusted for:
• costs of servicing equity (other than dividends) and preference share dividends;
• the after tax eff ect of dividends and interest associated with dilutive potential ordinary shares that have been recognised as expenses; and
• other non-discretionary changes in revenues or expenses during the period that would result from the dilution of potential ordinary shares;
divided by the weighted average number of ordinary shares and dilutive potential ordinary shares, adjusted for any bonus element.
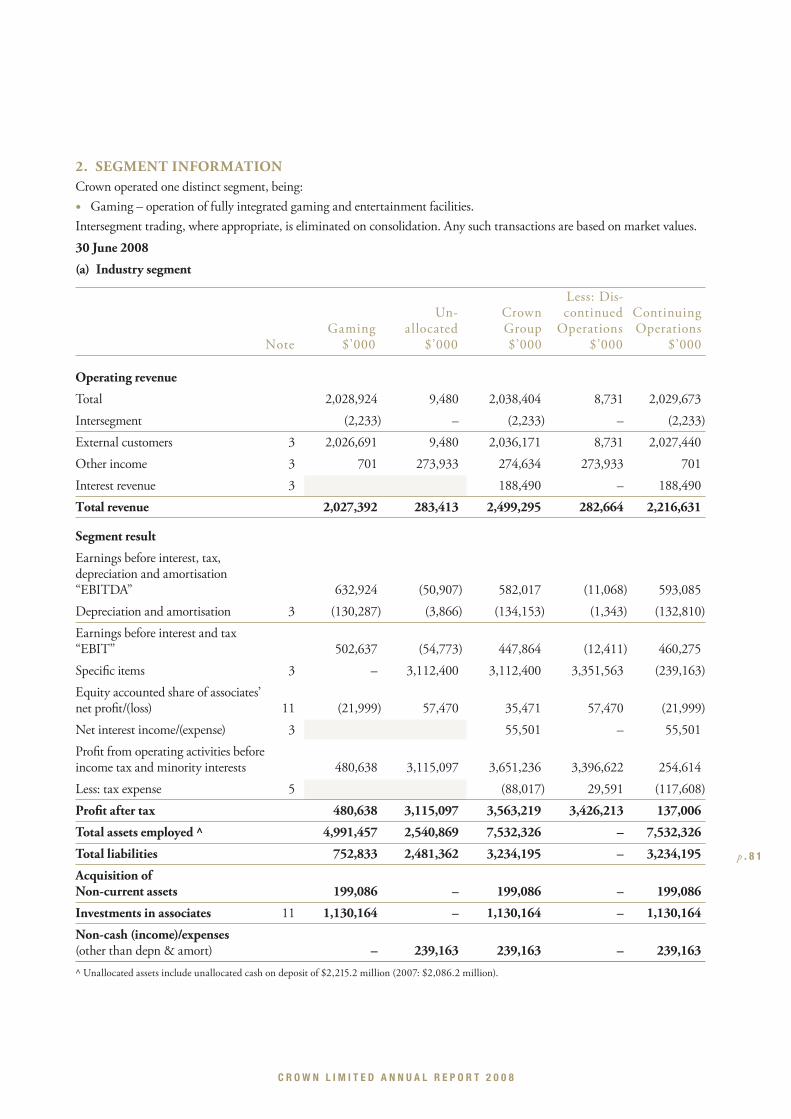
C R O W N L I M I T E D A N N U A L R E P O R T 2 0 0 8
p . 8 1
2. SEGMENT INFORMATIONCrown operated one distinct segment, being:
• Gaming – operation of fully integrated gaming and entertainment facilities.
Intersegment trading, where appropriate, is eliminated on consolidation. Any such transactions are based on market values.
30 June 2008
(a) Industry segment
Less: Dis- Un- Crown continued Continuing Gaming allocated Group Operations Operations Note $’000 $’000 $’000 $’000 $’000
Operating revenue
Total 2,028,924 9,480 2,038,404 8,731 2,029,673
Intersegment (2,233) – (2,233) – (2,233)
External customers 3 2,026,691 9,480 2,036,171 8,731 2,027,440
Other income 3 701 273,933 274,634 273,933 701
Interest revenue 3 188,490 – 188,490
Total revenue 2,027,392 283,413 2,499,295 282,664 2,216,631
Segment result
Earnings before interest, tax, depreciation and amortisation “EBITDA” 632,924 (50,907) 582,017 (11,068) 593,085
Depreciation and amortisation 3 (130,287) (3,866) (134,153) (1,343) (132,810)
Earnings before interest and tax “EBIT” 502,637 (54,773) 447,864 (12,411) 460,275
Specifi c items 3 – 3,112,400 3,112,400 3,351,563 (239,163)
Equity accounted share of associates’ net profi t/(loss) 11 (21,999) 57,470 35,471 57,470 (21,999)
Net interest income/(expense) 3 55,501 – 55,501
Profi t from operating activities before income tax and minority interests 480,638 3,115,097 3,651,236 3,396,622 254,614
Less: tax expense 5 (88,017) 29,591 (117,608)
Profi t after tax 480,638 3,115,097 3,563,219 3,426,213 137,006
Total assets employed ^ 4,991,457 2,540,869 7,532,326 – 7,532,326
Total liabilities 752,833 2,481,362 3,234,195 – 3,234,195
Acquisition of Non-current assets 199,086 – 199,086 – 199,086
Investments in associates 11 1,130,164 – 1,130,164 – 1,130,164
Non-cash (income)/expenses(other than depn & amort) – 239,163 239,163 – 239,163
^ Unallocated assets include unallocated cash on deposit of $2,215.2 million (2007: $2,086.2 million).
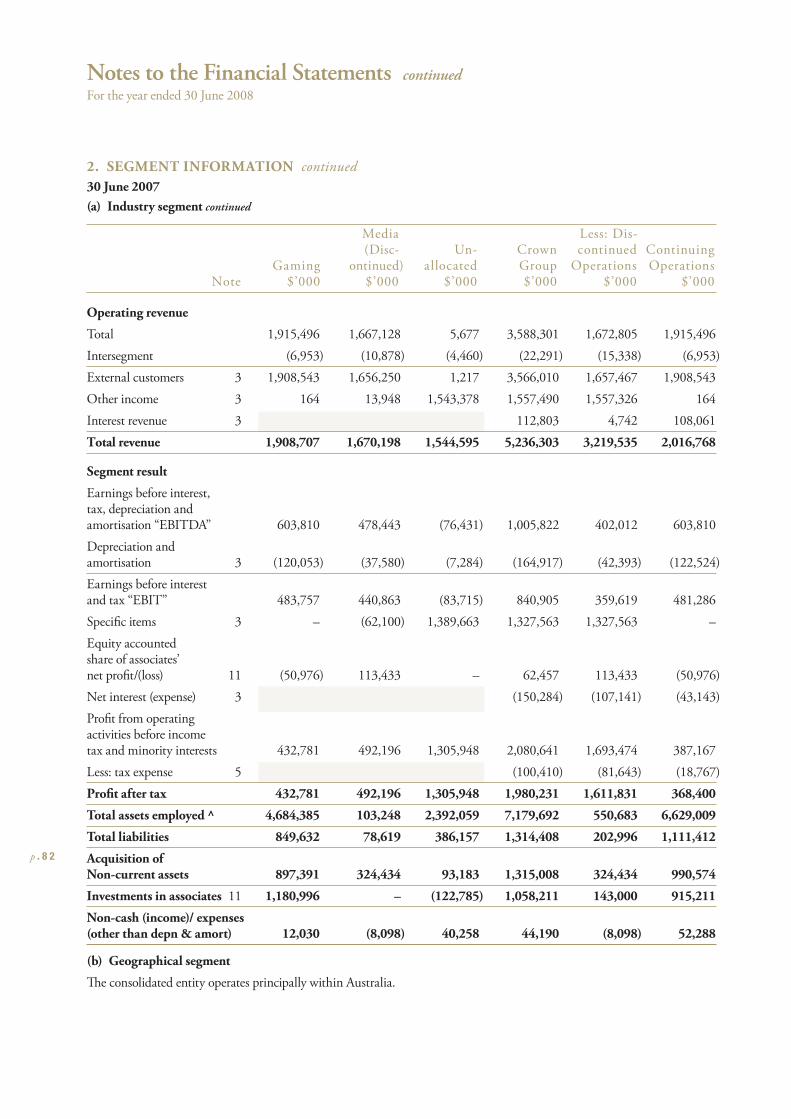
Notes to the Financial Statements continued
For the year ended 30 June 2008
p . 8 2
2. SEGMENT INFORMATION continued
30 June 2007(a) Industry segment continued
Media Less: Dis- (Disc- Un- Crown continued Continuing Gaming ontinued) allocated Group Operations Operations Note $’000 $’000 $’000 $’000 $’000 $’000
Operating revenue
Total 1,915,496 1,667,128 5,677 3,588,301 1,672,805 1,915,496
Intersegment (6,953) (10,878) (4,460) (22,291) (15,338) (6,953)
External customers 3 1,908,543 1,656,250 1,217 3,566,010 1,657,467 1,908,543
Other income 3 164 13,948 1,543,378 1,557,490 1,557,326 164
Interest revenue 3 112,803 4,742 108,061
Total revenue 1,908,707 1,670,198 1,544,595 5,236,303 3,219,535 2,016,768
Segment result
Earnings before interest, tax, depreciation and amortisation “EBITDA” 603,810 478,443 (76,431) 1,005,822 402,012 603,810
Depreciation and amortisation 3 (120,053) (37,580) (7,284) (164,917) (42,393) (122,524)
Earnings before interest and tax “EBIT” 483,757 440,863 (83,715) 840,905 359,619 481,286
Specifi c items 3 – (62,100) 1,389,663 1,327,563 1,327,563 –
Equity accounted share of associates’ net profi t/(loss) 11 (50,976) 113,433 – 62,457 113,433 (50,976)
Net interest (expense) 3 (150,284) (107,141) (43,143)
Profi t from operating activities before income tax and minority interests 432,781 492,196 1,305,948 2,080,641 1,693,474 387,167
Less: tax expense 5 (100,410) (81,643) (18,767)
Profi t after tax 432,781 492,196 1,305,948 1,980,231 1,611,831 368,400
Total assets employed ^ 4,684,385 103,248 2,392,059 7,179,692 550,683 6,629,009
Total liabilities 849,632 78,619 386,157 1,314,408 202,996 1,111,412
Acquisition of Non-current assets 897,391 324,434 93,183 1,315,008 324,434 990,574
Investments in associates 11 1,180,996 – (122,785) 1,058,211 143,000 915,211
Non-cash (income)/ expenses(other than depn & amort) 12,030 (8,098) 40,258 44,190 (8,098) 52,288
(b) Geographical segment
Th e consolidated entity operates principally within Australia.
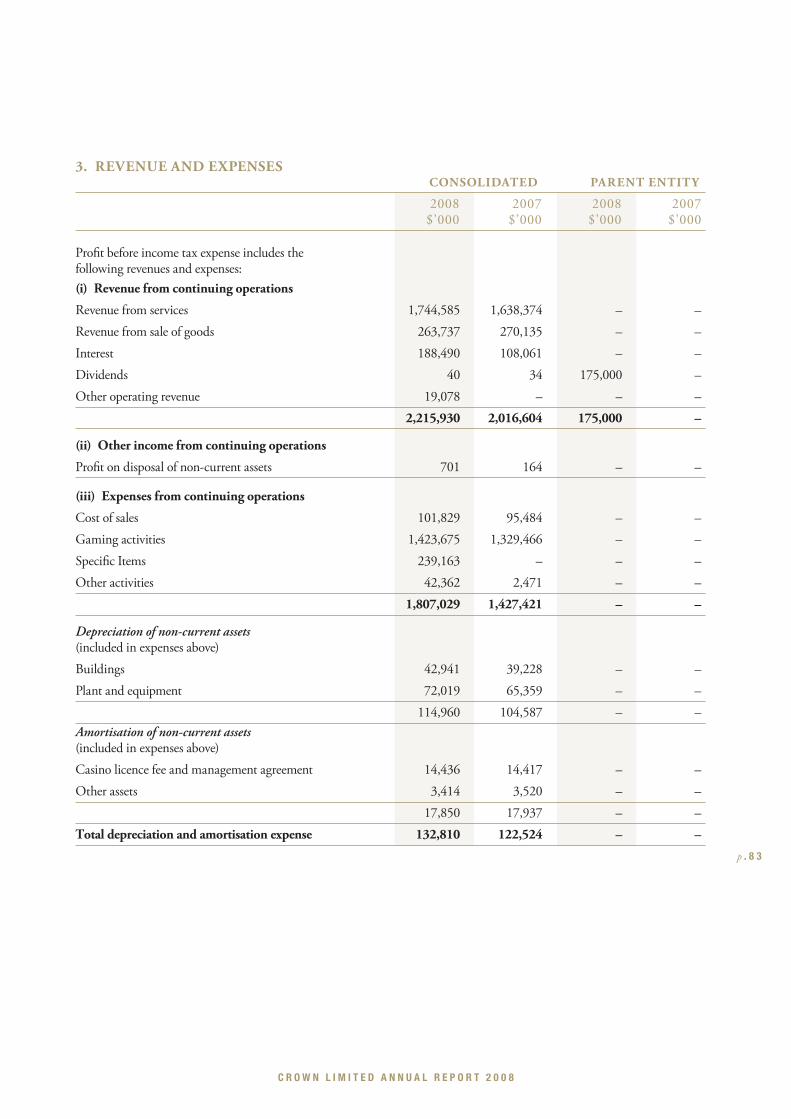
C R O W N L I M I T E D A N N U A L R E P O R T 2 0 0 8
p . 8 3
3. REVENUE AND EXPENSES CONSOLIDATED PARENT ENTITY
2008 2007 2008 2007 $’000 $’000 $’000 $’000
Profi t before income tax expense includes the following revenues and expenses:
(i) Revenue from continuing operations
Revenue from services 1,744,585 1,638,374 – –
Revenue from sale of goods 263,737 270,135 – –
Interest 188,490 108,061 – –
Dividends 40 34 175,000 –
Other operating revenue 19,078 – – –
2,215,930 2,016,604 175,000 –
(ii) Other income from continuing operations
Profi t on disposal of non-current assets 701 164 – –
(iii) Expenses from continuing operations
Cost of sales 101,829 95,484 – –
Gaming activities 1,423,675 1,329,466 – –
Specifi c Items 239,163 – – –
Other activities 42,362 2,471 – –
1,807,029 1,427,421 – –
Depreciation of non-current assets(included in expenses above)
Buildings 42,941 39,228 – –
Plant and equipment 72,019 65,359 – –
114,960 104,587 – –
Amortisation of non-current assets(included in expenses above)
Casino licence fee and management agreement 14,436 14,417 – –
Other assets 3,414 3,520 – –
17,850 17,937 – –
Total depreciation and amortisation expense 132,810 122,524 – –
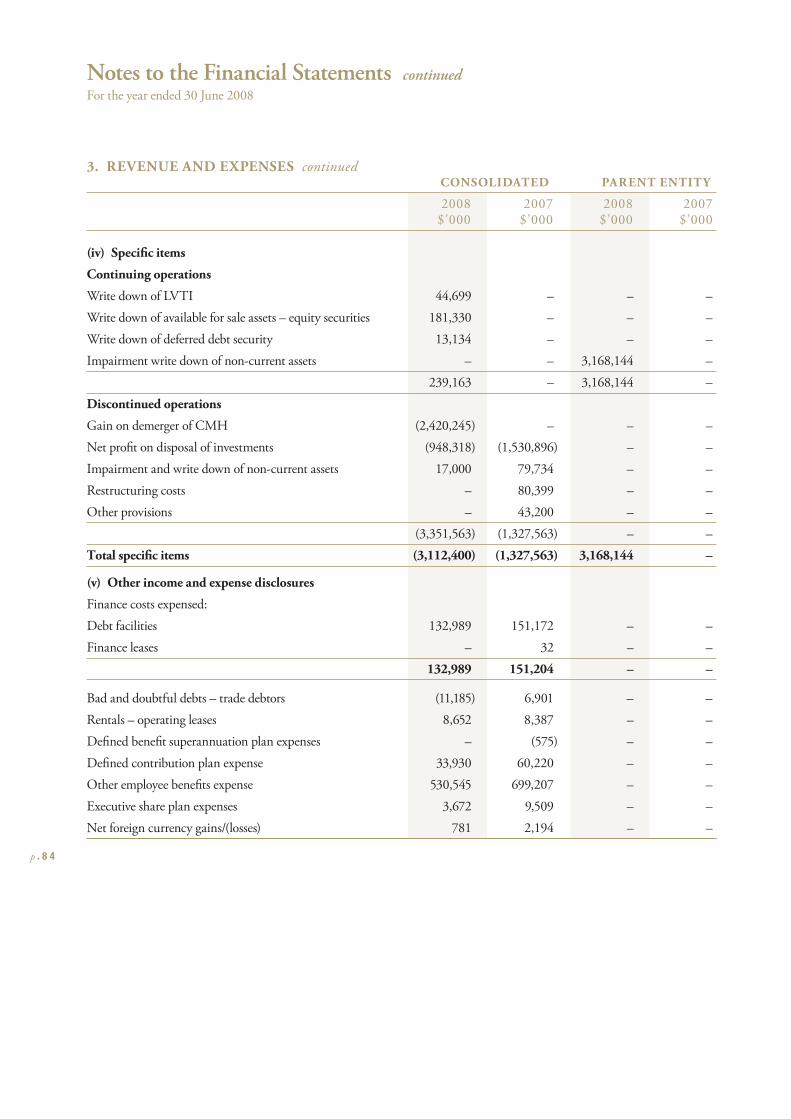
Notes to the Financial Statements continued
For the year ended 30 June 2008
p . 8 4
3. REVENUE AND EXPENSES continued CONSOLIDATED PARENT ENTITY
2008 2007 2008 2007 $’000 $’000 $’000 $’000
(iv) Specifi c items
Continuing operations
Write down of LVTI 44,699 – – –
Write down of available for sale assets – equity securities 181,330 – – –
Write down of deferred debt security 13,134 – – –
Impairment write down of non-current assets – – 3,168,144 –
239,163 – 3,168,144 –
Discontinued operations
Gain on demerger of CMH (2,420,245) – – –
Net profi t on disposal of investments (948,318) (1,530,896) – –
Impairment and write down of non-current assets 17,000 79,734 – –
Restructuring costs – 80,399 – –
Other provisions – 43,200 – –
(3,351,563) (1,327,563) – –
Total specifi c items (3,112,400) (1,327,563) 3,168,144 –
(v) Other income and expense disclosures
Finance costs expensed:
Debt facilities 132,989 151,172 – –
Finance leases – 32 – –
132,989 151,204 – –
Bad and doubtful debts – trade debtors (11,185) 6,901 – –
Rentals – operating leases 8,652 8,387 – –
Defi ned benefi t superannuation plan expenses – (575) – –
Defi ned contribution plan expense 33,930 60,220 – –
Other employee benefi ts expense 530,545 699,207 – –
Executive share plan expenses 3,672 9,509 – –
Net foreign currency gains/(losses) 781 2,194 – –
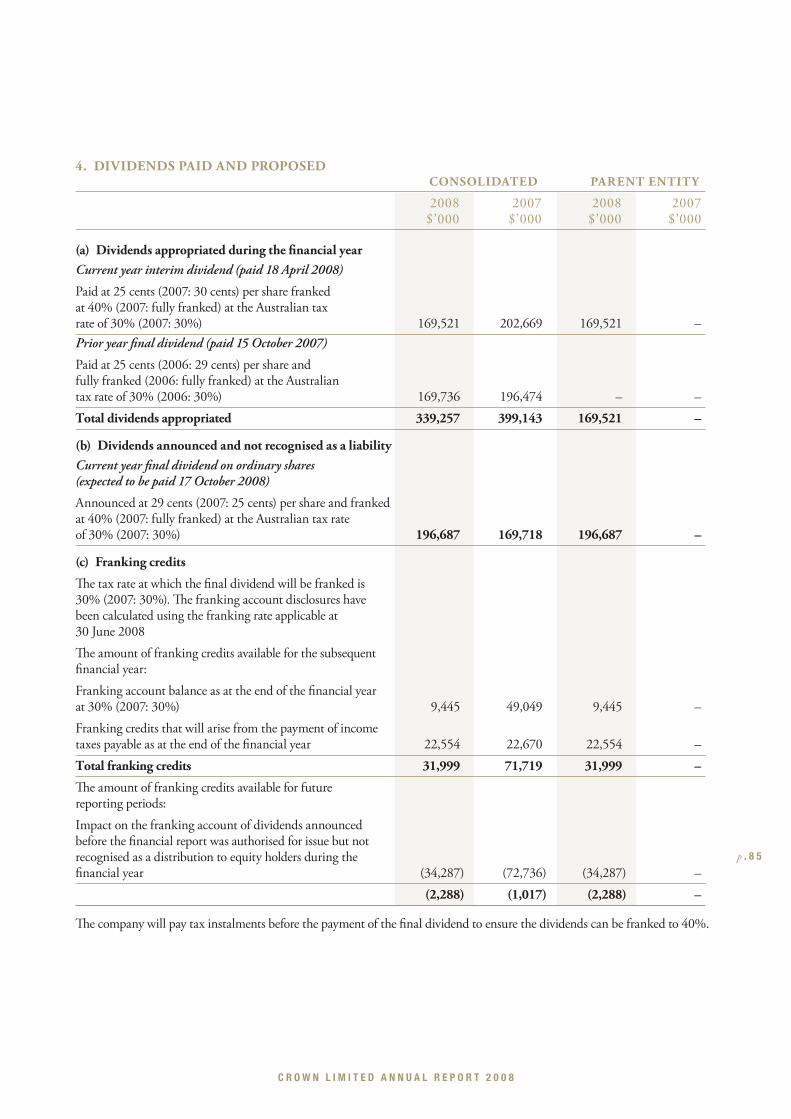
C R O W N L I M I T E D A N N U A L R E P O R T 2 0 0 8
p . 8 5
4. DIVIDENDS PAID AND PROPOSED CONSOLIDATED PARENT ENTITY
2008 2007 2008 2007 $’000 $’000 $’000 $’000
(a) Dividends appropriated during the fi nancial yearCurrent year interim dividend (paid 18 April 2008)
Paid at 25 cents (2007: 30 cents) per share franked at 40% (2007: fully franked) at the Australian tax rate of 30% (2007: 30%) 169,521 202,669 169,521 –
Prior year fi nal dividend (paid 15 October 2007)
Paid at 25 cents (2006: 29 cents) per share and fully franked (2006: fully franked) at the Australian tax rate of 30% (2006: 30%) 169,736 196,474 – –
Total dividends appropriated 339,257 399,143 169,521 –
(b) Dividends announced and not recognised as a liabilityCurrent year fi nal dividend on ordinary shares(expected to be paid 17 October 2008)
Announced at 29 cents (2007: 25 cents) per share and franked at 40% (2007: fully franked) at the Australian tax rate of 30% (2007: 30%) 196,687 169,718 196,687 –
(c) Franking credits
Th e tax rate at which the fi nal dividend will be franked is 30% (2007: 30%). Th e franking account disclosures have been calculated using the franking rate applicable at 30 June 2008
Th e amount of franking credits available for the subsequent fi nancial year:
Franking account balance as at the end of the fi nancial year at 30% (2007: 30%) 9,445 49,049 9,445 –
Franking credits that will arise from the payment of income taxes payable as at the end of the fi nancial year 22,554 22,670 22,554 –
Total franking credits 31,999 71,719 31,999 –
Th e amount of franking credits available for future reporting periods:
Impact on the franking account of dividends announced before the fi nancial report was authorised for issue but not recognised as a distribution to equity holders during the fi nancial year (34,287) (72,736) (34,287) –
(2,288) (1,017) (2,288) –
Th e company will pay tax instalments before the payment of the fi nal dividend to ensure the dividends can be franked to 40%.
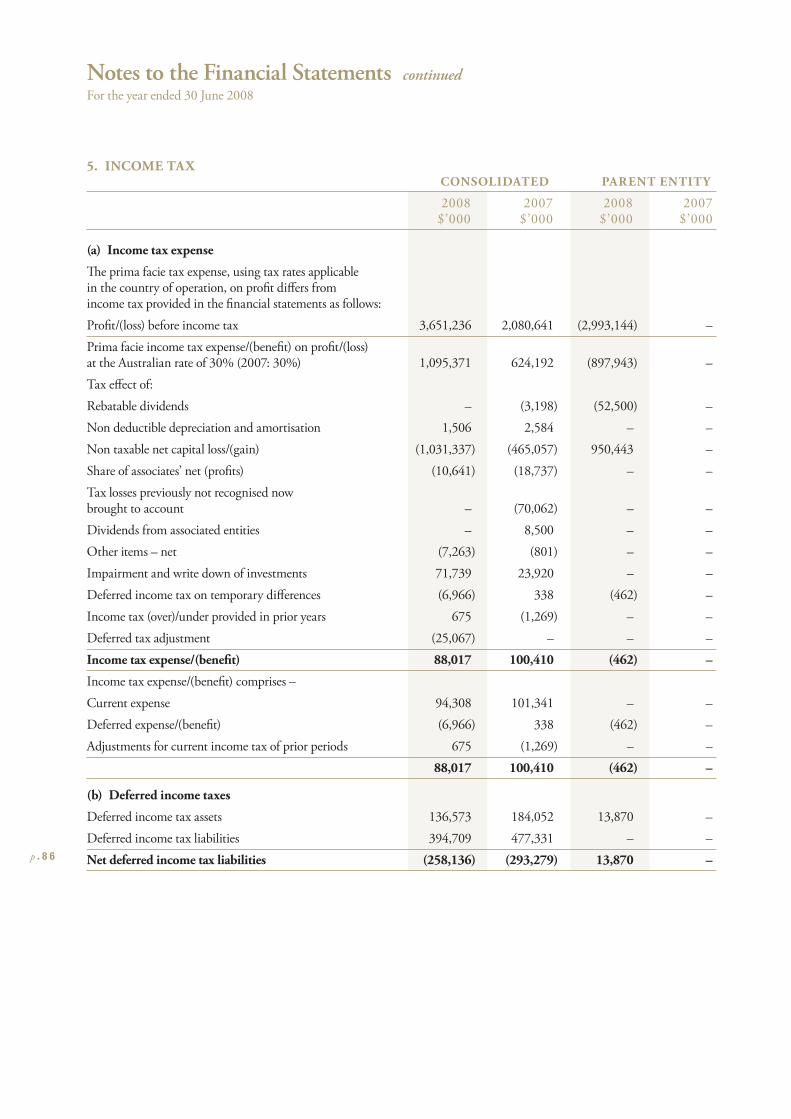
Notes to the Financial Statements continued
For the year ended 30 June 2008
p . 8 6
5. INCOME TAX CONSOLIDATED PARENT ENTITY
2008 2007 2008 2007 $’000 $’000 $’000 $’000
(a) Income tax expense
Th e prima facie tax expense, using tax rates applicable in the country of operation, on profi t diff ers from income tax provided in the fi nancial statements as follows:
Profi t/(loss) before income tax 3,651,236 2,080,641 (2,993,144) –
Prima facie income tax expense/(benefi t) on profi t/(loss) at the Australian rate of 30% (2007: 30%) 1,095,371 624,192 (897,943) –
Tax eff ect of:
Rebatable dividends – (3,198) (52,500) –
Non deductible depreciation and amortisation 1,506 2,584 – –
Non taxable net capital loss/(gain) (1,031,337) (465,057) 950,443 –
Share of associates’ net (profi ts) (10,641) (18,737) – –
Tax losses previously not recognised now brought to account – (70,062) – –
Dividends from associated entities – 8,500 – –
Other items – net (7,263) (801) – –
Impairment and write down of investments 71,739 23,920 – –
Deferred income tax on temporary diff erences (6,966) 338 (462) –
Income tax (over)/under provided in prior years 675 (1,269) – –
Deferred tax adjustment (25,067) – – –
Income tax expense/(benefi t) 88,017 100,410 (462) –
Income tax expense/(benefi t) comprises –
Current expense 94,308 101,341 – –
Deferred expense/(benefi t) (6,966) 338 (462) –
Adjustments for current income tax of prior periods 675 (1,269) – –
88,017 100,410 (462) –
(b) Deferred income taxes
Deferred income tax assets 136,573 184,052 13,870 –
Deferred income tax liabilities 394,709 477,331 – –
Net deferred income tax liabilities (258,136) (293,279) 13,870 –
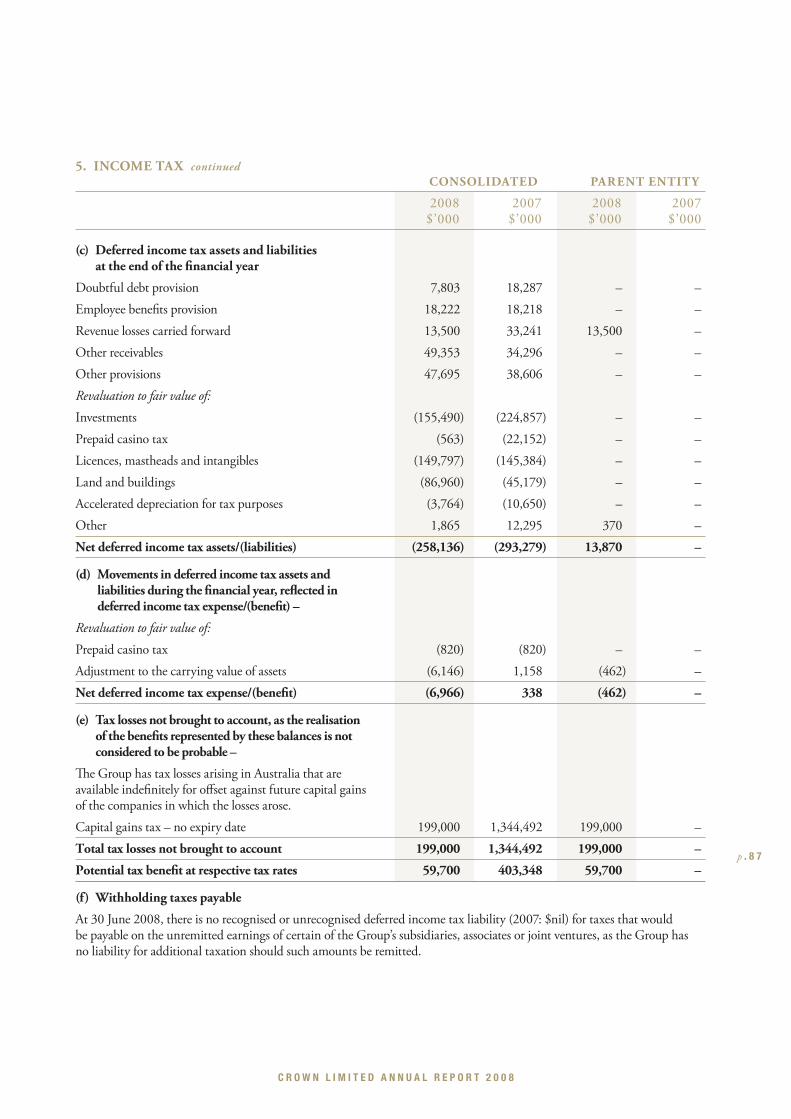
C R O W N L I M I T E D A N N U A L R E P O R T 2 0 0 8
p . 8 7
5. INCOME TAX continued
CONSOLIDATED PARENT ENTITY
2008 2007 2008 2007 $’000 $’000 $’000 $’000
(c) Deferred income tax assets and liabilities at the end of the fi nancial year
Doubtful debt provision 7,803 18,287 – –
Employee benefi ts provision 18,222 18,218 – –
Revenue losses carried forward 13,500 33,241 13,500 –
Other receivables 49,353 34,296 – –
Other provisions 47,695 38,606 – –
Revaluation to fair value of:
Investments (155,490) (224,857) – –
Prepaid casino tax (563) (22,152) – –
Licences, mastheads and intangibles (149,797) (145,384) – –
Land and buildings (86,960) (45,179) – –
Accelerated depreciation for tax purposes (3,764) (10,650) – –
Other 1,865 12,295 370 –
Net deferred income tax assets/(liabilities) (258,136) (293,279) 13,870 –
(d) Movements in deferred income tax assets and liabilities during the fi nancial year, refl ected in deferred income tax expense/(benefi t) –
Revaluation to fair value of:
Prepaid casino tax (820) (820) – –
Adjustment to the carrying value of assets (6,146) 1,158 (462) –
Net deferred income tax expense/(benefi t) (6,966) 338 (462) –
(e) Tax losses not brought to account, as the realisation of the benefi ts represented by these balances is not considered to be probable –
Th e Group has tax losses arising in Australia that are available indefi nitely for off set against future capital gains of the companies in which the losses arose.
Capital gains tax – no expiry date 199,000 1,344,492 199,000 –
Total tax losses not brought to account 199,000 1,344,492 199,000 –
Potential tax benefi t at respective tax rates 59,700 403,348 59,700 –
(f) Withholding taxes payable
At 30 June 2008, there is no recognised or unrecognised deferred income tax liability (2007: $nil) for taxes that would be payable on the unremitted earnings of certain of the Group’s subsidiaries, associates or joint ventures, as the Group has no liability for additional taxation should such amounts be remitted.
Notes to the Financial Statements continued
For the year ended 30 June 2008
p . 8 8
5. INCOME TAX continued
(g) Tax consolidationCrown Limited and its 100% owned Australian resident subsidiaries have formed a tax consolidated group with eff ect from 1 July 2007. Crown Limited is the head entity of the tax consolidated group. Members of the group have entered into a tax sharing arrangement with Crown Limited in order to allocate income tax expense between Crown Limited and the wholly owned subsidiaries. In addition, the agreement provides for the allocation of income tax liabilities between the entities should the head entity default on its tax payment obligations. At the balance date the possibility of default is remote.
(h) Tax eff ect accounting by members of the tax consolidated groupMembers of the tax consolidated group have entered into a tax funding agreement. Th e tax funding agreement provides for the allocation of current and deferred taxes to members of the tax consolidated group in accordance with their taxable income for the period. Th e allocation of taxes under the tax funding agreement is recognised as an increase/decrease in the subsidiaries intercompany accounts with the tax consolidated group head company, Crown Limited.
6. DISCONTINUED OPERATIONS(a) Details of discontinued operationsDemerger of CMHOn 12 December 2007, Crown disposed of its Media businesses by way of a demerger of Consolidated Media Holdings Limited. Th e demerger was eff ected by returning 1 CMH share to shareholders for each Crown share held.
Th e net assets of CMH at the time of demerger were $131.6 million. Th e value of CMH at the demerger date was $2,551.8 million. A gain of $2,420.2 million was therefore recorded on demerger. Th e $131.6 million has been recorded as a reduction of capital in the consolidated accounts and the $2,420.2 million has been accounted for as an internal distribution in the consolidated accounts.
As part of the demerger the following material entities were disposed:
– Consolidated Media Holdings Ltd (formally PBL)
– Windfyr Pty Ltd (and controlled entities)
– PBL Media Holdings Shareholder Pty Ltd (and controlled entities)
– PBL Pay TV Pty Ltd (and controlled entities)
PBL MediaOn 10 September 2007 PBL disposed half of its 50% investment (25%) in PBL Media for proceeds of $526.4 million. Th e cost base disposed by PBL relating to the share disposed was negative $347.3 million resulting in a profi t on disposal of $873.7 million.
Ticketing and EventsOn 17 July 2007, PBL sold its Ticketing and Events business to PBL Media for $210.0 million in cash. PBL’s cost base in the Ticketing and Events business at the time of the sale was $50.5 million. At the time of the transaction PBL owned 50% of PBL Media, therefore 50% of these net assets and 50% of the debt funding that PBL Media used for the acquisition were transferred to PBL’s investment in PBL Media ($79.7 million). Th e residual 50% was disposed, resulting in a gain on disposal of $79.7 million.
Th e material entities disposed as part of this transaction were:
– Ticketek Pty Limited
– Sydney Superdome Pty Limited; and
– Events Management Catering Pty Limited
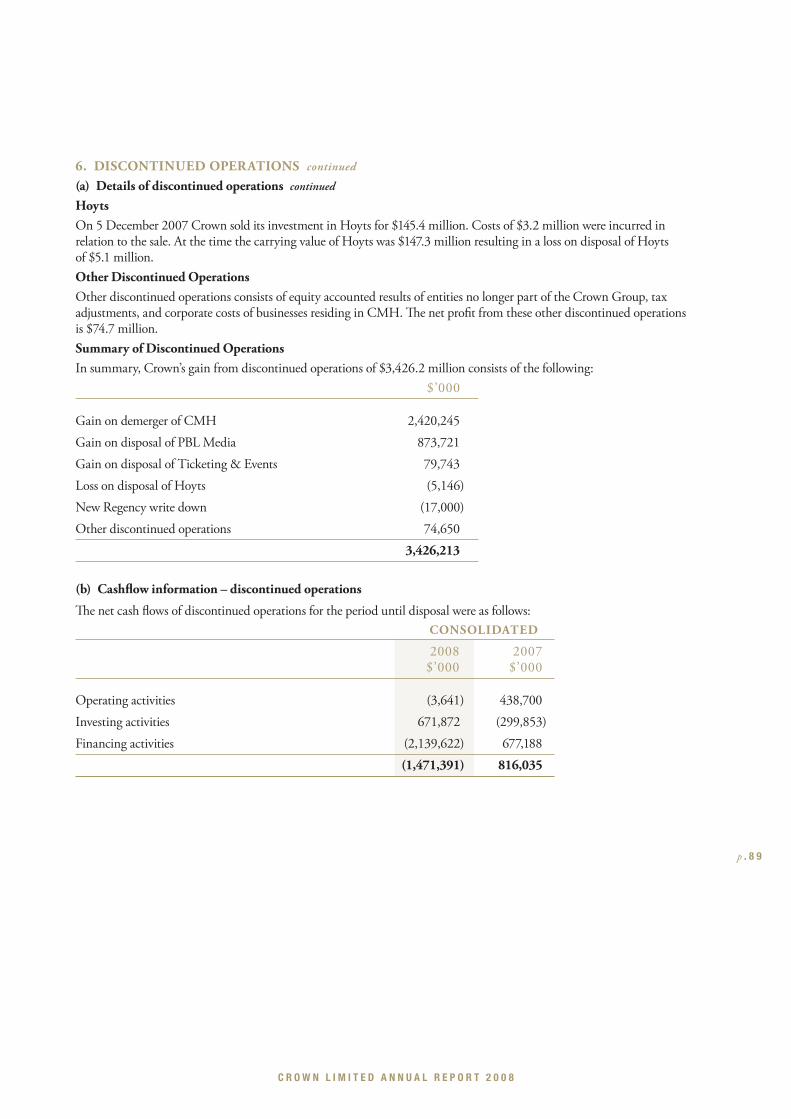
C R O W N L I M I T E D A N N U A L R E P O R T 2 0 0 8
p . 8 9
6. DISCONTINUED OPERATIONS continued
(a) Details of discontinued operations continued
HoytsOn 5 December 2007 Crown sold its investment in Hoyts for $145.4 million. Costs of $3.2 million were incurred in relation to the sale. At the time the carrying value of Hoyts was $147.3 million resulting in a loss on disposal of Hoyts of $5.1 million.
Other Discontinued OperationsOther discontinued operations consists of equity accounted results of entities no longer part of the Crown Group, tax adjustments, and corporate costs of businesses residing in CMH. Th e net profi t from these other discontinued operations is $74.7 million.
Summary of Discontinued OperationsIn summary, Crown’s gain from discontinued operations of $3,426.2 million consists of the following:
$’000
Gain on demerger of CMH 2,420,245
Gain on disposal of PBL Media 873,721
Gain on disposal of Ticketing & Events 79,743
Loss on disposal of Hoyts (5,146)
New Regency write down (17,000)
Other discontinued operations 74,650
3,426,213
(b) Cashfl ow information – discontinued operations
Th e net cash fl ows of discontinued operations for the period until disposal were as follows:
CONSOLIDATED
2008 2007 $’000 $’000
Operating activities (3,641) 438,700
Investing activities 671,872 (299,853)
Financing activities (2,139,622) 677,188
(1,471,391) 816,035
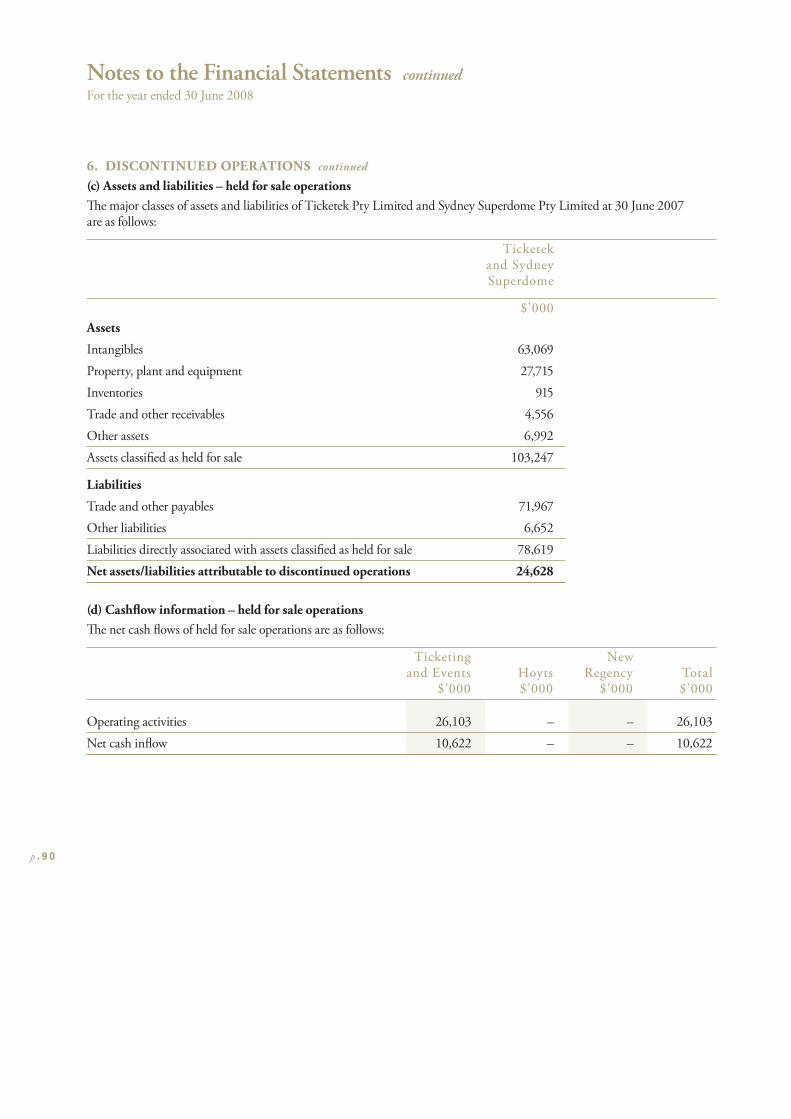
Notes to the Financial Statements continued
For the year ended 30 June 2008
p . 9 0
6. DISCONTINUED OPERATIONS continued
(c) Assets and liabilities – held for sale operationsTh e major classes of assets and liabilities of Ticketek Pty Limited and Sydney Superdome Pty Limited at 30 June 2007 are as follows:
Ticketek and Sydney Superdome
$’000
Assets
Intangibles 63,069
Property, plant and equipment 27,715
Inventories 915
Trade and other receivables 4,556
Other assets 6,992
Assets classifi ed as held for sale 103,247
Liabilities
Trade and other payables 71,967
Other liabilities 6,652
Liabilities directly associated with assets classifi ed as held for sale 78,619
Net assets/liabilities attributable to discontinued operations 24,628
(d) Cashfl ow information – held for sale operationsTh e net cash fl ows of held for sale operations are as follows:
Ticketing New and Events Hoyts Regency Total $’000 $’000 $’000 $’000
Operating activities 26,103 – – 26,103
Net cash infl ow 10,622 – – 10,622
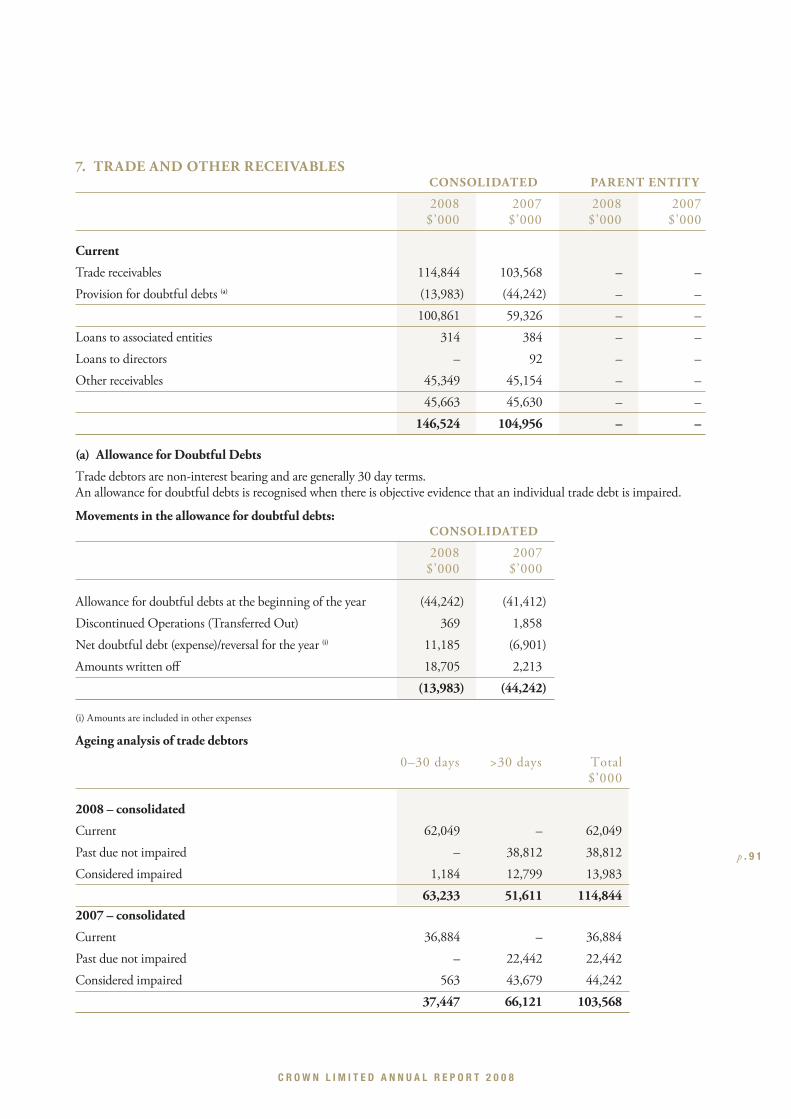
C R O W N L I M I T E D A N N U A L R E P O R T 2 0 0 8
p . 9 1
7. TRADE AND OTHER RECEIVABLES CONSOLIDATED PARENT ENTITY
2008 2007 2008 2007 $’000 $’000 $’000 $’000
Current
Trade receivables 114,844 103,568 – –
Provision for doubtful debts (a) (13,983) (44,242) – –
100,861 59,326 – –
Loans to associated entities 314 384 – –
Loans to directors – 92 – –
Other receivables 45,349 45,154 – –
45,663 45,630 – –
146,524 104,956 – –
(a) Allowance for Doubtful Debts
Trade debtors are non-interest bearing and are generally 30 day terms.An allowance for doubtful debts is recognised when there is objective evidence that an individual trade debt is impaired.
Movements in the allowance for doubtful debts: CONSOLIDATED
2008 2007 $’000 $’000
Allowance for doubtful debts at the beginning of the year (44,242) (41,412)
Discontinued Operations (Transferred Out) 369 1,858
Net doubtful debt (expense)/reversal for the year (i) 11,185 (6,901)
Amounts written off 18,705 2,213
(13,983) (44,242)
(i) Amounts are included in other expenses
Ageing analysis of trade debtors
0–30 days >30 days Total $’000
2008 – consolidated
Current 62,049 – 62,049
Past due not impaired – 38,812 38,812
Considered impaired 1,184 12,799 13,983
63,233 51,611 114,8442007 – consolidated
Current 36,884 – 36,884
Past due not impaired – 22,442 22,442
Considered impaired 563 43,679 44,242
37,447 66,121 103,568
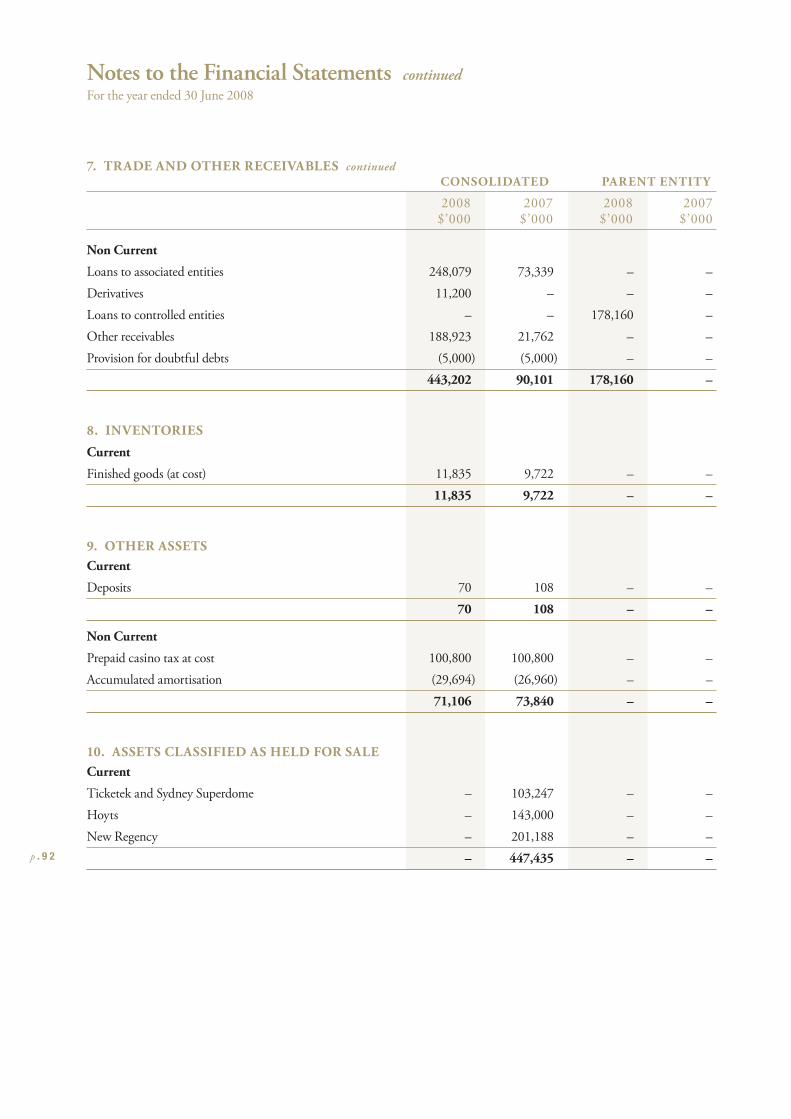
Notes to the Financial Statements continued
For the year ended 30 June 2008
p . 9 2
7. TRADE AND OTHER RECEIVABLES continued
CONSOLIDATED PARENT ENTITY
2008 2007 2008 2007 $’000 $’000 $’000 $’000
Non Current
Loans to associated entities 248,079 73,339 – –
Derivatives 11,200 – – –
Loans to controlled entities – – 178,160 –
Other receivables 188,923 21,762 – –
Provision for doubtful debts (5,000) (5,000) – –
443,202 90,101 178,160 –
8. INVENTORIES
Current
Finished goods (at cost) 11,835 9,722 – –
11,835 9,722 – –
9. OTHER ASSETSCurrent
Deposits 70 108 – –
70 108 – –
Non Current
Prepaid casino tax at cost 100,800 100,800 – –
Accumulated amortisation (29,694) (26,960) – –
71,106 73,840 – –
10. ASSETS CLASSIFIED AS HELD FOR SALECurrent
Ticketek and Sydney Superdome – 103,247 – –
Hoyts – 143,000 – –
New Regency – 201,188 – –
– 447,435 – –
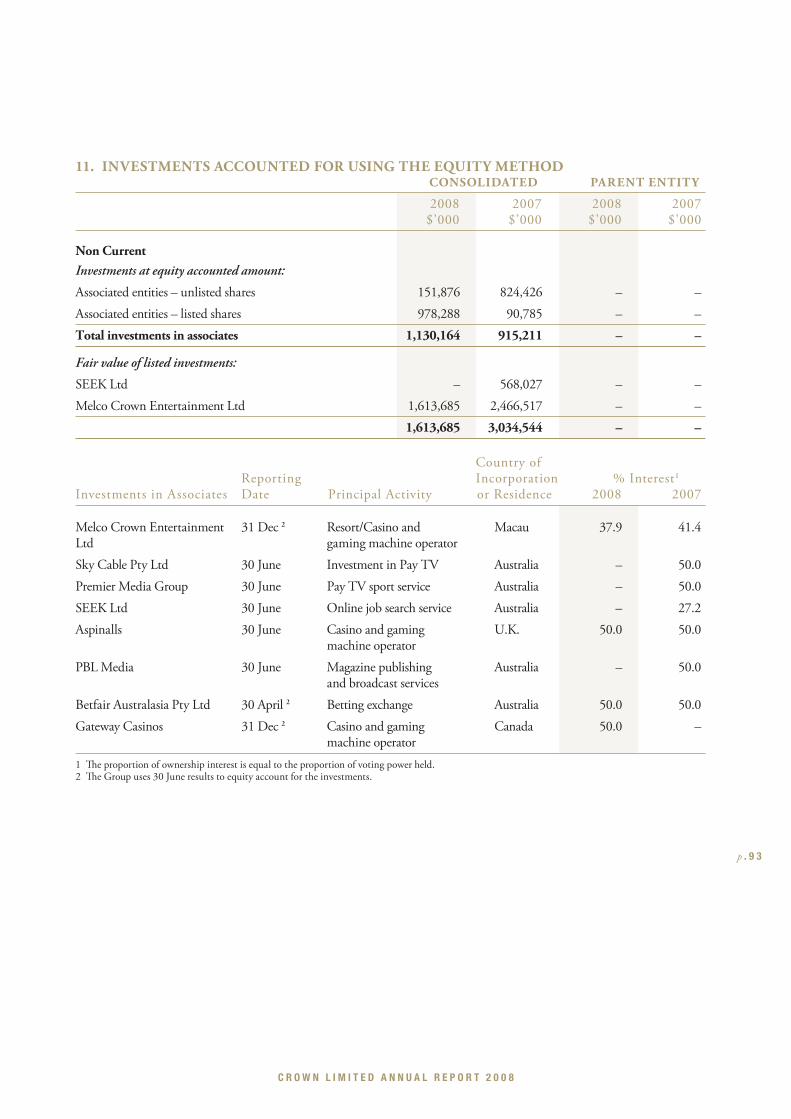
C R O W N L I M I T E D A N N U A L R E P O R T 2 0 0 8
p . 9 3
11. INVESTMENTS ACCOUNTED FOR USING THE EQUITY METHOD CONSOLIDATED PARENT ENTITY
2008 2007 2008 2007 $’000 $’000 $’000 $’000
Non CurrentInvestments at equity accounted amount:
Associated entities – unlisted shares 151,876 824,426 – –
Associated entities – listed shares 978,288 90,785 – –
Total investments in associates 1,130,164 915,211 – –
Fair value of listed investments:
SEEK Ltd – 568,027 – –
Melco Crown Entertainment Ltd 1,613,685 2,466,517 – –
1,613,685 3,034,544 – –
Country of Reporting Incorporation % Interest1
Investments in Associates Date Principal Activity or Residence 2008 2007
Melco Crown Entertainment 31 Dec 2 Resort/Casino and Macau 37.9 41.4Ltd gaming machine operator
Sky Cable Pty Ltd 30 June Investment in Pay TV Australia – 50.0
Premier Media Group 30 June Pay TV sport service Australia – 50.0
SEEK Ltd 30 June Online job search service Australia – 27.2
Aspinalls 30 June Casino and gaming U.K. 50.0 50.0 machine operator
PBL Media 30 June Magazine publishing Australia – 50.0 and broadcast services
Betfair Australasia Pty Ltd 30 April 2 Betting exchange Australia 50.0 50.0
Gateway Casinos 31 Dec 2 Casino and gaming Canada 50.0 – machine operator
1 Th e proportion of ownership interest is equal to the proportion of voting power held.2 Th e Group uses 30 June results to equity account for the investments.
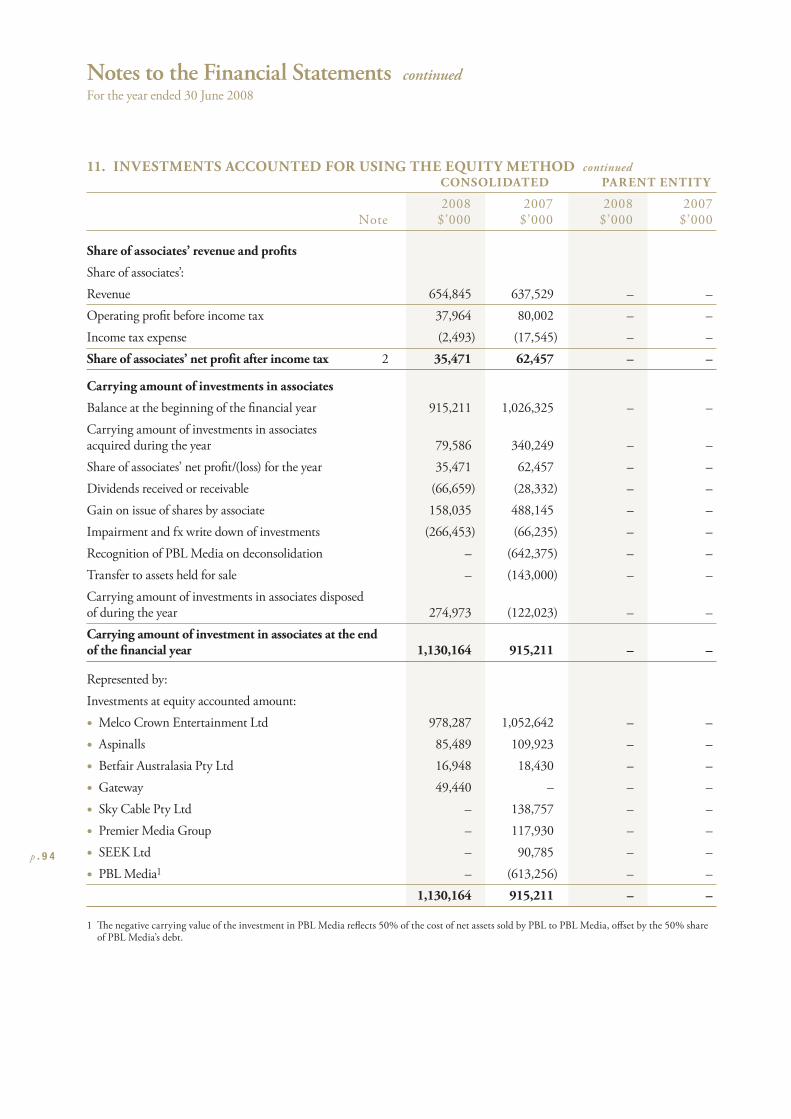
Notes to the Financial Statements continued
For the year ended 30 June 2008
p . 9 4
11. INVESTMENTS ACCOUNTED FOR USING THE EQUITY METHOD continued
CONSOLIDATED PARENT ENTITY
2008 2007 2008 2007 Note $’000 $’000 $’000 $’000
Share of associates’ revenue and profi ts
Share of associates’:
Revenue 654,845 637,529 – –
Operating profi t before income tax 37,964 80,002 – –
Income tax expense (2,493) (17,545) – –
Share of associates’ net profi t after income tax 2 35,471 62,457 – –
Carrying amount of investments in associates
Balance at the beginning of the fi nancial year 915,211 1,026,325 – –
Carrying amount of investments in associates acquired during the year 79,586 340,249 – –
Share of associates’ net profi t/(loss) for the year 35,471 62,457 – –
Dividends received or receivable (66,659) (28,332) – –
Gain on issue of shares by associate 158,035 488,145 – –
Impairment and fx write down of investments (266,453) (66,235) – –
Recognition of PBL Media on deconsolidation – (642,375) – –
Transfer to assets held for sale – (143,000) – –
Carrying amount of investments in associates disposed of during the year 274,973 (122,023) – –
Carrying amount of investment in associates at the end of the fi nancial year 1,130,164 915,211 – –
Represented by:
Investments at equity accounted amount:
• Melco Crown Entertainment Ltd 978,287 1,052,642 – –
• Aspinalls 85,489 109,923 – –
• Betfair Australasia Pty Ltd 16,948 18,430 – –
• Gateway 49,440 – – –
• Sky Cable Pty Ltd – 138,757 – –
• Premier Media Group – 117,930 – –
• SEEK Ltd – 90,785 – –
• PBL Media1 – (613,256) – –
1,130,164 915,211 – –
1 Th e negative carrying value of the investment in PBL Media refl ects 50% of the cost of net assets sold by PBL to PBL Media, off set by the 50% share of PBL Media’s debt.
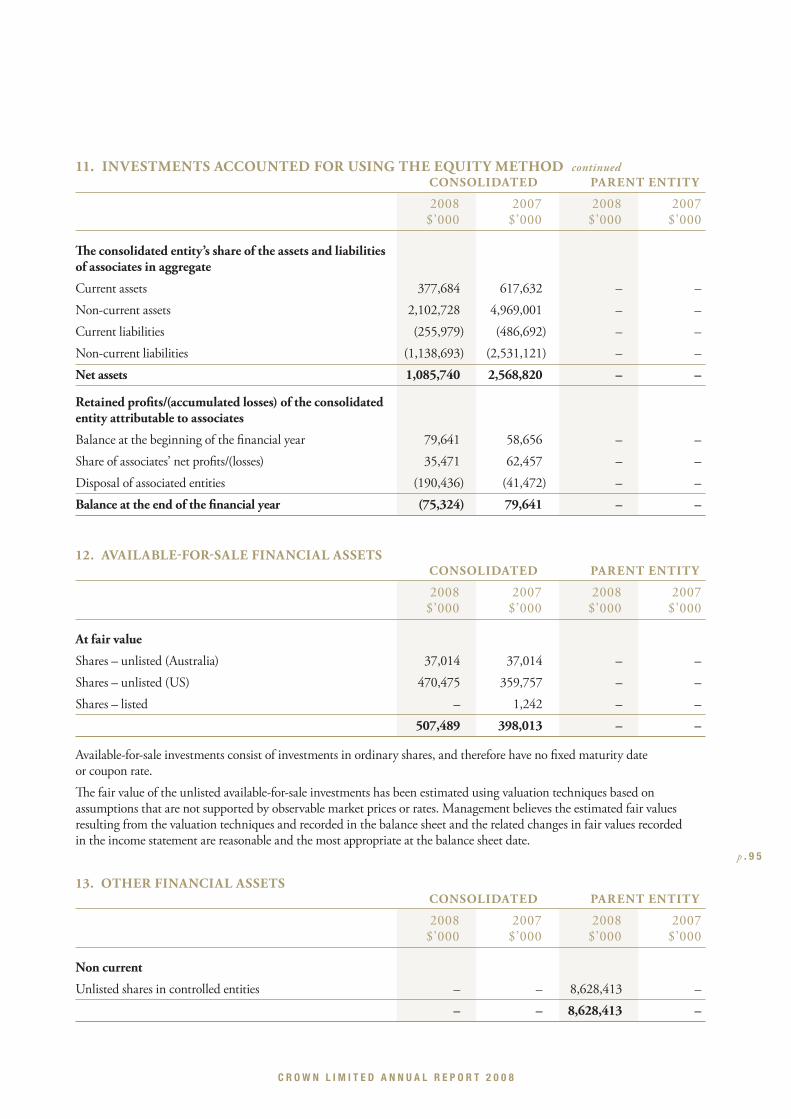
C R O W N L I M I T E D A N N U A L R E P O R T 2 0 0 8
p . 9 5
11. INVESTMENTS ACCOUNTED FOR USING THE EQUITY METHOD continued
CONSOLIDATED PARENT ENTITY
2008 2007 2008 2007 $’000 $’000 $’000 $’000
Th e consolidated entity’s share of the assets and liabilities of associates in aggregate
Current assets 377,684 617,632 – –
Non-current assets 2,102,728 4,969,001 – –
Current liabilities (255,979) (486,692) – –
Non-current liabilities (1,138,693) (2,531,121) – –
Net assets 1,085,740 2,568,820 – –
Retained profi ts/(accumulated losses) of the consolidated entity attributable to associates
Balance at the beginning of the fi nancial year 79,641 58,656 – –
Share of associates’ net profi ts/(losses) 35,471 62,457 – –
Disposal of associated entities (190,436) (41,472) – –
Balance at the end of the fi nancial year (75,324) 79,641 – –
12. AVAILABLEFORSALE FINANCIAL ASSETS CONSOLIDATED PARENT ENTITY
2008 2007 2008 2007 $’000 $’000 $’000 $’000
At fair value
Shares – unlisted (Australia) 37,014 37,014 – –
Shares – unlisted (US) 470,475 359,757 – –
Shares – listed – 1,242 – –
507,489 398,013 – –
Available-for-sale investments consist of investments in ordinary shares, and therefore have no fi xed maturity date or coupon rate.
Th e fair value of the unlisted available-for-sale investments has been estimated using valuation techniques based on assumptions that are not supported by observable market prices or rates. Management believes the estimated fair values resulting from the valuation techniques and recorded in the balance sheet and the related changes in fair values recorded in the income statement are reasonable and the most appropriate at the balance sheet date.
13. OTHER FINANCIAL ASSETS CONSOLIDATED PARENT ENTITY
2008 2007 2008 2007 $’000 $’000 $’000 $’000
Non current
Unlisted shares in controlled entities – – 8,628,413 –
– – 8,628,413 –
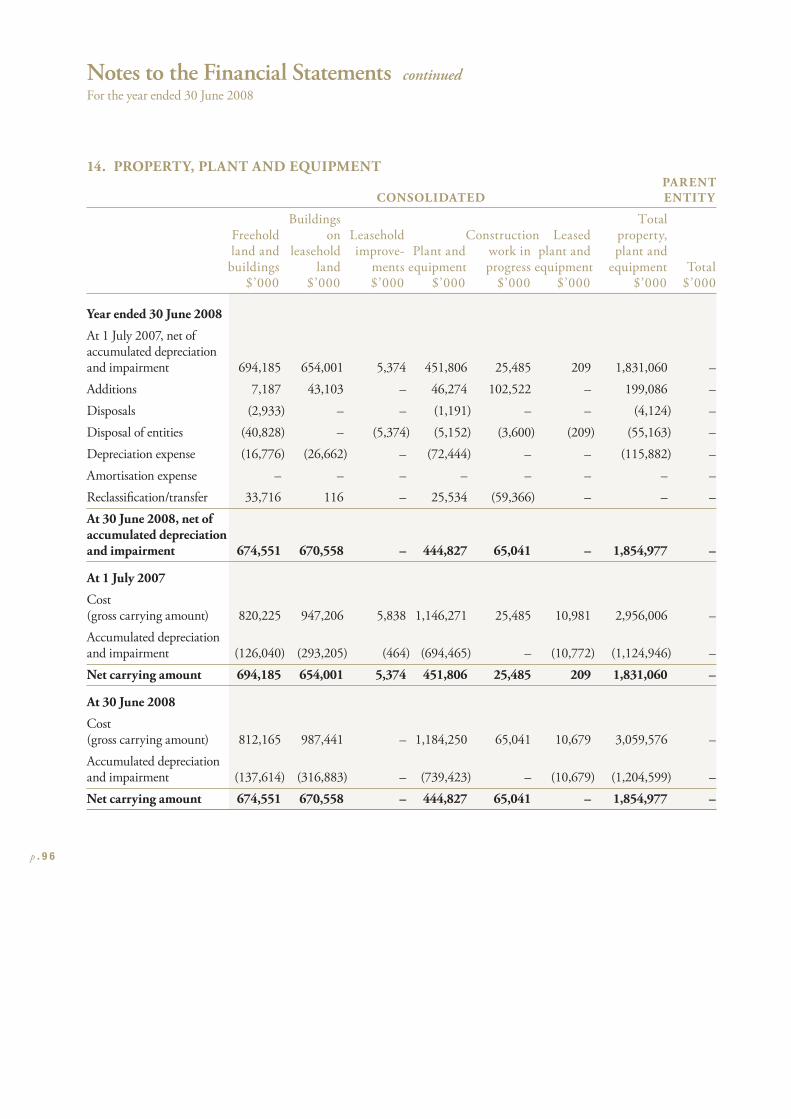
Notes to the Financial Statements continued
For the year ended 30 June 2008
p . 9 6
14. PROPERTY, PLANT AND EQUIPMENT PARENT CONSOLIDATED ENTITY
Buildings Total Freehold on Leasehold Construction Leased property, land and leasehold improve- Plant and work in plant and plant and buildings land ments equipment progress equipment equipment Total $’000 $’000 $’000 $’000 $’000 $’000 $’000 $’000
Year ended 30 June 2008
At 1 July 2007, net of accumulated depreciation and impairment 694,185 654,001 5,374 451,806 25,485 209 1,831,060 –
Additions 7,187 43,103 – 46,274 102,522 – 199,086 –
Disposals (2,933) – – (1,191) – – (4,124) –
Disposal of entities (40,828) – (5,374) (5,152) (3,600) (209) (55,163) –
Depreciation expense (16,776) (26,662) – (72,444) – – (115,882) –
Amortisation expense – – – – – – – –
Reclassifi cation/transfer 33,716 116 – 25,534 (59,366) – – –
At 30 June 2008, net of accumulated depreciation and impairment 674,551 670,558 – 444,827 65,041 – 1,854,977 –
At 1 July 2007
Cost (gross carrying amount) 820,225 947,206 5,838 1,146,271 25,485 10,981 2,956,006 –
Accumulated depreciation and impairment (126,040) (293,205) (464) (694,465) – (10,772) (1,124,946) –
Net carrying amount 694,185 654,001 5,374 451,806 25,485 209 1,831,060 –
At 30 June 2008
Cost (gross carrying amount) 812,165 987,441 – 1,184,250 65,041 10,679 3,059,576 –
Accumulated depreciation and impairment (137,614) (316,883) – (739,423) – (10,679) (1,204,599) –
Net carrying amount 674,551 670,558 – 444,827 65,041 – 1,854,977 –
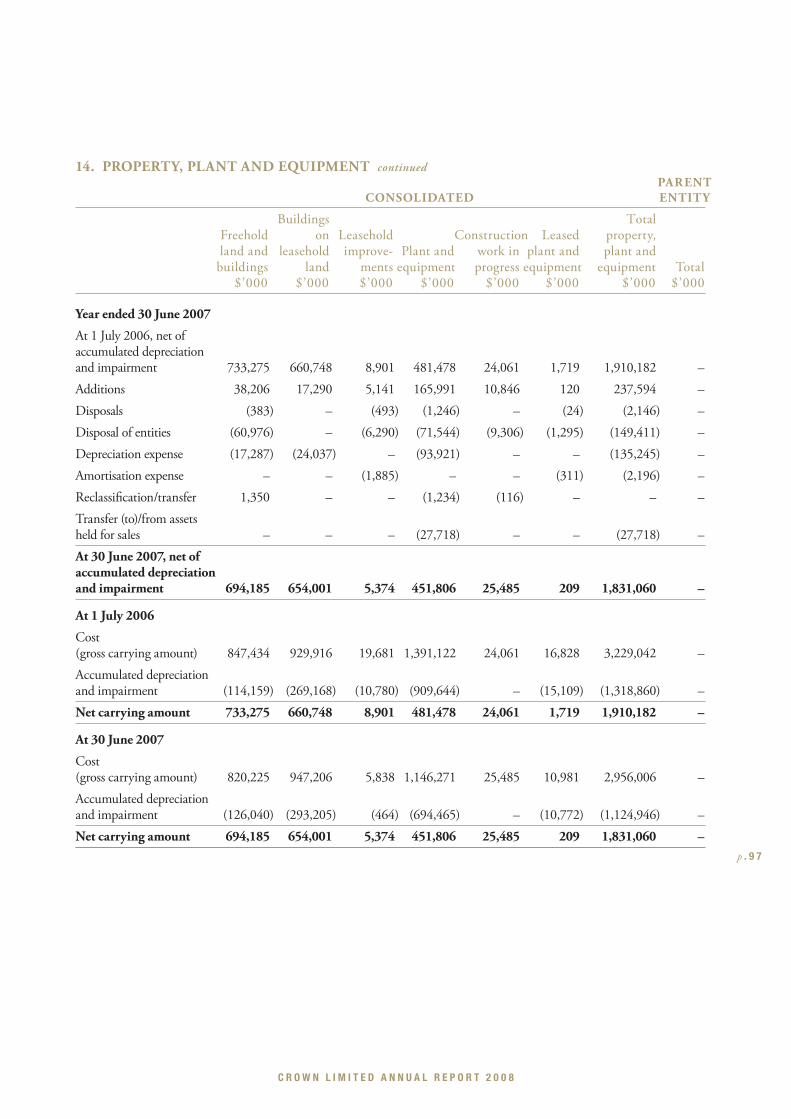
C R O W N L I M I T E D A N N U A L R E P O R T 2 0 0 8
p . 9 7
14. PROPERTY, PLANT AND EQUIPMENT continued
PARENT CONSOLIDATED ENTITY
Buildings Total Freehold on Leasehold Construction Leased property, land and leasehold improve- Plant and work in plant and plant and buildings land ments equipment progress equipment equipment Total $’000 $’000 $’000 $’000 $’000 $’000 $’000 $’000
Year ended 30 June 2007
At 1 July 2006, net of accumulated depreciation and impairment 733,275 660,748 8,901 481,478 24,061 1,719 1,910,182 –
Additions 38,206 17,290 5,141 165,991 10,846 120 237,594 –
Disposals (383) – (493) (1,246) – (24) (2,146) –
Disposal of entities (60,976) – (6,290) (71,544) (9,306) (1,295) (149,411) –
Depreciation expense (17,287) (24,037) – (93,921) – – (135,245) –
Amortisation expense – – (1,885) – – (311) (2,196) –
Reclassifi cation/transfer 1,350 – – (1,234) (116) – – –
Transfer (to)/from assets held for sales – – – (27,718) – – (27,718) –
At 30 June 2007, net of accumulated depreciation and impairment 694,185 654,001 5,374 451,806 25,485 209 1,831,060 –
At 1 July 2006
Cost (gross carrying amount) 847,434 929,916 19,681 1,391,122 24,061 16,828 3,229,042 –
Accumulated depreciation and impairment (114,159) (269,168) (10,780) (909,644) – (15,109) (1,318,860) –
Net carrying amount 733,275 660,748 8,901 481,478 24,061 1,719 1,910,182 –
At 30 June 2007
Cost (gross carrying amount) 820,225 947,206 5,838 1,146,271 25,485 10,981 2,956,006 –
Accumulated depreciation and impairment (126,040) (293,205) (464) (694,465) – (10,772) (1,124,946) –
Net carrying amount 694,185 654,001 5,374 451,806 25,485 209 1,831,060 –
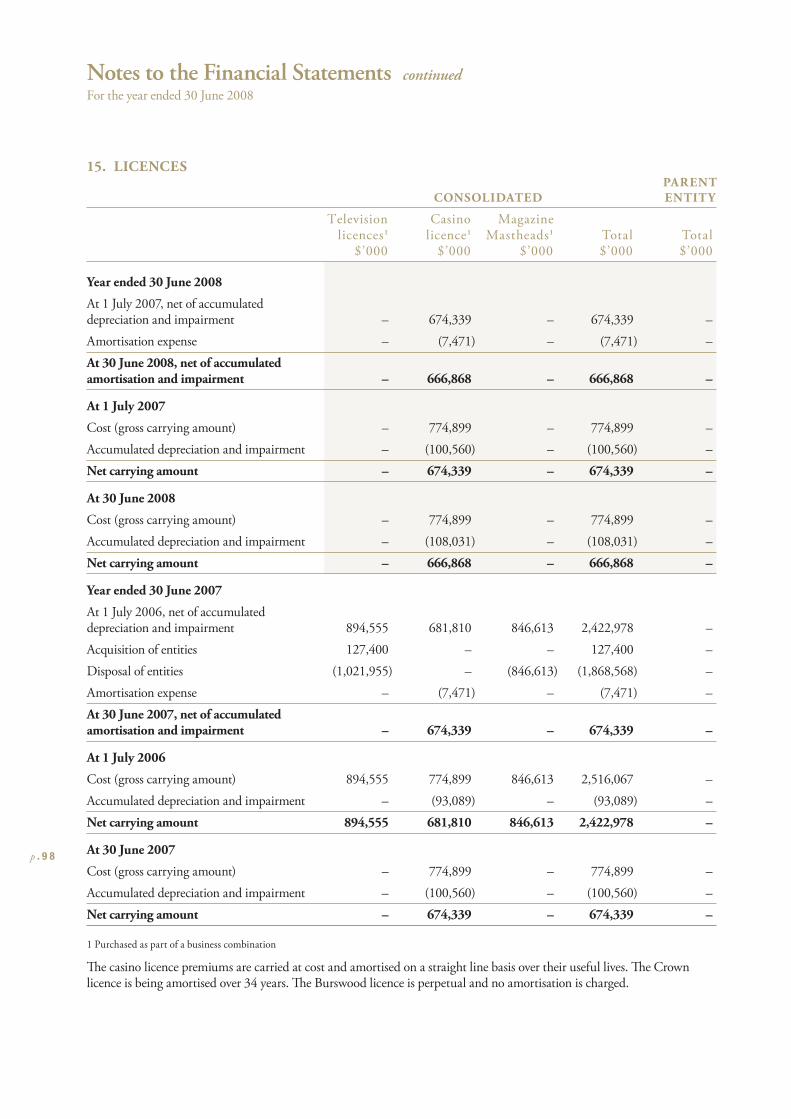
Notes to the Financial Statements continued
For the year ended 30 June 2008
p . 9 8
15. LICENCES PARENT CONSOLIDATED ENTITY
Television Casino Magazine licences1 licence1 Mastheads1 Total Total $’000 $’000 $’000 $’000 $’000
Year ended 30 June 2008
At 1 July 2007, net of accumulated depreciation and impairment – 674,339 – 674,339 –
Amortisation expense – (7,471) – (7,471) –
At 30 June 2008, net of accumulated amortisation and impairment – 666,868 – 666,868 –
At 1 July 2007
Cost (gross carrying amount) – 774,899 – 774,899 –
Accumulated depreciation and impairment – (100,560) – (100,560) –
Net carrying amount – 674,339 – 674,339 –
At 30 June 2008
Cost (gross carrying amount) – 774,899 – 774,899 –
Accumulated depreciation and impairment – (108,031) – (108,031) –
Net carrying amount – 666,868 – 666,868 –
Year ended 30 June 2007
At 1 July 2006, net of accumulated depreciation and impairment 894,555 681,810 846,613 2,422,978 –
Acquisition of entities 127,400 – – 127,400 –
Disposal of entities (1,021,955) – (846,613) (1,868,568) –
Amortisation expense – (7,471) – (7,471) –
At 30 June 2007, net of accumulated amortisation and impairment – 674,339 – 674,339 –
At 1 July 2006
Cost (gross carrying amount) 894,555 774,899 846,613 2,516,067 –
Accumulated depreciation and impairment – (93,089) – (93,089) –
Net carrying amount 894,555 681,810 846,613 2,422,978 –
At 30 June 2007
Cost (gross carrying amount) – 774,899 – 774,899 –
Accumulated depreciation and impairment – (100,560) – (100,560) –
Net carrying amount – 674,339 – 674,339 –
1 Purchased as part of a business combination
Th e casino licence premiums are carried at cost and amortised on a straight line basis over their useful lives. Th e Crown licence is being amortised over 34 years. Th e Burswood licence is perpetual and no amortisation is charged.
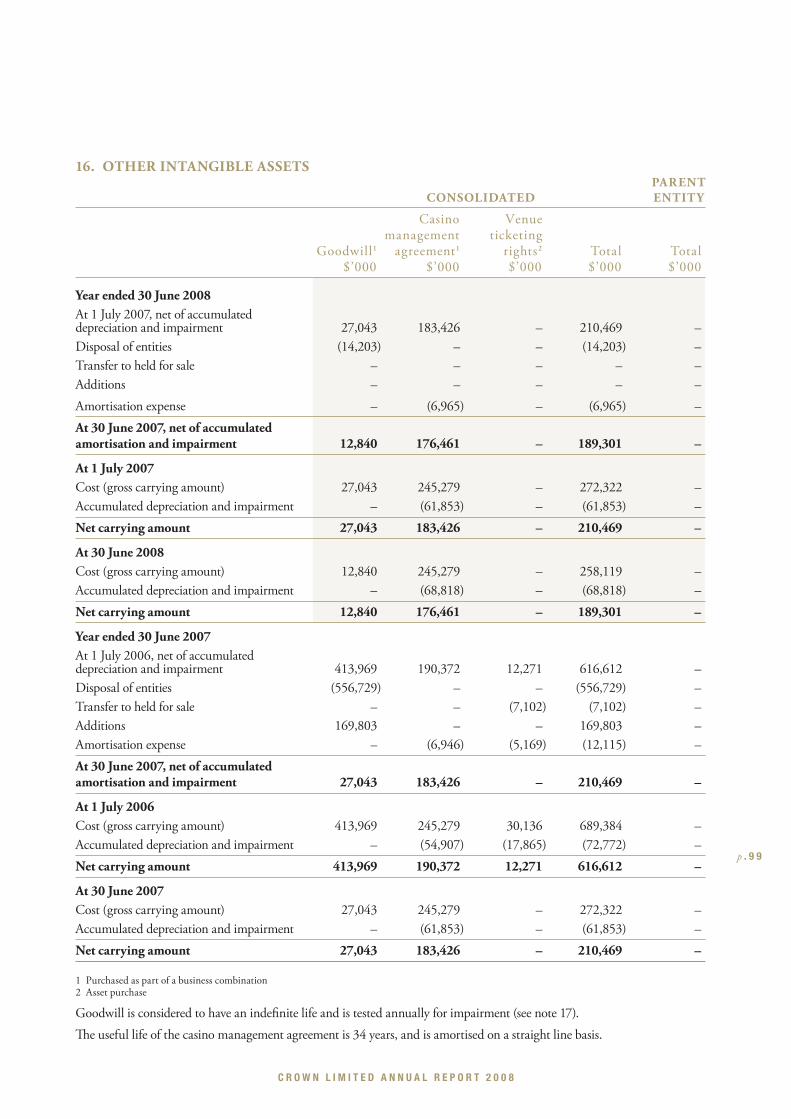
C R O W N L I M I T E D A N N U A L R E P O R T 2 0 0 8
p . 9 9
16. OTHER INTANGIBLE ASSETS PARENT CONSOLIDATED ENTITY
Casino Venue management ticketing Goodwill1 agreement1 rights2 Total Total $’000 $’000 $’000 $’000 $’000
Year ended 30 June 2008At 1 July 2007, net of accumulated depreciation and impairment 27,043 183,426 – 210,469 –
Disposal of entities (14,203) – – (14,203) –
Transfer to held for sale – – – – –
Additions – – – – –
Amortisation expense – (6,965) – (6,965) –
At 30 June 2007, net of accumulated amortisation and impairment 12,840 176,461 – 189,301 –
At 1 July 2007Cost (gross carrying amount) 27,043 245,279 – 272,322 –
Accumulated depreciation and impairment – (61,853) – (61,853) –
Net carrying amount 27,043 183,426 – 210,469 –
At 30 June 2008Cost (gross carrying amount) 12,840 245,279 – 258,119 –
Accumulated depreciation and impairment – (68,818) – (68,818) –
Net carrying amount 12,840 176,461 – 189,301 –
Year ended 30 June 2007At 1 July 2006, net of accumulated depreciation and impairment 413,969 190,372 12,271 616,612 –
Disposal of entities (556,729) – – (556,729) –
Transfer to held for sale – – (7,102) (7,102) –
Additions 169,803 – – 169,803 –
Amortisation expense – (6,946) (5,169) (12,115) –
At 30 June 2007, net of accumulated amortisation and impairment 27,043 183,426 – 210,469 –
At 1 July 2006Cost (gross carrying amount) 413,969 245,279 30,136 689,384 –
Accumulated depreciation and impairment – (54,907) (17,865) (72,772) –
Net carrying amount 413,969 190,372 12,271 616,612 –
At 30 June 2007Cost (gross carrying amount) 27,043 245,279 – 272,322 –
Accumulated depreciation and impairment – (61,853) – (61,853) –
Net carrying amount 27,043 183,426 – 210,469 –
1 Purchased as part of a business combination2 Asset purchase
Goodwill is considered to have an indefi nite life and is tested annually for impairment (see note 17).
Th e useful life of the casino management agreement is 34 years, and is amortised on a straight line basis.
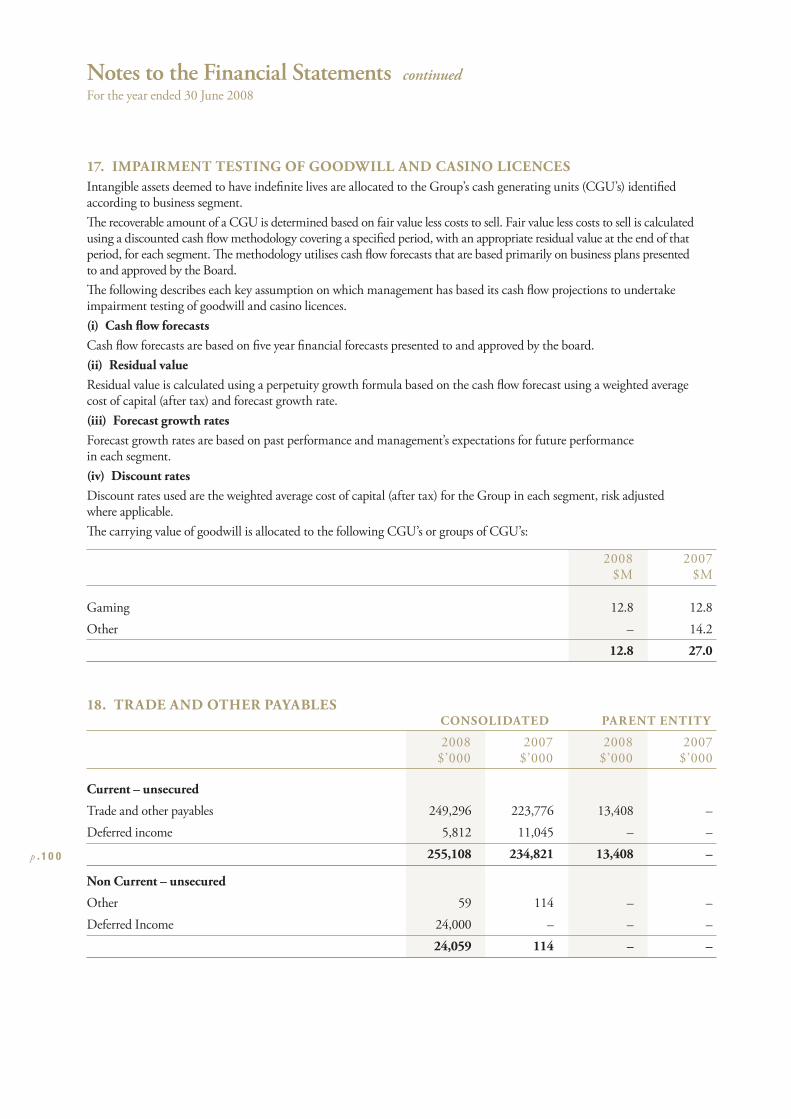
Notes to the Financial Statements continued
For the year ended 30 June 2008
p . 1 0 0
17. IMPAIRMENT TESTING OF GOODWILL AND CASINO LICENCESIntangible assets deemed to have indefi nite lives are allocated to the Group’s cash generating units (CGU’s) identifi ed according to business segment.
Th e recoverable amount of a CGU is determined based on fair value less costs to sell. Fair value less costs to sell is calculated using a discounted cash fl ow methodology covering a specifi ed period, with an appropriate residual value at the end of that period, for each segment. Th e methodology utilises cash fl ow forecasts that are based primarily on business plans presented to and approved by the Board.
Th e following describes each key assumption on which management has based its cash fl ow projections to undertake impairment testing of goodwill and casino licences.
(i) Cash fl ow forecastsCash fl ow forecasts are based on fi ve year fi nancial forecasts presented to and approved by the board.
(ii) Residual valueResidual value is calculated using a perpetuity growth formula based on the cash fl ow forecast using a weighted average cost of capital (after tax) and forecast growth rate.
(iii) Forecast growth ratesForecast growth rates are based on past performance and management’s expectations for future performance in each segment.
(iv) Discount ratesDiscount rates used are the weighted average cost of capital (after tax) for the Group in each segment, risk adjusted where applicable.
Th e carrying value of goodwill is allocated to the following CGU’s or groups of CGU’s:
2008 2007 $M $M
Gaming 12.8 12.8
Other – 14.2
12.8 27.0
18. TRADE AND OTHER PAYABLES CONSOLIDATED PARENT ENTITY
2008 2007 2008 2007 $’000 $’000 $’000 $’000
Current – unsecured
Trade and other payables 249,296 223,776 13,408 –
Deferred income 5,812 11,045 – –
255,108 234,821 13,408 –
Non Current – unsecured
Other 59 114 – –
Deferred Income 24,000 – – –
24,059 114 – –
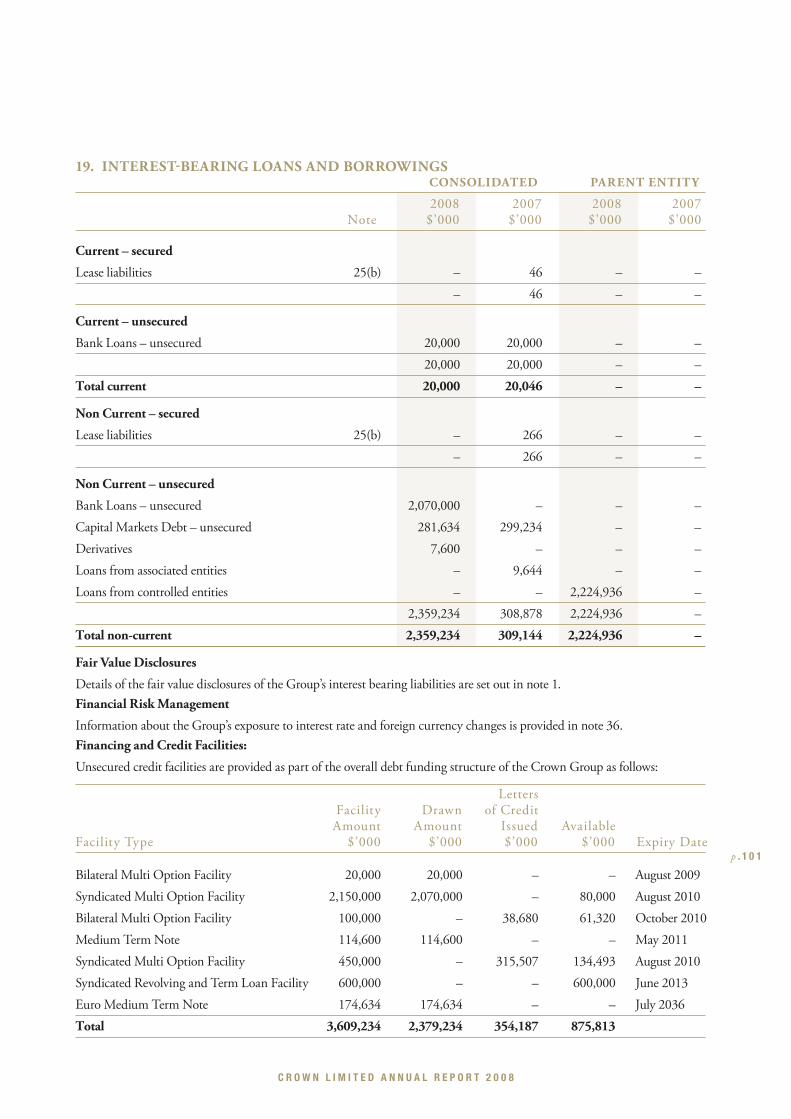
C R O W N L I M I T E D A N N U A L R E P O R T 2 0 0 8
p . 1 0 1
19. INTERESTBEARING LOANS AND BORROWINGS CONSOLIDATED PARENT ENTITY
2008 2007 2008 2007 Note $’000 $’000 $’000 $’000
Current – secured
Lease liabilities 25(b) – 46 – –
– 46 – –
Current – unsecured
Bank Loans – unsecured 20,000 20,000 – –
20,000 20,000 – –
Total current 20,000 20,046 – –
Non Current – secured
Lease liabilities 25(b) – 266 – –
– 266 – –
Non Current – unsecured
Bank Loans – unsecured 2,070,000 – – –
Capital Markets Debt – unsecured 281,634 299,234 – –
Derivatives 7,600 – – –
Loans from associated entities – 9,644 – –
Loans from controlled entities – – 2,224,936 –
2,359,234 308,878 2,224,936 –
Total non-current 2,359,234 309,144 2,224,936 –
Fair Value Disclosures
Details of the fair value disclosures of the Group’s interest bearing liabilities are set out in note 1.
Financial Risk Management
Information about the Group’s exposure to interest rate and foreign currency changes is provided in note 36.
Financing and Credit Facilities:
Unsecured credit facilities are provided as part of the overall debt funding structure of the Crown Group as follows:
Letters Facility Drawn of Credit Amount Amount Issued AvailableFacility Type $’000 $’000 $’000 $’000 Expiry Date
Bilateral Multi Option Facility 20,000 20,000 – – August 2009
Syndicated Multi Option Facility 2,150,000 2,070,000 – 80,000 August 2010
Bilateral Multi Option Facility 100,000 – 38,680 61,320 October 2010
Medium Term Note 114,600 114,600 – – May 2011
Syndicated Multi Option Facility 450,000 – 315,507 134,493 August 2010
Syndicated Revolving and Term Loan Facility 600,000 – – 600,000 June 2013
Euro Medium Term Note 174,634 174,634 – – July 2036
Total 3,609,234 2,379,234 354,187 875,813
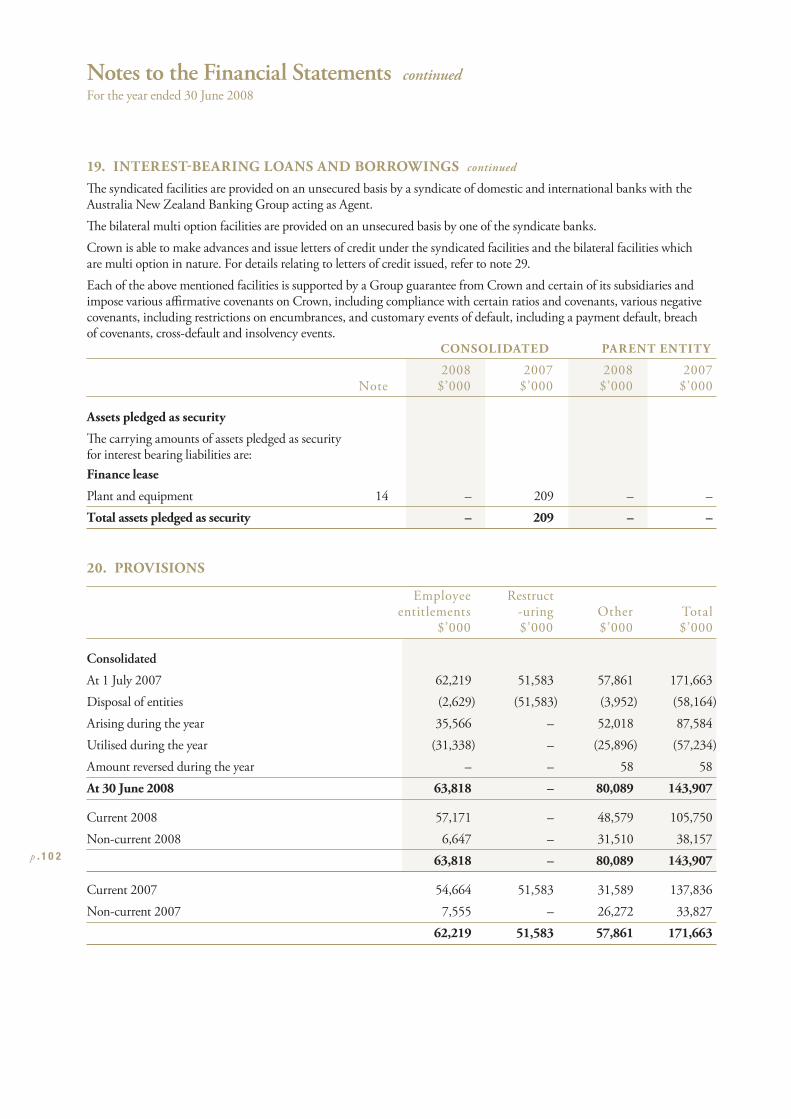
Notes to the Financial Statements continued
For the year ended 30 June 2008
p . 1 0 2
19. INTERESTBEARING LOANS AND BORROWINGS continued
Th e syndicated facilities are provided on an unsecured basis by a syndicate of domestic and international banks with the Australia New Zealand Banking Group acting as Agent.
Th e bilateral multi option facilities are provided on an unsecured basis by one of the syndicate banks.
Crown is able to make advances and issue letters of credit under the syndicated facilities and the bilateral facilities which are multi option in nature. For details relating to letters of credit issued, refer to note 29.
Each of the above mentioned facilities is supported by a Group guarantee from Crown and certain of its subsidiaries and impose various affi rmative covenants on Crown, including compliance with certain ratios and covenants, various negative covenants, including restrictions on encumbrances, and customary events of default, including a payment default, breach of covenants, cross-default and insolvency events. CONSOLIDATED PARENT ENTITY
2008 2007 2008 2007 Note $’000 $’000 $’000 $’000
Assets pledged as security
Th e carrying amounts of assets pledged as security for interest bearing liabilities are:
Finance lease
Plant and equipment 14 – 209 – –
Total assets pledged as security – 209 – –
20. PROVISIONS
Employee Restruct entitlements -uring Other Total $’000 $’000 $’000 $’000
Consolidated
At 1 July 2007 62,219 51,583 57,861 171,663
Disposal of entities (2,629) (51,583) (3,952) (58,164)
Arising during the year 35,566 – 52,018 87,584
Utilised during the year (31,338) – (25,896) (57,234)
Amount reversed during the year – – 58 58
At 30 June 2008 63,818 – 80,089 143,907
Current 2008 57,171 – 48,579 105,750
Non-current 2008 6,647 – 31,510 38,157
63,818 – 80,089 143,907
Current 2007 54,664 51,583 31,589 137,836
Non-current 2007 7,555 – 26,272 33,827
62,219 51,583 57,861 171,663
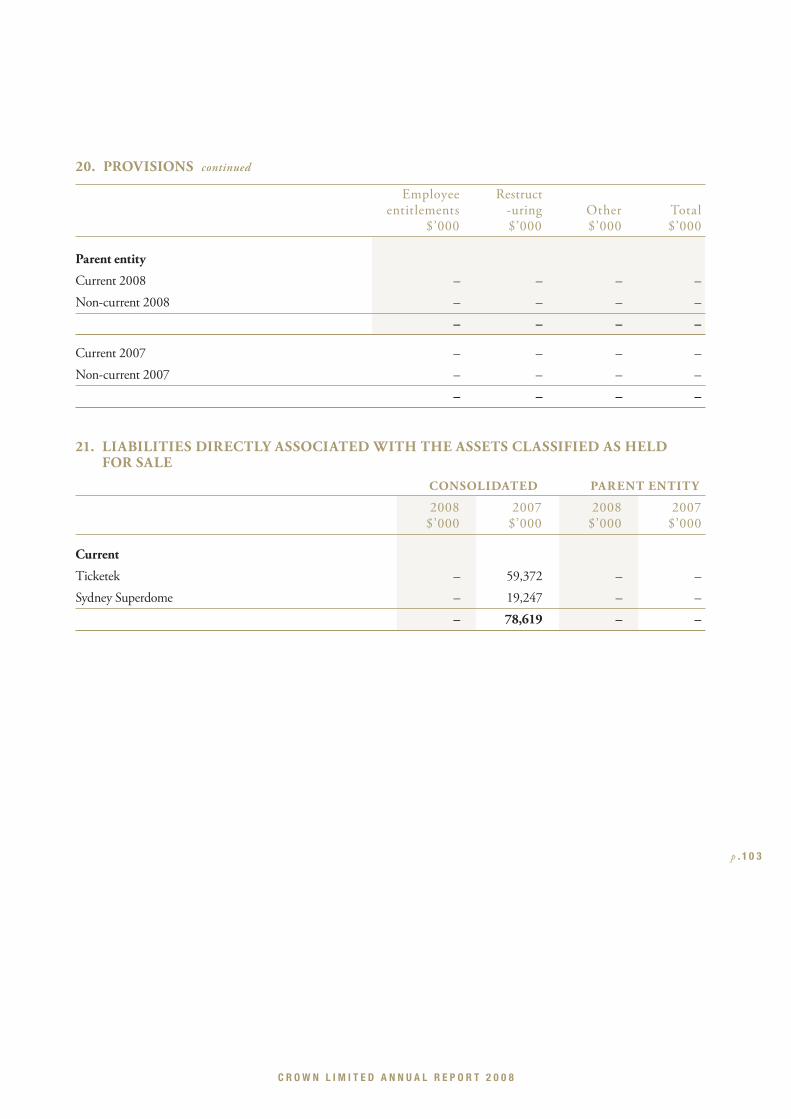
C R O W N L I M I T E D A N N U A L R E P O R T 2 0 0 8
p . 1 0 3
20. PROVISIONS continued
Employee Restruct entitlements -uring Other Total $’000 $’000 $’000 $’000
Parent entity
Current 2008 – – – –
Non-current 2008 – – – –
– – – –
Current 2007 – – – –
Non-current 2007 – – – –
– – – –
21. LIABILITIES DIRECTLY ASSOCIATED WITH THE ASSETS CLASSIFIED AS HELD FOR SALE
CONSOLIDATED PARENT ENTITY
2008 2007 2008 2007 $’000 $’000 $’000 $’000
Current
Ticketek – 59,372 – –
Sydney Superdome – 19,247 – –
– 78,619 – –
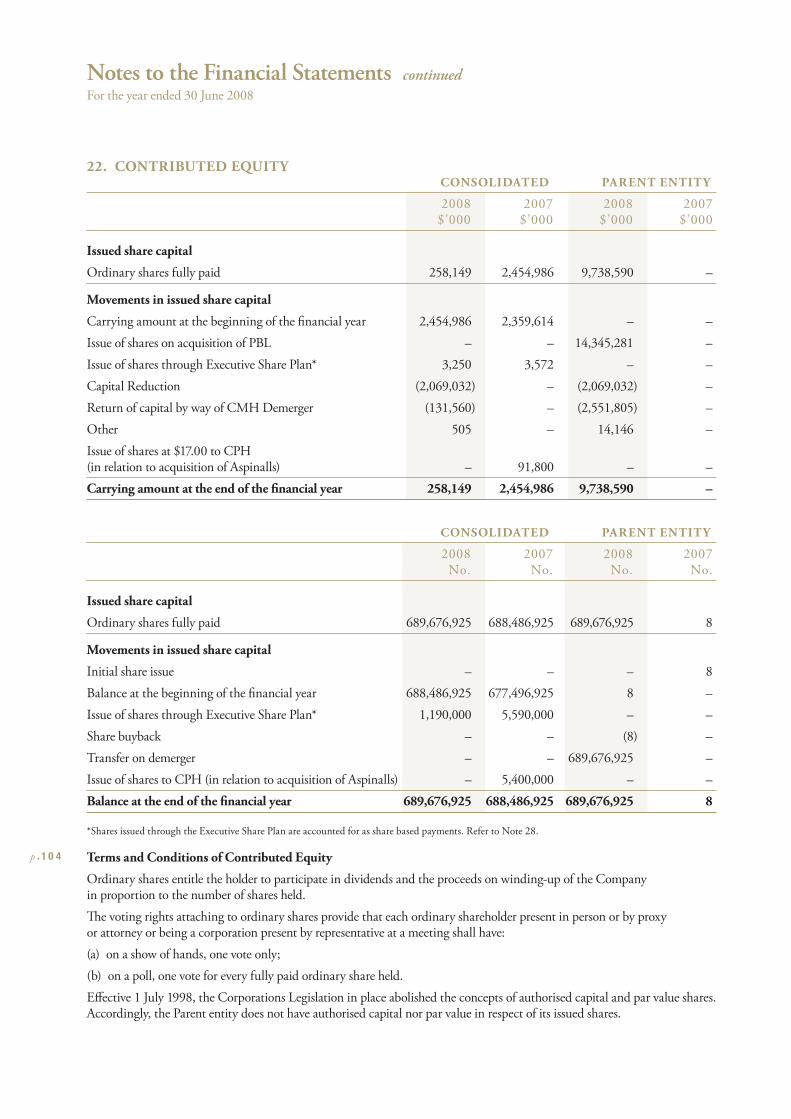
Notes to the Financial Statements continued
For the year ended 30 June 2008
p . 1 0 4
22. CONTRIBUTED EQUITY CONSOLIDATED PARENT ENTITY
2008 2007 2008 2007 $’000 $’000 $’000 $’000
Issued share capital
Ordinary shares fully paid 258,149 2,454,986 9,738,590 –
Movements in issued share capital
Carrying amount at the beginning of the fi nancial year 2,454,986 2,359,614 – –
Issue of shares on acquisition of PBL – – 14,345,281 –
Issue of shares through Executive Share Plan* 3,250 3,572 – –
Capital Reduction (2,069,032) – (2,069,032) –
Return of capital by way of CMH Demerger (131,560) – (2,551,805) –
Other 505 – 14,146 –
Issue of shares at $17.00 to CPH (in relation to acquisition of Aspinalls) – 91,800 – –
Carrying amount at the end of the fi nancial year 258,149 2,454,986 9,738,590 –
CONSOLIDATED PARENT ENTITY
2008 2007 2008 2007 No. No. No. No.
Issued share capital
Ordinary shares fully paid 689,676,925 688,486,925 689,676,925 8
Movements in issued share capital
Initial share issue – – – 8
Balance at the beginning of the fi nancial year 688,486,925 677,496,925 8 –
Issue of shares through Executive Share Plan* 1,190,000 5,590,000 – –
Share buyback – – (8) –
Transfer on demerger – – 689,676,925 –
Issue of shares to CPH (in relation to acquisition of Aspinalls) – 5,400,000 – –
Balance at the end of the fi nancial year 689,676,925 688,486,925 689,676,925 8
*Shares issued through the Executive Share Plan are accounted for as share based payments. Refer to Note 28.
Terms and Conditions of Contributed Equity
Ordinary shares entitle the holder to participate in dividends and the proceeds on winding-up of the Company in proportion to the number of shares held.
Th e voting rights attaching to ordinary shares provide that each ordinary shareholder present in person or by proxy or attorney or being a corporation present by representative at a meeting shall have:
(a) on a show of hands, one vote only;
(b) on a poll, one vote for every fully paid ordinary share held.
Eff ective 1 July 1998, the Corporations Legislation in place abolished the concepts of authorised capital and par value shares. Accordingly, the Parent entity does not have authorised capital nor par value in respect of its issued shares.
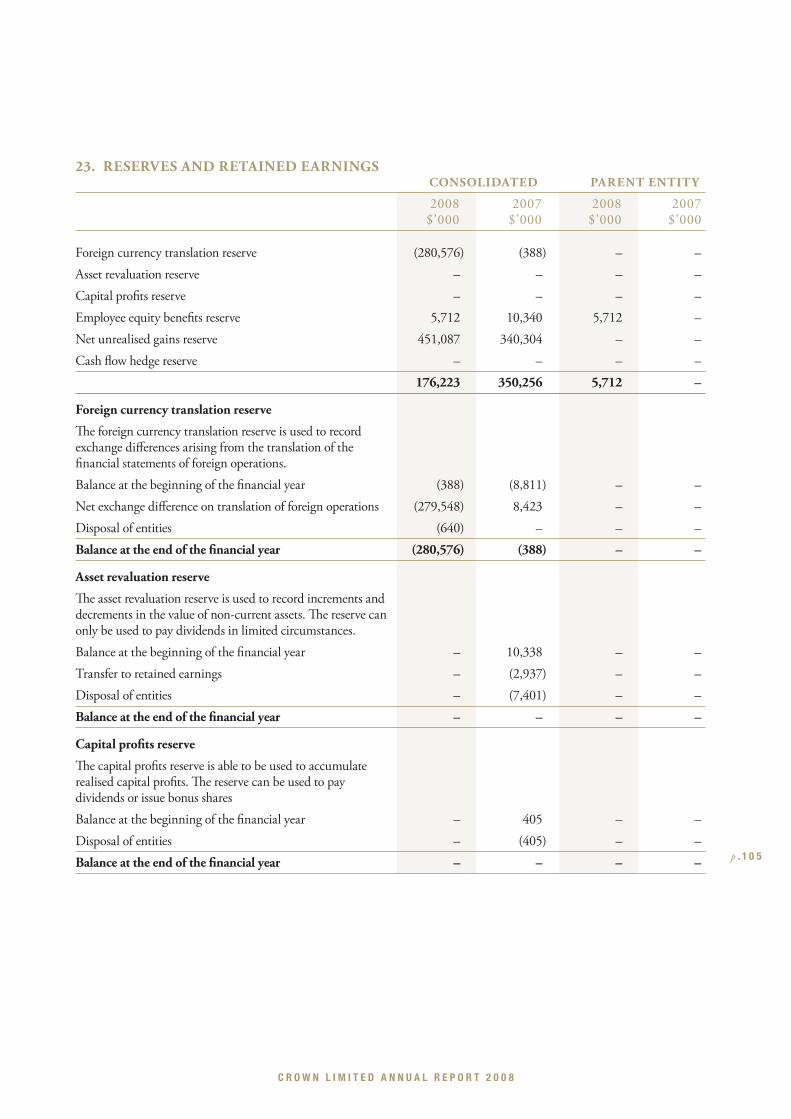
C R O W N L I M I T E D A N N U A L R E P O R T 2 0 0 8
p . 1 0 5
23. RESERVES AND RETAINED EARNINGS CONSOLIDATED PARENT ENTITY
2008 2007 2008 2007 $’000 $’000 $’000 $’000
Foreign currency translation reserve (280,576) (388) – –
Asset revaluation reserve – – – –
Capital profi ts reserve – – – –
Employee equity benefi ts reserve 5,712 10,340 5,712 –
Net unrealised gains reserve 451,087 340,304 – –
Cash fl ow hedge reserve – – – –
176,223 350,256 5,712 –
Foreign currency translation reserve
Th e foreign currency translation reserve is used to record exchange diff erences arising from the translation of the fi nancial statements of foreign operations.
Balance at the beginning of the fi nancial year (388) (8,811) – –
Net exchange diff erence on translation of foreign operations (279,548) 8,423 – –
Disposal of entities (640) – – –
Balance at the end of the fi nancial year (280,576) (388) – –
Asset revaluation reserve
Th e asset revaluation reserve is used to record increments and decrements in the value of non-current assets. Th e reserve can only be used to pay dividends in limited circumstances.
Balance at the beginning of the fi nancial year – 10,338 – –
Transfer to retained earnings – (2,937) – –
Disposal of entities – (7,401) – –
Balance at the end of the fi nancial year – – – –
Capital profi ts reserve
Th e capital profi ts reserve is able to be used to accumulate realised capital profi ts. Th e reserve can be used to pay dividends or issue bonus shares
Balance at the beginning of the fi nancial year – 405 – –
Disposal of entities – (405) – –
Balance at the end of the fi nancial year – – – –
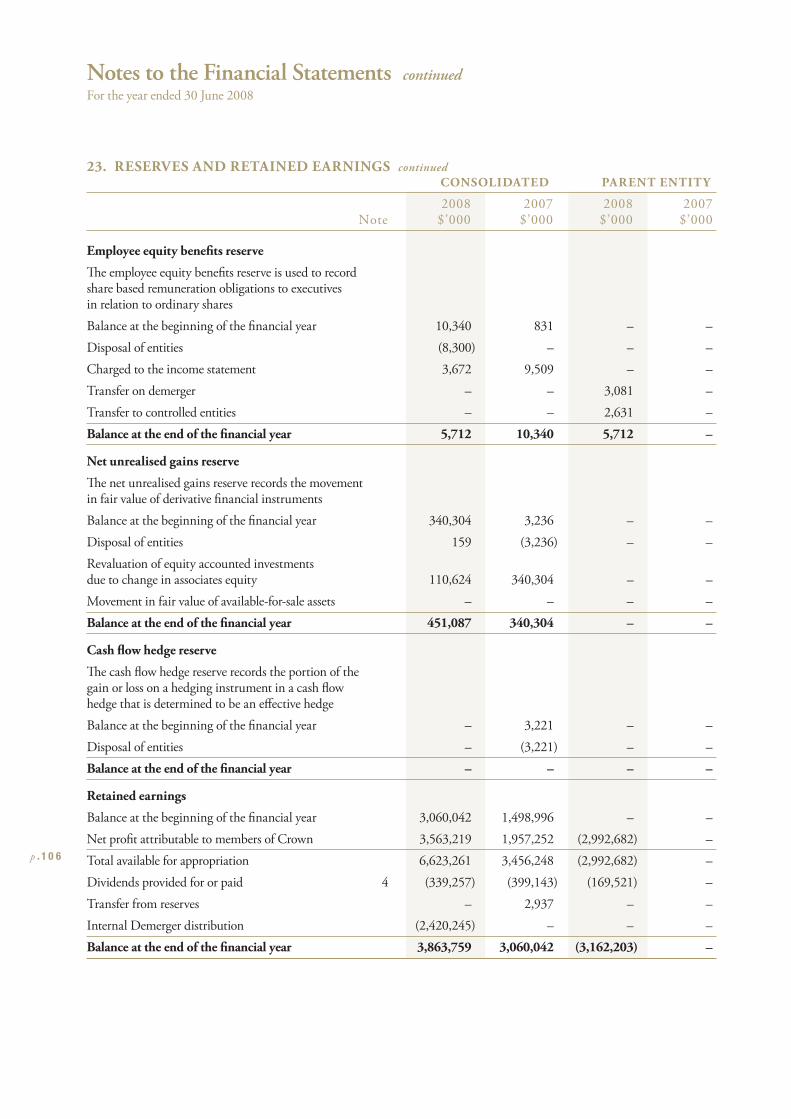
Notes to the Financial Statements continued
For the year ended 30 June 2008
p . 1 0 6
23. RESERVES AND RETAINED EARNINGS continued
CONSOLIDATED PARENT ENTITY
2008 2007 2008 2007 Note $’000 $’000 $’000 $’000
Employee equity benefi ts reserve
Th e employee equity benefi ts reserve is used to record share based remuneration obligations to executives in relation to ordinary shares
Balance at the beginning of the fi nancial year 10,340 831 – –
Disposal of entities (8,300) – – –
Charged to the income statement 3,672 9,509 – –
Transfer on demerger – – 3,081 –
Transfer to controlled entities – – 2,631 –
Balance at the end of the fi nancial year 5,712 10,340 5,712 –
Net unrealised gains reserve
Th e net unrealised gains reserve records the movement in fair value of derivative fi nancial instruments
Balance at the beginning of the fi nancial year 340,304 3,236 – –
Disposal of entities 159 (3,236) – –
Revaluation of equity accounted investments due to change in associates equity 110,624 340,304 – –
Movement in fair value of available-for-sale assets – – – –
Balance at the end of the fi nancial year 451,087 340,304 – –
Cash fl ow hedge reserve
Th e cash fl ow hedge reserve records the portion of the gain or loss on a hedging instrument in a cash fl ow hedge that is determined to be an eff ective hedge
Balance at the beginning of the fi nancial year – 3,221 – –
Disposal of entities – (3,221) – –
Balance at the end of the fi nancial year – – – –
Retained earnings
Balance at the beginning of the fi nancial year 3,060,042 1,498,996 – –
Net profi t attributable to members of Crown 3,563,219 1,957,252 (2,992,682) –
Total available for appropriation 6,623,261 3,456,248 (2,992,682) –
Dividends provided for or paid 4 (339,257) (399,143) (169,521) –
Transfer from reserves – 2,937 – –
Internal Demerger distribution (2,420,245) – – –
Balance at the end of the fi nancial year 3,863,759 3,060,042 (3,162,203) –
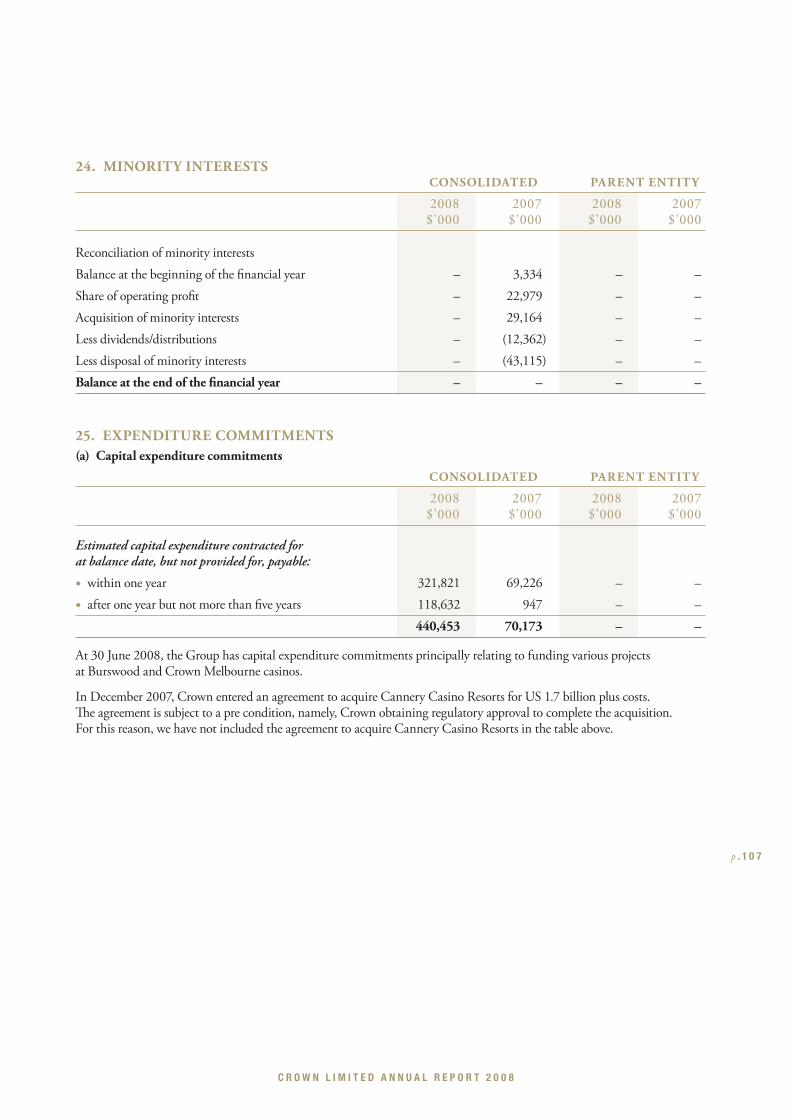
C R O W N L I M I T E D A N N U A L R E P O R T 2 0 0 8
p . 1 0 7
24. MINORITY INTERESTS CONSOLIDATED PARENT ENTITY
2008 2007 2008 2007 $’000 $’000 $’000 $’000
Reconciliation of minority interests
Balance at the beginning of the fi nancial year – 3,334 – –
Share of operating profi t – 22,979 – –
Acquisition of minority interests – 29,164 – –
Less dividends/distributions – (12,362) – –
Less disposal of minority interests – (43,115) – –
Balance at the end of the fi nancial year – – – –
25. EXPENDITURE COMMITMENTS(a) Capital expenditure commitments
CONSOLIDATED PARENT ENTITY
2008 2007 2008 2007 $’000 $’000 $’000 $’000
Estimated capital expenditure contracted for at balance date, but not provided for, payable:
• within one year 321,821 69,226 – –
• after one year but not more than fi ve years 118,632 947 – –
440,453 70,173 – –
At 30 June 2008, the Group has capital expenditure commitments principally relating to funding various projects at Burswood and Crown Melbourne casinos.
In December 2007, Crown entered an agreement to acquire Cannery Casino Resorts for US 1.7 billion plus costs. Th e agreement is subject to a pre condition, namely, Crown obtaining regulatory approval to complete the acquisition. For this reason, we have not included the agreement to acquire Cannery Casino Resorts in the table above.
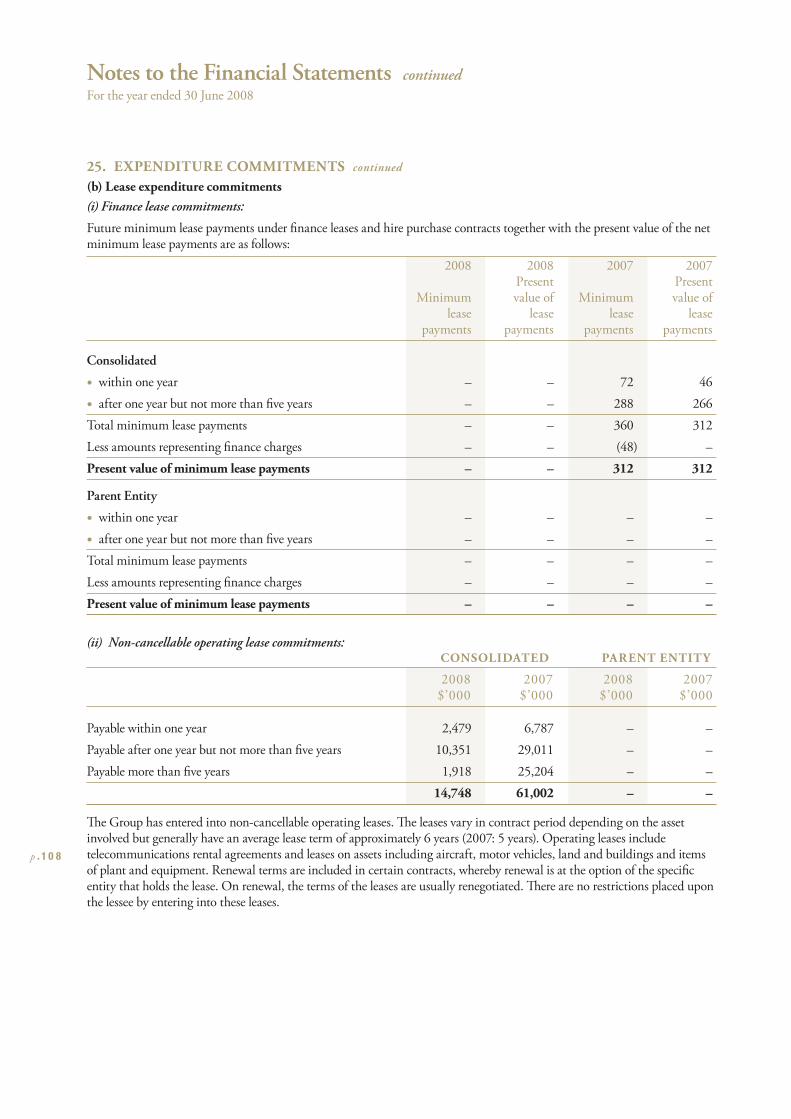
Notes to the Financial Statements continued
For the year ended 30 June 2008
p . 1 0 8
25. EXPENDITURE COMMITMENTS continued
(b) Lease expenditure commitments(i) Finance lease commitments:
Future minimum lease payments under fi nance leases and hire purchase contracts together with the present value of the net minimum lease payments are as follows:
2008 2008 2007 2007 Present Present Minimum value of Minimum value of lease lease lease lease payments payments payments payments
Consolidated
• within one year – – 72 46
• after one year but not more than fi ve years – – 288 266
Total minimum lease payments – – 360 312
Less amounts representing fi nance charges – – (48) –
Present value of minimum lease payments – – 312 312
Parent Entity
• within one year – – – –
• after one year but not more than fi ve years – – – –
Total minimum lease payments – – – –
Less amounts representing fi nance charges – – – –
Present value of minimum lease payments – – – –
(ii) Non-cancellable operating lease commitments: CONSOLIDATED PARENT ENTITY
2008 2007 2008 2007 $’000 $’000 $’000 $’000
Payable within one year 2,479 6,787 – –
Payable after one year but not more than fi ve years 10,351 29,011 – –
Payable more than fi ve years 1,918 25,204 – –
14,748 61,002 – –
Th e Group has entered into non-cancellable operating leases. Th e leases vary in contract period depending on the asset involved but generally have an average lease term of approximately 6 years (2007: 5 years). Operating leases include telecommunications rental agreements and leases on assets including aircraft, motor vehicles, land and buildings and items of plant and equipment. Renewal terms are included in certain contracts, whereby renewal is at the option of the specifi c entity that holds the lease. On renewal, the terms of the leases are usually renegotiated. Th ere are no restrictions placed upon the lessee by entering into these leases.
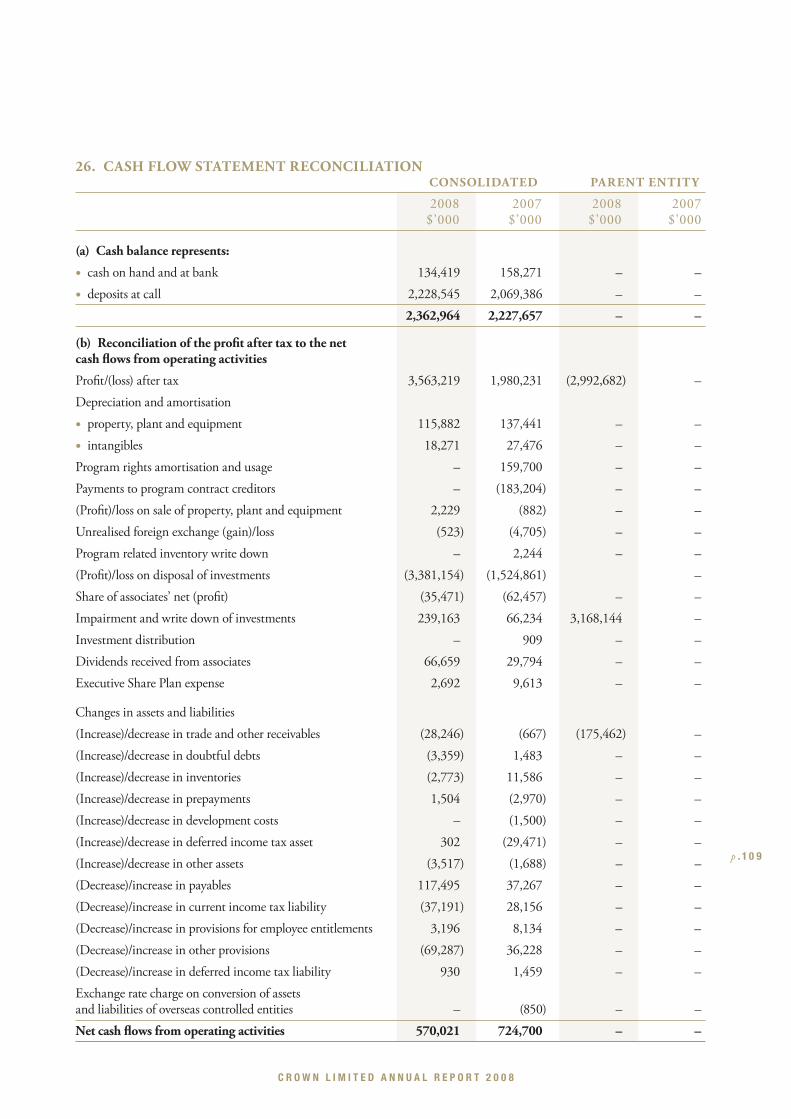
C R O W N L I M I T E D A N N U A L R E P O R T 2 0 0 8
p . 1 0 9
26. CASH FLOW STATEMENT RECONCILIATION CONSOLIDATED PARENT ENTITY
2008 2007 2008 2007 $’000 $’000 $’000 $’000
(a) Cash balance represents:
• cash on hand and at bank 134,419 158,271 – –
• deposits at call 2,228,545 2,069,386 – –
2,362,964 2,227,657 – –
(b) Reconciliation of the profi t after tax to the net cash fl ows from operating activities
Profi t/(loss) after tax 3,563,219 1,980,231 (2,992,682) –
Depreciation and amortisation
• property, plant and equipment 115,882 137,441 – –
• intangibles 18,271 27,476 – –
Program rights amortisation and usage – 159,700 – –
Payments to program contract creditors – (183,204) – –
(Profi t)/loss on sale of property, plant and equipment 2,229 (882) – –
Unrealised foreign exchange (gain)/loss (523) (4,705) – –
Program related inventory write down – 2,244 – –
(Profi t)/loss on disposal of investments (3,381,154) (1,524,861) –
Share of associates’ net (profi t) (35,471) (62,457) – –
Impairment and write down of investments 239,163 66,234 3,168,144 –
Investment distribution – 909 – –
Dividends received from associates 66,659 29,794 – –
Executive Share Plan expense 2,692 9,613 – –
Changes in assets and liabilities
(Increase)/decrease in trade and other receivables (28,246) (667) (175,462) –
(Increase)/decrease in doubtful debts (3,359) 1,483 – –
(Increase)/decrease in inventories (2,773) 11,586 – –
(Increase)/decrease in prepayments 1,504 (2,970) – –
(Increase)/decrease in development costs – (1,500) – –
(Increase)/decrease in deferred income tax asset 302 (29,471) – –
(Increase)/decrease in other assets (3,517) (1,688) – –
(Decrease)/increase in payables 117,495 37,267 – –
(Decrease)/increase in current income tax liability (37,191) 28,156 – –
(Decrease)/increase in provisions for employee entitlements 3,196 8,134 – –
(Decrease)/increase in other provisions (69,287) 36,228 – –
(Decrease)/increase in deferred income tax liability 930 1,459 – –
Exchange rate charge on conversion of assets and liabilities of overseas controlled entities – (850) – –
Net cash fl ows from operating activities 570,021 724,700 – –
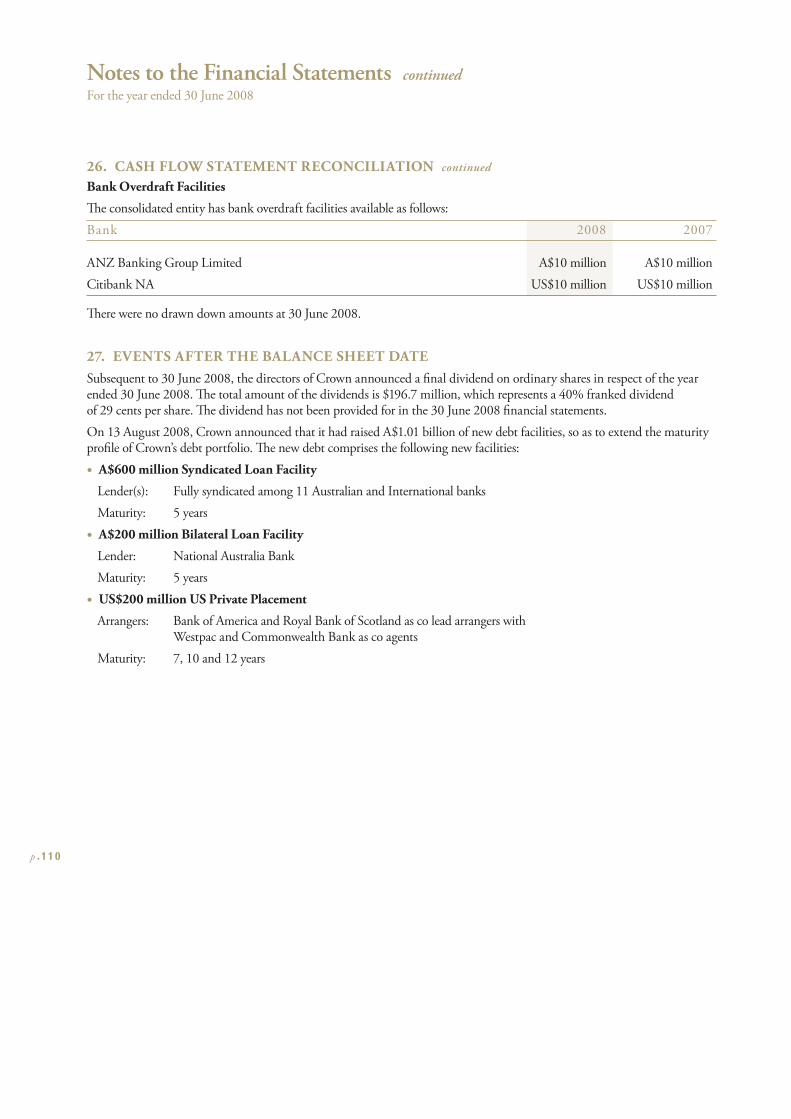
Notes to the Financial Statements continued
For the year ended 30 June 2008
p . 1 1 0
26. CASH FLOW STATEMENT RECONCILIATION continued
Bank Overdraft Facilities
Th e consolidated entity has bank overdraft facilities available as follows:
Bank 2008 2007
ANZ Banking Group Limited A$10 million A$10 million
Citibank NA US$10 million US$10 million
Th ere were no drawn down amounts at 30 June 2008.
27. EVENTS AFTER THE BALANCE SHEET DATESubsequent to 30 June 2008, the directors of Crown announced a fi nal dividend on ordinary shares in respect of the year ended 30 June 2008. Th e total amount of the dividends is $196.7 million, which represents a 40% franked dividend of 29 cents per share. Th e dividend has not been provided for in the 30 June 2008 fi nancial statements.
On 13 August 2008, Crown announced that it had raised A$1.01 billion of new debt facilities, so as to extend the maturity profi le of Crown’s debt portfolio. Th e new debt comprises the following new facilities:
• A$600 million Syndicated Loan Facility
Lender(s): Fully syndicated among 11 Australian and International banks
Maturity: 5 years
• A$200 million Bilateral Loan Facility
Lender: National Australia Bank
Maturity: 5 years
• US$200 million US Private Placement
Arrangers: Bank of America and Royal Bank of Scotland as co lead arrangers with Westpac and Commonwealth Bank as co agents
Maturity: 7, 10 and 12 years
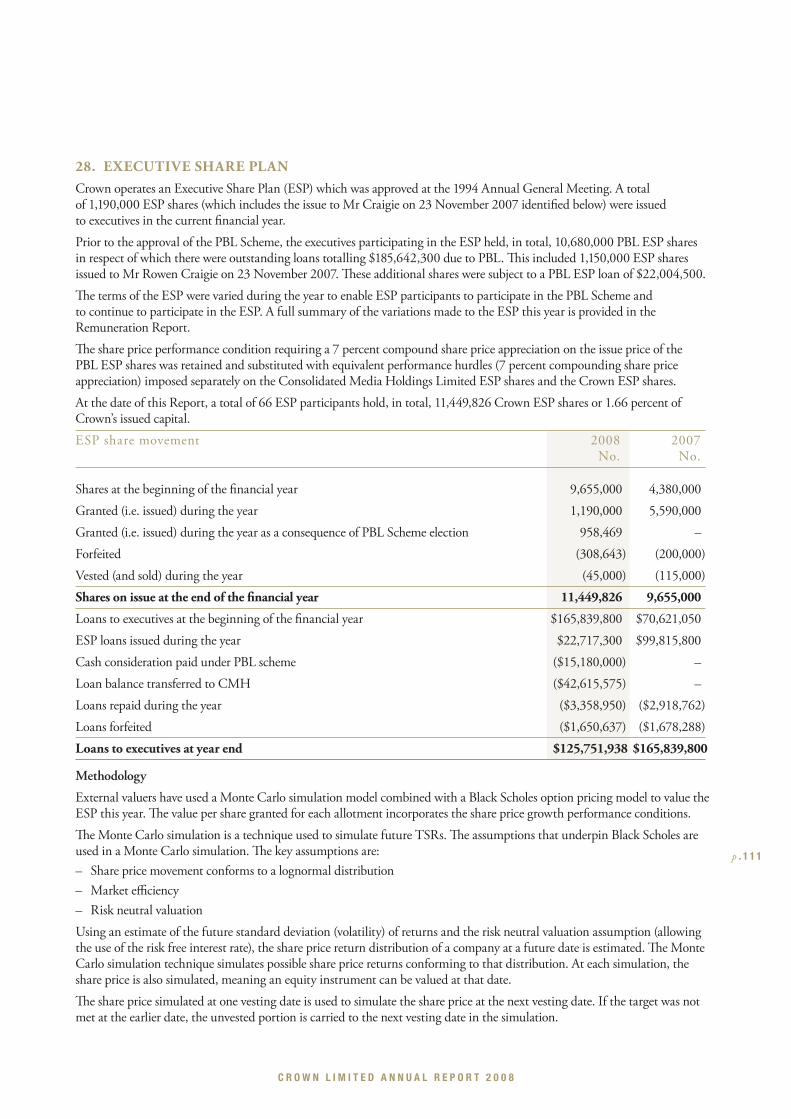
C R O W N L I M I T E D A N N U A L R E P O R T 2 0 0 8
p . 1 1 1
28. EXECUTIVE SHARE PLANCrown operates an Executive Share Plan (ESP) which was approved at the 1994 Annual General Meeting. A total of 1,190,000 ESP shares (which includes the issue to Mr Craigie on 23 November 2007 identifi ed below) were issued to executives in the current fi nancial year.
Prior to the approval of the PBL Scheme, the executives participating in the ESP held, in total, 10,680,000 PBL ESP shares in respect of which there were outstanding loans totalling $185,642,300 due to PBL. Th is included 1,150,000 ESP shares issued to Mr Rowen Craigie on 23 November 2007. Th ese additional shares were subject to a PBL ESP loan of $22,004,500.
Th e terms of the ESP were varied during the year to enable ESP participants to participate in the PBL Scheme and to continue to participate in the ESP. A full summary of the variations made to the ESP this year is provided in the Remuneration Report.
Th e share price performance condition requiring a 7 percent compound share price appreciation on the issue price of the PBL ESP shares was retained and substituted with equivalent performance hurdles (7 percent compounding share price appreciation) imposed separately on the Consolidated Media Holdings Limited ESP shares and the Crown ESP shares.
At the date of this Report, a total of 66 ESP participants hold, in total, 11,449,826 Crown ESP shares or 1.66 percent of Crown’s issued capital.
ESP share movement 2008 2007 No. No.
Shares at the beginning of the fi nancial year 9,655,000 4,380,000
Granted (i.e. issued) during the year 1,190,000 5,590,000
Granted (i.e. issued) during the year as a consequence of PBL Scheme election 958,469 –
Forfeited (308,643) (200,000)
Vested (and sold) during the year (45,000) (115,000)
Shares on issue at the end of the fi nancial year 11,449,826 9,655,000
Loans to executives at the beginning of the fi nancial year $165,839,800 $70,621,050
ESP loans issued during the year $22,717,300 $99,815,800
Cash consideration paid under PBL scheme ($15,180,000) –
Loan balance transferred to CMH ($42,615,575) –
Loans repaid during the year ($3,358,950) ($2,918,762)
Loans forfeited ($1,650,637) ($1,678,288)
Loans to executives at year end $125,751,938 $165,839,800
Methodology
External valuers have used a Monte Carlo simulation model combined with a Black Scholes option pricing model to value the ESP this year. Th e value per share granted for each allotment incorporates the share price growth performance conditions.
Th e Monte Carlo simulation is a technique used to simulate future TSRs. Th e assumptions that underpin Black Scholes are used in a Monte Carlo simulation. Th e key assumptions are:
– Share price movement conforms to a lognormal distribution
– Market effi ciency
– Risk neutral valuation
Using an estimate of the future standard deviation (volatility) of returns and the risk neutral valuation assumption (allowing the use of the risk free interest rate), the share price return distribution of a company at a future date is estimated. Th e Monte Carlo simulation technique simulates possible share price returns conforming to that distribution. At each simulation, the share price is also simulated, meaning an equity instrument can be valued at that date.
Th e share price simulated at one vesting date is used to simulate the share price at the next vesting date. If the target was not met at the earlier date, the unvested portion is carried to the next vesting date in the simulation.
Notes to the Financial Statements continued
For the year ended 30 June 2008
p . 1 1 2
28. EXECUTIVE SHARE PLAN continued
Th e Monte Carlo simulation model uses the following inputs for the issuance on 23 November 2007.
Grant date 23 November 2007
Issue price $18.97 & $19.18
Dividend yield 3.17%
Risk from rate 6.21%
Volatility 23%
Expected life 5 years
Non transferability of the plans
During the period from grant date to vesting, executives cannot sell their plan rights. However, no adjustment is made to the fair values for this, as non-transferability is due to the executive having not yet earned the right to the plan (through the provision of their services), rather than a restriction on the underlying value of the plan rights.
After vesting, the holders have until expiry to “exercise” the plan. Since the plan rights are not transferable, liquidity can only be obtained by exercising the plan rights and selling the underlying shares. In the case of the ESP, given the seniority of the holders and the benefi t of the limited recourse feature, it is assumed the ESP will be held until expiry.
Dilution
When an investor exercises an exchange traded option, there is no change in either the company’s assets or the number of shares outstanding. However, when a company issued option is exercised, the number of shares outstanding will increase and the underlying assets of the company will be increased by the amount of the exercise proceeds. Any dilution of the share price of Crown which might arise on the issue of new shares following exercise of the ESP would be immaterial, given the number of existing shares on issue. Accordingly, no adjustment to the value of the ESP has been made for potential dilution.
Other assumptions – PBL’s share price was the loan amount per share as advised by management at the grant date for the ESP;
– Th e risk free rate is the yield on an Australian Government Bond with a life similar to the expected life at the valuation date;
– Expected volatility was based on PBL’s historical share price movement preceding the valuation date and the implied volatility on exchanged traded options;
– Th e dividend yield was calculated based on the consensus broker EPS forecast divided by PBL’s share price.
C R O W N L I M I T E D A N N U A L R E P O R T 2 0 0 8
p . 1 1 3
29. CONTINGENT LIABILITIES AND RELATED MATTERS CONSOLIDATED PARENT ENTITY
2008 2007 2008 2007 $’000 $’000 $’000 $’000
Unsecured 354,187 567,720 354,187 –
Contingent liabilities related primarily to the following:
Controlled Entities
(i) Under the terms of a deed entered into in accordance with the ASIC Class Order 98/1418, the parent entity has undertaken to meet any shortfall which might arise on the liquidation of controlled entities which are party to the deed. – – – –
(ii) Th e consolidated entity and parent entity have issued letters of credit to the State of Victoria in respect of obligations of Crown Melbourne Limited 185,000 185,000 185,000 –
(iii) Th e consolidated entity and parent entity have made guarantees in relation to commitments of certain of its associated entities 150,961 382,668 150,961 –
(iv) Th e consolidated entity and parent entity have made certain guarantees regarding contractual, performance and other commitments 18,226 52 18,226 –
Th e probability of having to meet these contingent liabilities is remote, and therefore it is not practicable to disclose an indication of the uncertainties relating to each amount or the timing of any outfl ows.
30. AUDITORS’ REMUNERATION CONSOLIDATED PARENT ENTITY
2008 2007 2008 2007 $’000 $’000 $’000 $’000
Amounts received, or due and receivable, by the auditor of the parent entity for: Auditing the accounts 764 1,254 – –
Taxation services 2,061 3,194 – –
Other services
• Assurance related 2 333 – –
• Assurance services relating to restructuring 642 3,050 – –
• Due diligence 334 3,645 – –
Amounts received, or due and receivable, by other member fi rms of Ernst & Young International for: Auditing the accounts of controlled entities 24 187 – –
Other services
• Taxation services 383 373 – –
• Assurance Related 25 – – –
• Due Diligence 354 – – –
4,589 12,036 –
Notes to the Financial Statements continued
For the year ended 30 June 2008
p . 1 1 4
31. EARNINGS PER SHARE EPS CONSOLIDATED
2008 2007 $’000 $’000
Th e following refl ects the income and share data used in the calculations of basic and diluted EPS:
Net profi t 3,563,219 1,980,231
Net (profi t) attributable to minority interests – (22,979)
Earnings used in calculating basic and diluted EPS 3,563,219 1,957,252
Weighted average number of ordinary shares used in calculating basic and diluted EPS (‘000) 689,206 684,666
Th e following refl ects the income and share data used in the calculations of basic and diluted EPS:
Excluding the eff ect of discontinued operations:
Net profi t attributable to members of the parent 3,563,219 1,957,252
Discontinued operations 3,426,213 1,666,522
Net profi t excluding discontinued operations and specifi c items 137,006 290,730
Earnings used in calculating basic and diluted EPS 137,006 290,730
Weighted average number of ordinary shares used in calculating basic and diluted EPS (‘000) 689,206 684,666
Excluding the eff ect of discontinued operations and specifi c items:
Net profi t attributable to members of the parent 3,563,219 1,957,252
Discontinued operations 3,426,213 1,666,522
Specifi c items after tax (239,163) (51,379)
Net profi t excluding discontinued operations and specifi c items 376,169 342,109
Earnings used in calculating basic and diluted EPS 376,169 342,109
Weighted average number of ordinary shares used in calculating basic and diluted EPS (‘000) 689,206 684,666
C R O W N L I M I T E D A N N U A L R E P O R T 2 0 0 8
p . 1 1 5
32. KEY MANAGEMENT PERSONNEL DISCLOSURESTh e Company has applied the exemption under Corporations Amendments Regulation 2006 which exempts listed companies from providing remuneration in their annual report as required by paragraphs Aus 25.4 to Aus 25.7.2 of Accounting Standard AASB 124 Related Party Disclosures. Th ese remuneration disclosures have been transferred to the remuneration report in pages 32 to 52, and have been audited.
(a) Details of key management personnel(i) Directors
James D Packer Executive Chairman
John H Alexander Executive Deputy Chairman
Christopher J Anderson Non Executive Director
Rowen B Craigie Chief Executive Offi cer and Managing Director
Christopher D Corrigan Non Executive Director
Rowena Danziger Non Executive Director
Geoff rey J Dixon Non Executive Director
Ashok P Jacob Non Executive Director
Michael R Johnston Non Executive Director
David H Lowy Non Executive Director
Christopher J Mackay Non Executive Director (resigned 7 March 2008)
Richard W Turner Non Executive Director
(ii) Executives
Geoff rey Kleemann Chief Financial Offi cer – Crown Limited
Guy Jalland PBL Group General Counsel and Joint Company Secretary (until 21 December 2007)
Martin Dalgleish Chief Executive Offi cer, PBL New Media (until 30 November 2007)
David Courtney Chief Executive Offi cer – Crown Melbourne Limited
Barry Felstead Chief Executive Offi cer – Burswood Limited
(b) Remuneration of key management personnel
Total remuneration for key management personnel for the Group and Parent Entity during the fi nancial year are set out below:
Remuneration by category 2008 2007 $ $
Short term 11,223,580 27,672,994
Post employment 405,282 850,401
Other long term 388,267 249,004
Termination 26,098,000 1,500,000
Share based payments 5,524,218 5,063,239
43,639,347 35,335,638
Further details are contained in the Remuneration Report.
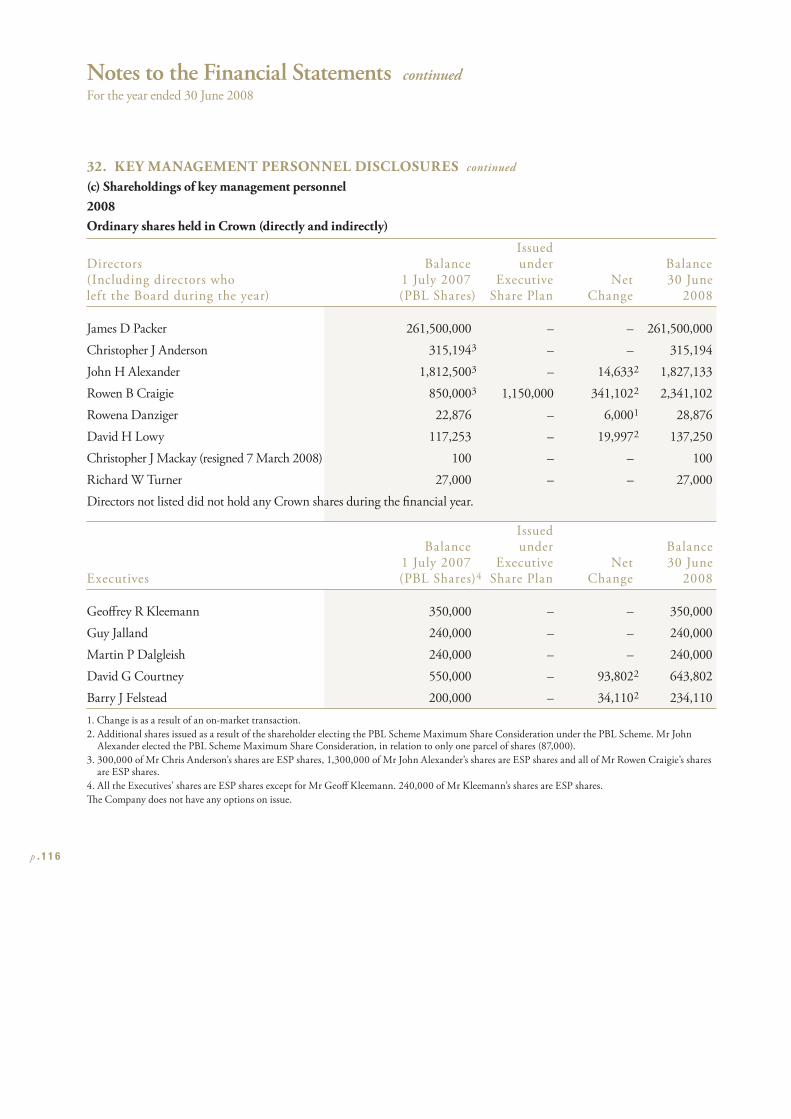
Notes to the Financial Statements continued
For the year ended 30 June 2008
p . 1 1 6
32. KEY MANAGEMENT PERSONNEL DISCLOSURES continued
(c) Shareholdings of key management personnel2008 Ordinary shares held in Crown (directly and indirectly)
Issued Directors Balance under Balance (Including directors who 1 July 2007 Executive Net 30 Juneleft the Board during the year) (PBL Shares) Share Plan Change 2008
James D Packer 261,500,000 – – 261,500,000
Christopher J Anderson 315,194 3 – – 315,194
John H Alexander 1,812,500 3 – 14,633 2 1,827,133
Rowen B Craigie 850,000 3 1,150,000 341,102 2 2,341,102
Rowena Danziger 22,876 – 6,000 1 28,876
David H Lowy 117,253 – 19,997 2 137,250
Christopher J Mackay (resigned 7 March 2008) 100 – – 100
Richard W Turner 27,000 – – 27,000
Directors not listed did not hold any Crown shares during the fi nancial year.
Issued Balance under Balance 1 July 2007 Executive Net 30 JuneExecutives (PBL Shares)4 Share Plan Change 2008
Geoff rey R Kleemann 350,000 – – 350,000
Guy Jalland 240,000 – – 240,000
Martin P Dalgleish 240,000 – – 240,000
David G Courtney 550,000 – 93,802 2 643,802
Barry J Felstead 200,000 – 34,110 2 234,110
1. Change is as a result of an on-market transaction.
2. Additional shares issued as a result of the shareholder electing the PBL Scheme Maximum Share Consideration under the PBL Scheme. Mr John Alexander elected the PBL Scheme Maximum Share Consideration, in relation to only one parcel of shares (87,000).
3. 300,000 of Mr Chris Anderson’s shares are ESP shares, 1,300,000 of Mr John Alexander’s shares are ESP shares and all of Mr Rowen Craigie’s shares are ESP shares.
4. All the Executives’ shares are ESP shares except for Mr Geoff Kleemann. 240,000 of Mr Kleemann’s shares are ESP shares.
Th e Company does not have any options on issue.
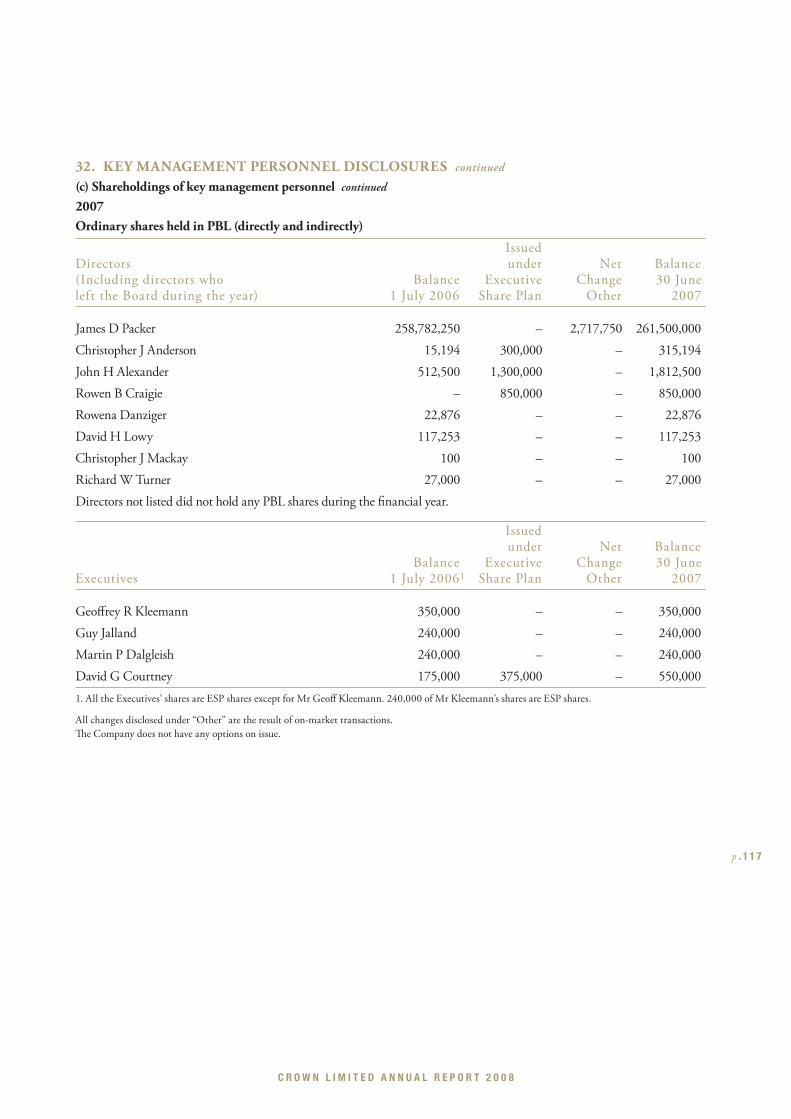
C R O W N L I M I T E D A N N U A L R E P O R T 2 0 0 8
p . 1 1 7
32. KEY MANAGEMENT PERSONNEL DISCLOSURES continued
(c) Shareholdings of key management personnel continued 2007 Ordinary shares held in PBL (directly and indirectly)
Issued Directors under Net Balance (Including directors who Balance Executive Change 30 Juneleft the Board during the year) 1 July 2006 Share Plan Other 2007
James D Packer 258,782,250 – 2,717,750 261,500,000
Christopher J Anderson 15,194 300,000 – 315,194
John H Alexander 512,500 1,300,000 – 1,812,500
Rowen B Craigie – 850,000 – 850,000
Rowena Danziger 22,876 – – 22,876
David H Lowy 117,253 – – 117,253
Christopher J Mackay 100 – – 100
Richard W Turner 27,000 – – 27,000
Directors not listed did not hold any PBL shares during the fi nancial year.
Issued under Net Balance Balance Executive Change 30 JuneExecutives 1 July 2006 1 Share Plan Other 2007
Geoff rey R Kleemann 350,000 – – 350,000
Guy Jalland 240,000 – – 240,000
Martin P Dalgleish 240,000 – – 240,000
David G Courtney 175,000 375,000 – 550,000
1. All the Executives’ shares are ESP shares except for Mr Geoff Kleemann. 240,000 of Mr Kleemann’s shares are ESP shares.
All changes disclosed under “Other” are the result of on-market transactions.
Th e Company does not have any options on issue.
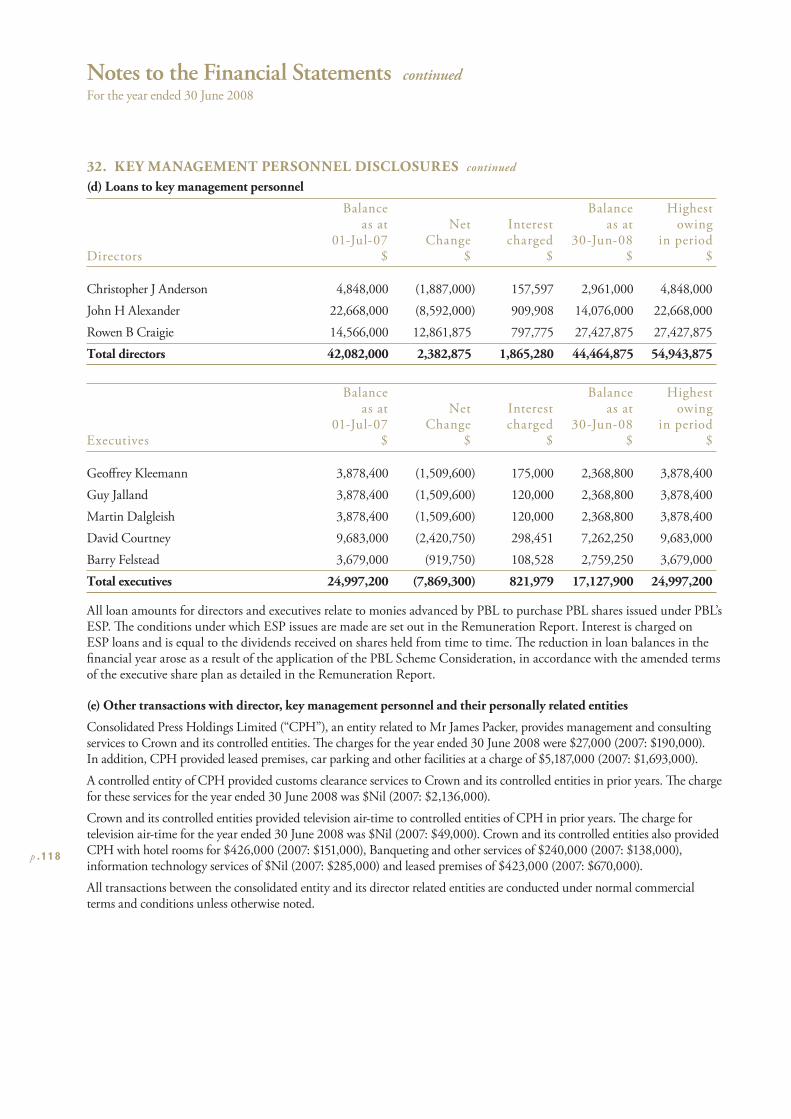
Notes to the Financial Statements continued
For the year ended 30 June 2008
p . 1 1 8
32. KEY MANAGEMENT PERSONNEL DISCLOSURES continued
(d) Loans to key management personnel
Balance Balance Highest as at Net Interest as at owing 01-Jul-07 Change charged 30-Jun-08 in periodDirectors $ $ $ $ $
Christopher J Anderson 4,848,000 (1,887,000) 157,597 2,961,000 4,848,000
John H Alexander 22,668,000 (8,592,000) 909,908 14,076,000 22,668,000
Rowen B Craigie 14,566,000 12,861,875 797,775 27,427,875 27,427,875
Total directors 42,082,000 2,382,875 1,865,280 44,464,875 54,943,875
Balance Balance Highest as at Net Interest as at owing 01-Jul-07 Change charged 30-Jun-08 in periodExecutives $ $ $ $ $
Geoff rey Kleemann 3,878,400 (1,509,600) 175,000 2,368,800 3,878,400
Guy Jalland 3,878,400 (1,509,600) 120,000 2,368,800 3,878,400
Martin Dalgleish 3,878,400 (1,509,600) 120,000 2,368,800 3,878,400
David Courtney 9,683,000 (2,420,750) 298,451 7,262,250 9,683,000
Barry Felstead 3,679,000 (919,750) 108,528 2,759,250 3,679,000
Total executives 24,997,200 (7,869,300) 821,979 17,127,900 24,997,200
All loan amounts for directors and executives relate to monies advanced by PBL to purchase PBL shares issued under PBL’s ESP. Th e conditions under which ESP issues are made are set out in the Remuneration Report. Interest is charged on ESP loans and is equal to the dividends received on shares held from time to time. Th e reduction in loan balances in the fi nancial year arose as a result of the application of the PBL Scheme Consideration, in accordance with the amended terms of the executive share plan as detailed in the Remuneration Report.
(e) Other transactions with director, key management personnel and their personally related entities
Consolidated Press Holdings Limited (“CPH”), an entity related to Mr James Packer, provides management and consulting services to Crown and its controlled entities. Th e charges for the year ended 30 June 2008 were $27,000 (2007: $190,000). In addition, CPH provided leased premises, car parking and other facilities at a charge of $5,187,000 (2007: $1,693,000).
A controlled entity of CPH provided customs clearance services to Crown and its controlled entities in prior years. Th e charge for these services for the year ended 30 June 2008 was $Nil (2007: $2,136,000).
Crown and its controlled entities provided television air-time to controlled entities of CPH in prior years. Th e charge for television air-time for the year ended 30 June 2008 was $Nil (2007: $49,000). Crown and its controlled entities also provided CPH with hotel rooms for $426,000 (2007: $151,000), Banqueting and other services of $240,000 (2007: $138,000), information technology services of $Nil (2007: $285,000) and leased premises of $423,000 (2007: $670,000).
All transactions between the consolidated entity and its director related entities are conducted under normal commercial terms and conditions unless otherwise noted.
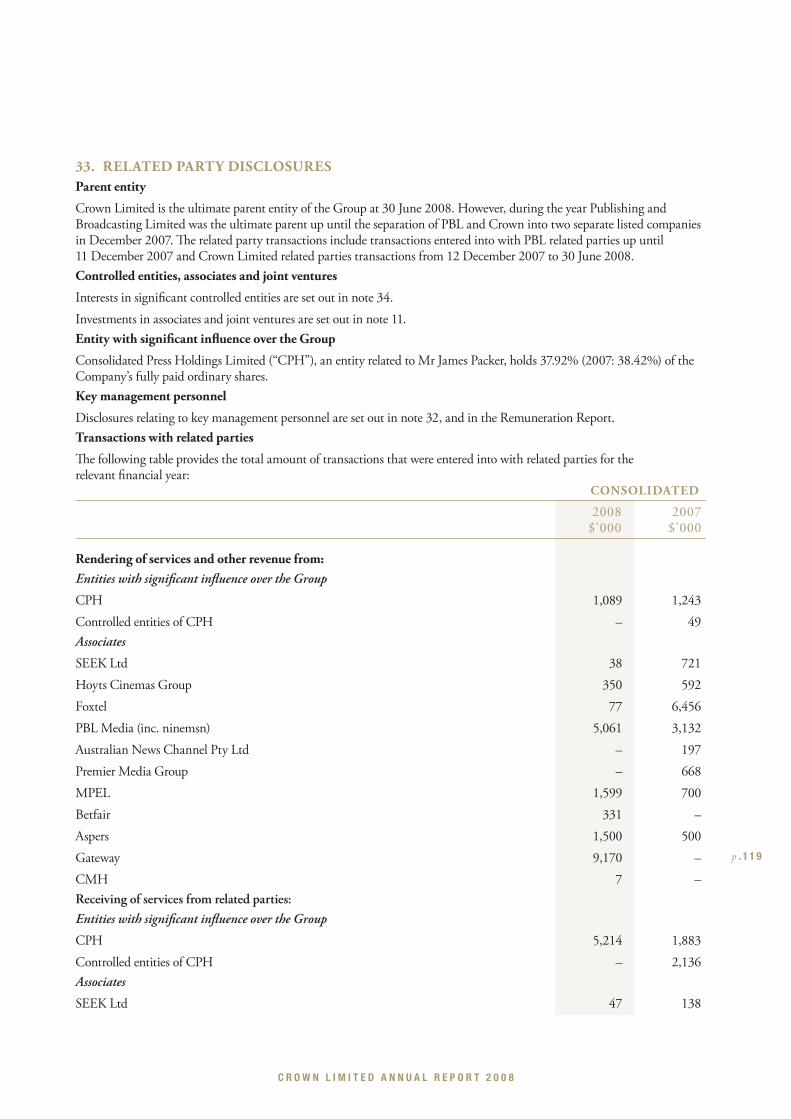
C R O W N L I M I T E D A N N U A L R E P O R T 2 0 0 8
p . 1 1 9
33. RELATED PARTY DISCLOSURESParent entity
Crown Limited is the ultimate parent entity of the Group at 30 June 2008. However, during the year Publishing and Broadcasting Limited was the ultimate parent up until the separation of PBL and Crown into two separate listed companies in December 2007. Th e related party transactions include transactions entered into with PBL related parties up until 11 December 2007 and Crown Limited related parties transactions from 12 December 2007 to 30 June 2008.
Controlled entities, associates and joint ventures
Interests in signifi cant controlled entities are set out in note 34.
Investments in associates and joint ventures are set out in note 11.
Entity with signifi cant infl uence over the Group
Consolidated Press Holdings Limited (“CPH”), an entity related to Mr James Packer, holds 37.92% (2007: 38.42%) of the Company’s fully paid ordinary shares.
Key management personnel
Disclosures relating to key management personnel are set out in note 32, and in the Remuneration Report.
Transactions with related parties
Th e following table provides the total amount of transactions that were entered into with related parties for the relevant fi nancial year: CONSOLIDATED
2008 2007 $’000 $’000
Rendering of services and other revenue from:Entities with signifi cant infl uence over the Group
CPH 1,089 1,243
Controlled entities of CPH – 49
Associates
SEEK Ltd 38 721
Hoyts Cinemas Group 350 592
Foxtel 77 6,456
PBL Media (inc. ninemsn) 5,061 3,132
Australian News Channel Pty Ltd – 197
Premier Media Group – 668
MPEL 1,599 700
Betfair 331 –
Aspers 1,500 500
Gateway 9,170 –
CMH 7 –
Receiving of services from related parties:
Entities with signifi cant infl uence over the Group
CPH 5,214 1,883
Controlled entities of CPH – 2,136
Associates
SEEK Ltd 47 138
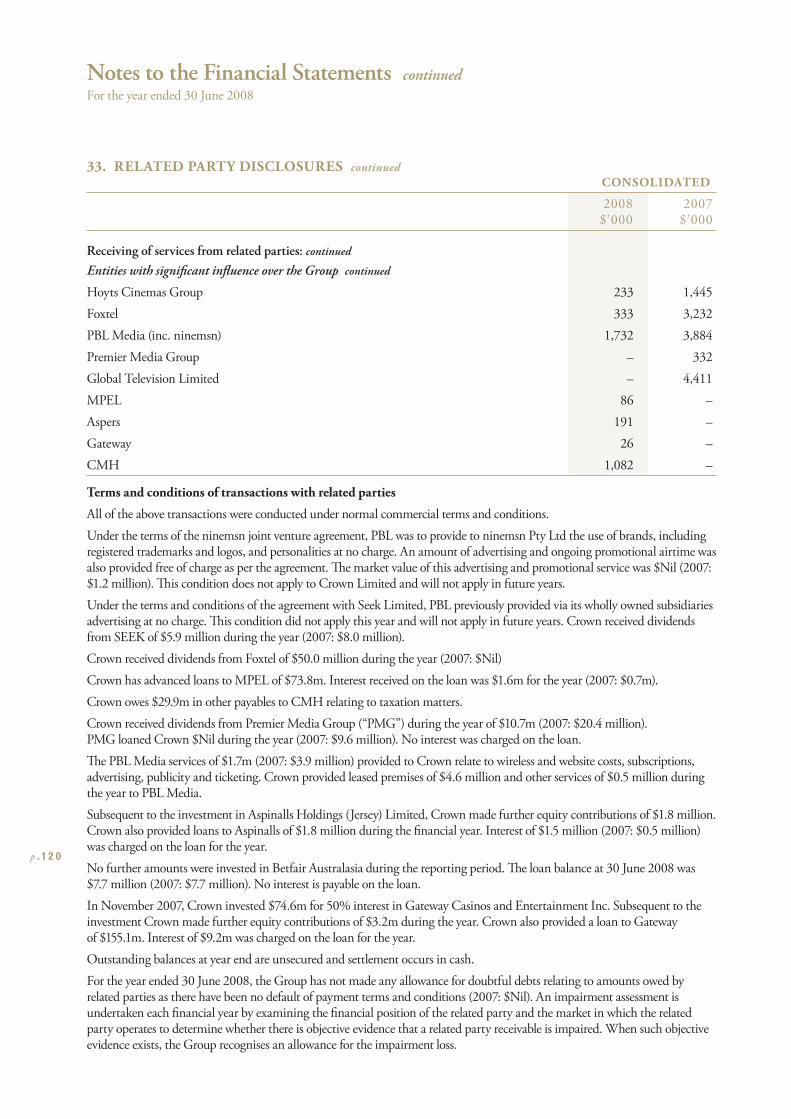
Notes to the Financial Statements continued
For the year ended 30 June 2008
p . 1 2 0
33. RELATED PARTY DISCLOSURES continued
CONSOLIDATED
2008 2007 $’000 $’000
Receiving of services from related parties: continued
Entities with signifi cant infl uence over the Group continued
Hoyts Cinemas Group 233 1,445
Foxtel 333 3,232
PBL Media (inc. ninemsn) 1,732 3,884
Premier Media Group – 332
Global Television Limited – 4,411
MPEL 86 –
Aspers 191 –
Gateway 26 –
CMH 1,082 –
Terms and conditions of transactions with related parties
All of the above transactions were conducted under normal commercial terms and conditions.
Under the terms of the ninemsn joint venture agreement, PBL was to provide to ninemsn Pty Ltd the use of brands, including registered trademarks and logos, and personalities at no charge. An amount of advertising and ongoing promotional airtime was also provided free of charge as per the agreement. Th e market value of this advertising and promotional service was $Nil (2007: $1.2 million). Th is condition does not apply to Crown Limited and will not apply in future years.
Under the terms and conditions of the agreement with Seek Limited, PBL previously provided via its wholly owned subsidiaries advertising at no charge. Th is condition did not apply this year and will not apply in future years. Crown received dividends from SEEK of $5.9 million during the year (2007: $8.0 million).
Crown received dividends from Foxtel of $50.0 million during the year (2007: $Nil)
Crown has advanced loans to MPEL of $73.8m. Interest received on the loan was $1.6m for the year (2007: $0.7m).
Crown owes $29.9m in other payables to CMH relating to taxation matters.
Crown received dividends from Premier Media Group (“PMG”) during the year of $10.7m (2007: $20.4 million). PMG loaned Crown $Nil during the year (2007: $9.6 million). No interest was charged on the loan.
Th e PBL Media services of $1.7m (2007: $3.9 million) provided to Crown relate to wireless and website costs, subscriptions, advertising, publicity and ticketing. Crown provided leased premises of $4.6 million and other services of $0.5 million during the year to PBL Media.
Subsequent to the investment in Aspinalls Holdings (Jersey) Limited, Crown made further equity contributions of $1.8 million. Crown also provided loans to Aspinalls of $1.8 million during the fi nancial year. Interest of $1.5 million (2007: $0.5 million) was charged on the loan for the year.
No further amounts were invested in Betfair Australasia during the reporting period. Th e loan balance at 30 June 2008 was $7.7 million (2007: $7.7 million). No interest is payable on the loan.
In November 2007, Crown invested $74.6m for 50% interest in Gateway Casinos and Entertainment Inc. Subsequent to the investment Crown made further equity contributions of $3.2m during the year. Crown also provided a loan to Gateway of $155.1m. Interest of $9.2m was charged on the loan for the year.
Outstanding balances at year end are unsecured and settlement occurs in cash.
For the year ended 30 June 2008, the Group has not made any allowance for doubtful debts relating to amounts owed by related parties as there have been no default of payment terms and conditions (2007: $Nil). An impairment assessment is undertaken each fi nancial year by examining the fi nancial position of the related party and the market in which the related party operates to determine whether there is objective evidence that a related party receivable is impaired. When such objective evidence exists, the Group recognises an allowance for the impairment loss.
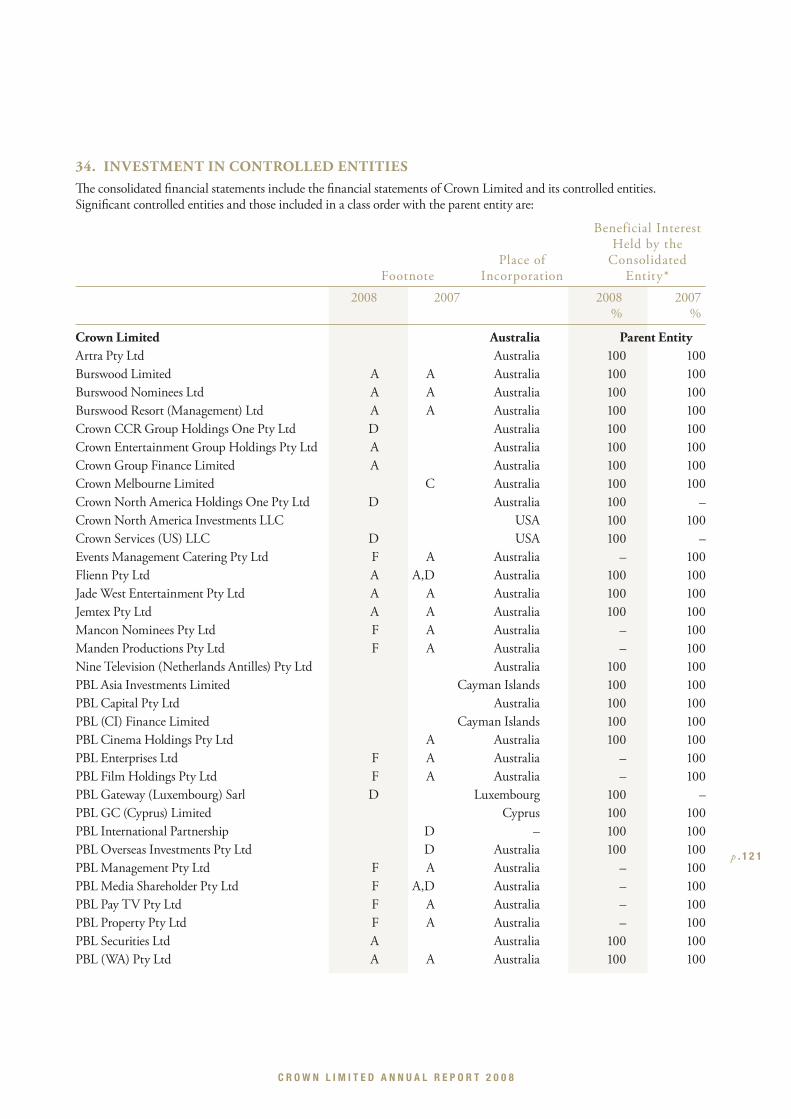
C R O W N L I M I T E D A N N U A L R E P O R T 2 0 0 8
p . 1 2 1
34. INVESTMENT IN CONTROLLED ENTITIESTh e consolidated fi nancial statements include the fi nancial statements of Crown Limited and its controlled entities. Signifi cant controlled entities and those included in a class order with the parent entity are:
Beneficial Interest Held by the Place of Consolidated Footnote Incorporation Entity*
2008 2007 2008 2007 % %
Crown Limited Australia Parent EntityArtra Pty Ltd Australia 100 100
Burswood Limited A A Australia 100 100
Burswood Nominees Ltd A A Australia 100 100
Burswood Resort (Management) Ltd A A Australia 100 100
Crown CCR Group Holdings One Pty Ltd D Australia 100 100
Crown Entertainment Group Holdings Pty Ltd A Australia 100 100
Crown Group Finance Limited A Australia 100 100
Crown Melbourne Limited C Australia 100 100
Crown North America Holdings One Pty Ltd D Australia 100 –
Crown North America Investments LLC USA 100 100
Crown Services (US) LLC D USA 100 –
Events Management Catering Pty Ltd F A Australia – 100
Flienn Pty Ltd A A,D Australia 100 100
Jade West Entertainment Pty Ltd A A Australia 100 100
Jemtex Pty Ltd A A Australia 100 100
Mancon Nominees Pty Ltd F A Australia – 100
Manden Productions Pty Ltd F A Australia – 100
Nine Television (Netherlands Antilles) Pty Ltd Australia 100 100
PBL Asia Investments Limited Cayman Islands 100 100
PBL Capital Pty Ltd Australia 100 100
PBL (CI) Finance Limited Cayman Islands 100 100
PBL Cinema Holdings Pty Ltd A Australia 100 100
PBL Enterprises Ltd F A Australia – 100
PBL Film Holdings Pty Ltd F A Australia – 100
PBL Gateway (Luxembourg) Sarl D Luxembourg 100 –
PBL GC (Cyprus) Limited Cyprus 100 100
PBL International Partnership D – 100 100
PBL Overseas Investments Pty Ltd D Australia 100 100
PBL Management Pty Ltd F A Australia – 100
PBL Media Shareholder Pty Ltd F A,D Australia – 100
PBL Pay TV Pty Ltd F A Australia – 100
PBL Property Pty Ltd F A Australia – 100
PBL Securities Ltd A Australia 100 100
PBL (WA) Pty Ltd A A Australia 100 100
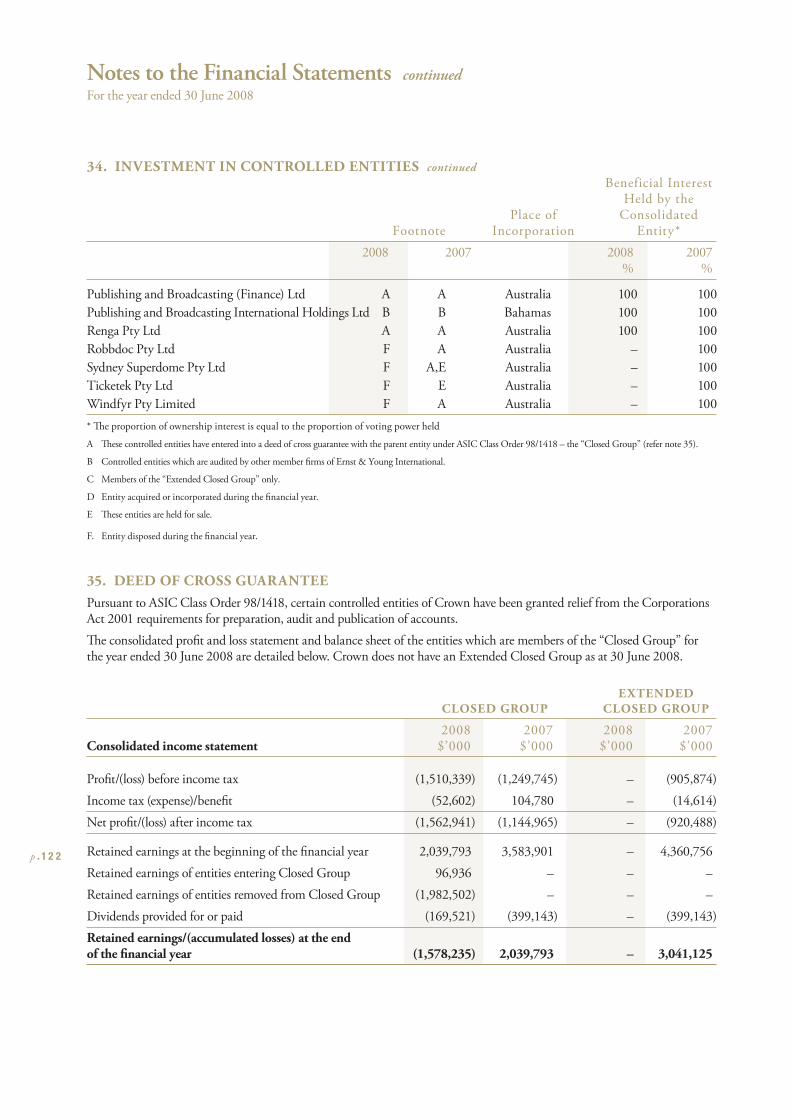
Notes to the Financial Statements continued
For the year ended 30 June 2008
p . 1 2 2
34. INVESTMENT IN CONTROLLED ENTITIES continued
Beneficial Interest Held by the Place of Consolidated Footnote Incorporation Entity*
2008 2007 2008 2007 % %
Publishing and Broadcasting (Finance) Ltd A A Australia 100 100
Publishing and Broadcasting International Holdings Ltd B B Bahamas 100 100
Renga Pty Ltd A A Australia 100 100
Robbdoc Pty Ltd F A Australia – 100
Sydney Superdome Pty Ltd F A,E Australia – 100
Ticketek Pty Ltd F E Australia – 100
Windfyr Pty Limited F A Australia – 100
* Th e proportion of ownership interest is equal to the proportion of voting power held
A Th ese controlled entities have entered into a deed of cross guarantee with the parent entity under ASIC Class Order 98/1418 – the “Closed Group” (refer note 35).
B Controlled entities which are audited by other member fi rms of Ernst & Young International.
C Members of the “Extended Closed Group” only.
D Entity acquired or incorporated during the fi nancial year.
E Th ese entities are held for sale.
F. Entity disposed during the fi nancial year.
35. DEED OF CROSS GUARANTEEPursuant to ASIC Class Order 98/1418, certain controlled entities of Crown have been granted relief from the Corporations Act 2001 requirements for preparation, audit and publication of accounts.
Th e consolidated profi t and loss statement and balance sheet of the entities which are members of the “Closed Group” for the year ended 30 June 2008 are detailed below. Crown does not have an Extended Closed Group as at 30 June 2008.
EXTENDED CLOSED GROUP CLOSED GROUP
2008 2007 2008 2007Consolidated income statement $’000 $’000 $’000 $’000
Profi t/(loss) before income tax (1,510,339) (1,249,745) – (905,874)
Income tax (expense)/benefi t (52,602) 104,780 – (14,614)
Net profi t/(loss) after income tax (1,562,941) (1,144,965) – (920,488)
Retained earnings at the beginning of the fi nancial year 2,039,793 3,583,901 – 4,360,756
Retained earnings of entities entering Closed Group 96,936 – – –
Retained earnings of entities removed from Closed Group (1,982,502) – – –
Dividends provided for or paid (169,521) (399,143) – (399,143)
Retained earnings/(accumulated losses) at the end of the fi nancial year (1,578,235) 2,039,793 – 3,041,125
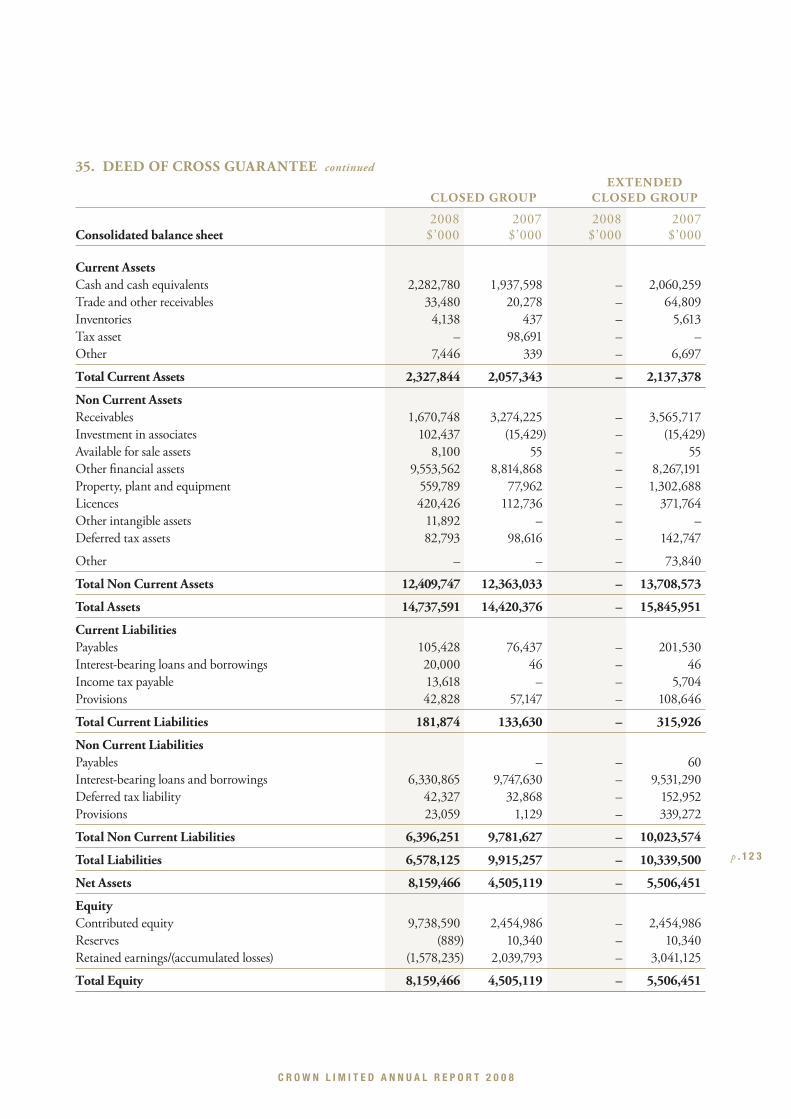
C R O W N L I M I T E D A N N U A L R E P O R T 2 0 0 8
p . 1 2 3
35. DEED OF CROSS GUARANTEE continued
EXTENDED CLOSED GROUP CLOSED GROUP
2008 2007 2008 2007Consolidated balance sheet $’000 $’000 $’000 $’000
Current AssetsCash and cash equivalents 2,282,780 1,937,598 – 2,060,259
Trade and other receivables 33,480 20,278 – 64,809
Inventories 4,138 437 – 5,613
Tax asset – 98,691 – –
Other 7,446 339 – 6,697
Total Current Assets 2,327,844 2,057,343 – 2,137,378
Non Current AssetsReceivables 1,670,748 3,274,225 – 3,565,717
Investment in associates 102,437 (15,429) – (15,429)
Available for sale assets 8,100 55 – 55
Other fi nancial assets 9,553,562 8,814,868 – 8,267,191
Property, plant and equipment 559,789 77,962 – 1,302,688
Licences 420,426 112,736 – 371,764
Other intangible assets 11,892 – – –
Deferred tax assets 82,793 98,616 – 142,747
Other – – – 73,840
Total Non Current Assets 12,409,747 12,363,033 – 13,708,573
Total Assets 14,737,591 14,420,376 – 15,845,951
Current LiabilitiesPayables 105,428 76,437 – 201,530
Interest-bearing loans and borrowings 20,000 46 – 46
Income tax payable 13,618 – – 5,704
Provisions 42,828 57,147 – 108,646
Total Current Liabilities 181,874 133,630 – 315,926
Non Current LiabilitiesPayables – – 60
Interest-bearing loans and borrowings 6,330,865 9,747,630 – 9,531,290
Deferred tax liability 42,327 32,868 – 152,952
Provisions 23,059 1,129 – 339,272
Total Non Current Liabilities 6,396,251 9,781,627 – 10,023,574
Total Liabilities 6,578,125 9,915,257 – 10,339,500
Net Assets 8,159,466 4,505,119 – 5,506,451
EquityContributed equity 9,738,590 2,454,986 – 2,454,986
Reserves (889) 10,340 – 10,340
Retained earnings/(accumulated losses) (1,578,235) 2,039,793 – 3,041,125
Total Equity 8,159,466 4,505,119 – 5,506,451
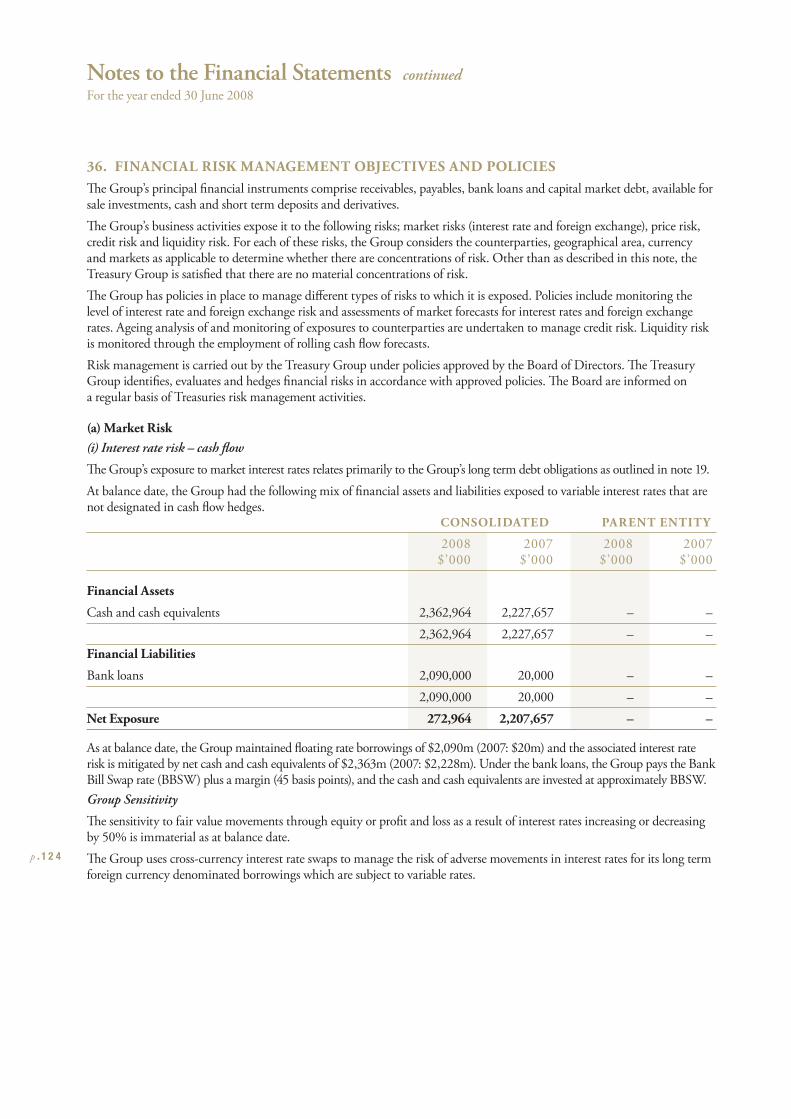
Notes to the Financial Statements continued
For the year ended 30 June 2008
p . 1 2 4
36. FINANCIAL RISK MANAGEMENT OBJECTIVES AND POLICIESTh e Group’s principal fi nancial instruments comprise receivables, payables, bank loans and capital market debt, available for sale investments, cash and short term deposits and derivatives.
Th e Group’s business activities expose it to the following risks; market risks (interest rate and foreign exchange), price risk, credit risk and liquidity risk. For each of these risks, the Group considers the counterparties, geographical area, currency and markets as applicable to determine whether there are concentrations of risk. Other than as described in this note, the Treasury Group is satisfi ed that there are no material concentrations of risk.
Th e Group has policies in place to manage diff erent types of risks to which it is exposed. Policies include monitoring the level of interest rate and foreign exchange risk and assessments of market forecasts for interest rates and foreign exchange rates. Ageing analysis of and monitoring of exposures to counterparties are undertaken to manage credit risk. Liquidity risk is monitored through the employment of rolling cash fl ow forecasts.
Risk management is carried out by the Treasury Group under policies approved by the Board of Directors. Th e Treasury Group identifi es, evaluates and hedges fi nancial risks in accordance with approved policies. Th e Board are informed on a regular basis of Treasuries risk management activities.
(a) Market Risk(i) Interest rate risk – cash fl ow
Th e Group’s exposure to market interest rates relates primarily to the Group’s long term debt obligations as outlined in note 19.
At balance date, the Group had the following mix of fi nancial assets and liabilities exposed to variable interest rates that are not designated in cash fl ow hedges. CONSOLIDATED PARENT ENTITY
2008 2007 2008 2007 $’000 $’000 $’000 $’000
Financial Assets
Cash and cash equivalents 2,362,964 2,227,657 – –
2,362,964 2,227,657 – –
Financial Liabilities
Bank loans 2,090,000 20,000 – –
2,090,000 20,000 – –
Net Exposure 272,964 2,207,657 – –
As at balance date, the Group maintained fl oating rate borrowings of $2,090m (2007: $20m) and the associated interest rate risk is mitigated by net cash and cash equivalents of $2,363m (2007: $2,228m). Under the bank loans, the Group pays the Bank Bill Swap rate (BBSW) plus a margin (45 basis points), and the cash and cash equivalents are invested at approximately BBSW.
Group Sensitivity
Th e sensitivity to fair value movements through equity or profi t and loss as a result of interest rates increasing or decreasing by 50% is immaterial as at balance date.
Th e Group uses cross-currency interest rate swaps to manage the risk of adverse movements in interest rates for its long term foreign currency denominated borrowings which are subject to variable rates.
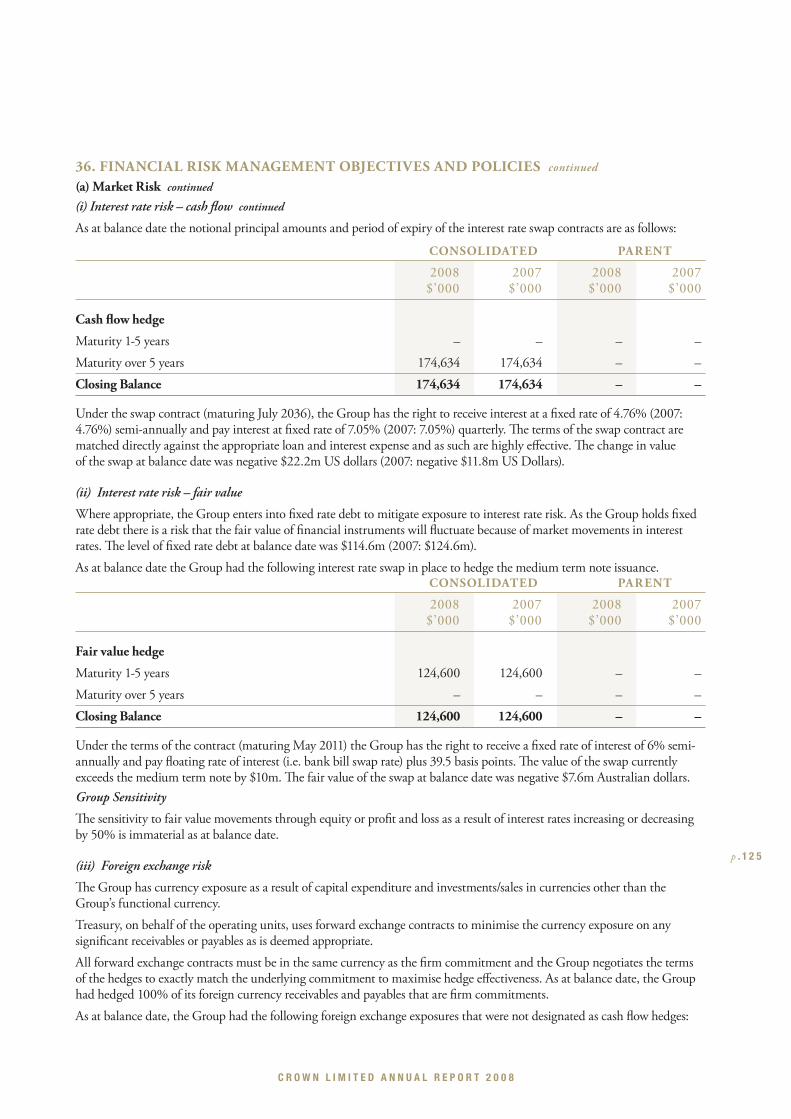
C R O W N L I M I T E D A N N U A L R E P O R T 2 0 0 8
p . 1 2 5
36. FINANCIAL RISK MANAGEMENT OBJECTIVES AND POLICIES continued
(a) Market Risk continued (i) Interest rate risk – cash fl ow continued
As at balance date the notional principal amounts and period of expiry of the interest rate swap contracts are as follows:
CONSOLIDATED PARENT
2008 2007 2008 2007 $’000 $’000 $’000 $’000
Cash fl ow hedge
Maturity 1-5 years – – – –
Maturity over 5 years 174,634 174,634 – –
Closing Balance 174,634 174,634 – –
Under the swap contract (maturing July 2036), the Group has the right to receive interest at a fi xed rate of 4.76% (2007: 4.76%) semi-annually and pay interest at fi xed rate of 7.05% (2007: 7.05%) quarterly. Th e terms of the swap contract are matched directly against the appropriate loan and interest expense and as such are highly eff ective. Th e change in value of the swap at balance date was negative $22.2m US dollars (2007: negative $11.8m US Dollars).
(ii) Interest rate risk – fair value
Where appropriate, the Group enters into fi xed rate debt to mitigate exposure to interest rate risk. As the Group holds fi xed rate debt there is a risk that the fair value of fi nancial instruments will fl uctuate because of market movements in interest rates. Th e level of fi xed rate debt at balance date was $114.6m (2007: $124.6m).
As at balance date the Group had the following interest rate swap in place to hedge the medium term note issuance. CONSOLIDATED PARENT
2008 2007 2008 2007 $’000 $’000 $’000 $’000
Fair value hedge
Maturity 1-5 years 124,600 124,600 – –
Maturity over 5 years – – – –
Closing Balance 124,600 124,600 – –
Under the terms of the contract (maturing May 2011) the Group has the right to receive a fi xed rate of interest of 6% semi-annually and pay fl oating rate of interest (i.e. bank bill swap rate) plus 39.5 basis points. Th e value of the swap currently exceeds the medium term note by $10m. Th e fair value of the swap at balance date was negative $7.6m Australian dollars.
Group Sensitivity
Th e sensitivity to fair value movements through equity or profi t and loss as a result of interest rates increasing or decreasing by 50% is immaterial as at balance date.
(iii) Foreign exchange risk
Th e Group has currency exposure as a result of capital expenditure and investments/sales in currencies other than the Group’s functional currency.
Treasury, on behalf of the operating units, uses forward exchange contracts to minimise the currency exposure on any signifi cant receivables or payables as is deemed appropriate.
All forward exchange contracts must be in the same currency as the fi rm commitment and the Group negotiates the terms of the hedges to exactly match the underlying commitment to maximise hedge eff ectiveness. As at balance date, the Group had hedged 100% of its foreign currency receivables and payables that are fi rm commitments.
As at balance date, the Group had the following foreign exchange exposures that were not designated as cash fl ow hedges:
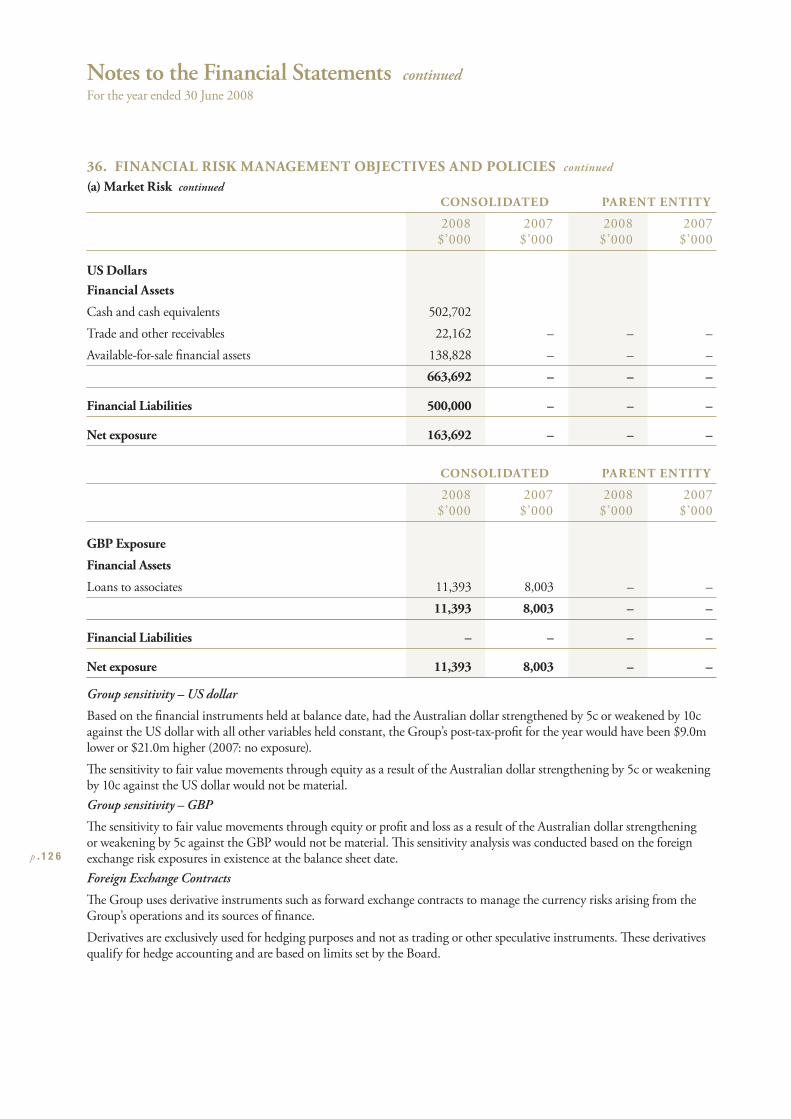
Notes to the Financial Statements continued
For the year ended 30 June 2008
p . 1 2 6
36. FINANCIAL RISK MANAGEMENT OBJECTIVES AND POLICIES continued
(a) Market Risk continued
CONSOLIDATED PARENT ENTITY
2008 2007 2008 2007 $’000 $’000 $’000 $’000
US DollarsFinancial Assets
Cash and cash equivalents 502,702
Trade and other receivables 22,162 – – –
Available-for-sale fi nancial assets 138,828 – – –
663,692 – – –
Financial Liabilities 500,000 – – –
Net exposure 163,692 – – –
CONSOLIDATED PARENT ENTITY
2008 2007 2008 2007 $’000 $’000 $’000 $’000
GBP Exposure
Financial Assets
Loans to associates 11,393 8,003 – –
11,393 8,003 – –
Financial Liabilities – – – –
Net exposure 11,393 8,003 – –
Group sensitivity – US dollar
Based on the fi nancial instruments held at balance date, had the Australian dollar strengthened by 5c or weakened by 10c against the US dollar with all other variables held constant, the Group’s post-tax-profi t for the year would have been $9.0m lower or $21.0m higher (2007: no exposure).
Th e sensitivity to fair value movements through equity as a result of the Australian dollar strengthening by 5c or weakening by 10c against the US dollar would not be material.
Group sensitivity – GBP
Th e sensitivity to fair value movements through equity or profi t and loss as a result of the Australian dollar strengthening or weakening by 5c against the GBP would not be material. Th is sensitivity analysis was conducted based on the foreign exchange risk exposures in existence at the balance sheet date.
Foreign Exchange Contracts
Th e Group uses derivative instruments such as forward exchange contracts to manage the currency risks arising from the Group’s operations and its sources of fi nance.
Derivatives are exclusively used for hedging purposes and not as trading or other speculative instruments. Th ese derivatives qualify for hedge accounting and are based on limits set by the Board.
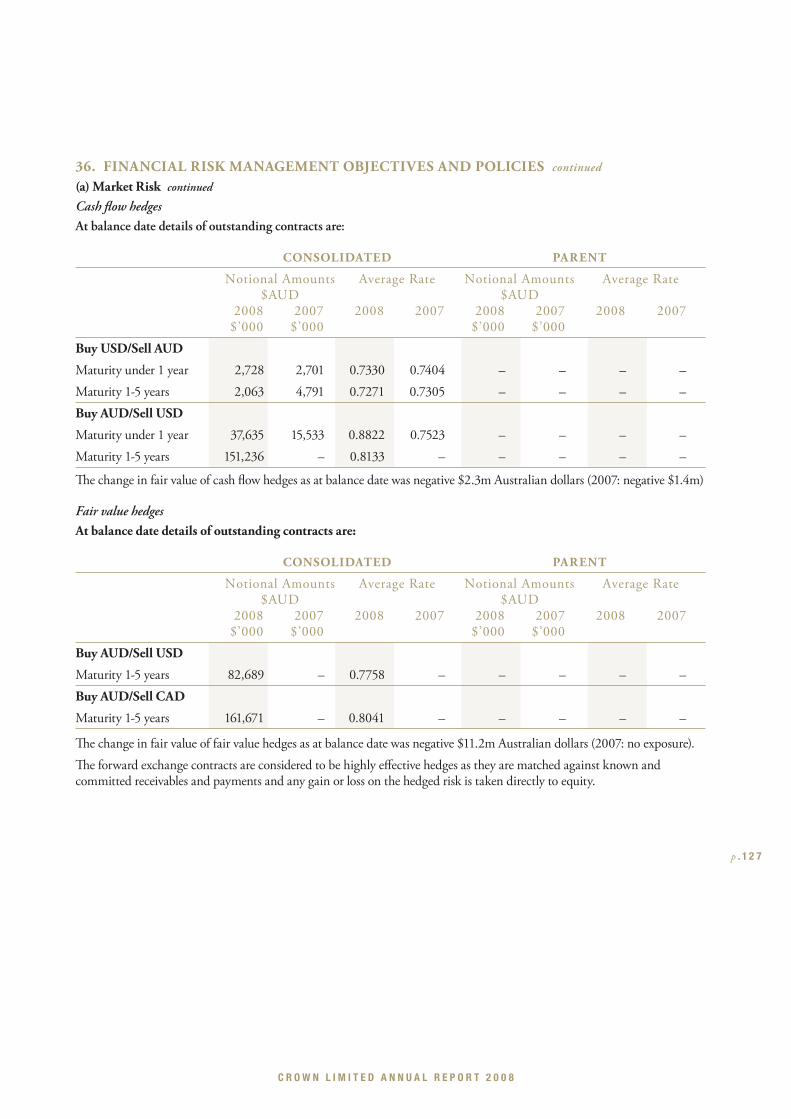
C R O W N L I M I T E D A N N U A L R E P O R T 2 0 0 8
p . 1 2 7
36. FINANCIAL RISK MANAGEMENT OBJECTIVES AND POLICIES continued
(a) Market Risk continued
Cash fl ow hedges
At balance date details of outstanding contracts are:
CONSOLIDATED PARENT
Notional Amounts Average Rate Notional Amounts Average Rate $AUD $AUD 2008 2007 2008 2007 2008 2007 2008 2007 $’000 $’000 $’000 $’000
Buy USD/Sell AUD
Maturity under 1 year 2,728 2,701 0.7330 0.7404 – – – –
Maturity 1-5 years 2,063 4,791 0.7271 0.7305 – – – –
Buy AUD/Sell USD
Maturity under 1 year 37,635 15,533 0.8822 0.7523 – – – –
Maturity 1-5 years 151,236 – 0.8133 – – – – –
Th e change in fair value of cash fl ow hedges as at balance date was negative $2.3m Australian dollars (2007: negative $1.4m)
Fair value hedges
At balance date details of outstanding contracts are:
CONSOLIDATED PARENT
Notional Amounts Average Rate Notional Amounts Average Rate $AUD $AUD 2008 2007 2008 2007 2008 2007 2008 2007 $’000 $’000 $’000 $’000
Buy AUD/Sell USD
Maturity 1-5 years 82,689 – 0.7758 – – – – –
Buy AUD/Sell CAD
Maturity 1-5 years 161,671 – 0.8041 – – – – –
Th e change in fair value of fair value hedges as at balance date was negative $11.2m Australian dollars (2007: no exposure).
Th e forward exchange contracts are considered to be highly eff ective hedges as they are matched against known and committed receivables and payments and any gain or loss on the hedged risk is taken directly to equity.
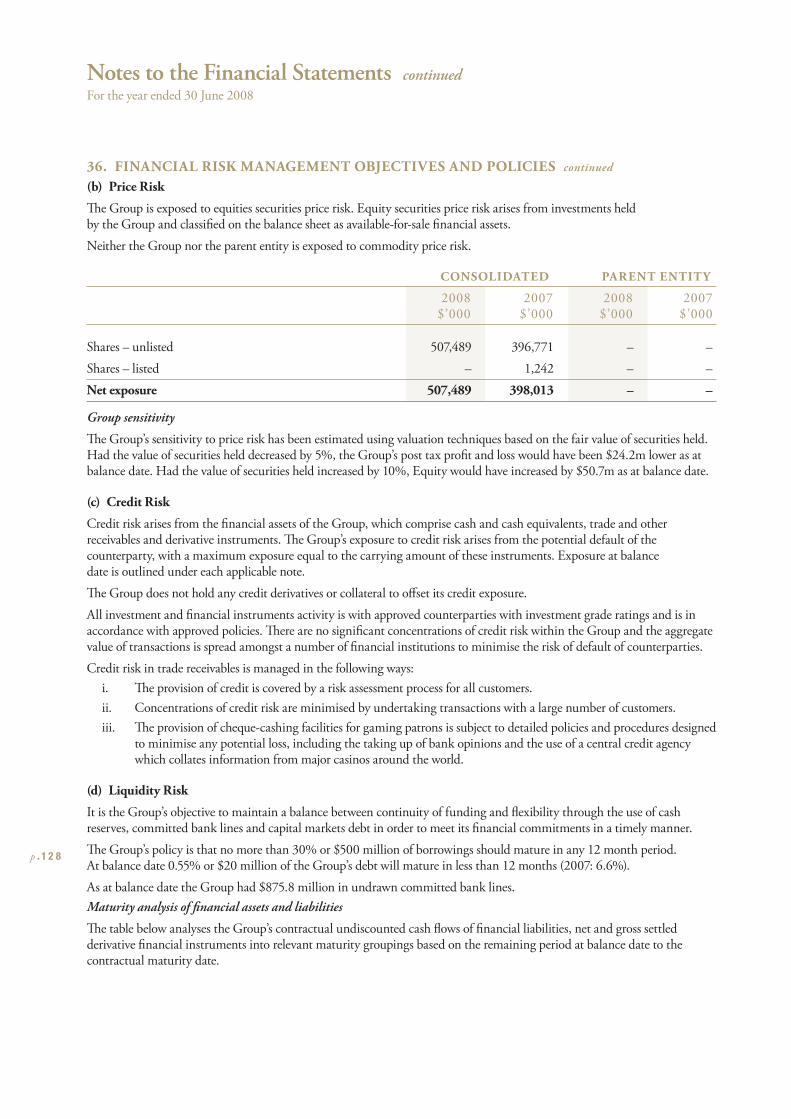
Notes to the Financial Statements continued
For the year ended 30 June 2008
p . 1 2 8
36. FINANCIAL RISK MANAGEMENT OBJECTIVES AND POLICIES continued
(b) Price Risk
Th e Group is exposed to equities securities price risk. Equity securities price risk arises from investments held by the Group and classifi ed on the balance sheet as available-for-sale fi nancial assets.
Neither the Group nor the parent entity is exposed to commodity price risk. CONSOLIDATED PARENT ENTITY
2008 2007 2008 2007 $’000 $’000 $’000 $’000
Shares – unlisted 507,489 396,771 – –
Shares – listed – 1,242 – –
Net exposure 507,489 398,013 – –
Group sensitivity
Th e Group’s sensitivity to price risk has been estimated using valuation techniques based on the fair value of securities held. Had the value of securities held decreased by 5%, the Group’s post tax profi t and loss would have been $24.2m lower as at balance date. Had the value of securities held increased by 10%, Equity would have increased by $50.7m as at balance date.
(c) Credit Risk
Credit risk arises from the fi nancial assets of the Group, which comprise cash and cash equivalents, trade and other receivables and derivative instruments. Th e Group’s exposure to credit risk arises from the potential default of the counterparty, with a maximum exposure equal to the carrying amount of these instruments. Exposure at balance date is outlined under each applicable note.
Th e Group does not hold any credit derivatives or collateral to off set its credit exposure.
All investment and fi nancial instruments activity is with approved counterparties with investment grade ratings and is in accordance with approved policies. Th ere are no signifi cant concentrations of credit risk within the Group and the aggregate value of transactions is spread amongst a number of fi nancial institutions to minimise the risk of default of counterparties.
Credit risk in trade receivables is managed in the following ways:
i. Th e provision of credit is covered by a risk assessment process for all customers.
ii. Concentrations of credit risk are minimised by undertaking transactions with a large number of customers.
iii. Th e provision of cheque-cashing facilities for gaming patrons is subject to detailed policies and procedures designed to minimise any potential loss, including the taking up of bank opinions and the use of a central credit agency which collates information from major casinos around the world.
(d) Liquidity Risk
It is the Group’s objective to maintain a balance between continuity of funding and fl exibility through the use of cash reserves, committed bank lines and capital markets debt in order to meet its fi nancial commitments in a timely manner.
Th e Group’s policy is that no more than 30% or $500 million of borrowings should mature in any 12 month period. At balance date 0.55% or $20 million of the Group’s debt will mature in less than 12 months (2007: 6.6%).
As at balance date the Group had $875.8 million in undrawn committed bank lines.
Maturity analysis of fi nancial assets and liabilities
Th e table below analyses the Group’s contractual undiscounted cash fl ows of fi nancial liabilities, net and gross settled derivative fi nancial instruments into relevant maturity groupings based on the remaining period at balance date to the contractual maturity date.
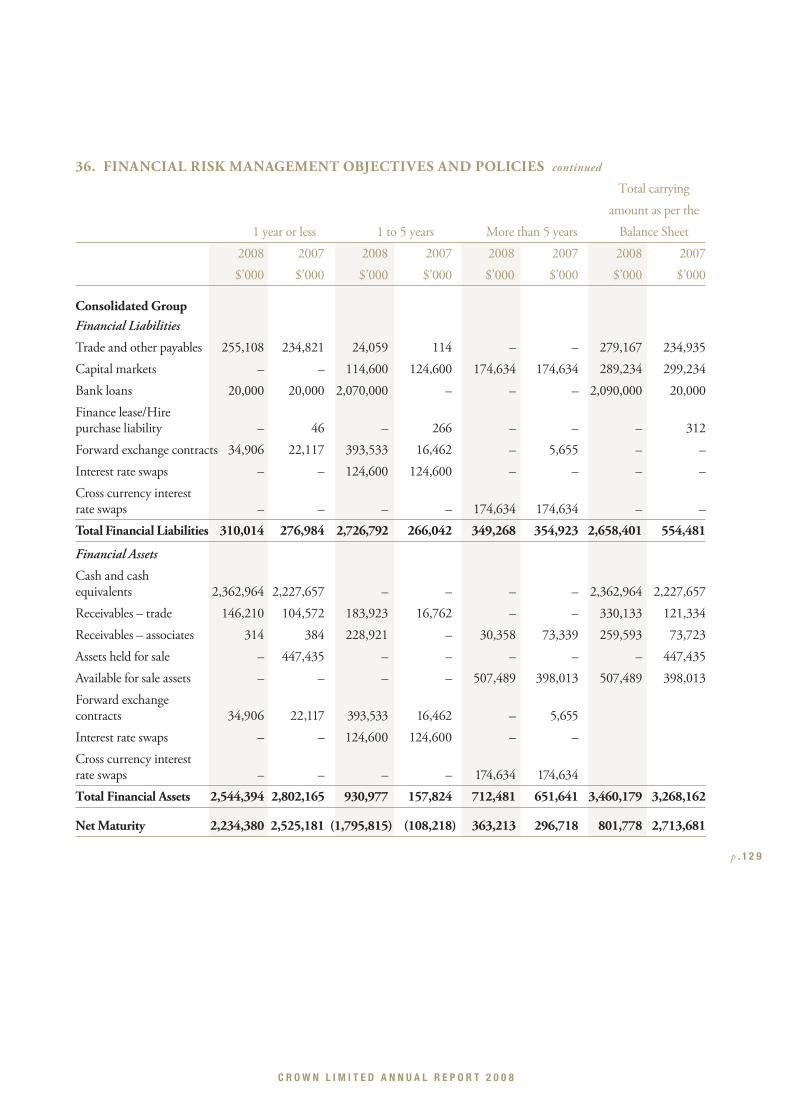
C R O W N L I M I T E D A N N U A L R E P O R T 2 0 0 8
p . 1 2 9
36. FINANCIAL RISK MANAGEMENT OBJECTIVES AND POLICIES continued
Total carrying
amount as per the
1 year or less 1 to 5 years More than 5 years Balance Sheet
2008 2007 2008 2007 2008 2007 2008 2007
$’000 $’000 $’000 $’000 $’000 $’000 $’000 $’000
Consolidated GroupFinancial Liabilities
Trade and other payables 255,108 234,821 24,059 114 – – 279,167 234,935
Capital markets – – 114,600 124,600 174,634 174,634 289,234 299,234
Bank loans 20,000 20,000 2,070,000 – – – 2,090,000 20,000
Finance lease/Hire purchase liability – 46 – 266 – – – 312
Forward exchange contracts 34,906 22,117 393,533 16,462 – 5,655 – –
Interest rate swaps – – 124,600 124,600 – – – –
Cross currency interest rate swaps – – – – 174,634 174,634 – –
Total Financial Liabilities 310,014 276,984 2,726,792 266,042 349,268 354,923 2,658,401 554,481
Financial Assets
Cash and cash equivalents 2,362,964 2,227,657 – – – – 2,362,964 2,227,657
Receivables – trade 146,210 104,572 183,923 16,762 – – 330,133 121,334
Receivables – associates 314 384 228,921 – 30,358 73,339 259,593 73,723
Assets held for sale – 447,435 – – – – – 447,435
Available for sale assets – – – – 507,489 398,013 507,489 398,013
Forward exchange contracts 34,906 22,117 393,533 16,462 – 5,655
Interest rate swaps – – 124,600 124,600 – –
Cross currency interest rate swaps – – – – 174,634 174,634
Total Financial Assets 2,544,394 2,802,165 930,977 157,824 712,481 651,641 3,460,179 3,268,162
Net Maturity 2,234,380 2,525,181 (1,795,815) (108,218) 363,213 296,718 801,778 2,713,681
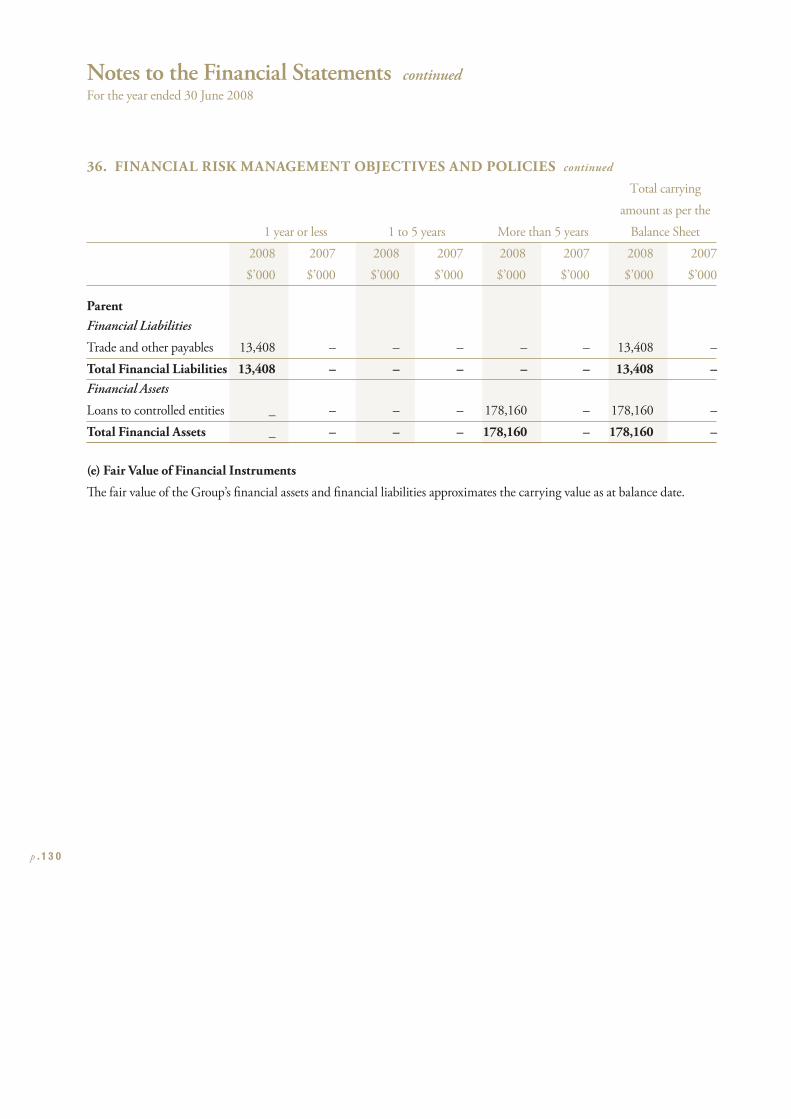
Notes to the Financial Statements continued
For the year ended 30 June 2008
p . 1 3 0
36. FINANCIAL RISK MANAGEMENT OBJECTIVES AND POLICIES continued
Total carrying
amount as per the
1 year or less 1 to 5 years More than 5 years Balance Sheet
2008 2007 2008 2007 2008 2007 2008 2007
$’000 $’000 $’000 $’000 $’000 $’000 $’000 $’000
ParentFinancial Liabilities
Trade and other payables 13,408 – – – – – 13,408 –
Total Financial Liabilities 13,408 – – – – – 13,408 –Financial Assets
Loans to controlled entities _ – – – 178,160 – 178,160 –
Total Financial Assets _ – – – 178,160 – 178,160 –
(e) Fair Value of Financial Instruments
Th e fair value of the Group’s fi nancial assets and fi nancial liabilities approximates the carrying value as at balance date.
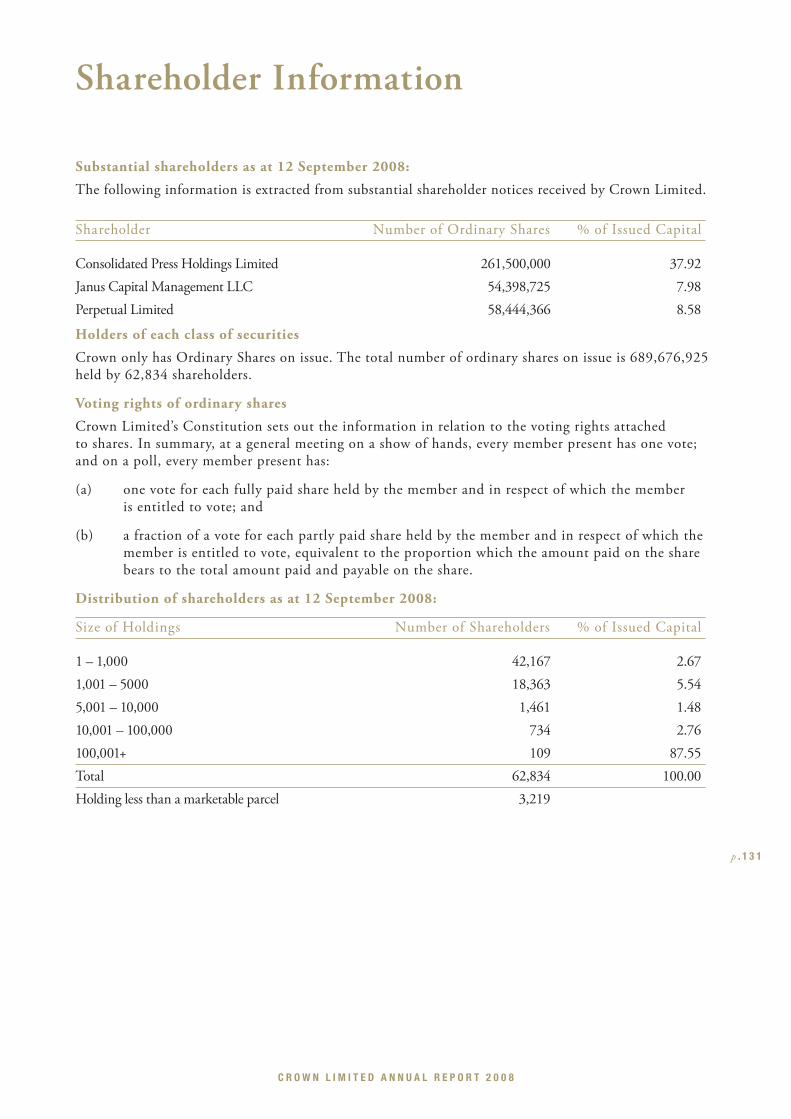
C R O W N L I M I T E D A N N U A L R E P O R T 2 0 0 8
p . 1 3 1
Substantial shareholders as at 12 September 2008:
The following information is extracted from substantial shareholder notices received by Crown Limited.
Shareholder Number of Ordinary Shares % of Issued Capital
Consolidated Press Holdings Limited 261,500,000 37.92
Janus Capital Management LLC 54,398,725 7.98
Perpetual Limited 58,444,366 8.58
Holders of each class of securities
Crown only has Ordinary Shares on issue. The total number of ordinary shares on issue is 689,676,925 held by 62,834 shareholders.
Voting rights of ordinary shares
Crown Limited’s Constitution sets out the information in relation to the voting rights attached to shares. In summary, at a general meeting on a show of hands, every member present has one vote; and on a poll, every member present has:
(a) one vote for each fully paid share held by the member and in respect of which the member is entitled to vote; and
(b) a fraction of a vote for each partly paid share held by the member and in respect of which the member is entitled to vote, equivalent to the proportion which the amount paid on the share bears to the total amount paid and payable on the share.
Distribution of shareholders as at 12 September 2008:
Size of Holdings Number of Shareholders % of Issued Capital
1 – 1,000 42,167 2.67
1,001 – 5000 18,363 5.54
5,001 – 10,000 1,461 1.48
10,001 – 100,000 734 2.76
100,001+ 109 87.55
Total 62,834 100.00
Holding less than a marketable parcel 3,219
Shareholder Information
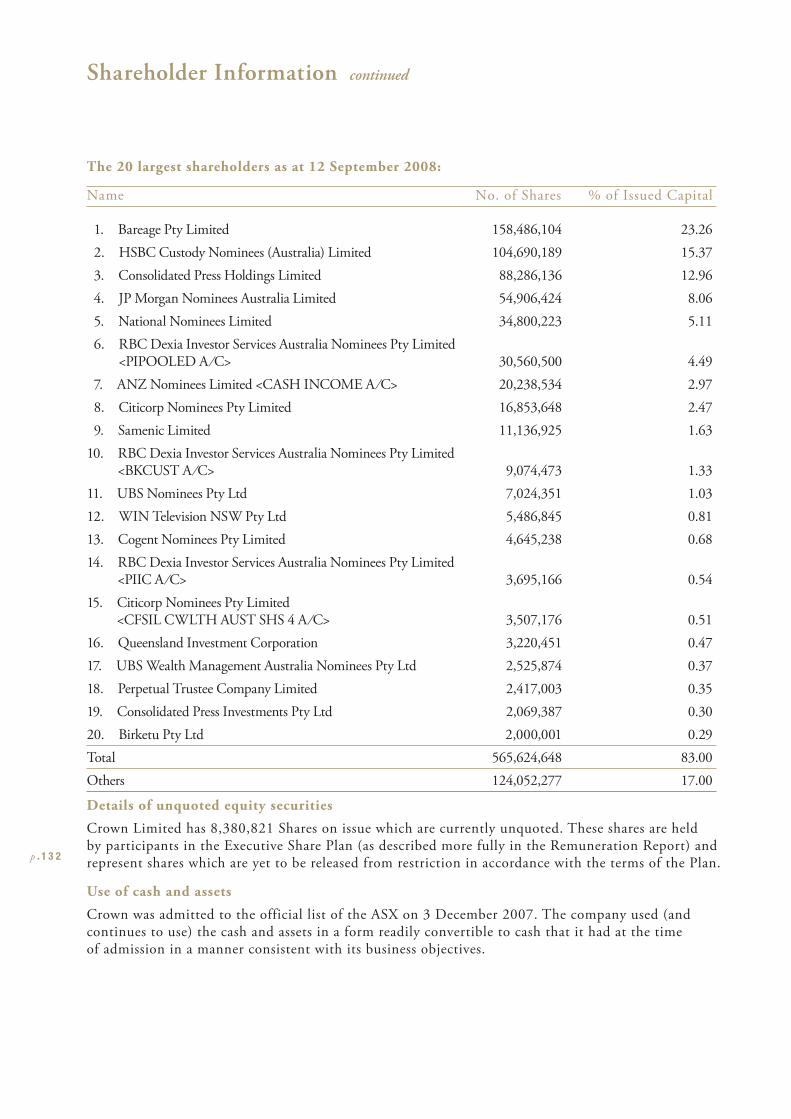
p . 1 3 2
The 20 largest shareholders as at 12 September 2008:
Name No. of Shares % of Issued Capital
1. Bareage Pty Limited 158,486,104 23.26
2. HSBC Custody Nominees (Australia) Limited 104,690,189 15.37
3. Consolidated Press Holdings Limited 88,286,136 12.96
4. JP Morgan Nominees Australia Limited 54,906,424 8.06
5. National Nominees Limited 34,800,223 5.11
6. RBC Dexia Investor Services Australia Nominees Pty Limited<PIPOOLED A ⁄ C> 30,560,500 4.49
7. ANZ Nominees Limited <CASH INCOME A ⁄ C> 20,238,534 2.97
8. Citicorp Nominees Pty Limited 16,853,648 2.47
9. Samenic Limited 11,136,925 1.63
10. RBC Dexia Investor Services Australia Nominees Pty Limited <BKCUST A ⁄ C> 9,074,473 1.33
11. UBS Nominees Pty Ltd 7,024,351 1.03
12. WIN Television NSW Pty Ltd 5,486,845 0.81
13. Cogent Nominees Pty Limited 4,645,238 0.68
14. RBC Dexia Investor Services Australia Nominees Pty Limited <PIIC A ⁄ C> 3,695,166 0.54
15. Citicorp Nominees Pty Limited <CFSIL CWLTH AUST SHS 4 A ⁄ C> 3,507,176 0.51
16. Queensland Investment Corporation 3,220,451 0.47
17. UBS Wealth Management Australia Nominees Pty Ltd 2,525,874 0.37
18. Perpetual Trustee Company Limited 2,417,003 0.35
19. Consolidated Press Investments Pty Ltd 2,069,387 0.30
20. Birketu Pty Ltd 2,000,001 0.29
Total 565,624,648 83.00
Others 124,052,277 17.00
Details of unquoted equity securities
Crown Limited has 8,380,821 Shares on issue which are currently unquoted. These shares are held by participants in the Executive Share Plan (as described more fully in the Remuneration Report) and represent shares which are yet to be released from restriction in accordance with the terms of the Plan.
Use of cash and assets
Crown was admitted to the official list of the ASX on 3 December 2007. The company used (and continues to use) the cash and assets in a form readily convertible to cash that it had at the time of admission in a manner consistent with its business objectives.
Shareholder Information continued
C R O W N L I M I T E D A N N U A L R E P O R T 2 0 0 8
p . 1 3 3
Shareholder enquiries
Shareholders may access their details by visiting the Share Registry’s website at www.computershare.com. For security reasons, shareholders need to enter their Security holder Reference Number (SRN) or Holding Identification Number (HIN) and postcode to access personal information. Security holding information may be updated online. Alternatively, download the relevant forms and have the completed forms mailed to the Share Registry.
Shareholders with queries about their shareholdings should contact the Share Registry, Computershare Investor Services, on telephone number 1300 659 795 or if calling from outside Australia, (61 3) 9415 4000 or by fax (61 3) 9473 2500.
Electronic shareholder communications
Shareholders who wish to receive email alerts informing them of significant announcements, dividend payment advices and the availability of reports on Crown Limited’s website, www.crownlimited.com, may either contact the Share Registry or lodge such instructions online at the Share Registry’s website at www.computershare.com.
Change of address
Issuer sponsored shareholders should notify the Share Registry immediately in writing or by telephone upon any change in their address quoting their SRN. Changes in addresses for broker sponsored holders should be directed to the sponsoring brokers with the appropriate HIN.
Direct payment to shareholders’ accounts
Dividends may be paid directly to any bank, building society or credit union account in Australia. Payments are electronically credited on the dividend date with advisory confirmation containing payment details mailed to shareholders. Shareholders who wish to have their dividends paid directly to their account should advise the Share Registry in writing.
Tax File Numbers
Crown is obliged to deduct tax at the top marginal rate plus Medicare levy from unfranked or partially franked dividends paid to Australian resident shareholders who have not supplied their Tax File Number (TFN) or exemption details. If you wish to provide your TFN or exemption details, please contact the Share Registry.
Consolidation of multiple holdings
If you have multiple holdings which you wish to consolidate, please advise the Share Registry in writing. If your holdings are broker sponsored, please contact the sponsoring broker directly.
Additional Information

this page has been left blank intentionally
p . 1 3 4

this page has been left blank intentionally
p . 1 3 5

this page has been left blank intentionally
p . 1 3 6
Corporate Information
Directors• James D Packer Executive Chairman
• John H Alexander BA Executive Deputy Chairman
• Rowen B Craigie BEc (Hons) Chief Executive Offi cer and Managing Director
• Christopher J Anderson BEc
• Christopher D Corrigan
• Rowena Danziger BA, TC, MACE
• Geoff rey J Dixon
• Ashok P Jacob MBA
• Michael R Johnston BEc, CA
• David H Lowy AM, BCom
• Richard W Turner AM, BEc, FCA
Chief Financial OfficerGeoff rey R Kleemann CA
Chief Executive Officer, Crown MelbourneDavid G Courtney BBus, F Fin, MBA, ACA, GDipAppFin
Chief Executive Officer, BurswoodBarry J Felstead
General Counsel/Joint Company SecretaryMichael J Neilson BA, LLB
Joint Company SecretaryMary Manos BCom, LLB (Hons)
Crown Limited’s registered office and principal corporate officeLevel 3Crown Towers8 Whiteman StreetSouthbank VIC 3006Australia
Share RegistryComputershare Investor Services Pty LtdYarra Falls452 Johnston StreetAbbotsford VIC 3067Phone: 1300 850 505 (within Australia) (61 3) 9415 4000 (outside Australia)Fax: (61 3) 9473 2500Website: www.computershare.com
Stock Exchange ListingCrown Limited’s ordinary shares are listed on the Australian Stock Exchange under the code “CWN”. Th e home exchange is Melbourne.
WebsiteVisit our website www.crownlimited.com for media releases and fi nancial information
AuditorErnst & Young
BankerAustralia and New Zealand Banking Group Limited
Printer to insert FSC logoThis report is printed on Monza Satin produced with 55% recycled fi bre (25% post consumer and 30% pre consumer) and FSC Certifi ed pulp, which ensures that all virgin pulp is derived from well-managed forests, and is manufactured by an ISO 14001 certifi ed mill. Monza Recycled is an FSC Mixed Source Certifi ed Paper.
DESIGN: COLLIER & ASSOCIATES THE STRATEGIC DESIGN COMPANY #13012

crownlimited.comcrownlimited.com