Embed Size (px)
Citation preview

Crowe, C. C., C. J. Schultz, M. Kumjian, L. D. Carey, and W. A. Petersen, 2012: Use of dual-polarization signatures in diagnosing tornadic
potential. Electronic J. Operational Meteor., 13 (5), 5778. ––––––––––––––––––––––––––––––––––––––––––––––––––––––––––––––––––––––––––––––––––––––––––––––––––––––––––––––––––––
__________
Corresponding author address: Christina C. Crowe, 320A Sparkman Dr., Huntsville, AL 35805
E-mail: [email protected]
57
NWA EJOM Article
USE OF DUAL-POLARIZATION SIGNATURES IN
DIAGNOSING TORNADIC POTENTIAL
CHRISTINA C. CROWE*
+, CHRISTOPHER J. SCHULTZ
†, MATTHEW KUMJIAN
ǂ,
LAWRENCE D. CAREY†, WALTER A. PETERSEN^
+National Weather Service, Huntsville, Alabama
†Department of Atmospheric Science, UAHuntsville, Huntsville, Alabama
ǂCooperative Institute for Mesoscale Meteorological Studies, University of Oklahoma, and
NOAA/OAR/National Severe Storms Laboratory, Norman, OK
^NASA Wallops Flight Center, Wallops, Virginia
(Manuscript received 2 February 2012; in final form 28 June 2012)
ABSTRACT
Recent research has suggested that the combination of differential reflectivity (ZDR) and specific differential
phase (KDP) can be useful in the assessment of low-level wind shear within a thunderstorm, a critical factor in
tornado formation. The two main polarimetric signatures indicated for this diagnosis include an arc of ZDR along the
right inflow edge of the thunderstorm near or collocated with a large gradient in horizontal reflectivity, ZH,
(indicative of regions of preferentially large raindrops) and a region of enhanced KDP located deeper into the forward
flank precipitation shield than the ZDR arc (indicating that the smaller drops are preferentially advected farther from
the updraft core by the low-level winds).
Three severe weather events in North Alabama were examined to assess the utility of these ZDR and KDP
signatures in determining the potential for tornadic activity. The cases were: 26 October 2010, when many storms
indicated tornadic potential from a standard reflectivity and velocity analysis, but very few storms actually produced
tornadoes; 28 February 2011, a broken line event that transitioned from a tornadic to high wind threat; and 27 April
2011, when multiple rounds of tornadic storms, associated with quasi-linear convective systems (QLCS) and
supercells, thrashed the Tennessee Valley. All three cases displayed strong evidence of ZDR arcs and horizontal
separation of KDP and ZDR during tornadic periods. In addition, non-tornadic storms showed consistent signatures of
overlapping dual-pol fields. While some variations remain between supercell, broken line, and QLCS tornadoes,
common signatures among all storm types indicate a potentially broad application of this type of signature
recognition.
_______________
1. Introduction
The dual-polarization (hereafter “dual-pol”) upgrade of the National Weather Service
network of S-band radars is currently underway, and the incorporation of polarimetric
information into the real-time forecasting process is expected to enhance the warning forecaster’s
58
abilities in many situations. However, with respect to the diagnosis of tornadic development in
storms, only a limited number of operational applications have been discussed at length and
these have generally focused on the detection of tornadic debris (e.g., Ryzhkov et al. 2005a,
WDTB 2011, Schultz et al. 2011, Schultz et al. 2012a,b). Yet, research performed over the past
several years on tornadic supercells has indicated additional dual-pol signatures (e.g., ZDR arc
and the separation of KDP and ZDR) which may be able to provide a new view of storm scale
processes necessary to produce and sustain a tornado (Kumjian and Ryzhkov 2007, 2008a,
2009).
Previous work by Crowe et al. (2010) analyzed data from several storms associated with
Hurricane Rita (2005) to determine whether the signatures mentioned above would be found in
storm structures other than those in the Great Plains. The small dataset indicated that tornadic
mini-supercells, associated with rainbands in a decaying tropical cyclone, displayed the ZDR arc
and the separation of KDP and ZDR seen in classic supercell cases. Due to the less clear ZH
signatures in the smaller cells (e.g., no hook echoes), the commonalities between the dual-pol
signatures showed promise of supporting the warning decision process in less common warning
events. This led the authors to expand the signature analysis to a variety of case days with
diverse storm structure and evolution. This paper examines those cases to assess the
commonality of previously observed dual-pol signatures, with the goal of determining the
potential for operational application of the analysis. While the data for this study were
associated with a C-band radar, expected differences when analyzing S-band data are discussed.
2. Background
As a refresher for those unfamiliar with dual-pol variables, a quick review of the meaning
and typical values of differential reflectivity (ZDR) and specific differential phase (KDP) are
provided here. Further details on these can be found in Doviak and Zrnic (1993), Zrnic and
Ryzhkov (1999), Straka et. al (2000), Bringi and Chandrasekar (2001), or Ryzhkov et al.
(2005b).
Standard radar reflectivity factor at horizontal polarization (ZH) provides information
only about the horizontal dimension and concentration of hydrometeors in a range gate sample,
and cannot discriminate among hydrometeor types alone. The ratio of reflectivity in the
horizontal and vertical (ZDR), can then provide more detail about hydrometeor size and shape. A
typical range of C-band values of ZDR is from -2 to 6 dB, where higher values indicate more
oblate hydrometeors and values near zero can indicate dry hail or small raindrops, depending on
the corresponding ZH values. In addition, KDP is related to the total liquid water content in a
particular volume. Typical values of KDP range from -1° km-1
to 6° km-1
, with higher values
associated with greater liquid water content. Therefore, with approximately equal values of ZH,
regions with lower values of KDP and higher ZDR suggest a lower concentration of large drops.
Conversely, regions with higher KDP and lower values of ZDR indicate a higher concentration of
small drops.
These two contrasting regions of drop size distributions and their attendant dual-pol fields
have been indicated as important signatures associated with size sorting and microphysical
processes occurring during the development of tornadic storms. Localized enhancements of
storm-relative helicity (SRH) have been suggested to be the cause of preferential size sorting of
hydrometeors (Kumjian and Ryzhkov 2008a, 2009; hereafter KR 2008a, 2009). This leads to
low level signatures (1-2 km or approximately 3,300-6,500 feet above ground level; hereafter

59
AGL) of regions with higher ZDR/lower KDP along the ZH gradient on the inflow side of the
storm and regions with lower ZDR/higher KDP further into the forward flank downdraft of the cell
(KR 2007, 2008a; Romine 2008; Crowe et al. 2010) (Fig. 1). These regions develop because
smaller drops experience a greater residence time in the sheared flow of the storm and therefore
advect farther downstream and to the left of the core of the updraft (in an environment
characterized by a cyclonically curved hodograph). Alternately, larger drops fall more rapidly
just outside the main updraft core. A modeling study (KR 2009) then showed that increased
storm-relative wind speed and directional shear leads to increased size sorting as described
above. When shear was changed from unidirectional to directional, an additional feature in the
ZDR field was also identified: an arcing shape in the ZDR enhancement along the inflow side of
the cell (Fig. 2). Additionally, a positive correlation was found between increased directional
shear and a more substantial ZDR arc (both in values and curvature). In case studies primarily
associated with Oklahoma supercells, enhanced values of ZDR were observed to be greater than
5-6 dB at C-band (KR 2008a). Then Crowe et al. (2010) found that only the tornadic storm
studied in the Hurricane Rita case produced these same high values of ZDR in the ZDR arc.
Figure 1. Constant altitude plot at 1 km (top left), 3 km (top right) and 5 km (bottom left) above
radar level (ARL) at 2204 UTC on 8 May 2003, near Oklahoma City, OK. Contours and shading
as in inset legend. Half circles with the letter A indicate a region of anticyclonic rotation while
half circles with the letter C indicate regions of cyclonic rotation. Small black boxes indicate
couplet alignment relative to the radar. A tornado was reported at 2206 UTC (Figure 12 from
Romine et al. 2008 – re-printed with the permission of the AMS). The position of the KOUN S-
band radar is also noted on the image.

60
Figure 2. Schematic depiction of how low-level veering winds in a supercell storm-relative
frame lead to an enhancement of ZDR along the right (inflow) edge of the forward-flank
downdraft precipitation echo (outlined on the surface). The wind vectors indicate the veering
flow. If projected onto a horizontal plane, the line connecting the wind vectors would represent
the hodograph, the area of which is proportional to the low-level storm relative helicity (SRH).
Cyclonic trajectories are shown for large drops (black solid line), medium sized drops (dashed
line), and small drops (dotted line) falling from a point source. The shading represents the ZDR
enhancement, which is maximized at the edge of the forward-flank downdraft. (Figure 2 from
KR 2009 – re-printed with the permission of the AMS). This schematic is meant to be
conceptual, with no specific values of ZDR associated with the shading regions. The large drops
are approximately 6-8 mm in diameter with the small drops less than 1-2 mm.
Besides the impact of near-storm SRH on drop size distribution within a thunderstorm,
the dual-pol fields may also provide further understanding of microphysical processes occurring
within the storm. Markowski et al. (2002) pointed to the potential importance of RFD
thermodynamics in tornadogenesis, needing a parcel with a low enough equivalent potential
temperature within the RFD to descend to the surface but also with a high enough equivalent
potential temperature to be recycled into the updraft to retain or increase low-level vertical
velocities. Evaporation is suggested to provide the primary cooling mechanism for the RFD,
which occurs preferentially with smaller drops within a given volume and may be indicated by
changes to the RFD dual-pol fields, specifically an increase in ZDR (Li and Srivastava 2001, KR
2010). KR (2008b) compared inferred drop size distributions in several cases and determined
that non-tornadic hooks had larger drop sizes than tornadic hook echoes. This would point to

61
increased values of ZDR in the hook of non-tornadic storms and possibly an ideal range of ZDR
within a tornadic hook for just the right amount of evaporation within the RFD. Kumjian (2011)
followed up with an observational study that suggested further details about the size sorting in
tornadic hook echoes. While the low-level updraft allows only large drops to fall just outside the
updraft (along the inflow edge of the hook and forward flank), warm-rain processes and
dynamically-induced downdrafts transport small drops more rapidly to the surface around the
back edge of the hook. This occurs quickly enough to prevent the total evaporation of small
drops and too large of a difference in equivalent potential temperature between the RFD and
inflow.
3. Data and methodology
This study utilized data collected by the Advanced Radar for Meteorological and
Operational Research (ARMOR) for storms over northern Alabama. For all cases presented,
ARMOR performed full disk and sector scans with an average refresh rate of 2 minutes, beam
width of 1.0°, and range gate spacing of 125 m. The only exception was that the 26 October
2010 case periodically alternated to 250-m spacing due to differing scanning strategies. Readers
are encouraged to consult Petersen et al. (2005, 2007) for further specifications of this C-band
polarimetric radar. It is important to note that the frequency of ARMOR is different from a
WSR-88D, and therefore specific values of ZDR and KDP presented in this paper cannot be
directly transferred to NEXRAD dual-pol radar data, as both parameters are frequency
dependent.
For those looking to use the analysis presented here with the upgraded S-band WSR-88D
data, a few important differences between C- and S-band data should be considered. Since KDP
is inversely proportional to the wavelength of the radar, the values with ARMOR data would be
around two times higher than values with the upgraded NEXRAD network. In addition, ZDR
depends on differential resonance response at different wavelengths, and therefore does not lead
to a direct relationship between data among the different radar wavelengths. No significant
differences are expected at lower values of ZDR, around 3 dB or lower, yet higher values of ZDR
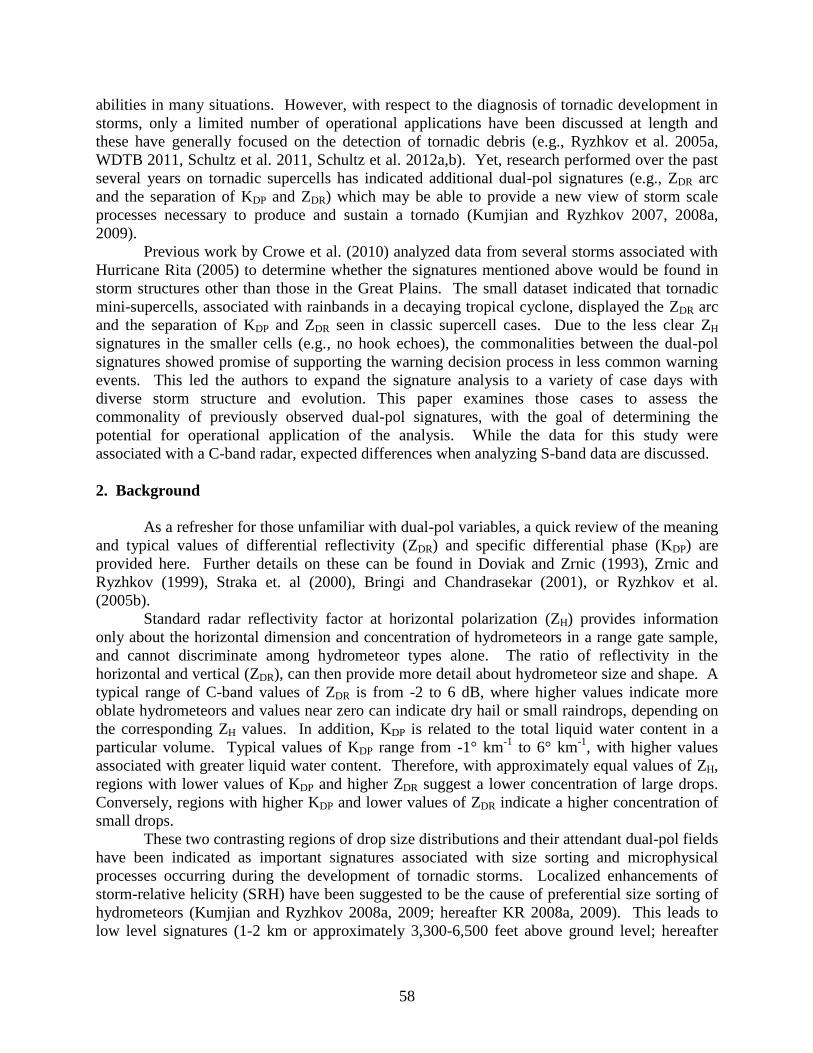
become rarer at S band, as presented in Browoska et al. (2011) (Fig. 3). Hail signatures of ZDR
dropping to near 0 dB are also more apparent at S band, since Mie scattering causes large ZDR
values with large raindrops and water-coated hail at C band. It should be noted that previous
work by Romine et al. (2008) and KR (2007, 2008a, 2008b) used S-band data from the KOUN
radar in Norman, OK, for most of their dataset. Papers by Kumjian and Ryzhkov (2007 and
2008a) also included three cases of C-band data in their 18 case dataset. In all, the C-band work
presented in this paper and in Crowe et al. (2010) agreed with the thresholds presented in
previous S-band research.
62
Figure 3. Size dependencies of ZDR at S (black line) and C (blue line) band across the particle
spectrum of raindrops (D < 0.8 cm) and partially melted hailstones (D > 0.8 cm). Generated
using the hail model from Ryzhkov et al. (2009).
For ease in plotting and running analysis, the data were converted to a three-dimensional
1-km Cartesian grid using a Cressman weighting function. Low-level plots were created for
each scan of a storm at 1 km (3,300 ft) elevation AGL to analyze features nearest the surface.
Due to rotation tracking complications in QLCS cases, raw data for several of the events were
also analyzed for the development of signatures. Using the same thresholds as seen in the
images from Romine et al (2008) (Fig. 1), analysis of the low-level plots focused on fields of
high KDP (defined as greater than 1.5 °km-1
) and enhanced ZDR (defined as greater than 3 dB)
relative to the main ZH structure (greater than 30 dBZ with “higher values” defined as 50 dBZ).
4. Analysis
Three event days were utilized for this study to account for varying atmospheric
conditions and event evolution. The first occurred on the afternoon of 26 October 2010, where
widespread development of supercells across North Alabama led to the issuance of 39 tornado
warnings by the National Weather Service forecast office in Huntsville. But even with a large
number of cells exhibiting intense rotation, only four tornadoes occurred (rated EF-0 to EF-1).
Eight storms occurred within an effective range (approximately 90 km) of ARMOR for analysis

63
this day. The second event was a broken squall line on the afternoon of 28 February 2011.
Rotation associated with breaks in the line led to seven tornado warnings, and two tornadoes in
the northern portions of the Huntsville County Warning Area (CWA) (rated EF-1 to EF-2).
Third, the 27 April 2011 tornado outbreak consisted of three waves of tornadic storms that
tracked across north Alabama. All modes of convection were observed over this 14-hour event,
leading to 92 tornado warnings and 40 tornadoes (rated EF-0 to EF-5).
In total, 20 storms within an effective range of the ARMOR radar were used for this
study (8 on 26 Oct, 3 on 28 Feb., 9 on 27 Apr.). Sixteen of the 20 storms were chosen because
they were associated with tornado warnings issued by the National Weather Service office in
Huntsville and exhibited strong rotation characteristics. Additionally, four storms were chosen
as control or “null” cases, which researchers defined as storms which were not associated with
NWS tornado warnings but exhibited some rotation and organized convective structure. This
was intended to increase the focus on signatures purely in the dual-polarization fields, assuming
a warning operator has already taken into account standard radar interrogation. Analyses of two
storms are presented here for each case day, one representative of tornadic cells and the other
representative of non-tornadic storms. In addition, examples of quasi-linear convective system
(QLCS) tornadic and non-tornadic segments are presented from the 27 April 2011 case.
Velocity imagery is not shown, but in each case (except the “null”) rotation characteristics
prompted a forecaster at the NWS in Huntsville to issue a warning.
a. 26 October 2010
The representative tornadic cell for this day was associated with tornado warnings for
almost a three hour period (from 1729 to 2015 UTC) as it tracked from Franklin Co., AL, to
Franklin Co, TN. This storm (Cell 1) produced a short-lived EF-1 tornado from 1823-1824 UTC
in northern Lawrence County, Alabama. During the early period of the warnings for this storm,
ZDR signatures remained transient, had higher values toward the rear of the storm near the
updraft [inferred from the location of rotation, bounded weak echo region (BWER) and/or inflow
notch in each case], and generally overlapped the higher KDP field (Fig. 4a). Approaching the
time of tornadogenesis, as a storm merger occurred the area of enhanced ZDR became more
consistent from scan to scan and started to trend toward the inflow edge of the KDP and ZH (Fig.
4b,c). The time of the very brief tornado was associated with a left-to-right separation of KDP
and ZDR, with low ZDR values around the updraft core but a persistent region of 4.5-5 dB values
in the arc (Fig. 4c). Only a very weak curvature to the ZDR field could be noted, though. KDP
and ZDR then became overlapped after the tornado ended and remained that way for much of the
rest of the life of the storm (Fig. 4d). A period from around 1853 to 1906 UTC showed some of
these same signatures before ZDR again became co-located with the updraft and KDP pushed into
the forward flank of the storm. Several reports of funnel clouds were received during this period,
but a lack of damage along the storm track indicated that a tornado likely did not occur. It
should be noted that the rotation signature at that time was weaker than that associated with the
brief spin up in Lawrence County. In addition, the average values of ZDR during the periods of
the 4 tornadoes from this case was around 4-4.5 dB with only one tornado associated with values
above 6 dB.

64
Figure 4. Four panel time trend of CAPPIs at 1km elevation, for a tornadic cell from 26 October
2010 (Cell 1). A tornado warning was in effect from 1729-2015 UTC, and an EF1 tornado was
on the ground from 1823-1824 UTC (indicated by the red T). Reflectivity (ZH) is contoured in
black at 30 and 50 dBZ, specific differential phase (KDP) is shaded yellow for values greater than
1.5° km-1
, and differential reflectivity (ZDR) is shaded blue for values greater than 3 dB. The four
panel shows representative returns through the storm evolution (ordered top left as 4a, top right
as 4b, bottom left as 4c., and bottom right as 4d), while the attached animation uses the same
shading and shows a loop for the entire time the storm was tracked on ARMOR (from 1733-2002
UTC). Click for animation (uses same panel layout as Figure 10).
A shorter-lived, non-tornadic cell (Cell 7) tracked south of the radar, from Cullman to
DeKalb Co., AL, associated with tornado warnings from 2206 to 2230Z. The main feature noted
with this cell was higher values of ZDR (greater than 3 dB and, at times, greater than 6 dB)
remaining co-located with the updraft of the storm through its lifetime. Any horizontal
separation between the higher values of KDP and ZDR occurred in a rear-to-front fashion and were
4a 4b
4c 4d
65
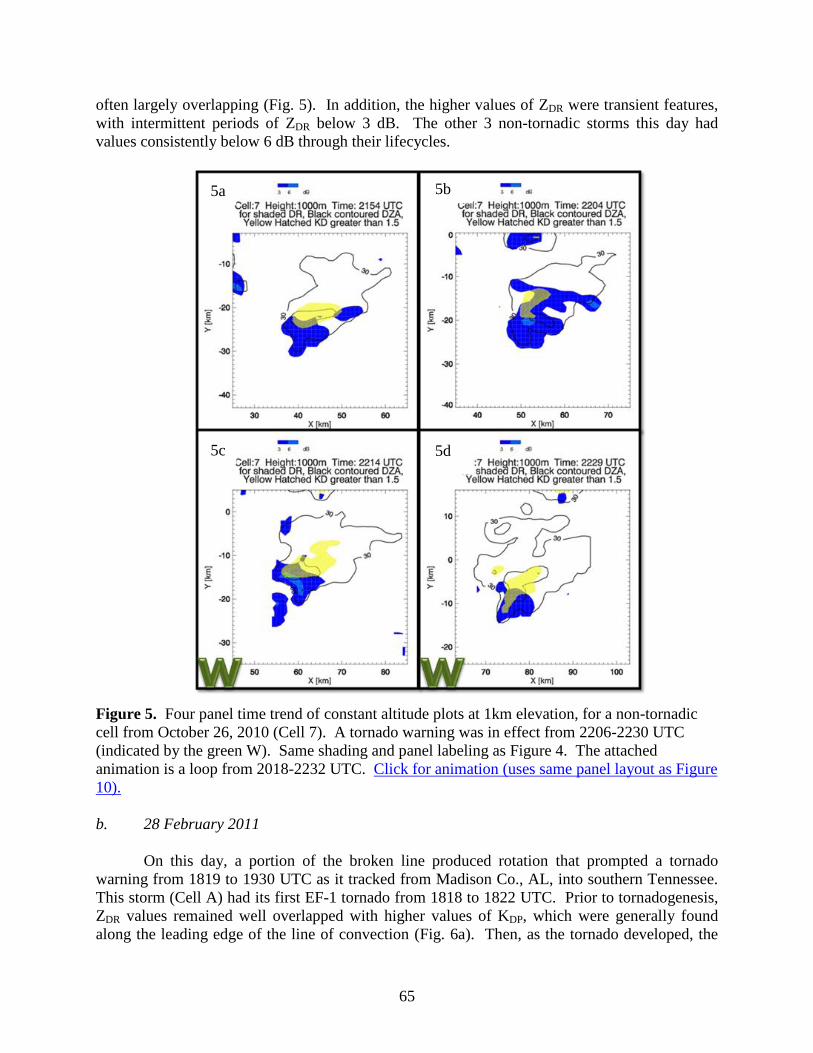
often largely overlapping (Fig. 5). In addition, the higher values of ZDR were transient features,
with intermittent periods of ZDR below 3 dB. The other 3 non-tornadic storms this day had
values consistently below 6 dB through their lifecycles.
Figure 5. Four panel time trend of constant altitude plots at 1km elevation, for a non-tornadic
cell from October 26, 2010 (Cell 7). A tornado warning was in effect from 2206-2230 UTC
(indicated by the green W). Same shading and panel labeling as Figure 4. The attached
animation is a loop from 2018-2232 UTC. Click for animation (uses same panel layout as Figure
10).
b. 28 February 2011
On this day, a portion of the broken line produced rotation that prompted a tornado
warning from 1819 to 1930 UTC as it tracked from Madison Co., AL, into southern Tennessee.
This storm (Cell A) had its first EF-1 tornado from 1818 to 1822 UTC. Prior to tornadogenesis,
ZDR values remained well overlapped with higher values of KDP, which were generally found
along the leading edge of the line of convection (Fig. 6a). Then, as the tornado developed, the
5a 5b
5c 5d

66
persistent region of higher KDP began to break up and retreat from the notch in the broken line
(Fig. 6b,c). During this period, ZH began to take on almost supercellular characteristics, with
persistent areas of ZDR greater than 3 dB that remained near the circulation, just as would be
expected in a supercell. As the tornado ended, the higher values of KDP returned and overlapped
the enhanced ZDR once again (Fig. 6d). ZDR then began to increase to above 6 dB as the storm
continued northeast and eventually produced a couple additional weak tornadoes in Tennessee.
Further south, another region of rotation (Cell B) prompted tornado warnings from 1924
to 2015 UTC as it tracked from Marshall to DeKalb Co., AL, but never produced a tornado.
During the lifetime of this rotation feature, ZDR values remained low, only intermittently pushing
above 3 dB but never as high as 6 dB. In addition, the enhanced regions of ZDR only appeared
within the KDP shield and higher ZH values (Fig. 7). Conversely, the other non-tornadic case
from this day did produce values ZDR periodically above 6 dB, but on average was only around
4-4.5 dB and was always co-located with high KDP.
c. 27 April 2011
The tornadic storm chosen for this event occurred during the afternoon, when the
convective mode turned to significant supercells. The first storm to produce a tornado during this
period across the Huntsville CWA tracked southeast of the radar from Cullman to Jackson Co.,
AL. The storm (Cell A) prompted tornado warnings from 1924 to 2141 UTC and produced two
EF-4 tornadoes during this period. The first tornado tracked across Cullman, Morgan and
Marshall Counties from 1943 to 2033 UTC, and the second in Jackson County from 2101 to
2136 UTC. Prior to the development of the first tornado, the ZDR field displayed some arcing
shape around the inflow edge of the supercell but consistently showed the majority of the +3 dB
shield co-located with the storm’s updraft and the KDP shield overlapping it (Fig. 8a). In the 10
minutes prior to tornadogenesis, subtle changes in the fields developed with ZDR pushing toward
the forward flank and the forward flank portion of the KDP shield began shifting westward.
Then, in the first five minutes after tornadogenesis, the arcing shape quickly became more
enhanced in both the ZDR and KDP fields. In addition, the left-to-right separation of KDP and ZDR
developed and higher values of ZDR pushed well into the forward flank, away from the updraft
(Fig. 8b). While some transient areas of higher ZDR periodically appeared near the updraft and
around the back edge of the hook during the lifetime of this long-track tornado, the consistent
feature of ZDR remained along the inflow edge of the KDP and ZH gradients. Nearing the end of
the lifetime of the tornado, the ZDR in the forward flank slowly shifted toward the left of the
maximum KDP while the ZDR near the updraft transitioned toward the center/inflow side of the
updraft core (Fig. 8c,d). ZDR values greater than 6 dB were observed with this storm and were
generally higher near the time of tornadogenesis, decreasing through the lifecycle of the tornado.
This pattern showed variations for each tornadic storm from this event, but a peak in ZDR near
tornadogenesis and subsequent decrease were noted for five of the seven tornadoes included in
this study. Analysis from the period of the second tornado is not included here due to beam
blockage, attenuation, and non-uniform beam filling issues associated with the relative locations
of the radar and storm.

67
Figure 6. Four panel time trend of CAPPIs at 1km elevation, for a tornadic cell from 28
February 2011 (Cell A). A tornado warning was in effect from 1819-1930 UTC, and an EF1
tornado was on the ground from 1818-1822 UTC (indicated by the red T). Same shading and
panel labeling as Figure 4. The attached animation is a loop from 1708-1850 UTC.
Click for animation (uses same panel layout as Figure 10).
6a 6b
6c 6d

68
Figure 7. Four panel time trend of CAPPIs at 1km elevation, for a non-tornadic cell from 28
February 28 (Cell B). A tornado warning was in effect from 1924-2015 UTC (indicated by the
green W). Same shading and panel labeling as Figure 4. The attached animation is a loop from
1847-2004 UTC. Click for animation (uses same panel layout as Figure 10).
The non-tornadic storm chosen for this event occurred earlier in the day, as a discrete cell
developed ahead of an approaching line of storms, and tracked from Lawrence to Madison Co.,
AL. The NWS issued tornado warnings on this storm (Cell L) from 1405 to 1445 UTC but it
never produced a tornado. As was seen in the non-tornadic Cell 7 from the 26 Oct. case, higher
ZDR values remained to the rear of the storm and were co-located with the updraft. In addition,
the regions of highest KDP, ZDR and ZH all remained overlapped through the lifetime of this
shorter-lived cell (Fig. 9). However, contrary to previous non-tornadic cells discussed, this
storm did produce consistently higher (i.e., 6 dB) values of ZDR for most of the tornado warning
period. This would be consistent, though, with the reports of 0.75 to 1.0 inch diameter hail
associated with this storm over its lifetime, since high ZDR values are associated with water
coated hail at C band (Anderson et al. 2011). The two other non-tornadic storms (including a
null case) generally had ZDR values below 5 dB for their observed period.
7a 7b
7c 7d

69
Figure 8. Four panel time trend of CAPPIs at 1 km elevation, for a tornadic cell from 27 April
2011 (Cell A). A tornado warning was in effect for all panels, and an EF4 tornado was on the
ground from 1943-2033 UTC (indicated by the red T). Same shading and panel labeling as
Figure 4. The attached animation is a loop from 1916-2112 UTC. Click for animation (uses
same panel layout as Figure 10).
We will now turn to an analysis of the embedded rotation within the late-morning QLCS,
in which two portions of the line produced notches in the leading convective edge over
Limestone and Madison Co., AL. The tornadic rotation developed quickly over the county
borders and produced a tornado from 1620 to 1630 UTC just west of the radar. A tornado
warning was then associated with this rotation from 1630 to 1700 UTC. Leading up to the time
of the tornado (Fig. 10), the ZH notch associated with the developing rotation was co-located
with higher values of KDP (greater than 2° km-1
) and ZDR (1-2 dB). Higher values of ZDR could
be seen to the north of this location, along the inflow edge of the main convective line. Then, as
a tornado developed, a switch in the dual-pol fields took shape. By 1620 UTC, the higher KDP
values retreated toward the rear of the storm, leaving only values of 1° km-1
or less near the
notch and rotation (Fig. 11). In addition, an arc of ZDR with values greater than 3 dB had moved
8a 8b
8c 8d

70
forward into the appendage, horizontally separated from the main shield of KDP, and reversed in
direction compared to the supercellular ZDR arcs (i.e. curved from west to southeast rather than
west to northeast of the circulation). Then, as the tornado was lifting, the ZDR retreated again
toward the rear of the storm while much higher values of KDP pushed forward into the appendage
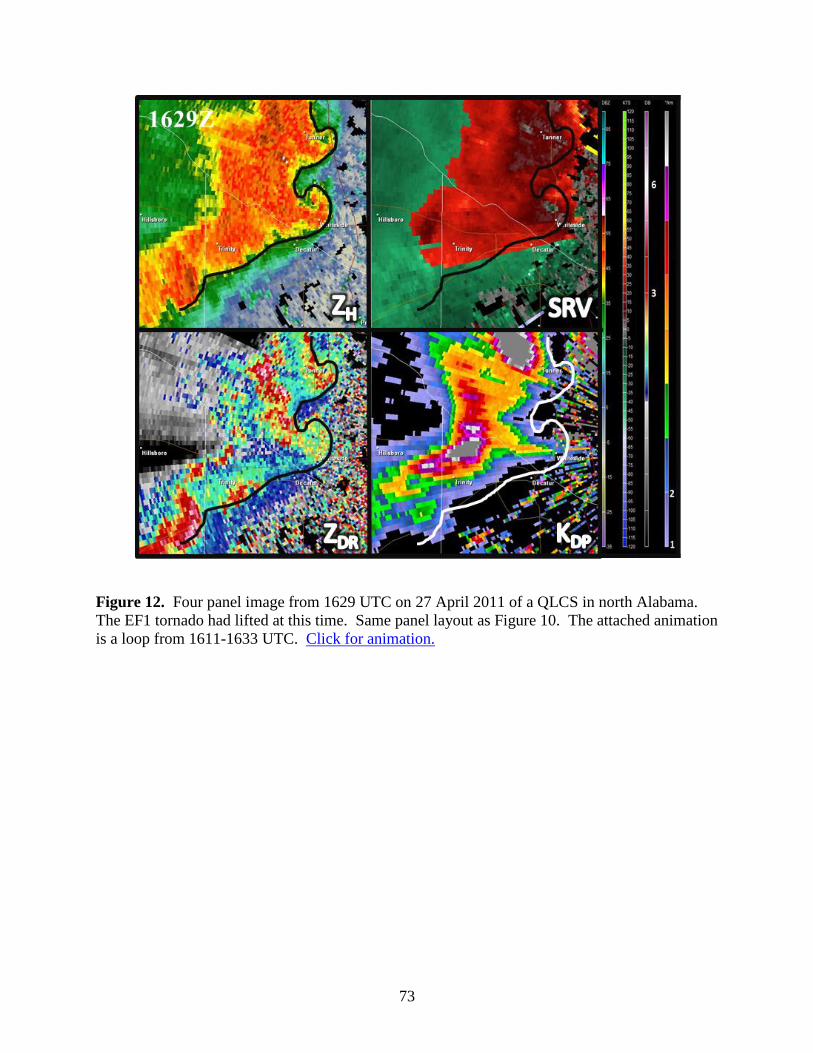
of ZH and became more overlapped with the higher ZDR (Fig. 12).
Figure 9. Four panel time trend of CAPPIs at 1km elevation, for a non-tornadic cell from 27
April 2011 (Cell L). A tornado warning was in effect from 1405-1445 UTC (indicated by the
green W). Same shading and panel labeling as Figure 4. The attached animation is a loop from
1336-1413 UTC. Click for animation (uses same panel layout as Figure 10).
Farther north along the line, an additional area of rotation was associated with an
appendage protruding from the leading edge of convection but never produced a tornado and did
not prompt a tornado warning. Looking at the dual-pol fields associated with this cell (Fig. 13),
one could see very high values of ZDR (greater than 6 dB) and higher values of KDP (greater than
2° km-1
) extending forward and co-located with the higher reflectivity of the appendage along the
front of the line.
9a 9b
9c 9d

71
Figure 10. Four panel image from 1611 UTC on 27 April 2011 of a QLCS in north Alabama.
No tornado was on the ground at this time. Reflectivity (ZH) is at top left and storm relative
velocity (SRV) is at top right. Specific differential phase (KDP) is at bottom right with values
greater than 1 °km-1
in blue/grey and greater than 2° km-1
in blue. Differential reflectivity (ZDR)
is at bottom left with values greater than 3 dB in red and 6 dB in white. Color bars are in order
from left to right: ZH, SRV, ZDR, and KDP.

72
Figure 11. Four panel image from 1620 UTC on 27 April 2011 of a QLCS in north Alabama.
At this time, an EF1 was touching down north of Trinity (approximate location indicated by the
white arrow in SRV panel). Same panel layout as Figure 10.
73
Figure 12. Four panel image from 1629 UTC on 27 April 2011 of a QLCS in north Alabama.
The EF1 tornado had lifted at this time. Same panel layout as Figure 10. The attached animation
is a loop from 1611-1633 UTC. Click for animation.

74
Figure 13. Four panel image from 1611 UTC on 27 April 2011 of another portion of the QLCS
in north Alabama. This portion of the line never produced a tornado. Same panel layout as
Figure 10.
5. Summary and conclusions
This research builds upon previous work (e.g. KR 2008a, 2009; Crowe et al. 2010) by
examining 20 storms in various storm environments to build the understanding how dual-pol
fields differ between tornadic and non-tornadic storms. Previous research has indicated that these
signatures are associated with different dynamics and thermodynamics of the near-storm
environment. Enhanced ZDR arcs are likely associated with localized enhancements of near-
storm SRH, also leading to enhanced size sorting evidenced in the separation of the KDP and ZDR
maxima. It has also been suggested that changes in the KDP and ZDR fields are evidence of
microphysical processes associated with preferential evaporation of small drops in the RFD,
creating potentially ideal thermodynamic characteristics for the RFD, relative to the storm
inflow, to induce tornadogenesis.
Each tornadic storm associated with a discrete cell in any of the cases presented exhibited
a distinct ZDR arc with values greater than 3 dB, oriented along the gradient of ZH at the inflow
edge of the cell. In addition, QLCS appendages associated with tornadic development displayed

75
a wrapping of enhanced ZDR forward from the main precipitation core. A threshold of ≥ 6 dB
(Crowe et al. 2010) within the ZDR arc correctly differentiated between a tornadic and non-
tornadic cell in 11 of 20 events, with several misses possibly associated with sampling issues
(attenuation, non-uniform beam filling, distance from radar; e.g., Bringi et al. 1990, Ryzhkov
2007). This is in contrast to the work done primarily with S-band data (KR 2008a, 2009). This
may be explained by the ubiquity of melting hail and its dominance in C-band ZDR data, which
probably contributed to higher ZDR values in more cases than would be seen in S-band data
(Anderson et al. 2011).
In the stronger environmental 0-1 km SRH on 27 April, the tornadic storms exhibited ZDR
consistently between 5 and 6 dB over the cell’s lifetime. On the other hand, days with slightly
lower environmental SRH values did not perform as well with the 5-6 dB threshold, with the
October case showing no clear signal and the February case only having a tornadic storm
produce ZDR greater than 6 dB after it produced its first in a family of tornadoes. The extent of
the curvature of the ZDR arc was also found to be more apparent in cases with higher
environmental SRH (Redstone Arsenal sounding site 0-3 km SRH: 26 October 1700 UTC = 265
m2 s
-2, 28 February 1200 UTC = 556 m
2 s
-2, 27 April 1700 UTC = 874 m
2 s
-2). In the two storms
that produced more than one tornado (Cells A from 28 February and 27 April), the period during
the second tornado also exhibited higher values of ZDR than during the first tornado and values
above 6 dB were associated with the onset. Future work may need to investigate these
thresholds further, to account for S- versus C-band differences, possibly including an analysis of
ρhv to support hydrometeor diversity analysis, and potentially looking for a ‘normalized’ ZDR
value that might be of use in determining a threshold that varies depending on the background
environment and preferred storm type.
The other main feature of note in these storms was associated with the horizontal
separation of dual-pol fields. Tornadic periods showed a greater separation of KDP and ZDR
maxima, with ZDR enhanced toward the inflow side of the cell while the enhanced KDP shifted
toward the left of the forward flank of the storm. Estimates from these few cases suggest that
tornadoes occurred with a non-overlapping region of KDP extending to the left by 2-3 km while a
non-overlapping portion of the ZDR extended to the right (inflow-side) by 2-3 km. In addition,
these cases suggest that the horizontal separation of fields, arcing shape and forward push of the
ZDR arc may begin to slowly develop prior to tornadogenesis, with a rapid enhancement in these
signatures within the first five minutes after tornadogenesis. Non-tornadic periods, on the other
hand, had higher ZDR values toward the rear of the storm near the updraft and rotation, while KDP
may shift further forward into the forward flank of the storm. QLCS cases also displayed
separation of variables during tornadoes, with KDP retreating into the main precipitation core
during tornadic periods as ZDR transitioned forward. As a tornado ended, the KDP pushed
forward into the appendage again while the ZDR retreated slightly. Portions of the QLCS that
never produced a tornado had large values of ZDR in the appendage through its lifecycle.
Overall, these non-tornadic periods had a greater overlap of the dual-pol fields in discrete cell,
broken line, and QLCS cases. These non-tornadic signatures appear to be, in general, more clear
cut than those leading up to tornadogenesis and therefore may provide increased confidence a
tornado will not develop or has not developed. Additional research will be needed to further
investigate the more transient signatures identified prior to tornadogenesis to perhaps increase
warning lead times.

76
6. Future Work
Continued work is needed to confirm and expand upon the usefulness of the investigation
presented in this paper. As identified in previous research (KR 2007, 2008a, 2008b), adding an
analysis of ρhv to this work may provide further insight into size sorting and diversity of
hydrometeors occurring within these storms. By adding dual- or triple-Doppler analysis
available with the combined UAHuntsville and National Weather Service equipment [KHTX S-
band, ARMOR C-band, Mobile Alabama X-band (MAX) radars], drop trajectories could be
studied for a comparison to and assessment of the real life applications of the modeling study
performed by KR (2009). An expanded dataset can also be examined, as more data become
available, especially associated with high-quality observations of QLCS tornadoes and in general
with the new S-band data from WSR-88Ds. This will also be important in confirming the use of
thresholds presented in this paper with S-band data and analyzing the potential modifications to a
ZDR threshold.
Acknowledgements. Funding for MK was provided by NOAA/Office of Oceanic and
Atmospheric Research under NOAA/University of Oklahoma Cooperative Agreement
NA11OAR4320072, U.S. Department of Commerce. UAHuntsville (CJS and LDC)
participation was funded in part by NOAA Grant NA09OAR4600204 in support of the
UAHuntsville Tornado Hurricane and Observations Research Center (THOR). WAP and LDC
also acknowledge support of the NASA Precipitation Science Program. The authors would like
to thank Dr. Kevin Knupp, Dustin Phillips, and Patrick Gatlin for continued support through
maintenance of the ARMOR C-band radar. Special thanks also go to Mr. Brian Carcione and the
staff of the National Weather Service in Huntsville, Alabama, for feedback while completing this
research.
REFERENCES
Anderson, M. E., L. D. Carey, W. A. Petersen, and K. R. Knupp, 2011: C-band dual-
polarimetric radar signatures of hail. Electronic J. Operational Meteor., 12 (2), 1–30.
Bringi, V. N., and V. Chandrasekar, 2001: The Polarimetric basis for characterizing
precipitation. Polarimetric Doppler Weather Radar: Principles and Applications.
Cambridge University Press, 378-532.
——, V. Chandrasekar, N. Balakrishnan, D. S. Zrnić, 1990: An examination of propagation
effects in rainfall on radar measurements at microwave frequencies. J. Atmos. Oceanic
Technol., 7, 829–840. doi: 10.1175/1520-0426
Borowska, L., A. Ryzhkov, D. Zrnic, C. Simmer, and R. Palmer, 2011: Attenuation and
differential attenuation of 5-cm wavelength radiation in melting hail. J. Appl. Meteor., 50,
59-76.
Crowe, C.C., W.A. Petersen, L.D. Carey, and D.J. Cecil, 2010: A dual-polarization investigation
of tornado-warned cells associated with Hurricane Rita (2005). Electronic J. Operational
Meteor., EJ4.

77
Doviak, R.J. and D.S. Zrnic, 1993: Multiple-parameter measurements of precipitation. Doppler
radar and weather observations. Academic Press, 234-271.
Kumjian, M.R., 2011: Precipitation properties of supercell hook echoes. Electronic J. Severe
Storms Meteor. 6 (5), 1-21.
——, and A. Ryzhkov, 2007: Polarimetric characteristics of tornadic and nontornadic
supercell thunderstorms. Preprints, 33rd
Conference on Radar Meteorology, Cairns,
Queensland, Ameri. Meteor. Soc., CD-ROM, P10.1.
——, and A. Ryzhkov, 2008a: Polarimetric signatures in supercell thunderstorms. J. Appl.
Meteor., 47, 1940-1961.
——, and A. Ryzhkov, 2008b: Microphysical differences between tornadic and nontornadic
supercell rear-flank downdrafts revealed by dual-polarization radar measurements.
Preprints, 24th
Conference on Severe Local Storms, Savannah, Georgia, Ameri. Meteor.
Soc., CD-ROM, 3B.4.
——, and A. Ryzhkov, 2009: Storm-relative helicity revealed from polarimetric radar
measurements. J. Atmos. Sci., 66, 667-685.
——, and A. Ryzhkov, 2010: The impact of evaporation on polarimetric characteristics of rain:
Theoretical model and practical implications. J. Appl. Meteor. and Climatol., 49, 1247-
1267.
Li, X., and R.C. Srivastava, 2001: An analytical solution for raindrop evaporation and its
application to radar rainfall measurements. J. Appl. Meteor., 40, 1607-1616.
Markowski, P.M., J.M. Straka, and E.N. Rasmussen, 2002: Direct surface thermodynamic
observations within the rear-flank downdrafts of nontornadic and tornadic supercells.
Mon. Wea. Rev., 130, 1692-1721.
Petersen, W.A., K.R. Knupp, D.J. Cecil, and J.R. Mecikalski, 2007: The University of Alabama
Huntsville THOR Center Instrumentation: Research and operational collaboration.
Invited Presentation, 33rd International Conference on Radar Meteorology, Ameri.
Meteor. Soc., Cairns, Australia, August 6-10, 2007.
——, K. Knupp, J. Walters, W. Deierling, M. Gauthier, B. Dolan, J.P. Dice, D.
Satterfield, C. Davis, R. Blakeslee, S. Goodman, S. Podgorney, J. Hall, M. Budge, and A.
Wooten, 2005: The UAH-NSSTC/WHNT ARMOR C-band dual-polarimetric radar: A
unique collaboration in research, education and technology transfer. Preprints, 32nd
Conference on Radar Meteorology, Albuquerque, New Mexico, Ameri. Meteor. Soc.,
CD-ROM, 12R.4.
Romine, G.S., D.W. Burgess, and R.B. Wilhelmson, 2008: A dual-polarization-radar-based

78
assessment of the 8 May 2003 Oklahoma City area tornadic supercell. Mon. Wea. Rev.,
136, 2849-2870.
Ryzhkov, A.V., 2007: The impact of beam broadening on the quality of radar polarimetric
data. J. Atmos. Oceanic Technol., 24, 729–744. doi: 10.1175/JTECH2003.1
——, T.J. Schuur, D.W. Burgess, and D.S. Zrnic, 2005a: Polarimetric tornado detection. J.
Appl. Meteor., 44, 557-570.
——, S. Ganson, A. Khain, M. Pinsky, and A. Prkrovsky, 2009: Polarimetric
characteristics of melting hail at S and C bands. Proc. 34th
Conf. on Radar Meteorology,
Williamsburg, VA, Amer. Meteor. Soc. 4A.6.
——, T.J. Schuur, D.W. Burgess, P.L. Heinselman, S.E. Giangrande, and D.S. Zrnic, 2005b:
The Joint Polarization Experiment: Polarimetric rainfall measurementsr and hydrometeor
classification. Bull. Amer. Meteor. Soc., 86, 809-824.
Schultz, C.J., E.V. Schultz, C.B. Darden, B.C. Carcione, C.C. Crowe, D.J. Nadler, L.D. Carey,
W.A. Petersen, P.N. Gatlin, and K.R. Knupp, 2011: The use of dual polarimetric tornado
debris signatures in an operational setting. 36th
Annual Meeting, Birmingham, AL,
National Weather Association.
Schultz, C. J., and co-authors, 2012a: Dual-polarization tornadic debris signatures Part I:
Examples and utility in an operational setting. Electronic J. Operational Meteor., in
review.
——, and co-authors, 2012b: Dual-polarization tornadic debris signatures Part II: Comparisons
and caveats. Electronic J. Operational Meteor., in review.
Straka J.M., D.S. Zrnic, A.V. Ryshkov, 2000: Bulk hydrometeor classification and quantification
using polarimetric radar data: synthesis of relations. J. Appl. Meteor., 39, 1341-1372.
WDTB (Warning Decision Training Branch – NWS), 2011: Dual-Pol Radar Operations Course-
Overview and Tornado Debris Signature. Dual-Polarization Radar Training. Retrieved
January 4, 2012, from http://www.wdtb.noaa.gov/courses/dualpol
Zrnic, D.S., and A.V. Ryzhkov, 1999: Polarimetry for weather surveillance radars. Bull. Amer.
Meteor. Soc., 80, 389-406.


![arXiv:1807.01232v2 [cs.CV] 25 Sep 2018 · Unclassified 1138. km 95.4 km 1750.8 km 164.5 km 3148.7 km Total 3685.0 km 425.3 km 3536.9 km 1029.5 km 8676.6 km 2.5 Challenge 3 - Las](https://img.pdfslide.us/doc/110x75/5f107f837e708231d44967c4/arxiv180701232v2-cscv-25-sep-2018-unclassiied-1138-km-954-km-17508-km.jpg)