Embed Size (px)
Citation preview
139D. Sui et al. (eds.), Crowdsourcing Geographic Knowledge: Volunteered Geographic Information (VGI) in Theory and Practice, DOI 10.1007/978-94-007-4587-2_9, © Springer Science+Business Media Dordrecht 2013
Abstract Volunteered geographic information (VGI) describes the collaborative and voluntary collection of any kind of spatial data, and has evolved to become an important source for geo-information. Users participate in VGI communities and share their data with other community members at no charge. The data is based on personal measurements or personal knowledge, as well as on available aerial imagery provided by Bing Maps etc. In the early beginnings, VGI comprised only two-dimensional (2D) data, but now more and more users also contribute 3D-compliant data such as height information. By utilizing such 3D information or 3D-VGI, it is possible to create virtual but increasingly realistic 3D map features and models that can be compared to products such as Google Earth. In this chapter, the evolution of VGI from 2D to 3D is discussed. In particular, the creation of a 3D virtual globe including visualization of 3D building models as well as traf fi c infra-structure, landuse areas, and points of interest (POIs) is reviewed. Additional data sources and the semantic enrichment of virtual models are also discussed. Crowdsourced geodata can serve as a real alternative data source and VGI can be utilized for generating rich 3D city models.
9.1 Introduction
The terms geo-crowdsourcing, user-generated geographic content, and volunteered geographic information (VGI) describe a quite new phenomenon in geoinformatics, whereby an ever-expanding group of users collaboratively and voluntarily collects different types of spatial data (Goodchild 2007a ) . That is, both laypeople and
M. Goetz (*) • A. Zipf GIScience research group , University of Heidelberg , Heidelberg , Germany e-mail: [email protected] ; [email protected]
Chapter 9 The Evolution of Geo-Crowdsourcing: Bringing Volunteered Geographic Information to the Third Dimension
Marcus Goetz and Alexander Zipf
140 M. Goetz and A. Zipf
professionals create geographic data based on (personal) measurements (e.g., via GPS devices or personal knowledge) and provide this data in a Web 2.0 community platform to other users of the community. In doing so, the VGI communities create a comprehensive data source of many different types, with the members of these communities acting as remote sensors (Goodchild 2007b ) . Especially in urban regions, VGI data is often available at a very detailed scale, which is the reason for its increasing use in urban data management (Song and Sun 2010 ) . One of the most popular examples of such a VGI community is the OpenStreetMap (OSM) project, which will be described in more detail later.
In the early beginnings of VGI, the available data mainly comprised two-dimensional (2D) data, but since 2008, people more and more often started to collect 3D data such as height information, roof geometry information, etc., transforming VGI from 2D maps and imagery to a 3D data source. Adding 3D information to VGI projects is an important step, not only due to the fact that we are living in a 3D world, but also because 3D information allows the development and provision of many different applications. For example, by providing 3D models for a city district, it is possible to demonstrate future city development plans to the broad public in a public-participation process, consistent with Sarjakoski’s suggestion that, “three-dimensional modeling and photorealistic visualization and animation should be included in public participation GIS for the sake of space-to-feel level experience in urban plans” (Sarjakoski 1998 ) . Not only public-participation initiatives bene fi t from 3D models, but also (scienti fi c) analysis often achieves more exact results when using 3D data. For example, in the area of visibility analysis in urban areas, it has been demonstrated that “3D visibility indices are more effective than 2D indices” (Yang et al. 2007 ) . Furthermore, 3D information about urban areas supports decisions in emergencies (Lee 2007 ; Kolbe et al. 2008 ; Lee and Zlatanova 2008 ; Schilling and Goetz 2010 ) and can also be utilized for visualizing topological relations (Lee 2001 ) . To the authors of this chapter, it is therefore evident that 3D information about both urban and rural areas is useful for diverse applications and it is crucial to have access to different sources of 3D data. By demonstrating the richness and diversity of VGI data (and especially OSM data), it will be proven that VGI is a real alternative data source for 3D information. One step towards this, and also for encouraging the members of VGI communities, is the project OSM-3D 1 : a virtual globe for visualizing OSM data as a 3D model. The fundamental ideas and basics behind this project have already been described and demonstrated (Over et al. 2010 ) . However, the project has been recently extended to the whole European region, and additionally, re fi nements and improvements (especially for building construction) have been made.
The remainder of this chapter is organized as follows: First, there is an introduction to the OSM project. Afterwards, there is an extensive overview about the OSM-3D project with a special focus on a quantitative analysis of 3D-compliant OSM
1 www.osm-3d.org
1419 The Evolution of Geo-Crowdsourcing: Bringing Volunteered Geographic...
attributes, as well as the generation of building models. Additionally, this section contains an outlook for the enrichment of OSM data by using additional data sources. Thereafter, there is a discussion about possible semantic enrichment of 3D city models by using VGI from OSM. The last section summarizes the presented work and discusses future research.
9.2 OpenStreetMap: One of the Most Popular Examples for VGI
In the last few years, diverse initiatives (with different user groups, aims, etc.) for the collection of VGI, such as geotagged Flickr images, 2 Wikimapia, 3 Foursquare, 4 Gowalla, 5 etc., have emerged. One of the most popular examples is indisputably the OpenStreetMap project. OSM was initiated in 2004 and rapidly developed into a fast growing Web community with currently more than 400,000 registered users, thus more than 400,000 potential contributors.
Users of OSM are able to contribute data to the community by adding several georeferenced points (i.e., nodes) to the database. These points are created by using personal measurements with a GPS device (e.g., a GPS-enabled cell phone) or by applying personal knowledge about the surrounding areas. Additionally, different providers of fi ne-resolution aerial images such as Bing Maps have granted permis-sion to use their images for mapping activities (e.g., mapping street segments or building shapes). This decision has also increased the amount of data inside OSM because now it is possible to map data around the world without the need of being there physically. In addition to georeferenced nodes, users within OSM can also combine them into so-called ways (i.e., a connection of nodes), allowing the creation of linestring geometries (e.g., for street segments). These ways do not necessarily have to be closed (i.e., the starting point equals the ending point), but if so, they can be further utilized for mapping polygons (e.g., areas) with arbitrary shape. For mapping complex polygons with outer shells and inner holes, it is also possible to create so-called relations inside OSM. Additionally, these relations can be used for describing complex relationships between different OSM nodes or ways. The latest OSM dataset (November 2011) contains more than 1.25 billion georefer-enced nodes, 114 million ways, and 1,100,000 relations.
But OpenStreetMap does not only contain pure geometric information. Additionally, OSM adapts a concept of open and unlimited key-value pairs for adding different (semantic) information and attributes on top of the geometry. That is, users can map their geometries by using nodes, ways, or relations and enrich those with distinct information by attaching key-value pairs. The key describes a distinct information
2 fl ickr.com 3 wikimapia.org 4 http://foursquare.com 5 http://gowalla.com
142 M. Goetz and A. Zipf
domain or condition, and the corresponding value describes the information itself. So, for example, a way with the key highway describes a street for vehicles and humans. Additionally, the value motorway re fi nes this street as a motorway not utilizable by pedestrians. Since the number of key-value pairs is not limited (i.e., a user can add an arbitrary number of key-value pairs), it is possible to further re fi ne the information about the motorway, for example, by adding the key maxspeed with the value 130 . Also, users are enabled to map not only streets but also natural areas such as forests or seas, different points of interests (POIs) such as ATMs or letter boxes, building ground shapes, etc. The OSM key-value methodology itself is very open; thus, it is very easy for a user to add any kind of additional information. There are of course some best practices and recommendations for mapping different map features such as the keys amenity , building , natural , place , waterway , etc., as described on the OSM wiki page (OSM 2011b ) . A complete list of all keys is also available at Tagwatch ( 2011 ) .
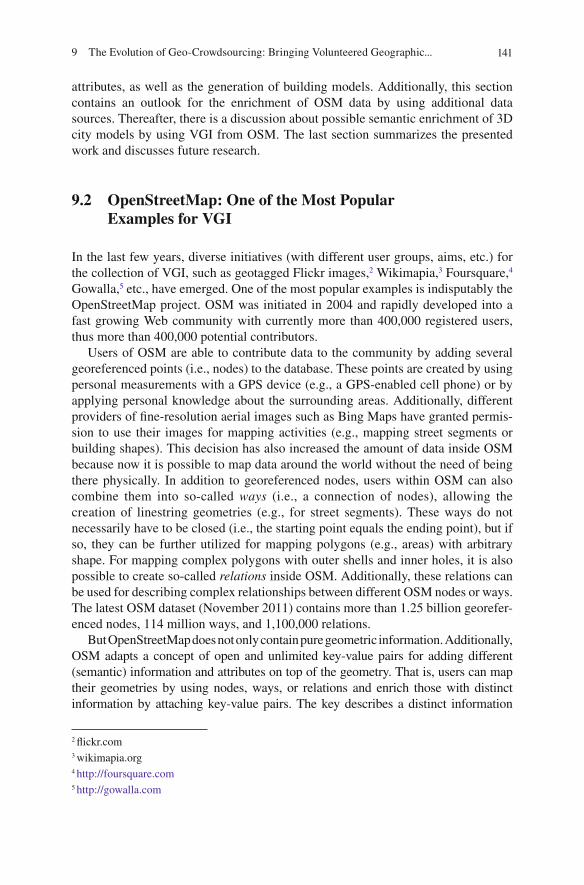
The data of OSM itself can be either downloaded from different OSM data provider platforms (e.g., Geofabrik 6 ) or by using the Web API which is part of the visual Web interface of OSM. 7 By using this Web interface, users (also those who are not OSM members) can access the 2D online map and browse through the world. Figure 9.1 depicts an exemplary screenshot of the OSM map. Furthermore, this Web API also allows the download of OSM data.
Fig. 9.1 The OSM map perspective on the city of Heidelberg with different types of map features (streets, buildings, etc.) (OSM 2011a )
6 http://download.geofabrik.de/ 7 http://www.openstreetmap.org
1439 The Evolution of Geo-Crowdsourcing: Bringing Volunteered Geographic...
9.3 Three-Dimensional OpenStreetMap
Most applications and research investigations that use OpenStreetMap as a data source are 2D and only visualize the data in 2D from a bird’s eye view. That is, according to Over et al. ( 2010 ) , there is little research on the 3D visualization and usage of OSM data available, and there are basically just two different applications which provide a real 3D perspective with additional digital terrain model (DTM) and 3D buildings: the so-called KOSMOS World fl ier (Brejc 2011 ) and the OSM-3D project (OSM-3D 2011 ) . A couple of other applications for providing perspective scenes (with fl at terrain) and some extruded buildings do also exist, for example, Ziegler ( 2011 ) , but these are very limited regarding scene display size, application functionality, and 3D visualizations. In contrast, the OSM-3D project is based on public Open Geospatial Consortium (OGC) standards and drafts, such as a Web Map Service (WMS) or Web 3D Service (W3DS) and dedicated client software, and provides a detailed virtual globe with atmospheric visualization effects. A compre-hensive number of data types have been selected and used for displaying different 3D map features such as a DTM, POIs, buildings, streets, labels, natural areas, etc.
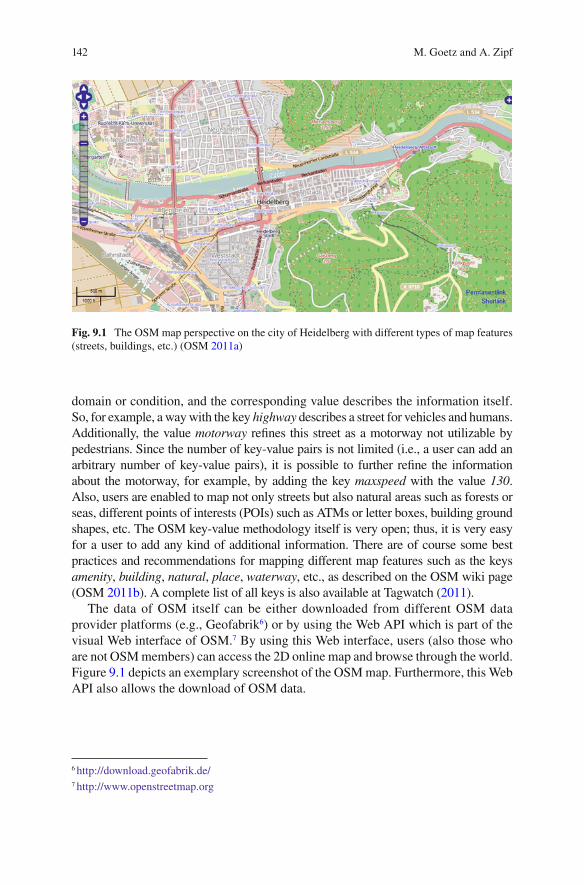
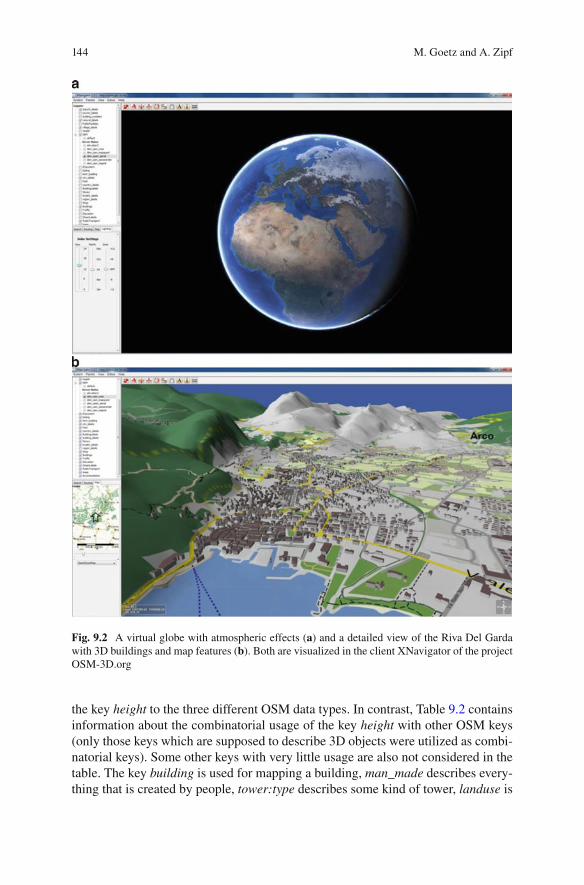
To the authors’ knowledge, OSM-3D is the only project that uses such an exten-sive amount of OSM data for the generation of 3D models. Furthermore, it is the fi rst approach to generate realistic 3D models (especially building models) by purely using VGI from OSM, thus demonstrating the richness and power of VGI. Figure 9.2a depicts an overview of the 3D globe in XNavigator. Additionally, Fig. 9.2b shows a more detailed perspective of the Riva Del Garda in Italy, where different natural areas as well as streets, waterways, and 3D buildings are visualized. The next sections will describe OSM-3D in more detail, especially focusing on the generation of 3D building models and 3D map features. Before that, we include a discussion about relevant and 3D-compliant OSM keys and values, as well as a brief introduction to the system architecture of OSM-3D.
9.3.1 Analyses of 3D-Compliant OpenStreetMap Attributes
Basically, all geographic data in OSM is 2D. The users within the OSM community measure 2D GPS points or draw geometries based on 2D aerial imagery. Thus, the visible geometry inside OSM, which is in most cases the visible map that can be consumed via the Web interface of OSM, is 2D. Therefore, at fi rst glance, OpenStreet-Map does not seem to provide any kind of 3D data. However, when taking a closer and more detailed look at the data structure as well as the best practices and popular key-value pairs within the project, it becomes evident that there is nevertheless plenty of 3D information inside OSM.
The OSM-key height , as one could imagine due to the semantic meaning of the key, obviously contains 3D data. It describes the (vertical) height of a map feature, wherein the default length measure (if not explicitly provided by the user) is meters. Table 9.1 contains quantitative and qualitative information about the application of
144 M. Goetz and A. Zipf
Fig. 9.2 A virtual globe with atmospheric effects ( a ) and a detailed view of the Riva Del Garda with 3D buildings and map features ( b ). Both are visualized in the client XNavigator of the project OSM-3D.org
the key height to the three different OSM data types. In contrast, Table 9.2 contains information about the combinatorial usage of the key height with other OSM keys (only those keys which are supposed to describe 3D objects were utilized as combi-natorial keys). Some other keys with very little usage are also not considered in the table. The key building is used for mapping a building, man_made describes every-thing that is created by people, tower:type describes some kind of tower, landuse is
1459 The Evolution of Geo-Crowdsourcing: Bringing Volunteered Geographic...
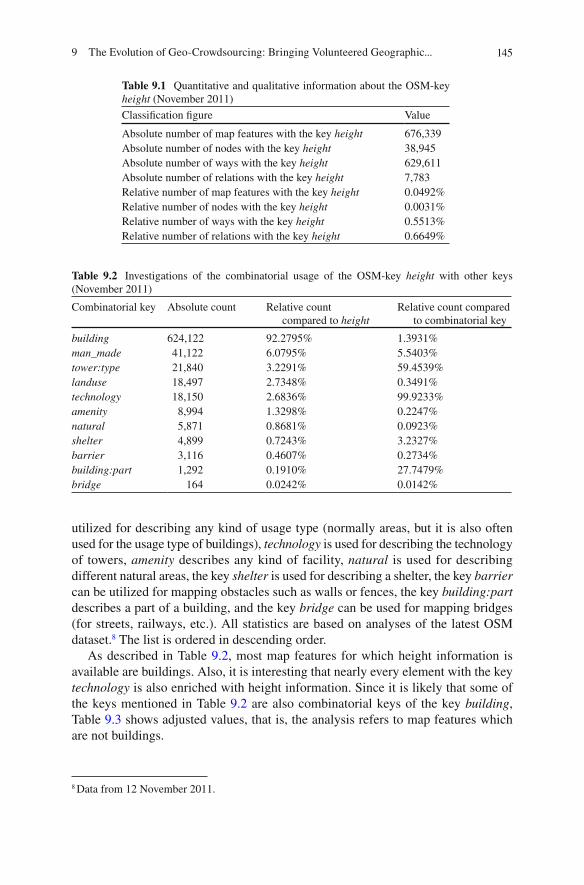
Table 9.1 Quantitative and qualitative information about the OSM-key height (November 2011)
Classi fi cation fi gure Value
Absolute number of map features with the key height 676,339 Absolute number of nodes with the key height 38,945 Absolute number of ways with the key height 629,611 Absolute number of relations with the key height 7,783 Relative number of map features with the key height 0.0492% Relative number of nodes with the key height 0.0031% Relative number of ways with the key height 0.5513% Relative number of relations with the key height 0.6649%
Table 9.2 Investigations of the combinatorial usage of the OSM-key height with other keys (November 2011)
Combinatorial key Absolute count Relative count compared to height
Relative count compared to combinatorial key
building 624,122 92.2795% 1.3931% man_made 41,122 6.0795% 5.5403% tower:type 21,840 3.2291% 59.4539% landuse 18,497 2.7348% 0.3491% technology 18,150 2.6836% 99.9233% amenity 8,994 1.3298% 0.2247% natural 5,871 0.8681% 0.0923% shelter 4,899 0.7243% 3.2327% barrier 3,116 0.4607% 0.2734% building:part 1,292 0.1910% 27.7479% bridge 164 0.0242% 0.0142%
utilized for describing any kind of usage type (normally areas, but it is also often used for the usage type of buildings), technology is used for describing the technology of towers, amenity describes any kind of facility, natural is used for describing different natural areas, the key shelter is used for describing a shelter, the key barrier can be utilized for mapping obstacles such as walls or fences, the key building:part describes a part of a building, and the key bridge can be used for mapping bridges (for streets, railways, etc.). All statistics are based on analyses of the latest OSM dataset. 8 The list is ordered in descending order.
As described in Table 9.2 , most map features for which height information is available are buildings. Also, it is interesting that nearly every element with the key technology is also enriched with height information. Since it is likely that some of the keys mentioned in Table 9.2 are also combinatorial keys of the key building , Table 9.3 shows adjusted values, that is, the analysis refers to map features which are not buildings.
8 Data from 12 November 2011.
146 M. Goetz and A. Zipf
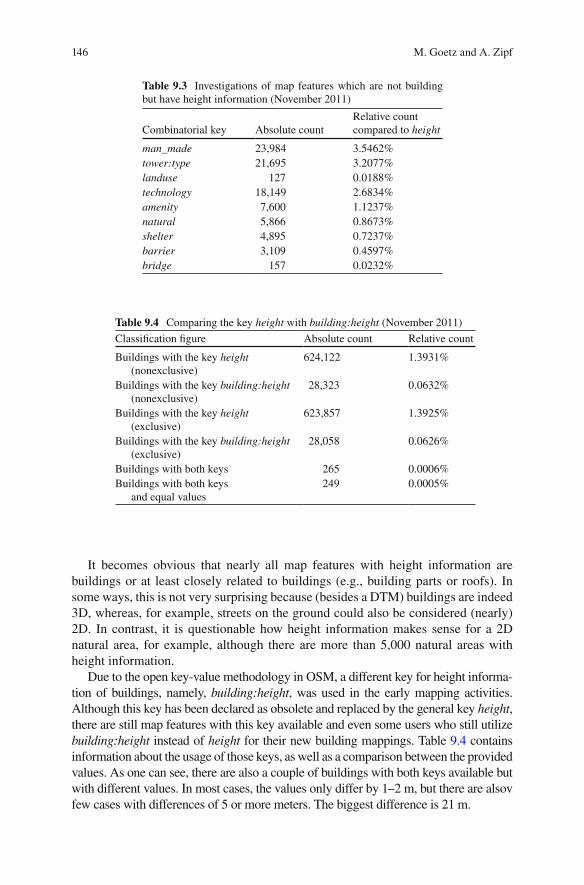
Table 9.4 Comparing the key height with building:height (November 2011)
Classi fi cation fi gure Absolute count Relative count
Buildings with the key height (nonexclusive)
624,122 1.3931%
Buildings with the key building:height (nonexclusive)
28,323 0.0632%
Buildings with the key height (exclusive)
623,857 1.3925%
Buildings with the key building:height (exclusive)
28,058 0.0626%
Buildings with both keys 265 0.0006% Buildings with both keys
and equal values 249 0.0005%
Table 9.3 Investigations of map features which are not building but have height information (November 2011)
Combinatorial key Absolute count Relative count compared to height
man_made 23,984 3.5462% tower:type 21,695 3.2077% landuse 127 0.0188% technology 18,149 2.6834% amenity 7,600 1.1237% natural 5,866 0.8673% shelter 4,895 0.7237% barrier 3,109 0.4597% bridge 157 0.0232%
It becomes obvious that nearly all map features with height information are buildings or at least closely related to buildings (e.g., building parts or roofs). In some ways, this is not very surprising because (besides a DTM) buildings are indeed 3D, whereas, for example, streets on the ground could also be considered (nearly) 2D. In contrast, it is questionable how height information makes sense for a 2D natural area, for example, although there are more than 5,000 natural areas with height information.
Due to the open key-value methodology in OSM, a different key for height informa-tion of buildings, namely, building:height , was used in the early mapping activities. Although this key has been declared as obsolete and replaced by the general key height , there are still map features with this key available and even some users who still utilize building:height instead of height for their new building mappings. Table 9.4 contains information about the usage of those keys, as well as a comparison between the provided values. As one can see, there are also a couple of buildings with both keys available but with different values. In most cases, the values only differ by 1–2 m, but there are alsov few cases with differences of 5 or more meters. The biggest difference is 21 m.
1479 The Evolution of Geo-Crowdsourcing: Bringing Volunteered Geographic...
Besides the keys height and building:height , there are also some other keys with height information such as seamark:light:height (total usage: 23,009) for describing the height of a sea light, light:height (total usage: 1,348) for describing the height of a light (e.g., a street light), or min_height (total usage: 1,321) for describing the elevation of a map feature (i.e., the space between the ground and the feature, mostly used in combination with building ). However, currently they are rarely used and will thus not be investigated in detail within this chapter. Nevertheless, they still might contain 3D-related data and thus might be relevant when creating 3D models from OpenStreetMap.
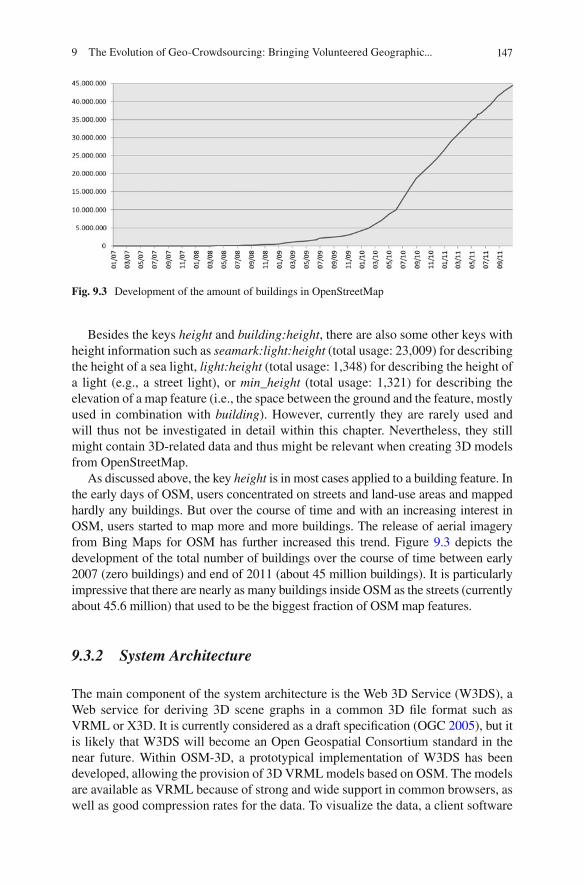
As discussed above, the key height is in most cases applied to a building feature. In the early days of OSM, users concentrated on streets and land-use areas and mapped hardly any buildings. But over the course of time and with an increasing interest in OSM, users started to map more and more buildings. The release of aerial imagery from Bing Maps for OSM has further increased this trend. Figure 9.3 depicts the development of the total number of buildings over the course of time between early 2007 (zero buildings) and end of 2011 (about 45 million buildings). It is particularly impressive that there are nearly as many buildings inside OSM as the streets (currently about 45.6 million) that used to be the biggest fraction of OSM map features.
9.3.2 System Architecture
The main component of the system architecture is the Web 3D Service (W3DS), a Web service for deriving 3D scene graphs in a common 3D fi le format such as VRML or X3D. It is currently considered as a draft speci fi cation (OGC 2005 ) , but it is likely that W3DS will become an Open Geospatial Consortium standard in the near future. Within OSM-3D, a prototypical implementation of W3DS has been developed, allowing the provision of 3D VRML models based on OSM. The models are available as VRML because of strong and wide support in common browsers, as well as good compression rates for the data. To visualize the data, a client software
Fig. 9.3 Development of the amount of buildings in OpenStreetMap
148 M. Goetz and A. Zipf
the XNavigator has been developed. This client software allows very intuitive and user-friendly consumption of the data derived from the W3DS because the client automatically sends the location-dependent user requests to the W3DS, so the user does not have to do this on his or her own. Additionally, the client allows the selection of individual layers with different types of data, such as buildings, streets, and natural areas. Furthermore, additional functionalities such as routing, address search, POI search, or GPS track visualization add value to the application. Since all components are based on OGC standards, the application platform is very fl exible and scalable. Also, all layers can be styled according to user requirements by using 3D-styled layer descriptors (3D-SLD) (Over et al. 2010 ) . This very short introduction to OSM-3D and its architecture ought to be enough in the context of this chapter. For more detailed information, please refer to common publications such as Zipf et al. ( 2007 ) , Schilling et al. ( 2009 ) , and Over et al. ( 2010 ) . Furthermore, some details about the performance as well as the data processing are described in the following sections, especially Sect. 9.3.5 .
9.3.3 Generation of Building Features
Besides the DTM (which is not discussed in detail within this chapter), the main 3D parts of OSM-3D are the 3D building models. As stated above, the whole OSM dataset currently contains nearly 45 million buildings, that is, 45 million footprints which are possibly enriched with geometric or semantic information (see below). Simple footprint geometries, that is, geometries with no holes inside, are mapped as a single closed way within OSM, whereby the way must contain at least 4 nodes with the fi rst node being equal to the last node. For mapping complex polygons (e.g., buildings with holes inside the footprint), users need to utilize OSM relations. These consist of one or more outer members (describing the outer shape of the polygon) and an arbitrary number of inner members (describing holes in the shell geometry).
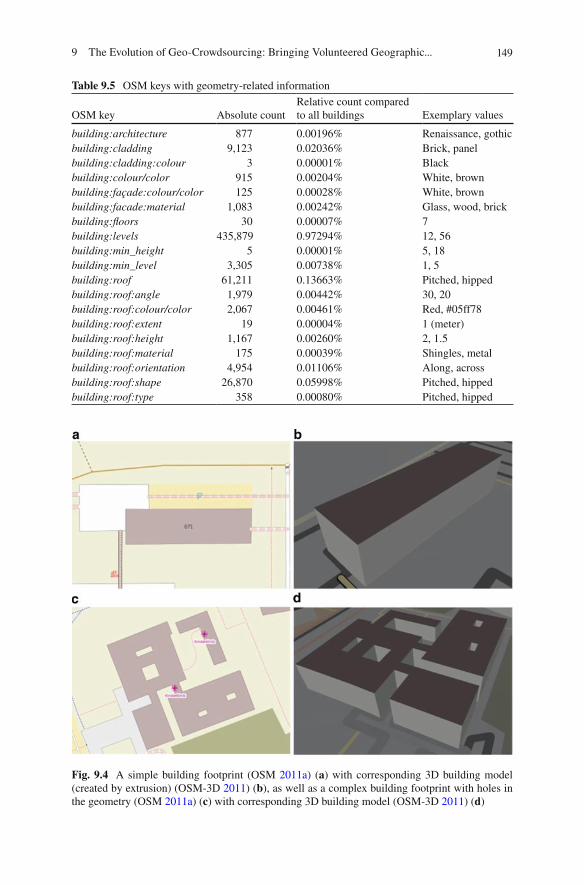
Obviously, for the generation of 3D building models, the 2D footprint is not enough, thus additional information is required. As stated above, due to the open OSM key-value pair methodology, it is no problem to add further (3D) information to building footprints, and every OSM user can do so. That is, 3D information is not explicitly mapped as a geometry by the community but implicitly provided as key-value pairs on top of the corresponding map feature. Table 9.5 contains the building geometry and building appearance-related keys which are currently available in OSM and are more or less often used within the community. Table 9.5 also demon-strates a disadvantage of the open key-value pair methodology: for some building attributes (e.g., the roof shape), there are several potential OSM keys available; thus when investigating them, all potential keys need to be considered and compared with each other (Fig. 9.4 ).
How can this information be used to generate 3D building models? One of the most important attributes of a building is its height because it allows the generation of a 3D volumetric body by simply extruding the building footprint (which is available in OSM) with the added height information. Figure 9.5a depicts a quite simple
1499 The Evolution of Geo-Crowdsourcing: Bringing Volunteered Geographic...
Table 9.5 OSM keys with geometry-related information
OSM key Absolute count Relative count compared to all buildings Exemplary values
building:architecture 877 0.00196% Renaissance, gothic building:cladding 9,123 0.02036% Brick, panel building:cladding:colour 3 0.00001% Black building:colour/color 915 0.00204% White, brown building:façade:colour/color 125 0.00028% White, brown building:facade:material 1,083 0.00242% Glass, wood, brick building: fl oors 30 0.00007% 7 building:levels 435,879 0.97294% 12, 56 building:min_height 5 0.00001% 5, 18 building:min_level 3,305 0.00738% 1, 5 building:roof 61,211 0.13663% Pitched, hipped building:roof:angle 1,979 0.00442% 30, 20 building:roof:colour/color 2,067 0.00461% Red, #05ff78 building:roof:extent 19 0.00004% 1 (meter) building:roof:height 1,167 0.00260% 2, 1.5 building:roof:material 175 0.00039% Shingles, metal building:roof:orientation 4,954 0.01106% Along, across building:roof:shape 26,870 0.05998% Pitched, hipped building:roof:type 358 0.00080% Pitched, hipped
Fig. 9.4 A simple building footprint (OSM 2011a ) ( a ) with corresponding 3D building model (created by extrusion) (OSM-3D 2011 ) ( b ), as well as a complex building footprint with holes in the geometry (OSM 2011a ) ( c ) with corresponding 3D building model (OSM-3D 2011 ) ( d )
150 M. Goetz and A. Zipf
building footprint of a rectangular building, and Fig. 9.5b shows the corresponding 3D building model which has been generated by extruding the footprint with the building height. Also, more complex building footprints, such as those containing holes in the outer shell (Fig. 9.5c ) can be transformed into 3D building models by footprint extrusion (Fig. 9.5d ).
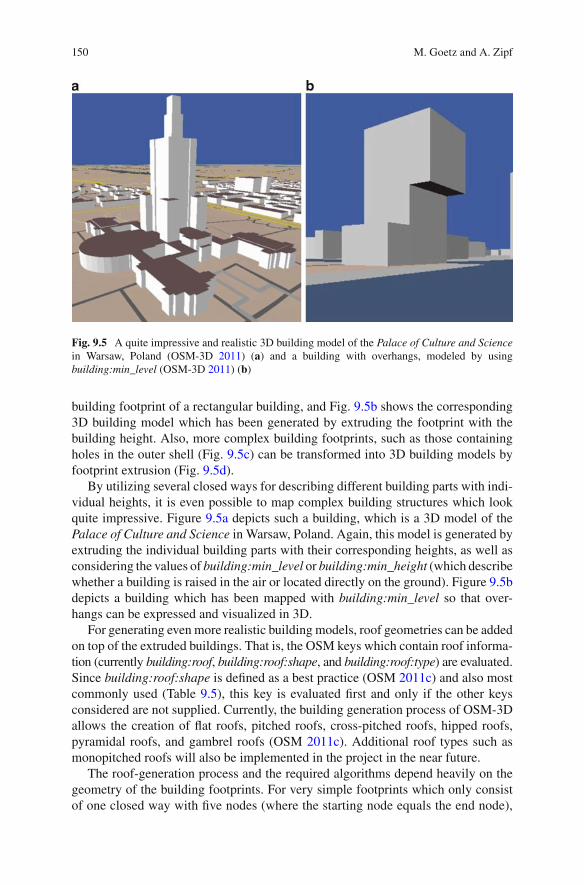
By utilizing several closed ways for describing different building parts with indi-vidual heights, it is even possible to map complex building structures which look quite impressive. Figure 9.5a depicts such a building, which is a 3D model of the Palace of Culture and Science in Warsaw, Poland. Again, this model is generated by extruding the individual building parts with their corresponding heights, as well as considering the values of building:min_level or building:min_height (which describe whether a building is raised in the air or located directly on the ground). Figure 9.5b depicts a building which has been mapped with building:min_level so that over-hangs can be expressed and visualized in 3D.
For generating even more realistic building models, roof geometries can be added on top of the extruded buildings. That is, the OSM keys which contain roof informa-tion (currently building:roof , building:roof:shape , and building:roof:type ) are evaluated. Since building:roof:shape is de fi ned as a best practice (OSM 2011c ) and also most commonly used (Table 9.5 ), this key is evaluated fi rst and only if the other keys considered are not supplied. Currently, the building generation process of OSM-3D allows the creation of fl at roofs, pitched roofs, cross-pitched roofs, hipped roofs, pyramidal roofs, and gambrel roofs (OSM 2011c ) . Additional roof types such as monopitched roofs will also be implemented in the project in the near future.
The roof-generation process and the required algorithms depend heavily on the geometry of the building footprints. For very simple footprints which only consist of one closed way with fi ve nodes (where the starting node equals the end node),
Fig. 9.5 A quite impressive and realistic 3D building model of the Palace of Culture and Science in Warsaw, Poland (OSM-3D 2011 ) ( a ) and a building with overhangs, modeled by using building:min_level (OSM-3D 2011 ) ( b )
1519 The Evolution of Geo-Crowdsourcing: Bringing Volunteered Geographic...
the roof generation is straightforward: each node represents a node of the roof geometry, thus these are the basis of the roof. Depending on the roof type, other points can be calculated by utilizing linear algebra. These points are then connected with each other (again depending on the roof type), so fi nally the roof geometry can be computed. For instance, a pyramidal roof can be computed by calculating the centroid of the building footprint and creating a triangle geometry for every pair of adjacent roof basis nodes and the centroid (which is raised in the air). The resulting four triangle geometries are then the fi nal roof geometry. How far the roof is raised in the air is either explicitly added in OSM with the key building:roof:height or implicitly with the key building:roof:angle (though, in this case, the real height needs to be computed with trigonometric equations). For a pitched roof, there are some more computations required, but these are also quite straightforward.
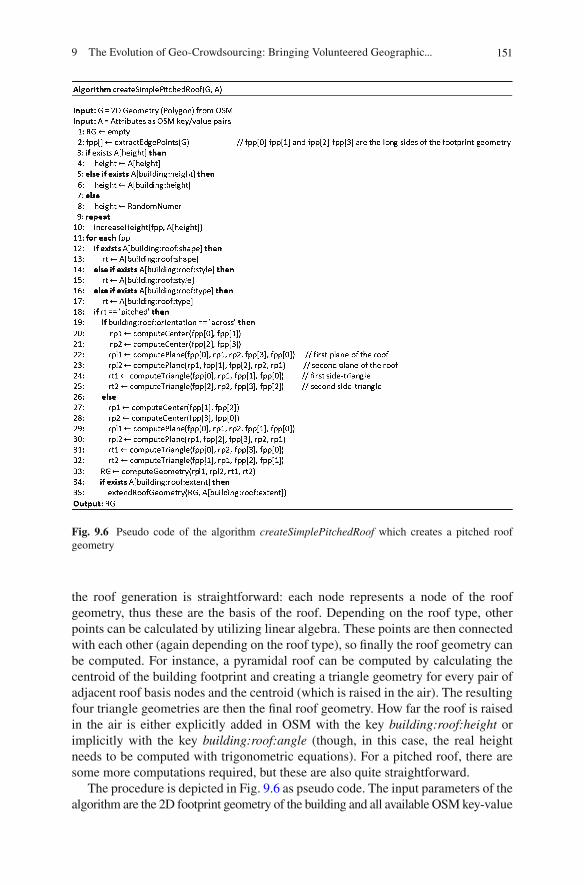
The procedure is depicted in Fig. 9.6 as pseudo code. The input parameters of the algorithm are the 2D footprint geometry of the building and all available OSM key-value
Fig. 9.6 Pseudo code of the algorithm createSimplePitchedRoof which creates a pitched roof geometry
152 M. Goetz and A. Zipf
pairs. If the building has a pitched roof (all potential OSM keys are analyzed), the algorithm computes a proper roof geometry (also considering the roof orientation according to building:roof:orientation ). Also, if the key building:roof:extent is supplied within OSM, the roof geometry is extended accordingly. Other roof types can be computed with similar algorithms.
The above algorithms and procedures are valid for simple geometries consisting of fi ve points, whereas the geometry does not necessarily have to be rectangular. Also, for shifted and rotated geometries, this approach returns valid results.
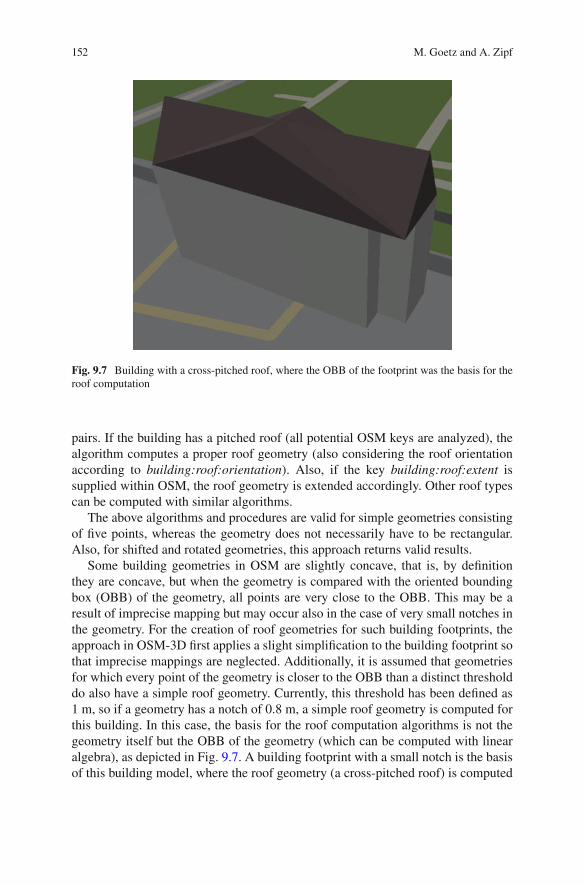
Some building geometries in OSM are slightly concave, that is, by de fi nition they are concave, but when the geometry is compared with the oriented bounding box (OBB) of the geometry, all points are very close to the OBB. This may be a result of imprecise mapping but may occur also in the case of very small notches in the geometry. For the creation of roof geometries for such building footprints, the approach in OSM-3D fi rst applies a slight simpli fi cation to the building footprint so that imprecise mappings are neglected. Additionally, it is assumed that geometries for which every point of the geometry is closer to the OBB than a distinct threshold do also have a simple roof geometry. Currently, this threshold has been de fi ned as 1 m, so if a geometry has a notch of 0.8 m, a simple roof geometry is computed for this building. In this case, the basis for the roof computation algorithms is not the geometry itself but the OBB of the geometry (which can be computed with linear algebra), as depicted in Fig. 9.7 . A building footprint with a small notch is the basis of this building model, where the roof geometry (a cross-pitched roof) is computed
Fig. 9.7 Building with a cross-pitched roof, where the OBB of the footprint was the basis for the roof computation
1539 The Evolution of Geo-Crowdsourcing: Bringing Volunteered Geographic...
for the OBB of the building footprint. These roofs are not really equal to the real-world roofs, but they can be considered as a quite good approximation of reality, and they ought to be enough for the sake of a basic VGI-based 3D model. Currently, there is plenty of work aimed at the improvement of roof geometries. Some fi rst prototypical results were obtained by using straight-skeleton algorithms with procedural extrusion (Laycock and Day 2003 ; Kelly and Wonka 2011 ) , but there is still plenty of work to do for a broad application of these algorithms to OSM data.
Finally, for making the building models even more realistic and appealing, the roof can be colored according to the tags building:roof:colour or building:roof:color , and the building body can be colored according to building:facade:colour, building:facade:color , building:colour , or building:color .
9.3.4 Adding Additional Data Sources
As one can see from the previous sections, there are theoretically many OSM keys which are relevant for building-model creation, but practically, most of them are rarely available in OSM. Therefore, it is also interesting to see how OSM data can be extended by using other data sources.
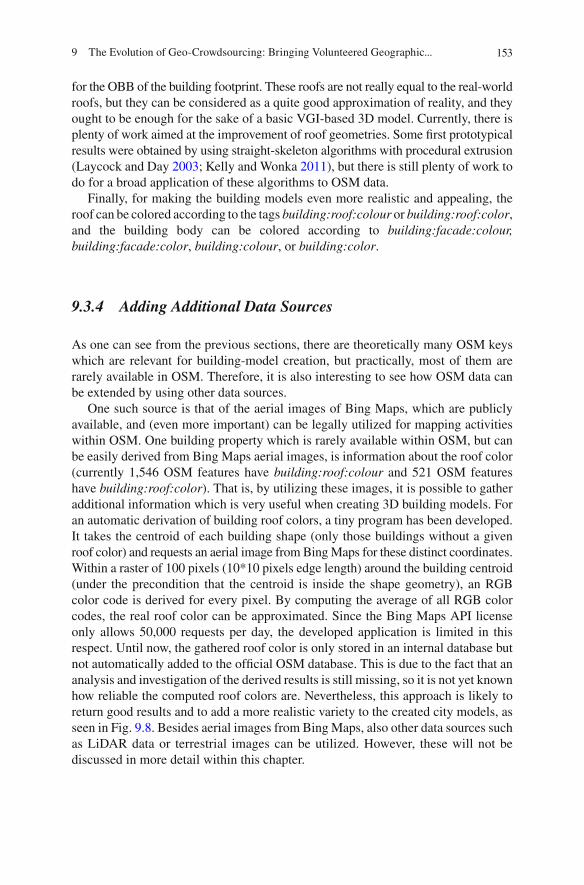
One such source is that of the aerial images of Bing Maps, which are publicly available, and (even more important) can be legally utilized for mapping activities within OSM. One building property which is rarely available within OSM, but can be easily derived from Bing Maps aerial images, is information about the roof color (currently 1,546 OSM features have building:roof:colour and 521 OSM features have building:roof:color ). That is, by utilizing these images, it is possible to gather additional information which is very useful when creating 3D building models. For an automatic derivation of building roof colors, a tiny program has been developed. It takes the centroid of each building shape (only those buildings without a given roof color) and requests an aerial image from Bing Maps for these distinct coordinates. Within a raster of 100 pixels (10*10 pixels edge length) around the building centroid (under the precondition that the centroid is inside the shape geometry), an RGB color code is derived for every pixel. By computing the average of all RGB color codes, the real roof color can be approximated. Since the Bing Maps API license only allows 50,000 requests per day, the developed application is limited in this respect. Until now, the gathered roof color is only stored in an internal database but not automatically added to the of fi cial OSM database. This is due to the fact that an analysis and investigation of the derived results is still missing, so it is not yet known how reliable the computed roof colors are. Nevertheless, this approach is likely to return good results and to add a more realistic variety to the created city models, as seen in Fig. 9.8 . Besides aerial images from Bing Maps, also other data sources such as LiDAR data or terrestrial images can be utilized. However, these will not be discussed in more detail within this chapter.
154 M. Goetz and A. Zipf
9.3.5 Performance and Statistics
The above mentioned project OSM-3D has already been in operation for a couple of years. During this time, the required data quantity as well as the processing time has increased substantially. The system currently covers 3D map features for the European region; for the rest of the world, all features are 2D (e.g., streets or land-use areas), and buildings are not computed for non-European areas. The European restriction has been chosen on the one hand for data reduction and on the other hand because of the fact that most of the OSM-mapping activities happen in the European area anyway.
Focusing on the buildings, the system currently requires a 12-GB database for 2D building footprints (generated beforehand from raw OSM data) and a 68-GB database for the georeferenced 3D-VRML building models. The two databases (footprints and models) are distributed on two individual database servers. The pro-cessing itself is performed weekly on a dedicated workstation with 2.5-GHz CPU and 2-GB RAM and takes about 75 h.
9.4 Adding Semantic Information
Obviously, the above described creation processes for a 3D visualization only focus on geometry; the 3D model is created (as VRML or X3D) and visualized. But what about the semantics of the model? More and more applications from different fi elds such as urban planning or emergency response require not only pure geometric models but also semantic information about the different model features. Providing comprehensive semantics allows more complex and sophisticated applications and analysis, but a source of semantic information is required.
Fig. 9.8 Several building models with varying roof colors
1559 The Evolution of Geo-Crowdsourcing: Bringing Volunteered Geographic...
Due to the open key-value pair methodology of OpenStreetMap, there are many different potential keys which contain not only geometric but also semantic infor-mation. It can even be stated that the majority of OSM keys are of a semantic type rather than a geometric type. The semantic information is from various domains, such as the key access for describing the legal accessibility of a distinct map feature, the key landuse for describing the primary usage of areas of land, the key tracktype for providing a classi fi cation of tracks, the key name for describing the name of a map feature, the key oneway for describing one-way characteristics of a street segment, and the key smoothness for providing a classi fi cation schema for the physical usability of a way for wheeled vehicles. There are many different (semantic) keys and far too many to be listed in this chapter. Nevertheless, the examples given ought to be enough for illustration and demonstration of the great diversity of semantic information within OpenStreetMap, ranging from street properties to building properties to accessibility constraints.
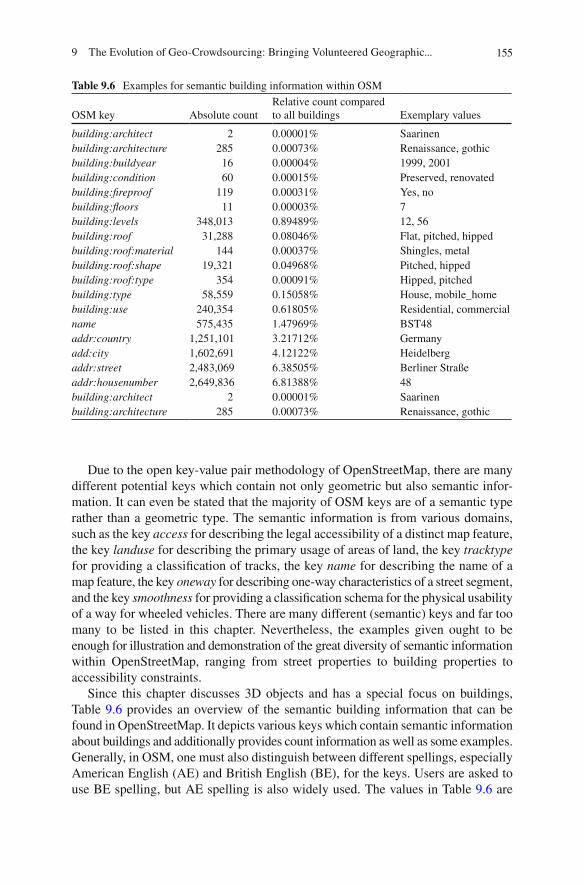
Since this chapter discusses 3D objects and has a special focus on buildings, Table 9.6 provides an overview of the semantic building information that can be found in OpenStreetMap. It depicts various keys which contain semantic information about buildings and additionally provides count information as well as some examples. Generally, in OSM, one must also distinguish between different spellings, especially American English (AE) and British English (BE), for the keys. Users are asked to use BE spelling, but AE spelling is also widely used. The values in Table 9.6 are
Table 9.6 Examples for semantic building information within OSM
OSM key Absolute count Relative count compared to all buildings Exemplary values
building:architect 2 0.00001% Saarinen building:architecture 285 0.00073% Renaissance, gothic building:buildyear 16 0.00004% 1999, 2001 building:condition 60 0.00015% Preserved, renovated building: fi reproof 119 0.00031% Yes, no building: fl oors 11 0.00003% 7 building:levels 348,013 0.89489% 12, 56 building:roof 31,288 0.08046% Flat, pitched, hipped building:roof:material 144 0.00037% Shingles, metal building:roof:shape 19,321 0.04968% Pitched, hipped building:roof:type 354 0.00091% Hipped, pitched building:type 58,559 0.15058% House, mobile_home building:use 240,354 0.61805% Residential, commercial name 575,435 1.47969% BST48 addr:country 1,251,101 3.21712% Germany add:city 1,602,691 4.12122% Heidelberg addr:street 2,483,069 6.38505% Berliner Straße addr:housenumber 2,649,836 6.81388% 48 building:architect 2 0.00001% Saarinen building:architecture 285 0.00073% Renaissance, gothic
156 M. Goetz and A. Zipf
accumulated regarding their spelling, that is, different spellings describing the same information are combined in one row (e.g., building:facade:color and building:facade:colour ). Again, there is a great diversity, but there are also some keys which are rarely used within OSM (e.g., building:architect ). Additionally, some of the keys mentioned in Table 9.5 (e.g., building:roof:shape ) could also be considered as semantic information and not only geometric information.
9.5 Conclusions and Future Work
In this chapter, the potential application of VGI and especially OpenStreetMap for the generation of 3D models has been discussed. A special focus has been laid on the generation of 3D city models and building models. First, it has been demon-strated why it is important to utilize 3D data and 3D models in different applications and analyses. After a brief introduction to OpenStreetMap, a comprehensive analysis of 3D-compliant OSM attributes has been provided, as well as diverse quantitative and qualitative investigations of the current OSM dataset. Afterwards, a very brief introduction to the architecture of OSM-3D has been given, followed by a detailed discussion of the creation of 3D building models. Trying to focus not only on geometry, an overview and discussion on semantic attributes, that is, OSM keys that contain semantic information, have been provided. By conducting this research, it can be demonstrated that VGI (especially from OSM) is a rich and powerful data source for 3D information, which can be utilized for the generation of 3D city models. This chapter demonstrates what kind of information is available. Furthermore, various examples show the computation of 3D building models.
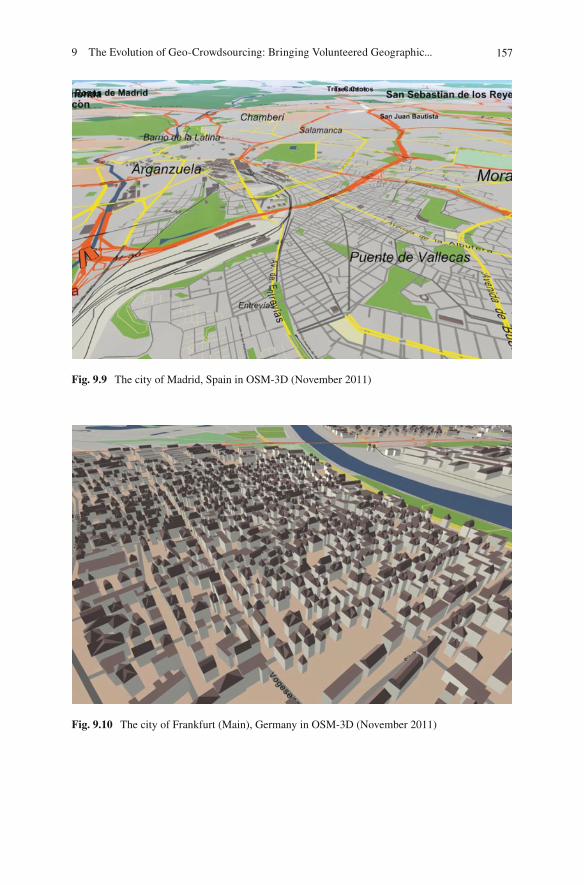
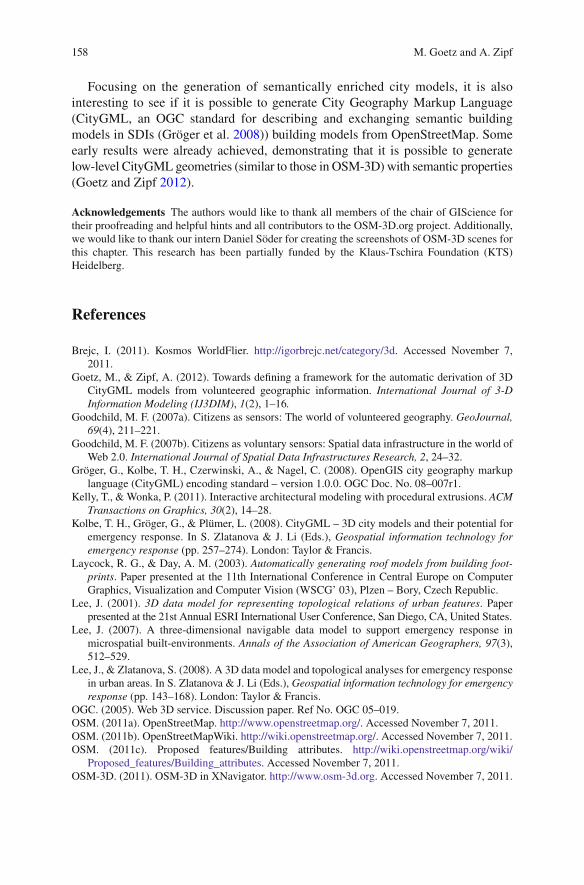
As described above (and also demonstrated in OSM-3D), it is generally possible to create 3D models based on VGI from OSM. However, the main issue about this is the missing data in many places. While many cities in Germany (and France) are mapped to a high degree also with buildings, the situation is different in many other countries. At the moment, the OSM community of users mainly focuses on geomet-ric aspects of streets and natural areas (which they can map with their nodes), but buildings and semantic information about them are not yet typically added. Also, 3D-compliant information is not often added at the moment, which might be the case because of missing measurement methods for height values, but it is likely that future cell phones will also include sensors for such measurements. Figure 9.9 depicts a screenshot from the city of Madrid, Spain – it demonstrates the missing data in some urban areas because Madrid contains few building shapes or even information about buildings. However, we are con fi dent that users will be motivated to add (semantic) information about buildings because projects such as OSM-3D and other future applications demonstrate the power and potential that lies in 3D-VGI. Another example can be seen in Fig. 9.10 . It shows a part of Frankfurt (Main) in Germany where, similar to many cities in Europe, nearly all building outlines have been mapped.
1579 The Evolution of Geo-Crowdsourcing: Bringing Volunteered Geographic...
Fig. 9.9 The city of Madrid, Spain in OSM-3D (November 2011)
Fig. 9.10 The city of Frankfurt (Main), Germany in OSM-3D (November 2011)
158 M. Goetz and A. Zipf
Focusing on the generation of semantically enriched city models, it is also interesting to see if it is possible to generate City Geography Markup Language (CityGML, an OGC standard for describing and exchanging semantic building models in SDIs (Gröger et al. 2008 ) ) building models from OpenStreetMap. Some early results were already achieved, demonstrating that it is possible to generate low-level CityGML geometries (similar to those in OSM-3D) with semantic properties (Goetz and Zipf 2012 ) .
Acknowledgements The authors would like to thank all members of the chair of GIScience for their proofreading and helpful hints and all contributors to the OSM-3D.org project. Additionally, we would like to thank our intern Daniel Söder for creating the screenshots of OSM-3D scenes for this chapter. This research has been partially funded by the Klaus-Tschira Foundation (KTS) Heidelberg.
References
Brejc, I. (2011). Kosmos WorldFlier. http://igorbrejc.net/category/3d . Accessed November 7, 2011.
Goetz, M., & Zipf, A. (2012). Towards de fi ning a framework for the automatic derivation of 3D CityGML models from volunteered geographic information. International Journal of 3-D Information Modeling (IJ3DIM) , 1 (2), 1–16 .
Goodchild, M. F. (2007a). Citizens as sensors: The world of volunteered geography. GeoJournal, 69 (4), 211–221.
Goodchild, M. F. (2007b). Citizens as voluntary sensors: Spatial data infrastructure in the world of Web 2.0. International Journal of Spatial Data Infrastructures Research, 2 , 24–32.
Gröger, G., Kolbe, T. H., Czerwinski, A., & Nagel, C. (2008). OpenGIS city geography markup language (CityGML) encoding standard – version 1.0.0. OGC Doc. No. 08–007r1.
Kelly, T., & Wonka, P. (2011). Interactive architectural modeling with procedural extrusions. ACM Transactions on Graphics, 30 (2), 14–28.
Kolbe, T. H., Gröger, G., & Plümer, L. (2008). CityGML – 3D city models and their potential for emergency response. In S. Zlatanova & J. Li (Eds.), Geospatial information technology for emergency response (pp. 257–274). London: Taylor & Francis.
Laycock, R. G., & Day, A. M. (2003). Automatically generating roof models from building foot-prints . Paper presented at the 11th International Conference in Central Europe on Computer Graphics, Visualization and Computer Vision (WSCG’ 03), Plzen – Bory, Czech Republic.
Lee, J. (2001). 3D data model for representing topological relations of urban features . Paper presented at the 21st Annual ESRI International User Conference, San Diego, CA, United States.
Lee, J. (2007). A three-dimensional navigable data model to support emergency response in microspatial built-environments. Annals of the Association of American Geographers, 97 (3), 512–529.
Lee, J., & Zlatanova, S. (2008). A 3D data model and topological analyses for emergency response in urban areas. In S. Zlatanova & J. Li (Eds.), Geospatial information technology for emergency response (pp. 143–168). London: Taylor & Francis.
OGC. (2005). Web 3D service. Discussion paper. Ref No. OGC 05–019. OSM. (2011a). OpenStreetMap. http://www.openstreetmap.org/ . Accessed November 7, 2011. OSM. (2011b). OpenStreetMapWiki. http://wiki.openstreetmap.org/ . Accessed November 7, 2011. OSM. (2011c). Proposed features/Building attributes. http://wiki.openstreetmap.org/wiki/
Proposed_features/Building_attributes . Accessed November 7, 2011. OSM-3D. (2011). OSM-3D in XNavigator. http://www.osm-3d.org . Accessed November 7, 2011.
1599 The Evolution of Geo-Crowdsourcing: Bringing Volunteered Geographic...
Over, M., Schilling, A., Neubauer, S., & Zipf, A. (2010). Generating web-based 3D city models from OpenStreetMap: The current situation in Germany. Computers, Environment and Urban Systems, 34 (6), 496–507.
Sarjakoski, T. (1998). Networked GIS for public participation – Emphasis on utilizing image data. Computers, Environment and Urban Systems, 22 (4), 381–392.
Schilling, A., & Goetz, M. (2010). Decision support systems using 3D OGC services and indoor routing – Example scenario from the OWS-6 testbed . Paper presented at the 5th 3D GeoInfo conference, Berlin, Germany.
Schilling, A., Over, M., Neubauer, S., Neis, P., Walenciak, G., & Zipf, A. (2009). Interoperable location based services for 3D cities on the web using user generated content from OpenStreetMap . Paper presented at the 27th urban data management symposium, Ljubljana, Slovenia.
Song, W., & Sun, G. (2010). The role of mobile volunteered geographic information in urban management . Paper presented at the 18th international conference on geoinformatics, Beijing, China.
Tagwatch. (2011). Tagwatch planet-latest. http://tagwatch.stoecker.eu/Planet-latest/En/tags.html . Accessed November 7, 2011.
Yang, P. P.-J., Putra, S. Y., & Li, W. (2007). Viewsphere: A GIS-based 3D visibility analysis for urban design evaluation. Environment and Planning B: Planning and Design, 34 (6), 971–992.
Ziegler, S. (2011). osm3d Viewer. http://www.osm3d.org . Accessed November 7, 2011. Zipf, A., Basanow, J., Neis, P., Neubauer, S., & Schilling, A. (2007). Towards 3D spatial data
infrastructures (3D-SDI) based on open standards – Experiences, results and future issues . Paper presented at the 3D GeoInfo07, ISPRS WG IV/8 International Workshop on 3D Geo-information: Requirements, acquisition, modelling, analysis, visualisation, Delft, Netherlands.