Embed Size (px)
Citation preview
Registered Charity Number 207890
Accepted Manuscript
This is an Accepted Manuscript, which has been through the RSC Publishing peer review process and has been accepted for publication.
Accepted Manuscripts are published online shortly after acceptance, which is prior to technical editing, formatting and proof reading. This free service from RSC Publishing allows authors to make their results available to the community, in citable form, before publication of the edited article. This Accepted Manuscript will be replaced by the edited and formatted Advance Article as soon as this is available.
To cite this manuscript please use its permanent Digital Object Identifier (DOI®), which is identical for all formats of publication.
More information about Accepted Manuscripts can be found in the Information for Authors.
Please note that technical editing may introduce minor changes to the text and/or graphics contained in the manuscript submitted by the author(s) which may alter content, and that the standard Terms & Conditions and the ethical guidelines that apply to the journal are still applicable. In no event shall the RSC be held responsible for any errors or omissions in these Accepted Manuscript manuscripts or any consequences arising from the use of any information contained in them.
www.rsc.org/molecularbiosystems
ISSN 1742-206X
1742-206X(2010)6:1;1-G
Top Quality Bioscience Journals
Take a look today!
www.rsc.org/journalsRegistered Charity Number 207890
New for 2010
MedChemComm - focusing on medicinal chemistry research, including new studies related to
biologically-active chemical or biochemical entities that can act as pharmacological agents with therapeutic
potential or relevance. www.rsc.org/medchemcomm
New for 2009
Integrative Biology - a journal focusing on quantitative multi-scale biology using enabling technologies and tools to exploit the convergence of biology with physics, chemistry, engineering, imaging and informatics. www.rsc.org/ibiology
Metallomics - a journal covering the research fields related to metals in biological, environmental and clinical systems. www.rsc.org/metallomics
Molecular BioSystems - a journal with a focus on the interface between chemistry and the -omic sciences and systems biology. www.molecularbiosystems.org
Organic & Biomolecular Chemistry - an international journal covering the breadth of synthetic, physical and biomolecular chemistry. www.rsc.org/obc
Natural Product Reports (NPR) - a critical review journal which stimulates progress in all areas of natural products research. www.rsc.org/npr
Photochemical & Photobiological Sciences - publishing high quality research on all aspects of photochemistry and photobiology, encouraging synergism between the two areas. www.rsc.org/pps
Volume 6 | N
umber 1 | 2010
Molecular B
ioSystems
Pages 1–276
www.molecularbiosystems.org Volume 6 | Number 1 | January 2010 | Pages 1–276
PAPERDieter Willbold et al.Competitively selected protein ligands pay their increase in specificity by a decrease in affinity
METHODThomas Kodadek et al.Rapid identification of orexin receptor binding ligands using cell-based screening accelerated with magnetic beads
Indexed in
MEDLINE!
mbs006001_Cover.indd 5-1 26/11/2009 15:05:22
MolecularBiosystems
View Article OnlineView Journal
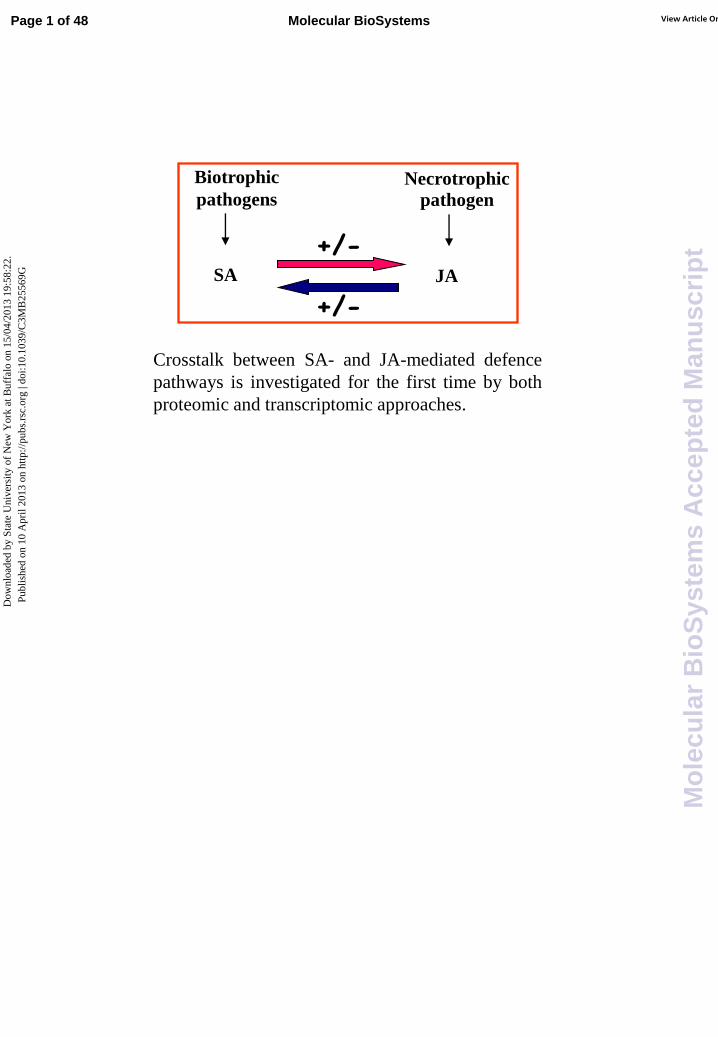
Biotrophic
pathogens
SA
Necrotrophic
pathogen
JA
+/-
+/-
Crosstalk between SA- and JA-mediated defence
pathways is investigated for the first time by both
proteomic and transcriptomic approaches.
Page 1 of 48 Molecular BioSystems
Mo
lecu
lar
Bio
Sys
tem
s A
ccep
ted
Man
usc
rip
t
Dow
nloa
ded
by S
tate
Uni
vers
ity o
f N
ew Y
ork
at B
uffa
lo o
n 15
/04/
2013
19:
58:2
2.
Publ
ishe
d on
10
Apr
il 20
13 o
n ht
tp://
pubs
.rsc
.org
| do
i:10.
1039
/C3M
B25
569G
View Article Online
1
Crosstalk between salicylic acid and jasmonate in Arabidopsis investigated by an integrated
proteomic and transcriptomic approach
Silvia Proietti, Laura Bertini, Anna Maria Timperio, Lello Zolla, Carlo Caporale and Carla Caruso*
Department of Ecological and Biological Sciences, Università della Tuscia, Via S. Camillo De
Lellis, Viterbo 01100, Italy
*(�) Corresponding author: Prof. Carla Caruso; mailing address: Department of Ecological and
Biological Sciences, Università della Tuscia, Via S. Camillo De Lellis, 01100 Viterbo, Italy. Phone:
+39 0761357330; Fax: +39 0761357242; E-mail: [email protected]
Page 2 of 48Molecular BioSystems
Mo
lecu
lar
Bio
Sys
tem
s A
ccep
ted
Man
usc
rip
t
Dow
nloa
ded
by S
tate
Uni
vers
ity o
f N
ew Y
ork
at B
uffa
lo o
n 15
/04/
2013
19:
58:2
2.
Publ
ishe
d on
10
Apr
il 20
13 o
n ht
tp://
pubs
.rsc
.org
| do
i:10.
1039
/C3M
B25
569G
View Article Online
2
Abstract
Resistance conferred by biotrophic pathogens often requires salicylic acid (SA) signaling,
whereas necrotrophic pathogens or wounding mainly activate the jasmonate/ehtylene (JA/ET)-
dependent pathway. Crosstalk connections between these two independent signaling pathways may
lead to a synergistic or antagonistic behavior.
In order to shed some light on the crosstalk between these two hormones in Arabidopsis plants, a
proteomic approach combined with a transcriptomic analysis has been used to identify molecules
differentially expressed upon single or simultaneous treatment with both phytohormones. Twenty-
five nonredundant differential proteins were revealed upon treatment with SA or JA alone or in
combination, which are involved in general metabolic processes as well as in response to stress, in
developmental process, in protein metabolism and transport.
Interestingly, gene expression study, carried out on genes involved in oxidative stress and in
biotic and/or abiotic stresses, highlighted the correspondence between proteomic and transcriptomic
approaches, here performed by RT-PCR. Our data clearly demonstrate that almost all gene/proteins
involved in oxidative stress as well as in biotic and/or abiotic stresses are mainly induced upon JA
and only a few of them are overexpressed upon SA treatment. Moreover, we found that
substantially negative crosstalk is established upon the combined action of the two hormones and
that generally SA exerts a negative crosstalk over the JA pathway.
Our study corroborate the hypotesis that combination of both phytohormones induce
reprogramming of the plant transcriptome, but at same time highlights the presence of a complex
network of signaling that is far to be completely elucidated.
Keywords
Phytohormones crosstalk; Arabidopsis; proteomics; transcriptomics.
Page 3 of 48 Molecular BioSystems
Mo
lecu
lar
Bio
Sys
tem
s A
ccep
ted
Man
usc
rip
t
Dow
nloa
ded
by S
tate
Uni
vers
ity o
f N
ew Y
ork
at B
uffa
lo o
n 15
/04/
2013
19:
58:2
2.
Publ
ishe
d on
10
Apr
il 20
13 o
n ht
tp://
pubs
.rsc
.org
| do
i:10.
1039
/C3M
B25
569G
View Article Online
3
Introduction
The first detectable response of a plant cell to an invading microorganism is the programmed cell
death (PCD) at the infection site, which is part of the so-called hypersensitive response (HR), and is
generally recognized by the presence of brown lesions at the injury site. The HR deprives the
pathogen of nutrients confining its growth to a small region of the plant. Host cell necrosis is
accompanied by a whole series of events, including changes in oxidative metabolism, accumulation
of toxic compounds and lignifications of cell walls. The initial responses of pathogen-invaded or
elicitor-treated plant cells occur within few minutes and are rapidly followed by local gene
activation. They include rapid and transient changes in inorganic ion fluxes across plasma
membrane, the accumulation of reactive oxygen species (ROSs) referred to as oxidative burst and
changes in the phosphorylation status of various proteins, all of which have been associated with
intracellular signal transduction mechanisms1,2
.
Many studies have shown that the HR is accompanied not only by biochemical changes at the
site of infection but also at distant site in the plant. This form of induced resistance is referred to as
systemic acquired resistance (SAR)3,4
, and this mechanism can be compared to immunization in
animals and humans. Characterisation of SAR in a variety of plant species has suggested the
existence of a complex signaling network that involves many diffusible factors known as second
messengers. Among the best studied endogenous signaling molecules are salicylic acid (SA), nitric
oxide (NO), jasmonic acid (JA) and ethylene (ET), phytohormones that primarily regulate the
protective responses of plant against biotic and abiotic stresses. The pivotal role of plant hormones
in the regulation of plant defense is well documented5-7
. Resistance conferred by biotrophic
pathogens often requires SA signaling, whereas necrotrophic pathogens or wounding mainly
activate the JA/ET-dependent pathway8. Thus, at least two different signal transduction pathways
can be distinguished, either SA- or JA/ET-dependent, which are turned on in response to pathogen
attack9. Large-scale transcriptomic analyses using DNA microarray technology, strongly support
the existence of such a complex signaling crosstalk between different pathways10,11
. Crosstalk
Page 4 of 48Molecular BioSystems
Mo
lecu
lar
Bio
Sys
tem
s A
ccep
ted
Man
usc
rip
t
Dow
nloa
ded
by S
tate
Uni
vers
ity o
f N
ew Y
ork
at B
uffa
lo o
n 15
/04/
2013
19:
58:2
2.
Publ
ishe
d on
10
Apr
il 20
13 o
n ht
tp://
pubs
.rsc
.org
| do
i:10.
1039
/C3M
B25
569G
View Article Online
4
connections between these two independent signaling pathways may lead to a synergistic or
antagonistic behavior 12,13,6,14,15
.
Among phytohormones involved in signal transduction pathways are also counted abscisic acid
(ABA), auxins and gibberellins, mainly involved in responses to abiotic stresses. In particular ABA
has been a subject of intensive studies that demonstrated its involvement in drought, low
temperature and osmotic stresses. It has been reported that ABA acts as negative regulator of
disease resistance16
; in particular, ABA and ET interact, mostly antagonistically, in several
developmental processes and in vegetative tissues17,18
. In addition, it has been reported that ABA
acts as antagonist also in SA-mediated signal transduction pathway19
. These findings suggest that
all signal pathways mediated from plant phytohormones are able to interact and to cooperate in the
development of plant defence mechanisms. Thus, a crosstalk between biotic and abiotic stress
signaling may converge in similar defence response and the presence of different pathways of
defence response offers a great regulatory potential that contribute to regulate both abiotic stresses
and disease resistance 20-23
. To date, the mechanisms that underlie this crosstalk are still unknown
and many laboratories are engaged in this field of research.
One of the best studied examples of defence-related signal crosstalk is the antagonistic
interaction between the SA and JA, dominant messenger signals in local and systemic induced
defence signaling24-26
. In the last years a highly interconnected signaling network between the
above phytohormones has been reported using mRNA expression profiling27,28
. However,
transcriptional changes do not reflect the complete cellular regulatory processes, since post-
transcriptional processes are not taken into account. Thus, complementary approaches such as
proteome-based expression profiling are needed to obtain a full picture of the regulatory elements in
plant defence response.
Proteome analysis is becoming a powerful tool in the functional characterization of plants. Due
to the availability of vast nucleotide sequence information and based on the progress achieved in
Page 5 of 48 Molecular BioSystems
Mo
lecu
lar
Bio
Sys
tem
s A
ccep
ted
Man
usc
rip
t
Dow
nloa
ded
by S
tate
Uni
vers
ity o
f N
ew Y
ork
at B
uffa
lo o
n 15
/04/
2013
19:
58:2
2.
Publ
ishe
d on
10
Apr
il 20
13 o
n ht
tp://
pubs
.rsc
.org
| do
i:10.
1039
/C3M
B25
569G
View Article Online
5
sensitive and rapid protein identification by mass spectrometry, proteome approaches open up new
perspectives to analyze the complex functions of model plants and crop species at different levels.
Due to the availability of complete genomic sequence information and of large mutant
collections, a number of recent proteome studies have focused on Arabidopsis as a model plant. For
instance, the effect of SA in the establishment of early defence mechanisms in Arabidopsis has been
investigated using this approach29
. The NaCl stress-responsive proteins30
, the fungal elicitor-
induced proteins31
as well as the insect herbivore Plutella xylostella-induced proteins32
in
Arabidopsis have been also investigated with this methodology. Nonetheless, the interplay of more
phytohormones has not been investigated up to now using proteomics.
2D-PAGE, coupled with MS/MS, is one of the most powerful and effective techniques to
undertake proteomic analysis and to identify differentially expressed proteins offering highly
reproducible resolution for protein separation. Indeed, recent advances in mass spectrometry permit
analysis of low amounts of proteins separated in 2D gels. In order to shed some light on the
crosstalk between SA and JA in Arabidopsis, we have used 2D-PAGE coupled with MS/MS to
identify the up- or down-regulated Arabidopsis leaf proteins upon single or simultaneous treatment
with both phytohormones. Furthermore, this study demonstrates the power of 2D nano-HPLC in
combination with nano-electrospray iontrap MS/MS for comparative proteomic studies. In addition,
gene expression studies combined with the results obtained with the proteomic approach have
shown that there is a good correlation between the two experimental procedures.
Results and Discussion
2D protein analysis
It is well recognized that SA and JA induce several effects on plant development and disease. In
order to shed some light on the crosstalk between these two hormones in Arabidopsis plants, a
proteomic approach combined with a transcriptomic analysis has been used to identify
proteins/genes differentially expressed upon treatments with SA or JA alone and in combination. To
Page 6 of 48Molecular BioSystems
Mo
lecu
lar
Bio
Sys
tem
s A
ccep
ted
Man
usc
rip
t
Dow
nloa
ded
by S
tate
Uni
vers
ity o
f N
ew Y
ork
at B
uffa
lo o
n 15
/04/
2013
19:
58:2
2.
Publ
ishe
d on
10
Apr
il 20
13 o
n ht
tp://
pubs
.rsc
.org
| do
i:10.
1039
/C3M
B25
569G
View Article Online
6
this end, five-week-old Col-0 Arabidopsis plants have been separately treated with both
phytohormones by dipping foliar rosette into solution of SA or JA. Moreover, the combined effect
of SA and JA has been also evaluated by dipping foliar rosette into solution containing both
chemical inducers as reported in Material and Methods section. Plants of the same age were dipped
into distilled water and used as a control. Total soluble proteins prepared from treated leaves as well
as from control plants were separated by 2D gel electrophoresis and, following Coomassie brilliant
blue staining, protein patterns were characterized by image analysis using Progenesis SameSpots
software. The protein maps produced in triplicate from three independent experiments showed a
high level of reproducibility. Using the image analysis software, the 2D representative maps of
protein extracted from SA- (Fig. 1a), JA- (Fig. 1b) and both hormones-treated plants (Fig. 1c) as
well as the 2D representative control map (Fig. 1d) were analyzed. Approximately 700 spots could
be detected on each Coomassie brilliant blue-stained gel and about 500 protein spots matched
between control and sample gels in three independent experiments. Fig. 1e shows the reference map
derived from computerized image analysis performed using Progenesis SameSpots software
showing the protein spots analyzed by mass spectrometry. Quantitative image analysis revealed a
total of about 84 protein spots that changed their abundance (volume %) upon treatments with SA
or JA alone as well as upon treatment with the combination of the two hormones with respect to the
control. We decided to focus our attention on protein spots over- or under-expressed by a factor of
four as compared to the control. On this basis, we found 41 protein spots over-expressed at least
upon one treatment. On the other hand, the level of under-expression was always found less than
four-fold with respect to the control. For this reason only the over-expressed proteins were further
investigated.
Numbers and arrows in panels a, b and c of Fig.1 indicate analyzed spots corresponding to
proteins overexpressed at least four- fold with respect to the control. Differentially abundant spots
(indicated with numbers in the reference map showed in Fig. 1e) were excised from the gels and
digested by trypsin. Peptide mixtures were then analyzed by LC-ESI-MS/MS for protein
Page 7 of 48 Molecular BioSystems
Mo
lecu
lar
Bio
Sys
tem
s A
ccep
ted
Man
usc
rip
t
Dow
nloa
ded
by S
tate
Uni
vers
ity o
f N
ew Y
ork
at B
uffa
lo o
n 15
/04/
2013
19:
58:2
2.
Publ
ishe
d on
10
Apr
il 20
13 o
n ht
tp://
pubs
.rsc
.org
| do
i:10.
1039
/C3M
B25
569G
View Article Online
7
identification. From forty-one gel plugs excised, twenty-eight proteins were successfully identified
by Mascot database searches of the full NCBI protein database.
Fig. 2 shows the expression level of the 28 identified proteins calculated relatively to the control
for each treatment. Fig. 2a shows the expression level of nine protein spots which were found to be
overexpressed by JA treatment but repressed by SA (spots number: 173, 179, 187, 193, 199, 299,
300, 459 and 468), indicating a negative crosstalk of SA over the JA pathway. Eight protein spots
were overexpressed by SA treatment but repressed by JA (spots number: 191, 204, 205, 278, 296,
302, 340 and 523), indicating a negative crosstalk of JA over the SA pathway. Moreover, Fig. 2c
shows seven protein spots overexpressed at least four-fold upon single treatment with SA or JA, but
repressed by a combination of both (spots number: 177, 200, 206, 213, 214, 348 and 423),
indicating antagonistic crosstalk between the two hormones. Finally, Fig. 2d shows the only four
protein spots inducible exclusively upon the combined treatment (spots number: 106, 375, 380 and
475) that suggest a synergistic behavior of SA- and JA-mediated response.
Spot identification by mass spectrometry
The twenty-eight proteins that were successfully identified by Mascot analysis are shown in
Table 1 together with their classification, protein spot number, gene code, identification parameters
and fold change differences among the different treatments. .
Fold changes are based on mean percentage volumes of each spot. It is worthwhile to mention
that two proteins were present on the gel in more than two spots, suggesting the existence of
alternative post-translational modifications or degradation. All proteins have been grouped in four
classes on the basis of their function or their involvement in metabolic response.
Photosynthesis
Rubisco large subunit (AtCg00490) was identified in three protein spots (177, 200, 205). Further
examination of electrophoresis patterns indicated that the inferred isoelectric point values of these
spots differed, due probably to the existence of isoforms or post-translational modification. Two
protein spots (177 and 200), having identical relative mass and differing only moderately in their pI
Page 8 of 48Molecular BioSystems
Mo
lecu
lar
Bio
Sys
tem
s A
ccep
ted
Man
usc
rip
t
Dow
nloa
ded
by S
tate
Uni
vers
ity o
f N
ew Y
ork
at B
uffa
lo o
n 15
/04/
2013
19:
58:2
2.
Publ
ishe
d on
10
Apr
il 20
13 o
n ht
tp://
pubs
.rsc
.org
| do
i:10.
1039
/C3M
B25
569G
View Article Online
8
(4.3 and 4.25, respectively), were found to be over-expressed upon SA treatment with similar fold
change (around 14 fold induction). On the contrary, the protein spot 205, showing a pI value of 4.8,
was found to be less induced upon SA treatment (4,95 fold induction). We could speculate that SA
is more effective in the induction of the more acidic isoforms of rubisco large subunit than the less
acidic one. Moreover, rubisco isoforms were subjected to a negative crosstalk since the combined
treatment with the two hormones produces an inhibition of the protein expression with respect to
the single treatments.
One more enzyme involved in photosynthesis, namely ribulose bisphosphate carboxylase small
chain 1A (At1g67090, spot 475), was found. It is worth highlighting that neither SA or JA alone
were effective in inducing this protein, but the combined treatment with these hormones is able to
induce its expression by 7,12 fold. These findings suggest that the protein is over-expressed only
during a positive crosstalk between the two signal transduction pathways.
Proteins involved in ATP synthesis
Chloroplast ATP synthase CF1 subunit alpha (AtCg00120) was identified in only one protein
spot (spot 193), whereas the beta subunit (AtCg00480) was identified in two protein spots, namely
213 and 214. It has been recently reported that among proteins responsive to toxic volatile organic
compound (VOC) in Arabidopsis is ATP synthase CF133
. Like other abiotic stress responses, the
VOC-mediated process is possibly linked to the hormonal-mediated stress responses. In fact,
ethylene has been regarded as the best candidate among plant hormones that might play a pivotal
role in the stress response induced by VOC34
. In our experimental conditions, the level of ATP
synthase CF1 alpha subunit was found to be 10,34 fold increased upon JA treatment that follows the
same signaling pathway of ethylene. Interestingly, the protein was no longer induced during the
combined treatment of JA and SA suggesting an antagonistic crosstalk by SA.
Two protein spots accounting for ATP synthase CF1 beta subunit were identified which differs
slightly in their pI. In particular, spot 213, showing a pI of 3.95, was induced by JA 19,87 fold and
by SA 14,76 fold whereas the more acidic isoform (spot 214, pI 3.6) showed 22,14 and 25,70 fold
Page 9 of 48 Molecular BioSystems
Mo
lecu
lar
Bio
Sys
tem
s A
ccep
ted
Man
usc
rip
t
Dow
nloa
ded
by S
tate
Uni
vers
ity o
f N
ew Y
ork
at B
uffa
lo o
n 15
/04/
2013
19:
58:2
2.
Publ
ishe
d on
10
Apr
il 20
13 o
n ht
tp://
pubs
.rsc
.org
| do
i:10.
1039
/C3M
B25
569G
View Article Online
9
induction upon JA or SA treatment, respectively. It is also interesting to highlight that the combined
treatment of the two hormones resulted in a negative crosstalk as evidenced by low level of fold
change (2,02 for spot 213 and 4,79 for spot 214) with respect to the control.
Phosphoglycerate kinase (Atlg79550) was identified as spot 523. Phosphoglycerate kinase
(PGK) transfers a phosphate group from 1,3-bisphosphglycerate to ADP forming ATP and 3-
phopshoglycerate. This reaction is essential in most cells for the generation of ATP in aerobes, for
fermentation in anaerobes and for carbon fixation in plants. It has been reported that PGK levels are
greatly enhanced in Arabidopsis germinating seed treated with SA29
. According with this evidence,
we found that spot 523 is increased 6,91 fold in Arabidopsis plant treated with SA, whereas it is not
influenced by JA. However, the protein was no longer induced during the combined treatment of JA
and SA suggesting that JA is responsible of an antagonistic crosstalk. Unfortunately, it is not
possible at the moment to unravel the SA-transduction pathways involved in the central metabolism
regulation, nevertheless it is interesting to highlight that JA seems to be not involved in such a
regulation.
Oxidative stress
Abiotic stresses can cause many metabolic changes and are known to increase ROS levels in
plant tissue35,36
producing several changes in many biological processes. For instance, H2O2, one of
the most studied marker of oxidative stress, may be involved in signaling by other hormone or
stress responses37-40
. As shown in Table 1, several proteins involved in oxidative stress have been
identified. In particular, 14 protein spots were found to be involved in the production of ROS or
their detoxification as well as protein involved in central metabolism or photorespiration following
oxidative stress. Among them are two glycolate oxidase (GOX) isoforms, namely MOA2.2
(At3g14420, spot 299) and MOA2.13 (At3g1445, spot 300), that are peroxisomal enzymes that
catalyze the conversion of glycolate and oxygen to glyoxylate and hydrogen peroxide which is
related to photorespiration41
. Both isoforms were found to be highly induced by JA with respect to
the control (8,87 and 14,59 fold change, respectively), but they were subjected to a negative
Page 10 of 48Molecular BioSystems
Mo
lecu
lar
Bio
Sys
tem
s A
ccep
ted
Man
usc
rip
t
Dow
nloa
ded
by S
tate
Uni
vers
ity o
f N
ew Y
ork
at B
uffa
lo o
n 15
/04/
2013
19:
58:2
2.
Publ
ishe
d on
10
Apr
il 20
13 o
n ht
tp://
pubs
.rsc
.org
| do
i:10.
1039
/C3M
B25
569G
View Article Online
10
crosstalk by SA on JA pathway. It is well known that methyl jasmonate treatment of tomato plants
results in the accumulation of hydrogen peroxide that in turns acts as second messenger leading to
the induction of defense genes42
. According with this finding, we could suggest that the JA-
dependent increased level of H2O2 might be ascribed to increased levels of GOX. It is worthwhile to
mention that also Arabidopsis plants overexpressing GOX in chloroplasts accumulate both
glyoxylate and hydrogen peroxide, thus making the GOX plants a challenging model in which to
study the action of plastid-produced H2O2 as a signal molecule43
. Glyoxylate produced by GOX is
one of the two substrates of glutamate:glyoxylate amino transferase (GGAT) that is one of the best
studied enzyme involved in photorespiration in leaf peroxisome44
. Photorespiratory transamination
of glyoxylate, which is mediated by GGAT and serine glyoxylate aminotransferase (SGAT), is
believed to play an important role in the biosynthesis and metabolism of major amino acids. Our
results demonstrated the presence of GGAT1 in spot 179 that is induced by JA (6,01 fold change)
and it is repressed in combination of both phytohormones, displaying to be involved in an
antagonistic crosstalk by SA on JA pathway. Moreover, it has been recently reported that
glyoxylate may be converted in glycine also through the action of the gamma-aminobutirrate
transaminase (GABA-T), suggesting a potential interaction between GABA metabolism and
photorespiration45
. In this study we found GABA-T (At3g22200) in spot 191 that is induced both
by JA (2,97 fold change) and SA (5,27 fold change) when used alone. On the contrary, our results
highlight an antagonistic behavior when the two hormones were used in combination.
As mentioned above, an increased level of hydrogen peroxide is produced during respiration;
H2O2 is then detoxified by the action of the peroxisomal catalase which catalyses the breakdown of
H2O2 in water and oxygen. Two protein spots were found to be associated with catalase, namely
spot 187 (catalase3, CAT3, At1g20620) and spot 199 (catalase2, CAT2, At4g35090). According
with the expression induction of glycolate oxidase, both CAT2 and CAT3 were found to be induced
by JA (16,68 and 8,46 fold induction, respectively).
It is well documented that high levels of ROSs lead to cellular damage and are involved in
Page 11 of 48 Molecular BioSystems
Mo
lecu
lar
Bio
Sys
tem
s A
ccep
ted
Man
usc
rip
t
Dow
nloa
ded
by S
tate
Uni
vers
ity o
f N
ew Y
ork
at B
uffa
lo o
n 15
/04/
2013
19:
58:2
2.
Publ
ishe
d on
10
Apr
il 20
13 o
n ht
tp://
pubs
.rsc
.org
| do
i:10.
1039
/C3M
B25
569G
View Article Online
11
programmed cell death (PCD) at the site of infection46,47
. In particular, PCD events are best
described during incompatible plant-pathogen interactions that form the basis for HR48
. During
evolution plants developed fine tune mechanisms to cope with temporary shift in the intracellular
redox state. In particular, photorespiration forms part of the dissipatory mechanisms of plants to
minimize production of ROS mitigating photooxidative damage49
. Among the enzymes involved in
such a pathway is also serine hydroxymethyl transferase (SHMT) that plays a crucial role in
controlling cell damage provoked by biotic and abiotic stresses50
. Our results showed that SHMT 1
(spot 173, At4g37930) and SHMT 4 (spot 206, At4g13930) are both induced by JA with 4,84 and
15,02 fold change, respectively. Interestingly, SHMT 1 is induced only by JA, whereas SHMT 4
was found to be induced also by SA (11,20 fold induction). In our experimental conditions both
enzymes are subjected to a negative crosstalk.
Other enzymes involved in mechanisms of attenuation of antioxidant response associated with
basal defense are carbonic anhydrases (CAs). These enzymes play a role in carbon fixation in C4
photosynthetic plants and in particular chloroplast CAs are recognized to expedite CO2 diffusion
during the first steps of Calvin cycle51
. Moreover, chloroplast CA functions as SA-binding protein 3
exhibiting antioxidant activity and plays a role in the HR defense response52
. Recently, it has been
reported that CAs are induced in Plutella-resistant inbred lines of Arabidopsis highlighting their
involvement in limiting ROS damage32
. In our experiments we identified two CA proteins, one
being the product of the At3g01500 gene coding for the chloroplast CA1(spot 468), whereas the
other was the product of the At5g14740 gene, coding for a putative CA2 (spot 459). Both proteins
are induced upon JA treatment (9,63 and 5,2 fold induction, respectively), are insensitive to SA
treatment and are subjected to a negative crosstalk.
One more enzyme that plays a role in mediating oxidative stress and regulating HR cell death is
aconitase (ACO2), found in spot 106. In animals, aconitase displays two different functions: in the
presence of an iron-sulfur cluster in its catalytic center it displays enzymatic activity whereas in its
absence it acquires the ability to bind RNA regulating the stability or translatability of certain
Page 12 of 48Molecular BioSystems
Mo
lecu
lar
Bio
Sys
tem
s A
ccep
ted
Man
usc
rip
t
Dow
nloa
ded
by S
tate
Uni
vers
ity o
f N
ew Y
ork
at B
uffa
lo o
n 15
/04/
2013
19:
58:2
2.
Publ
ishe
d on
10
Apr
il 20
13 o
n ht
tp://
pubs
.rsc
.org
| do
i:10.
1039
/C3M
B25
569G
View Article Online
12
transcripts. Recently, it has been reported that one member of the aconitase family is able to
specifically bind the 5’ UTR of superoxide dismutase CSD2 (Atg28190) in vitro, affecting its
transcription level53
. These finding corroborate the hypothesis that aconitase mediates resistance to
oxidative stress and regulate cell death by modulating the expression of genes involved in
intracellular ROS level control. Interestingly, in our experimental condition, aconitase 2
(At4g26970, spot 106) is up-regulated upon the combined treatment with SA and JA (4,87 fold
induction), whereas it is not affected by the single hormone treatment. In this case, the protein
expression is significantly induced when a synergistic interaction occurs between the two different
transduction pathways. Moreover, these findings corroborate previous studies highlighting the
hormone-mediated oxidative stress54
.
On the basis of the results presented above, comes evident the role of both SA or JA in
stimulating defense responses related to oxidative stress. Among them are also the induction of
proteins associated to lipid globule, known as fibrillin. Fibrillins are lipid-binding proteins of
plastids that are induced under abiotic stress conditions. Very recently, it has been reported that
Arabidopsis plants with reduced levels of fibrillins are impaired in long-term acclimation to
environmental constrain such as photooxidative stress55
. As a result, their photosynthetic apparatus
shows an abnormal granal and stromal membrane arrangement causing inefficient protection.
Interestingly, all phenotypic effects of lower fibrillin levels were abolished by JA treatment
suggesting a new physiological role for this hormone, such as acclimation of chloroplasts. In
addition, evidence that stress-related JA biosynthesis is conditioned by the accumulation of fibrillin
was also reported55
. According with these results, we found fibrillin in spot 278 (At2g35490) that is
overexpressed upon JA treatment (5,75 fold induction). It is noteworthy that also SA is able to
induce fibrillin expression to an higher extent (10,76 fold induction), while the combined action of
two hormones shows the levels of expression of fibrillin comparable to those observed after
treatment with JA, suggesting a negative crosstalk by SA.
Finally, two proteins involved in disease resistance and antioxidant metabolism were found in
Page 13 of 48 Molecular BioSystems
Mo
lecu
lar
Bio
Sys
tem
s A
ccep
ted
Man
usc
rip
t
Dow
nloa
ded
by S
tate
Uni
vers
ity o
f N
ew Y
ork
at B
uffa
lo o
n 15
/04/
2013
19:
58:2
2.
Publ
ishe
d on
10
Apr
il 20
13 o
n ht
tp://
pubs
.rsc
.org
| do
i:10.
1039
/C3M
B25
569G
View Article Online
13
spots 340 and 380, namely ankyrin repeat-containing protein 2 (AKR2) (At4g35450) and
peroxisomal NAD-malate dehydrogenase (PMDH2) (At5g09660), respectively. Reduced
expression of AKR2 results in activation of HR and higher production of H2O2, similar to the
response of plants to pathogen infection. Moreover, AKR2 also interact with the ascorbate
peroxidase 3 that scavenges H2O2 in plant cell. These findings suggest that AKR2 is probably
involved in the regulation of antioxidant metabolism that is shared by both disease resistance and
stress response56
. The protein is highly inducible by SA (10,75 fold change) but is also induced by
JA, even to a lesser extent (5,86 fold change). Noteworthy, the combined treatment with the two
hormones results in a further decrease of AKR2 expression level (3,48 fold change) suggesting a
negative crosstalk between the two different transduction pathways. On the contrary, the combined
treatment of the two signal molecules results in the induction of PMDH2 expression (6,49 fold
induction), whereas the single treatments were totally ineffective. In this case a positive crosstalk
can be inferred to affect the protein expression.
Biotic and/or abiotic stress
Plant ability to cope with environmental stresses is essential for their survival. During evolution
plants have developed a complex variety of defence mechanisms that activate a highly coordinated
resistance response upon recognition of a potential risk. Signal transduction pathways leading to
defence are highly interconnected and often act simultaneously regulating gene expression via
synergistic or antagonistic actions. Besides SA, JA, ET and ABA, also the less studied hormones
such as brassinosteroid (BR) and gibberellic acid (GA) are involved in signaling cascade triggered
by biotic or abiotic stresses57,58
. It has been recently reported that BR-mediated stress tolerance in
Arabidopsis shows interactions with ABA, ET and SA pathways59
. How BR regulates gene
expression is currently understood for only a small number of genes. However, the involvement of a
plasma membrane-localized leucine-rich repeat receptor-like kinase (LRR-RLK), named BRI1, has
been widely recognized59
. In addition, it has been demonstrated that a plant homolog of TGF-beta
receptor interacting protein 1 (TRIP1) can be phosphorylated in vitro by BRI1 and that it is
Page 14 of 48Molecular BioSystems
Mo
lecu
lar
Bio
Sys
tem
s A
ccep
ted
Man
usc
rip
t
Dow
nloa
ded
by S
tate
Uni
vers
ity o
f N
ew Y
ork
at B
uffa
lo o
n 15
/04/
2013
19:
58:2
2.
Publ
ishe
d on
10
Apr
il 20
13 o
n ht
tp://
pubs
.rsc
.org
| do
i:10.
1039
/C3M
B25
569G
View Article Online
14
regulated by BR59
. In this study we prove evidence that transcript level of TRIP1, found in spot 302
(At2g46280), is induced by SA (4,44 fold induction) reinforcing the idea that BR and SA
transduction pathways may have some players in common.
As mentioned above, GA pathway plays crucial roles in plant growth and development as well as
stress responses. It has been recently reported that exogenous application of GA3 is able to reverse
the inhibitory effect of different stress conditions in seed germination and seedling establishment
and also increases SA biosynthesis, suggesting that GAs are implicated in plant responses to abiotic
stress by modulating SA levels58
. Among the protein overexpressed by SA treatment is calreticulin
1b (CRT1b), found in spot 204 (At1g09210), which belongs to a protein family of still poor
understood physiological function. Calreticulin has been shown to be involved in plant growth and
development as well as biotic and abiotic stress response. In fact, it has been reported that it is
involved in response to drought stress in wheat60
and in ABA-induced salt tolerance in potato61
.
Calreticulin is also overexpressed in response to pathogen attack62
as well as upon TMV infection63
.
Moreover, CRT gene expression is regulated by exogenous application of GA in barley aleuronic
cells64
indicating that crosstalk between CRT-mediated pathway and phytohormones-dependent
signaling might be one of the major mechanism triggering plant responses to different stresses.
These findings are in agreement with our results highlighting that CRT1b is induced by SA (4,26
fold change) that mimics biotic stress mediated by biotrophic pathogens and to JA (2,95 fold
change) that mimics biotic stress mediated by necrotrophic pathogen and insects as well as abiotic
stress.
As already stated above, ABA is not only able to regulate essential growth and developmental
processes in plants but it also plays an important role in freezing tolerance highlighting its
involvement in abiotic stresses. In our work we evidenced two proteins highly regulated by ABA:
the chloroplast RNA binding (CRB) protein, found in spot 296, and a NAD dependent
epimerase/dehydratase, found in spot 423. RNA binding proteins have been described as
component of ABA signaling during germination and drought tolerance65
. Besides these functions,
Page 15 of 48 Molecular BioSystems
Mo
lecu
lar
Bio
Sys
tem
s A
ccep
ted
Man
usc
rip
t
Dow
nloa
ded
by S
tate
Uni
vers
ity o
f N
ew Y
ork
at B
uffa
lo o
n 15
/04/
2013
19:
58:2
2.
Publ
ishe
d on
10
Apr
il 20
13 o
n ht
tp://
pubs
.rsc
.org
| do
i:10.
1039
/C3M
B25
569G
View Article Online
15
CRB proteins mediate changes in mRNA synthesis, transport, translation and degradation. In
particular, chloroplast CRB proteins play an important role in flowering control and light-regulation
of protein supply in chloroplasts66
. In our work, CRB protein (At1g09340) was found to be induced
by SA (5,10 fold induction) but its expression was not influenced by JA. Interestingly, the
simultaneous treatment with the two phytohormones suppresses the SA-mediated enhancement,
suggesting a negative crosstalk of JA on SA. A NAD-dependent epimerase/dehydratase was found
to be induced by either JA (6,3 fold induction) or SA (7,78 fold induction), but its expression level
remains almost unchanged with respect to the control when the two hormones were used in
combination. In this case we can speculate that the two transduction pathways negatively influence
each others. It is well recognized that NAD-dependent epimerase/dehydratase are related to a Small
Ubiquitin-like Modifier (SUMO) conjugating enzyme that is a component of the sumoylation
pathway in Arabidopsis67
. It is worthwhile to mention that sumoylation is implicated in ABA-
mediated inhibition of root growth68
. Moreover, it has been proposed that regulation of the
sumoylation-dependent ABA signaling pathway is possibly achieved by tyrosine phosphorylation69
.
On the basis of our results and those reported in the literature we can hypothesize that ABA, JA and
SA signaling pathways may have some player in common. However, how these signals interact
each other remains an unanswered question.
As reported in Fig. 2, protein spot 348 (At4g02450) is by far the protein that undergoes the largest
change in expression following treatment with SA, exhibiting 166 fold induction. A substantial
increase in its levels of expression is also reported after treatment with JA (47.5 fold induction). It is
interesting to note that the combined treatment with the two hormones reduces the levels of protein
expression compared to those seen after treatment with individual hormones (29.4 fold induction).
As reported in Table 1, MASCOT analysis revealed the presence of a HSP20-like chaperone in spot
348. Heat shock proteins are molecular chaperones that regulate the folding, localization,
accumulation, and degradation of protein molecules in both plant and animal species70
. The
pathways leading to the elucidation of the molecular mechanisms of HSP20 induction are still far
Page 16 of 48Molecular BioSystems
Mo
lecu
lar
Bio
Sys
tem
s A
ccep
ted
Man
usc
rip
t
Dow
nloa
ded
by S
tate
Uni
vers
ity o
f N
ew Y
ork
at B
uffa
lo o
n 15
/04/
2013
19:
58:2
2.
Publ
ishe
d on
10
Apr
il 20
13 o
n ht
tp://
pubs
.rsc
.org
| do
i:10.
1039
/C3M
B25
569G
View Article Online
16
from being fully understood, but involve temperature perception mechanisms coupled with other
signal transduction pathways triggered by abiotic signals71
. Besides their chaperone activity, it is
possible that HSP20 limit damage resulting from accumulation of reactive oxygen species, which
are generated under a wide range of stress conditions72
. For instance, there is evidence that HSPs
may protect against reactive oxygen species in both plant and animal species73
. Moreover, it has
been reported that several HSP20 genes are induced in Arabidopsis upon wounding which usually
follows similar transduction pathway as JA74
. This hypothesis results very intriguing considering
the highly interconnected mechanisms of signaling.
In this paper we also prove evidence that an elongation factor 1B alpha-subunit2 (eEF1 B alpha
2) (spot 375, At5g19510) is significantly induced only upon the combined treatment with SA and
JA (6,07 fold induction). Worth of note is that single treatment with SA or JA was unable to
promote protein induction. This protein plays a crucial role in translational machinery leading to the
synthesis of several proteins involved in different cell response, independently from physiological
or stress condition. However, it has been reported that eEF1 B alpha 2 was specifically induced in
Arabidopsis upon inoculation with Pseudomonas syringae pv tomato DC3000 in response to the
pathogen effector (PAMP) T3Es75
. Our results corroborate the evidence that translational process is
of the outmost importance especially under biotic or abiotic stresses.
Gene expression studies
In order to deepen knowledge on the transcriptomic profile of the genes coding for the
differentially expressed proteins illustrated above, RT-PCR analyses were performed. We focused
our attention on all proteins involved in the oxidative stress and those involved in biotic and/or
abiotic stresses since their expression is more meaningful to unravel signal transduction pathways.
To this end, specific primers listed in Table 2 were designed for all genes and specific primers
for ubiquitin (At4g05320) were utilized for the amplification of the housekeeping gene ubiquitin,
used for quantity control.
Page 17 of 48 Molecular BioSystems
Mo
lecu
lar
Bio
Sys
tem
s A
ccep
ted
Man
usc
rip
t
Dow
nloa
ded
by S
tate
Uni
vers
ity o
f N
ew Y
ork
at B
uffa
lo o
n 15
/04/
2013
19:
58:2
2.
Publ
ishe
d on
10
Apr
il 20
13 o
n ht
tp://
pubs
.rsc
.org
| do
i:10.
1039
/C3M
B25
569G
View Article Online
17
As reported in Fig. 3, the expression of genes involved in oxidative stress or related to biotic and/or
abiotic stresses correlates with the expression of the coded proteins (Fig. 2 and Table 1). In fact, we
found perfect correlation between transcript profiling and proteome analysis. Semi-quantitative RT-
PCR proved useful not only to study the expression of the selected genes upon single treatment with
SA or JA, but also to highlight the expression following the combined treatment with the two
phytohormones. In particular, genes induced only after the combined action of SA and JA were
found to be aconitase 2 (ACO2) and peroxisomal NAD-malate dehydrogenase 2 (PMDH2),
suggesting a synergism between the two hormones. This result is in good agreement with the
expression levels of the corresponding proteins as evidenced with proteomic analysis. However,
whether the two proteins participate to the same signal transduction pathway is still to be unraveled.
Almost all genes reported in Fig. 3 were found to be negatively modulated after the combined
treatment with SA or JA, suggesting a negative crosstalk. Interestingly, nine out of twelve genes
involved in the oxidative stress were overexpressed upon JA treatment, namely SHM1, GGAT1,
CAT3, CAT2, SHM4, MOA2.2, MOA2.13, CA1 and CA2. Almost all of the above-mentioned
genes are involved in the photorespiration process, as indicated in Fig. 4. Through H2O2 production,
detoxified by catalases, photorespiration makes a key contribution to cellular redox homeostasis. In
so doing, it influences multiple signaling pathways, in particular, those that govern plant hormonal
responses controlling growth, environmental and defense responses, and programmed cell
death76,77
. In our experimental conditions, both CAT2 and CAT3 were overexpressed upon JA
treatment (16,68 and 8,46 fold change, respectively) as well as upon SA challenge, even to a lesser
extent (5,76 and 2,29 fold change, respectively). Interestingly, CAT3 expression was drastically
reduced upon treatment with the combined hormones (1,20 fold change), whereas CAT2 exhibited a
lesser pronounced inhibition (13,44 fold change). Our results are in agreement with previous reports
on the SA-dependent inhibition of CAT activity78-80
. However, why and how SA antagonize the JA-
mediated pathway is still matter of debate.
Among genes overexpressed after JA treatment are also carbonic anhydrase coding genes (CA1 and
Page 18 of 48Molecular BioSystems
Mo
lecu
lar
Bio
Sys
tem
s A
ccep
ted
Man
usc
rip
t
Dow
nloa
ded
by S
tate
Uni
vers
ity o
f N
ew Y
ork
at B
uffa
lo o
n 15
/04/
2013
19:
58:2
2.
Publ
ishe
d on
10
Apr
il 20
13 o
n ht
tp://
pubs
.rsc
.org
| do
i:10.
1039
/C3M
B25
569G
View Article Online
18
CA2). For all these genes a negative effect of SA over the JA signaling can be inferred as evidenced
in Fig. 2 and Fig. 3 as well as in Table 1. Even though it remains unclear how ROS accumulation
determines the extent of SA/JA-dependent signals, it is clear that signals elicited by ROS cross-
communicate with other signaling components to determine the final outcome of the defense
reaction.
GABA-T, FIBR and AKR were overexpressed upon SA or JA treatments. Despite the
overexpression of all genes, a negative effect of JA on SA pathway has been evidenced. On the
contrary, all genes involved in biotic and/or abiotic stresses with the exception of EF1B proved to
be induced by SA while being all inhibited by the combination of the two phytohormones.
Taken together, these observations do not clarify how antagonism is exerted but add knowledge on
the existing picture15
of the major players in molecular crosstalk.
Concluding remarks
The present study revealed that several proteins are induced upon treatment with SA or JA alone
or in combination. The combined proteomic/transcriptomic approaches we used proved to be useful
to study the expression patterns of proteins and genes induced in response to different stimuli and
also to highlight crosstalk between two different transduction pathways. Moreover, our results add
significance in the research field on SA and JA signalling pathway and on crosstalk between two
phytohormones.
Choosing only the proteins that are overexpressed at least four times after treatment with
individual hormones or with the combination of the two, we highlighted the presence of proteins
that can be broadly categorized according to biological processes in which they are involved. Fig. 5
shows that about 25% of the proteins are involved in cellular processes, while 20% are synthesized
in response to stress and an equal amount are involved in general metabolic processes. According
with the signal molecules utilized, about 13% of the proteins are involved in biotic or abiotic
stimuli. Less percentage of the proteins are involved in developmental process (4,5%), protein
Page 19 of 48 Molecular BioSystems
Mo
lecu
lar
Bio
Sys
tem
s A
ccep
ted
Man
usc
rip
t
Dow
nloa
ded
by S
tate
Uni
vers
ity o
f N
ew Y
ork
at B
uffa
lo o
n 15
/04/
2013
19:
58:2
2.
Publ
ishe
d on
10
Apr
il 20
13 o
n ht
tp://
pubs
.rsc
.org
| do
i:10.
1039
/C3M
B25
569G
View Article Online
19
metabolism (2,2%) and transport. Proteins participating in cell organization and biogenesis or in
electron transport and energy pathways account for less than 1%.
Furthermore, we proved evidence that proteomic approaches can be as successful as
transcriptomics to highlight the effect of signal molecules on the rate of cellular metabolism of
Arabidopsis.
Our data clearly demonstrate that almost all gene/proteins involved in oxidative stress as well as
in biotic and/or abiotic stresses are mainly induced upon JA and only few of them are
overexpressed upon SA treatment. Moreover, we found that substantially negative crosstalk is
established upon the combined action of the two hormones and that generally SA exerts a negative
crosstalk over the JA pathway. It is generally recognized that SA mimics the effect of biotrophic
pathogens, whereas JA is involved in necrotrophic pathogen-associated response. In nature, plants
often deal with simultaneous invasion by multiple aggressors, which can influence the primary
induced defense response of the host plant. The crosstalk is thought to provide the plant with a
powerful regulatory potential that helps deciding which defensive strategy to follow, depending on
the type of attacker encountered81
. It appears that attackers have evolved ways to manipulate plants
for their own benefit by affecting induced defenses via modulation of the plant signaling network.
On the basis of our results, we can speculate that when a simultaneous infection by necrotrophic
and biotrophic pathogens occurs, the latter might prevent necrosis antagonizing the signaling
pathway induced by necrotrophs. This strategy allows the biotroph to colonize living host tissues.
Our study corroborate and reinforce literature data on the effect of phytoormones in
reprogramming the plant transcriptome and highlights the presence of a complex network of
signaling that is far to be completely elucidated. However, our data could represent a good starting
point to design new mutants of SA or JA pathways in order to unravel the complex network of
signaling.
Functional analyses of the identified proteins, together with post-translational modification
studies, should extend our understanding of the whole picture of cell response to stress and give an
Page 20 of 48Molecular BioSystems
Mo
lecu
lar
Bio
Sys
tem
s A
ccep
ted
Man
usc
rip
t
Dow
nloa
ded
by S
tate
Uni
vers
ity o
f N
ew Y
ork
at B
uffa
lo o
n 15
/04/
2013
19:
58:2
2.
Publ
ishe
d on
10
Apr
il 20
13 o
n ht
tp://
pubs
.rsc
.org
| do
i:10.
1039
/C3M
B25
569G
View Article Online
20
invaluable molecular basis of the plant defense mechanisms. However, further studies are required
with Arabidopsis mutants in signaling pathways to identify nodal genes that are expressed in
multiple signaling pathways mediated by different stimuli.
Experimental
Cultivation of Arabidopsis plants and treatments
Seeds of Arabidopsis accession Col-0 were sown in quartz sand. After 2 weeks, seedlings were
transferred to 60 ml pots containing sand/potting soil mixture that was autoclaved twice for 20 min
with a 24 h interval82
. Plants were cultivated in a growth chamber with a 12/12 h (200 mE m-2
s-
1) day/night cycle, temperature of 21°C and 70% relative humidity for another 3 weeks. Plants were
watered on alternate days. Chemical induction treatments of Arabidopsis were performed by
dipping leaves of 5-week-old plants in a solution of 1 mM SA, 100 µM MeJA or a combination of
both chemicals at same concentration (Sigma, Schnelldorf, Germany). Control plants were treated
with water only. Leaf rosettes from five plants for each treatment (around 20 leaves) were harvested
24 h after treatment, immediately frozen in liquid nitrogen and then stored at -80 °C before further
analysis. Three biologically independent replicates were prepared at separate times.
Protein extraction
Frozen leaf tissue (2 g fresh weight) was crushed in a pre-cooled mortar with liquid nitrogen
with a pestle. The resulting fine powder was dissolved in a extraction buffer containing 50 mM
HEPES (pH 7.2), 150 mM NaCl, 1 mM EDTA, 1mM PMSF, 1% PVP (Sigma, Schnelldorf,
Germany). The supernatant was separated from the insoluble fraction by centrifugation at 9000 rpm
for 30 min and protein concentration was measured according to Bradford83
. Bovine serum albumin
was used as a standard.
Page 21 of 48 Molecular BioSystems
Mo
lecu
lar
Bio
Sys
tem
s A
ccep
ted
Man
usc
rip
t
Dow
nloa
ded
by S
tate
Uni
vers
ity o
f N
ew Y
ork
at B
uffa
lo o
n 15
/04/
2013
19:
58:2
2.
Publ
ishe
d on
10
Apr
il 20
13 o
n ht
tp://
pubs
.rsc
.org
| do
i:10.
1039
/C3M
B25
569G
View Article Online
21
Semi-quantitative IEF–SDS PAGE
Proteins were precipitated from a desired volume (containing 900 µg of proteins) of each sample
with cold (4 °C) acetone (80% v/v) over-night, then centrifuged at 13500 rpm at 4°C for 15 min.
The supernatant was removed and the pellet was air-dried and then solubilized in the focusing
solution 8 M urea, 4% (w/v) CHAPS, 0.5% (w/v) pH 4-7 carrier ampholyte (Bio-lyte; Bio-Rad,
Hercules, CA, USA) and 40 mM Tris base with continuous stirring.
Proteins were subsequently reduced (10 mM tributylphosphine, 1 h) and alkylated (40 mM IAA,
1h). To prevent over-alkylation, iodoacetamide (IAA) excess was destroyed by adding 10 mM
DTE. Isoelectrofocusing (IEF) was performed using Biorad Multiphore II and ready–to–use
Immobiline Dry–Strips linear pH gradient 3–10 length 18 cm (BioRad, Hercules, CA, USA) and the
in gel sample rehydration method. IEF was run on a BioRad Protean IEF and the total product time
× voltage applied was 70000 V h for each strip at 20 °C. After IEF, the IPG gel strips were
incubated at room temperature for 30 min in 6 M urea, 30% w/v glycerol, 2% w/v SDS, 5 mM
Tris–HCl, pH 8.6.
The strips were sealed at the top of a 1.0 mm vertical second dimensional gel (BioRad, Hercules,
CA, USA) with 0.5% agarose in 25 mM Tris, 192 mM glycine, 0.1% SDS, pH 8.3. SDS–PAGE
was carried out on homogeneous running gel 16 cm × 20 cm, 12% acrylamide.
The running buffer was 25 mM Tris, 192 mM glycine, 0.1% SDS, pH 8.3; running conditions
were 40 mA/gel until the bromophenol blue reached the bottom of the gel; the molecular weight
marker was Wide Range SigmaMarkerTM
(Sigma, St. Louis, MO, USA). Gels were automatically
stained with Brilliant Blue G colloidal (Sigma, St. Louis, MO, USA) following the manufacturer’s
instructions. Three technical replicates per sample and three biological replicates were performed
for each plant treatment, for a total of 36 gels. The 2D image analysis was carried out and spots
were detected and quantified using the Progenesis SameSpots software v.2.0.2733.19819 software
package (Nonlinear Dynamics, Newcastle UK). Each gel was analysed for spot detection and
Page 22 of 48Molecular BioSystems
Mo
lecu
lar
Bio
Sys
tem
s A
ccep
ted
Man
usc
rip
t
Dow
nloa
ded
by S
tate
Uni
vers
ity o
f N
ew Y
ork
at B
uffa
lo o
n 15
/04/
2013
19:
58:2
2.
Publ
ishe
d on
10
Apr
il 20
13 o
n ht
tp://
pubs
.rsc
.org
| do
i:10.
1039
/C3M
B25
569G
View Article Online
22
background subtraction. Within-group comparison of protein spot numbers was determined by
repeated measure.
Image analysis
Two dimension gel images were digitized using a flatbed scanner (model ImageScanner-II, GE
Healthcare, Uppsala, Sweden) with a resolution of 300 dpi and 16-bit greyscale pixel depth. Image
analysis was carried out with Progenesis SameSpots software vers. 2.0 (Nonlinear Dynamics, UK),
which allows spot detection, background subtraction, and protein spot OD intensity quantification
(spot quantity definition). The gel image showing the highest number of spots and the best protein
pattern was chosen as a reference template, and spots in a standard gel were then matched across all
gels. Spot quantity values were normalized in each gel dividing the raw quantity of each spot by the
total quantity of all the spots included in the standard gel. For each protein spot, the average spot
quantity value and its variance coefficient in each group was determined. One-way analysis of
variance (ANOVA) was carried out at p < 0.05 in order to assess for absolute protein changes
among the different treatments; only 4-fold or higher quantitative variations were taken into
consideration. Principal component analysis (PCA) was also calculated according to Valledor and
Jorrín84
and it is included in the SameSpots software package. The least significant difference
(LSD) test was used to determine significant differences among group means.
In-Gel Digestion
Spots from 2–DE maps were carefully excised from the gels and subjected to in–gel trypsin
digestion according to Shevchenko et al.85
with minor modifications. The gel pieces were swollen
in a digestion buffer containing 50 mM NH4HCO3 and 12.5 ng/ml trypsin (modified porcine
trypsin, sequencing grade, Promega, Madison, WI, USA) in an ice bath. After 30 min, the
supernatant was removed and discarded; then 20 ml of 50 mM NH4HCO3 was added to the gel
pieces and digestion was allowed to proceed overnight at 37°C. The supernatant containing the
Page 23 of 48 Molecular BioSystems
Mo
lecu
lar
Bio
Sys
tem
s A
ccep
ted
Man
usc
rip
t
Dow
nloa
ded
by S
tate
Uni
vers
ity o
f N
ew Y
ork
at B
uffa
lo o
n 15
/04/
2013
19:
58:2
2.
Publ
ishe
d on
10
Apr
il 20
13 o
n ht
tp://
pubs
.rsc
.org
| do
i:10.
1039
/C3M
B25
569G
View Article Online
23
peptide mixture was removed and acidified with 5% formic acid before injection in the mass
spectrometer.
Protein Identification by MS/MS
Peptide mixtures were separated using Ultimate–Switchos–Famos HPLC system (LC Packings,
Amsterdam, The Netherlands). A sample volume of 14 µl was loaded by the autosampler onto a
homemade 2 cm fused silica precolumn (75 µm I.D.; 375 µm O.D) Reprosil C18–AQ, 3 µm
(GmBH, Ammerbuch–Entringen, DE) at a flow rate of 2 µl/min. Sequential elution of peptides was
accomplished using a flow rate of 200 nl/min and a linear gradient from Solution A (2%
acetonitrile; 0.1% formic acid) to 50% of Solution B (98% acetonitrile; 0.1% formic acid) in 40
minutes over the precolumn in–line with a homemade 10–15 cm resolving column (75 µm I.D.; 375
µm O.D.; Reprosil C18–AQ, 3 µm, Dr. Maisch GmbH, Ammerbuch–Entringen, Germany).
Peptides were eluted directly into a High Capacity ion Trap HCTplus (Bruker–Daltonik, Bremen,
Germany). Capillary voltage of 1.5–2 kV and a dry gas flow rate of 10 L/min were used at a
temperature of 230 °C. The scan range used was from 300 to 1800 m/z. Protein identification was
performed by searching in the National Centre for Biotechnology Information non–redundant
database (NCBInr, version 20081128, www.ncbi.nlm.nih.gov) using the MASCOT software in–
house version 2.2 (Matrix Science, London, UK). The following parameters were adopted for
database searches: complete carbamidomethylation of cysteines and partial oxidation of
methionines, peptide Mass Tolerance ±1.2 Da, Fragment Mass Tolerance ±0.9 Da, missed
cleavages 2. Only result scores [−10 x Log(P)] over the significance threshold level (P < 0.05) were
identified as positive. Even when high MASCOT scores were obtained (values >60), if proteins
were identified only by a single peptide, a combination of automated database search and a manual
interpretation of peptide fragmentation spectra was used to validate protein assignments. The mass
error, the presence of fragment ion series and the expected prevalence of C–terminus containing
ions (Y–type) in the high mass range were all taken into account in the verification procedure.
Page 24 of 48Molecular BioSystems
Mo
lecu
lar
Bio
Sys
tem
s A
ccep
ted
Man
usc
rip
t
Dow
nloa
ded
by S
tate
Uni
vers
ity o
f N
ew Y
ork
at B
uffa
lo o
n 15
/04/
2013
19:
58:2
2.
Publ
ishe
d on
10
Apr
il 20
13 o
n ht
tp://
pubs
.rsc
.org
| do
i:10.
1039
/C3M
B25
569G
View Article Online
24
Gene expression studies
RNA extraction was performed from 70 mg of the powder with a "NucleoSpin®
RNA Plant"
(MACHEREY-NAGEL) kit following the manufacturer's instructions. The quality and concentration of
RNA samples were examined by GelRed (BIOLINE) stained agarose gel electrophoresis and
spectrophotometric analysis.
One µg of total RNA was reverse-transcribed using oligo (dT)20 primers (Invitrogen), 0,5 mM
dNTPs and 200 U of ImProm-IITM
reverse transcriptase (PROMEGA) according to the
manufacturer’s instructions. cDNA amplification was performed over 25 cycles in a Progene
Termal cycler using BIOTAQTM
(BIOLINE) DNA Polymerase according to the manufacturer's
instructions under the following conditions: denaturation at 95 °C for 1 min, annealing for 1 minute
at different temperatures, depending on the primers used, and elongation at 72 °C for 1 min. The
specific primers were designed according to their known sequence (Table 2). To normalize the
quantity of RNA used for cDNA synthesis, cDNA was amplified with specific primers for UBI10,
according to the above protocol. The primers for UBI10 expression were used also to identify
possible contamination of RNA by genomic DNA. All the products of RT-PCR amplification were
analyzed on agarose gel 1.5% (w/v) according to the protocol proposed by Sambrook et al.86
.
Acknowledgements
This research was supported by the Ministero dell’Istruzione, Università e Ricerca Scientifica
(MIUR), project MIUR-FIRB (RBNE01KZE7).
Page 25 of 48 Molecular BioSystems
Mo
lecu
lar
Bio
Sys
tem
s A
ccep
ted
Man
usc
rip
t
Dow
nloa
ded
by S
tate
Uni
vers
ity o
f N
ew Y
ork
at B
uffa
lo o
n 15
/04/
2013
19:
58:2
2.
Publ
ishe
d on
10
Apr
il 20
13 o
n ht
tp://
pubs
.rsc
.org
| do
i:10.
1039
/C3M
B25
569G
View Article Online
25
References
1 E. Kombrink and E. Schmelzer, European J Plant Pathol, 2001, 107, 69-78.
2 K. Apel and H. Hirt, Annu Rev Plant Biol, 2004, 55, 373-399.
3 L. Sticher, B. Mauch-Mani and Métraux JP, Annu Rev Plant Pathol, 1997, 35, 235-270.
4 J.A. Ryals, U.H. Neuenschwander, M.G. Willits, A. Molina, H.Y. Steiner and M.D. Hunt, Plant
Cell, 1996, 8, 1809-1819.
5 R. Bari and J.D.G. Jones, Plant Mol Biol, 2009, 69, 473-488.
6 C.M.J. Pieterse, A. Leon-Reyes, S. Van der Ent and S.C.M. Van Wees, Nat Chem Biol, 2009, 5,
308-316.
7 A. Verhage, S.C.M. van Wees and C.M.J. Pieterse, Plant Physiol, 2010, 154, 536-540.
8 J. Glazebrook, Annual Review of Phytopathology, 2005, 43, 205-227.
9 A. Leon-Reyes, Y. Du, A. Koornneef, S. Proietti, A.P. Korbes, J. Memelink, C.M.J. Pieterse and
T. Ritsema, Mol Plant-Microbe Interact, 2010, 23, 187-197.
10 P.M. Schenk, K. Kazan, I. Wilson, J.P. Anderson, T. Richmond, S.C. Somerville and J.M.
Manners, Proc Natl Acad Sci USA, 2000, 97, 11655-11660.
11 Y.H. Cheong, H.S. Chang, R. Gupta, X. Wang, T. Zhu and S. Luan, Plant Physiol, 2002,129,
661-677.
12 R.M. Bostock, Annu Rev Phytopath, 2005, 43, 545-580.
13 S.H. Spoel and X. Dong, Cell Host & Microbe, 2008, 3, 348-351.
14 M.R. Grant and J.D.G. Jones, Science, 2009, 324, 750-752.
15 C.M.J. Pieterse, D. Van der Does, C. Zamioudis, A. Leon-Reyes and S.C.M. Van Wees, Annu
Rev Cell Dev Biol, 2012, 28, 489-521.
16 B. Mauch-Mani and F.Mauch, Curr Opin Plant Biol. 2005, 8, 409-414.
17 N. Beaudoin, C. Serizet, F. Gosti and J. Giraudat, Plant Cell, 2000, 12, 1103-1115.
18 M. Ghassemian, E. Nambara, S. Cutler, H. Kawaide, Y. Kamiya and P. McCourt, Plant Cell,
Page 26 of 48Molecular BioSystems
Mo
lecu
lar
Bio
Sys
tem
s A
ccep
ted
Man
usc
rip
t
Dow
nloa
ded
by S
tate
Uni
vers
ity o
f N
ew Y
ork
at B
uffa
lo o
n 15
/04/
2013
19:
58:2
2.
Publ
ishe
d on
10
Apr
il 20
13 o
n ht
tp://
pubs
.rsc
.org
| do
i:10.
1039
/C3M
B25
569G
View Article Online
26
2000, 12, 1117-1126.
19 C.J. Jiang, M. Shimono, S. Sugano, M. Kojima, K. Yazawa, R. Yoshida, H. Inoue, N. Hayashi,
H. Sakakibara and H. Takatsuji, Mol Plant-Microbe Interact, 2010, 23, 791-798.
20 M. Fujita, Y. Fujita, Y. Noutoshi, F. Takahashi, Y. Narusaka, K. Yamaguchi-Shinozaki and
Shinozaki K, Curr Opin Plant Biol, 2006, 9, 436-442.
21 M. De Torres-Zabala, M.H. Bennett, W.H. Truman and M.R. Grant, Plant Journal, 2009, 59,
375-38.
22 D. De Vleesschauwer, Y. Yang, C.V. Cruz and M. Hofte, Plant Physiol, 2010, 152, 2036-2052.
23 J. Ton, V. Flors and B. Mauch-Mani, Trends Plant Sci, 2009, 14, 310-317.
24 M.J. Pozo, L.C. Van Loon and C.M.J. Pieterse, J Plant Growth Regul, 2004, 23, 211-222.
25 L.C. Van Loon, B.P.J. Geraats and H.J.M. Linthorst, Trends Plant Sci, 2006, 11, 184-191.
26 G. Loake and M. Grant, Curr Opin Plant Biol, 2007, 10, 466-472.
27 J. Glazebrook, W. Chen, B. Estes, H-S Chang, C. Nawrath, J-P Metraux, T. Zhu and F. Katagiri,
Plant Journal, 2003, 31, 217–228.
28 F. Katagiri, Curr Opin Plant Biol, 2004, 7, 506-511.
29 L. Rajjou, M. Belghazi, R. Huguet, C. Robin, A. Moreau, C. Job and D. Job, Plant Physiol,
2006, 141, 910-923.
30 Y. Jiang, B. Yang, N.S. Harris and M.K. Deyholos, J Exp Bot, 2007, 4, 1-17.
31 S. Chivasa, J.M. Hamilton, R.S. Pringle, B.K. Ndimba, W.J. Simon, K. Lindsey, A.R. and
Slabas, J Exp Bot, 2006, 57 (7), 1553-1562.
32 R.M. Collins, M. Afzal, D.A. Ward, M.C. Prescott, S.M. Sait, H.H. Rees and A.B. Tomsett,
PLoS One, 2010, 5 (4), 1-14.
33 Park M.A., Seo J.H., Park J.S. and M. Kwon, Plant Cell Rep, 2009, 28, 1603-1614.
34 J.N. Cape, Environ Pollut, 2003, 122, 145-157.
35 C.H. Foyer and G. Noctor, Physiol Plant, 2003, 119, 355-364.
36 C.H. Foyer and G.Noctor, Plant Cell, 2005, 17, 1866-1875.
Page 27 of 48 Molecular BioSystems
Mo
lecu
lar
Bio
Sys
tem
s A
ccep
ted
Man
usc
rip
t
Dow
nloa
ded
by S
tate
Uni
vers
ity o
f N
ew Y
ork
at B
uffa
lo o
n 15
/04/
2013
19:
58:2
2.
Publ
ishe
d on
10
Apr
il 20
13 o
n ht
tp://
pubs
.rsc
.org
| do
i:10.
1039
/C3M
B25
569G
View Article Online
27
37 C.C.C. Chang, L. Ball, M.J. Fryer, N.R. Baker, S. Karpinski and P.M. Mullineaux, Plant J,
2004, 38, 499-511.
38 I.C. Mori and J.I. Schroeder, Plant Physiol, 2004, 135, 702-708.
39 R. Shin and D.P. Schachtman, Proc Natl Acad Sci USA, 2004, 101, 8827-8832.
40 J.M. Kwak, I.C. Mori, Z-M Pei, N. Leonhardt, M.A. Torres, J.L. Dangl, R.E. Bloom, S. Bodde,
J.D.G. Jones and J.I. Schroeder, EMBO J, 2003, 22, 2623-2633.
41 M. Nishimura, Y.D. Akhmedov, K. Strzalka and T. Akazawa, Arch Biochem Biophys, 1983,
222, 397-402.
42 M.L. Orozco-Cardenas, J. Narvaez-Vasquez and C.A. Ryan, Plant Cell, 2001,13, 179-191.
43 H. Fahnenstich, T.E. Scarpeci, E.M. Valle, U-I Flugge, V.G. Maurino, Plant Physiol, 2008, 148,
719-729.
44 S. Reumann, in Plant Peroxisomes: Biochemistry, Cell Biology and Biotechnological
Applications ed. A. Baker and I.A. Graham, Kluwer Academic Publishers, Dordrecht, 2002, pp.
141-189.
45 B.J. Shelp , R.T. Mullen and J.C. Waller. Trends Plant Sci., 2012, 17(2), 57-9.
46 V. Pavet, E. Olmos, G. Kiddle, S. Mowla, S. Kumar, J. Antoniw, M.E. Alvarez and C.H. Foyer.
Plant Physiol, 2005, 139,1291-1303.
47 F. Van Breusegem and J.F. Dat. Plant Physiol, 2006, 141, 384-390.
48 R.I. Pennell and C. Lamb. Plant Cell, 1997, 9, 1157-1168.
49 J. Zeier, B. Pink, M.J. Mueller and S. Berger. Planta, 2004, 219, 673-683.
50 J.I. Moreno, R. Martin and C. Castresana. Plant Journal, 2005, 41, 451-463.
51 J.A. Jebanathirajah and J.R. Coleman. Planta, 1998, 204, 177-182.
52 D.H. Slaymaker, D.A. Navarre, D. Clark, O. Del Pozo, G.B. Martin and D.F. Klessig. Proc Natl
Acad Sci USA, 2002, 99, 11640-11645.
53 W. Moeder, O. Del Pozo, D.A. Navarre, G.B. Martin and D.F. Klessig. Plant Mol Biol, 2007, 63
(2), 273-287.
Page 28 of 48Molecular BioSystems
Mo
lecu
lar
Bio
Sys
tem
s A
ccep
ted
Man
usc
rip
t
Dow
nloa
ded
by S
tate
Uni
vers
ity o
f N
ew Y
ork
at B
uffa
lo o
n 15
/04/
2013
19:
58:2
2.
Publ
ishe
d on
10
Apr
il 20
13 o
n ht
tp://
pubs
.rsc
.org
| do
i:10.
1039
/C3M
B25
569G
View Article Online
28
54 L.A. Mur, P. Kenton, R. Atzorn, O. Miersch and C. Wasternack. Plant Physiol, 2006, 140, 249-
262.
55 A. Youssef, Y. Laizet, M.A. Block, E. Maréchal, J.P. Alcaraz, T.R. Larson, D. Pontier, J. Gaffé
and M. Kuntz. Plant Journal, 2010, 61, 436-445.
56 J. Yan, J. Wang and H. Zhang. Plant Journal, 2002, 29, 193-202.
57 P. Krishna. J Plant Growth Regulat, 2003, 22, 289-297.
58 A. Alonso-Ramirez, D. Rodriguez, D. Reyes, J.A. Jimenez, G. Nicolas, M. Lopez-Climent, A.
Gomez-Cadenas and C. Nicolas, Plant Physiol, 2009, 150, 1335-1344.
59 U.K. Divi, T. Rahman and P. Krishna, BMC Plant Biol, 2011, 10, 151-164.
60 X.Y. Jia, C.Y. Xu, R.L. Jing, R.Z. Li, X.G. Mao, J.P. Wang and X.P. Chang, J Exp Bot, 2008,
59, 739-751.
61 J. Shaterian, F. Georges, A. Hussain, D. Waterer, H.D. Jong and K.K. Tanino, Environ Exp Bot,
2005, 53, 323-332.
62 E.P. Jelitto-Van Dooren, S. Vidal and J. Denecke, Plant Cell, 1999, 11, 1935-1944.
63 F. Chen, P.M. Hayes, D.M. Mulrooney and A. Pan, Plant Cell, 1994, 6, 835-843.
64 J. Denecke, L.E. Carlsson, S. Vidal, A.S. Hoglund, B. Ek, M.J. van Zeijl, K.M. Sinjorgo and
E.T. Palva, Plant Cell, 1995, 7, 391-406.
65 J.M. Kuhn and J.I. Schroeder, Curr Opin Plant Biol, 2003, 6, 463-469.
66 S. Raab, Z. Toth, C. de Groot, T. Stamminger and S. Hoth, Planta, 2006, 224, 900-914.
67 J. Kurepa, J.M. Walker, J. Smalle, M.M. Gosink, S.J. Davis, T.L. Durham, D-Y Sung, R.D.
Vierstra, J Biol Chem, 2003, 278, 6862-6872.
68 L.M. Lois, C.D. Lima and N-H. Chua, Plant Cell, 2003, 15, 1347-1359.
69 T. Ghelis, G. Bolbach, G. Clodic, Y. Habricot, E. Miginiac, B. Sotta and E. Jeannette, Plant
Physiol, 2008,148 (3), 1668-1680.
70 M.E. Feder and G.E. Hofmann, Annu Rev Physiol, 1999, 61, 243-282.
71 J. Larkindale, J.D. Hall, M.R. Knight and E.Vierling, Plant Physiol, 2005, 138, 882-897.
Page 29 of 48 Molecular BioSystems
Mo
lecu
lar
Bio
Sys
tem
s A
ccep
ted
Man
usc
rip
t
Dow
nloa
ded
by S
tate
Uni
vers
ity o
f N
ew Y
ork
at B
uffa
lo o
n 15
/04/
2013
19:
58:2
2.
Publ
ishe
d on
10
Apr
il 20
13 o
n ht
tp://
pubs
.rsc
.org
| do
i:10.
1039
/C3M
B25
569G
View Article Online
29
72 G.M. Pastori and H. Foyer, Plant Physiol, 2002, 129, 460-468.
73 U. Härndahl, R.B. Hall, K.W. Osteryoung, E. Vierling, J.F. Bornman and C. Sundby, Cell Stress
Chaperones, 1999, 4, 129-138.
74 W. Swindell, M. Hebner and A.P. Weber, BMC Genomics, 2007, 8, 125.
75 J.D.G. Jones and J.I. Schroeder, EMBO J, 2003, 22, 2623-2633.
76 H.Foyer, J. Bloom, G. Queval and G.Noctor, Annu Rev of Plant Biol, 2009, 60, 455- 484.
77 S. Kangasjärvi, J. Neukermans, S. Li, E.-M. Aro and G. Noctor, J Exp Bot, 2012, 63 (4), 1619-
1636.
78 U. Conrath, Z. Chen, J.R. Ricigliano and D.F. Klessig, Proc Natl Acad Sci USA, 1995, 92, 7143-
7147;
79 J. Durner and D.F. Klessig, J Biol Chem, 1996, 271, 28492-28501.
80 Z. Chen, S. Iyer, A. Caplan, D.F. Klessig and B. Fan, Plant Physiol, 1997, 114, 193-201.
81 P. Reymond and E.E. Farmer, Curr Opin Plant Biol, 1998, 1, 404-411.
82 C.M.J. Pieterse, S.C.M. Van Wees, J.A. Van Pelt, M. Knoester, R. Laan, H. Gerrits, P.J.
Weisbeek and L.C. Van Loon, Plant Cell, 1998, 10, 1571-1580.
83 M.M. Bradford, Analyt Bioch, 1976, 72, 248-254.
84 L. Valledor and J. Jorrin, J Proteomics, 2011, 74, 1-18.
85 A. Shevchenko, M. Wilm, O. Vorm and M. Mann, Anal Chemi, 1996, 68, 850-858.
86 J. Sambrook, E.F. Fritsch and T. Maniatis, in Molecular Cloning: A Laboratory Manual, ed.
Cold Spring Harbor Laboratory Press, Cold Spring Harbor, NY, USA, 2nd edn, 1989.
Page 30 of 48Molecular BioSystems
Mo
lecu
lar
Bio
Sys
tem
s A
ccep
ted
Man
usc
rip
t
Dow
nloa
ded
by S
tate
Uni
vers
ity o
f N
ew Y
ork
at B
uffa
lo o
n 15
/04/
2013
19:
58:2
2.
Publ
ishe
d on
10
Apr
il 20
13 o
n ht
tp://
pubs
.rsc
.org
| do
i:10.
1039
/C3M
B25
569G
View Article Online
30
Legends to figures
Fig. 1
2D-SDS PAGE of Arabidopsis leaf proteins. Equal amount (900 µg) of total proteic extract from
SA- (a), JA- (b) or SA/JA- (c) treated plants as well as of control plants (d) were loaded into 12%
acrylamide SDS gels as reported in Experimental section. Numbers and arrows in a, b and c
indicate analyzed spots corresponding to proteins overexpressed at least four- fold with respect to
the control. Fig. 1e shows the reference map derived from computerized image analysis performed
by using Progenesis SameSpots software.
Fig. 2
Level of expression of protein spots analyzed by LC-ESI-MS/MS. For each selected spot the
expression level upon each treatment has been calculated relatively to the control. Arabidopsis
plants treated with SA (white dotted bars) or JA (black bars) alone or in combination (grey bars).
Proteins are grouped on the basis on their involvement in the crosstalk between SA and JA. Panels
show proteins involved in: negative crosstalk by SA on JA pathway (a), negative crosstalk by JA on
SA pathway (b), antagonistic (c) and synergistic (d) crosstalk between SA and JA.
Fig. 3
Semi-quantitative RT-PCR analysis of genes coding for the proteins involved in oxidative stress
and biotic and/or abiotic stress listed in Table 1.
ACO2 (aconitase 2); SHM1 (serine hydroxymethyl transferase 1); GGAT1 (glutamate:glyoxylate
aminotranferase 1); CAT3 (catalase 3); GABA-T (gamma-aminobutyrate transaminase); CAT2
(catalase 2); SHM4 (serine hydroxymethyl transferase 4); FIBR (fibrillin); MOA2.2 ((S)-2-
hydroxy-acid oxidase, peroxisomal, putative/glycolate oxidase); MOA2.13 ((S)-2-hydroxy-acid
oxidase, peroxisomal, putative/glycolate oxidase); AKR (ankyrin repeat-containing protein 2);
Page 31 of 48 Molecular BioSystems
Mo
lecu
lar
Bio
Sys
tem
s A
ccep
ted
Man
usc
rip
t
Dow
nloa
ded
by S
tate
Uni
vers
ity o
f N
ew Y
ork
at B
uffa
lo o
n 15
/04/
2013
19:
58:2
2.
Publ
ishe
d on
10
Apr
il 20
13 o
n ht
tp://
pubs
.rsc
.org
| do
i:10.
1039
/C3M
B25
569G
View Article Online
31
PHMD2 (peroxisomal NAD-malate dehydrogenase 2); CA2 (carbonic anhydrase 2); CA1 (carbonic
anhydrase 1); CTR1B (calreticulin 1B); CRB (chloroplast RNA binding); TRIP1 (TGF-beta
receptor interacting protein 1); HSP20 (HSP20-like chaperone); EF1B (elongation factor 1B alpha-
subunit 2); NADEPI (NAD-dependent epimerase/dehydratase)
Fig. 4
First steps of the photorespiratory metabolism. Enzymes involved in catalyzing the reactions are
indicated in red.
Fig. 5
Gene ontology categorization: Biological process in which are involved the identified proteins
listed in Table 1
Page 32 of 48Molecular BioSystems
Mo
lecu
lar
Bio
Sys
tem
s A
ccep
ted
Man
usc
rip
t
Dow
nloa
ded
by S
tate
Uni
vers
ity o
f N
ew Y
ork
at B
uffa
lo o
n 15
/04/
2013
19:
58:2
2.
Publ
ishe
d on
10
Apr
il 20
13 o
n ht
tp://
pubs
.rsc
.org
| do
i:10.
1039
/C3M
B25
569G
View Article Online
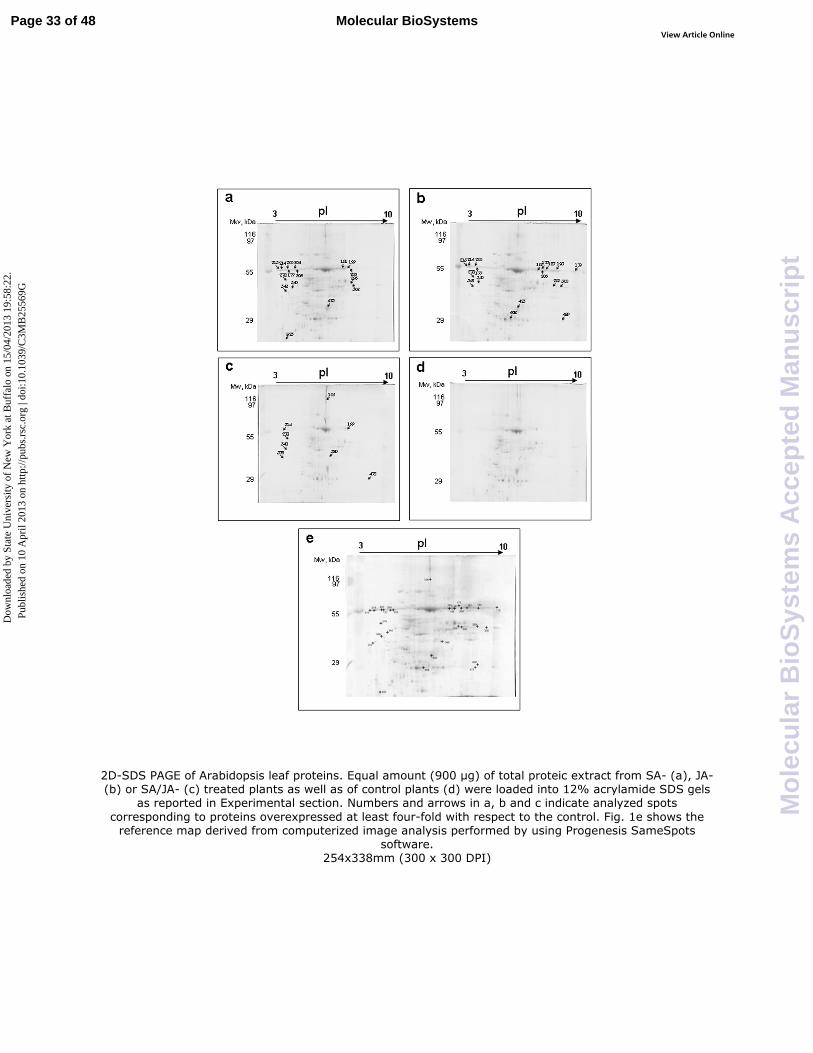
2D-SDS PAGE of Arabidopsis leaf proteins. Equal amount (900 µg) of total proteic extract from SA- (a), JA- (b) or SA/JA- (c) treated plants as well as of control plants (d) were loaded into 12% acrylamide SDS gels
as reported in Experimental section. Numbers and arrows in a, b and c indicate analyzed spots
corresponding to proteins overexpressed at least four-fold with respect to the control. Fig. 1e shows the reference map derived from computerized image analysis performed by using Progenesis SameSpots
software. 254x338mm (300 x 300 DPI)
Page 33 of 48 Molecular BioSystems
Mo
lecu
lar
Bio
Sys
tem
s A
ccep
ted
Man
usc
rip
t
Dow
nloa
ded
by S
tate
Uni
vers
ity o
f N
ew Y
ork
at B
uffa
lo o
n 15
/04/
2013
19:
58:2
2.
Publ
ishe
d on
10
Apr
il 20
13 o
n ht
tp://
pubs
.rsc
.org
| do
i:10.
1039
/C3M
B25
569G
View Article Online
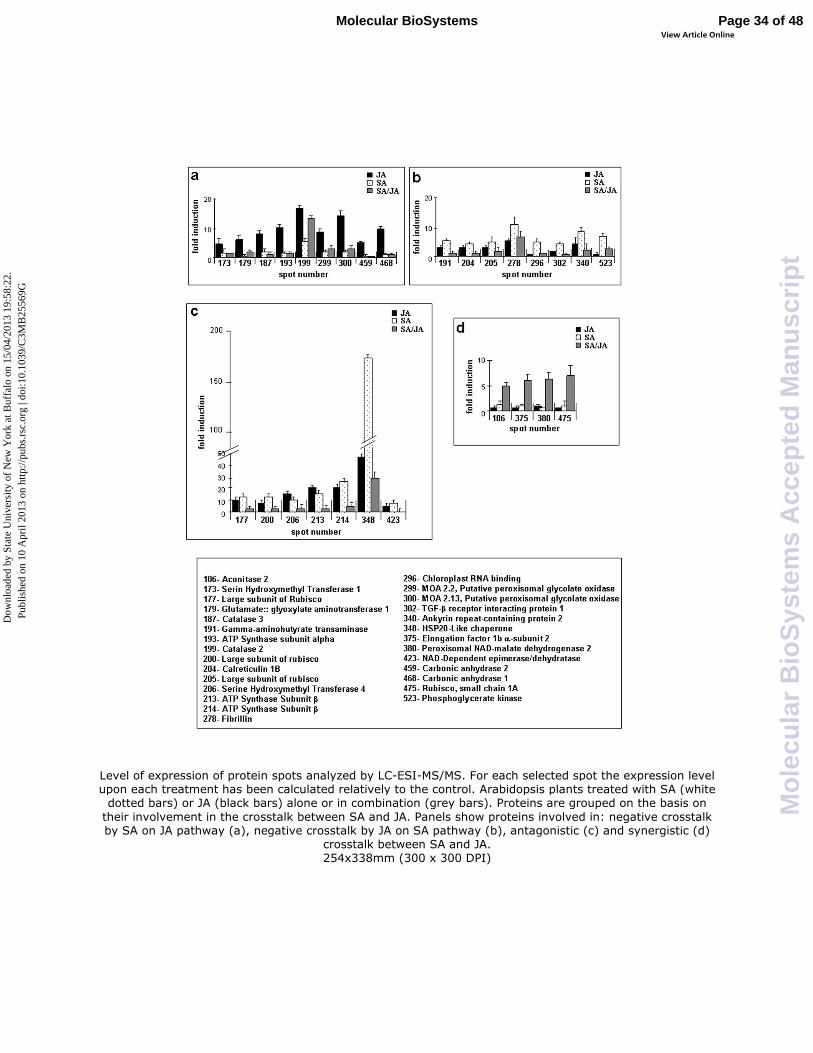
Level of expression of protein spots analyzed by LC-ESI-MS/MS. For each selected spot the expression level upon each treatment has been calculated relatively to the control. Arabidopsis plants treated with SA (white dotted bars) or JA (black bars) alone or in combination (grey bars). Proteins are grouped on the basis on
their involvement in the crosstalk between SA and JA. Panels show proteins involved in: negative crosstalk by SA on JA pathway (a), negative crosstalk by JA on SA pathway (b), antagonistic (c) and synergistic (d)
crosstalk between SA and JA. 254x338mm (300 x 300 DPI)
Page 34 of 48Molecular BioSystems
Mo
lecu
lar
Bio
Sys
tem
s A
ccep
ted
Man
usc
rip
t
Dow
nloa
ded
by S
tate
Uni
vers
ity o
f N
ew Y
ork
at B
uffa
lo o
n 15
/04/
2013
19:
58:2
2.
Publ
ishe
d on
10
Apr
il 20
13 o
n ht
tp://
pubs
.rsc
.org
| do
i:10.
1039
/C3M
B25
569G
View Article Online
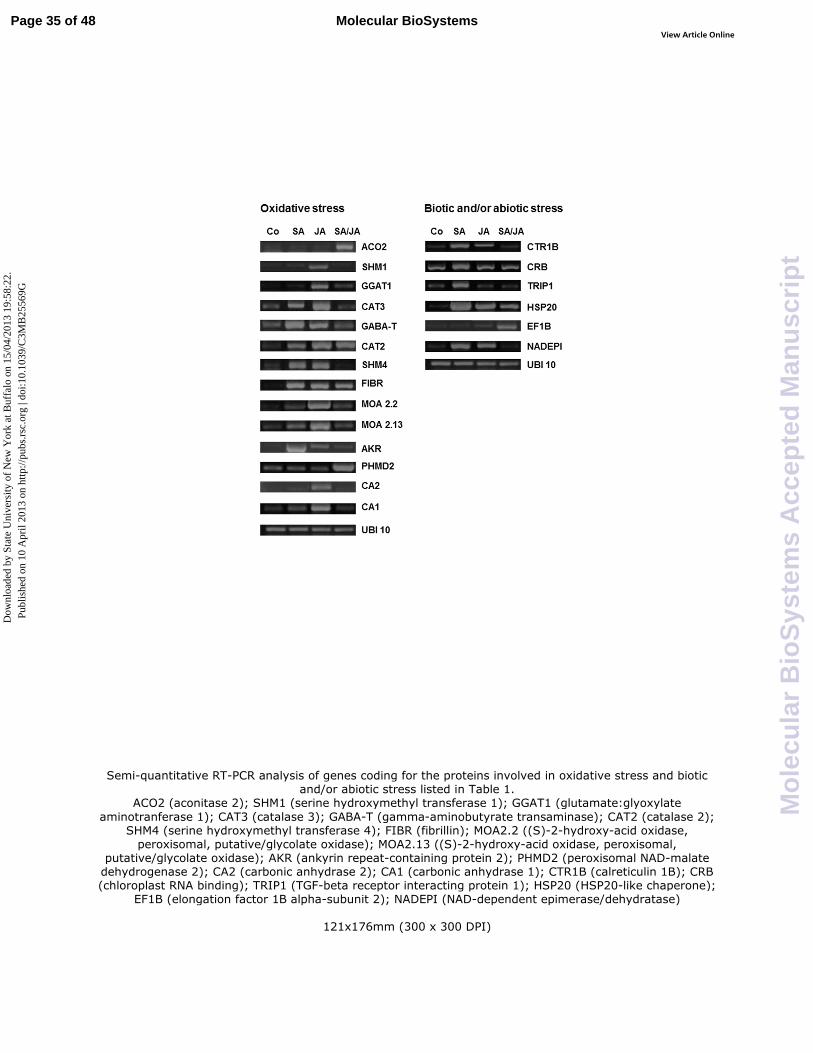
Semi-quantitative RT-PCR analysis of genes coding for the proteins involved in oxidative stress and biotic and/or abiotic stress listed in Table 1.
ACO2 (aconitase 2); SHM1 (serine hydroxymethyl transferase 1); GGAT1 (glutamate:glyoxylate
aminotranferase 1); CAT3 (catalase 3); GABA-T (gamma-aminobutyrate transaminase); CAT2 (catalase 2); SHM4 (serine hydroxymethyl transferase 4); FIBR (fibrillin); MOA2.2 ((S)-2-hydroxy-acid oxidase,
peroxisomal, putative/glycolate oxidase); MOA2.13 ((S)-2-hydroxy-acid oxidase, peroxisomal, putative/glycolate oxidase); AKR (ankyrin repeat-containing protein 2); PHMD2 (peroxisomal NAD-malate
dehydrogenase 2); CA2 (carbonic anhydrase 2); CA1 (carbonic anhydrase 1); CTR1B (calreticulin 1B); CRB (chloroplast RNA binding); TRIP1 (TGF-beta receptor interacting protein 1); HSP20 (HSP20-like chaperone);
EF1B (elongation factor 1B alpha-subunit 2); NADEPI (NAD-dependent epimerase/dehydratase)
121x176mm (300 x 300 DPI)
Page 35 of 48 Molecular BioSystems
Mo
lecu
lar
Bio
Sys
tem
s A
ccep
ted
Man
usc
rip
t
Dow
nloa
ded
by S
tate
Uni
vers
ity o
f N
ew Y
ork
at B
uffa
lo o
n 15
/04/
2013
19:
58:2
2.
Publ
ishe
d on
10
Apr
il 20
13 o
n ht
tp://
pubs
.rsc
.org
| do
i:10.
1039
/C3M
B25
569G
View Article Online

Page 36 of 48Molecular BioSystems
Mo
lecu
lar
Bio
Sys
tem
s A
ccep
ted
Man
usc
rip
t
Dow
nloa
ded
by S
tate
Uni
vers
ity o
f N
ew Y
ork
at B
uffa
lo o
n 15
/04/
2013
19:
58:2
2.
Publ
ishe
d on
10
Apr
il 20
13 o
n ht
tp://
pubs
.rsc
.org
| do
i:10.
1039
/C3M
B25
569G
View Article Online
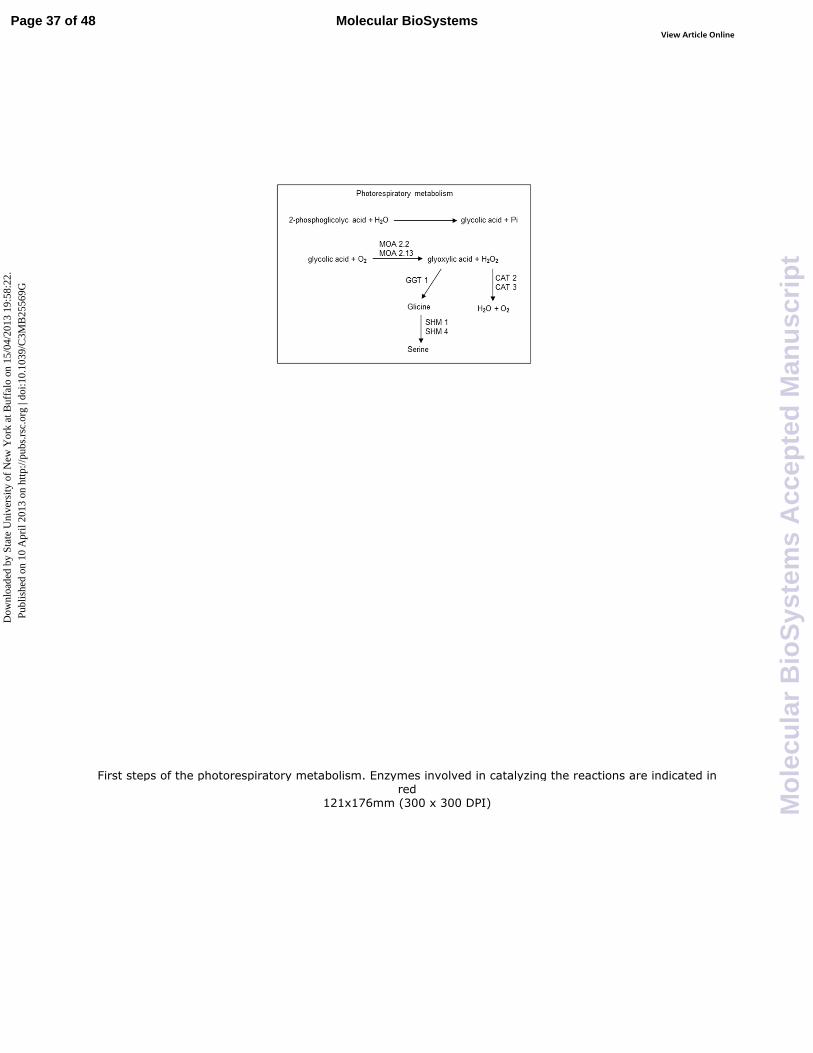
First steps of the photorespiratory metabolism. Enzymes involved in catalyzing the reactions are indicated in red
121x176mm (300 x 300 DPI)
Page 37 of 48 Molecular BioSystems
Mo
lecu
lar
Bio
Sys
tem
s A
ccep
ted
Man
usc
rip
t
Dow
nloa
ded
by S
tate
Uni
vers
ity o
f N
ew Y
ork
at B
uffa
lo o
n 15
/04/
2013
19:
58:2
2.
Publ
ishe
d on
10
Apr
il 20
13 o
n ht
tp://
pubs
.rsc
.org
| do
i:10.
1039
/C3M
B25
569G
View Article Online
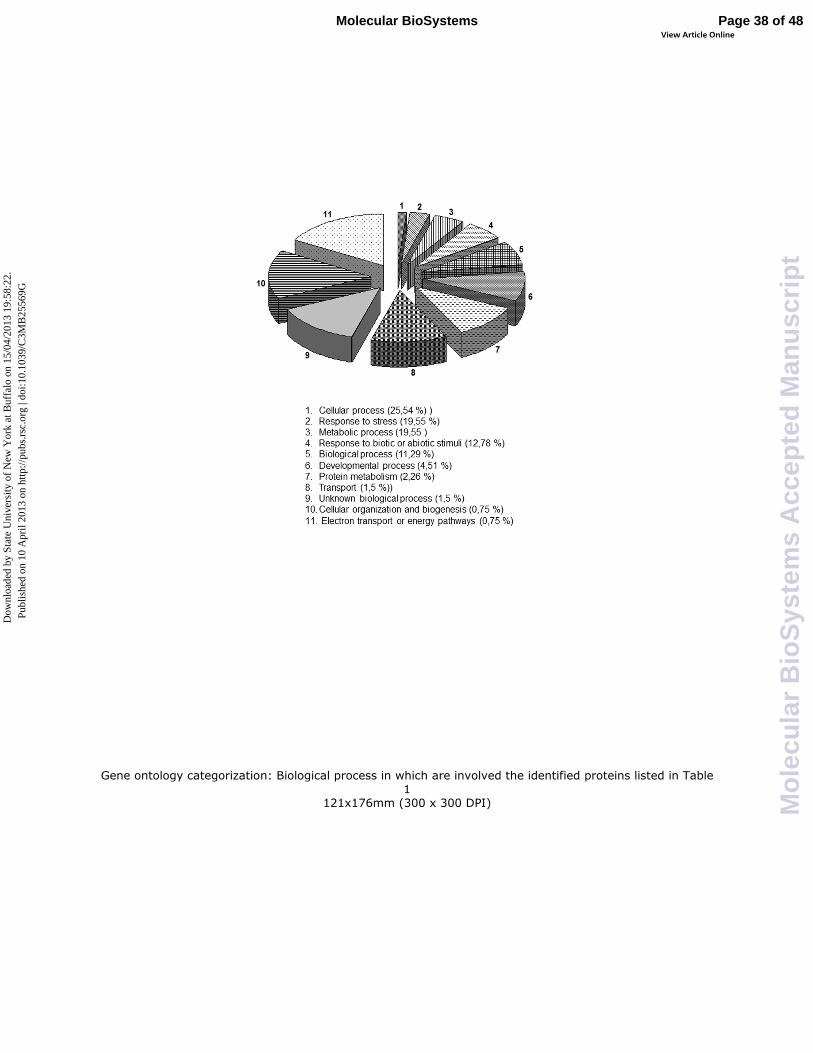
Gene ontology categorization: Biological process in which are involved the identified proteins listed in Table 1
121x176mm (300 x 300 DPI)
Page 38 of 48Molecular BioSystems
Mo
lecu
lar
Bio
Sys
tem
s A
ccep
ted
Man
usc
rip
t
Dow
nloa
ded
by S
tate
Uni
vers
ity o
f N
ew Y
ork
at B
uffa
lo o
n 15
/04/
2013
19:
58:2
2.
Publ
ishe
d on
10
Apr
il 20
13 o
n ht
tp://
pubs
.rsc
.org
| do
i:10.
1039
/C3M
B25
569G
View Article Online
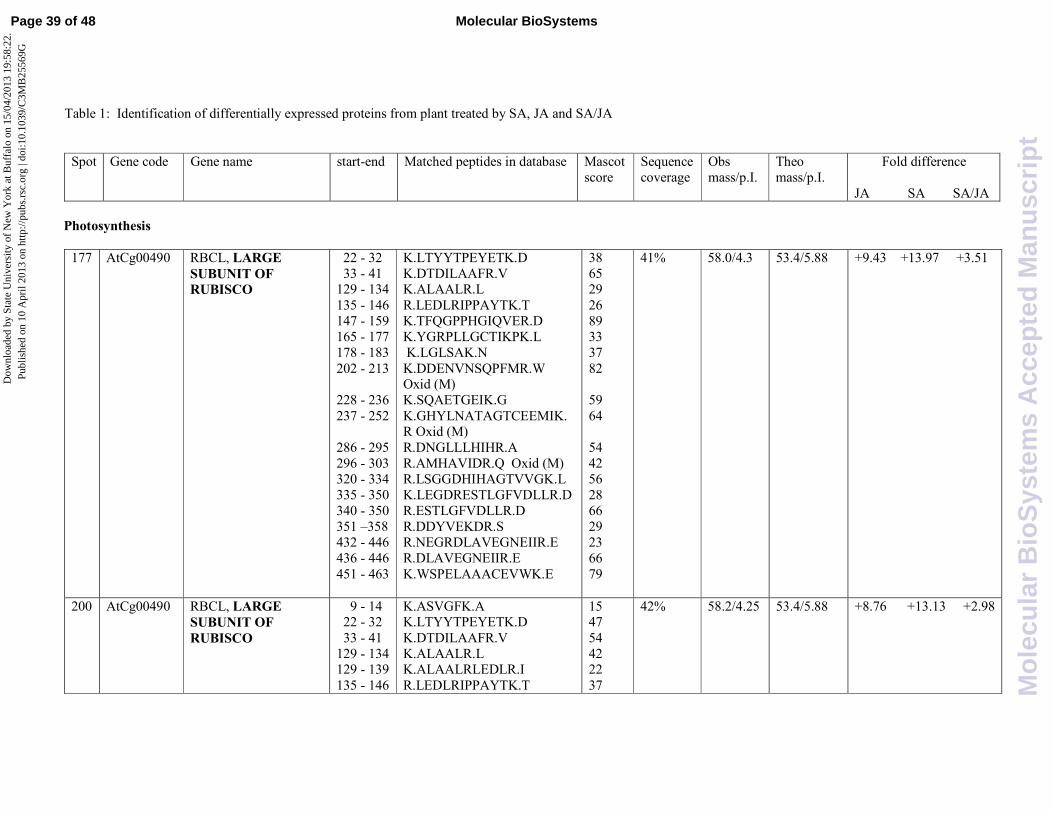
Table 1: Identification of differentially expressed proteins from plant treated by SA, JA and SA/JA
Spot Gene code Gene name start-end Matched peptides in database Mascot
score
Sequence
coverage
Obs
mass/p.I.
Theo
mass/p.I.
Fold difference
JA SA SA/JA
Photosynthesis
177 AtCg00490 RBCL, LARGE
SUBUNIT OF
RUBISCO
22 - 32
33 - 41 129 - 134
135 - 146
147 - 159
165 - 177
178 - 183
202 - 213
228 - 236
237 - 252
286 - 295
296 - 303
320 - 334
335 - 350
340 - 350
351 –358
432 - 446
436 - 446
451 - 463
K.LTYYTPEYETK.D
K.DTDILAAFR.V K.ALAALR.L
R.LEDLRIPPAYTK.T
K.TFQGPPHGIQVER.D
K.YGRPLLGCTIKPK.L
K.LGLSAK.N
K.DDENVNSQPFMR.W Oxid (M)
K.SQAETGEIK.G
K.GHYLNATAGTCEEMIK.R Oxid (M)
R.DNGLLLHIHR.A
R.AMHAVIDR.Q Oxid (M)
R.LSGGDHIHAGTVVGK.L
K.LEGDRESTLGFVDLLR.D
R.ESTLGFVDLLR.D
R.DDYVEKDR.S
R.NEGRDLAVEGNEIIR.E
R.DLAVEGNEIIR.E
K.WSPELAAACEVWK.E
38
65 29
26
89
33
37
82
59
64
54
42
56
28
66
29
23
66
79
41% 58.0/4.3 53.4/5.88 +9.43 +13.97 +3.51
200 AtCg00490 RBCL, LARGE
SUBUNIT OF
RUBISCO
9 - 14 22 - 32
33 - 41
129 - 134 129 - 139
135 - 146
K.ASVGFK.A K.LTYYTPEYETK.D
K.DTDILAAFR.V
K.ALAALR.L K.ALAALRLEDLR.I
R.LEDLRIPPAYTK.T
15 47
54
42 22
37
42% 58.2/4.25 53.4/5.88 +8.76 +13.13 +2.98
Page 39 of 48 Molecular BioSystems
Mo
lecu
lar
Bio
Sys
tem
s A
ccep
ted
Man
usc
rip
t
Dow
nloa
ded
by S
tate
Uni
vers
ity o
f N
ew Y
ork
at B
uffa
lo o
n 15
/04/
2013
19:
58:2
2.
Publ
ishe
d on
10
Apr
il 20
13 o
n ht
tp://
pubs
.rsc
.org
| do
i:10.
1039
/C3M
B25
569G
View Article Online
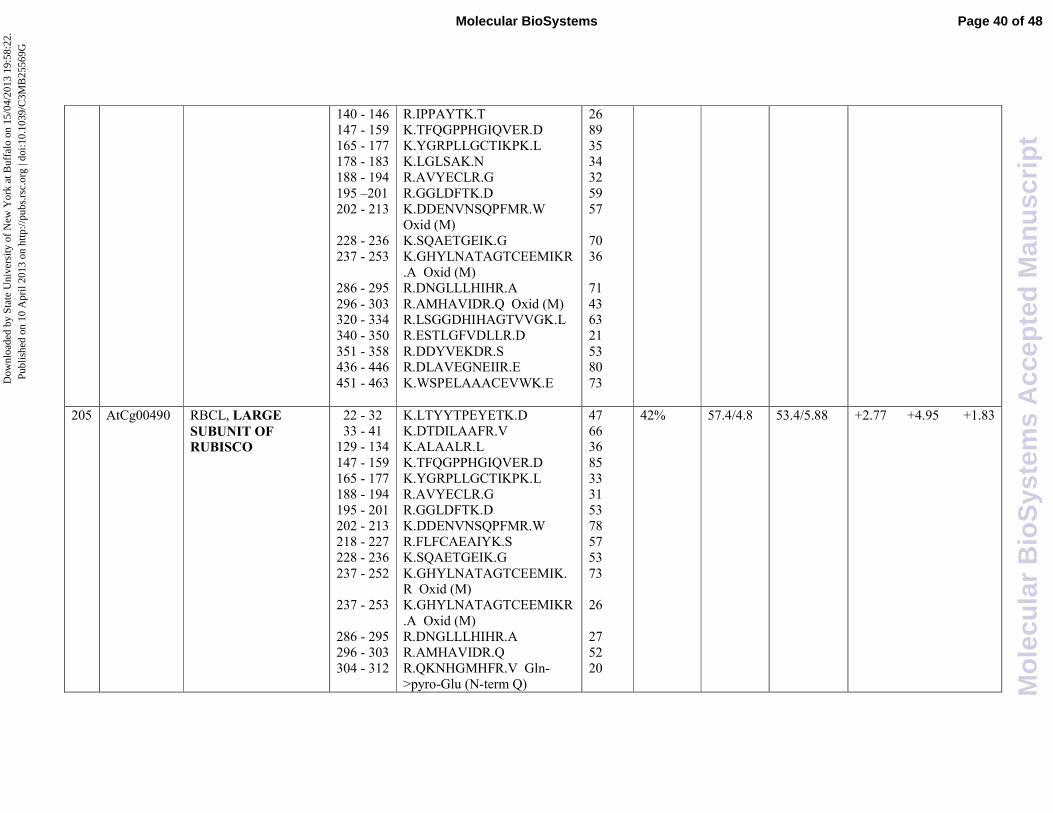
140 - 146
147 - 159
165 - 177
178 - 183
188 - 194
195 –201
202 - 213
228 - 236
237 - 253
286 - 295
296 - 303 320 - 334
340 - 350
351 - 358 436 - 446
451 - 463
R.IPPAYTK.T
K.TFQGPPHGIQVER.D
K.YGRPLLGCTIKPK.L
K.LGLSAK.N
R.AVYECLR.G
R.GGLDFTK.D
K.DDENVNSQPFMR.W
Oxid (M)
K.SQAETGEIK.G
K.GHYLNATAGTCEEMIKR
.A Oxid (M)
R.DNGLLLHIHR.A
R.AMHAVIDR.Q Oxid (M) R.LSGGDHIHAGTVVGK.L
R.ESTLGFVDLLR.D
R.DDYVEKDR.S R.DLAVEGNEIIR.E
K.WSPELAAACEVWK.E
26
89
35
34
32
59
57
70
36
71
43 63
21
53 80
73
205 AtCg00490 RBCL, LARGE
SUBUNIT OF
RUBISCO
22 - 32
33 - 41 129 - 134
147 - 159
165 - 177
188 - 194
195 - 201
202 - 213
218 - 227
228 - 236
237 - 252
237 - 253
286 - 295
296 - 303
304 - 312
K.LTYYTPEYETK.D
K.DTDILAAFR.V K.ALAALR.L
K.TFQGPPHGIQVER.D
K.YGRPLLGCTIKPK.L
R.AVYECLR.G
R.GGLDFTK.D
K.DDENVNSQPFMR.W
R.FLFCAEAIYK.S
K.SQAETGEIK.G
K.GHYLNATAGTCEEMIK.R Oxid (M)
K.GHYLNATAGTCEEMIKR
.A Oxid (M)
R.DNGLLLHIHR.A
R.AMHAVIDR.Q
R.QKNHGMHFR.V Gln-
>pyro-Glu (N-term Q)
47
66 36
85
33
31
53
78
57
53
73
26
27
52
20
42% 57.4/4.8 53.4/5.88 +2.77 +4.95 +1.83
Page 40 of 48Molecular BioSystems
Mo
lecu
lar
Bio
Sys
tem
s A
ccep
ted
Man
usc
rip
t
Dow
nloa
ded
by S
tate
Uni
vers
ity o
f N
ew Y
ork
at B
uffa
lo o
n 15
/04/
2013
19:
58:2
2.
Publ
ishe
d on
10
Apr
il 20
13 o
n ht
tp://
pubs
.rsc
.org
| do
i:10.
1039
/C3M
B25
569G
View Article Online
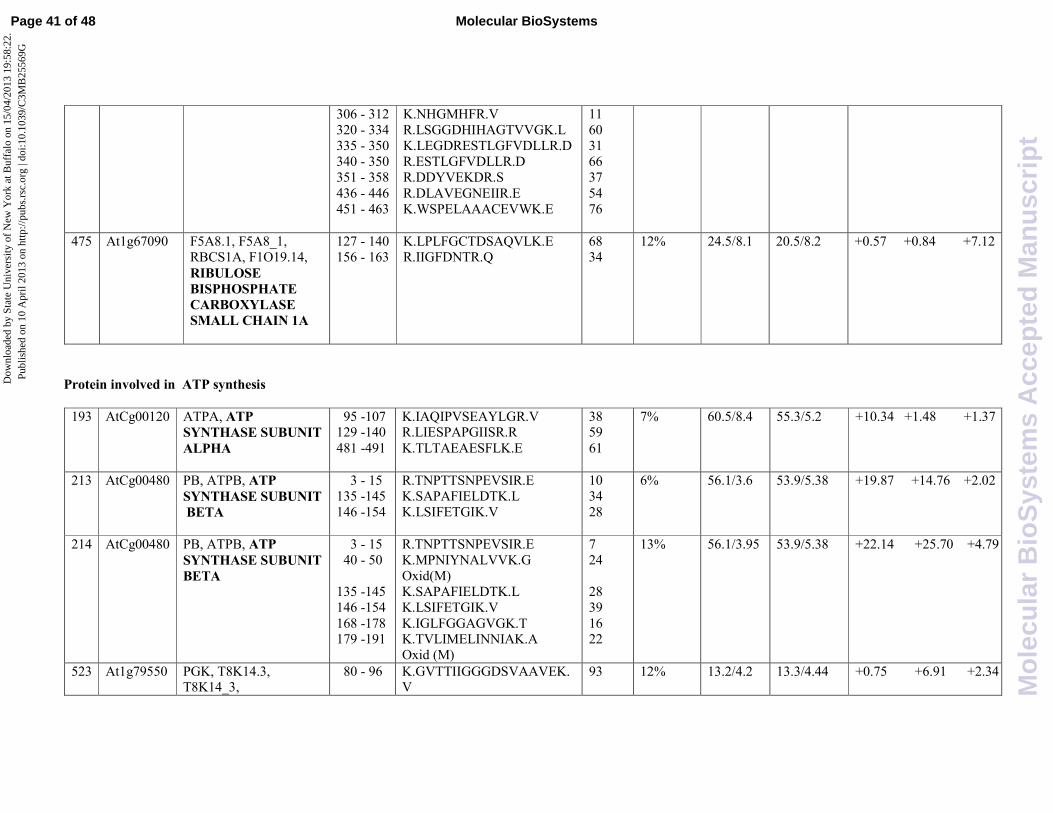
306 - 312
320 - 334
335 - 350
340 - 350
351 - 358
436 - 446
451 - 463
K.NHGMHFR.V
R.LSGGDHIHAGTVVGK.L
K.LEGDRESTLGFVDLLR.D
R.ESTLGFVDLLR.D
R.DDYVEKDR.S
R.DLAVEGNEIIR.E
K.WSPELAAACEVWK.E
11
60
31
66
37
54
76
475 At1g67090 F5A8.1, F5A8_1,
RBCS1A, F1O19.14,
RIBULOSE
BISPHOSPHATE
CARBOXYLASE
SMALL CHAIN 1A
127 - 140
156 - 163
K.LPLFGCTDSAQVLK.E
R.IIGFDNTR.Q
68
34
12% 24.5/8.1 20.5/8.2 +0.57 +0.84 +7.12
Protein involved in ATP synthesis
193 AtCg00120 ATPA, ATP
SYNTHASE SUBUNIT
ALPHA
95 -107 129 -140
481 -491
K.IAQIPVSEAYLGR.V R.LIESPAPGIISR.R
K.TLTAEAESFLK.E
38 59
61
7% 60.5/8.4 55.3/5.2 +10.34 +1.48 +1.37
213 AtCg00480 PB, ATPB, ATP
SYNTHASE SUBUNIT
BETA
3 - 15
135 -145
146 -154
R.TNPTTSNPEVSIR.E
K.SAPAFIELDTK.L
K.LSIFETGIK.V
10
34
28
6% 56.1/3.6 53.9/5.38 +19.87 +14.76 +2.02
214 AtCg00480 PB, ATPB, ATP
SYNTHASE SUBUNIT
BETA
3 - 15
40 - 50
135 -145
146 -154
168 -178 179 -191
R.TNPTTSNPEVSIR.E
K.MPNIYNALVVK.G
Oxid(M)
K.SAPAFIELDTK.L
K.LSIFETGIK.V
K.IGLFGGAGVGK.T K.TVLIMELINNIAK.A
Oxid (M)
7
24
28
39
16 22
13% 56.1/3.95 53.9/5.38 +22.14 +25.70 +4.79
523 At1g79550 PGK, T8K14.3, T8K14_3,
80 - 96 K.GVTTIIGGGDSVAAVEK.V
93 12% 13.2/4.2 13.3/4.44 +0.75 +6.91 +2.34
Page 41 of 48 Molecular BioSystems
Mo
lecu
lar
Bio
Sys
tem
s A
ccep
ted
Man
usc
rip
t
Dow
nloa
ded
by S
tate
Uni
vers
ity o
f N
ew Y
ork
at B
uffa
lo o
n 15
/04/
2013
19:
58:2
2.
Publ
ishe
d on
10
Apr
il 20
13 o
n ht
tp://
pubs
.rsc
.org
| do
i:10.
1039
/C3M
B25
569G
View Article Online
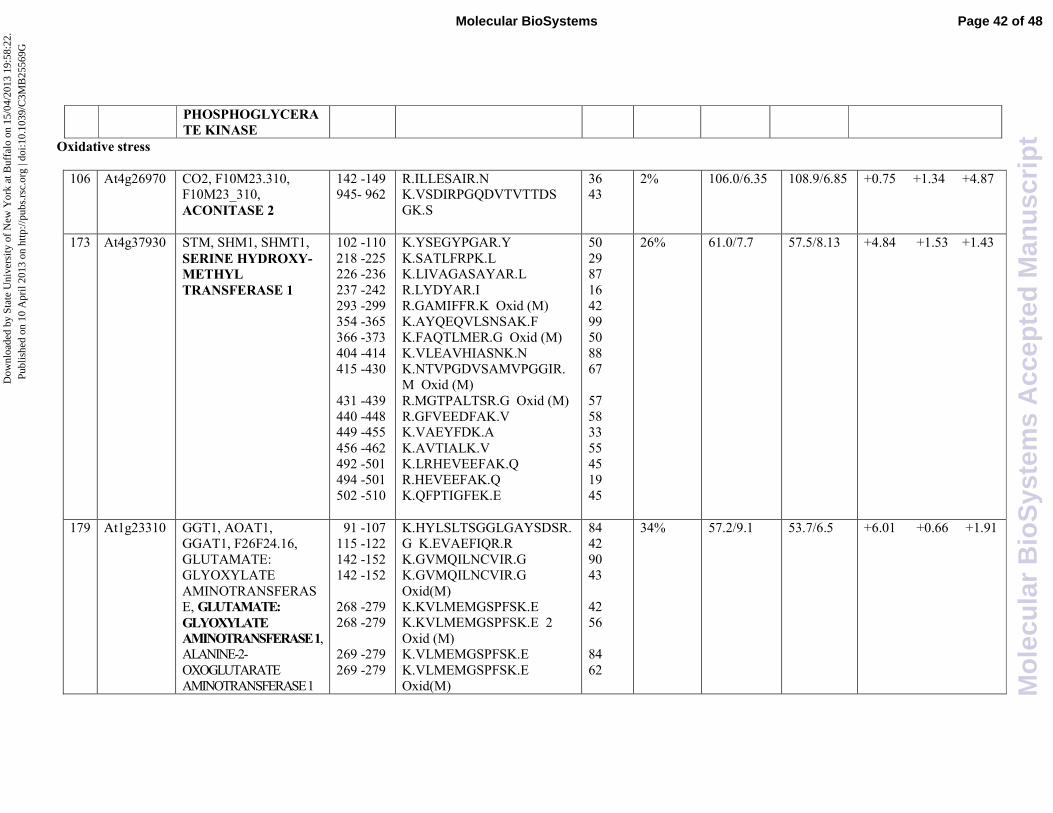
PHOSPHOGLYCERA
TE KINASE
Oxidative stress
106 At4g26970
CO2, F10M23.310, F10M23_310,
ACONITASE 2
142 -149 945- 962
R.ILLESAIR.N K.VSDIRPGQDVTVTTDS
GK.S
36 43
2% 106.0/6.35
108.9/6.85 +0.75 +1.34 +4.87
173 At4g37930
STM, SHM1, SHMT1,
SERINE HYDROXY-
METHYL
TRANSFERASE 1
102 -110
218 -225 226 -236
237 -242
293 -299
354 -365
366 -373
404 -414
415 -430
431 -439
440 -448 449 -455
456 -462
492 -501
494 -501
502 -510
K.YSEGYPGAR.Y
K.SATLFRPK.L K.LIVAGASAYAR.L
R.LYDYAR.I
R.GAMIFFR.K Oxid (M)
K.AYQEQVLSNSAK.F
K.FAQTLMER.G Oxid (M)
K.VLEAVHIASNK.N
K.NTVPGDVSAMVPGGIR.
M Oxid (M)
R.MGTPALTSR.G Oxid (M)
R.GFVEEDFAK.V K.VAEYFDK.A
K.AVTIALK.V
K.LRHEVEEFAK.Q
R.HEVEEFAK.Q
K.QFPTIGFEK.E
50
29 87
16
42
99
50
88
67
57
58 33
55
45
19
45
26%
61.0/7.7
57.5/8.13
+4.84 +1.53 +1.43
179 At1g23310
GGT1, AOAT1,
GGAT1, F26F24.16,
GLUTAMATE:
GLYOXYLATE
AMINOTRANSFERASE, GLUTAMATE:
GLYOXYLATE
AMINOTRANSFERASE 1, ALANINE-2-
OXOGLUTARATE
AMINOTRANSFERASE 1
91 -107
115 -122
142 -152
142 -152
268 -279
268 -279
269 -279
269 -279
K.HYLSLTSGGLGAYSDSR.
G K.EVAEFIQR.R
K.GVMQILNCVIR.G
K.GVMQILNCVIR.G
Oxid(M) K.KVLMEMGSPFSK.E
K.KVLMEMGSPFSK.E 2
Oxid (M) K.VLMEMGSPFSK.E
K.VLMEMGSPFSK.E
Oxid(M)
84
42
90
43
42
56
84
62
34% 57.2/9.1 53.7/6.5 +6.01 +0.66 +1.91
Page 42 of 48Molecular BioSystems
Mo
lecu
lar
Bio
Sys
tem
s A
ccep
ted
Man
usc
rip
t
Dow
nloa
ded
by S
tate
Uni
vers
ity o
f N
ew Y
ork
at B
uffa
lo o
n 15
/04/
2013
19:
58:2
2.
Publ
ishe
d on
10
Apr
il 20
13 o
n ht
tp://
pubs
.rsc
.org
| do
i:10.
1039
/C3M
B25
569G
View Article Online
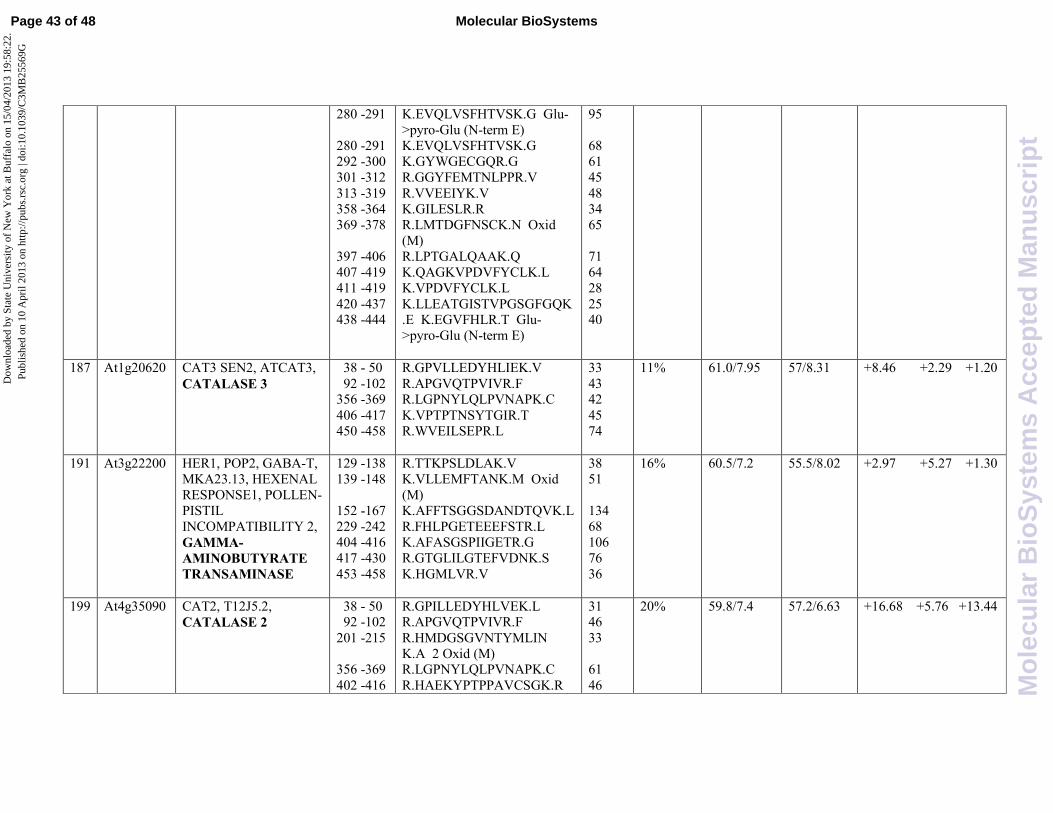
280 -291
280 -291
292 -300
301 -312
313 -319
358 -364
369 -378
397 -406
407 -419
411 -419
420 -437 438 -444
K.EVQLVSFHTVSK.G Glu-
>pyro-Glu (N-term E)
K.EVQLVSFHTVSK.G
K.GYWGECGQR.G
R.GGYFEMTNLPPR.V
R.VVEEIYK.V
K.GILESLR.R
R.LMTDGFNSCK.N Oxid
(M)
R.LPTGALQAAK.Q
K.QAGKVPDVFYCLK.L
K.VPDVFYCLK.L
K.LLEATGISTVPGSGFGQK.E K.EGVFHLR.T Glu-
>pyro-Glu (N-term E)
95
68
61
45
48
34
65
71
64
28
25 40
187 At1g20620 CAT3 SEN2, ATCAT3,
CATALASE 3
38 - 50
92 -102 356 -369
406 -417
450 -458
R.GPVLLEDYHLIEK.V
R.APGVQTPVIVR.F R.LGPNYLQLPVNAPK.C
K.VPTPTNSYTGIR.T
R.WVEILSEPR.L
33
43 42
45
74
11% 61.0/7.95 57/8.31 +8.46 +2.29 +1.20
191
At3g22200 HER1, POP2, GABA-T,
MKA23.13, HEXENAL
RESPONSE1, POLLEN-
PISTIL
INCOMPATIBILITY 2,
GAMMA-
AMINOBUTYRATE
TRANSAMINASE
129 -138
139 -148
152 -167
229 -242
404 -416
417 -430
453 -458
R.TTKPSLDLAK.V
K.VLLEMFTANK.M Oxid
(M)
K.AFFTSGGSDANDTQVK.L
R.FHLPGETEEEFSTR.L
K.AFASGSPIIGETR.G
R.GTGLILGTEFVDNK.S
K.HGMLVR.V
38
51
134
68
106
76
36
16% 60.5/7.2 55.5/8.02 +2.97 +5.27 +1.30
199 At4g35090
CAT2, T12J5.2,
CATALASE 2
38 - 50 92 -102
201 -215
356 -369
402 -416
R.GPILLEDYHLVEK.L R.APGVQTPVIVR.F
R.HMDGSGVNTYMLIN
K.A 2 Oxid (M) R.LGPNYLQLPVNAPK.C
R.HAEKYPTPPAVCSGK.R
31 46
33
61
46
20% 59.8/7.4 57.2/6.63 +16.68 +5.76 +13.44
Page 43 of 48 Molecular BioSystems
Mo
lecu
lar
Bio
Sys
tem
s A
ccep
ted
Man
usc
rip
t
Dow
nloa
ded
by S
tate
Uni
vers
ity o
f N
ew Y
ork
at B
uffa
lo o
n 15
/04/
2013
19:
58:2
2.
Publ
ishe
d on
10
Apr
il 20
13 o
n ht
tp://
pubs
.rsc
.org
| do
i:10.
1039
/C3M
B25
569G
View Article Online
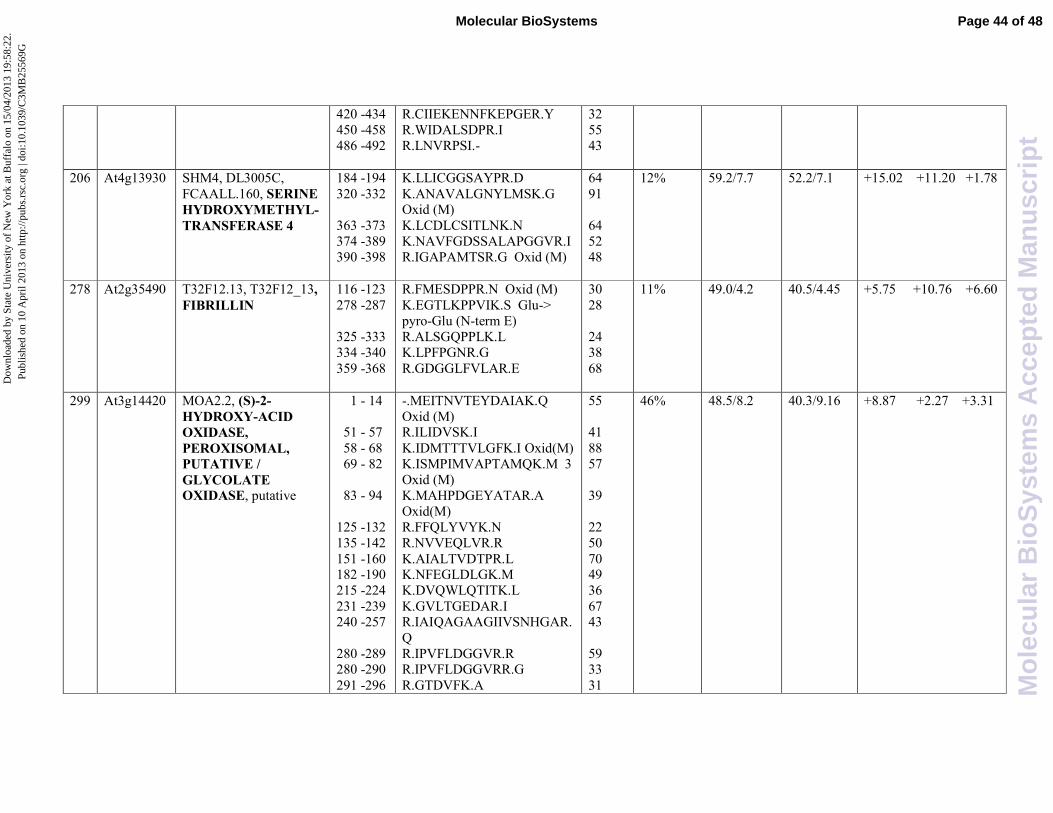
420 -434
450 -458
486 -492
R.CIIEKENNFKEPGER.Y
R.WIDALSDPR.I
R.LNVRPSI.-
32
55
43
206 At4g13930 SHM4, DL3005C,
FCAALL.160, SERINE
HYDROXYMETHYL-
TRANSFERASE 4
184 -194
320 -332
363 -373
374 -389
390 -398
K.LLICGGSAYPR.D
K.ANAVALGNYLMSK.G Oxid (M)
K.LCDLCSITLNK.N
K.NAVFGDSSALAPGGVR.I
R.IGAPAMTSR.G Oxid (M)
64
91
64
52
48
12% 59.2/7.7 52.2/7.1 +15.02 +11.20 +1.78
278 At2g35490
T32F12.13, T32F12_13,
FIBRILLIN
116 -123
278 -287
325 -333
334 -340
359 -368
R.FMESDPPR.N Oxid (M)
K.EGTLKPPVIK.S Glu->
pyro-Glu (N-term E)
R.ALSGQPPLK.L
K.LPFPGNR.G
R.GDGGLFVLAR.E
30
28
24
38
68
11% 49.0/4.2 40.5/4.45 +5.75 +10.76 +6.60
299 At3g14420
MOA2.2, (S)-2-
HYDROXY-ACID
OXIDASE,
PEROXISOMAL,
PUTATIVE /
GLYCOLATE
OXIDASE, putative
1 - 14
51 - 57
58 - 68
69 - 82
83 - 94
125 -132
135 -142
151 -160 182 -190
215 -224
231 -239 240 -257
280 -289 280 -290
291 -296
-.MEITNVTEYDAIAK.Q
Oxid (M) R.ILIDVSK.I
K.IDMTTTVLGFK.I Oxid(M)
K.ISMPIMVAPTAMQK.M 3
Oxid (M)
K.MAHPDGEYATAR.A
Oxid(M)
R.FFQLYVYK.N
R.NVVEQLVR.R
K.AIALTVDTPR.L K.NFEGLDLGK.M
K.DVQWLQTITK.L
K.GVLTGEDAR.I R.IAIQAGAAGIIVSNHGAR.
Q
R.IPVFLDGGVR.R R.IPVFLDGGVRR.G
R.GTDVFK.A
55
41
88
57
39
22
50
70 49
36
67 43
59 33
31
46%
48.5/8.2
40.3/9.16
+8.87 +2.27 +3.31
Page 44 of 48Molecular BioSystems
Mo
lecu
lar
Bio
Sys
tem
s A
ccep
ted
Man
usc
rip
t
Dow
nloa
ded
by S
tate
Uni
vers
ity o
f N
ew Y
ork
at B
uffa
lo o
n 15
/04/
2013
19:
58:2
2.
Publ
ishe
d on
10
Apr
il 20
13 o
n ht
tp://
pubs
.rsc
.org
| do
i:10.
1039
/C3M
B25
569G
View Article Online
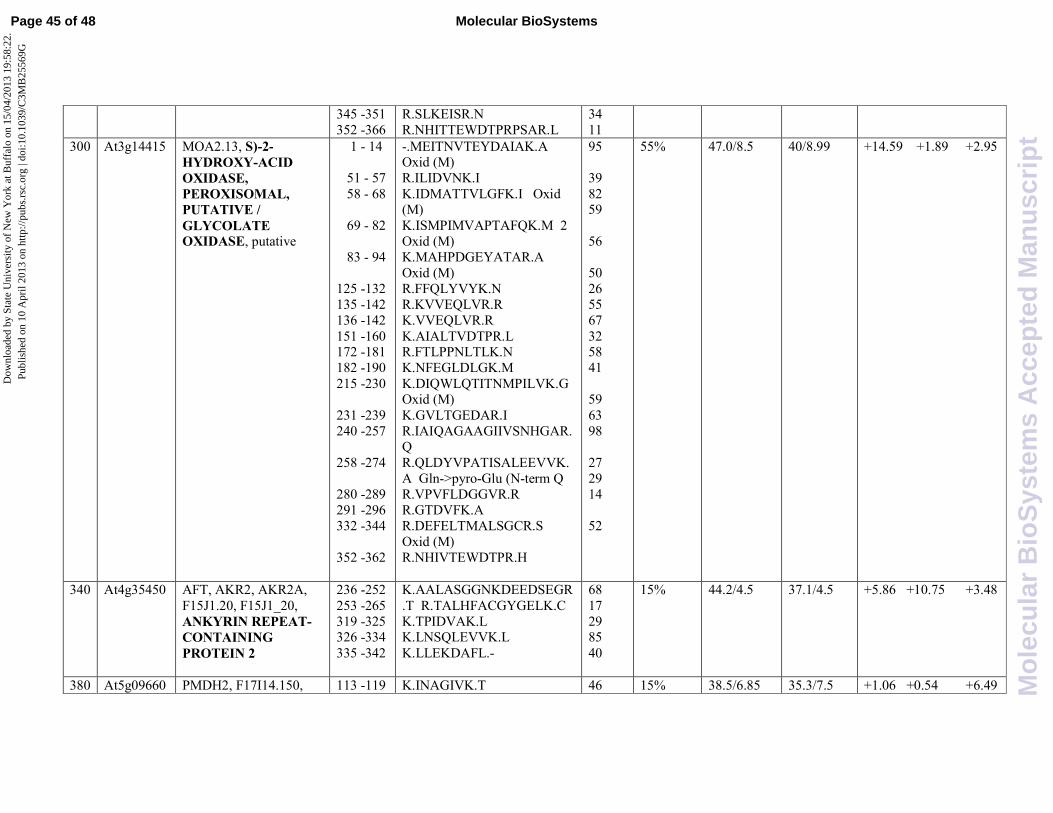
345 -351
352 -366
R.SLKEISR.N
R.NHITTEWDTPRPSAR.L
34
11
300
At3g14415
MOA2.13, S)-2-
HYDROXY-ACID
OXIDASE,
PEROXISOMAL,
PUTATIVE /
GLYCOLATE
OXIDASE, putative
1 - 14
51 - 57
58 - 68
69 - 82
83 - 94
125 -132
135 -142
136 -142
151 -160 172 -181
182 -190
215 -230
231 -239
240 -257
258 -274
280 -289
291 -296
332 -344
352 -362
-.MEITNVTEYDAIAK.A Oxid (M)
R.ILIDVNK.I
K.IDMATTVLGFK.I Oxid (M)
K.ISMPIMVAPTAFQK.M 2
Oxid (M)
K.MAHPDGEYATAR.A
Oxid (M)
R.FFQLYVYK.N
R.KVVEQLVR.R
K.VVEQLVR.R
K.AIALTVDTPR.L R.FTLPPNLTLK.N
K.NFEGLDLGK.M
K.DIQWLQTITNMPILVK.G Oxid (M)
K.GVLTGEDAR.I
R.IAIQAGAAGIIVSNHGAR.Q
R.QLDYVPATISALEEVVK.
A Gln->pyro-Glu (N-term Q
R.VPVFLDGGVR.R
R.GTDVFK.A
R.DEFELTMALSGCR.S
Oxid (M)
R.NHIVTEWDTPR.H
95
39
82 59
56
50
26
55
67
32 58
41
59
63
98
27
29
14
52
55%
47.0/8.5
40/8.99
+14.59 +1.89 +2.95
340 At4g35450 AFT, AKR2, AKR2A,
F15J1.20, F15J1_20,
ANKYRIN REPEAT-
CONTAINING
PROTEIN 2
236 -252
253 -265
319 -325 326 -334
335 -342
K.AALASGGNKDEEDSEGR
.T R.TALHFACGYGELK.C
K.TPIDVAK.L K.LNSQLEVVK.L
K.LLEKDAFL.-
68
17
29 85
40
15% 44.2/4.5 37.1/4.5 +5.86 +10.75 +3.48
380 At5g09660 PMDH2, F17I14.150, 113 -119 K.INAGIVK.T 46 15% 38.5/6.85 35.3/7.5 +1.06 +0.54 +6.49
Page 45 of 48 Molecular BioSystems
Mo
lecu
lar
Bio
Sys
tem
s A
ccep
ted
Man
usc
rip
t
Dow
nloa
ded
by S
tate
Uni
vers
ity o
f N
ew Y
ork
at B
uffa
lo o
n 15
/04/
2013
19:
58:2
2.
Publ
ishe
d on
10
Apr
il 20
13 o
n ht
tp://
pubs
.rsc
.org
| do
i:10.
1039
/C3M
B25
569G
View Article Online
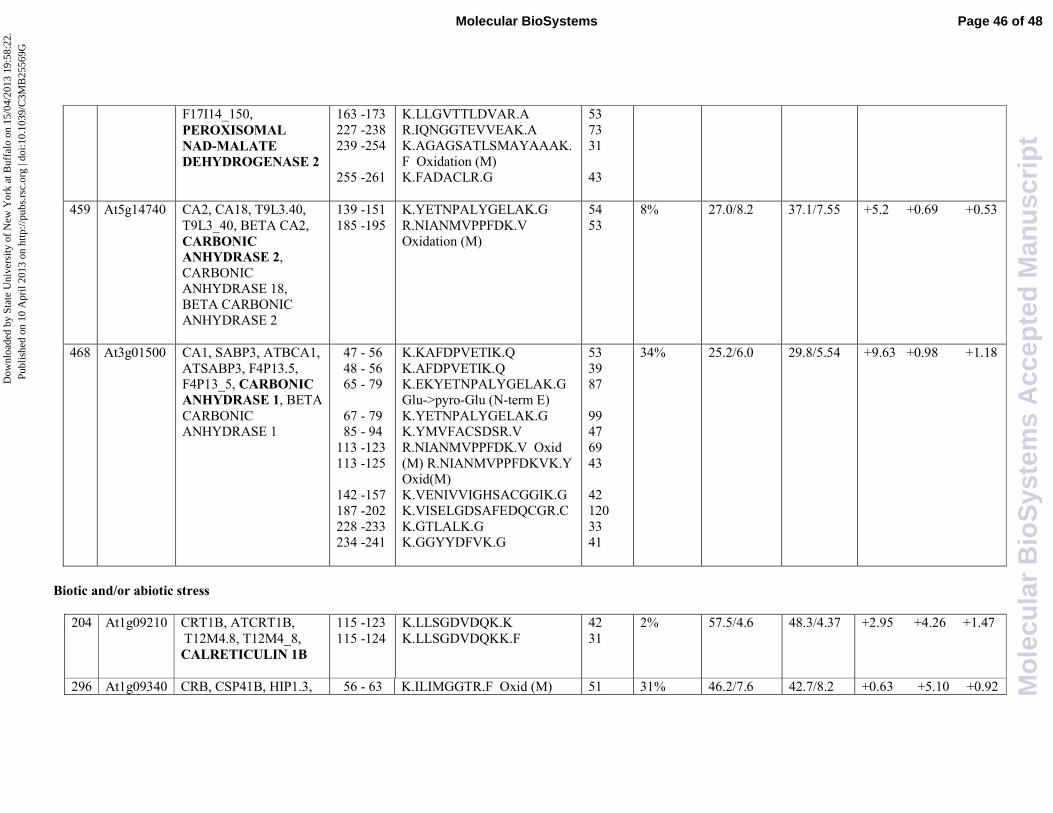
F17I14_150,
PEROXISOMAL
NAD-MALATE
DEHYDROGENASE 2
163 -173
227 -238
239 -254
255 -261
K.LLGVTTLDVAR.A
R.IQNGGTEVVEAK.A
K.AGAGSATLSMAYAAAK.
F Oxidation (M)
K.FADACLR.G
53
73
31
43
459 At5g14740 CA2, CA18, T9L3.40,
T9L3_40, BETA CA2,
CARBONIC
ANHYDRASE 2,
CARBONIC
ANHYDRASE 18,
BETA CARBONIC
ANHYDRASE 2
139 -151
185 -195
K.YETNPALYGELAK.G
R.NIANMVPPFDK.V
Oxidation (M)
54
53
8% 27.0/8.2
37.1/7.55 +5.2 +0.69 +0.53
468 At3g01500 CA1, SABP3, ATBCA1,
ATSABP3, F4P13.5, F4P13_5, CARBONIC
ANHYDRASE 1, BETA
CARBONIC ANHYDRASE 1
47 - 56
48 - 56 65 - 79
67 - 79 85 - 94
113 -123
113 -125
142 -157
187 -202
228 -233
234 -241
K.KAFDPVETIK.Q
K.AFDPVETIK.Q K.EKYETNPALYGELAK.G
Glu->pyro-Glu (N-term E)
K.YETNPALYGELAK.G K.YMVFACSDSR.V
R.NIANMVPPFDK.V Oxid
(M) R.NIANMVPPFDKVK.Y
Oxid(M)
K.VENIVVIGHSACGGIK.G
K.VISELGDSAFEDQCGR.C
K.GTLALK.G
K.GGYYDFVK.G
53
39 87
99 47
69
43
42
120
33
41
34% 25.2/6.0 29.8/5.54 +9.63 +0.98 +1.18
Biotic and/or abiotic stress
204 At1g09210 CRT1B, ATCRT1B,
T12M4.8, T12M4_8,
CALRETICULIN 1B
115 -123
115 -124
K.LLSGDVDQK.K
K.LLSGDVDQKK.F
42
31
2% 57.5/4.6 48.3/4.37 +2.95 +4.26 +1.47
296 At1g09340 CRB, CSP41B, HIP1.3, 56 - 63 K.ILIMGGTR.F Oxid (M) 51 31% 46.2/7.6 42.7/8.2 +0.63 +5.10 +0.92
Page 46 of 48Molecular BioSystems
Mo
lecu
lar
Bio
Sys
tem
s A
ccep
ted
Man
usc
rip
t
Dow
nloa
ded
by S
tate
Uni
vers
ity o
f N
ew Y
ork
at B
uffa
lo o
n 15
/04/
2013
19:
58:2
2.
Publ
ishe
d on
10
Apr
il 20
13 o
n ht
tp://
pubs
.rsc
.org
| do
i:10.
1039
/C3M
B25
569G
View Article Online
CHLOROPLAST RNA
BINDING,
HETEROGLYCAN-
INTERACTING
PROTEIN 1.3,
CHLOROPLAST
STEM-LOOP BINDING
PROTEIN
OF 41 KDA
109 -116
141 -154
155 -169
187 -200
189 -200
191 -200
252 -265
269 -277
278 -286
291 -305
361 -373
K.ILHLKGDR.K
R.EAEEVEPILEALPK.L
K.LEQYIYCSSAGVYLK.S
R.HKGKLETESLLQSK.G
K.GKLETESLLQSK.G
K.LETESLLQSK.G
K.DLATAFLNVLGNEK.A
R.EIFNISGEK.Y
K.YVTFDGLAK.A
K.AGGFPEPEIVHYNPK.E
K.EADFTTDDMILSK.K
Oxid (M)
34
47
84
27
40
19
28
41
25
13
75
302 At2g46280
TIF3I1, TRIP-1,
T3F17.7,
TGF-BETA
RECEPTOR
INTERACTING
PROTEIN 1
21 - 30
67 - 77 83 - 91
92 - 97
98 - 106 107 -118
202 -215
224 -229 304 -315
R.EGDLLFSCAK.D
R.LITGSADQTAK.L K.SGKELFTFK.F
K.FNAPTR.S
R.SVDFAVGDR.L R.LAVITTDHFVDR.T
K.AADDSHFLTGSLDK.T
R.TLTLLK.T K.SFSSGGEDGYVR.L
26
69 20
41
52 23
28
26 90
27%
45.8/7.7 36.5/6.90
+1.65 +4.44 +0.83
348 At4g02450 T14P8.5, T14P8_5,
HSP20-LIKE
CHAPERONE
9 - 15
16 - 26
30 - 43
44 - 54
55 - 67
61 - 73
68 - 73 74 - 81
93 -101
228 -238 228 -241
K.WAETTEK.I
K.IFLTVVLADTK.D
K.VNLDPEGVFDFSAK.V
K.VGPENHVYELK.L
K.LELADKVNVEESK.I
K.VNVEESKINIGER.S
K.INIGER.S R.SIFCIIEK.A
R.VKKPPHYVK.V
K.APAAEETTSVK.E K.APAAEETTSVKEDK.-
30
69
51
64
87
31
42 37
19
54 71
38% 42.5/4.2 28/4.4 +47.5 +166 +29.4
375 At5g19510
eEF1Balpha2,
ELONGATION
2 - 15
16 - 24
M.AVTFSDLHTEEGVK.S
K.SVEEHLAGK.T
99
48
24% 38.1/4.0 24.2/4.4 +0.63 +1.03 +6.07
Page 47 of 48 Molecular BioSystems
Mo
lecu
lar
Bio
Sys
tem
s A
ccep
ted
Man
usc
rip
t
Dow
nloa
ded
by S
tate
Uni
vers
ity o
f N
ew Y
ork
at B
uffa
lo o
n 15
/04/
2013
19:
58:2
2.
Publ
ishe
d on
10
Apr
il 20
13 o
n ht
tp://
pubs
.rsc
.org
| do
i:10.
1039
/C3M
B25
569G
View Article Online
FACTOR 1B ALPHA-
SUBUNIT 2
57 - 67
153 -159
154 -159
160 -172
K.WYESVASQLAK.S
K.KLEEAVR.G
K.LEEAVR.G
R.GVEMPGLFWGASK.L
Oxid (M)
84
35
36
45
423 At5g02240 NAD-DEPENDENT
EPIMERASE/DEHYD
RATASE, SDR_a5
2 – 15
16 - 23
24 - 34
174 -185
M.ANLPTVLVTGASGR.T
R.TGQIVYKK.L
K.LKEGSDKFVAK.G
R.AGGLLDKEGGVR.E
43
20
25
14
17% 32.25/6.4 27.1/6.2 +6.3 +7.78 +1.20
2D-PAGE protein profiles from pooled SA, JA and SA/JA treated plants were compared to controls and differentially expressed proteins identified. Spot numbers refer to
Fig. 1. ‘Gene code’ refers to the unique identifier in the A. thaliana database (www.arabidopsis.org). Identified proteins that were differentially expressed by 4-fold or
more are listed here. Mass/pI values came from NCBI database.
Page 48 of 48Molecular BioSystems
Mo
lecu
lar
Bio
Sys
tem
s A
ccep
ted
Man
usc
rip
t
Dow
nloa
ded
by S
tate
Uni
vers
ity o
f N
ew Y
ork
at B
uffa
lo o
n 15
/04/
2013
19:
58:2
2.
Publ
ishe
d on
10
Apr
il 20
13 o
n ht
tp://
pubs
.rsc
.org
| do
i:10.
1039
/C3M
B25
569G
View Article Online
Table 2
Primer sequences used for gene expression analyses.
Gene name Primer Name Sequence 5' to 3'
ACO2 (At4g26970) ACO2 F TCTAATGGACCGTGGTGTGA
ACO2 R TACTTGCTGCATCGAAAACG
SHM1 (At4g37930) SHM1 F GCAGAGGCCACAATTCTCTC
SHM1 R GGACGAATGGGTTTGTCAAT
GGAT1 (At1g23310) GGAT1F CAATTTCAGTGGCTCTGCTG
GGAT1R GGAGAGTCACGTTCGGTTCT
CAT3 (At1g20620) CAT3 F CCAAAAACTCATGTTTCCTTCC
CAT3 R TGATCCATTTCAGGATTCTCC
GABA-T (At3g22200) GABA-T F TTAAAGCGTTTGCCTCTGGT
GABA-T R CATCAAAATGCCATCACCTG
CAT2 (At4g35090) CAT2 F CATCATGTGGATCTTCTGTGC
CAT2 R TCGACAGCTCTTACGGGATT
SHM4 (At4g13930) SHM4 F AGGCGAAGAGATGAAGATGC
SHM4 R AAACCCATACAAACACACCGTA
FIBRILLIN (At2g35490) FIBR F GGGAGGAGAAATTGGAGGAG
FIBR R TCTCTAACGGAGCCGGAGTA
MOA2.2 (At3g14420) MOA2.2 F GCAGCAACACAGAACCAAAA
MOA2.2 R TCTGGGAATCACAAGAAATTGA
MOA2.13 (At3g14415) MOA2.13 F TATTTGTCCGCATCTCCACA
MOA2.13 R GAGAGAGGAAGGGTGGGACT
AKR2 (At4g35450) AKR2 F AATGGAGAAGCAGTGGCTGT
AKR2 R GACAATGTTGTGGTGGCAAA
PMDH2 (At5g09660) PMDH2 F ACGGGAAAACTGCAGAGCTA
PMDH2 R GACAACAGCTCCAGTGTCCA
CA2 (At5g14740) CA2 F TAAACATGGTCCCCTTTTGG
CA2 R CAGGTGCACCGAAAACAA
CA1 (At3g01500) CA1 F CTGATCTCCGCTTCTCTTCG
CA1 R CTGGCTCGTTACGGATAAGC
CRT1B (At1g09210) CRT1B F TTGTTTCTCTGCTAAGCCAATG
CRT1B R GGACGTTGGACTGTTGGATT
CRB (At1g09340) CRB F GGTAACGAGAAAGCCAGCAG
CRB R CTCCACCGATGCAAAGAAAT
TRIP-1 (At2g46280) TRIP-1 F AGTCTCCCATTCCGGATTTT
TRIP-1 R GCTCGCTCACACATAGAGCA
HSP20-like (At5g19510) HSP20 F TGTTCTAGAGATGATGAAAAACCA
HSP20 R CGTCAAAGCCAAAAATTTCAA
eEF1Bαααα2 (At5g19510) eEF1Bα2 F TCTCAGAGTCTCACAGCTCAGG
eEF1Bα2 R CTCCTCCACGGATTTGACAC
NADEPI (At5g02240) NADEPI F TAAGGAAGGCGGTGTACGAG
NADEPI R GCCTTGAAGTCTTTGGTTGG
UBI 10 (At4g05320) UBI10 F AAAGAGATAACAGGAACGGAAACATAGT
UBI10 R GGCCTTGTATAATCCCTGATGAATAAG
Page 49 of 48 Molecular BioSystems
Mo
lecu
lar
Bio
Sys
tem
s A
ccep
ted
Man
usc
rip
t
Dow
nloa
ded
by S
tate
Uni
vers
ity o
f N
ew Y
ork
at B
uffa
lo o
n 15
/04/
2013
19:
58:2
2.
Publ
ishe
d on
10
Apr
il 20
13 o
n ht
tp://
pubs
.rsc
.org
| do
i:10.
1039
/C3M
B25
569G
View Article Online