Embed Size (px)
Citation preview

GEOPHYSICS, VOL. 68, NO. 5 (SEPTEMBER-OCTOBER 2003); P. 1519–1524, 8 FIGS., 1 TABLE.10.1190/1.1620625
Crosshole seismoelectric measurements in borehole models with fractures
Zhenya Zhu∗ and M. Nafi Toksoz∗
ABSTRACT
Laboratory experiments are performed in cross-borehole models with fractures to investigate seismo-electric conversions in the fractures. Using an electrodein a borehole, we measure the electric field induced byan acoustic wave, and we investigate the relationship be-tween the electric signal and the fracture aperture usingultrasonic fracture borehole models. The experimentalresults confirm that a radiating electromagnetic (EM)wave is induced by a guide wave at a fracture betweenan acoustic source and electric receiver boreholes. Theposition of a vertical or inclined fracture between twoboreholes can be determined using the arrival times ofthe EM wave and the formation velocity by placing theacoustic source at a different depth and recording elec-tric signals with real or synthetic arrays of acoustic andelectric receivers in the second borehole. Crosshole seis-moelectric measurements might be a technique for in-vestigating fractures between boreholes more directlythan traditional acoustic measurements.
INTRODUCTION
The most successful tomographic techniques in the field ofseismology have used the arrival times of seismic waves tomap the velocities of the subsurface (Lo et al., 1988). Cross-hole acoustic tomography has relied on the first arrival trav-eltimes and waveforms of the wavefield to map the veloci-ties of the medium between two boreholes (Wu and Toksoz,1987; Matarese, 1993; Thompson, 1993). Crosshole seismic to-mography may show a slow formation zone, but it cannotdetermine the distribution of fractures in the zone. It is alsovery difficult to find a single fracture from crosshole acoustictomography.
Seismic waves propagating in a fluid-saturated porous-permeable medium induce fluid motion in the pores (Biot,1956; Mavko and Nur, 1979; Berryman, 1980; Plona, 1982;Bourbie et al., 1987). In the presence of ions in the fluid or
Manuscript received by the Editor June 28, 2002; revised manuscript received January 31, 2003.∗Earth Resources Laboratory, Department of Earth, Atmospheric, and Planetary Sciences, Massachusetts Institute of Technology, Cambridge,Massachusetts, 02139. E-mail: [email protected]; [email protected]© 2003 Society of Exploration Geophysicists. All rights reserved.
a double-charge layer at the fluid-solid interface, the move-ment of fluid moves the charges and generates an electric field(Morgan et al., 1989; Pride, 1994; Pride and Haartsen, 1996).In a homogeneous porous medium, the induced electric field islocal and is controlled by rock properties (porosity, permeabil-ity, lithology, saturant conductivity, etc.) and by fluid motiondriven by the seismic wave (Zhu et al., 2000). When there is aninterface in the medium, the discontinuity of the seismoelectricfield gives rise to electromagnetic (EM) radiation (Thompsonand Gist, 1993; Haartsen, 1995; Zhu et al., 1999). Seismic wavepropagation in a geological medium will produce a local elec-tric field in a homogenous formation and a radiated EM waveat interfaces between formations. When there is a fracture, theEM radiation is generally stronger than that in the case of for-mation boundaries.
In the laboratory, Zhu and Toksoz (1999) observed EM radi-ation where fractures intersected a borehole. The EM radiationwas strong where fractures were normal to borehole axis (i.e.,horizontal fracture) and weak where fractures were vertical.In a vertical seismic profile–type field experiment, Mikhailovet al. (2000) observed EM waves generated by the incidentseismic waves on fractures intersecting the borehole.
Because the seismoelectric wave induced at a fracture is aradiating EM wave, we may measure it outside the fracturearea. We may use crosshole seismoelectric measurements toreceive the EM wave induced at the fracture and to determineits position between two boreholes.
In this paper, we first observe and confirm that a received EMwave is induced at a fracture with a simple fracture boreholemodel. We investigate the relationship between the amplitudeof the EM wave and fracture aperture. Then, we investigate theseismoelectric signatures of vertical or inclined fractures be-tween two boreholes using crosshole measurements in the lab-oratory at ultrasonic frequencies. In these experiments, acous-tic sources are fixed at a point of a borehole or moved inthe borehole, and both acoustic and EM waves reach thesecond borehole and are received by an acoustic receiver oran electrode. The position of the fracture between two bore-holes can be determined from the arrival time of the EMwave.
1519
Dow
nloa
ded
06/0
2/14
to 1
30.1
27.2
38.2
33. R
edis
trib
utio
n su
bjec
t to
SEG
lice
nse
or c
opyr
ight
; see
Ter
ms
of U
se a
t http
://lib
rary
.seg
.org
/
1520 Zhu and Toksoz
SEISMOELECTRIC CONVERSION AT A FRACTURE
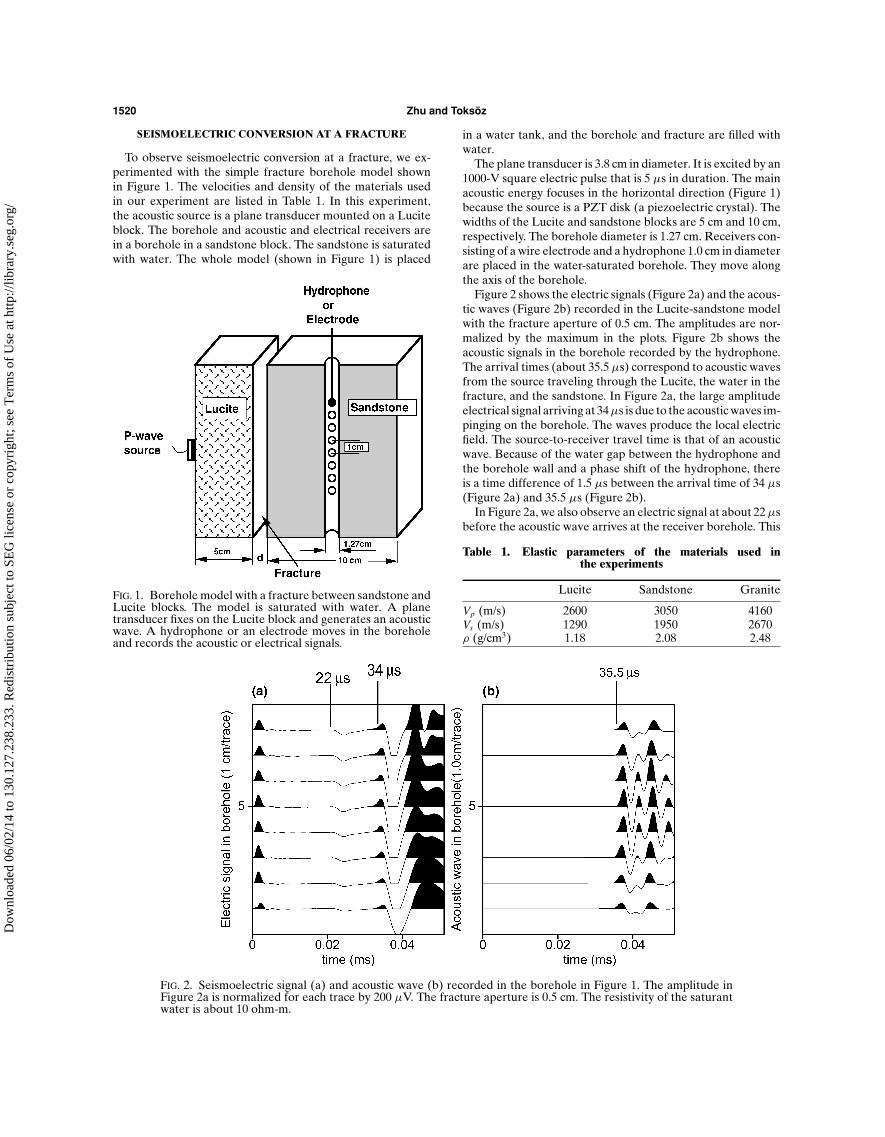
To observe seismoelectric conversion at a fracture, we ex-perimented with the simple fracture borehole model shownin Figure 1. The velocities and density of the materials usedin our experiment are listed in Table 1. In this experiment,the acoustic source is a plane transducer mounted on a Luciteblock. The borehole and acoustic and electrical receivers arein a borehole in a sandstone block. The sandstone is saturatedwith water. The whole model (shown in Figure 1) is placed
FIG. 1. Borehole model with a fracture between sandstone andLucite blocks. The model is saturated with water. A planetransducer fixes on the Lucite block and generates an acousticwave. A hydrophone or an electrode moves in the boreholeand records the acoustic or electrical signals.
FIG. 2. Seismoelectric signal (a) and acoustic wave (b) recorded in the borehole in Figure 1. The amplitude inFigure 2a is normalized for each trace by 200 μV. The fracture aperture is 0.5 cm. The resistivity of the saturantwater is about 10 ohm-m.
in a water tank, and the borehole and fracture are filled withwater.
The plane transducer is 3.8 cm in diameter. It is excited by an1000-V square electric pulse that is 5 μs in duration. The mainacoustic energy focuses in the horizontal direction (Figure 1)because the source is a PZT disk (a piezoelectric crystal). Thewidths of the Lucite and sandstone blocks are 5 cm and 10 cm,respectively. The borehole diameter is 1.27 cm. Receivers con-sisting of a wire electrode and a hydrophone 1.0 cm in diameterare placed in the water-saturated borehole. They move alongthe axis of the borehole.
Figure 2 shows the electric signals (Figure 2a) and the acous-tic waves (Figure 2b) recorded in the Lucite-sandstone modelwith the fracture aperture of 0.5 cm. The amplitudes are nor-malized by the maximum in the plots. Figure 2b shows theacoustic signals in the borehole recorded by the hydrophone.The arrival times (about 35.5 μs) correspond to acoustic wavesfrom the source traveling through the Lucite, the water in thefracture, and the sandstone. In Figure 2a, the large amplitudeelectrical signal arriving at 34 μs is due to the acoustic waves im-pinging on the borehole. The waves produce the local electricfield. The source-to-receiver travel time is that of an acousticwave. Because of the water gap between the hydrophone andthe borehole wall and a phase shift of the hydrophone, thereis a time difference of 1.5 μs between the arrival time of 34 μs(Figure 2a) and 35.5 μs (Figure 2b).
In Figure 2a, we also observe an electric signal at about 22 μsbefore the acoustic wave arrives at the receiver borehole. This
Table 1. Elastic parameters of the materials used inthe experiments
Lucite Sandstone Granite
Vp (m/s) 2600 3050 4160Vs (m/s) 1290 1950 2670ρ (g/cm3) 1.18 2.08 2.48
Dow
nloa
ded
06/0
2/14
to 1
30.1
27.2
38.2
33. R
edis
trib
utio
n su
bjec
t to
SEG
lice
nse
or c
opyr
ight
; see
Ter
ms
of U
se a
t http
://lib
rary
.seg
.org
/
Crosshole Seismoelectric Measurements 1521
signal should be the electromagnetic wave generated at thefracture by the acoustic wave. After we measured the travel-time of the acoustic wave traveling from the acoustic source tothe Lucite side in the Lucite block, we know that the arrivaltime (22 μs) of this seismoelectric signal is that of the acousticwave propagating from the source to the sandstone side of thefracture. The following experiments confirms that this signal at22 μs is induced at the sandstone side of the fracture. The EMwave propagation time in the sandstone is negligible (nearlyzero), since the EM wavelength at 100 kHz is roughly on theorder of 1000 m and we are effectively in the electrostatic nearfield. In this experiment, the resistivity of the saturant water isabout 10 ohm–m, which is that of tap water.
To further investigate the seismoelectric signal induced ata fracture, we fixed the acoustic source (the plane trans-ducer) and the electrode in the sandstone borehole at thesame horizontal position, and recorded the seismoelectric sig-nals (Figure 3) as we changed the fracture aperture from 0to 8.82 mm (“0” means that the Lucite and sandstone blockstouch). From the arrival times of the electric signals in Figure 3,we can calculate the apparent velocity of the arrivals is 1500 m/s,which is equal to the acoustic velocity in water. Figure 4 showsthe relationship between the aperture and the amplitude of theEM signals induced at the fractures.
This experiment shows that the arrival time and the ampli-tude of the EM wave induced at the fracture increase when theaperture of the fracture increases. The results confirm that theseismoelectric conversion is induced at the sandstone side ofthe fracture, not at the Lucite side (Wu and Toksoz, 1987), andthe EM wave is generated mainly by a Stoneley wave (a guidewave) excited in the fracture.
When the aperture of the fracture increases, the arrival timeof the acoustic wave from the source to the Lucite side of thefracture should be the same as before, but the arrival time tothe sandstone side is delayed because the distance of waterbetween the Lucite and sandstone sides (aperture) increases.
FIG. 3. Seismoelectric signal recorded in a borehole (Figure 1)when the aperture d changes from 0 (trace 1) to 8.82 mm(trace 8) with an increment of 1.26 mm/trace. The amplitude isnormalized by 400 μV.
Delaying the arrival time of the EM wave in Figure 3 confirmsthe EM wave is induced at the sandstone side. This is also thereason why the apparent velocity is equal to the water velocity(1500 m/s).
When the aperture increases, the P-wave amplitude de-creases due to water attenuation. No shear wave can be excitedin the water of the fracture. Only the amplitude of the Stoneleywave excited in the fracture increases with increase in aperturebecause the Stoneley wave is a guide wave, and the main en-ergy is focused on the interface between the solid boundary andwater. This increasing amplitude of the EM wave in Figure 3confirms that it is mainly induced by the Stoneley wave excitedin the fracture.
VERTICAL FRACTURE BETWEEN BOREHOLES
Based on the above experiments, we put an acoustic sourceinto a water-filled borehole and conducted crosshole seismo-electric measurements. First, we made a vertical fracture modelshown in Figure 5. The fracture is parallel to the two boreholes.A monopole transducer source is located in the granite bore-hole. The transducer (a PZT tube) is 0.9 cm in diameter and1.2 cm in length, and is excited by a 1000-V square pulse that is5 μs in width. The main energy of this source is in the horizontaldirection (Figure 5). Because the size of the tube transducer issmall, the acoustic energy is smaller than the plane transducerused in the previous experiment, although the exciting pulsehas the same amplitude. The blocks of granite and sandstone inFigure 5 have the same size: 10 cm × 10 cm × 15 cm and bore-holes with 1.27 cm in diameter. The fracture aperture is verylarge (4 cm) in order to separate and observe the seismoelectricsignals produced at the two sides of the fracture.
When the source is fixed at a certain position, we movean electrode or hydrophone in the other borehole to recordthe seismoelectric and acoustic fields shown in Figures 6a and6b. The acoustic wave, propagating through granite, water,and sandstone in a horizontal direction, arrives at the sand-stone borehole at about 60 μs (Figure 6b). In Figure 6a, we
FIG. 4. Relationship between aperture d and amplitude of theseismoelectric signals induced at the fracture and recorded inthe borehole (Figure 1).
Dow
nloa
ded
06/0
2/14
to 1
30.1
27.2
38.2
33. R
edis
trib
utio
n su
bjec
t to
SEG
lice
nse
or c
opyr
ight
; see
Ter
ms
of U
se a
t http
://lib
rary
.seg
.org
/

1522 Zhu and Toksoz
recorded electric signals at about 45 μs and 60 μs. Calculatingthe traveltimes, we confirm that 45 μs is the arrival time of theacoustic wave propagating from the source to the surface of thesandstone at the fracture. This means that the seismoelectricsignal induced by the acoustic wave at the sandstone surfaceof the fracture is the source of the electromagnetic wave whichpropagates from the fracture to the sandstone borehole withan EM wave velocity. We recorded a very weak signal between
FIG. 5. Crosshole model with a vertical fracture between gran-ite and sandstone blocks. A PZT tube transducer, as an acous-tic source, is fixed in the granite borehole. A hydrophone oran electrode moves in the sandstone borehole and records anacoustic wave or electric signal. The diameter of the boreholesis 1.27 cm. The fracture aperture is 4 cm.
FIG. 6. Seismoelectric signal (a) and acoustic wave (b) recorded in the sandstone borehole is shown in Figure 5. Theamplitude of the electric signals in Figure 6a is normalized by 25 μV for each trace. The fracture aperture is 4 cm.
20 μs and 45 μs, whose amplitude is much smaller than thatafter 45 μs. It is produced at the granite side of the fracture,and it is weak due to the low porosity and permeability of gran-ite compared with sandstone. The first arrivals of the acousticwaves around 60 μs in Figure 6b are slightly different due todifferent propagating paths. However, it is difficult to see themoveout in the arrival times of the EM waves (Figure 6a).
We first determine the arrival time of an acoustic wave inthe borehole during crosshole acoustic measurements, thendetermine with crosshole seismoelectric measurements theseismoelectric wave arriving before that time. The fracture po-sition between the borehole can be determined by the arrivaltime of the EM wave induced at a fracture if the formationvelocity is known.
INCLINED FRACTURE BETWEEN BOREHOLES
When a vertical fracture is parallel to boreholes and theacoustic source is fixed at a certain position, the received EMwave induced at the fracture has the same arrival time in thesandstone borehole. To investigate the effect of a dipping frac-ture between the boreholes, we made a crosshole model withan inclined fracture, shown in Figure 7. The angle betweenthe fracture and horizontal direction is about 70◦. A monopoletransducer is located in the Lucite borehole, and an electrode isin the sandstone borehole. The aperture of the inclined fractureis 1 cm.
We conducted two experiments to investigate seismoelectricsignals induced at the fracture. First, we fixed the source at a cer-tain position in the Lucite borehole, moved the electrode alongthe sandstone borehole, and recorded electric signals. Then, wefixed the electrode at a certain position in the sandstone bore-hole and recorded the electric signals when the source movesin the Lucite borehole.
Figure 8 shows the electric signals recorded in the two mea-surements. Figure 8a shows the signal received by the electrodein the sandstone borehole when the source is fixed at position 2
Dow
nloa
ded
06/0
2/14
to 1
30.1
27.2
38.2
33. R
edis
trib
utio
n su
bjec
t to
SEG
lice
nse
or c
opyr
ight
; see
Ter
ms
of U
se a
t http
://lib
rary
.seg
.org
/
Crosshole Seismoelectric Measurements 1523
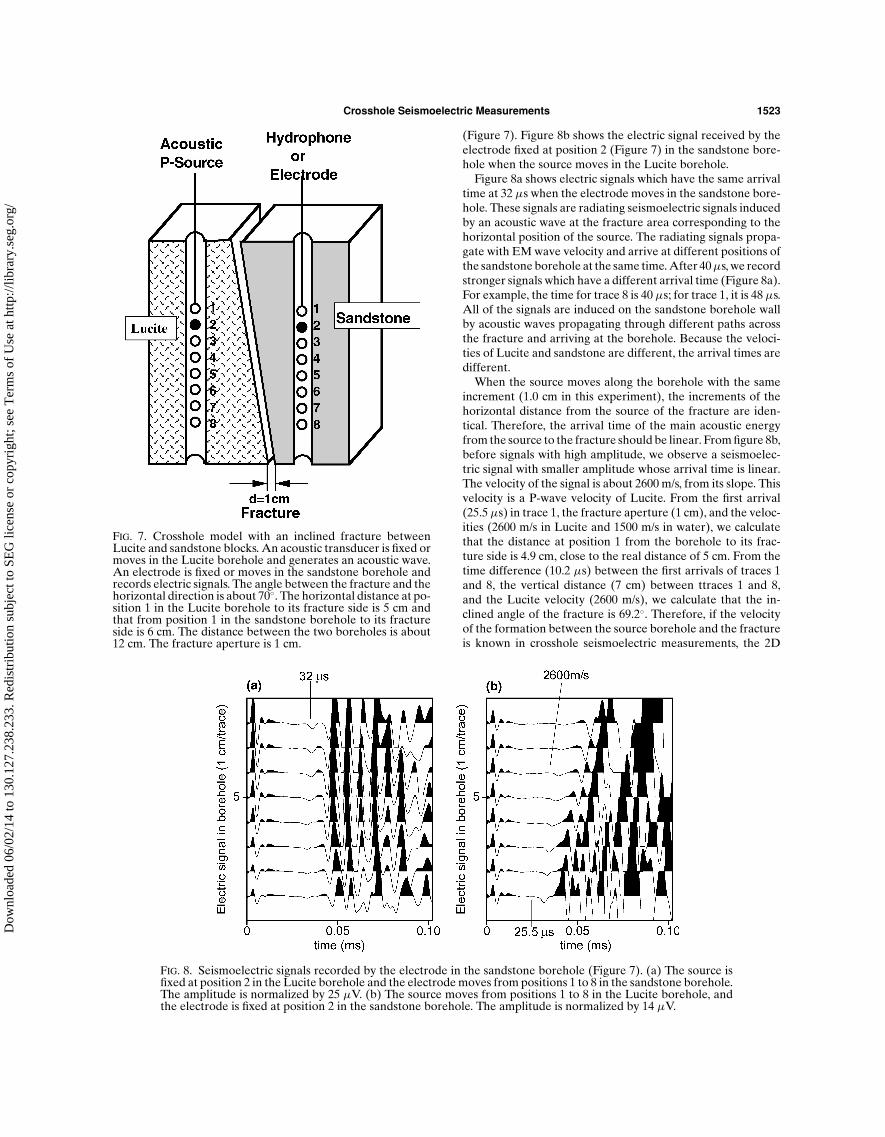
FIG. 7. Crosshole model with an inclined fracture betweenLucite and sandstone blocks. An acoustic transducer is fixed ormoves in the Lucite borehole and generates an acoustic wave.An electrode is fixed or moves in the sandstone borehole andrecords electric signals. The angle between the fracture and thehorizontal direction is about 70◦. The horizontal distance at po-sition 1 in the Lucite borehole to its fracture side is 5 cm andthat from position 1 in the sandstone borehole to its fractureside is 6 cm. The distance between the two boreholes is about12 cm. The fracture aperture is 1 cm.
FIG. 8. Seismoelectric signals recorded by the electrode in the sandstone borehole (Figure 7). (a) The source isfixed at position 2 in the Lucite borehole and the electrode moves from positions 1 to 8 in the sandstone borehole.The amplitude is normalized by 25 μV. (b) The source moves from positions 1 to 8 in the Lucite borehole, andthe electrode is fixed at position 2 in the sandstone borehole. The amplitude is normalized by 14 μV.
(Figure 7). Figure 8b shows the electric signal received by theelectrode fixed at position 2 (Figure 7) in the sandstone bore-hole when the source moves in the Lucite borehole.
Figure 8a shows electric signals which have the same arrivaltime at 32 μs when the electrode moves in the sandstone bore-hole. These signals are radiating seismoelectric signals inducedby an acoustic wave at the fracture area corresponding to thehorizontal position of the source. The radiating signals propa-gate with EM wave velocity and arrive at different positions ofthe sandstone borehole at the same time. After 40 μs, we recordstronger signals which have a different arrival time (Figure 8a).For example, the time for trace 8 is 40 μs; for trace 1, it is 48 μs.All of the signals are induced on the sandstone borehole wallby acoustic waves propagating through different paths acrossthe fracture and arriving at the borehole. Because the veloci-ties of Lucite and sandstone are different, the arrival times aredifferent.
When the source moves along the borehole with the sameincrement (1.0 cm in this experiment), the increments of thehorizontal distance from the source of the fracture are iden-tical. Therefore, the arrival time of the main acoustic energyfrom the source to the fracture should be linear. From figure 8b,before signals with high amplitude, we observe a seismoelec-tric signal with smaller amplitude whose arrival time is linear.The velocity of the signal is about 2600 m/s, from its slope. Thisvelocity is a P-wave velocity of Lucite. From the first arrival(25.5 μs) in trace 1, the fracture aperture (1 cm), and the veloc-ities (2600 m/s in Lucite and 1500 m/s in water), we calculatethat the distance at position 1 from the borehole to its frac-ture side is 4.9 cm, close to the real distance of 5 cm. From thetime difference (10.2 μs) between the first arrivals of traces 1and 8, the vertical distance (7 cm) between ttraces 1 and 8,and the Lucite velocity (2600 m/s), we calculate that the in-clined angle of the fracture is 69.2◦. Therefore, if the velocityof the formation between the source borehole and the fractureis known in crosshole seismoelectric measurements, the 2D
Dow
nloa
ded
06/0
2/14
to 1
30.1
27.2
38.2
33. R
edis
trib
utio
n su
bjec
t to
SEG
lice
nse
or c
opyr
ight
; see
Ter
ms
of U
se a
t http
://lib
rary
.seg
.org
/
1524 Zhu and Toksoz
fracture position, including distance, dip angle, and direction,can be determined directly from the radiating seismoelectricsignals induced at the fracture.
CONCLUSIONS
In this paper, we introduced experimental studies of cross-hole seismoelectric measurements with a fracture between thesource and receiver boreholes. When an acoustic source ina borehole generates an acoustic wave, an electrode receiveselectric signals that are induced by the acoustic wave at a frac-ture and on the borehole wall. Our experiments also investi-gated the effect of a fracture aperture on the seismoelectricsignals and measurements in crosshole models with a verticalor inclined fracture between two boreholes.
Our experiments confirm that seismoelectric conversion at awater-saturated fracture produces a radiating EM wave whichcan be received at a receiver borehole. The amplitude of theEM wave induced at the fracture not only depends on the fluidconductivity, but also is related to the aperture of the fracturebecause the EM wave is mainly induced by the Stoneley waveexcited in the fracture. The experimental results in vertical andinclined fracture models show that the crosshole seismoelectricmeasurements can more directly and accurately measure thefracture between two boreholes and also determine its 2D po-sition than crosshole seismic tomography, which is not sensitiveto a single fracture.
The crosshole seismoelectric measurements can record notonly the EM wave induced at a fracture, but also the electricsignals generated by the seismic wave arriving at the receiverborehole. This means that the crosshole seismoelectric mea-surement can construct a tomography image with the travel-times extracted from the seismoelectric signals in the borehole.Therefore, crosshole seismoelectric well logging might be a newmeans to explore formations and fractures between two bore-holes.
ACKNOWLEDGMENTS
We thank Dr. Daniel Burns and Prof. Frank Dale Morganfor their valuable suggestions and discussions. We also thank
Mr. Barry Kirkendall for showing us his results measured in thefield. This work was supported by DOE Grant No. DE-FG02-00ER15041 and by the Earth Resources Laboratory BoreholeAcoustics and Logging Consortium.
REFERENCES
Berryman, J. G., 1980, Confirmation of Biot’s theory: Appl. Phys. Lett.,37, 382–384.
Biot, M. A., 1956, The theory of propagation of elastic waves in fluid-saturated solids: I. Lower frequency range: J. Acoust. Soc. Am., 28,168–178.
Bourbie, T., Coussy, O., and Zinszner, B., 1987, Acoustics of porousmedia: Editions Technip, 324.
Haartsen, M. W., 1995, Coupled electromagnetic and acoustic wave-field modeling in poroelastic media and its application in geophysicalexploration: Ph.D. diss., Massachusetts Institute of Technology.
Lo, T. W., Toksoz, M. N., Xu, S. H., and Wu, R. S., 1988, Ultrasonic labo-ratory tests of geophysical tomographic reconstruction: Geophysics,53, 947–956.
Matarese, J. R., 1993, Nonlinear traveltime tomography: Ph.D. diss.,Massachusetts Institute of Technology.
Mavko, G. M., and Nur, A., 1979, Wave attenuation in partially satu-rated rocks: Geophysics, 44, 161–178.
Mikhailov, O. V., Queen, J., and Toksoz, M. N., 2000, Using boreholeelectroseismic measurements to detect and characterize fractured(permeable) zones: Geophysics, 65, 1098–1112.
Morgan, F. D., Williams, E. R., and Madden, T. R., 1989, Streaming po-tential properties of westerly granite with applications: J. Geophys.Res., 94, 12449–12461.
Plona, T. J., 1982, Acoustics of fluid-saturated porous media: UltrasonicSymp. IEEE, 1044–1048.
Pride, S., 1994, Govering equations for the coupled electromagneticsand acoustics of porous media: Phys. Rev. B, 50, 15678–15696.
Pride, S. R., and Haartsen, M. W., 1996, Electroseismic wave properties:J. Acoust. Soc. Am., 100, 1301–1315.
Thompson, D. R., 1993, Nonlinear waveform tomography: Theory andapplication to crosshole seismic data: Ph.D. diss., Massachusetts In-stitute of Technology.
Thompson, A. H., and Gist, G. A., 1993, Geophysical applications ofelectrokinetic conversion: The Leading Edge, 12, 1169–1173.
Wu, R. S., and Toksoz, M. N., 1987, Diffraction tomography andmulti-source holography applied to seismic imaging: Geophysics, 52,11–25.
Zhu, Z., and Toksoz, M. N., 1999, Seismoelectric and seismomagneticmeasurements in fractured borehole models: 69th Ann. Internat.,Mtg., Soc. Expl. Geophys., Expanded Abstracts, 144–147.
Zhu, Z., Haartsen, M. W., and Toksoz, M. N., 1999, Experimental stud-ies of electrokinetic conversions in fluid-saturated borehole models:Geophysics, 64, 1349–1356.
———2000, Experimental studies of seismoelectric conver-sions in fluid-saturated porous media: J. Geophys. Res., 105,28 055–28 064.
Dow
nloa
ded
06/0
2/14
to 1
30.1
27.2
38.2
33. R
edis
trib
utio
n su
bjec
t to
SEG
lice
nse
or c
opyr
ight
; see
Ter
ms
of U
se a
t http
://lib
rary
.seg
.org
/


![Deep Borehole Field Test Laboratory and Borehole Testing ... · The characterization borehole (CB) is the smaller-diameter borehole (i.e., 21.6 cm [8.5”] diameter at total depth),](https://img.pdfslide.us/doc/110x75/5ebe68817151f10bcd35645a/deep-borehole-field-test-laboratory-and-borehole-testing-the-characterization.jpg)