Embed Size (px)
Citation preview
Cross-sex and cross-educational levelperformance in a color-wordinterference task
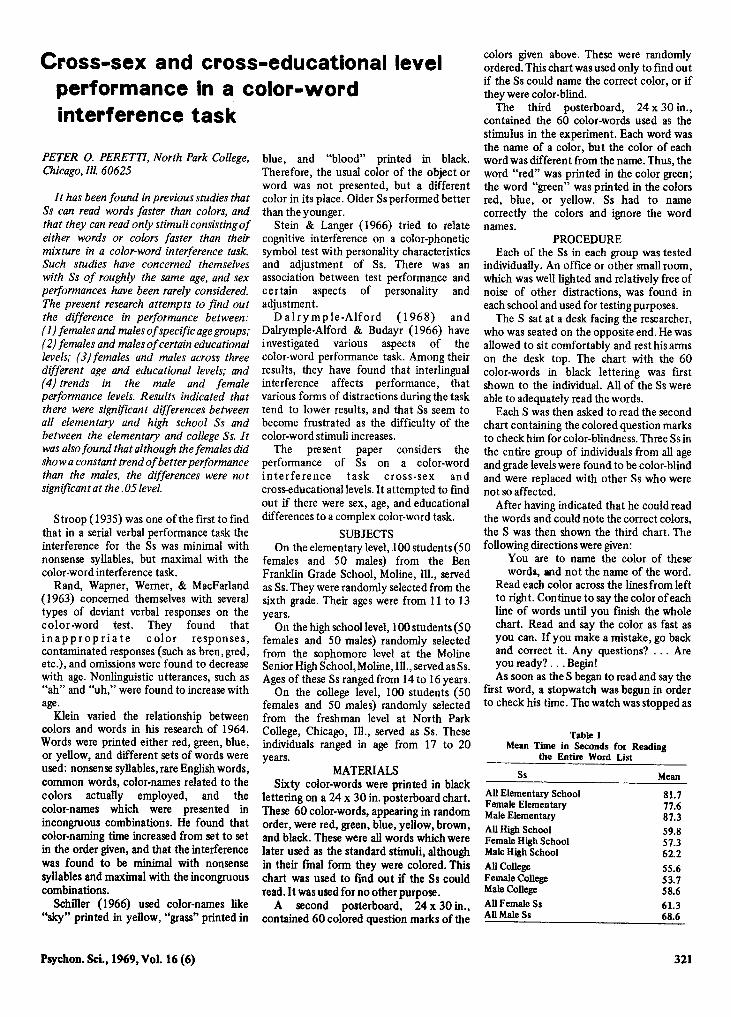
Table 1Mean Time in Seconds for Reading
the Entire Word List
colors given above. These were randomlyordered. This chart wasused only to find outif the Ss could name the correct color, or ifthey were color-blind.
The third posterboard, 24 x 30 in.,contained the 60 color-words used as thestimulus in the experiment. Each word wasthe name of a color, but the color of eachword was different from the name. Thus, theword "red" was printed in the color green;the word "green" was printed in the colorsred, blue, or yellow. Ss had to namecorrectly the colors and ignore the wordnames.
PROCEDUREEach of the Ss in each group was tested
individually. An office or other small room,which was well lighted and relatively free ofnoise of other distractions, was found ineach school and used for testing purposes.
The S sat at a desk facing the researcher,who was seated on the opposite end. He wasallowed to sit comfortably and rest his armson the desk top. The chart with the 60color-words in black lettering was firstshown to the individual. All of the Ss wereable to adequately read the words.
Each S was then asked to read the secondchart containing the colored question marksto check him for color-blindness. Three Ss inthe entire group of individuals from all ageand grade levelswere found to be color-blindand were replaced with other Ss who werenot so affected.
After having indicated that he could readthe words and could note the correct colors,the S was then shown the third chart. Thefollowing directions were given:
You are to name the color of thesewords, and not the name of the word.
Read each color across the lines from leftto right. Continue to say the color ofeachline of words until you finish the wholechart. Read and say the color as fast asyou can. If you make a mistake, go backand correct it. Any questions? ... Areyou ready? ... Begin!As soon as the S began to read and say the
first word, a stopwatch was begun in orderto check his time. The watch was stopped as
PETER O. PERETTI, North Park College,Chicago, Ill. 60625
It has been found in previous studies thatSs can read words faster than colors, andthat they can read only stimuli consistingofeither words or colors faster than theirmixture in a color-word interference task.Such studies have concerned themselveswith Ss of roughly the same age, and sexperformances have been rarely considered.The present research attempts to find outthe difference in performance between:(1) females and malesofspecific agegroups;(2) females and malesofcertain educationallevels; (3) females and males across threedifferent age and educational levels; and(4) trends in the male and femaleperformance levels. Results indicated thatthere were significant differences betweenall elementary and high school Ss andbetween the elementary and college Ss. Itwas alsofound that although the females didshow a constant trend ofbetter performancethan the males, the differences were notsignificantat the .05 level.
Stroop (1935) was one ofthe first to findthat in a serial verbal performance task theinterference for the Ss was minimal withnonsense syllables, but maximal with thecolor-word interference task.
Rand, Wapner, Werner, & MacFarland(1963) concerned themselves with severaltypes of deviant verbal responses on thecolor-word test. They found thatinappropriate color responses,contaminated responses (such as bren.gred,etc.), and omissions were found to decreasewith age. Nonlinguistic utterances, such as"ah" and "uh,' were found to increase withage.
Klein varied the relationship betweencolors and words in his research of 1964.Words were printed either red, green, blue,or yellow, and different sets of words wereused: nonsense syllables, rare English words,common words, color-names related to thecolors actually employed, and thecolor-names which were presented inincongruous combinations. He found thatcolor-naming time increased from set to setin the order given, and that the interferencewas found to be minimal with nonsensesyllables and maximal with the incongruouscombinations.
Schiller (1966) used color-names like"sky" printed in yellow, "grass" printed in
Psychon. Sci., 1969,Vol. 16 (6)
blue, and "blood" printed in black.Therefore, the usual color of the object orword was not presented, but a differentcolor in its place. Older Ss performed betterthan the younger.
Stein & Langer (1966) tried to relatecognitive interference on a color-phoneticsymbol test with personality characteristicsand adjustment of Ss. There was anassociation between test performance andcer tain aspects of personality andadjustment.
Dalrymple-Alford (1968) andDalrymple-Alford & Budayr (1966) haveinvestigated various aspects of thecolor-word performance task. Among theirresults, they have found that interlingualinterference affects performance, thatvarious forms of distractions during the tasktend to lower results, and that Ss seem tobecome frustrated as the difficulty of thecolor-word stimuli increases.
The present paper considers theperformance of Ss on a color-wordinterference task cross-sex andcross-educational levels.It attempted to findout if there were sex, age, and educationaldifferences to a complex color-word task.
SUBJECTSOn the elementary level,100 students (50
females and 50 males) from the BenFranklin Grade School, Moline, Ill., servedas Ss. They were randomly selected from thesixth grade. Their ages were from 11 to 13years.
On thehighschoollevel, 100 students (50females and 50 males) randomly selected
. from the sophomore level at the MolineSenior HighSchool, Moline, Ill., served asSs.Ages of these Ss ranged from 14 to 16 years.
On the college level, 100 students (50females and 50 males) randomly selectedfrom the freshman level at North ParkCollege, Chicago, Ill., served as Ss. Theseindividuals ranged in age from 17 to 20years.
MATERIALSSixty color-words were printed in black
lettering on a 24 x 30 in. posterboard chart.These 60 color-words, appearing in randomorder, were red, green, blue, yellow, brown,and black. These were all words which werelater used as the standard stimuli, althoughin their final form they were colored. Thischart was used to find out if the Ss couldread. It was used for no other purpose.
A second posterboard, 24 x 30 in.,contained 60 colored question marks of the
Ss
All Elementary SchoolFemale ElementaryMale Elementary
All High SchoolFemale High SchoolMale High School
All CollegeFemale CollegeMale College
All Female SsAll Male Ss
Mean
81.777.687.359.857.362.2
55.653.758.6
61.368.6
321
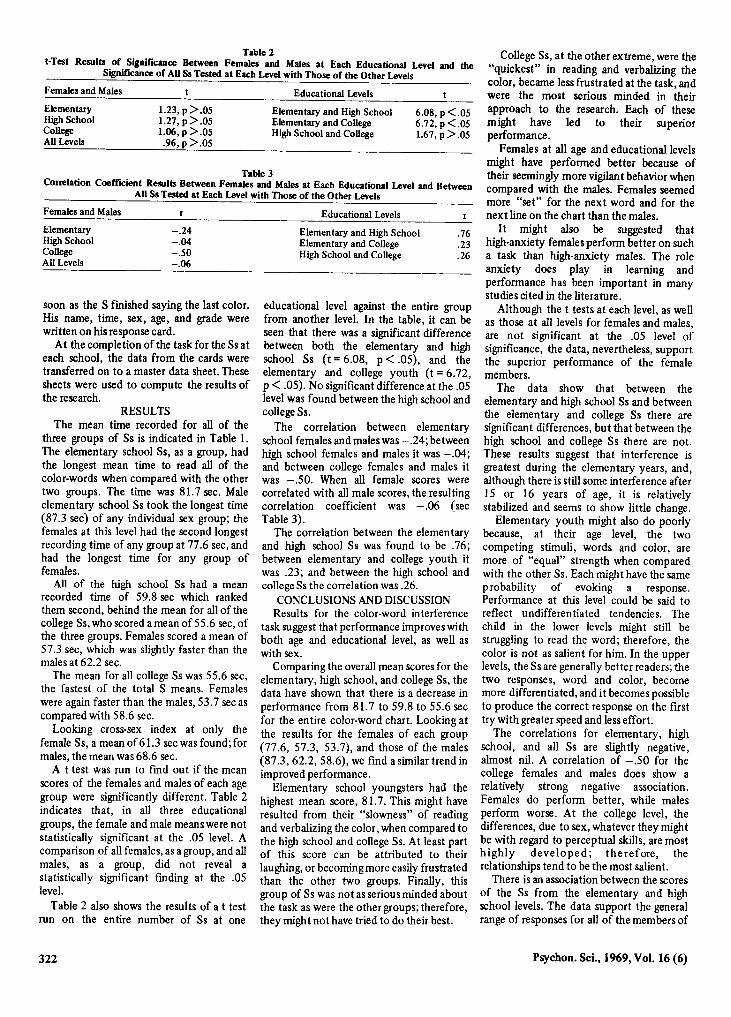
Table 3Correlation Coemcient Results Between Females and Males at Each Educational Level and Between
AUSs Tested at Each Level with Those of the Other Levels
Table 2t-Test Results of Signi....cance Between Females and Males at Each Educational Level and the
Signficance of AUSs Tested at Each Level with Those of the Other Levels
soon as the S finished saying the last color.His name, time, sex, age, and grade werewritten on his response card.
At the completion of the task for the Ss ateach school, the data from the cards weretransferred on to a master data sheet. Thesesheets were used to compute the results ofthe research.
RESULTSThe mean time recorded for all of the
three groups of Ss is indicated in Table 1.The elementary school Ss, as a group, hadthe longest mean time to read all of thecolor-words when compared with the othertwo groups. The time was 81.7 sec. Maleelementary school Ss took the longest time(87.3 sec) of any individual sex group; thefemales at this level had the second longestrecording time of any group at 77.6 sec, andhad the longest time for any group offemales.
All of the high school Ss had a meanrecorded time of 59.8 sec which rankedthem second, behind the mean for all of thecollege Ss, who scored a mean of 55.6 sec, ofthe three groups. Females scored a mean of57.3 sec, which was slightly faster than themales at 62.2 sec.
The mean for all college Ss was 55.6 sec,the fastest of the total S means. Femaleswere again faster than the males, 53.7 sec ascompared with 58.6 sec.
Looking cross-sex index at only thefemale Ss, a mean of 61.3 sec was found; formales, the mean was 68.6 sec.
A t test was run to find out if the meanscores of the females and males of each agegroup were significantly different. Table 2indicates that, in all three educationalgroups, the female and male means were notstatistically significant at the .05 level. Acomparison of all females, as a group, and allmales, as a group, did not reveal astatistically significant finding at the .05level.
Table 2 also shows the results of a t testrun on the entire number of Ss at one
educational level against the entire groupfrom another level. In the table, it can beseen that there was a significant differencebetween both the elementary and highschool Ss (t = 6.08, P < .05), and theelementary and college youth (t =6.72,p < .05). No significant difference at the .05level was found between the high school andcollege Ss.
The correlation between elementaryschool females and males was -.24; betweenhigh school females and males it was -.04;and between college females and males itwas -.50. When all female scores werecorrelated with all male scores, the resultingcorrelation coefficient was -.06 (seeTable 3).
The correlation between the elementaryand high school Ss was found to be .76;between elementary and college youth itwas .23; and between the high school andcollege Ss the correlation was .26.
CONCLUSIONS AND DISCUSSIONResults for the color-word interference
task suggest that performance improves withboth age and educational level, as well aswith sex.
Comparing the overall mean scores for theelementary, high school, and college Ss, thedata have shown that there is a decrease inperformance from 81.7 to 59.8 to 55.6 secfor the entire color-word chart. Looking atthe results for the females of each group(77.6, 57.3, 53.7), and those of the males(87.3, 62.2, 58.6), we find a similar trend inimproved performance.
Elementary school youngsters had thehighest mean score, 81.7. This might haveresulted from their "slowness" of readingand verbalizing the color, when compared tothe high school and college Ss. At least partof this score can be attributed to theirlaughing, or becoming more easily frustratedthan the other two groups. Finally, thisgroup of Ss was not as serious minded aboutthe task as were the other groups; therefore,they might not have tried to do their best.
College Ss, at the other extreme, were the"quickest" in reading and verbalizing thecolor, became less frustrated at the task, andwere the most serious minded in theirapproach to the research. Each of thesemight have led to their superiorperformance.
Females at all age and educational levelsmight have performed better because oftheir seemingly more vigilant behavior whencompared with the males. Females seemedmore "set" for the next word and for thenext line on the chart than the males.
It might also be suggested thathigh-anxiety females perform better on sucha task than high-anxiety males. The roleanxiety does play in learning andperformance has been important in manystudies cited in the literature.
Although the t tests at each level, as wellas those at all levels for females and males,are not significant at the .05 level ofsignificance, the data, nevertheless, supportthe superior performance of the femalemembers.
The data show that between theelementary and high school Ss and betweenthe elementary and college Ss there aresignificant differences, but that between thehigh school and college Ss there are not.These results suggest that interference isgreatest during the elementary years, and,although there is still some interference after15 or 16 years of age, it is relativelystabilized and seems to show little change.
Elementary youth might also do poorlybecause, at their age level, the twocompeting stimuli, words and color, aremore of "equal" strength when comparedwith the other Ss. Each might have the sameprobability of evoking a response.Performance at this level could be said toreflect undifferentiated tendencies. Thechild in the lower levels might still bestruggling to read the word; therefore, thecolor is not as salient for him. In the upperlevels, the Ss are generally better readers; thetwo responses, word and color, becomemore differentiated, and it becomes possibleto produce the correct response on the firsttry with greater speed and less effort.
The correlations for elementary, highschool, and all Ss are slightly negative,almost nil. A correlation of -.50 for thecollege females and males does show arelatively strong negative association.Females do perform better, while malesperform worse. At the college level, thedifferences, due to sex, whatever they mightbe with regard to perceptual skills, are mosthighly developed; therefore, therelationships tend to be the most salient.
There is an association between the scoresof the Ss from the elementary and highschool levels. The data support the generalrange of responses for all of the members of
.76
.23
.26
6.08, p<.056.72, p<.051.67, p >.05
Elementary and High SchoolElementary and CollegeHigh School and College
Educational Levels
Elementary and High SchoolElementary and CollegeHigh School and College
Educational Levels
-.24-.04-.50-.06
1.23, P >.051.27, p>.051.06,p>.05.96, p>.05
Females and Males
ElementaryHigh SchoolCollegeAll Levels
Females and Males
ElementaryHigh SchoolCoUegeAll Levels
322 Psychon. Sci., 1969, Vol. 16 (6)
Semantic factors In conservationof welght1
these groups. Although their mean scoresdiffer, the trend in S response is similar. Itmight be that the form of the distractionsand their number are the same for thesegroups and not the same for the collegegroup. Younger students might be moreeasily distracted qualitatively, as well asquantitatively, than older ones.
REFERENCESDALRYMPLE-ALFORD, E. C. Interlingual
interference in a color-naming task.PsychonomicScience, 1968, 10, 215-216.
DALRYMPLE-ALFORD, E. C., & BUDAYR, B.Examination of some aspects of the Stroopcolor-word test. Perceptual & Motor Skills,1966, 23, 1211-1214.
SUSAN G. NUMMEDAL and FRANK B.MURRA Y, University of Minnesota,Minneapolis, Minn.55455
The performance of first- andsecond-grade Ss was analyzed on eightconnotative-denotative discriminationproblems and seven conservation-of-weightproblems, each of which representedphysical dimensions that are highlycorrelated on the semantic differentialpotency factor. The resultsindicated that Sswho made correct denotativediscriminations performed significantlybetter on the conservation of weightproblems than Ss who were unable todiscriminate connotative from denotativemeaning. The ability to make correctdenotative discriminations is acquiredpriorto weight conservation and is perhaps anecessary, but not sufficient, condition forconservation ofweight.
When a first grader is asked to report whatdifferences exist between two objects thatdiffer only in size,he may say that the largerof the two objects is not only larger, but thatit is actually heavier and stronger than thesmaller object even when he has contraryevidence about the weight and strength ofthe two objects (Ervin-Tripp & Foster,1960). The child apparently accepts the factthat "larger," for example, connotes"heavy" and "strong" as indicating that"larger" denotes "heavy" and "strong" aswell. Of course, it is not unreasonable thatthe child should confuse connotative anddenotative meaning in this instance, sincemore often than not size, weight, andstrength are positively correlated in thechild's experience.
Psychon. Sci.,1969,Vol. 16(6)
KLEIN, G. S. Semantic power measured throughthe interference of words with color-naming.American Journal of Psychology, 1964, 71,576-588.
RAND, G., WAPNER, S., WERNER, M., &MacFARLAND, J. H. Differences inperformance on the Stroop color-word test.Journal of Personality, 1963, 31, 534-558.
SCHILLER, P. H. Developmental study ofcolor-word interference. Journal ofExperimental Psychology, 1966, 72, 105-108.
STEIN, K. B., & LANGER, J. The relationship ofcovert cognitive interference in thecolor-phonetic symbol test to personalitycharacteristics and adjustment. Journal ofPersonality, 1966,34,241-251.
STROOP, J. R. Studies of interference in serialverbal reactions. Journal of ExperimentalPsychology, 1935,18,643-662.
In addition to failing to discriminateconnotative and denotative meaning, theyoung child also fails to conserve ormaintain the constancy of, for example, anobject's weight when the object's shape,texture, or temperature is changed (Murray& Johnson, 1968).
The present investigation explored therelation between these two kinds ofchildren's failures, namely, the failure todiscriminate connotative and denotativemeaning, and the failure to conserve weight,by analyzing first and second graders'performance on eight connotativedenotative discrimination problems andseven conservation of weight problems, allof which were based on physical dimensionsthat were highly loaded on Osgood'ssemantic differential potency factor.
SUBJECTSSubjects were 27 first graders (15 boys
and 12 girls) with a mean age of 6.96 years(S.D. = .57 years), and 30 second graders(17 boys and 13 girls) with a mean age of7.92 years (S.D. = .44 years).
PROCEDUREThe connotative-denotative
discrimination test consisted of eightproblems in which two objects differed insize (large-small), weight (heavy-light),texture (rough-smooth), shape (thick-thin,wide-narrow, or long-short), strength(strong-weak), or hardness (hard-soft). Thephysical dimensions of the stimulus pair foreach problem were (1) size: a large block(1* x I* x %in.) and a small block(% x %x * in.); (2) thickness: a thick block(Bh Bh * in.) and a thin block(}IIIx 1%x 1/3 in.);(3) width: awide block(1%x 1 x %in.) and a narrow block(1%x * x % in.); (4) length: a long block
(3* x % x * in.) and a short block(1% x %x * in.); (5) weight: a heavy block(l oz) and a light block (* oz) both1%x %x % in.; (6) texture: a rough blockand a smooth block (both 1% x %x % in.);(7) strength: a "strong" dry sponge and a"weak" damp sponge (both1* x 1* x * in.); (8) hardness: a hard ballof clay and a soft ball of clay (both 1* in.diam). Ss, individually, were presented witha pair of these objects that differed on onedimension (e.g., size: one largeand one smallblock) and were asked to say how theobjects differed on that dimension. Ss, then,were asked if the objects differed on each ofthe other dimensions of thickness, width,length, weight, texture, strength, andhardness as well. For example, subjects werespecifically asked, "Is one bigger and onesmaller or are they both the same size?" andthen, "Which one is bigger (or smaller)?"The same question form then was used toask about the same objects for the followingpairs of words: "wider, narrower; longer,shorter; thicker, thinner; heavier, lighter;
rougher, smoother; stronger, weaker;harder, softer" in random order for each S.
In the seven conservation of weightproblems, after each S agreed two clay ballswere equal in weight, one of the twoidentical clay balls was transformed in size[(1) by adding a piece of clay] , in shape[(2) by flattening it into a pancake, (3) byrolling it into a sausage, or (4) by pressing itinto a wheel], in texture [(5) by roughingthe surface with a table fork] ,or in strength[by having the S imagine that the ball was(6) heated in the oven, or (7) frozen in arefrigerator] . After each transformation, Sswere asked, "Is one heavier and one lighter,or are they both the Same weight?" and ifSssaid the balls had different weights, theywere asked, "Which one is heavier (or,one-half the time, lighter)?"
RESULTSSubjects who made four or more correct
conservation responses to the sevenconservation of weight problems (one size,three shape, one texture, two strengthproblems) were scored as conservers, and Sswho made three or fewer correct responseswere scored as nonconservers. There were,by this criterion, 9 conservers and 18nonconservers in the first grade and 18conservers and 12 nonconservers in thesecond grade. The difference in theseproportions of conservers andnonconservers between the two grades wassignificant by a Fisher Test (p =.0398).
A Cochran Q analysis at each grade levelof the difference between the proportion ofconservers and nonconservers on each of theconservation problems showed significantdifferences between the proportions ofconservers and nonconservers across theproblems for both the first-grade Ss(Q =76.54, P < .001) and the second grade
323