Embed Size (px)
Citation preview
Cross sections and photoelectron angular distributions in photodetachmentfrom negative ions using equation-of-motion coupled-cluster Dysonorbitals
C. Melania Oanaa� and Anna I. Krylovb�
Department of Chemistry, University of Southern California, Los Angeles, California 90089-0482, USA
�Received 8 July 2009; accepted 27 August 2009; published online 25 September 2009�
We report total and differential cross sections for photodetachment from negative ions using Dysonorbitals calculated from equation-of-motion coupled-cluster wave functions and free wavedescription of the detached electron. The energy dependence of the cross sections is reproducedwell, however, the accuracy of absolute values varies. For F−, C−, NH2
−, and H−, the calculated crosssections are within the error bars from the experimental values, whereas the errors for Li− and OH−
are about 20%. The largest errors are observed for O− and O2− for which the calculated cross sections
differ from the experimental ones by factors of 3 and 2, respectively. Calculated anisotropyparameters for atomic anions exhibit too slow decrease, which suggests that the diffuseness of thecomputed Dyson orbitals is underestimated. Moreover, in the asymptotic region, the orbitals exhibitartifactual oscillations probably due to the limitations of Gaussian basis sets. The analysis of thetrends in the experimental anisotropy parameters suggests that the interaction of the detachedelectron with the core, which is neglected in the present model, is important. © 2009 AmericanInstitute of Physics. �doi:10.1063/1.3231143�
I. INTRODUCTION
Numerous variations of photoelectron spectroscopy arecapable of providing detailed information about the elec-tronic structure of molecules and ions, as well as their inter-actions with light.1–9 Kinetic energy distribution of photo-electrons contains information about electronic andvibrational levels, which, in turn, depend on the potentialenergy surfaces �PESs� of the species involved. The analysisof Franck–Condon progressions allows one to determinestructural differences between the initial and ionized/detached states, as well as to infer changes in the electronicwave functions. A well-resolved photoelectron spectrum is aunique signature of a system, however, even integratedFranck–Condon progressions, such as photoionization effi-ciency spectra, can be used to identify and distinguish spe-cies.
Wealth of the information can be obtained by consider-ing only the vibrational part of the Franck–Condon factors�FCFs� under simple assumptions about the electronic com-ponent of the total cross sections.10,11 However, the interpre-tation of some experiments requires more precise knowledgeof the electronic part of the cross section. For example, mea-surements of electron affinities �EAs� or ionization energies�IEs� rely on the near-threshold photoelectrons, and extract-ing EAs �or IEs� are based on the energy dependence of thecross section. Distinguishing isomers by their photoioniza-tion efficiency spectra is also more reliable when the elec-
tronic part of the cross section is known.12,13 Thus, modelingof the electronic part of the photoionization and/or photode-tachment cross sections is complementary to the calculationsof FCFs. More detailed information about electronic wavefunctions can be obtained by measuring angular distributionsof photoelectrons �PADs�, which are related to differentialcross sections.
A central quantity for calculating total and differentialcross sections is photoelectron matrix element connecting theinitial and the final wave functions:
DkIF = u��I
N�r��FN−1 · �k
el� = ��IFd �ru��k
el� �1�
where u is a unit vector in the direction of laser polarization,�k
el is a final state of the free electron with energy corre-sponding to the wave vector k, i.e., Eel�k�=k2 /2, and �IF
d isthe so called Dyson orbital that contains all the necessaryinformation about the wave functions of the initialN-electron system and the remaining N−1 electron core:
�IFd �1� = �N �I
N�1, . . . ,n��FN−1�2, . . . ,n�d2 . . . dn . �2�
Dyson orbitals �d are employed in calculations ofCompton profiles,14 electron momentum spectra,15,16 and in-terpretation of orbital imaging experiments.17–19 AlthoughDyson orbitals defined by Eq. �2� can be computed for anyinitial and final many-electron wave functions,20,21 many the-oretical studies employ an independent-particle approxima-tion and treat �d within the Hartree–Fock/Koopmans frame-
a�Electronic mail: [email protected]�Author to whom correspondence should be addressed. Electronic mail:
THE JOURNAL OF CHEMICAL PHYSICS 131, 124114 �2009�
0021-9606/2009/131�12�/124114/15/$25.00 © 2009 American Institute of Physics131, 124114-1
Author complimentary copy. Redistribution subject to AIP license or copyright, see http://jcp.aip.org/jcp/copyright.jsp
work. In more rigorous studies, correlation effects have beentaken into account using Green functions and propagatorformalism.22–25
Recently, we presented the calculation of Dyson orbitalswithin equation-of-motion coupled-cluster �EOM-CC�formalism.26 In chemical applications, EOM theory has beenadapted from nuclear physics27 for calculating electronicallyexcited states28–31 and later extended to EAs and ionizationpotentials.32–34 Subsequent developments35–43 of the EOMmethodology with a CC reference wave function enabledaccurate calculations of electron attached, ionized, and spin-flipped states, as discussed in detail in several reviews.44–52
By combining different EOM-CC methods, one can de-scribe ionization from open-shell and electronically excitedstates.51 Calculated using highly correlated wave functions,EOM-CC Dyson orbitals include both correlation and orbitalrelaxation effects. For ionizations from the ground state ofclosed-shell molecules, these effects often manifest them-selves not in the shape of the orbitals �e.g., we observed thatthe CCSD Dyson orbitals are often very similar to the ca-nonical Hartree–Fock ones, except when there is strong mix-ing of Koopmans configurations53�, rather in the norms of theDyson orbitals, which are related to the absolute cross sec-tions via Eq. �1�. The focus of this work is on the secondaspect of the problem, that is, the ionized electron. As thefirst step, we employ a simple plane wave description ofphotoelectrons, as in Ref. 54, to benchmark the performanceof this model for photodetachment from negative ions. Inthese processes, the remaining core is neutral, and one canexpect that the plain-wave description of photoelectrons �aswell as other assumptions of our model described below� arebetter justified compared to the ionization of the neutrals. Inthis paper, we consider several atomic and small molecularions, and compute total cross sections and the anisotropyparameter �. The comparison with the experimental data isused to determine the accuracy of this approach and to vali-date the assumptions of the model.
The field of anion spectroscopy has grown steadily, asdemonstrated by a large number of extensive studies of in-organic, organic, metal-organic, and cluster anions.55–70 Thedevelopment of new high resolution techniques expanded theapplicability of photodetachment experiments to includeelectronic structure determination of unstable and excitedstates, photodetachment ultrafast dynamics, anion reactivity,and intermolecular interactions in cluster anions.3,8,71–74
On the theory side, several models of varying complex-ity have been developed,54,75–77 and the applications revealedtheir capabilities and limitations. Most importantly, testingthe predictions of these models against the experimentalmeasurements helped quantify the relative importance of dif-ferent effects and interactions involved in the photoioniza-tion process. For example, for atomic ionization, theCooper–Zare formula75,78 derived within central-potentialmodel captures correctly the so-called geometrical effects re-sulting from angular momentum conservation laws and al-lows one to account for possible phase shifts between thepartial waves �more on this in Sec. II C�. Whereas in a gen-eral case the predictions of the Cooper–Zare model are sub-ject to the uncertainties in the parameters used �dipole radial
matrix elements and phase shifts�, some limiting situationsafford simple analytic answers, e.g. that the anisotropy pa-rameter � for the photoionization of an s-like Dyson orbitalis energy independent and equals 2 for linearly polarizedlight. Thus, the deviations from this behavior are due to theeffects neglected in the model, i.e., interactions �exchangeand correlation� of the ionized electron with the core andrelativistic effects.76 Calculations of � for Cl and Al thataccounted for these effects77,79 revealed that anisotropicelectron-ion interactions are non-negligible, whereas nonrel-ativistic effects were concluded to be less important.76
Expressions for PADs for several special cases �e.g. di-atomic molecules� taking into account rotational states havebeen developed and applied to interpret resonance enhancedmultiphoton ionization �REMPI� and velocity map imagingmeasurements80–84 by fitting the dipole matrix elements andphases to match the experimental PADs.
Reed et al.,54 who extended the central-potential modelto molecular ions, reported encouraging results for thresholdbehavior of total cross sections. Their model employedplane-wave description of the ejected electrons and neglectedion-core interactions. Since their calculations relied on em-pirical Dyson orbitals �i.e., Slater functions with the expo-nents fitted to reproduce the experiment�, it is difficult toassess the errors of the model due to the approximations inthe description of the ejected electron and the accuracy of themodel for the absolute values of the cross sections. The pri-mary goal of the present work is to benchmark this approachby combining simple description of the photoelectrons withaccurate ab initio Dyson orbitals.
Stehman and Woo introduced the zero-core-contribution�ZCC� model,85 which also relies on a plane-wave descrip-tion of the free electron and employs empirical representa-tion of the atomic Dyson orbital. A ZCC calculation requiresthree parameters: angular momentum of the Dyson orbital,its average size, and IE. They reported absolute cross sec-tions of photodetachment to be accurate to a factor of 2.
Several groups have been developing methodology thatallows one to account for anisotropic interactions betweenthe core and the ionized electron.86–89 For example, Luc-chese et al. computed final-state wave continuum functionusing iterative Schwinger variational method and employingfrozen Hartree–Fock representation of the core and single-center expansion technique.86 Powis developed an effectivepotential model for the core.87
The structure of the paper is as follows. In Sec. II wediscuss the theoretical aspects of cross section calculations�Sec. II A�, the treatment of the photoelectron wave functionand the relation of differential cross sections to the quantitymeasured experimentally, and the � anisotropy parameter�Sec. II B�. The details of the electronic structure and crosssections calculations are described in Sec. III. In Sec. IV, wefirst analyze the effect of the Dyson orbitals asymptotic be-havior on the photoelectron dipole moments �Sec. IV A�.Then we compare the performance of our model to the ex-perimentally measured total cross sections �Sec. IV B� andphotoelectron anisotropies �Sec. IV C�. Our concluding re-marks are given in Sec. V. Details about the isotropic aver-aging procedure are provided in the Appendix.
124114-2 C. M. Oana and A. I. Krylov J. Chem. Phys. 131, 124114 �2009�
Author complimentary copy. Redistribution subject to AIP license or copyright, see http://jcp.aip.org/jcp/copyright.jsp
II. THEORY
A. Differential and total cross sections and Dysonorbitals
In the dipole approximation, the differential cross sec-tion for ionizing or detaching a photoelectron in the solidangle d�k=sin �d�d� is �in atomic units�90
d�
d�k=
4�2
cE�Dk
IF��,���2, �3�
where E is energy of the ionizing radiation, k denotes bothenergy and the direction of the ejected electron, and DIF isthe photoelectron matrix element connecting the initial andthe final wave functions, see Eq. �1�, which depends on theDyson orbital and the wave function of the ionized electron.These equations are derived within sudden ionizationapproximation91,92 and strong orthogonality condition,14,17
i.e., assuming that ionization is fast and that the final statecan be described by the noninteracting and orthogonal N−1electron core and the continuum electron wave functions,�F
N−1�1, . . . ,n−1� and �kel�n ,��, respectively, with no corre-
lation between the outgoing and the remaining N−1 boundelectrons. Both approximations are usually justified by asmall size of the core relative to the free electron wave func-tion and, consequently, their vanishing overlap.14,17
For molecular systems, where dipole matrix elementsshould also include vibrational wave functions of the initialand final states, Eq. �3� becomes
d�
d�k=
4�2
cE
nn�
Pn�Dnn�k�2, �4�
where n and n� denote the initial and final vibrational levels,Pn gives the populations of the vibrational states of the initialsystem, and the energy of the ejected electron Eel�k� satisfythe following energy balance:
E = IE00 + Eel�k� + Evibf �n�� − Evib
i �n� , �5�
where IE00 is adiabatic ionization/detachment energy of theion, and Evib
i,f denotes vibrational energies of the initial andfinal system. IE00 is equal to EA of the neutral. The dipolematrix element Dnn�k includes contributions from the elec-tronic and vibrational, �n�
i �R� and �nf �R�, wave functions:
Dnn�k = dR�DkIF�R��n
i �R��n�f �R�� , �6�
where R denotes nuclear coordinates. Within Condon ap-proximation, the dependence of the electronic dipole matrixelement on nuclear coordinates can be neglected:
DkIF�R� � Dk
IF�R0� , �7�
�Dnn�k�2 = �DkIF�R0��2FCF�n,n�� , �8�
FCF�n,n�� = � dR�ni �R��n�
f �R��2
, �9�
where R0 denotes the equilibrium geometry of the initialelectronic state.
Equation �3� gives the cross section for a molecule atgiven orientation, and one needs to average over all molecu-lar orientations sampled in a particular experiment:
d�
d�k=
4�2
cE d��Dnn�k
IF �2P��� =4�2
cE�Dnn�k
IF �2,
�10�
where Euler angles ,� ,� specify molecular orientation,and P��� is a weighting function determined by the ex-periment, e.g., P���=1 for a single photon photodetach-ment, cos2��� or sin2��� in two-photon REMPI, etc. Finally,the total cross section is obtained from Eq. �3� by averagingover all orientations of the photoelectrons and laser polariza-tion directions:54
� =8�2
3cE d�k�Dk
IF�2 =8�2
3cE sin �d�d��DIF��,���2.
�11�
B. Plane wave description of the ejected electrons
In this work, we employ a simple plane wave descriptionof photoelectrons, as in Ref. 54, to benchmark the perfor-mance of this model for photodetachment from negativeions. Plane waves are the exact eigenstates of the free elec-tron in the absence of the interaction between the molecularcore and the detached electron:
�kel = �k� =� k
�2��3eikr, �12�
where the recommended90 normalization per unit energy isemployed. Neglect of the interaction is justified by a smallsize of the remaining core relative to the continuous states ofthe electron. Moreover, in the photodetachment from nega-tive ions, the remaining core is neutral and therefore does notgive rise to a long-range Coulomb potential.
To impose strong orthogonality condition,14,17 planewaves can be made orthogonal to the Dyson orbital bymeans of Schmidt orthogonalization, as has been done, forexample, in Ref. 54:
�k�� = �k� − ��d�k���d� . �13�
Such orthogonalization has shown to be important to repro-duce correct threshold behavior of the cross sections. How-ever, an identical result can be achieved by simply placingthe centroid of the Dyson orbital in the zero of the laboratoryframe,26,54 as done in the present work:
DIF = ��d�r�k�� = ��d�r�k� − ��d�k���d�r��d� = ��d�r�k� .
�14�
The term ��d�r��d� is zero due to our choice of the zero ofthe coordinate system, Eq. �40� in Ref. 26.
For deriving angular dependence �given by vector k̂� ofthe dipole matrix elements Dk
IF, it is convenient to expressplane waves in the basis of spherical waves �E , l ,m�:93
124114-3 Cross-section and PAD-EOM-CC Dyson orbitals J. Chem. Phys. 131, 124114 �2009�
Author complimentary copy. Redistribution subject to AIP license or copyright, see http://jcp.aip.org/jcp/copyright.jsp
�k� = l=0
�
m=−l
l
�E,l,m�1�k
Ylm�k̂� , �15�
�E,l,m� = il�2k
�jl�kr�Ylm�r� , �16�
where Ylm and jl are the spherical harmonics and sphericalBessel functions, respectively.
Substituting the above expansion into Eq. �1�, we arrive:
�DkIF�2 =
l,l�=0
�
m=−l
l
m�=−l�
l�
��Rd �ru�E,l,m�
��E,l�,m��ru��Ld�Ylm�k̂�Yl�m�
� �k̂� �17�
=1
2�k
l,l�=0
�
m=−l
l
m�=−l�
l�
Ckl�m�R · �Cklm
L ��Ylm�k̂�Yl�m�� �k̂� ,
�18�
where �Rd and �L
d denote left and right Dyson orbitals, asdefined in Ref. 26 �they are not identical owing to a non-Hermitian nature of EOM-CC�, and the coefficients Cklm
R,L are:
CklmR,L = 2kil �R,L
d �r�rujl�kr�Ylm��,��dr . �19�
We calculate coefficients �CklmR,L� and/or their averaged
values, �CklmR,L�, by the numerical integration on the grid �see
Appendix and Ref. 26�. By integrating over �, we arrive atthe following expression for the cross section:
d�
sin �d�=
4�2
cE
1
2�k2ll�
m=−min�l,l��
min�l,l��
�CklmR �Ckl�m
L ���
· lm��� · l�m��� . �20�
Equations �11� and �20� can be used for calculating total anddifferential cross sections, respectively. Finally, for the
incoming-wave boundary condition,94 the phase factor in Eq.�19� becomes i−l.
In the case of one-photon photodetachment using lin-early polarized light, the differential cross section has thefollowing form:95
d�
sin �d�=
�
4��1 + �P2�cos����� , �21�
where P2�cos���� is the second-order Legendre polynomial,and � is the so-called anisotropy parameter, a single quantitysufficient to characterize angular distribution of photoelec-trons for a single-photon ionization. It assumes values from�1 for purely perpendicular transition to +2 for purely par-allel transition. For these experiments, � can be extractedfrom Eq. �20� by fitting the computed d� /sin �d� to Eq.�21�. More efficiently, both � and � can be computed fromthe values of d� /sin �d� at �=0 and �=� /2, i.e., �par and�perp:
� =4�
3��par + 2�perp� , �22�
� =2��par − �perp��par + 2�perp
. �23�
C. A relationship of the present approach to theCooper–Zare model
The physical assumptions behind our approach are iden-tical to those used to derive the Cooper–Zare expression75,78
for anisotropy parameter � for the atomic ionization usinglinearly polarized light. For the atomic ionizations all angularaveraging can be done analytically, and the resulting aniso-tropy parameter depends only on the radial one-electron di-pole integrals. For the ionization from the atomic Dyson or-bital with angular momentum l �e.g., l=s , p ,d , . . .�, �depends only on the relative cross sections of l−1 and l+1partial waves and their relative phase:
� =l�l − 1��l−1
2 + �l + 1��l + 2��l+12 − 6l�l + 1��l−1�l+1 cos��l+1 − �l−1�
�2l + 1��l�l−12 + �l + 1��l+1
2 �, �24�
where the cross sections �l�1 are radial dipole matrix ele-ments:
�l�1 = 0
�
dr��d�r�rRkl�r�� . �25�
In many applications of the Cooper-Zare expression, thesecross sections are evaluated using approximate atomic-likeorbitals. However, these integrals can be easily computedusing our Dyson orbitals and the radial functions from Eq.�16�. Thus, for the atomic photodetachment, the results of
our calculations using numeric angular averaging are identi-cal to the calculations using Eq. �24� with the numericallycomputed radial dipole integrals and setting the phase shift tozero.
This provides a useful tool for validating the accuracy ofthe angular averaging, as well as allows us to investigate theeffects of nonzero phase shift on �. Similar computationscan be performed for simple diatomics whose Dyson orbitalsresemble atomic orbitals. For example, the ��-like Dysonorbital corresponding to photodetachment from O2
− or S2− is
almost identical to an atomic d-orbital, which has been ex-
124114-4 C. M. Oana and A. I. Krylov J. Chem. Phys. 131, 124114 �2009�
Author complimentary copy. Redistribution subject to AIP license or copyright, see http://jcp.aip.org/jcp/copyright.jsp
ploited in interpreting the experimental measurements.96,97
The differences between Cooper–Zare and full spherical av-eraging using our code can be used to asses the validity andlimits of such approach.
Equation �24� sets boundaries to the possible values of�, as well as its energy dependence. We can determineboundaries for � for molecular photodetachment by varyingthe phase factors in our model. If the experimental resultsfall outside of these boundaries, it would mean that eitherDyson orbitals are not sufficiently accurate, or that the inter-actions between the core and the ionized electron are notnegligible.
In the rest of this subsection, we consider photodetach-ment from a p-orbital. We use this example to check ourexpressions for consistency and to analyze the relationshipbetween the present approach and the Cooper–Zare model.In the case of p-atom, the only final states are s- andd-waves. The Cooper–Zare anisotropy parameter is then:
� =2��d
2 − 2�s�d cos ���s
2 + 2�d2 . �26�
The calculations using Eq. �20� can be set up in severalways. First, the state degeneracy can be dealt with differ-ently. One can start with a randomly oriented p-orbital andperform isotropic averaging �as one would do in a molecularcase�. Alternatively, the differential cross section can becomputed as the sum of cross sections computed for px, py,and pz orbitals. This allows us to verify that the numericalaveraging over the orientations is performed properly.
Choosing the latter approach, one can derive analytictotal cross section and � by using Eqs. �22� and �23�. For thez-polarized light, pz orbital yields s-wave �C00� and dz
2�C20�,whereas px and py yield equal mixtures of d2−1 and d2+1
�C2−1 and C2+1�. Thus, only the pz orbital contributes to �par
and �perp:
� = N�C002 + 5
2C202 � , �27�
� =2� 5
4C202 − �5C00C20�C00
2 + 52C20
2 , �28�
where N denotes the prefactor in Eq. �20�. Alternatively, �can be computed from Eq. �20� as follows:
� = N�C002 + C20
2 + C2−12 + C21
2 � . �29�
In order for the two cross sections to agree, the followingrelationship needs to be satisfied:
52C20
2 = C202 + C21
2 + C2−12 , �30�
which means that
C2�12 = 3
4C202 . �31�
This relationship indeed holds, as can be verified analyticallyby considering angular dependence of the respective inte-grals, as well as numerically, by comparing the values of thecomputed coefficients.
By comparing � in Eqs. �28� and �26�, we arrive at
�s = C00, �32�
�d =�5
2C20. �33�
Alternatively, by separating the angular dependence of theDyson orbital and performing integration over angular vari-ables in Eq. �19�, we obtain
C00
C20=
2�5
�s
�d. �34�
Thus, our expression for angular distribution is fully consis-tent with the Cooper–Zare expression.
III. COMPUTATIONAL DETAILS
The Dyson orbitals for photodetachment from atomicand molecular anions were computed using the EOM-CCSDsuite of methods implemented in the Q-CHEM electronicstructure package.98 Most of the anions in this study havewell-behaved ground state wave functions, i.e. closed-shellsinglets �H−,Li− ,F− ,NH2
− ,OH−� or high-spin triplets �C−�.The initial and final states of these systems were describedby CCSD and EOM-IP-CCSD, respectively, employingHartree–Fock reference corresponding to their ground states.
For O−, O2−, and S2
−, we employed a high-spin tripletstate of the corresponding neutral species as the reference.With this reference, the anions states were computed byEOM-EA/SF-CCSD, and the states of the neutrals by EOM-SF-CCSD.
Dyson orbitals of the molecular anions were computed atthe anions equilibrium geometries optimized at theCCSD�T�/aug-cc-pVTZ level using the MOLPRO quantumchemistry package.99 The optimized geometry parametersare: rOO=1.228 �O2
−�, rOH=0.968 Å�OH−�, rNH=1.031 Å,�HNH=101.8° �NH2
−�, and rSS=1.936 Å�S2−�.
We found that the computed cross sections are more sen-sitive to the one-electron basis set than energy differences,and a large number of diffuse functions is required for con-verged cross sections, as demonstrated below. For example,while the addition of several sets of s and p diffuse Gauss-ians results in small changes in the electronic state energies�i.e., 10−2 eV�, the respective changes in the Dyson orbitalsyield noticeable differences �up to 15%� in the resultingcross sections.
We employed several types of Pople,100,101 6-311G�n+���mdf ,mpd� with n=1–7, m=1–3, and Dunning102 bases.For the Pople basis sets,100,101 adding more polarization func-tions beyond 2d�2p� resulted in small changes in the crosssections �under 5%�, however, for the benchmark purposeswe employed larger 3df�3pd� bases. To compare the perfor-mance of the Pople and Dunning basis sets, the followingmodified bases were also considered: cc-pVTZ�n+�,aug-cc-pVTZ�n+�, and aug-cc-pVTZ+nsnp. Thecc-pVTZ�n+� sets were constructed from cc-pVTZ by add-ing the same �sp� diffuse sets as in the corresponding Poplebases. The aug-cc-pVTZ�n+� bases are derived in a similarway from aug-cc-pVTZ: The original set of s, p, d, and fdiffuse Gaussians from aug-cc-pVTZ is kept, and the secondand higher �sp� diffuse sets were taken from Pople bases. Foraug-cc-pVTZ+nsnp, the original Dunning set was aug-
124114-5 Cross-section and PAD-EOM-CC Dyson orbitals J. Chem. Phys. 131, 124114 �2009�
Author complimentary copy. Redistribution subject to AIP license or copyright, see http://jcp.aip.org/jcp/copyright.jsp
mented by more diffuse s and p Gaussians with the expo-nents obtained by successively dividing the lowest exponentby two.103
These Dyson orbitals were used as input for theEZDYSON program26,104 for cross section calculations. First,electronic dipole matrix elements Dk
IF�R0� are computed us-ing Eq. �1� and averaged over molecular orientation ��,as required by Eq. �10�. For atoms, no averaging is neces-sary, but the contributions from different atomic states �e.g.,px, py, and pz� need to be summed up. At each Euler point,the orbital is rotated to the lab frame and matrix element �1�is computed by numeric integration over a Cartesian xyz�grid in the laboratory frame. Convergence with respect to thedensity of the Cartesian grid is achieved quite readily. Thecutoff size of the xyz� box was determined by the radius atwhich the long-range Dyson orbital oscillations begin �seethe next section�, or, when there are no oscillations, at theradius when the amplitude becomes smaller than 10−7. Thenumber of points along each xyz� axis are listed in thesupplementary material.105 The density of the angular Eulergrid, which is limited by computational cost considerations,can introduce small numerical errors. We employed 18�10�18 �� grid, i.e., 20° rotations around each axis. Weestimate the numerical errors in the cross sections due to thisgrid are around 5%. For example, isotropic averaging forp-orbital photodetachment gives slightly different values forparallel or perpendicular ionization light polarization �e.g., px
versus pz� in the initial orientation, =�==0°.For example, the cross section for ionization from an isotro-pically averaged px orbital �exponent =1.0 a.u.� is6.33�10−4 bohr−2, assuming the electron binding energy of1.0 and 0.01 eV electron kinetic energy. The same crosssection for a isotropically averaged pz orbital is6.71�10−4 bohr−2. For a 1.0 eV photoelectron, the crosssections are 1.18�10−2 and , respectively. px results arecloser to the exact value, so the parallel orientation was usedas the starting point in all calculations, while the perpendicu-lar results were checked in a few cases. The integration overan isotropic ensemble of orientations in the lab frame is de-scribed in the Appendix.
Once averaged electronic dipole moment matrix ele-ments �Dk
IF� are computed, the cross sections ��E� are calcu-lated as follows. For atomic systems, ��E� are given by Eq.�11�, with k satisfying the following energy balance:
k2
2= E − IE. �35�
For molecular anions, FCF�n ,n�� �see Eq. �9�� werecomputed using double-harmonic parallel normal mode ap-proximation by the EZSPECTRUM program.106 Assuming vi-brationally cold anions �Pn=�n0�, the cross sections are com-puted as follows:
� =2
3
4�2
cE
n� sin �d�d��Dk��,���2FCF�0,n�� , �36�
where k depends on E, IE, and n� via:
k2
2= E − IE00 − Evib
f �n�� . �37�
Finally, we arrive at
� =2
3
4�2
cE�Dk�2
IE00
IE0n
FCF�0,n�dE , �38�
k2
2= E − IE00. �39�
The EAs �IE00� used in the cross sections calculationsare given in Table I. For the molecular anions, we assumethat the total energy of the ionizing radiation is the sum ofEA, the kinetic energy of the photoelectron, and the changein vibrational energy, with no energy being transferred torotations.
IV. RESULTS AND DISCUSSION
A. Asymptotic behavior of the Dyson orbitalsand their basis set dependence
Photodetachment cross sections ��E� and anisotropy pa-rameters � depend strongly on the basis set used to calculatethe corresponding Dyson orbitals. For example, the additionof more than two sets of diffuse functions changes EOM-CCSD energies by about 10−2 eV, however, resulting smallchanges in the Dyson orbital yield significant variations inthe calculated cross section and the anisotropy parameter.This suggests that the shape of the tail of the Dyson orbitalplays an important role.
Below we discuss the origin of this behavior using F− /Fexample for which we observed most severe basis set depen-dence. Since F− is a closed-shell singlet, possible orbital ar-tifacts due to spin contamination can be ruled out.
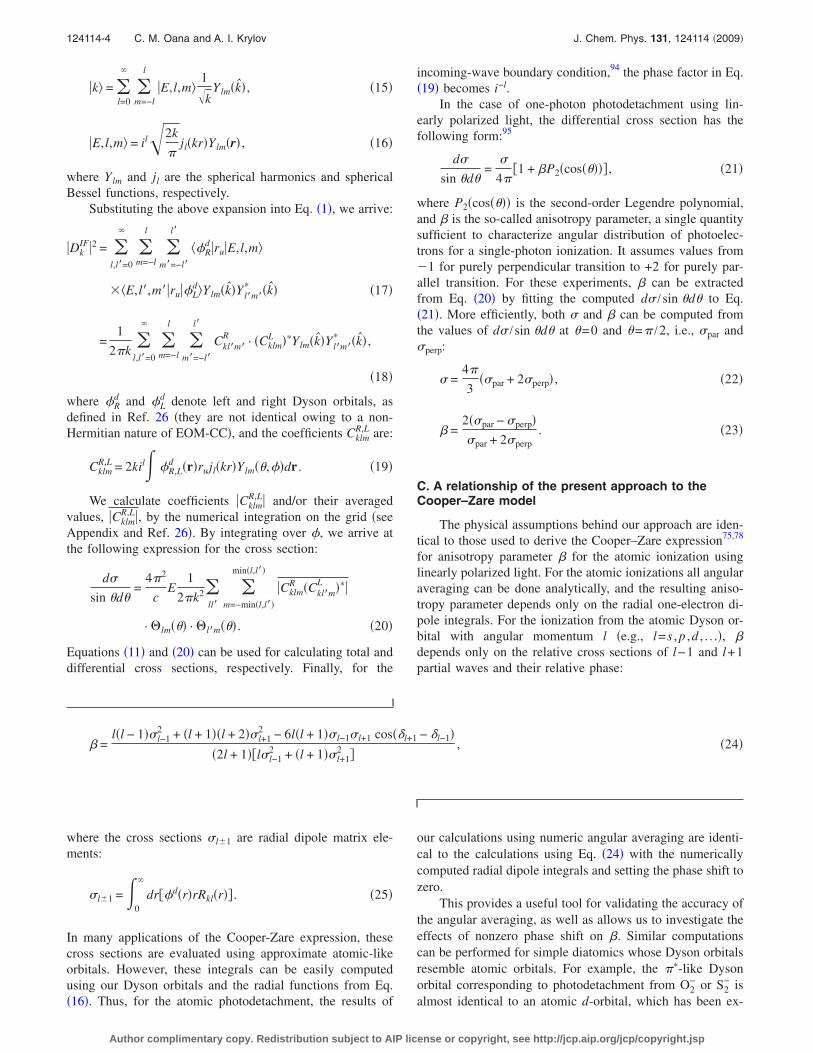
Figure 1 shows the one dimensional profile of the F− /FDyson orbitals computed using different Pople bases with anincreasing number of diffuse functions. In the 0–4 Å valenceregion �Fig. 1, top�, the shapes of the orbitals are similar.However, they become significantly different beyond 5 Å�Fig. 1, bottom�. Zooming in the tail region, we observesignificant changes in the spatial extent of the orbital uponadding a second set of diffuse functions. However, the larger6-311G�n+��3df� bases �n=3–5� do not result in extendedelectron density relative to 6-311G�2+��3df�, but exhibit
TABLE I. EAs �eV� used in the calculations.
Anion EA Reference
F 3.400 116, 117C 1.260 118O 1.460 119H 0.754 120, 121Li 0.618 111, 112OH 1.83 122O2 0.446 123NH2 0.744 124
124114-6 C. M. Oana and A. I. Krylov J. Chem. Phys. 131, 124114 �2009�
Author complimentary copy. Redistribution subject to AIP license or copyright, see http://jcp.aip.org/jcp/copyright.jsp
an oscillatory behavior beyond approximately 6.5 Å.The overall shape of Dyson orbitals converges only at the6-311G�5+��3df� level.
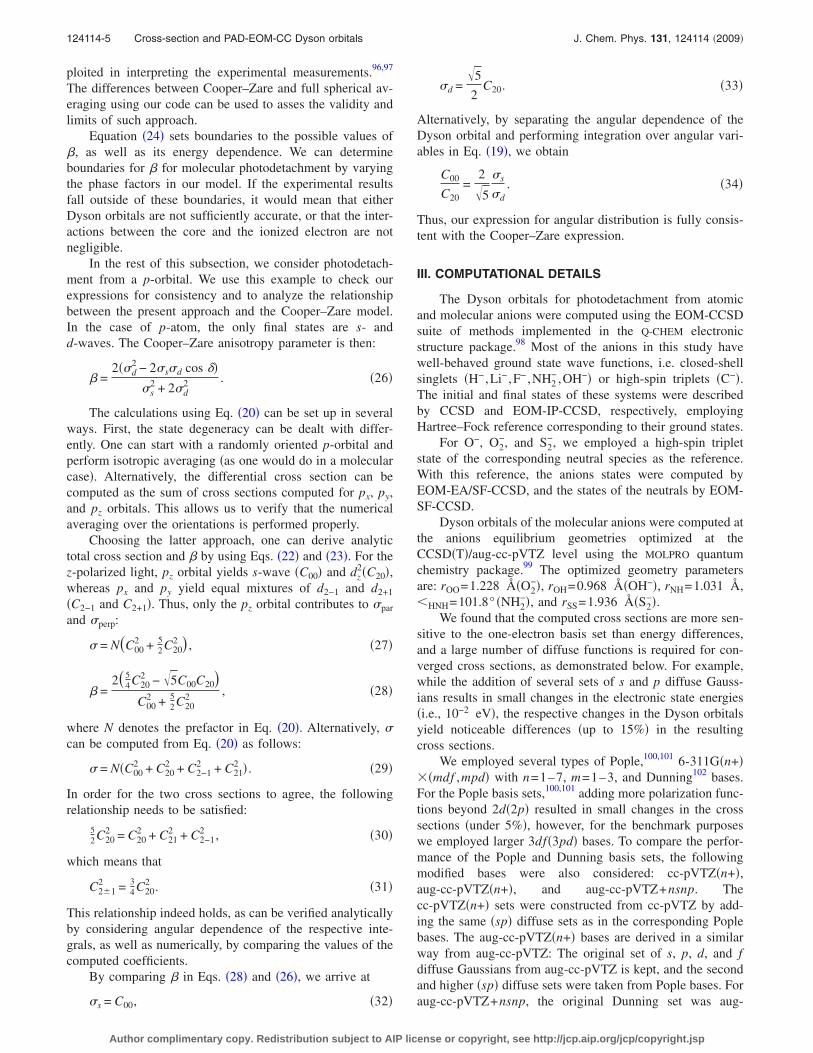
The correct asymptotic behavior of electronic density isdescribed by exponential decay, which suggests that theselong-range oscillations are numerical artifacts. Similar con-clusions have been drawn by Chan and co-workers, who in-vestigated nodal behavior of Hartree–Fock �HF� wavefunctions107 and also observed unphysical long-range nodes.To determine the source of these oscillations, we analyzedthe underlying HF MOs constituting the 6-311G�5+��3df�Dyson orbital, as shown in Fig. 2. The largest contributioncomes from the pz occupied MO, �3, which is very similar tothe Dyson orbital, with small contributions from virtualpz-like HF orbitals. Both the occupied and unoccupied HForbitals exhibit oscillatory behavior at larger radii, which in-dicates that these oscillations are not due to the inclusion ofcorrelation. Concurring with the conclusions of Ref. 107, webelieve that with increasing basis set size, the HF proceduretries to optimize the shape of the MOs in the valence region,which has the strongest effect on the energy, whereas thebehavior in the asymptotic region has negligible effect on thetotal energy, and, therefore the shape of the orbitals far fromthe nucleus is pretty much random. Thus, Dyson orbitals forphotodetachment from negative ions are one of the caseswhen the incorrect asymptotic behavior of Gaussian versusSlater orbitals becomes important.
It is interesting that the occupied pz MO obtained fromOO-CCD calculations108 is even closer to the Dyson orbital
than the corresponding leading HF orbital, �3. This confirmsthe observation of Ortiz22 that Bruckner orbitals are moresuitable for Koopmans’ model of ionization as they includeorbital relaxation and correlation effects.
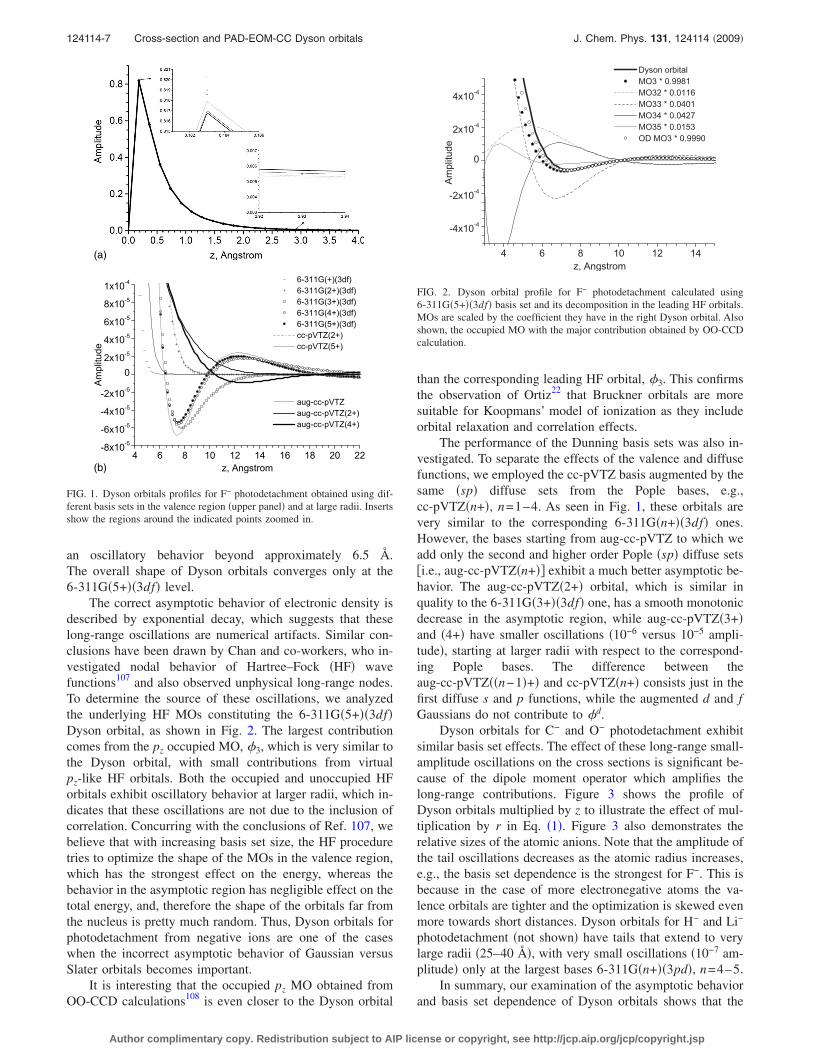
The performance of the Dunning basis sets was also in-vestigated. To separate the effects of the valence and diffusefunctions, we employed the cc-pVTZ basis augmented by thesame �sp� diffuse sets from the Pople bases, e.g.,cc-pVTZ�n+�, n=1–4. As seen in Fig. 1, these orbitals arevery similar to the corresponding 6-311G�n+��3df� ones.However, the bases starting from aug-cc-pVTZ to which weadd only the second and higher order Pople �sp� diffuse sets�i.e., aug-cc-pVTZ�n+�� exhibit a much better asymptotic be-havior. The aug-cc-pVTZ�2+� orbital, which is similar inquality to the 6-311G�3+��3df� one, has a smooth monotonicdecrease in the asymptotic region, while aug-cc-pVTZ�3+�and �4+� have smaller oscillations �10−6 versus 10−5 ampli-tude�, starting at larger radii with respect to the correspond-ing Pople bases. The difference between theaug-cc-pVTZ��n−1�+� and cc-pVTZ�n+� consists just in thefirst diffuse s and p functions, while the augmented d and fGaussians do not contribute to �d.
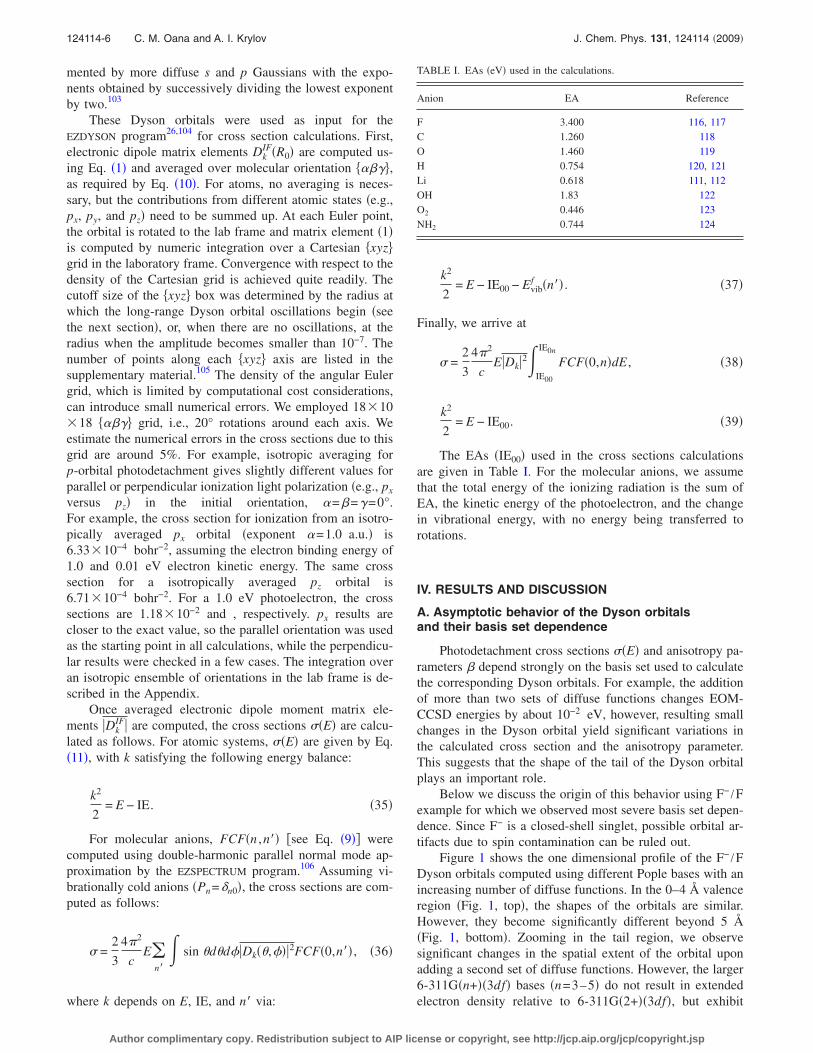
Dyson orbitals for C− and O− photodetachment exhibitsimilar basis set effects. The effect of these long-range small-amplitude oscillations on the cross sections is significant be-cause of the dipole moment operator which amplifies thelong-range contributions. Figure 3 shows the profile ofDyson orbitals multiplied by z to illustrate the effect of mul-tiplication by r in Eq. �1�. Figure 3 also demonstrates therelative sizes of the atomic anions. Note that the amplitude ofthe tail oscillations decreases as the atomic radius increases,e.g., the basis set dependence is the strongest for F−. This isbecause in the case of more electronegative atoms the va-lence orbitals are tighter and the optimization is skewed evenmore towards short distances. Dyson orbitals for H− and Li−
photodetachment �not shown� have tails that extend to verylarge radii �25–40 Å�, with very small oscillations �10−7 am-plitude� only at the largest bases 6-311G�n+��3pd�, n=4–5.
In summary, our examination of the asymptotic behaviorand basis set dependence of Dyson orbitals shows that the
4 6 8 10 12 14 16 18 20 22-8x10⁻⁵-6x10⁻⁵-4x10⁻⁵-2x10⁻⁵
02x10-54x10-56x10-58x10-51x10-4
6-311G(+)(3df)6-311G(2+)(3df)6-311G(3+)(3df)6-311G(4+)(3df)6-311G(5+)(3df)cc-pVTZ(2+)cc-pVTZ(5+)
aug-cc-pVTZaug-cc-pVTZ(2+)aug-cc-pVTZ(4+)
Amplitude
z, Angstrom(b)
(a)
FIG. 1. Dyson orbitals profiles for F− photodetachment obtained using dif-ferent basis sets in the valence region �upper panel� and at large radii. Insertsshow the regions around the indicated points zoomed in.
4 6 8 10 12 14
-4x10⁻⁴
-2x10⁻⁴
0
2x10⁻⁴
4x10⁻⁴
Dyson orbitalMO3 * 0.9981MO32 * 0.0116MO33 * 0.0401MO34 * 0.0427MO35 * 0.0153OD MO3 * 0.9990
Amplitude
z, Angstrom
FIG. 2. Dyson orbital profile for F− photodetachment calculated using6-311G�5+��3df� basis set and its decomposition in the leading HF orbitals.MOs are scaled by the coefficient they have in the right Dyson orbital. Alsoshown, the occupied MO with the major contribution obtained by OO-CCDcalculation.
124114-7 Cross-section and PAD-EOM-CC Dyson orbitals J. Chem. Phys. 131, 124114 �2009�
Author complimentary copy. Redistribution subject to AIP license or copyright, see http://jcp.aip.org/jcp/copyright.jsp
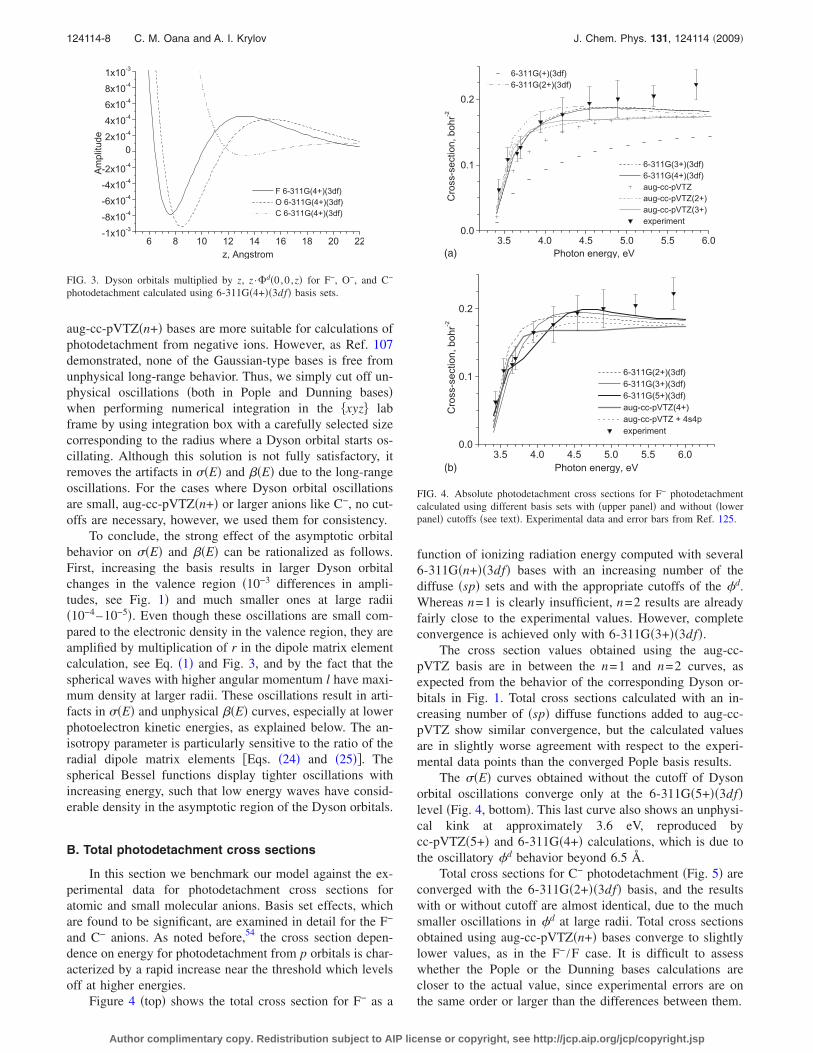
aug-cc-pVTZ�n+� bases are more suitable for calculations ofphotodetachment from negative ions. However, as Ref. 107demonstrated, none of the Gaussian-type bases is free fromunphysical long-range behavior. Thus, we simply cut off un-physical oscillations �both in Pople and Dunning bases�when performing numerical integration in the xyz� labframe by using integration box with a carefully selected sizecorresponding to the radius where a Dyson orbital starts os-cillating. Although this solution is not fully satisfactory, itremoves the artifacts in ��E� and ��E� due to the long-rangeoscillations. For the cases where Dyson orbital oscillationsare small, aug-cc-pVTZ�n+� or larger anions like C−, no cut-offs are necessary, however, we used them for consistency.
To conclude, the strong effect of the asymptotic orbitalbehavior on ��E� and ��E� can be rationalized as follows.First, increasing the basis results in larger Dyson orbitalchanges in the valence region �10−3 differences in ampli-tudes, see Fig. 1� and much smaller ones at large radii�10−4–10−5�. Even though these oscillations are small com-pared to the electronic density in the valence region, they areamplified by multiplication of r in the dipole matrix elementcalculation, see Eq. �1� and Fig. 3, and by the fact that thespherical waves with higher angular momentum l have maxi-mum density at larger radii. These oscillations result in arti-facts in ��E� and unphysical ��E� curves, especially at lowerphotoelectron kinetic energies, as explained below. The an-isotropy parameter is particularly sensitive to the ratio of theradial dipole matrix elements �Eqs. �24� and �25��. Thespherical Bessel functions display tighter oscillations withincreasing energy, such that low energy waves have consid-erable density in the asymptotic region of the Dyson orbitals.
B. Total photodetachment cross sections
In this section we benchmark our model against the ex-perimental data for photodetachment cross sections foratomic and small molecular anions. Basis set effects, whichare found to be significant, are examined in detail for the F−
and C− anions. As noted before,54 the cross section depen-dence on energy for photodetachment from p orbitals is char-acterized by a rapid increase near the threshold which levelsoff at higher energies.
Figure 4 �top� shows the total cross section for F− as a
function of ionizing radiation energy computed with several6-311G�n+��3df� bases with an increasing number of thediffuse �sp� sets and with the appropriate cutoffs of the �d.Whereas n=1 is clearly insufficient, n=2 results are alreadyfairly close to the experimental values. However, completeconvergence is achieved only with 6-311G�3+��3df�.
The cross section values obtained using the aug-cc-pVTZ basis are in between the n=1 and n=2 curves, asexpected from the behavior of the corresponding Dyson or-bitals in Fig. 1. Total cross sections calculated with an in-creasing number of �sp� diffuse functions added to aug-cc-pVTZ show similar convergence, but the calculated valuesare in slightly worse agreement with respect to the experi-mental data points than the converged Pople basis results.
The ��E� curves obtained without the cutoff of Dysonorbital oscillations converge only at the 6-311G�5+��3df�level �Fig. 4, bottom�. This last curve also shows an unphysi-cal kink at approximately 3.6 eV, reproduced bycc-pVTZ�5+� and 6-311G�4+� calculations, which is due tothe oscillatory �d behavior beyond 6.5 Å.
Total cross sections for C− photodetachment �Fig. 5� areconverged with the 6-311G�2+��3df� basis, and the resultswith or without cutoff are almost identical, due to the muchsmaller oscillations in �d at large radii. Total cross sectionsobtained using aug-cc-pVTZ�n+� bases converge to slightlylower values, as in the F− /F case. It is difficult to assesswhether the Pople or the Dunning bases calculations arecloser to the actual value, since experimental errors are onthe same order or larger than the differences between them.
6 8 10 12 14 16 18 20 22-1x10⁻³-8x10⁻⁴-6x10⁻⁴-4x10⁻⁴-2x10⁻⁴
02x10-44x10-46x10-48x10-41x10-3
F 6-311G(4+)(3df)O 6-311G(4+)(3df)C 6-311G(4+)(3df)
Amplitude
z, Angstrom
FIG. 3. Dyson orbitals multiplied by z, z ·�d�0,0 ,z� for F−, O−, and C−
photodetachment calculated using 6-311G�4+��3df� basis sets.
3.5 4.0 4.5 5.0 5.5 6.00.0
0.1
0.2
6-311G(+)(3df)6-311G(2+)(3df)
6-311G(3+)(3df)6-311G(4+)(3df)aug-cc-pVTZaug-cc-pVTZ(2+)aug-cc-pVTZ(3+)experiment
Cross-section,bohr-2
Photon energy, eV
3.5 4.0 4.5 5.0 5.5 6.00.0
0.1
0.2
6-311G(2+)(3df)6-311G(3+)(3df)6-311G(5+)(3df)aug-cc-pVTZ(4+)aug-cc-pVTZ + 4s4pexperiment
Cross-section,bohr-2
Photon energy, eV(b)
(a)
FIG. 4. Absolute photodetachment cross sections for F− photodetachmentcalculated using different basis sets with �upper panel� and without �lowerpanel� cutoffs �see text�. Experimental data and error bars from Ref. 125.
124114-8 C. M. Oana and A. I. Krylov J. Chem. Phys. 131, 124114 �2009�
Author complimentary copy. Redistribution subject to AIP license or copyright, see http://jcp.aip.org/jcp/copyright.jsp
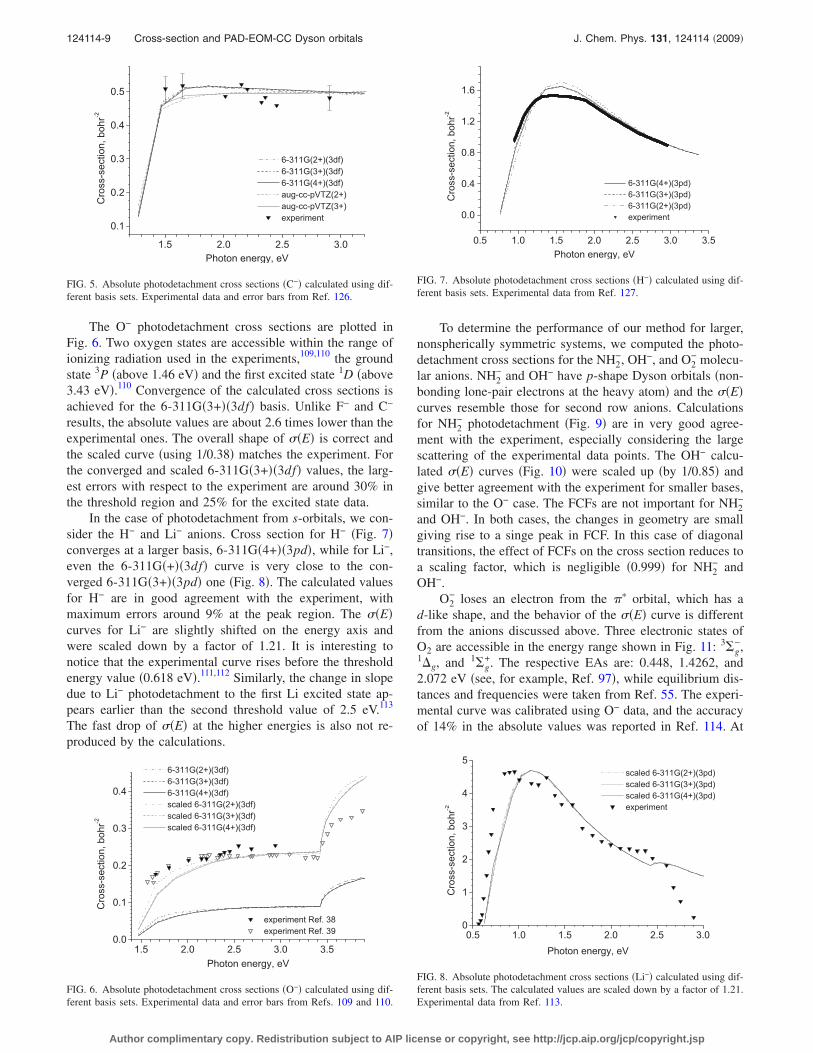
The O− photodetachment cross sections are plotted inFig. 6. Two oxygen states are accessible within the range ofionizing radiation used in the experiments,109,110 the groundstate 3P �above 1.46 eV� and the first excited state 1D �above3.43 eV�.110 Convergence of the calculated cross sections isachieved for the 6-311G�3+��3df� basis. Unlike F− and C−
results, the absolute values are about 2.6 times lower than theexperimental ones. The overall shape of ��E� is correct andthe scaled curve �using 1/0.38� matches the experiment. Forthe converged and scaled 6-311G�3+��3df� values, the larg-est errors with respect to the experiment are around 30% inthe threshold region and 25% for the excited state data.
In the case of photodetachment from s-orbitals, we con-sider the H− and Li− anions. Cross section for H− �Fig. 7�converges at a larger basis, 6-311G�4+��3pd�, while for Li−,even the 6-311G�+��3df� curve is very close to the con-verged 6-311G�3+��3pd� one �Fig. 8�. The calculated valuesfor H− are in good agreement with the experiment, withmaximum errors around 9% at the peak region. The ��E�curves for Li− are slightly shifted on the energy axis andwere scaled down by a factor of 1.21. It is interesting tonotice that the experimental curve rises before the thresholdenergy value �0.618 eV�.111,112 Similarly, the change in slopedue to Li− photodetachment to the first Li excited state ap-pears earlier than the second threshold value of 2.5 eV.113
The fast drop of ��E� at the higher energies is also not re-produced by the calculations.
To determine the performance of our method for larger,nonspherically symmetric systems, we computed the photo-detachment cross sections for the NH2
−, OH−, and O2− molecu-
lar anions. NH2− and OH− have p-shape Dyson orbitals �non-
bonding lone-pair electrons at the heavy atom� and the ��E�curves resemble those for second row anions. Calculationsfor NH2
− photodetachment �Fig. 9� are in very good agree-ment with the experiment, especially considering the largescattering of the experimental data points. The OH− calcu-lated ��E� curves �Fig. 10� were scaled up �by 1/0.85� andgive better agreement with the experiment for smaller bases,similar to the O− case. The FCFs are not important for NH2
−
and OH−. In both cases, the changes in geometry are smallgiving rise to a singe peak in FCF. In this case of diagonaltransitions, the effect of FCFs on the cross section reduces toa scaling factor, which is negligible �0.999� for NH2
− andOH−.
O2− loses an electron from the �� orbital, which has a
d-like shape, and the behavior of the ��E� curve is differentfrom the anions discussed above. Three electronic states ofO2 are accessible in the energy range shown in Fig. 11: 3�g
−,1�g, and 1�g
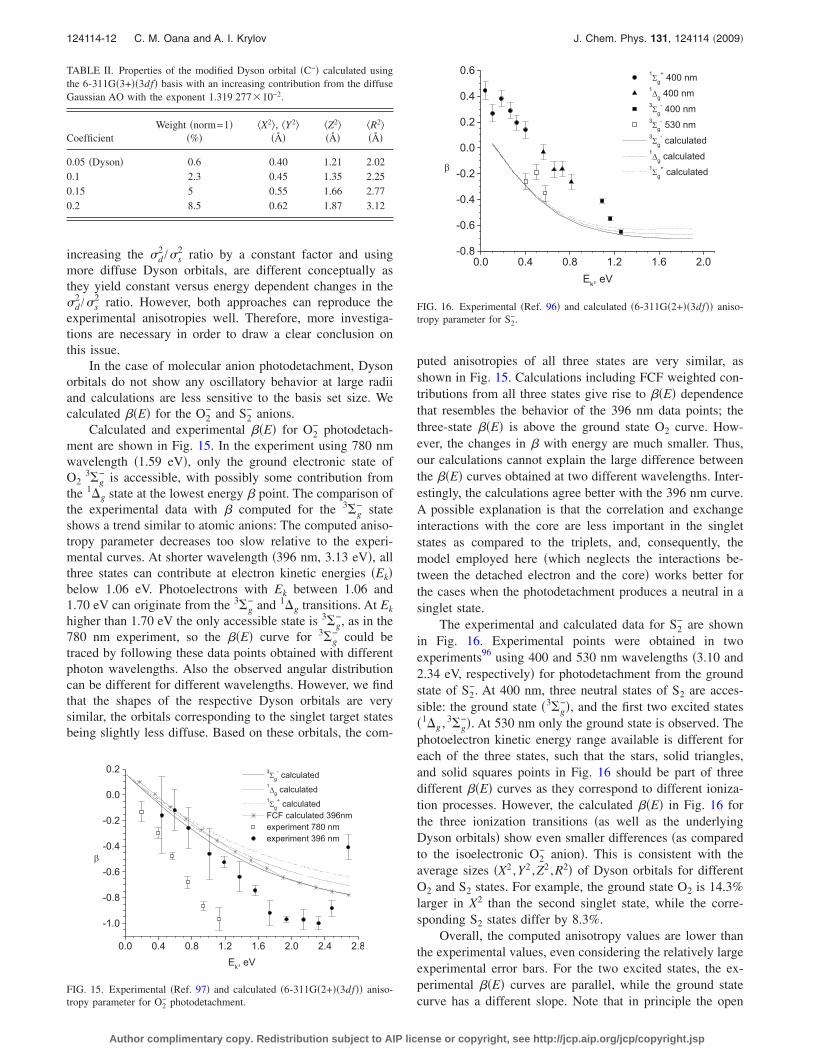
+. The respective EAs are: 0.448, 1.4262, and2.072 eV �see, for example, Ref. 97�, while equilibrium dis-tances and frequencies were taken from Ref. 55. The experi-mental curve was calibrated using O− data, and the accuracyof 14% in the absolute values was reported in Ref. 114. At
1.5 2.0 2.5 3.0
0.1
0.2
0.3
0.4
0.5
6-311G(2+)(3df)6-311G(3+)(3df)6-311G(4+)(3df)aug-cc-pVTZ(2+)aug-cc-pVTZ(3+)experiment
Cross-section,bohr-2
Photon energy, eV
FIG. 5. Absolute photodetachment cross sections �C−� calculated using dif-ferent basis sets. Experimental data and error bars from Ref. 126.
1.5 2.0 2.5 3.0 3.50.0
0.1
0.2
0.3
0.4
6-311G(2+)(3df)6-311G(3+)(3df)6-311G(4+)(3df)scaled 6-311G(2+)(3df)scaled 6-311G(3+)(3df)scaled 6-311G(4+)(3df)
experiment Ref. 38experiment Ref. 39
Cross-section,bohr-2
Photon energy, eV
FIG. 6. Absolute photodetachment cross sections �O−� calculated using dif-ferent basis sets. Experimental data and error bars from Refs. 109 and 110.
0.5 1.0 1.5 2.0 2.5 3.0 3.5
0.0
0.4
0.8
1.2
1.6
6-311G(4+)(3pd)6-311G(3+)(3pd)6-311G(2+)(3pd)experiment
Cross-section,bohr-2
Photon energy, eV
FIG. 7. Absolute photodetachment cross sections �H−� calculated using dif-ferent basis sets. Experimental data from Ref. 127.
0.5 1.0 1.5 2.0 2.5 3.00
1
2
3
4
5scaled 6-311G(2+)(3pd)scaled 6-311G(3+)(3pd)scaled 6-311G(4+)(3pd)experiment
Cross-section,bohr-2
Photon energy, eV
FIG. 8. Absolute photodetachment cross sections �Li−� calculated using dif-ferent basis sets. The calculated values are scaled down by a factor of 1.21.Experimental data from Ref. 113.
124114-9 Cross-section and PAD-EOM-CC Dyson orbitals J. Chem. Phys. 131, 124114 �2009�
Author complimentary copy. Redistribution subject to AIP license or copyright, see http://jcp.aip.org/jcp/copyright.jsp
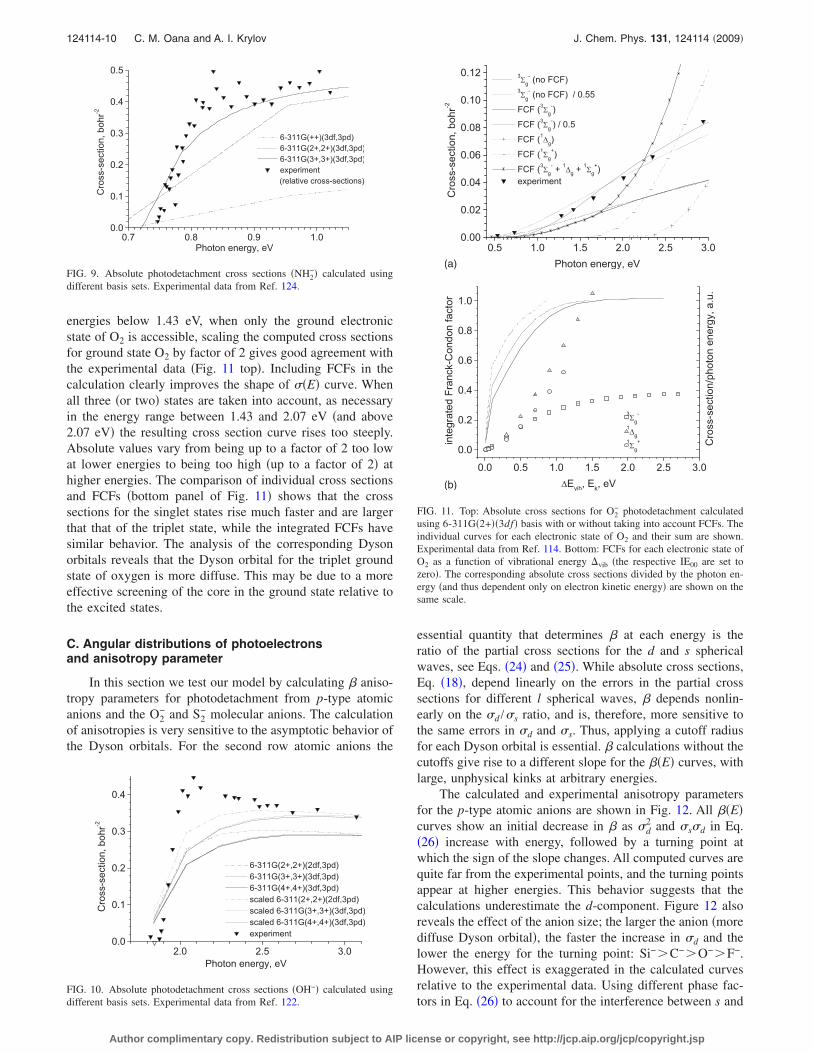
energies below 1.43 eV, when only the ground electronicstate of O2 is accessible, scaling the computed cross sectionsfor ground state O2 by factor of 2 gives good agreement withthe experimental data �Fig. 11 top�. Including FCFs in thecalculation clearly improves the shape of ��E� curve. Whenall three �or two� states are taken into account, as necessaryin the energy range between 1.43 and 2.07 eV �and above2.07 eV� the resulting cross section curve rises too steeply.Absolute values vary from being up to a factor of 2 too lowat lower energies to being too high �up to a factor of 2� athigher energies. The comparison of individual cross sectionsand FCFs �bottom panel of Fig. 11� shows that the crosssections for the singlet states rise much faster and are largerthat that of the triplet state, while the integrated FCFs havesimilar behavior. The analysis of the corresponding Dysonorbitals reveals that the Dyson orbital for the triplet groundstate of oxygen is more diffuse. This may be due to a moreeffective screening of the core in the ground state relative tothe excited states.
C. Angular distributions of photoelectronsand anisotropy parameter
In this section we test our model by calculating � aniso-tropy parameters for photodetachment from p-type atomicanions and the O2
− and S2− molecular anions. The calculation
of anisotropies is very sensitive to the asymptotic behavior ofthe Dyson orbitals. For the second row atomic anions the
essential quantity that determines � at each energy is theratio of the partial cross sections for the d and s sphericalwaves, see Eqs. �24� and �25�. While absolute cross sections,Eq. �18�, depend linearly on the errors in the partial crosssections for different l spherical waves, � depends nonlin-early on the �d /�s ratio, and is, therefore, more sensitive tothe same errors in �d and �s. Thus, applying a cutoff radiusfor each Dyson orbital is essential. � calculations without thecutoffs give rise to a different slope for the ��E� curves, withlarge, unphysical kinks at arbitrary energies.
The calculated and experimental anisotropy parametersfor the p-type atomic anions are shown in Fig. 12. All ��E�curves show an initial decrease in � as �d
2 and �s�d in Eq.�26� increase with energy, followed by a turning point atwhich the sign of the slope changes. All computed curves arequite far from the experimental points, and the turning pointsappear at higher energies. This behavior suggests that thecalculations underestimate the d-component. Figure 12 alsoreveals the effect of the anion size; the larger the anion �morediffuse Dyson orbital�, the faster the increase in �d and thelower the energy for the turning point: Si−�C−�O−�F−.However, this effect is exaggerated in the calculated curvesrelative to the experimental data. Using different phase fac-tors in Eq. �26� to account for the interference between s and
0.7 0.8 0.9 1.00.0
0.1
0.2
0.3
0.4
0.5
6-311G(++)(3df,3pd)6-311G(2+,2+)(3df,3pd)6-311G(3+,3+)(3df,3pd)experiment(relative cross-sections)
Cross-section,bohr-2
Photon energy, eV
FIG. 9. Absolute photodetachment cross sections �NH2−� calculated using
different basis sets. Experimental data from Ref. 124.
2.0 2.5 3.00.0
0.1
0.2
0.3
0.4
6-311G(2+,2+)(2df,3pd)6-311G(3+,3+)(3df,3pd)6-311G(4+,4+)(3df,3pd)scaled 6-311(2+,2+)(2df,3pd)scaled 6-311G(3+,3+)(3df,3pd)scaled 6-311G(4+,4+)(3df,3pd)experiment
Cross-section,bohr-2
Photon energy, eV
FIG. 10. Absolute photodetachment cross sections �OH−� calculated usingdifferent basis sets. Experimental data from Ref. 122.
0.5 1.0 1.5 2.0 2.5 3.00.00
0.02
0.04
0.06
0.08
0.10
0.12 3Σg- (no FCF)
3Σg- (no FCF) / 0.55
FCF (3Σg-)
FCF (3Σg-) / 0.5
FCF (1∆g)
FCF (1Σg+)
FCF (3Σg- + 1
∆g +1Σg+)
experiment
Cross-section,bohr-2
Photon energy, eV
0.0 0.5 1.0 1.5 2.0 2.5 3.0
0.0
0.2
0.4
0.6
0.8
1.0
Cross-section/photonenergy,a.u.
3Σg-
1∆g1Σg+in
tegratedFranck-Condonfactor
∆Evib, Ek, eV(b)
(a)
FIG. 11. Top: Absolute cross sections for O2− photodetachment calculated
using 6-311G�2+��3df� basis with or without taking into account FCFs. Theindividual curves for each electronic state of O2 and their sum are shown.Experimental data from Ref. 114. Bottom: FCFs for each electronic state ofO2 as a function of vibrational energy �vib �the respective IE00 are set tozero�. The corresponding absolute cross sections divided by the photon en-ergy �and thus dependent only on electron kinetic energy� are shown on thesame scale.
124114-10 C. M. Oana and A. I. Krylov J. Chem. Phys. 131, 124114 �2009�
Author complimentary copy. Redistribution subject to AIP license or copyright, see http://jcp.aip.org/jcp/copyright.jsp
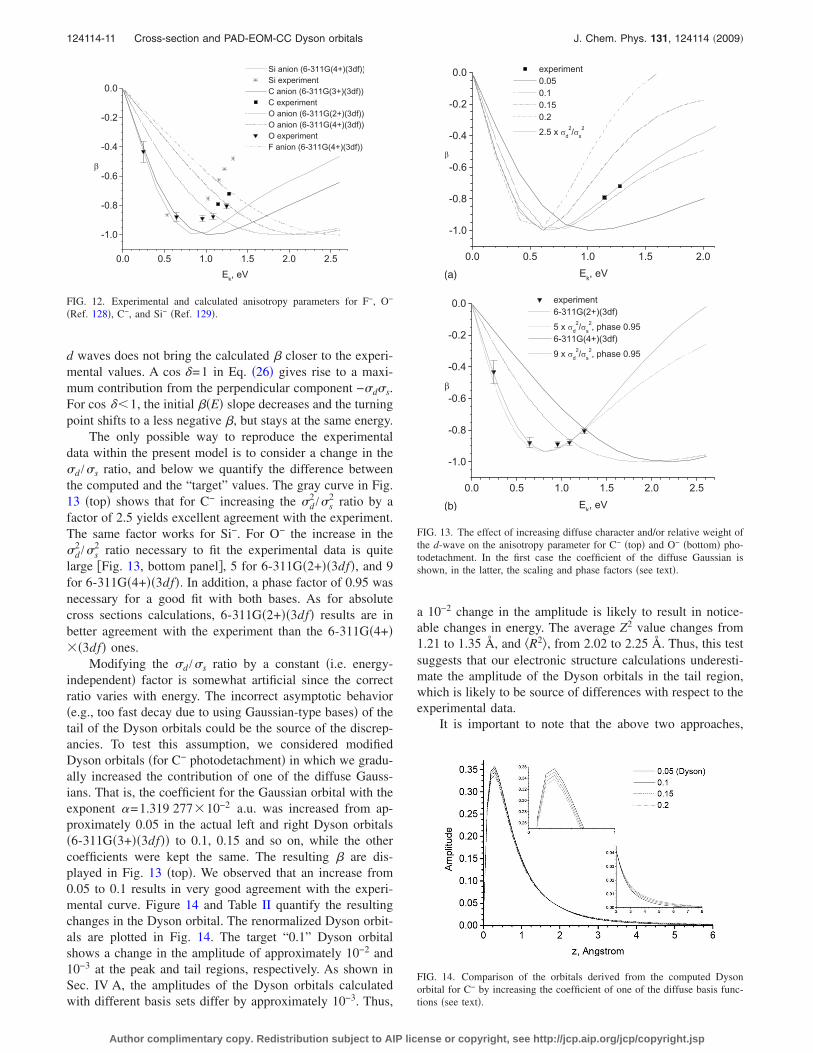
d waves does not bring the calculated � closer to the experi-mental values. A cos �=1 in Eq. �26� gives rise to a maxi-mum contribution from the perpendicular component −�d�s.For cos ��1, the initial ��E� slope decreases and the turningpoint shifts to a less negative �, but stays at the same energy.
The only possible way to reproduce the experimentaldata within the present model is to consider a change in the�d /�s ratio, and below we quantify the difference betweenthe computed and the “target” values. The gray curve in Fig.13 �top� shows that for C− increasing the �d
2 /�s2 ratio by a
factor of 2.5 yields excellent agreement with the experiment.The same factor works for Si−. For O− the increase in the�d
2 /�s2 ratio necessary to fit the experimental data is quite
large �Fig. 13, bottom panel�, 5 for 6-311G�2+��3df�, and 9for 6-311G�4+��3df�. In addition, a phase factor of 0.95 wasnecessary for a good fit with both bases. As for absolutecross sections calculations, 6-311G�2+��3df� results are inbetter agreement with the experiment than the 6-311G�4+���3df� ones.
Modifying the �d /�s ratio by a constant �i.e. energy-independent� factor is somewhat artificial since the correctratio varies with energy. The incorrect asymptotic behavior�e.g., too fast decay due to using Gaussian-type bases� of thetail of the Dyson orbitals could be the source of the discrep-ancies. To test this assumption, we considered modifiedDyson orbitals �for C− photodetachment� in which we gradu-ally increased the contribution of one of the diffuse Gauss-ians. That is, the coefficient for the Gaussian orbital with theexponent =1.319 277�10−2 a.u. was increased from ap-proximately 0.05 in the actual left and right Dyson orbitals�6-311G�3+��3df�� to 0.1, 0.15 and so on, while the othercoefficients were kept the same. The resulting � are dis-played in Fig. 13 �top�. We observed that an increase from0.05 to 0.1 results in very good agreement with the experi-mental curve. Figure 14 and Table II quantify the resultingchanges in the Dyson orbital. The renormalized Dyson orbit-als are plotted in Fig. 14. The target “0.1” Dyson orbitalshows a change in the amplitude of approximately 10−2 and10−3 at the peak and tail regions, respectively. As shown inSec. IV A, the amplitudes of the Dyson orbitals calculatedwith different basis sets differ by approximately 10−3. Thus,
a 10−2 change in the amplitude is likely to result in notice-able changes in energy. The average Z2 value changes from1.21 to 1.35 Å, and �R2�, from 2.02 to 2.25 Å. Thus, this testsuggests that our electronic structure calculations underesti-mate the amplitude of the Dyson orbitals in the tail region,which is likely to be source of differences with respect to theexperimental data.
It is important to note that the above two approaches,
0.0 0.5 1.0 1.5 2.0 2.5
-1.0
-0.8
-0.6
-0.4
-0.2
0.0
Si anion (6-311G(4+)(3df))Si experimentC anion (6-311G(3+)(3df))C experimentO anion (6-311G(2+)(3df))O anion (6-311G(4+)(3df))O experimentF anion (6-311G(4+)(3df))
β
Ek, eV
FIG. 12. Experimental and calculated anisotropy parameters for F−, O−
�Ref. 128�, C−, and Si− �Ref. 129�.
0.0 0.5 1.0 1.5 2.0
-1.0
-0.8
-0.6
-0.4
-0.2
0.0 experiment0.050.10.150.2
2.5 x σd2/σs
2
β
Ek, eV
0.0 0.5 1.0 1.5 2.0 2.5
-1.0
-0.8
-0.6
-0.4
-0.2
0.0 experiment6-311G(2+)(3df)
5 x σd2/σs
2, phase 0.956-311G(4+)(3df)
9 x σd2/σs
2, phase 0.95
β
Ek, eV(b)
(a)
FIG. 13. The effect of increasing diffuse character and/or relative weight ofthe d-wave on the anisotropy parameter for C− �top� and O− �bottom� pho-todetachment. In the first case the coefficient of the diffuse Gaussian isshown, in the latter, the scaling and phase factors �see text�.
FIG. 14. Comparison of the orbitals derived from the computed Dysonorbital for C− by increasing the coefficient of one of the diffuse basis func-tions �see text�.
124114-11 Cross-section and PAD-EOM-CC Dyson orbitals J. Chem. Phys. 131, 124114 �2009�
Author complimentary copy. Redistribution subject to AIP license or copyright, see http://jcp.aip.org/jcp/copyright.jsp
increasing the �d2 /�s
2 ratio by a constant factor and usingmore diffuse Dyson orbitals, are different conceptually asthey yield constant versus energy dependent changes in the�d
2 /�s2 ratio. However, both approaches can reproduce the
experimental anisotropies well. Therefore, more investiga-tions are necessary in order to draw a clear conclusion onthis issue.
In the case of molecular anion photodetachment, Dysonorbitals do not show any oscillatory behavior at large radiiand calculations are less sensitive to the basis set size. Wecalculated ��E� for the O2
− and S2− anions.
Calculated and experimental ��E� for O2− photodetach-
ment are shown in Fig. 15. In the experiment using 780 nmwavelength �1.59 eV�, only the ground electronic state ofO2
3�g− is accessible, with possibly some contribution from
the 1�g state at the lowest energy � point. The comparison ofthe experimental data with � computed for the 3�g
− stateshows a trend similar to atomic anions: The computed aniso-tropy parameter decreases too slow relative to the experi-mental curves. At shorter wavelength �396 nm, 3.13 eV�, allthree states can contribute at electron kinetic energies �Ek�below 1.06 eV. Photoelectrons with Ek between 1.06 and1.70 eV can originate from the 3�g
− and 1�g transitions. At Ek
higher than 1.70 eV the only accessible state is 3�g−, as in the
780 nm experiment, so the ��E� curve for 3�g− could be
traced by following these data points obtained with differentphoton wavelengths. Also the observed angular distributioncan be different for different wavelengths. However, we findthat the shapes of the respective Dyson orbitals are verysimilar, the orbitals corresponding to the singlet target statesbeing slightly less diffuse. Based on these orbitals, the com-
puted anisotropies of all three states are very similar, asshown in Fig. 15. Calculations including FCF weighted con-tributions from all three states give rise to ��E� dependencethat resembles the behavior of the 396 nm data points; thethree-state ��E� is above the ground state O2 curve. How-ever, the changes in � with energy are much smaller. Thus,our calculations cannot explain the large difference betweenthe ��E� curves obtained at two different wavelengths. Inter-estingly, the calculations agree better with the 396 nm curve.A possible explanation is that the correlation and exchangeinteractions with the core are less important in the singletstates as compared to the triplets, and, consequently, themodel employed here �which neglects the interactions be-tween the detached electron and the core� works better forthe cases when the photodetachment produces a neutral in asinglet state.
The experimental and calculated data for S2− are shown
in Fig. 16. Experimental points were obtained in twoexperiments96 using 400 and 530 nm wavelengths �3.10 and2.34 eV, respectively� for photodetachment from the groundstate of S2
−. At 400 nm, three neutral states of S2 are acces-sible: the ground state �3�g
−�, and the first two excited states�1�g , 3�g
−�. At 530 nm only the ground state is observed. Thephotoelectron kinetic energy range available is different foreach of the three states, such that the stars, solid triangles,and solid squares points in Fig. 16 should be part of threedifferent ��E� curves as they correspond to different ioniza-tion processes. However, the calculated ��E� in Fig. 16 forthe three ionization transitions �as well as the underlyingDyson orbitals� show even smaller differences �as comparedto the isoelectronic O2
− anion�. This is consistent with theaverage sizes �X2 ,Y2 ,Z2 ,R2� of Dyson orbitals for differentO2 and S2 states. For example, the ground state O2 is 14.3%larger in X2 than the second singlet state, while the corre-sponding S2 states differ by 8.3%.
Overall, the computed anisotropy values are lower thanthe experimental values, even considering the relatively largeexperimental error bars. For the two excited states, the ex-perimental ��E� curves are parallel, while the ground statecurve has a different slope. Note that in principle the open
TABLE II. Properties of the modified Dyson orbital �C−� calculated usingthe 6-311G�3+��3df� basis with an increasing contribution from the diffuseGaussian AO with the exponent 1.319 277�10−2.
CoefficientWeight �norm=1�
�%��X2�, �Y2�
���Z2���
�R2���
0.05 �Dyson� 0.6 0.40 1.21 2.020.1 2.3 0.45 1.35 2.250.15 5 0.55 1.66 2.770.2 8.5 0.62 1.87 3.12
0.0 0.4 0.8 1.2 1.6 2.0 2.4 2.8
-1.0
-0.8
-0.6
-0.4
-0.2
0.0
0.2 3Σg- calculated
1∆g calculated1Σg+ calculated
FCF calculated 396nmexperiment 780 nmexperiment 396 nm
β
Ek, eV
FIG. 15. Experimental �Ref. 97� and calculated �6-311G�2+��3df�� aniso-tropy parameter for O2
− photodetachment.
0.0 0.4 0.8 1.2 1.6 2.0-0.8
-0.6
-0.4
-0.2
0.0
0.2
0.4
0.6 1Σg+ 400 nm
1∆g 400 nm3Σg- 400 nm
3Σg- 530 nm
3Σg- calculated
1∆g calculated1Σg+ calculatedβ
Ek, eV
FIG. 16. Experimental �Ref. 96� and calculated �6-311G�2+��3df�� aniso-tropy parameter for S2
−.
124114-12 C. M. Oana and A. I. Krylov J. Chem. Phys. 131, 124114 �2009�
Author complimentary copy. Redistribution subject to AIP license or copyright, see http://jcp.aip.org/jcp/copyright.jsp
and solid squares should be fitted to the same curve, as theyboth correspond to photodetachment producing S2 in theground state.
Another interesting feature is that � values at very lowenergies are around 0.4. The ��-type Dyson orbital re-sembles a d orbital, for which the maximum � near thresholdis 0.2. This is an analytical result for d-orbital and our cal-culated curves approach this value at low energies. Experi-mental values higher than 0.2 can be explained by deviationsof the Dyson orbitals from an atomic d orbital, or the limi-tations of the model in which the interactions between thephotoelectron and the core are neglected, as done in thepresent and the Cooper–Zare models. Our calculations,which use the actual Dyson orbital and numeric isotropicaveraging, show that the deviations from an actual d orbitalare negligible, i.e., the computed d and higher angular mo-mentum contributions are indeed very small. It wassuggested115 that S2 is more polarizable, such that neutralcore-photoelectron interactions determine changes in thesymmetry of the core, while this effect is negligible in O2.
V. CONCLUSIONS
We presented calculations of the total and differentialcross sections for photodetachment from negative ions usingDyson orbitals computed with EOM-CC wave functions andfree wave description of the detached electron. The modeldoes not use any empirical parameters. The energy depen-dence of the cross sections is reproduced well, however, theaccuracy of absolute values varies. The maximum errors forF−, C−, NH2
−, H−, Li−, and OH− are 20%, although in manycases the computed cross sections are within experimentalerror bars. The largest errors are observed for O− and O2
− forwhich the calculated cross sections differ from the experi-mental ones by factor of 3 and 2, respectively.
For the atomic photodetachment, the assumptions of ourmodel are the same as in the Cooper–Zare approach. There-fore, it is surprising that the calculated anisotropy parametersfor atomic anions exhibit too slow decrease, which suggeststhat the diffuseness of the computed Dyson orbitals is under-estimated. An incorrect asymptotic behavior is consistentwith the artifactual oscillations of the Hartree–Fock andDyson orbitals, and is probably due to the limitations ofGaussian basis sets.
The analysis of the Dyson orbitals in the case of O2− and
S2− photodetachment shows very little differences between
the orbitals corresponding to different states of the neutral.These small differences cannot explain the experimentallyobserved dependence of � on the energy of ionizing radia-tion. This suggests that the neglected interactions betweenthe detached electron and the core may play an importantrole in shaping the angular distributions of photoelectrons.The experimental values of � at small energies in S2
−, whichexceed the asymptotic value of 0.2 allowed for this type oforbitals, also point out in this direction.
ACKNOWLEDGMENTS
We would like to thank Vadim A. Mozhayskiy for hishelp in developing the EZDYSON interface, to Evgeny
Epifanovsky for his help in parallelizing the code, and to Dr.Liang Tao for the helpful discussions. Support from the De-partment of Energy �Grant No. DE-FG02-05ER15685� isgratefully acknowledged. C.M.O. is a Wise postdoctoral fel-low and acknowledges support from the Wise Research Fund�USC�. This work is conducted under the auspices of theiOpenShell Center for Computational Studies of ElectronicStructure and Spectroscopy of Open-Shell and ElectronicallyExcited Species supported by the National Science Founda-tion through Grant No. CRIF:CRF CHE-0625419�0624602�0625237 grant. We are also grateful to the Institute ofMathematics and its Applications in Minnesota for its hospi-tality, computer resources, and productive environment dur-ing our stay at IMA as visiting scholars.
APPENDIX: ISOTROPIC AVERAGING PROCEDURE
Isotropic averaging is done by applying an inverse Eulerrotation ��−1 transforming Dyson orbital from molecularto the lab frame, as described in Ref. 26. Here we give a fewdetails about the choice of the angular grid used to generatean isotropic ensemble of molecular orientations in the labframe.
Euler angles �� span the following ranges:� �0−2�� , �� �0−��, and � �0−2�� and are uniquelydefined, except for rotations by �=0 or �. In this case, themolecular and lab z-axis coincide, and and rotationsbecome equivalent. Thus, for �=0 or �, spans the�0−2�� range, while =0 only.
An isotropic grid is obtained by considering an equallyspaced angular grid for the �� Euler angles. Alterna-tively, one can use equally spaced grids for and rota-tions, while � rotations are chosen such that they are equallyspaced in cos � �projection on the z-axis�. We tested theaveraging by using different initial orientations of the laserpolarization with respect to the molecular frame and compar-ing the resulting total cross sections and anisotropy param-eters. Our numeric integration tests show that an equallyspaced angular grid for all three Euler angles gives betterresults when the same density angular grids are compared.
For any given �� orientation the weighting factor isgiven by the spherical surface area that it spans:
P�i�ii� =��
2�
1
2�cos �i+1 − cos �i−1� . �40�
1 M. Seel and W. Domcke, J. Chem. Phys. 95, 7806 �1991�.2 K. Wang and V. McKoy, Annu. Rev. Phys. Chem. 46, 275 �1995�.3 D. M. Neumark, Annu. Rev. Phys. Chem. 52, 255 �2001�.4 R. E. Continetti, Annu. Rev. Phys. Chem. 52, 165 �2001�.5 T. Seideman, Annu. Rev. Phys. Chem. 53, 41 �2002�.6 K. L. Reid, Annu. Rev. Phys. Chem. 54, 397 �2003�.7 A. Stolow, Annu. Rev. Phys. Chem. 54, 89 �2003�.8 A. Sanov and R. Mabbs, Int. Rev. Phys. Chem. 27, 53 �2008�.9 K. L. Reid, Int. Rev. Phys. Chem. 27, 607 �2008�.
10 E. P. Wigner, Phys. Rev. 73, 1002 �1948�.11 R. D. Mead, K. R. Lykke, and W. C. Lineberger, in Electronic and Atomic
Collisions, edited by J. Eichler, I. V. Hertel, and N. Stolterfoht �Elsevier,New York, 1984�, p. 721.
12 T. A. Cool, J. Wang, K. Nakajima, C. A. Taatjes, and A. Mcllroy, Int. J.Mol. Sci. 247, 18 �2005�.
124114-13 Cross-section and PAD-EOM-CC Dyson orbitals J. Chem. Phys. 131, 124114 �2009�
Author complimentary copy. Redistribution subject to AIP license or copyright, see http://jcp.aip.org/jcp/copyright.jsp
13 C. A. Taatjes, S. J. Klippenstein, N. Hansen, J. A. Miller, T. A. Cool, J.Wang, M. E. Law, and P. R. Westmoreland, Phys. Chem. Chem. Phys. 7,806 �2005�.
14 I. G. Kaplan, B. Barbiellini, and A. Bansil, Phys. Rev. B 68, 235104�2003�.
15 E. Weigold and I. E. McCarthy, Electron Momentum Spectroscopy �Klu-wer, Dordecht, Plenum, New York, 1999�.
16 M. S. Deleuze and S. Klippenberg, J. Chem. Phys. 125, 104309 �2006�.17 S. Patchkovskii, Z. Zhao, T. Brabec, and D. M. Villenueve, Phys. Rev.
Lett. 97, 123003 �2006�.18 J. Itatani, J. Levesque, D. Zeidler, H. Niikura, H. Pépin, J. C. Kieffer, P.
B. Corkum, and D. M. Villenueve, Nature �London� 432, 867 �2004�.19 M. Yamazaki, T. Horio, N. Kishimoto, and K. Ohno, Phys. Rev. A 75,
032721 �2007�.20 A. A. Abrikosov, L. P. Gorkov, and J. E. Dzyaloskinski, Methods of
Quantum Field Theory in Statistical Physics �Prentice-Hall, EnglewoodCliffs, NJ, 1963�.
21 A. L. Fetter and J. D. Walecka, Quantum Theory of Many Particle Sys-tems �McGraw-Hill, New York, 1971�.
22 J. V. Ortiz, Adv. Quantum Chem. 35, 33 �1999�.23 J. Linderberg and Y. Öhrn, Propagators in Quantum Chemistry �Aca-
demic, London, 1973�.24 L. S. Cederbaum and W. Domcke, Adv. Chem. Phys. 36, 205 �1977�.25 L. S. Cederbaum, W. Domcke, J. Schrimer, and W. von Niessen, Adv.
Chem. Phys. 65, 115 �1986�.26 C. M. Oana and A. I. Krylov, J. Chem. Phys. 127, 234106 �2007�.27 D. J. Rowe, Rev. Mod. Phys. 40, 153 �1968�.28 T. H. Dunning and V. McKoy, J. Chem. Phys. 47, 1735 �1967�.29 T. H. Dunning and V. McKoy, J. Chem. Phys. 48, 5263 �1968�.30 T. I. Shibuya and V. McKoy, J. Chem. Phys. 53, 3308 �1970�.31 C. W. McCurdy, T. N. Rescigno, D. L. Yeager, and V. McKoy, Modern
Theoretical Chemistry �Plenum, New York, 1977�, Vol. 3, pp. 339–386.32 J. Simons and W. D. Smith, J. Chem. Phys. 58, 4899 �1973�.33 J. Simons, Annu. Rev. Phys. Chem. 28, 15 �1977�.34 T. T. Chen, J. Simons, and K. D. Jordan, Chem. Phys. 14, 145 �1976�.35 K. Emrich, Nucl. Phys. A. 351, 379 �1981�.36 H. Sekino and R. J. Bartlett, Int. J. Quantum Chem., Quantum Chem.
Symp. 26, 255 �1984�.37 J. Geertsen, M. Rittby, and R. J. Bartlett, Chem. Phys. Lett. 164, 57
�1989�.38 J. F. Stanton and R. J. Bartlett, J. Chem. Phys. 98, 7029 �1993�.39 S. V. Levchenko and A. I. Krylov, J. Chem. Phys. 120, 175 �2004�.40 D. Sinha, D. Mukhopadhyay, and D. Mukherjee, Chem. Phys. Lett. 129,
369 �1986�.41 S. Pal, M. Rittby, R. J. Bartlett, D. Sinha, and D. Mukherjee, Chem.
Phys. Lett. 137, 273 �1987�.42 J. F. Stanton and J. Gauss, J. Chem. Phys. 101, 8938 �1994�.43 M. Nooijen and R. J. Bartlett, J. Chem. Phys. 102, 3629 �1995�.44 J. Simons, Adv. Quantum Chem. 50, 213 �2005�.45 D. Mukherjee and S. Pal, Adv. Quantum Chem. 20, 291 �1989�.46 R. J. Bartlett and J. F. Stanton, Rev. Comput. Chem. 5, 65 �1994�.47 R. J. Bartlett, Int. J. Mol. Sci. 3, 579 �2002�.48 J. F. Stanton and J. Gauss, Adv. Chem. Phys. 125, 101 �2003�.49 A. I. Krylov, Acc. Chem. Res. 39, 83 �2006�.50 O. Christiansen, Theor. Chim. Acta 116, 106 �2006�.51 A. I. Krylov, Annu. Rev. Phys. Chem. 59, 433 �2008�.52 H. J. Monkhorst, Int. J. Quantum Chem., Quantum Chem. Symp. 11, 421
�1977�.53 A. Landau and A. I. Krylov, “Frozen natural orbitals for ionized states
within equation-of-motion coupled-cluster formalism,” J. Chem. Phys.�submitted�.
54 K. J. Reed, A. H. Zimmerman, H. C. Andersen, and J. I. Brauman, J.Chem. Phys. 64, 1368 �1976�.
55 K. M. Ervin, I. Anusiewicz, P. Skurski, J. Simons, and W. C. Lineberger,J. Phys. Chem. A 107, 8521 �2003�.
56 J. Simons, J. Phys. Chem. A 112, 6401 �2008�.57 A. Sanov and W. C. Lineberger, Phys. Chem. Chem. Phys. 6, 2018
�2004�.58 P. G. Wenthold and W. C. Lineberger, Acc. Chem. Res. 32, 597 �1999�.59 K. M. Ervin and W. C. Lineberger, in Advances in Gas Phase Ion Chem-
istry, edited by N. G. Adams and L. M. Babcock �JAP, Greenwich, CT,1992�, Vol. 1, pp. 121–166.
60 J. V. Coe, S. M. Williams, and K. H. Bowen, Int. Rev. Phys. Chem. 27,27 �2008�.
61 W. J. Zheng, J. M. Nilles, D. Radisic, S. T. Stokes, B. A. Trotter, S.Eustis, A. Grubisic, X. Li, and K. H. Bowen, in Proceedings of theINDO-US Conference on Materials and Biological Applications, editedby S. N. Saku, R. K. Choudhury, and P. Jena �Nova, New York, 2006�, p.135.
62 O. T. Ehrler and D. M. Neumark, Acc. Chem. Res. 42, 769 �2009�.63 D. M. Neumark, J. Phys. Chem. A 112, 13287 �2008�.64 A. N. Alexandrova, J. C. Bopp, B. M. Elliott, T. Herden, and M. A.
Johnson, Int. J. Mol. Sci. 283, 94 �2009�.65 S. Horvath, A. McCoy, J. R. Roscioli, and M. A. Johnson, J. Phys. Chem.
A 112, 12337 �2008�.66 R. A. Relph, J. C. Bopp, and M. A. Johnson, J. Chem. Phys. 129, 064305
�2008�.67 H. Schneider, J. M. Weber, E. M. Myshakin, K. D. Jordan, J. Bopp, T.
Herden, and M. A. Johnson, J. Chem. Phys. 127, 084319 �2007�.68 J. C. Bopp, J. R. Roscioli, M. A. Johnson, T. M. Miller, A. A. Viggiano,
S. M. Villano, S. W. Wren, and W. C. Lineberger, J. Phys. Chem. A 111,1214 �2007�.
69 W. H. Robertson and M. A. Johnson, Annu. Rev. Phys. Chem. 54, 173�2003�.
70 K. H. Bowen and E. W. Schlag, in The Encyclopedia of Mass Spectrom-etry, edited by P. Armentrout �Elsevier, Amsterdam, 2003�, Vol. 1, p. 736.
71 D. M. Neumark, J. Chem. Phys. 125, 132303 �2006�.72 D. M. Neumark, Phys. Chem. Chem. Phys. 7, 433 �2005�.73 A. Stolow, A. E. Bragg, and D. M. Neumark, Chem. Rev. �Washington,
D.C.� 104, 1719 �2004�.74 J. Simons, in Photoionization and Photodetachment, Advanced Series in
Physical Chemistry Vol. 10, edited by C. Y. Ng �World Scientific, Sin-gapore, 2000�.
75 J. Cooper and R. N. Zare, J. Chem. Phys. 48, 942 �1968�.76 S. T. Manson and A. F. Starace, Rev. Mod. Phys. 54, 389 �1982�.77 D. Dill, S. T. Manson, and A. F. Starace, Phys. Rev. Lett. 32, 971 �1974�.78 J. Cooper and R. N. Zare, J. Chem. Phys. 49, 4252 �1968�.79 A. F. Starace, R. H. Rast, and S. T. Manson, Phys. Rev. Lett. 38, 1522
�1977�.80 S. N. Dixit and V. McKoy, J. Chem. Phys. 82, 3546 �1985�.81 K. L. Reid, D. J. Leahy, and R. N. Zare, J. Chem. Phys. 95, 1746 �1991�.82 D. J. Leahy, K. L. Reid, and R. N. Zare, J. Chem. Phys. 95, 1757 �1991�.83 H. Park and R. N. Zare, J. Chem. Phys. 104, 4554 �1996�.84 P. Hockett and K. L. Reid, J. Chem. Phys. 127, 154308 �2007�.85 R. M. Stehman and S. B. Woo, Phys. Rev. A 20, 281 �1979�.86 R. R. Lucchese, G. Raseev, and V. McKoy, Phys. Rev. A 25, 2572
�1982�.87 I. Powis, Chem. Phys. 201, 189 �1995�.88 N. A. Cherepkov, S. K. Semenov, Y. Hikosaka, K. Ito, and A. Yaghisita,
Phys. Rev. Lett. 84, 250 �2000�.89 I. Cacelli, R. Moccia, and A. Rizzo, Phys. Rev. A 57, 1895 �1998�.90 H. A. Bethe and E. E. Salpeter, Quantum Mechanics of One and Two
Electron Atoms �Plenum, New York, 1977�.91 B. T. Pickup and O. Goscinsky, Mol. Phys. 26, 1013 �1973�.92 B. T. Pickup, Chem. Phys. 19, 193 �1977�.93 J. J. Sakurai, Modern Quantum Mechanics �Addison-Wesley, Reading,
MA, 1995�.94 H. A. Bethe, Phys. Rev. 93, 888 �1954�.95 J. Cooper and R. N. Zare, in Atomic Collision Processes, edited by S.
Geltman, K. T. Mahanthappa, and W. E. Brittin �Gordon and Breach,New York, 1968�, Vol. 11C, p. 317.
96 E. Surber, R. Mabbs, and A. Sanov, J. Phys. Chem. A 107, 8215 �2003�.97 F. A. Akin, L. K. Schirra, and A. Sanov, J. Phys. Chem. A 110, 8031
�2006�.98 Y. Shao, L. F. Molnar, Y. Jung, J. Kussmann, C. Ochsenfeld, S. Brown,
A. T. B. Gilbert, L. V. Slipchenko, S. V. Levchenko, D. P. O’Neil, R. A.Distasio, Jr., R. C. Lochan, T. Wang, G. J. O. Beran, N. A. Besley, J. M.Herbert, C. Y. Lin, T. Van Voorhis, S. H. Chien, A. Sodt, R. P. Steele, V.A. Rassolov, P. Maslen, P. P. Korambath, R. D. Adamson, B. Austin, J.Baker, E. F. C. Bird, H. Daschel, R. J. Doerksen, A. Drew, B. D. Dunietz,A. D. Dutoi, T. R. Furlani, S. R. Gwaltney, A. Heyden, S. Hirata, C.-P.Hsu, G. S. Kedziora, R. Z. Khalliulin, P. Klunziger, A. M. Lee, W. Z.Liang, I. Lotan, N. Nair, B. Peters, E. I. Proynov, P. A. Pieniazek, Y. M.Rhee, J. Ritchie, E. Rosta, C. D. Sherrill, A. C. Simmonett, J. E. Subot-nik, H. L. Woodcock III, W. Zhang, A. T. Bell, A. K. Chakraborty, D. M.Chipman, F. J. Keil, A. Warshel, W. J. Herhe, H. F. Schaefer III, J. Kong,A. I. Krylov, P. M. W. Gill, and M. Head-Gordon, Phys. Chem. Chem.Phys. 8, 3172 �2006�.
124114-14 C. M. Oana and A. I. Krylov J. Chem. Phys. 131, 124114 �2009�
Author complimentary copy. Redistribution subject to AIP license or copyright, see http://jcp.aip.org/jcp/copyright.jsp

99MOLPRO, a package of ab initio programs designed by H.-J. Werner and P.J. Knowles, version 2002.6.
100 W. J. Hehre, R. Ditchfield, and J. A. Pople, J. Chem. Phys. 56, 2257�1972�.
101 R. Krishnan, J. S. Binkley, R. Seeger, and J. A. Pople, J. Chem. Phys. 72,650 �1980�.
102 T. H. Dunning, J. Chem. Phys. 90, 1007 �1989�.103 M. Gutowski, K. D. Jordan, and P. Skurski, J. Phys. Chem. A 102, 2624
�1998�.104 C. M. Oana, V. A. Mozhayskiy, and A. I. Krylov, EZDYSON, http://
iopenshell.usc.edu/downloads/.105 See EPAPS supplementary material http://dx.doi.org/10.1063/1.3231143
for cross-section and anisotropy outputs from the EZDYSON program.106 V. A. Mozhayskiy and A. I. Krylov, EZSPECTRUM, http://
iopenshell.usc.edu/downloads/.107 J. Hachmann, P. T. A. Galek, T. Yanai, G. K. L. Chan, and N. C. Handy,
Chem. Phys. Lett. 392, 55 �2004�.108 C. D. Sherrill, A. I. Krylov, E. F. C. Byrd, and M. Head-Gordon, J.
Chem. Phys. 109, 4171 �1998�.109 L. M. Branscomb, D. S. Burch, S. J. Smith, and S. Geltman, Phys. Rev.
111, 504 �1958�.110 L. M. Branscomb, S. J. Smith, and G. Tisone, J. Chem. Phys. 43, 2906
�1965�.111 J. Dellwo, Y. Liu, and D. J. Pegg, Phys. Rev. A 45, 1544 �1992�.112 G. Haeffler, D. Hanstorp, I. Kiyan, A. E. Klinkmuller, U. Ljungblad, and
D. J. Pegg, Phys. Rev. A 53, 4127 �1996�.
113 H. J. Kaiser, E. Heinicke, R. Rackwitz, and D. Feldmann, Z. Phys. 270,259 �1974�.
114 D. S. Burch, S. J. Smith, and L. M. Branscomb, Phys. Rev. 112, 171�1958�.
115 A. Sanov, private communication.116 C. Blondel, P. Cacciani, C. Delsart, and R. Trainham, Phys. Rev. A 40,
3698 �1989�.117 C. Blondel, C. Delsart, and F. Goldfarb, J. Phys. B 34, L281 �2001�.118 M. Scheer, R. C. Bilodeau, C. A. Brodie, and H. K. Haugen, Phys. Rev.
A 58, 2844 �1998�.119 C. Valli, C. Blondel, and C. Delsart, Phys. Rev. A 59, 3809 �1999�.120 C. L. Pekeris, Phys. Rev. 126, 1470 �1962�.121 K. R. Lykke, K. K. Murray, and W. C. Lineberger, Phys. Rev. A 43, 6104
�1991�.122 L. M. Branscomb, Phys. Rev. 148, 11 �1966�.123 CRC Handbook of Chemistry and Physics, 62th ed., edited by R. C.
Weast �CRC Press, Boca Raton, FL, 1981�.124 K. C. Smyth and J. I. Brauman, J. Chem. Phys. 56, 4620 �1972�.125 A. Mandl, Phys. Rev. A 3, 251 �1971�.126 M. L. Seman and L. M. Branscomb, Phys. Rev. 125, 1602 �1962�.127 S. J. Smith and D. S. Burch, Phys. Rev. 116, 1125 �1959�.128 D. Hanstorp, C. Bengtsson, and D. J. Larson, Phys. Rev. A 40, 670
�1989�.129 A. M. Covington, D. Calabrese, W. W. Williams, J. S. Thompson, and T.
J. Kvale, Phys. Rev. A 56, 4746 �1997�.
124114-15 Cross-section and PAD-EOM-CC Dyson orbitals J. Chem. Phys. 131, 124114 �2009�
Author complimentary copy. Redistribution subject to AIP license or copyright, see http://jcp.aip.org/jcp/copyright.jsp
![Circular Dichroism in the Photoelectron Angular ...€¦ · depictedinFigure 1cwheretheregionoftheB band[18] actsas the resonant intermediate state. The vertical ionization potential](https://img.pdfslide.us/doc/110x75/6060b90c231d1648f6685fa6/circular-dichroism-in-the-photoelectron-angular-depictedinfigure-1cwheretheregionoftheb.jpg)


![Energy, angular momentum and · Energy, angular momentum and force distributions inside nucleons July 30, Scottish Event Campus, Glasgow, UK [C.L., Mantovani, Pasquini, PLB776 (2018)]](https://img.pdfslide.us/doc/110x75/5f57b0cfd20f4a341229dd57/energy-angular-momentum-and-energy-angular-momentum-and-force-distributions-inside.jpg)