Embed Size (px)
Citation preview
ORIGINAL RESEARCHpublished: 13 September 2019doi: 10.3389/fpubh.2019.00256
Frontiers in Public Health | www.frontiersin.org 1 September 2019 | Volume 7 | Article 256
Edited by:
Maciej S. Buchowski,
Vanderbilt University, United States
Reviewed by:
Tony Kuo,
Fielding School of Public Health,
United States
MinJae Lee,
University of Texas, United States
*Correspondence:
Tiffany M. Powell-Wiley
Specialty section:
This article was submitted to
Epidemiology,
a section of the journal
Frontiers in Public Health
Received: 23 May 2019
Accepted: 22 August 2019
Published: 13 September 2019
Citation:
Claudel SE, Shiroma EJ, Harris TB,
Mode NA, Ahuja C, Zonderman AB,
Evans MK and Powell-Wiley TM
(2019) Cross-Sectional Associations
of Neighborhood Perception, Physical
Activity, and Sedentary Time in
Community-Dwelling,
Socioeconomically Diverse Adults.
Front. Public Health 7:256.
doi: 10.3389/fpubh.2019.00256
Cross-Sectional Associations ofNeighborhood Perception, PhysicalActivity, and Sedentary Time inCommunity-Dwelling,Socioeconomically Diverse AdultsSophie E. Claudel 1, Eric J. Shiroma2, Tamara B. Harris 2, Nicolle A. Mode2,Chaarushi Ahuja 1, Alan B. Zonderman2, Michele K. Evans 2 and Tiffany M. Powell-Wiley 1*
1 Social Determinants of Obesity and Cardiovascular Risk Laboratory, National Heart, Blood, Lung Institute, National Institutes
of Health, Bethesda, MD, United States, 2 Laboratory of Epidemiology and Population Science, National Institute on Aging,
National Institutes of Health, Bethesda, MD, United States
Background: Little is known about the role of perceived neighborhood environment
as a determinant of physical activity (PA) and sedentary time (ST) in understanding
obesity-related health behaviors. We focus on a biracial, socioeconomically diverse
population using objectively measured ST, which is under-represented in the literature.
Methods: We examined the association between self-reported neighborhood
perception (Likert-scale questions), PA using the Baecke questionnaire, and both
non-sedentary time and ST using accelerometry from wave 4 of the Healthy Aging in
Neighborhoods of Diversity across the Life Span (HANDLS) study (n = 2,167). After
applying exclusion criteria, the sample size was n = 1,359 for analyses of self-reported
PA and n = 404 for analyses of accelerometry data. Factor analysis identified key
neighborhood characteristics to develop a total neighborhood perception score (NPS).
Higher NPS indicated less favorable neighborhood perception. Linear regression was
used to determine the relationship between NPS, PA, non-sedentary time, and ST.
Results: Complete data were available for n = 1,359 [age 56.6(9.0) years, 59.5%
female, 62.2% African American] for whom we identified four neighborhood perception
factors: (1) concern about crime, (2) physical environment, (3) location of violent crime,
and (4) social environment. Worsening perception of the overall neighborhood [β=−0.13
(SE= 0.03); p= 0.001], the physical environment [−0.11 (0.05); p= 0.03], and the social
environment [−0.46 (0.07); p < 0.0001] were associated with decreased PA. Worsening
perception of the overall neighborhood [1.14 (0.49); p = 0.02] and neighborhood social
environment [3.59 (1.18); p = 0.003] were associated with increased ST over the day.
There were no interactions for race, sex, poverty status, or economic index.
Conclusion: Poor overall neighborhood perception, perceived social environment,
and perceived neighborhood physical environment are associated with PA and ST in a
multi-racial, socioeconomically diverse cohort of urban adults.
Clinical Trial Registration: The HANDLS study is registered at ClinicalTrials.gov
as NCT01323322.
Keywords: physical activity, sedentary time, racial/ethnic disparities, neighborhood, perceived crime, HANDLS

Claudel et al. Neighborhood and Physical Activity
INTRODUCTION
In the United States, 25% of deaths are attributable tocardiovascular disease, making it the leading cause of deathfor both men and women (1). Nearly 50% of Americans havea significant risk factor for cardiovascular events, includinghypertension, hyperlipidemia, and smoking; yet few are activelyaddressing these risks with health behavior change (1). Physicalactivity (PA) has been repeatedly shown to reduce risk ofcardiovascular events, decrease overall mortality, and amelioratehealth, leading multiple expert panels to recommend increasedPA and decreased sedentary time (ST) as important preventivemeasures (2). Sedentary time is critical for intervention asit is an independent risk factor for cardiometabolic disease(3, 4) and, with accumulating evidence, all-cause mortality(5, 6). However, individual behavior cannot be consideredindependently of its environmental context, which may beexerting formidable influence on decision-making throughperception and opportunity.
The neighborhood environment is undoubtedly a keydeterminant of cardiovascular health, as it has been repeatedlyassociated with increasing body mass index (7), cardiovascularevents (8), and incident diabetes (9, 10). Neighborhood factorsthat influence health include crime (6, 7), perceived safety(11), physical attributes (graffiti, lighting, structural damage,etc.) (12), social cohesion (13), and walkability (10). A recentreview highlights the constructs underlying neighborhoodsand cardiometabolic health (14). Social cohesion refers to thecollective efficacy that underlies building shared communityvalues to advance toward common goals (15–17). Neighborhooddisorder refers to physical decay and fear that negatively impactthe neighborhood environment (15, 18). Walkability is the abilityof the physical environment to facilitate outdoor recreationalactivities, such as active transport (10, 19). The more notabledebate regarding these concepts is whether research shouldemphasize objective or perceived measures of neighborhoodcondition. Several studies demonstrate resident perception ofthese factors as more predictive of health outcomes than objectivemeasures (7, 11, 20, 21).
Although many studies have focused on neighborhoodbarriers to PA, few have looked at factors that promote sedentarybehavior (22). Those that have evaluated the relationshipbetween neighborhood factors and ST have reported mixedresults, likely due to variable neighborhood measures andinconsistent operational definitions of ST. Use of objectivemeasures of ST is even more rare. Kozo and colleaguesinvestigated accelerometry and self-reported ST to evaluate therelationship between ST and neighborhood walkability, but didnot consider other neighborhood characteristics (23). Similarly,Van Dyck and colleagues examined transit-related ST in relationto neighborhood walkability and transportation resources, butdid not measure other neighborhood conditions and reliedentirely on self-reported ST (24). Despite the discrepancies in
Abbreviations: PA, physical activity; ST, sedentary time; CVD, cardiovasculardisease; NPS, neighborhood perception score; HANDLS, Healthy Aging inNeighborhoods of Diversity across the Lifespan.
measurement and analysis, preliminary findings support therole of neighborhood environment on ST (25, 26) and healthoutcomes such as blood pressure, resting heart rate, and bodymass index (BMI) (21, 25). Further studies are needed to evaluatethe role of the neighborhood environment on health behaviorswithin diverse populations, using objective measures of ST, andconsidering multiple neighborhood characteristics.
Using data from the Healthy Aging in Neighborhoods ofDiversity across the Life Span (HANDLS) study of AfricanAmerican and white, socioeconomically diverse, community-dwelling adults, we explore the neighborhood environment as akey precipitant of CVD risk through its ability to decrease PA andpromote ST. This study aims to investigate the cross-sectionalrelationship between perception of neighborhood environment,PA, and ST, as well as the potential moderating effects of race, sex,and socioeconomic status. We expect that those who perceive aworse neighborhood environment will be less likely to engage inPA and more likely to engage in sedentary behavior.
METHODS
HANDLS StudyThe HANDLS study is a cohort (n= 3,720) of white and AfricanAmerican socioeconomically diverse individuals in BaltimoreCity, Maryland 30–64 years old at baseline. The participantsare a fixed cohort recruited from 13 neighborhoods selected byarea probability sampling. As a longitudinal study, HANDLScollected consecutive waves of data every 4–5 years with interimanalyses. Waves 1 through 4 were completed between August2004 and September 2017, with Wave 4—used here—occurringfrom September 2013 to September 2017. The study design andmethodology have been previously described in detail (27). TheNational Institute of Environmental Health Sciences institutionalreview board approved the study and all participants signedwritten, informed consent.
Secondary data from the HANDLS study were analyzedfor this project. Using HANDLS Wave 4 data (n = 2,167),we excluded participants who refused to answer theentire neighborhood questionnaire (n = 591) or entire PAquestionnaire (n = 103), as well as those who lacked completecovariate data (n = 208). This resulted in a sample of 1,359 foranalysis of PA. A subset of Wave 4 participants were offeredthe opportunity to participate in the accelerometry. The samplesize is limited in these analyses by both the smaller cohort whoparticipated and by missing covariate data. The final analyticsample for the accelerometry cohort was n = 404. HANDLSWave 4 was the only wave with accompanying accelerometerdata, therefore, the analyses were conducted cross-sectionallyrather than longitudinally.
Neighborhood QuestionnaireThe exposure of interest, neighborhood perception score(NPS), was derived via principal components factor analysisfrom a neighborhood questionnaire completed by HANDLSparticipants. Response options were scaled on a 5-pointLikert scale. The questionnaire consisted of two questions onneighborhood accessibility, five questions on neighborhood
Frontiers in Public Health | www.frontiersin.org 2 September 2019 | Volume 7 | Article 256

Claudel et al. Neighborhood and Physical Activity
social cohesion, three questions on neighborhood socialconscience, 11 questions on neighborhood disorder, and29 questions on neighborhood crime. Neighborhood socialcohesion, social conscience, and disorder were assessed usingdimensions suggested by Sampson et al. (15, 28). The remainingneighborhood violence questions were developed by a HANDLScollaborator and expert in the field.
Measures of Physical Activity andSedentary TimeSelf-reported Likert scale responses to the Baecke PhysicalActivity Questionnaire were reverse coded as needed andsummed into individual category scores (Work, Sport, andLeisure) and then summed again for a total PA score. Work,Sport, and Leisure PA are standard indices of the BaeckeQuestionnaire and are created by summing responses to thequestions included in each section of the questionnaire, asdescribed by Baecke et al. (29). Leisure time PA (LTPA) wasdefined as the sum of Sport and Leisure PA. A higher combinedscore indicates a greater level of PA. This questionnaire has beenrepeatedly validated in numerous populations (30–32). However,there is no standard conversion to minutes per week of PA.
ST and non-sedentary time were measured by an ActiGraphGT3X+ accelerometer in a subset of the Wave 4 participants(n = 760). The wrist location of the ActiGraph has beenshown to have increased participant adherence for 24-h wearcompared to both hip-based locations and the adhesivelyattached leg of the ActivPAL. Additionally, ActiGraph hasa longer battery life. Participants were asked to wear awrist-worn ActiGraph 24 h per day (except when bathing,showering, or swimming) for 1 week. Accelerometer datawere aggregated into 60-s epochs and then screened fornon-wear using a standard algorithm to detect sustainedperiods of non-movement (33). Accelerometer data wereconsidered to be valid if participants had more than 10 hper day of wear on at least 4 days. Accelerometer-assessedsedentary time was defined as the number of minutes whenthe accelerometer registered <1,853 vector magnitude counts(34). A vector magnitude count is an aggregated measure ofacceleration across all three axes. Non-sedentary time was usedas a proxy measure for objective PA in these participants.Accelerometer data were further categorized by time of dayas total waking hours (5 a.m.−11 p.m.); exploratory analyseswere conducted with three additional categories: morning hours(5 a.m.−9 a.m.), working hours (9 a.m.−5 p.m.), and eveninghours (5 p.m.−11 p.m.).
CovariatesThe covariates used in the analyses were collected duringthe HANDLS study visit via interview and questionnaire.The categorical covariates include sex (women vs. men),race/ethnicity (African American vs. Non-Hispanic White),poverty status (above vs. below 125% of the federal povertylevel), education [less than high school vs. high school/GeneralEducational Development (GED) and above], and length ofresidence in the neighborhood (<1 year vs.≥1 year). Continuouscovariates include age (years), BMI (kg/m2), and neighborhood
economic index based on 2012–2016 American CommunitySurvey data [NEI; see Mode et al. (35)]. Neighborhood economicindex was used to provide a measure of objective neighborhoodenvironment in the analysis. Covariates were selected followingreview of the literature (35–37).
Statistical AnalysisThe neighborhood perception score (NPS) was calculatedfrom the neighborhood questionnaire using the followinganalytic technique. Principal axis factoring was used toidentify common themes (factors) from the neighborhoodquestionnaire. The sample size was assessed to be sufficientfor factor analysis based on prior research (38). Promax(oblique) rotation was applied. A loading score of 0.40was required for inclusion in the factor and the minimumeigenvalue was set at 1. Neighborhood perception scores werecomputed using only the items that loaded into factors. Thenumerical value of each Likert-scale response was summedto create a total neighborhood perception score (NPS) andfactor-specific NPS. Cronbach’s alpha measured the internalconsistency of each factor; only those with a value above0.70 were considered acceptable. A higher NPS representsa worse perception of the neighborhood environment.Analysis of Kurtosis and Skew demonstrated that NPS wasnormally distributed.
Descriptive statistics of participant characteristics werecalculated and evaluated for correlation to total NPS usingpairwise correlation coefficients. Since the data are a multilevelstructure (i.e., individuals nested within census tracts), anintraclass correlation coefficient (ICC) was calculated for anintercept only model. The ICC was 2.7%, indicating a lowproportion of the variability lies within census tracts. AlthoughICC is not the only available indicator for determiningthe need for multilevel modeling, it informed the decisionto pursue simple regression models instead of multilevelmodeling (39–41). Multivariable linear regression modelingevaluated the influence of NPS on PA, LTPA, non-sedentarytime, and ST. Models were adjusted for age, BMI, race(referent = white), poverty status (referent = above povertylevel), education (referent = below high school/GED), NEI,and length of residence at the same address (referent ≤1year). Multicollinearity of the variables was examined usingtolerance and variance inflation factors (VIF), and independentvariables (i.e., age, race, sex, BMI, income, education, lengthof residence, poverty status, NEI) were not found to becollinear (VIF < 2.0). After adjustment for covariates, thesample size for the PA and LTPA was n = 1,359 and thesample for ST and non-sedentary time was n = 404, due tomissing covariate data. Interaction terms between NPS andrace, sex, NEI, and poverty status were evaluated. All analyseswere conducted in Stata/IC Version 12.1 (StataCorp, CollegeStation, TX).
RESULTS
Participant socio-demographic, health, and neighborhoodcharacteristics are shown in Table 1. Total NPS ranged from
Frontiers in Public Health | www.frontiersin.org 3 September 2019 | Volume 7 | Article 256

Claudel et al. Neighborhood and Physical Activity
TABLE 1 | Correlations between participant characteristics and total
neighborhood perception score for the analytic cohort (n = 1,359).
Estimate Correlation
with NPS
p-value
NPS score range 42–140
SOCIODEMOGRAPHIC VARIABLES
Age (Years) 56.1 (9.0) −0.12 <0.0001
Sex 0.07 0.01
Women 809 (59.5)
Men 550 (40.5)
Race −0.18 <0.0001
African American 845 (62.2)
White 514 (37.8)
Poverty Status 0.06 0.03
Below Poverty Level 492 (36.2)
Above Poverty Level 867 (63.8)
Education −0.02 0.48
12th grade and below 402 (29.6)
High School/GED and above 957 (70.4)
BMI (kg/m2) 31.0 (7.7) −0.003 0.91
Length of Residence −0.01 0.74
<1 year 161 (11.9)
≥1 year 1,198 (88.2)
Neighborhood Economic Index (NEI) −3.6 (4.3) −0.13 <0.0001
ACTIVITY VARIABLES
Physical Activity (Baecke)
Work PA Scorea 13.9 (10.6) −0.05 0.06
Leisure Time PA Scoreb 15.2 (10.3) −0.08 0.003
Total PA Scorec 28.4 (16.1) −0.09 0.001
Average Sedentary Time (min)
Total Waking Hours (5 a.m.−11 p.m.) 602.8 (136.5) 0.14 0.006
Morning Hours (5 a.m.−9 a.m.) 162.4 (50.9) 0.13 0.008
Working Hours (9 a.m.−5 p.m.) 242.0 (67.8) 0.12 0.01
Evening Hours (5 p.m.−11 p.m.) 204.4 (52.8) 0.06 0.20
Percent Time Spent Sedentary
Total Waking Hours (5 a.m.−11 p.m.) 59.4 (12.1) 0.13 0.007
Morning Hours (5 a.m.−9 a.m.) 73.1 (17.8) 0.15 0.003
Working Hours (9 a.m.−5 p.m.) 52.3 (14.7) 0.11 0.02
Evening Hours (5 p.m.−11 p.m.) 60.4 (13.8) 0.07 0.17
Estimate represents Mean (SD) or N (%), as appropriate.aTotal possible work PA score = 38.bTotal possible leisure time PA score = 50.cTotal possible overall PA score = 88.
42 to 140, with a median value of 87. The sample was ∼60%female, 62% African American, and had a mean age of 56.1 years(SD 9.0) and mean BMI of 31.0 kg/m2 (SD 7.7). None of thesocio-demographic or activity variables were strongly correlatedto total NPS, as all correlation coefficients were <0.18 (Table 1).Correlations between the factor scores were also assessed andfound to be minimal (data not shown).
The results of the principal component factor analysisare shown in Table 2. The analysis yielded four factors thattogether explained 93.7% of the variance. The four factors were
interpreted as: (1) concern about specific types of crime, (2)physical environment, (3) location of violent crime, and (4) socialenvironment, with Cronbach’s alpha coefficients of 0.96, 0.93,0.87, and 0.83, respectively. As shown in Table 2, 13 questionsdefined worrying about specific types of crime, 11 questionsdefined perceptions of neighborhood physical environment,five questions defined perceptions of where violent crimeoccurs, and seven questions defined perceptions of neighborhoodsocial environment.
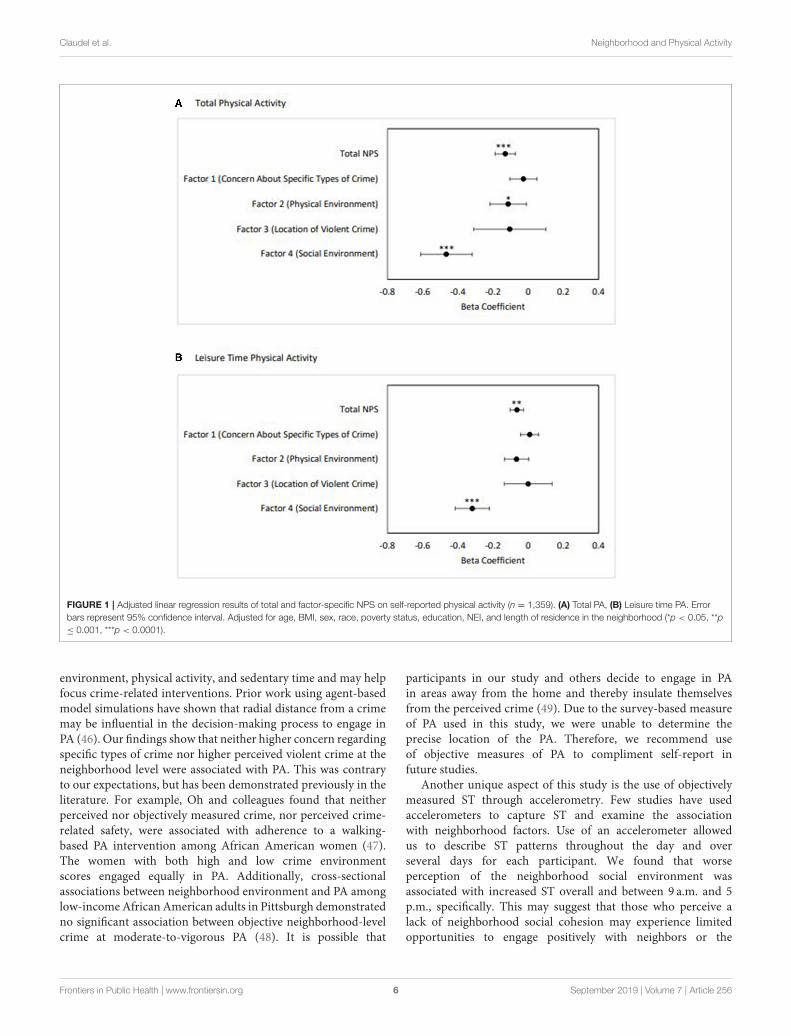
Figure 1 shows the beta coefficients (β) and 95% confidenceintervals of the regression results for total and factor-specificNPS on self-reported PA. For total PA, worsening overallneighborhood perception (β = −0.13; SE = 0.03; p = 0.001),perception of the neighborhood physical environment (Factor2; β = −0.11; SE = 0.05; p = 0.03), and perception of theneighborhood social environment (Factor 4; β = −0.46; SE =
0.07; p < 0.0001) were associated with lower levels of PA. Forleisure time PA, worsening overall neighborhood perception (β=−0.06; SE= 0.02; p= 0.001) and perception of the neighborhoodsocial environment (Factor 4; β = −0.32; SE = 0.05; p < 0.0001)were associated with decreased LTPA. There were no significantinteractions for sex, race, or socioeconomic status. The regressioncoefficients for all covariates in each model for PA and LTPA areincluded in Supplemental Tables 1, 2, respectively.
Table 3 shows the regression results of total and factor-specificNPS on objectively measured ST. Worsening perception of theoverall neighborhood environment was associated with increasedST over the entire waking day (β 1.14; SE 0.49; p = 0.02).Worsening perception of the neighborhood social environment(Factor 4) was associated with increased ST over the entire day (β3.59; SE 1.18; p = 0.003). There were no significant interactionsfor sex, race, or socioeconomic status.
Further exploratory analyses were conducted to evaluate STduring discrete periods of the day (morning hours, workinghours, and evening hours). Worsening perception of the overallneighborhood environment was associated with increased STduring morning hours (β 0.47; SE 0.19; p = 0.01). Additionally,worsening perception of the neighborhood social environment(Factor 4) was associated with increased ST during working hours(β 1.75; SE 0.59; p = 0.003). Data for discrete periods of the dayare shown in Supplemental Tables 3–5.
Objectively measured non-sedentary time was similarlyanalyzed. Regression results for total and factor specific NPSfor total waking hours and during discrete periods of the day.Results of these analyses were non-significant and are presentedin Supplemental Tables 6–9.
DISCUSSION
Based on cross-sectional data from the bi-racial,socioeconomically diverse HANDLS study, neighborhoodenvironment appears to have a potent association withindividuals’ PA and ST. The literature on neighborhoodenvironment describes differential effects based on gender(42, 43) and race (44). We considered the potential effectmodification of race, sex, and socioeconomic status, but found
Frontiers in Public Health | www.frontiersin.org 4 September 2019 | Volume 7 | Article 256

Claudel et al. Neighborhood and Physical Activity
TABLE 2 | Rotated factor loading scores and mean Likert scale response to the questions that loaded into each factor (n = 1,359).
Factor Question pertaining to: Likert scale
response mean (SD)
Factor 1 Factor 2 Factor 3 Factor 4
Concern about
specific types of
crime (Factor 1)
Violent crime inside neighbors’ homes 2.68 0.54 −0.11 0.21 0.02
Murders near where you live 2.21 0.82 0.03 0.05 −0.02
Shootings near where you live 2.13 0.83 −0.02 0.03 0.02
Rapes or sexual assaults near where you live 2.24 0.94 0.03 −0.09 0.03
Robberies near where you live 2.13 0.86 0.03 0.03 −0.009
Car-jackings near where you live 2.44 0.93 0.02 −0.10 0.08
Aggravated assaults (serious harm) near where
you live
2.31 0.96 0.005 −0.04 0.03
Common assaults (minor harm) near where you live 2.32 0.92 0.02 0.009 0.02
Residential burglaries near where you live 2.21 0.85 0.04 0.03 0.001
Violent crime inside neighbors’ homes 2.48 0.93 0.008 −0.11 0.02
Violent crime on your street 2.44 0.80 −0.05 0.04 −0.02
You being victimized (mugged, robbed, assaulted) 2.55 0.62 0.003 0.16 −0.13
Your home being burglarized 2.58 0.46 −0.01 0.20 −0.14
Physical
environment
(Factor 2)
Graffiti in neighborhood 2.32 0.03 0.65 −0.05 0.07
Litter in neighborhood 3.00 0.04 0.64 −0.03 0.07
Drug dealers, drug users, or drunks in neighborhood 2.73 −0.06 0.78 0.06 −0.007
Unemployed adults loitering in neighborhood 2.62 −0.003 0.82 0.02 0.008
Gang activity in neighborhood 1.92 −0.03 0.73 0.02 0.02
Disorderly teens or children in neighborhood 2.43 −0.001 0.76 0.03 0.05
Prostitution in neighborhood 1.87 0.003 0.64 0.04 0.06
Vacant or abandoned buildings in neighborhood 2.57 −0.008 0.85 0.04 −0.08
Broken windows in neighborhood 2.23 −0.02 0.87 0.09 −0.07
Serious crimes (assault, mugging, robbery) 2.37 −0.005 0.68 −0.09 0.01
Houses or yards not kept up in neighborhood 2.65 0.02 0.72 0.02 0.009
Location of violent
crime (Factor 3)
Violent crime on your street 2.61 0.26 −0.22 0.45 −0.05
Violent crime on adjacent streets 2.59 0.31 −0.21 0.47 −0.03
Violent crime several streets away 2.46 0.20 −0.13 0.66 −0.007
Violent crime in other neighborhoods 2.12 0.06 0.09 0.83 0.05
Violent crime across the city as a whole 1.93 0.07 0.13 0.76 0.09
Social environment
(Factor 4)
Neighbors do not get along 2.50 −0.08 0.14 0.09 0.44
Neighbors are not willing to help each other 2.39 −0.06 −0.11 0.04 0.72
Not a close knit neighborhood 2.74 0.03 −0.07 −0.05 0.70
Neighbors cannot be trusted 2.90 −0.10 0.06 0.07 0.62
Neighbors do not take action if children spray-paint 2.37 0.02 0.22 0.05 0.53
Neighbors do not take action if children are
disrespectful
2.51 0.08 0.04 −0.01 0.70
Neighbors do not take action if there is a fight 2.48 0.03 0.06 0.04 0.66
Eigenvalue 14.02 5.19 1.83 1.33
Common variance
explained
58.7% 21.7% 7.7% 5.6%
Cronbach’s α
coefficient
0.96 0.93 0.87 0.83
Bold values indicate loading scores ≥0.4, which qualified the item for inclusion in the factor.
no significant interactions in our models. This is consistent withBell and colleagues’ findings that gender interactions were onlysignificant for objectively measured neighborhood deprivationand not perceived neighborhood deprivation when assessingthe association with BMI and waist circumference (43). In ourstudy, ST was pervasive and PA was low, which demonstrateshigher risk of future cardiometabolic disease in this population(3). Although the literature has shown that neighborhoodsbroadly are associated with health behaviors (45), in this study,
we sought to identify specific elements of the neighborhoodenvironment that may be dictating individual PA and ST in abi-racial, socioeconomically diverse population.
This study is unique in describing precise components ofperceived crime, rather than relying on a single metric ofgeneral crime perception. Understanding the context in whichparticipants decide to be physically active or sedentary byspecifically describing individual types and categories of crimehas not been previously done in relation to neighborhood
Frontiers in Public Health | www.frontiersin.org 5 September 2019 | Volume 7 | Article 256
Claudel et al. Neighborhood and Physical Activity
FIGURE 1 | Adjusted linear regression results of total and factor-specific NPS on self-reported physical activity (n = 1,359). (A) Total PA, (B) Leisure time PA. Error
bars represent 95% confidence interval. Adjusted for age, BMI, sex, race, poverty status, education, NEI, and length of residence in the neighborhood (*p < 0.05, **p
≤ 0.001, ***p < 0.0001).
environment, physical activity, and sedentary time and may helpfocus crime-related interventions. Prior work using agent-basedmodel simulations have shown that radial distance from a crimemay be influential in the decision-making process to engage inPA (46). Our findings show that neither higher concern regardingspecific types of crime nor higher perceived violent crime at theneighborhood level were associated with PA. This was contraryto our expectations, but has been demonstrated previously in theliterature. For example, Oh and colleagues found that neitherperceived nor objectively measured crime, nor perceived crime-related safety, were associated with adherence to a walking-based PA intervention among African American women (47).The women with both high and low crime environmentscores engaged equally in PA. Additionally, cross-sectionalassociations between neighborhood environment and PA amonglow-incomeAfrican American adults in Pittsburgh demonstratedno significant association between objective neighborhood-levelcrime at moderate-to-vigorous PA (48). It is possible that
participants in our study and others decide to engage in PAin areas away from the home and thereby insulate themselvesfrom the perceived crime (49). Due to the survey-based measureof PA used in this study, we were unable to determine theprecise location of the PA. Therefore, we recommend useof objective measures of PA to compliment self-report infuture studies.
Another unique aspect of this study is the use of objectivelymeasured ST through accelerometry. Few studies have usedaccelerometers to capture ST and examine the associationwith neighborhood factors. Use of an accelerometer allowedus to describe ST patterns throughout the day and overseveral days for each participant. We found that worseperception of the neighborhood social environment wasassociated with increased ST overall and between 9 a.m. and 5p.m., specifically. This may suggest that those who perceive alack of neighborhood social cohesion may experience limitedopportunities to engage positively with neighbors or the
Frontiers in Public Health | www.frontiersin.org 6 September 2019 | Volume 7 | Article 256

Claudel et al. Neighborhood and Physical Activity
TABLE 3 | Adjusted linear regression results of total and factor-specific NPS on accelerometer-measured sedentary time for the entire waking day (n = 404).
Model 1 Model 2 Model 3 Model 4 Model 5
β SE β SE β SE β SE β SE
Total NPS 1.14 0.49 – – – – – – – –
Factor 1 Score – – 0.03 0.96 – – – – – –
Factor 2 Score – – – – 0.86 0.85 – – – –
Factor 3 Score – – – – – – 2.48 1.75 – –
Factor 4 Score – – – – – – – – 3.59 1.18
Age 2.83 0.74 2.72 0.74 2.79 0.74 2.71 0.74 3.02 0.74
Sex 33.40 13.83 38.18 13.80 37.22 13.78 37.58 13.73 34.22 13.67
BMI 2.94 0.87 3.14 0.88 3.18 0.87 3.11 0.87 3.00 0.87
Race −12.98 14.49 −14.42 14.74 −10.72 14.98 −17.51 14.71 −8.41 14.54
Poverty Status 15.64 13.84 17.74 13.90 16.91 13.90 16.86 13.88 14.89 13.78
Education 4.09 14.07 5.60 14.21 6.15 14.14 5.61 14.11 6.01 13.99
Residence −27.65 20.95 −29.82 21.11 −30.86 21.06 −28.08 21.05 −29.12 20.83
NEI −0.28 1.60 −0.54 1.64 0.03 1.70 −0.86 1.62 0.34 1.61
Intercept 255.94 69.56 355.70 56.50 328.29 61.16 328.10 57.96 279.38 59.59
Bold indicates p < 0.05.
Model 1: Exposure variable is Total NPS.
Model 2: Exposure variable is Factor 1 (Concern about specific types of crime).
Model 3: Exposure variable is Factor 2 (Physical environment).
Model 4: Exposure variable is Factor 3 (Location of violent crime).
Model 5: Exposure variable is Factor 4 (Social environment).
surrounding social environment and therefore choose to remainsedentary. Further work using objectively measured ST will benecessary to develop a more comprehensive understanding ofsedentary behavior among community-dwelling adults and theinfluence of neighborhood environment.
Contrary to prior research, our findings do not demonstratea relationship between perceived neighborhood crime andincreased ST (50). Although unexpected, this may point to anunderlying relationship between the social environment andthe influence of perceived crime on health behaviors. It hasbeen previously shown that there is an inverse associationbetween neighborhood violence and social cohesion (28), wheregreater social support is associated with higher perceivedneighborhood safety among low-income, urban residents (51).Elements of the social environment, including resident socialinteractions and neighborhood diversity, have been associatedwith increased walking behavior and decreased ST among olderadults (52). Therefore, these findings may suggest the possibilitythat a positive social environment could temper the impact ofperceived crime on health behaviors such as PA and ST. Furtherinvestigation is needed to understand what drives individuals’behavior in response to perceived threat of crime and how thesocial environment may mediate the decision-making process.
The prominent relationship between neighborhood socialenvironment and both PA and ST in our study illuminatesa crucial yet physically intangible neighborhood influenceon behavior. Improved neighborhood social environment haspreviously been associated with lower incidence of type2 diabetes mellitus (53), myocardial infarction (54), andstroke mortality (55). Poor neighborhood social cohesion ishypothesized to act on physical health via transmission of
negative health behaviors and lack of social support (45).Therefore, it is possible that improving social cohesion couldsimultaneously increase PA and decrease ST, but solutions arelikely to be community-specific, requiring ongoing dialogue withresidents through community engagement, including throughcommunity based participatory research (17, 56). Emphasison opportunities for resident interactions has been shownto facilitate improved neighborhood social cohesion (57) andhas been associated with higher probability of meeting PArecommendations (58). Providing communal gathering areas,encouraging mixed land use for walkable destinations, increasingtransit stops, facilitating group activities, enhancing multi-generational engagement, and reducing perception of crimewould likely improve the social environment and therebyreduce ST (57, 59). Determining which community solutionswill succeed may be best accomplished through communityengagement (60). The need for community engagement inmedical research is well-described by Holzer and colleagues, whodemonstrate the potential for enhanced trust and participation(61). Fostering the participant-researcher relationship andincluding participants as co-researchers offers possibility ofmore direct tailoring of interventions to community needsbased on participant-identified community-specific challenges(62). This may both improve the quality of the research andincrease the likelihood of implementation of findings followingits conclusion.
This study has several limitations. Foremost, it is lackingin objective crime and physical activity data. While objectivemeasures of neighborhood have been shown to be poorlycorrelated with an individual’s perception (47, 63), having bothobjective and subjective measures for analysis would enhance our
Frontiers in Public Health | www.frontiersin.org 7 September 2019 | Volume 7 | Article 256

Claudel et al. Neighborhood and Physical Activity
understanding of what is driving the relationships. This studyalso lacks subjective measures of ST, which would potentiallyelucidate perceptions of “available” time for PA and thus possiblya critical psychological component of an individuals’ decisionto engage in PA. Additionally, due to the nature of factoranalysis, it is not possible to determine whether there werekey items and which items within a factor—for example, whatcomponent of the social environment—were responsible for therelationships observed. Knowledge of specific characteristics tobe modified will be essential to designing successful, targetedinterventions in the future. It must be noted that in thisanalysis, multiple comparisons were computed without adjustingthe p-values, therefore the findings should be interpreted withcaution. Additionally, the neighborhood violence questions weredeveloped by a HANDLS collaborator and have not beenvalidated as a scale. The questionnaire did not include collisionfatalities as an aspect of neighborhood safety, which have beenconsidered as a measure of safety in other studies (64). Finally,due to the cross-sectional nature of the analysis, we are unable tolook at health outcomes in this population over time as a result oftheir exposure to these environmental influences on PA and ST.
CONCLUSION AND IMPLICATIONS FORHEALTH PROMOTION
Neighborhood socioeconomic status (35) and neighborhoodperception (7, 9, 65) are known to be strong determinantsof health, specifically chronic disease outcomes (53, 66).This study shows that neighborhood social environment maybe influencing residents’ behavior and decisions, includingthe probability of engaging in PA or remaining sedentaryfor adults living in Baltimore, Maryland. This study isnovel in individually highlighting specific elements of thesocial environment, neighborhood-level crime, and physicalneighborhood characteristics which may be key mediatorsbetween neighborhoods and health. Furthermore, this studyspecifically identifies risk factors for increased ST, which areunderstudied in the literature. Our work, in conjunction withexisting literature, is most relevant to designing physical activityand obesity interventions in and around Baltimore, MD (46, 60,67, 68).
Interventions that focus on improving the neighborhoodsocial environment may enhance residents’ perception of PAresources and increase their likelihood of engaging in PA whiledecreasing the likelihood of ST. Therefore, planning publichealth interventions to promote PA should not be conducted inisolation, rather, consideration of the neighborhood environmentis critical. Addressing the neighborhood environment may bebest accomplished through community engagement that resultsin discussion of specific social environmental barriers. Theseconversations may take place through the formation of acommunity advisory board by the research team or throughparticipant focus groups. With respect to conducting researchon PA and ST in the community setting, we recommendthe use of accelerometers to accurately capture participants’activity throughout the day. Additionally, we recommend the
consideration of focused measures of crime to adequatelycharacterize the implications of adverse social behaviors onresidents’ decision making with respect to PA and ST.
DATA AVAILABILITY
The datasets for this manuscript are not publicly available due toconfidentiality reasons. Requests to access the datasets should bedirected to the corresponding author.
ETHICS STATEMENT
The studies involving human participants were reviewed andapproved by National Institute of Environmental Health Sciencesinstitutional review board. The patients/participants providedtheir written informed consent to participate in this study.
AUTHOR CONTRIBUTIONS
TP-W conceived of the study, participated in its design, dataanalysis, and writing the manuscript. SC participated in thestudy design, data analysis, and writing the manuscript. ES andTH participated in data analysis and drafting the manuscript.CA participated in developing the study design and draftingthe manuscript. NM, AZ, and ME oversaw primary datacollection for the HANDLS cohort, provided feedback onthe study analyses, reviewed analyzed data, and assisted inwriting the manuscript.
FUNDING
The TP-W Lab (Grant No. ZIA-HL006148, ZIA-HL006168,and ZIA-HL006225) was funded by the Division of IntramuralResearch of the National Heart, Lung, and Blood Instituteand the Intramural Research Program of the National Instituteon Minority Health and Health Disparities. This research wassupported in part by the Intramural Research Program of theNIH, National Institute on Aging (Grant No. Z01-AG000194).The views expressed in this manuscript are those of the authorsand do not necessarily represent the views of the National Heart,Lung, and Blood Institute; the National Institute on MinorityHealth and Health Disparities; the National Institute on Aging,the National Institutes of Health; or the U.S. Department ofHealth and Human Services. SC is also supported by the NIHMedical Research Scholars Program, a public-private partnershipsupported jointly by the NIH and generous contributions tothe Foundation for the NIH from the Doris Duke CharitableFoundation, the American Association for Dental Research,the Colgate-Palmolive Company, Genentech, Elsevier, and otherprivate donors.
SUPPLEMENTARY MATERIAL
The Supplementary Material for this article can be foundonline at: https://www.frontiersin.org/articles/10.3389/fpubh.2019.00256/full#supplementary-material
Frontiers in Public Health | www.frontiersin.org 8 September 2019 | Volume 7 | Article 256

Claudel et al. Neighborhood and Physical Activity
REFERENCES
1. Centers for Disease Control and Prevention. Heart Disease Fact Sheet. (2017).2. Myers J. Exercise and cardiovascular health. Circulation. (2003) 107:e2–5.
doi: 10.1161/01.CIR.0000048890.59383.8D3. Healy GN,Matthews CE, Dunstan DW,Winkler EA, Owen N. Sedentary time
and cardio-metabolic biomarkers in US adults: NHANES 2003-06. Eur HeartJ. (2011) 32:590–7. doi: 10.1093/eurheartj/ehq451
4. Same RV, Feldman DI, Shah N, Martin SS, Al Rifai M, Blaha MJ, et al.Relationship between sedentary behavior and cardiovascular risk. CurrCardiol Rep. (2016) 18:6. doi: 10.1007/s11886-015-0678-5
5. Biddle SJH, Bennie JA, Bauman AE, Chau JY, Dunstan D, Owen N. et al. Toomuch sitting and all-causemortality: is there a causal link? BMCPublic Health.(2016) 16:635. doi: 10.1186/s12889-016-3307-3
6. Matthews CE, Cohen SS, Fowke JH, Han X, Xiao Q, Buchowski MS. et al.Physical activity, sedentary behavior, and cause-specific mortality in blackand white adults in the Southern Community Cohort Study. Am J Epidemiol.(2014) 180:394–405. doi: 10.1093/aje/kwu142
7. Powell-Wiley TM, Moore K, Allen N, Block R, Evenson KR, Mujahid M, et al.Associations of neighborhood crime and safety and with changes in bodymassindex and waist circumference the multi-ethnic study of atherosclerosis. Am JEpidemiol. (2017) 186:280–8. doi: 10.1093/aje/kwx082
8. Chum A, O’Campo P. Cross-sectional associations between residentialenvironmental exposures and cardiovascular diseases. BMC Public Health.(2015) 15:438. doi: 10.1186/s12889-015-1788-0
9. Christine PJ, Auchincloss AH, Bertoni AG, Carnethon MR, Sánchez BN,Moore K, et al. Longitudinal associations between neighborhood physical andsocial environments and incident type 2 diabetes mellitus: the multi-ethnicstudy of atherosclerosis (MESA). JAMA Intern Med. (2015) 175:1311–20.doi: 10.1001/jamainternmed.2015.2691
10. Creatore MI, Glazier RH, Moineddin R, Fazli GS, Johns A, Gozdyra P, et al.Association of neighborhood walkability with change in overweight, obesity,and diabetes. JAMA. (2016) 315:2211–20. doi: 10.1001/jama.2016.5898
11. Fish JS, Ettner S, Ang A, Brown AF. Association of perceived neighborhoodsafety on body mass index. Am J Public Health. (2010) 100:2296–303.doi: 10.2105/AJPH.2009.183293
12. Powell-Wiley TM, Ayers CR, de Lemos JA, Lakoski SG, Vega GL, Grundy S,et al. Relationship between perceptions about neighborhood environment andprevalent obesity: data from the Dallas Heart Study. Obesity (Silver Spring).(2013) 21:e14–21. doi: 10.1002/oby.20012
13. Guilcher SJT, Kaufman-Shriqui V, Hwang J, O’Campo P, Matheson FI,Glazier RH, et al. The association between social cohesion in theneighborhood and body mass index (BMI): An examination of gendereddifferences among urban-dwelling Canadians. Prev Med. (2017) 99:293–8.doi: 10.1016/j.ypmed.2017.02.022
14. Tamura K, Langerman SD, Ceasar JN, Andrews MR, Agrawal M, Powell-Wiley TM. Neighborhood social environment and cardiovascular risk. CurrCardiovasc Risk Rep. (2019) 13:13. doi: 10.1007/s12170-019-0601-5
15. Sampson RJ, Raudenbush SW. Seeing disorder: neighborhood stigma and thesocial construction of “Broken Windows”. Soc Psychol Q. (2004) 67:319–42.doi: 10.1177/019027250406700401
16. Fonseca X, Lukosch S, Brazier F. Social cohesion revisited: a new definitionand how to characterize it. Innov Eur J Soc Sci Res. (2019) 32:231–53.doi: 10.1080/13511610.2018.1497480
17. Yuma-Guerrero PJ, Cubbin C, von Sternberg K. Neighborhood socialcohesion as a mediator of neighborhood conditions on mothers’engagement in physical activity. Health Educ Behav. (2017) 44:845–56.doi: 10.1177/1090198116687537
18. Franzini L, Caughy MO, Nettles SM, O’Campo P. Perceptions of disorder:contributions of neighborhood characteristics to subjective perceptions ofdisorder. J Environ Psychol. (2008) 28:83–93. doi: 10.1016/j.jenvp.2007.08.003
19. Paul P, Carlson SA, Fulton JE. Walking and the perception of neighborhoodattributes among U.S. adults-2012. J Phys Act Health. (2017) 14:36–44.doi: 10.1123/jpah.2015-0685
20. Lovasi GS, Goh CE, Pearson AL, Breetzke G. The independent associationsof recorded crime and perceived safety with physical health in a nationallyrepresentative cross-sectional survey ofmen andwomen inNewZealand. BMJOpen. (2014) 4:e004058. doi: 10.1136/bmjopen-2013-004058
21. Ahuja C, Ayers C, Hartz J, Adu-Brimpong J, Thomas S, Mitchell V, et al.Examining relationships between perceptions and objective assessments ofneighborhood environment and sedentary time: data from the Washington,D.C. cardiovascular health and needs assessment. Prev Med Rep. (2018)9:42–8. doi: 10.1016/j.pmedr.2017.12.002
22. Koohsari MJ, Sugiyama T, Sahlqvist S, Mavoa S, Hadgraft N, Owen N.Neighborhood environmental attributes and adults’ sedentary behaviors:review and research agenda. Prev Med (Baltim). (2015) 77:141–9.doi: 10.1016/j.ypmed.2015.05.027
23. Kozo J, Sallis JF, Conway TL, Kerr J, Cain K, Saelens BE, et al. Sedentarybehaviors of adults in relation to neighborhood walkability and income.Health Psychol. (2012) 31:704–13. doi: 10.1037/a0027874
24. Van Dyck D, Cerin E, Conway TL, De Bourdeaudhuij I, Owen N, Kerr J, et al.Associations between perceived neighborhood environmental attributes andadults’ sedentary behavior: findings from the USA, Australia and Belgium. SocSci Med. (2012) 74:1375–84. doi: 10.1016/j.socscimed.2012.01.018
25. Lee RE, Mama SK, Adamus-Leach HJ. Neighborhood street scale elements,sedentary time and cardiometabolic risk factors in inactive ethnic minoritywomen. PLoS ONE. (2012) 7:e51081. doi: 10.1371/journal.pone.0051081
26. Strong LL, Reitzel LR, Wetter DW, McNeill LH. Associations of perceivedneighborhood physical and social environments with physical activity andtelevision viewing in African Americanmen and women.Am JHealth Promot.(2013) 27:401–9. doi: 10.4278/ajhp.120306-QUAN-127
27. Evans MK, Lepkowski JM, Powe NR, LaVeist T, Kuczmarski MF,Zonderman AB. Healthy aging in neighborhoods of diversity across thelife span (HANDLS): overcoming barriers to implementing a longitudinal,epidemiologic, urban study of health, race, and socioeconomic status. EthnDis. (2010) 20:267–275.
28. Sampson RJ, Raudenbush SW, Earls F. Neighborhoods and violent crime:a multilevel study of collective efficacy. Science. (1997) 277:918–24.doi: 10.1126/science.277.5328.918
29. Baecke JA, Burema J, Frijters JE. A short questionnaire for the measurementhabitual physical activity in epidemiological studies. Am J Clin Nutr. (1982)36:936–42. doi: 10.1093/ajcn/36.5.936
30. Philippaerts RM, Westerterp KR, Lefevre J. Doubly labelled water validationof three physical activity questionnaires. Int J Sports Med. (1999) 20:284–9.doi: 10.1055/s-2007-971132
31. Pols MA, Peeters PH, Bueno-De-Mesquita HB, Ocké MC, Wentink CA,Kemper HC, et al. Validity and repeatability of a modified Baeckequestionnaire on physical activity. Int J Epidemiol. (1995) 24:381–8.doi: 10.1093/ije/24.2.381
32. Helmerhorst HJ, Brage S, Warren J, Besson H, Ekelund U. A systematicreview of reliability and objective criterion-related validity of physicalactivity questionnaires. Int J Behav Nutr Phys Act. (2012) 9:103.doi: 10.1186/1479-5868-9-103
33. Choi L, Ward SC, Schnelle JF, Buchowski MS. Assessment of wear/nonweartime classification algorithms for triaxial accelerometer. Med SciSports Exerc. (2012) 44:2009–16. doi: 10.1249/MSS.0b013e318258cb36
34. Koster A, Shiroma EJ, Caserotti P, Matthews CE, Chen KY, Glynn NW,et al. Comparison of sedentary estimates between activPAL and hip-and wrist-worn ActiGraph. Med Sci Sports Exerc. (2016) 48:1514–22.doi: 10.1249/MSS.0000000000000924
35. Mode NA, Evans MK, Zonderman AB. Race, neighborhood economicstatus, income inequality and mortality. PLoS ONE. (2016) 11:e0154535.doi: 10.1371/journal.pone.0154535
36. Unger E, Diez-Roux AV, Lloyd-Jones DMM, Mujahid MS, NettletonJA, Bertoni A, et al. Association of neighborhood characteristics withcardiovascular health in the multi-ethnic study of atherosclerosis(MESA). Circ Cardiovasc Qual Outcomes. (2014) 7:524–31.doi: 10.1161/CIRCOUTCOMES.113.000698
37. Mujahid MS, Diez-Roux AV, Morenoff JD, Raghunathan TE, Cooper RS, NiH, et al. Neighborhood characteristics and hypertension. Epidemiology. (2008)19:590–8. doi: 10.1097/EDE.0b013e3181772cb2
38. Osborne JW, Costello AB. Sample size and subject to item ratio in principalcomponents analysis. Pract Assess Res Eval. (2004) 9:1–9.
39. Li F, Fisher KJ, Bauman A, Ory MG, Chodzko-Zajko W, Harmer P,et al. Neighborhood influences on physical activity in middle-aged and
Frontiers in Public Health | www.frontiersin.org 9 September 2019 | Volume 7 | Article 256

Claudel et al. Neighborhood and Physical Activity
older adults: a multilevel perspective. J Aging Phys Act. (2005) 13:87–114.doi: 10.1123/japa.13.1.87
40. Musca SC, Kamiejski R, Nugier A, Méot A, Er-Rafiy A, Brauer M. Data withhierarchical structure: impact of intraclass correlation and sample size ontype-I error. Front Psychol. (2011) 2:74. doi: 10.3389/fpsyg.2011.00074
41. Diez-Roux AV. Multilevel analysis in public health research. Annu Rev PublicHealth. (2000) 21:171–92. doi: 10.1146/annurev.publhealth.21.1.171
42. Snedker KA. Neighborhood conditions and fear of crime: areconsideration of sex differences. Crime Delinq. (2015) 61:45–70.doi: 10.1177/0011128710389587
43. Bell JA, Hamer M, Shankar A. Gender-specific associations of objectiveand perceived neighborhood characteristics with body mass index and waistcircumference among older adults in the English longitudinal study of ageing.Am J Public Health. (2014) 104:1279–86. doi: 10.2105/AJPH.2014.301947
44. Wong MS, Chan KS, Jones-Smith JC, Colantuoni E, Thorpe RJ, Bleich SN.The neighborhood environment and obesity: understanding variation byrace/ethnicity. Prev Med. (2017) 111:371–7. doi: 10.1016/j.ypmed.2017.11.029
45. Diez Roux AV, Mair C. Neighborhoods and health. Ann N Y Acad Sci. (2010)1186:125–45. doi: 10.1111/j.1749-6632.2009.05333.x
46. Powell-Wiley TM, Wong MS, Adu-Brimpong J, Brown ST, HertensteinDL, Zenkov E, et al. Simulating the impact of crime on AfricanAmerican women’s physical activity and obesity. Obesity. (2017) 25:2149–55.doi: 10.1002/oby.22040
47. Oh AY, Zenk SN, Wilbur J, Block R, McDevitt J, Wang E. Effects of perceivedand objective neighborhood crime on walking frequency among midlifeAfrican American women in a home-based walking intervention. J Phys ActHealth. (2010) 7:432–41. doi: 10.1123/jpah.7.4.432
48. Richardson AS, Troxel WM, Ghosh-Dastidar MB, Beckman R, HunterGP, DeSantis AS, et al. One size doesn’t fit all: cross-sectional associationsbetween neighborhood walkability, crime and physical activity dependson age and sex of residents. BMC Public Health. (2017) 17:97.doi: 10.1186/s12889-016-3959-z
49. Giles-Corti B, Timperio A, Bull F, Pikora T. Understanding physical activityenvironmental correlates: increased specificity for ecological models. ExercSport Sci Rev. (2005) 33:175–81. doi: 10.1097/00003677-200510000-00005
50. Shaw RJ, Cukic I, Deary IJ, Gale CR, Chastin SFM, Dall PM, et al. Theinfluence of neighbourhoods and the social environment on sedentarybehaviour in older adults in three prospective cohorts. Int J Environ Res PublicHealth. (2017) 14:1–21. doi: 10.3390/ijerph14060557
51. De Jesus M, Puleo E, Shelton RC, Emmons KM. Associations betweenperceived social environment and neighborhood safety: health implications.Health Place. (2010) 16:1007–13. doi: 10.1016/j.healthplace.2010.06.005
52. Van Holle V, Van Cauwenberg J, De Bourdeaudhuij I, Deforche B, Vande Weghe N, Van Dyck D. Interactions between neighborhood socialenvironment and walkability to explain belgian older adults’ physical activityand sedentary time. Int J Environ Res Public Health. (2016) 13:E569.doi: 10.3390/ijerph13060569
53. Gebreab SY, Hickson DA, Sims M, Wyatt SB, Davis SK, Correa A, et al.Neighborhood social and physical environments and type 2 diabetes mellitusin African Americans: the jackson heart study.Health Place. (2017) 43:128–37.doi: 10.1016/j.healthplace.2016.12.001
54. Chaix B, LindströmM, Rosvall M,Merlo J. Neighbourhood social interactionsand risk of acutemyocardial infarction. J Epidemiol Community Health. (2008)62:62–8. doi: 10.1136/jech.2006.056960
55. Kim ES, Park N, Peterson C. Perceived neighborhood social cohesion andstroke. Soc Sci Med. (2013) 97:49–55. doi: 10.1016/j.socscimed.2013.08.001
56. Suminski RR, Petosa RL, Poston CW, Neighborhoods on the MovePartnership. Neighborhoods on the move: a community-based participatoryresearch approach to promoting physical activity. Prog Community HealthPartnersh. (2009) 3:5. doi: 10.1353/cpr.0.0059
57. Child ST, Schoffman DE, Kaczynski AT, Forthofer M, Wilcox S, Baruth M.Neighborhood attributes associated with the social environment. Am J HealthPromot. (2016) 30:634–7. doi: 10.4278/ajhp.140307-ARB-99
58. Ball K, Cleland VJ, Timperio AF, Salmon J, Giles-Corti B, CrawfordDA. Love thy neighbour? Associations of social capital and crimewith physical activity amongst women. Soc Sci Med. (2010) 71:807–14.doi: 10.1016/j.socscimed.2010.04.041
59. Suglia SF, Shelton RC, Hsiao A, Wang YC, Rundle A, Link BG. Why theneighborhood social environment is critical in obesity prevention. J UrbanHealth. (2016) 93:206–12. doi: 10.1007/s11524-015-0017-6
60. Mui Y, Ballard E, Lopatin E, Thornton RLJ, Pollack Porter KM, GittelsohnJ. A community-based system dynamics approach suggests solutions forimproving healthy food access in a low-income urban environment. PLoSONE. (2019) 14:1–13. doi: 10.1371/journal.pone.0216985
61. Holzer JK, Ellis L, Merritt MW. Why we need communityengagement in medical research. J Investig Med. (2014) 62:851–5.doi: 10.1097/JIM.0000000000000097
62. Dresser R. A deep dive into community engagement.Narrat Inq Bioeth. (2017)7:41–5. doi: 10.1353/nib.2017.0014
63. Foster S, Giles-Corti B. The built environment, neighborhood crimeand constrained physical activity: an exploration of inconsistentfindings. Prev Med. (2008) 47:241–51. doi: 10.1016/j.ypmed.2008.03.017
64. Kim E, Muennig P, Rosen Z. Vision zero: a toolkit for road safety in themodern era. Inj Epidemiol. (2017) 4:1–9. doi: 10.1186/s40621-016-0098-z
65. Barrington WE, Stafford M, Hamer M, Beresford SA, Koepsell T, SteptoeA. Socioeconomic deprivation, perceived neighborhood factors, and cortisolresponses to induced stress among healthy adults. Health Place. (2014)27:120–6. doi: 10.1016/j.healthplace.2014.02.001
66. Diez-Roux AV, Mujahid MS, Hirsch JA, Moore K, Moore LV. The impact ofneighborhoods on cardiovascular risk: the MESA Neighborhood Study. GlobHeart. (2016) 11:353–63. doi: 10.1016/j.gheart.2016.08.002
67. Casagrande SS, Gittelsohn J, Zonderman AB, Evans MK, Gary-Webb TL.Association of walkability with obesity in Baltimore City, Maryland. AmJ Public Health. (2011) 101(Suppl. 1):318–24. doi: 10.2105/AJPH.2009.187492
68. Healthy Baltimore (2020). Available online at:https://health.baltimorecity.gov/news/press-releases/2016-08-30-baltimore-city-health-departmentlaunches-“healthy-baltimore-2020” (accessed March 7,2019).
Conflict of Interest Statement: The authors declare that the research wasconducted in the absence of any commercial or financial relationships that couldbe construed as a potential conflict of interest.
Copyright © 2019 Claudel, Shiroma, Harris, Mode, Ahuja, Zonderman, Evansand Powell-Wiley. This is an open-access article distributed under the terms ofthe Creative Commons Attribution License (CC BY). The use, distribution orreproduction in other forums is permitted, provided the original author(s) and thecopyright owner(s) are credited and that the original publication in this journalis cited, in accordance with accepted academic practice. No use, distribution orreproduction is permitted which does not comply with these terms.
Frontiers in Public Health | www.frontiersin.org 10 September 2019 | Volume 7 | Article 256
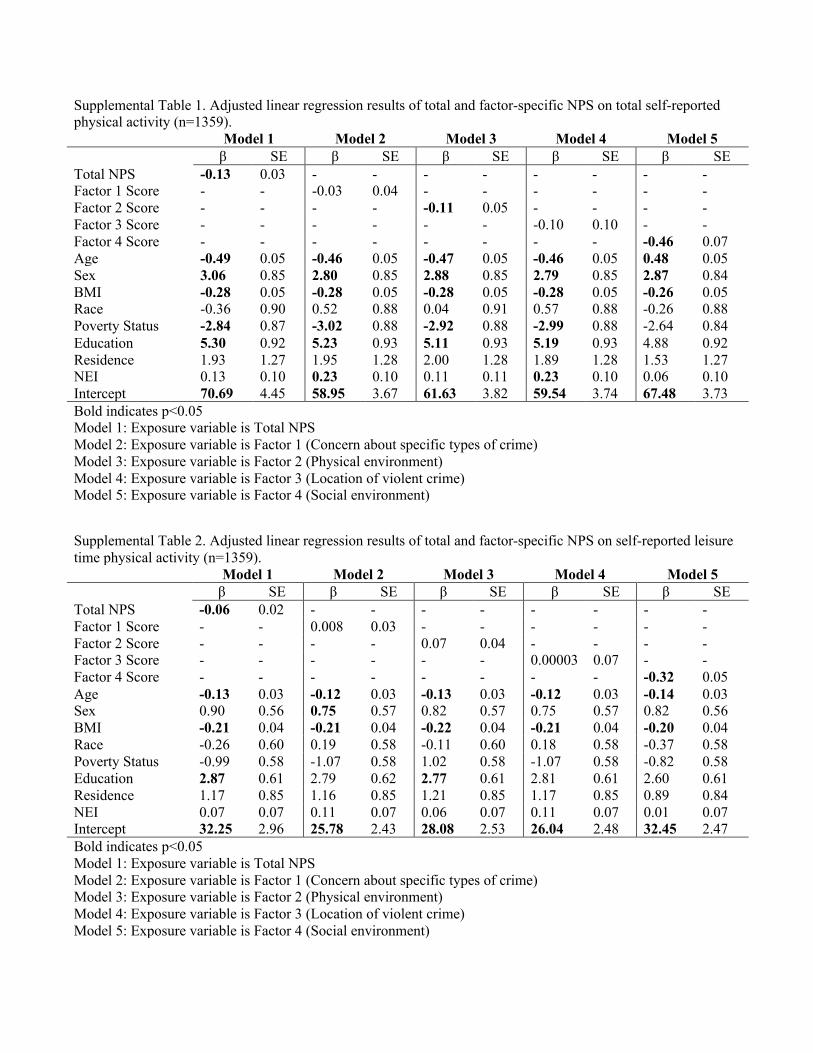
Supplemental Table 1. Adjusted linear regression results of total and factor-specific NPS on total self-reported physical activity (n=1359). Model 1 Model 2 Model 3 Model 4 Model 5 β SE β SE β SE β SE β SE Total NPS -0.13 0.03 - - - - - - - - Factor 1 Score - - -0.03 0.04 - - - - - - Factor 2 Score - - - - -0.11 0.05 - - - - Factor 3 Score - - - - - - -0.10 0.10 - - Factor 4 Score - - - - - - - - -0.46 0.07 Age -0.49 0.05 -0.46 0.05 -0.47 0.05 -0.46 0.05 0.48 0.05 Sex 3.06 0.85 2.80 0.85 2.88 0.85 2.79 0.85 2.87 0.84 BMI -0.28 0.05 -0.28 0.05 -0.28 0.05 -0.28 0.05 -0.26 0.05 Race -0.36 0.90 0.52 0.88 0.04 0.91 0.57 0.88 -0.26 0.88 Poverty Status -2.84 0.87 -3.02 0.88 -2.92 0.88 -2.99 0.88 -2.64 0.84 Education 5.30 0.92 5.23 0.93 5.11 0.93 5.19 0.93 4.88 0.92 Residence 1.93 1.27 1.95 1.28 2.00 1.28 1.89 1.28 1.53 1.27 NEI 0.13 0.10 0.23 0.10 0.11 0.11 0.23 0.10 0.06 0.10 Intercept 70.69 4.45 58.95 3.67 61.63 3.82 59.54 3.74 67.48 3.73 Bold indicates p<0.05 Model 1: Exposure variable is Total NPS Model 2: Exposure variable is Factor 1 (Concern about specific types of crime) Model 3: Exposure variable is Factor 2 (Physical environment) Model 4: Exposure variable is Factor 3 (Location of violent crime) Model 5: Exposure variable is Factor 4 (Social environment)
Supplemental Table 2. Adjusted linear regression results of total and factor-specific NPS on self-reported leisure time physical activity (n=1359). Model 1 Model 2 Model 3 Model 4 Model 5 β SE β SE β SE β SE β SE Total NPS -0.06 0.02 - - - - - - - - Factor 1 Score - - 0.008 0.03 - - - - - - Factor 2 Score - - - - 0.07 0.04 - - - - Factor 3 Score - - - - - - 0.00003 0.07 - - Factor 4 Score - - - - - - - - -0.32 0.05 Age -0.13 0.03 -0.12 0.03 -0.13 0.03 -0.12 0.03 -0.14 0.03 Sex 0.90 0.56 0.75 0.57 0.82 0.57 0.75 0.57 0.82 0.56 BMI -0.21 0.04 -0.21 0.04 -0.22 0.04 -0.21 0.04 -0.20 0.04 Race -0.26 0.60 0.19 0.58 -0.11 0.60 0.18 0.58 -0.37 0.58 Poverty Status -0.99 0.58 -1.07 0.58 1.02 0.58 -1.07 0.58 -0.82 0.58 Education 2.87 0.61 2.79 0.62 2.77 0.61 2.81 0.61 2.60 0.61 Residence 1.17 0.85 1.16 0.85 1.21 0.85 1.17 0.85 0.89 0.84 NEI 0.07 0.07 0.11 0.07 0.06 0.07 0.11 0.07 0.01 0.07 Intercept 32.25 2.96 25.78 2.43 28.08 2.53 26.04 2.48 32.45 2.47 Bold indicates p<0.05 Model 1: Exposure variable is Total NPS Model 2: Exposure variable is Factor 1 (Concern about specific types of crime) Model 3: Exposure variable is Factor 2 (Physical environment) Model 4: Exposure variable is Factor 3 (Location of violent crime) Model 5: Exposure variable is Factor 4 (Social environment)

Supplemental Table 3. Adjusted linear regression results of total and factor-specific NPS on accelerometer-measured sedentary time for morning hours (n=404). Model 1 Model 2 Model 3 Model 4 Model 5 β SE β SE β SE β SE β SE Total NPS 0.47 0.19 - - - - - - - - Factor 1 Score - - 0.15 0.25 - - - - - - Factor 2 Score - - - - 0.50 0.33 - - - - Factor 3 Score - - - - - - 0.86 0.67 - - Factor 4 Score - - - - - - - - 0.82 0.46 Age 0.37 0.28 0.31 0.29 0.36 0.29 0.31 0.29 0.39 0.29 Sex -2.58 5.32 -0.89 5.32 -1.21 5.30 -0.87 5.30 -1.51 5.31 BMI 0.46 0.34 0.52 0.34 0.57 0.34 0.53 0.34 0.51 0.34 Race -7.87 5.58 -8.90 5.68 -6.35 5.76 -9.51 5.67 -7.11 5.65 Poverty Status 5.47 5.33 6.32 5.36 5.78 5.35 5.99 5.35 5.64 5.35 Education 3.32 5.42 3.72 5.48 4.34 5.44 4.00 5.45 4.11 5.44 Residence -6.20 8.06 -6.78 8.13 -7.70 8.09 -6.47 8.11 -6.98 8.08 NEI -0.10 0.62 -0.29 0.64 0.13 0.66 -0.32 0.63 0.005 0.63 Intercept 89.71 26.82 127.89 21.82 114.89 23.52 121.46 22.39 113.74 21.16 Bold indicates p<0.05 Model 1: Exposure variable is Total NPS Model 2: Exposure variable is Factor 1 (Concern about specific types of crime) Model 3: Exposure variable is Factor 2 (Physical environment) Model 4: Exposure variable is Factor 3 (Location of violent crime) Model 5: Exposure variable is Factor 4 (Social environment)
Supplemental Table 4. Adjusted linear regression results of total and factor-specific NPS on accelerometer-measured sedentary time for working hours (n=404). Model 1 Model 2 Model 3 Model 4 Model 5 β SE β SE β SE β SE β SE Total NPS 0.47 0.25 - - - - - - - - Factor 1 Score - - -0.10 0.33 - - - - - - Factor 2 Score - - - - 0.54 0.43 - - - - Factor 3 Score - - - - - - 0.53 0.88 - - Factor 4 Score - - - - - - - - 1.75 0.59 Age 0.82 0.37 0.78 0.37 0.82 0.37 0.77 0.37 0.92 0.37 Sex 17.11 6.97 19.28 6.95 18.49 6.93 18.98 6.93 17.16 6.88 BMI 1.56 0.44 1.67 0.44 1.68 0.44 1.64 0.44 1.57 0.44 Race 2.43 7.31 2.21 7.42 4.13 7.54 1.20 7.42 4.75 7.32 Poverty Status 4.46 6.98 5.30 7.00 4.81 7.00 5.14 7.00 3.94 6.94 Education -2.39 7.10 -1.54 7.15 -1.43 7.11 -1.75 7.12 -1.57 7.04 Residence -10.25 10.57 -11.40 10.63 -11.79 10.59 -10.80 10.62 -10.81 10.49 NEI -0.37 0.81 -0.42 0.83 -0.12 0.85 -0.54 0.82 -0.05 0.81 Intercept 103.93 35.09 147.94 28.43 128.09 30.76 139.71 29.23 108.11 30.01 Bold indicates p<0.05 Model 1: Exposure variable is Total NPS Model 2: Exposure variable is Factor 1 (Concern about specific types of crime) Model 3: Exposure variable is Factor 2 (Physical environment) Model 4: Exposure variable is Factor 3 (Location of violent crime) Model 5: Exposure variable is Factor 4 (Social environment)
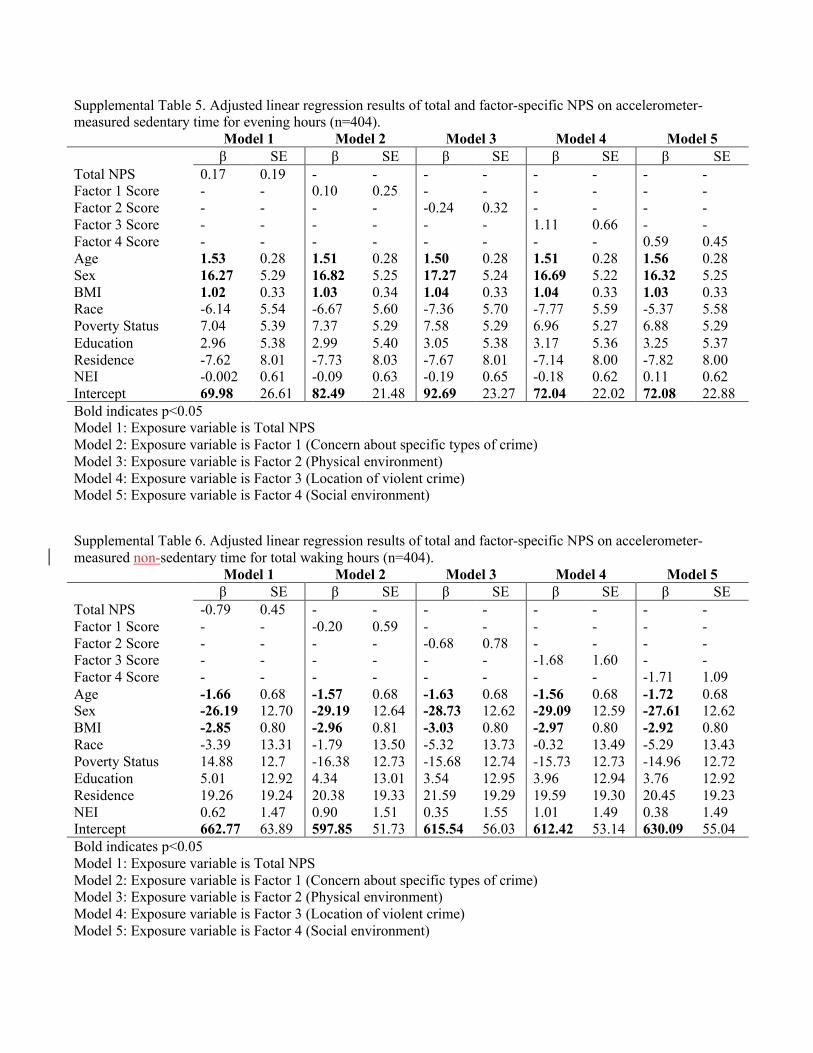
Supplemental Table 5. Adjusted linear regression results of total and factor-specific NPS on accelerometer-measured sedentary time for evening hours (n=404). Model 1 Model 2 Model 3 Model 4 Model 5 β SE β SE β SE β SE β SE Total NPS 0.17 0.19 - - - - - - - - Factor 1 Score - - 0.10 0.25 - - - - - - Factor 2 Score - - - - -0.24 0.32 - - - - Factor 3 Score - - - - - - 1.11 0.66 - - Factor 4 Score - - - - - - - - 0.59 0.45 Age 1.53 0.28 1.51 0.28 1.50 0.28 1.51 0.28 1.56 0.28 Sex 16.27 5.29 16.82 5.25 17.27 5.24 16.69 5.22 16.32 5.25 BMI 1.02 0.33 1.03 0.34 1.04 0.33 1.04 0.33 1.03 0.33 Race -6.14 5.54 -6.67 5.60 -7.36 5.70 -7.77 5.59 -5.37 5.58 Poverty Status 7.04 5.39 7.37 5.29 7.58 5.29 6.96 5.27 6.88 5.29 Education 2.96 5.38 2.99 5.40 3.05 5.38 3.17 5.36 3.25 5.37 Residence -7.62 8.01 -7.73 8.03 -7.67 8.01 -7.14 8.00 -7.82 8.00 NEI -0.002 0.61 -0.09 0.63 -0.19 0.65 -0.18 0.62 0.11 0.62 Intercept 69.98 26.61 82.49 21.48 92.69 23.27 72.04 22.02 72.08 22.88 Bold indicates p<0.05 Model 1: Exposure variable is Total NPS Model 2: Exposure variable is Factor 1 (Concern about specific types of crime) Model 3: Exposure variable is Factor 2 (Physical environment) Model 4: Exposure variable is Factor 3 (Location of violent crime) Model 5: Exposure variable is Factor 4 (Social environment)
Supplemental Table 6. Adjusted linear regression results of total and factor-specific NPS on accelerometer-measured non-sedentary time for total waking hours (n=404). Model 1 Model 2 Model 3 Model 4 Model 5 β SE β SE β SE β SE β SE Total NPS -0.79 0.45 - - - - - - - - Factor 1 Score - - -0.20 0.59 - - - - - - Factor 2 Score - - - - -0.68 0.78 - - - - Factor 3 Score - - - - - - -1.68 1.60 - - Factor 4 Score - - - - - - - - -1.71 1.09 Age -1.66 0.68 -1.57 0.68 -1.63 0.68 -1.56 0.68 -1.72 0.68 Sex -26.19 12.70 -29.19 12.64 -28.73 12.62 -29.09 12.59 -27.61 12.62 BMI -2.85 0.80 -2.96 0.81 -3.03 0.80 -2.97 0.80 -2.92 0.80 Race -3.39 13.31 -1.79 13.50 -5.32 13.73 -0.32 13.49 -5.29 13.43 Poverty Status 14.88 12.7 -16.38 12.73 -15.68 12.74 -15.73 12.73 -14.96 12.72 Education 5.01 12.92 4.34 13.01 3.54 12.95 3.96 12.94 3.76 12.92 Residence 19.26 19.24 20.38 19.33 21.59 19.29 19.59 19.30 20.45 19.23 NEI 0.62 1.47 0.90 1.51 0.35 1.55 1.01 1.49 0.38 1.49 Intercept 662.77 63.89 597.85 51.73 615.54 56.03 612.42 53.14 630.09 55.04 Bold indicates p<0.05 Model 1: Exposure variable is Total NPS Model 2: Exposure variable is Factor 1 (Concern about specific types of crime) Model 3: Exposure variable is Factor 2 (Physical environment) Model 4: Exposure variable is Factor 3 (Location of violent crime) Model 5: Exposure variable is Factor 4 (Social environment)

Supplemental Table 7. Adjusted linear regression results of total and factor-specific NPS on accelerometer-measured non-sedentary time for morning hours (n=401). Model 1 Model 2 Model 3 Model 4 Model 5 β SE β SE β SE β SE β SE Total NPS -0.26 0.15 - - - - - - - - Factor 1 Score - - 0.10 0.25 - - - - - - Factor 2 Score - - - - -0.24 0.32 - - - - Factor 3 Score - - - - - - 1.11 0.66 - - Factor 4 Score - - - - - - - - 0.59 0.45 Age -0.21 0.22 1.51 0.28 1.50 0.28 1.51 0.28 1.56 0.28 Sex 1.63 4.20 16.82 5.25 17.27 5.24 16.69 5.22 16.32 5.25 BMI -0.32 0.27 1.03 0.34 1.04 0.33 1.04 0.33 1.03 0.33 Race 3.94 4.41 -6.67 5.60 -7.36 5.70 -7.77 5.59 -5.37 5.58 Poverty Status -1.14 4.21 7.37 5.29 7.58 5.29 6.96 5.27 6.88 5.29 Education -3.09 4.28 2.99 5.40 3.05 5.38 3.17 5.36 3.25 5.37 Residence 6.39 6.36 -7.73 8.03 -7.67 8.01 -7.14 8.00 -7.82 8.00 NEI -0.06 0.49 -0.09 0.63 -0.19 0.65 -0.18 0.62 0.11 0.62 Intercept 96.84 21.18 82.49 21.48 92.69 23.27 72.04 22.02 72.08 22.88 Bold indicates p<0.05 Model 1: Exposure variable is Total NPS Model 2: Exposure variable is Factor 1 (Concern about specific types of crime) Model 3: Exposure variable is Factor 2 (Physical environment) Model 4: Exposure variable is Factor 3 (Location of violent crime) Model 5: Exposure variable is Factor 4 (Social environment)
Supplemental Table 8. Adjusted linear regression results of total and factor-specific NPS on accelerometer-measured non-sedentary time for working hours (n=404). Model 1 Model 2 Model 3 Model 4 Model 5 β SE β SE β SE β SE β SE Total NPS -0.47 0.26 - - - - - - - - Factor 1 Score - - 0.02 0.34 - - - - - - Factor 2 Score - - - - -0.60 0.45 - - - - Factor 3 Score - - - - - - -0.62 0.93 - - Factor 4 Score - - - - - - - - -1.29 0.63 Age -0.59 0.39 -0.54 0.39 -0.59 0.39 -0.54 0.93 -0.65 0.39 Sex -12.11 7.33 -14.73 7.30 -13.39 7.28 -13.93 7.28 -12.65 7.28 BMI -1.64 0.46 -1.72 0.47 -1.76 0.46 -1.72 7.28 -1.67 0.46 Race -4.45 7.69 -3.98 7.80 -6.41 7.92 -3.11 7.80 -6.04 7.74 Poverty Status -4.90 7.34 -5.75 7.36 -5.19 7.35 -5.54 7.36 -4.73 7.33 Education 6.57 7.46 5.89 7.52 5.59 7.47 5.94 7.48 5.80 7.45 Residence 9.81 11.11 10.77 11.17 11.40 11.13 10.28 11.16 10.45 11.09 NEI 0.45 0.85 0.54 0.87 0.16 0.90 0.63 0.86 0.24 0.86 Intercept 345.60 36.91 303.81 29.90 323.84 32.33 311.33 30.73 332.07 31.73 Bold indicates p<0.05 Model 1: Exposure variable is Total NPS Model 2: Exposure variable is Factor 1 (Concern about specific types of crime) Model 3: Exposure variable is Factor 2 (Physical environment) Model 4: Exposure variable is Factor 3 (Location of violent crime) Model 5: Exposure variable is Factor 4 (Social environment)

Supplemental Table 9. Adjusted linear regression results of total and factor-specific NPS on accelerometer-measured non-sedentary time for evening hours (n=404). Model 1 Model 2 Model 3 Model 4 Model 5 β SE β SE β SE β SE β SE Total NPS -0.11 0.18 - - - - - - - - Factor 1 Score - - -0.17 0.23 - - - - - - Factor 2 Score - - - - 0.31 0.30 - - - - Factor 3 Score - - - - - - -0.66 0.62 - - Factor 4 Score - - - - - - - - -0.33 0.42 Age -0.91 0.26 -0.89 0.26 -0.88 0.26 -0.90 0.26 -0.93 0.27 Sex -15.79 4.96 -15.96 4.92 -16.60 4.91 -16.07 4.90 -15.87 4.93 BMI -0.79 0.31 -0.78 0.31 -0.80 0.31 -0.80 0.31 -0.80 0.31 Race -1.39 5.20 -0.70 5.25 0.01 5.34 -0.42 0.31 -1.81 5.24 Poverty Status -8.45 4.97 -8.70 4.97 -8.95 4.96 -8.42 5.25 -8.39 4.97 Education 0.39 5.05 0.59 5.06 0.42 5.04 0.26 5.04 0.21 5.04 Residence 4.12 7.52 3.96 7.53 3.98 7.51 3.85 5.72 4.25 7.51 NEI 0.12 0.57 0.23 0.59 0.34 0.60 0.23 0.58 0.06 0.58 Intercept 225.46 25.00 219.84 20.14 206.06 21.81 223.55 20.70 223.20 21.49 Bold indicates p<0.05 Model 1: Exposure variable is Total NPS Model 2: Exposure variable is Factor 1 (Concern about specific types of crime) Model 3: Exposure variable is Factor 2 (Physical environment) Model 4: Exposure variable is Factor 3 (Location of violent crime) Model 5: Exposure variable is Factor 4 (Social environment)