Embed Size (px)
Citation preview
Page 1 of 53
Cross-RDC Impact Assessment and Performance Reporting Update
Stage 1: Cross-RDC Impact Assessment for the Period
1 July 2009 to 30 June 2015
FINAL REPORT
October 2016
Prepared For
The Council of Rural Research and Development Corporations
Submitted By
Agtrans Research
AgEconPlus
EconSearch
Date
19th October 2016
Page 2 of 53
Acknowledgments
Agtrans Research and Consulting, in association with AgEconPlus Consulting and EconSearch,
would like to thank Tim Lester, for facilitating contact with the Rural Research and Development
Corporations, and the Evaluation Working Group, for their valuable guidance and feedback
throughout the Cross-RDC Impact Assessment process. The members of the Evaluation Working
Group of the Council were:
Tim Lester, Council of Rural Research and Development Corporations
Patrick Hone, Fisheries Research and Development Corporation
Leigh Clement, Sugar Research Australia Limited
Michael O’Shea, Sugar Research Australia Limited
Terry Longhurst, Meat and Livestock Australia
Chris Lafferty, Forest and Wood Products Australia
Dave Alden, Rural Industries Research and Development Corporation
Alison Anderson, Horticulture Innovation Australia Limited
Murray Jenkins, Dairy Australia
Mark Rowley, Wine Australia
In addition, a number of other RDC personnel attended workshops held with the Working Group and
made valuable contributions; their inputs are gratefully acknowledged.
Glossary of Economic Terms
Cost-benefit analysis: A conceptual framework for the economic evaluation of projects and programs in the public sector. It differs from a financial appraisal or evaluation in that it considers all gains (benefits) and losses (costs), regardless of to whom they accrue.
Benefit-cost ratio: The ratio of the present value of investment benefits to the present value of investment costs.
Discounting: The process of relating the costs and benefits of an investment to a base year using a stated discount rate.
Internal rate of return: The discount rate at which an investment has a net present value of zero, i.e. where present value of benefits = present value of costs.
Investment criteria: Measures of the economic worth of an investment such as Net Present Value, Benefit-Cost Ratio, and Internal Rate of Return.
Modified internal rate of return:
The internal rate of return of an investment that is modified so that the cash inflows from an investment are re-invested at the rate of the cost of capital (the re-investment rate).
Net present value: The discounted value of the benefits of an investment less the discounted value of the costs, i.e. present value of benefits - present value of costs.
Present value of benefits: The discounted value of benefits.
Present value of costs: The discounted value of investment costs.
Page 3 of 53
Acronyms and Abbreviations
ABS Australian Bureau of Statistics
AECL Australian Egg Corporation Limited
Agtrans Agtrans Research and Consulting Pty Ltd
AMPC Australian Meat Processor Corporation
APL Australian Pork Limited
AWI Australian Wool Innovation
BCR Benefit-Cost Ratio
BSES Bureau of Sugar Experiment Stations
CBA Cost Benefit Analysis
CRDC Cotton Research and Development Corporation
CRRDC Council of Rural Research and Development Corporations
DAWR Department of Agriculture and Water Resources
FRDC Fisheries Research and Development Corporation
FWPA Forest and Wood Products Australia
GDP Gross Domestic Product
GRDC Grains Research and Development Corporation
GWRDC Grape and Wine Research and Development Corporation
Hort. Innovation Horticulture Innovation Australia Limited
IRR Internal Rate of Return
MIRR Modified Internal Rate of Return
MLA Meat and Livestock Australia
NPV Net Present Value
PIRD Act Primary Industries Research and Development Act
PVB Present Value of Benefits
PVC Present Value of Costs
R&D Research and Development
RD&E Research, Development and Extension
RDC Research and Development Corporation
RIRDC Rural Industries Research and Development Corporation
SRA Sugar Research Australia
SRDC Sugar Research and Development Corporation
USB Universal Serial Bus (digital storage device)
WTP Willingness to Pay
Page 4 of 53
Contents
Acknowledgments ................................................................................................................................... 2
Glossary of Economic Terms .................................................................................................................. 2
Acronyms and Abbreviations .................................................................................................................. 3
List of Tables ........................................................................................................................................... 5
Executive Summary ................................................................................................................................ 6
1. Introduction ...................................................................................................................................... 8
2. Context and Background ................................................................................................................. 9
2.1 The Rural Research and Development Corporations ............................................................. 9
2.2 The Council of Rural Research and Development Corporations .......................................... 10
2.3 The Purpose of Cross-RDC Impact Assessment .................................................................. 10
2.4 Summary of Methods and Findings from the 2008 and 2010 CRRDC Cross-RDC Impact
Assessment Reports ......................................................................................................................... 10
2.5 Evaluation Post-2010 ............................................................................................................ 12
3. The Current Assessment ............................................................................................................... 13
3.1 Engaging Individual RDCs in the Cross-RDC Evaluation Process ....................................... 13
3.2 Description of the Stage 1 Template ..................................................................................... 13
4. List of evaluations .......................................................................................................................... 15
4.1 The Population ...................................................................................................................... 15
4.2 Exclusions ............................................................................................................................. 16
5. Impact Assessment Results (2010-2015) ...................................................................................... 18
5.1 Economic Evaluation Results ...................................................................................................... 18
5.2 Qualitative Description of Environmental and Social Impacts ..................................................... 21
6. Public benefits ................................................................................................................................ 22
7. Alignment with CRRDC Communication Themes ......................................................................... 23
8. Issues Identified and Implications for Future Cross-RDC Impact Assessment ............................. 28
9. Conclusion ..................................................................................................................................... 31
Reference List ....................................................................................................................................... 32
Appendices ........................................................................................................................................... 33
Appendix 1: List of all 15 Current RDCs with Web Page Links ......................................................... 33
Appendix 2: Complete List of the 288 Project Cluster Evaluations Submitted and Recorded .......... 34
Appendix 3: Summary Results of Sensitivity Analyses ..................................................................... 41
Appendix 4: Subjective Assessment of Alignment of Each Project Cluster to the Six CRRDC
Communication Themes (Total 288 Project Clusters) ...................................................................... 43
Page 5 of 53
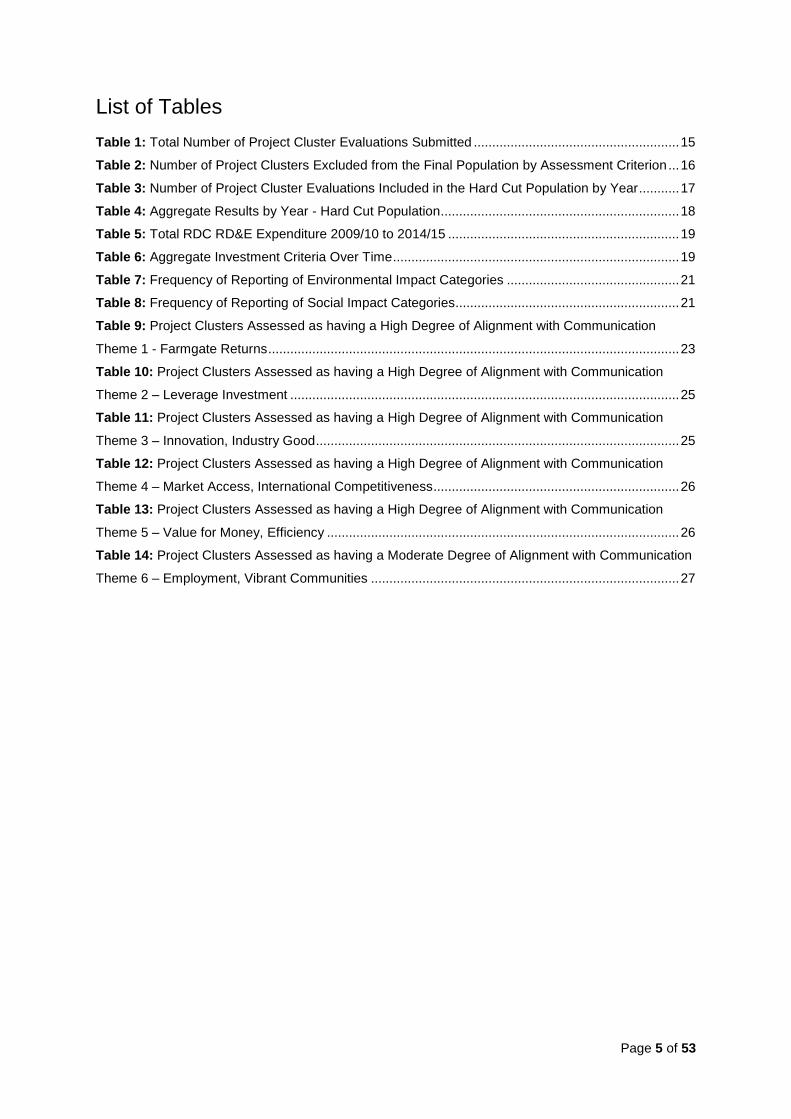
List of Tables
Table 1: Total Number of Project Cluster Evaluations Submitted ........................................................ 15
Table 2: Number of Project Clusters Excluded from the Final Population by Assessment Criterion ... 16
Table 3: Number of Project Cluster Evaluations Included in the Hard Cut Population by Year ........... 17
Table 4: Aggregate Results by Year - Hard Cut Population ................................................................. 18
Table 5: Total RDC RD&E Expenditure 2009/10 to 2014/15 ............................................................... 19
Table 6: Aggregate Investment Criteria Over Time .............................................................................. 19
Table 7: Frequency of Reporting of Environmental Impact Categories ............................................... 21
Table 8: Frequency of Reporting of Social Impact Categories ............................................................. 21
Table 9: Project Clusters Assessed as having a High Degree of Alignment with Communication
Theme 1 - Farmgate Returns ................................................................................................................ 23
Table 10: Project Clusters Assessed as having a High Degree of Alignment with Communication
Theme 2 – Leverage Investment .......................................................................................................... 25
Table 11: Project Clusters Assessed as having a High Degree of Alignment with Communication
Theme 3 – Innovation, Industry Good ................................................................................................... 25
Table 12: Project Clusters Assessed as having a High Degree of Alignment with Communication
Theme 4 – Market Access, International Competitiveness ................................................................... 26
Table 13: Project Clusters Assessed as having a High Degree of Alignment with Communication
Theme 5 – Value for Money, Efficiency ................................................................................................ 26
Table 14: Project Clusters Assessed as having a Moderate Degree of Alignment with Communication
Theme 6 – Employment, Vibrant Communities .................................................................................... 27
Page 6 of 53
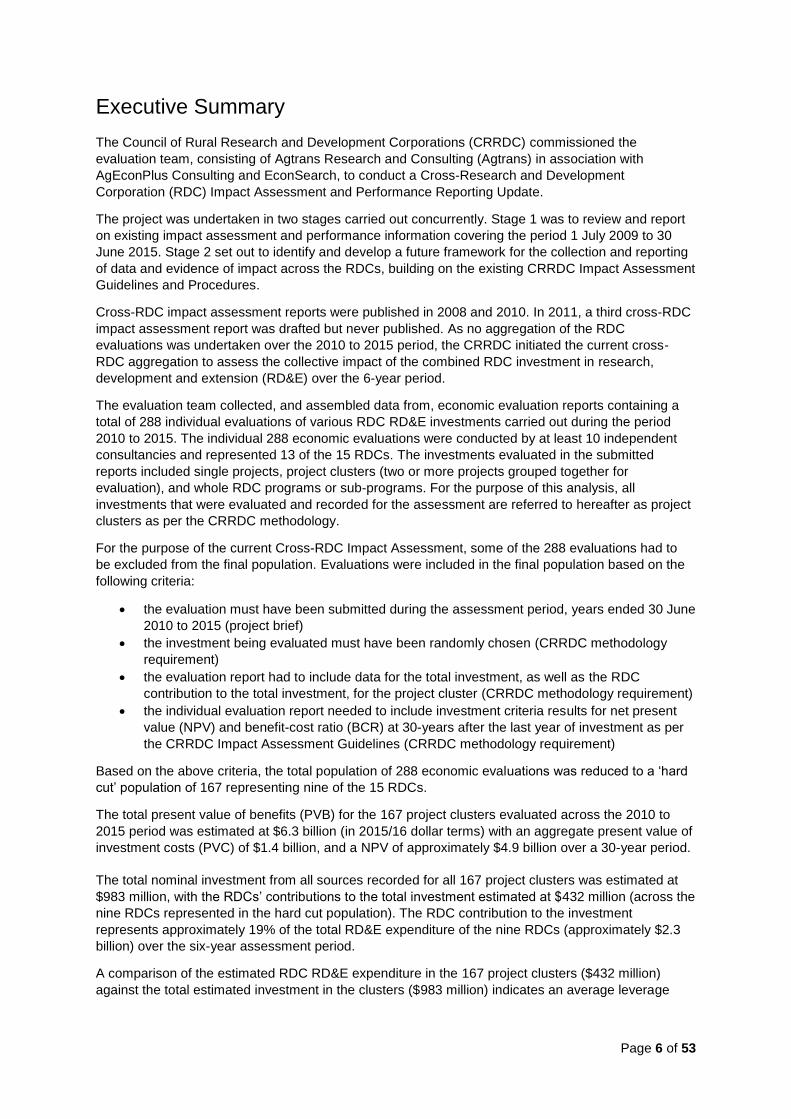
Executive Summary
The Council of Rural Research and Development Corporations (CRRDC) commissioned the
evaluation team, consisting of Agtrans Research and Consulting (Agtrans) in association with
AgEconPlus Consulting and EconSearch, to conduct a Cross-Research and Development
Corporation (RDC) Impact Assessment and Performance Reporting Update.
The project was undertaken in two stages carried out concurrently. Stage 1 was to review and report
on existing impact assessment and performance information covering the period 1 July 2009 to 30
June 2015. Stage 2 set out to identify and develop a future framework for the collection and reporting
of data and evidence of impact across the RDCs, building on the existing CRRDC Impact Assessment
Guidelines and Procedures.
Cross-RDC impact assessment reports were published in 2008 and 2010. In 2011, a third cross-RDC
impact assessment report was drafted but never published. As no aggregation of the RDC
evaluations was undertaken over the 2010 to 2015 period, the CRRDC initiated the current cross-
RDC aggregation to assess the collective impact of the combined RDC investment in research,
development and extension (RD&E) over the 6-year period.
The evaluation team collected, and assembled data from, economic evaluation reports containing a
total of 288 individual evaluations of various RDC RD&E investments carried out during the period
2010 to 2015. The individual 288 economic evaluations were conducted by at least 10 independent
consultancies and represented 13 of the 15 RDCs. The investments evaluated in the submitted
reports included single projects, project clusters (two or more projects grouped together for
evaluation), and whole RDC programs or sub-programs. For the purpose of this analysis, all
investments that were evaluated and recorded for the assessment are referred to hereafter as project
clusters as per the CRRDC methodology.
For the purpose of the current Cross-RDC Impact Assessment, some of the 288 evaluations had to
be excluded from the final population. Evaluations were included in the final population based on the
following criteria:
the evaluation must have been submitted during the assessment period, years ended 30 June
2010 to 2015 (project brief)
the investment being evaluated must have been randomly chosen (CRRDC methodology
requirement)
the evaluation report had to include data for the total investment, as well as the RDC
contribution to the total investment, for the project cluster (CRRDC methodology requirement)
the individual evaluation report needed to include investment criteria results for net present
value (NPV) and benefit-cost ratio (BCR) at 30-years after the last year of investment as per
the CRRDC Impact Assessment Guidelines (CRRDC methodology requirement)
Based on the above criteria, the total population of 288 economic evaluations was reduced to a ‘hard
cut’ population of 167 representing nine of the 15 RDCs.
The total present value of benefits (PVB) for the 167 project clusters evaluated across the 2010 to
2015 period was estimated at $6.3 billion (in 2015/16 dollar terms) with an aggregate present value of
investment costs (PVC) of $1.4 billion, and a NPV of approximately $4.9 billion over a 30-year period.
The total nominal investment from all sources recorded for all 167 project clusters was estimated at
$983 million, with the RDCs’ contributions to the total investment estimated at $432 million (across the
nine RDCs represented in the hard cut population). The RDC contribution to the investment
represents approximately 19% of the total RD&E expenditure of the nine RDCs (approximately $2.3
billion) over the six-year assessment period.
A comparison of the estimated RDC RD&E expenditure in the 167 project clusters ($432 million)
against the total estimated investment in the clusters ($983 million) indicates an average leverage
Page 7 of 53
ratio of approximately 1.27 to 1, meaning that for every $1 contributed by the RDCs, co-investment
partners contributed, on average, $1.27 to the RD&E investment.
Several additional sensitivity analyses were carried out on the total population based on different sets
of exclusion criteria in order to test the robustness of the above results. In general, the additional
results generated were informative and were consistent with the results of the general aggregate
analysis of the 167 project cluster evaluations.
Information on environmental and social impacts for each project cluster evaluated was also recorded
in the data collection template. Qualitative data were summarised and analysed and the impacts were
then grouped into seven environmental impact categories and seven social impact categories based
on the frequency of the type of specific impacts identified. Of the 167 project cluster evaluations
assessed, 118 reported one or more environmental impacts, and 149 reported one or more social
impacts.
The Cross-RDC Impact Assessment process for 2010-2015 identified some issues to be considered
for future assessments. These include a lack of continuing commitment to the CRRDC evaluation
approach, inconsistent evaluation reporting (including neglect of adherence to a standardised process
and inconsistent estimation of investment costs), absence of specific data on co-investment, loss of
corporate memory, and limited reporting of cross-RDC collaborative investments.
Overall, the results of the 2010-2015 Cross-RDC Impact Assessment are highly positive and results
demonstrate that the investment by the RDCs as a whole has been delivering significant benefits to
Australia.
Page 8 of 53
1. Introduction
The Council of Rural Research and Development Corporations (CRRDC) commissioned the
evaluation team, consisting of Agtrans Research and Consulting (Agtrans) in association with
AgEconPlus Consulting and EconSearch, to conduct a Cross-Research and Development
Corporation (RDC) Impact Assessment and Performance Reporting Update.
The project was undertaken in two stages carried out concurrently. Stage 1 was to review and report
on existing impact assessment and performance information reported during the period 1 July 2009 to
30 June 2015. Stage 2 set out to identify and develop a future framework for the collection and
reporting of data and evidence of impact across the RDCs, building on the existing CRRDC Impact
Assessment Guidelines and Procedures1.
This report presents the findings of the evaluation team for Stage 1 of the Cross-RDC Impact
Assessment and Performance Reporting Update 2010-2015. The analysis of the data collected has
allowed a generalised assessment of the performance of the RDCs regarding their past investment.
1 The CRRDC Impact Assessment Guideline and Procedures documents are available on the CRRDC website: Procedures: http://www.ruralrdc.com.au/wp-content/uploads/2016/04/CRRDC-Impact-Assessment-Procedures-V.1-070514.pdf Guidelines: http://www.ruralrdc.com.au/wp-content/uploads/2016/04/CRRDC-Impact-Assessment-Guidelines-V.1-070514.pdf
Page 9 of 53
2. Context and Background
2.1 The Rural Research and Development Corporations
The Rural Research and Development (R&D) Corporations are a network of organisations which have been formed under a partnership between different agriculture, fisheries and forestry industries and the Australian Government to drive innovation and improvement in, and for, rural industries.
The RDCs provide a range of services to the industries that they support and are funded through a mix of Australian Government and industry contributions. Their particular role and place within the rural innovation system as investment managers, custodians of public and private funds, and service providers to industry and Government, means that there is a high regard for ensuring a strong focus on governance and accountability of funds being managed, on efficiency and effectiveness of process employed, and on delivering value and impact from activities.
Historically all of the RDCs were established as agencies of the government under Commonwealth legislation, the Primary Industries and Energy Research and Development Act 1989 (now the Primary Industries Research and Development (PIRD) Act). The Act outlines the expectations, functions, roles and responsibilities for the RDCs, including delivery of economic, environmental and social benefits to rural industries, rural and regional communities, and the nation, through strategic investments in research, development and technology transfer or adoption.
Over time many of the RDCs have transitioned to become independent, not-for-profit companies owned by the industries they serve. This has happened where industry has seen an opportunity to merge and streamline organisations and structures, and where flexibility was needed to provide services such as market development, market access and promotion. There are now 10 industry-owned company RDCs and five statutory corporations owned by the Commonwealth under the PIRD Act (Rural R&D Corporations, 2016).
The 15 RDCs include2:
Statutory bodies:
Grains Research and Development Corporation (GRDC)
Fisheries Research and Development Corporation (FRDC)
Rural Industries Research and Development Corporation (RIRDC)
Cotton Research and Development Corporation (CRDC)
Wine Australia
Industry owned companies:
Horticulture Innovation Australia Limited (Hort. Innovation)
Meat and Livestock Australia (MLA)
Dairy Australia
Australian Wool Innovation (AWI)
Sugar Research Australia Limited (SRA)
Australian Pork Limited (APL)
Australian Meat Processor Corporation (AMPC)
Forest and Wood Products Australia (FWPA)
Australian Egg Corporation Limited (AECL)
Livecorp
2 See Appendix 1: List of all 15 Current RDCs with Web Page Links for the complete list of RDCs with links
to each of their associated web pages.
Page 10 of 53
2.2 The Council of Rural Research and Development Corporations
The RDCs come together through the CRRDC which provides a leadership forum to discuss and work collectively on important issues. The role of the Council is to support and facilitate the RDCs working together to fulfil their broad purpose and deliver economic, environmental and social benefits for rural industries and the broader community.
The aims of the Council are to (Rural R&D Corporations, 2016):
support, encourage and facilitate continual improvement in the delivery of efficient and effective services to rural industries and the community, particularly with regard to research, development, technology transfer and adoption
effectively represent and position the Rural RDCs as participants in the rural innovation system
influence national and rural innovation policy
provide a unified voice for the RDCs on matters of national importance.
2.3 The Purpose of Cross-RDC Impact Assessment
The RDCs operate in an area of high visibility and consistently strong demand for accountability of
expenditures, operations and results. RDCs undertake project, program and operational assessments
and performance reviews in line with CRRDC impact assessment guidelines and the requirements of
various contractual and regulatory arrangements with the Australian government.
Through the CRRDC, the RDCs need to refine, update and implement processes for collating and
aggregating impact assessment and performance information to support communication of the results
to relevant stakeholders. This includes exploring, assessing, combining and synthesising existing
material and potentially identifying additional evaluation work required.
Generating and documenting evidence of impact and demonstrating performance of the RDCs as a
collective is a key objective of the Council. The evaluation initiative also strongly aligns to the
CRRDC’s Stakeholder Engagement and Communications Strategy (2015-2017) that is currently being
rolled out.
2.4 Summary of Methods and Findings from the 2008 and 2010
CRRDC Cross-RDC Impact Assessment Reports
December 2008 Report: Measuring economic, environmental and social returns from
Rural Research and Development Corporations’ investment
Method
In 2007, the CRRDC developed an evaluation framework for assessing the impact of RDC
investments and their compliance with government requirements and priorities. The framework
enabled independent estimates to be provided of the net benefits of cross-RDC investments,
including achievements and industry benefits, relative to Government priorities. The purpose was to
provide robust and objective information on the overall economic, social and environmental impacts
produced by the RDC portfolio.
The methodology behind the framework had three elements:
1. Examination of the return of 36 specifically-selected highly successful projects (known as “hero” projects).
Page 11 of 53
2. Examination of the returns of 32 randomly selected projects3 from a pool of 600. These projects were chosen at random from the entire range of projects in order to provide an indication of the average return to Australia from the RDC investment.
3. Examination and evaluation of a sample of current RDC programs that involved collaboration and had a high level of public interest. Biosecurity was the first area to be selected for review and several biosecurity projects were evaluated.
Seven independent consultancies were commissioned by individual RDCs to undertake the
evaluations.
Results
The 36 hero projects were estimated to generate returns of $10.5 billion from a $265 million
investment by the RDCs and a $200 million contribution from other funding partners. RDCs initiated
and managed all 36 projects.
Benefits estimated at $685.7 million (present value terms, 2007) from the 32 randomly selected
projects resulted in a simple average benefit-cost ratio (BCR) of 11 to 1 after a period of 25 years.
A range of significant social and environmental benefits also were identified. These were distributed
broadly to the Australian community.
January 2010 Report: Impact of Investment in Research and Development by the
Rural Research and Development Corporations
Method
The framework for cross-RDC impact assessment set up in 2007 was intended to be an annual
reporting process. The 2009 evaluation (January 2010 report) followed a similar methodology but
emphasis focused on the random sampling component and did not include a repeat of the hero
project component included in the 2008 report (though some specific investment clusters were
described as case studies of various benefit types).
The goal of this second cross-RDC evaluation was to report on representative random sampling of project clusters from each RDC to build a pool of consistent cost-benefit analysis studies (CBAs) that could be used to provide an indication of the range and trends in returns from the total RDCs investments over a three-year period. Randomly selected project clusters were evaluated.
There were 59 project clusters evaluated in 2009 for the January 2010 report. The programs covered a broad range of RDC investments ranging across forestry, meat, fodder crops, dairy systems, soil biology and fisheries resource management. As well as covering a range of industry related topics, the programs also reflected the various stages across a wide spectrum of the innovation cycle within which the RDCs operate.
Results
The 59 individual project clusters evaluated in 2009 represented $676 million in RDC investments. It
was noted that one project cluster, Northern Beef Research (an MLA co-investment with the
Queensland Department of Employment, Economic Development and Innovation), made up $411
million or approximately 60%, of the total project cluster costs.
The total net present value (NPV) of all project clusters evaluated in 2009 was estimated at $1.9
billion over a 25-year period. Economic benefits included productivity gains, improved market
outcomes, and improved quality systems.
The results showed a strong return on investment, with a simple average BCR estimated at 10.5 to 1
after 25 years, which was largely consistent with the simple average BCR results from 2008.
3 In the context of the 2008 report ‘projects’ means a group of investments made to produce a particular R&D outcome. This can apply to an individual project or a group of projects with clearly defined innovation outcomes. Future reports refer to project clusters (one or more projects grouped for evaluation purposes) or programs.
Page 12 of 53
The January 2010 report also included a weighted average BCR (weighted by total project cluster
cost) to compare with the simple average BCR and help detect biases due to project size. The
weighted average BCR for the total project net returns was estimated at 6.04 to 1 after 25 years.
Current, past and potential future cross-RDC evaluation frameworks are discussed in more depth in
the Stage 2 report for the CRRDC Cross-RDC Impact Assessment and Performance Reporting
Update.
2.5 Evaluation Post-2010
From the beginning of 2011 to the end of 2015 few changes in the evaluation framework were
reported. Some RDCs developed specific CBA processes, partly driven by the earlier CRRDC
requirements and partly as a means of reporting to industry and assisting with research management
and priority setting. In 2011, a third cross-RDC impact assessment report was drafted but never
published. An important change in this period was the implementation of Statutory Funding
Agreements (SFAs) between the Department of Agriculture and Water Resources (DAWR) and the
individual RDCs that require a regular, periodic performance assessment.
Over the current analysis period, 2010 to 2015, some RDCs have continued to draw from the
population of clusters earlier defined for the 2008 and 2010 evaluation process, while others have not
maintained consistent commitment to ex-post evaluation including CBA. As no aggregation of the
RDC evaluations was undertaken over the 2010 to 2015 period, the CRRDC initiated the current
cross-RDC aggregation to assess the collective impact of the combined RDC investment in research,
development and extension (RD&E) over the 6-year period.
Further information on CRRDC impact assessment initiatives such as the refinement of guidelines
and a new Procedures Document during the 2010-2015 period is covered in the Stage 2 report.
Page 13 of 53
3. The Current Assessment
3.1 Engaging Individual RDCs in the Cross-RDC Evaluation Process
A letter from the CRRDC was sent to each of the 15 RDCs on 22 May 2016 by the CRRDC
Operations Manager. The letter requested cooperation from the RDCs to submit their economic
evaluations effected over the 2010-2015 period to the CRRDC via a DropBox established for this
purpose. The letter also sought permission from some RDCs where information was already held by
one or more of the three consultancies engaged in the CRRDC evaluation project for those
consultancies to use the RDC information they already held for purposes of the impact assessment.
Three members of the evaluation team already held a total of over 170 economic evaluation reports.
These were predominantly randomly chosen investments and represented seven RDCs, listed below.
Grain Research and Development Corporation
Fisheries Research and Development Corporation
Rural Industries Research and Development Corporation
Sugar Research and Development Corporation (SRDC) (now Sugar Research Australia)
Horticulture Australia (now Horticulture Innovation Australia Limited)
Grape and Wine Research and Development Corporation (GWRDC) (now Wine Australia)
Australian Egg Corporation Limited
The consultants had also assisted some of the RDCs to complete the previous templates that were
sent with the required information to the CRRDC secretariat in the early years of the 2010 to 2015
period and copies of some of these templates also were held by the consultants.
As a result of several changes within individual RDCs and the CRRDC itself, existing data held by the
CRRDC appeared to be in a state that made it difficult for the evaluation team to use; hence the team
took the view that all relevant data (economic evaluation reports submitted to the CRRDC between 1
July 2009 and 30 June 2015) needed to be resubmitted as per the letter of 22 May from the CRRDC
to the RDCs so that there was no overlap with evaluations included in the previous January 2010
report.
Some difficulty was experienced by some RDCs in uploading information into the DropBox
established by the CRRDC. To overcome the difficulties, the evaluation team accepted data
submissions from some RDCs in the form of USB drives and email attachments.
3.2 Description of the Stage 1 Template
The evaluation team developed a standard template for data entry that was used to assemble data for
the economic evaluation reports that were expected to be received, including those already held by
the team. The template was sent to the CRRDC for comment. The standard template was based on
improvements to the previous template developed by ACIL Tasman on behalf of the CRRDC and
which was used in the 2008 and 2010 CRRDC impact assessment reports. Although the new
guidelines for carrying out the economic evaluations were not officially posted until May 2014 (and
then only as a draft), some of the changes in the 2014 guidelines (now officially on the CRRDC
website) were accommodated in the new template for assembling past evaluation information.
As it was expected that information from most RDCs would follow what had been submitted in 2008
and 2009 from which the CRRDC impact assessment reports (2008 and 2010) were based, the
template used for the 2010-2015 period was based on the template that existed in 2009.
The Existing Excel Template and Evaluation Reports (2010)
The existing template was a Microsoft Excel spreadsheet that included columns for reporting
quantitative data for each investment. These columns included investment criteria for each investment
covering the present value of benefits (PVB), present value of investment costs (PVC), NPV, BCR
and Internal Rate of Return (IRR). This set of investment criteria was included for both the total RD&E
Page 14 of 53
Investment (including co-investors) and the investment by the RDC only. The total benefits were
attributed to the RDC in proportion to the contribution of investment costs by the RDC. In each case
these five investment criteria were reported in five-year step periods up to year 30, with the last year
of investment as year 0 as per the CRRDC Impact Assessment Guidelines.
Other information supplied in the Excel reporting template included:
The name of the project cluster evaluated
The RDC contact responsible for the evaluation
The consultant used to conduct the evaluation
The period of the investment (start year and final year)
The discount rate used
The evaluation reports were the key source of information from which the qualitative environmental
and social benefits were assembled. Where some of these benefits may have been valued, this was
identified from the evaluation reports.
Information for the 2010-2015 Assessment
The instructions for evaluation in the 2010-2015 period were assumed to be a continuation of those
that pertained at the time of the 2010 report.
Other information components of the template for the 2010-2015 data assembly include:
The total RD&E investment made by each RDC in each financial year
The strength of the association of each investment analysed with the six CRRDC
Communication Themes - score of 0 (none), 1 (low), 2 (medium) and 3 (high)
A description of the various environmental and social impacts identified and/or valued across
the investments evaluated
Information on collaborative investments with other RDCs that were available in the
evaluation descriptions assembled
Some derived parameters from the input data were automatically generated from the new template.
These included:
Average leverage ratios achieved by the RDC for co-investment
Total and RDC PVB, PVC and NPV by year and across the six years combined
The annual expenditure evaluated for each RDC as a percentage of the total RD&E
expenditure for that year (by year and RDC)
Page 15 of 53
4. List of evaluations
4.1 The Population
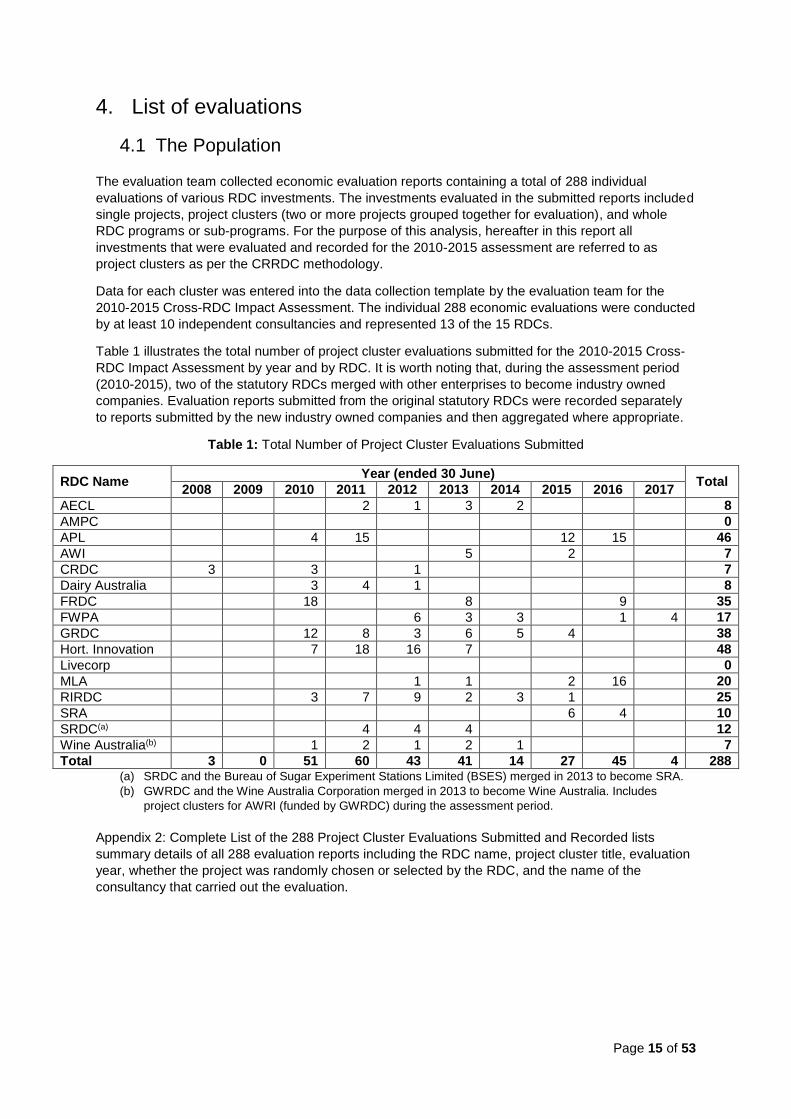
The evaluation team collected economic evaluation reports containing a total of 288 individual
evaluations of various RDC investments. The investments evaluated in the submitted reports included
single projects, project clusters (two or more projects grouped together for evaluation), and whole
RDC programs or sub-programs. For the purpose of this analysis, hereafter in this report all
investments that were evaluated and recorded for the 2010-2015 assessment are referred to as
project clusters as per the CRRDC methodology.
Data for each cluster was entered into the data collection template by the evaluation team for the
2010-2015 Cross-RDC Impact Assessment. The individual 288 economic evaluations were conducted
by at least 10 independent consultancies and represented 13 of the 15 RDCs.
Table 1 illustrates the total number of project cluster evaluations submitted for the 2010-2015 Cross-
RDC Impact Assessment by year and by RDC. It is worth noting that, during the assessment period
(2010-2015), two of the statutory RDCs merged with other enterprises to become industry owned
companies. Evaluation reports submitted from the original statutory RDCs were recorded separately
to reports submitted by the new industry owned companies and then aggregated where appropriate.
Table 1: Total Number of Project Cluster Evaluations Submitted
RDC Name Year (ended 30 June)
Total 2008 2009 2010 2011 2012 2013 2014 2015 2016 2017
AECL 2 1 3 2 8
AMPC 0
APL 4 15 12 15 46
AWI 5 2 7
CRDC 3 3 1 7
Dairy Australia 3 4 1 8
FRDC 18 8 9 35
FWPA 6 3 3 1 4 17
GRDC 12 8 3 6 5 4 38
Hort. Innovation 7 18 16 7 48
Livecorp 0
MLA 1 1 2 16 20
RIRDC 3 7 9 2 3 1 25
SRA 6 4 10
SRDC(a) 4 4 4 12
Wine Australia(b) 1 2 1 2 1 7
Total 3 0 51 60 43 41 14 27 45 4 288 (a) SRDC and the Bureau of Sugar Experiment Stations Limited (BSES) merged in 2013 to become SRA.
(b) GWRDC and the Wine Australia Corporation merged in 2013 to become Wine Australia. Includes
project clusters for AWRI (funded by GWRDC) during the assessment period.
Appendix 2: Complete List of the 288 Project Cluster Evaluations Submitted and Recorded lists
summary details of all 288 evaluation reports including the RDC name, project cluster title, evaluation
year, whether the project was randomly chosen or selected by the RDC, and the name of the
consultancy that carried out the evaluation.
Page 16 of 53
4.2 Exclusions
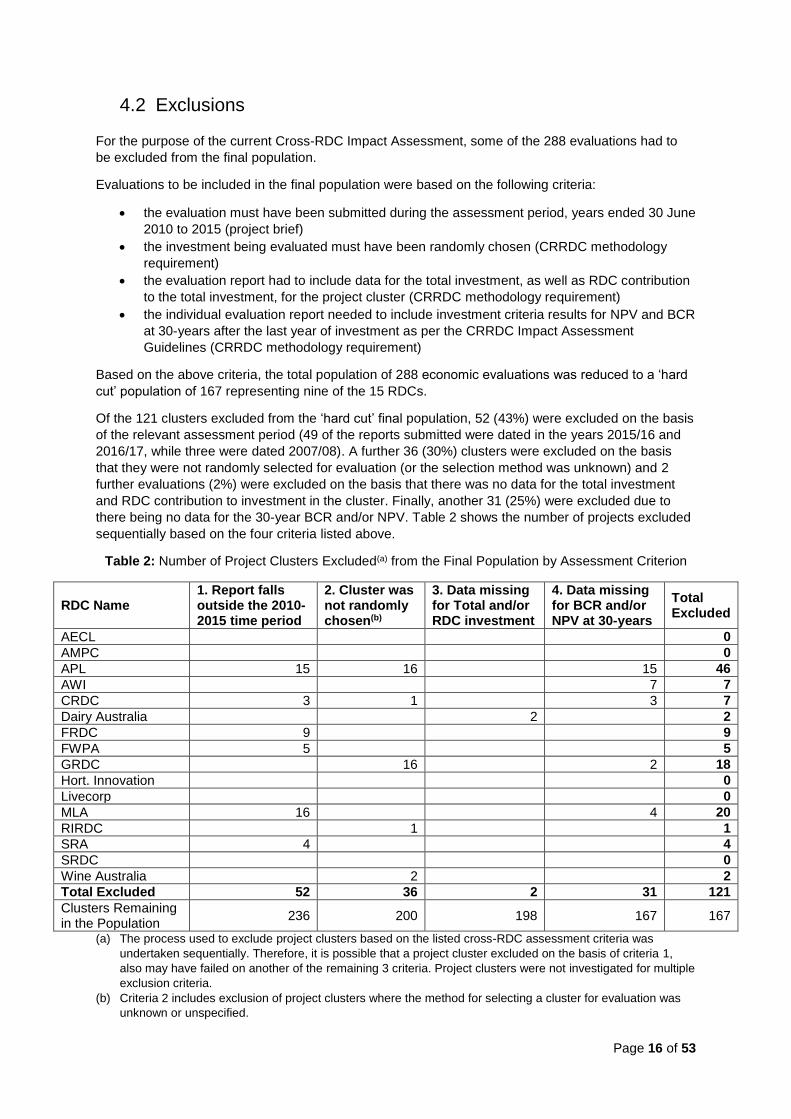
For the purpose of the current Cross-RDC Impact Assessment, some of the 288 evaluations had to
be excluded from the final population.
Evaluations to be included in the final population were based on the following criteria:
the evaluation must have been submitted during the assessment period, years ended 30 June
2010 to 2015 (project brief)
the investment being evaluated must have been randomly chosen (CRRDC methodology
requirement)
the evaluation report had to include data for the total investment, as well as RDC contribution
to the total investment, for the project cluster (CRRDC methodology requirement)
the individual evaluation report needed to include investment criteria results for NPV and BCR
at 30-years after the last year of investment as per the CRRDC Impact Assessment
Guidelines (CRRDC methodology requirement)
Based on the above criteria, the total population of 288 economic evaluations was reduced to a ‘hard
cut’ population of 167 representing nine of the 15 RDCs.
Of the 121 clusters excluded from the ‘hard cut’ final population, 52 (43%) were excluded on the basis
of the relevant assessment period (49 of the reports submitted were dated in the years 2015/16 and
2016/17, while three were dated 2007/08). A further 36 (30%) clusters were excluded on the basis
that they were not randomly selected for evaluation (or the selection method was unknown) and 2
further evaluations (2%) were excluded on the basis that there was no data for the total investment
and RDC contribution to investment in the cluster. Finally, another 31 (25%) were excluded due to
there being no data for the 30-year BCR and/or NPV. Table 2 shows the number of projects excluded
sequentially based on the four criteria listed above.
Table 2: Number of Project Clusters Excluded(a) from the Final Population by Assessment Criterion
RDC Name 1. Report falls outside the 2010-2015 time period
2. Cluster was not randomly chosen(b)
3. Data missing for Total and/or RDC investment
4. Data missing for BCR and/or NPV at 30-years
Total Excluded
AECL 0
AMPC 0
APL 15 16 15 46
AWI 7 7
CRDC 3 1 3 7
Dairy Australia 2 2
FRDC 9 9
FWPA 5 5
GRDC 16 2 18
Hort. Innovation 0
Livecorp 0
MLA 16 4 20
RIRDC 1 1
SRA 4 4
SRDC 0
Wine Australia 2 2
Total Excluded 52 36 2 31 121
Clusters Remaining in the Population
236 200 198 167 167
(a) The process used to exclude project clusters based on the listed cross-RDC assessment criteria was
undertaken sequentially. Therefore, it is possible that a project cluster excluded on the basis of criteria 1,
also may have failed on another of the remaining 3 criteria. Project clusters were not investigated for multiple
exclusion criteria.
(b) Criteria 2 includes exclusion of project clusters where the method for selecting a cluster for evaluation was
unknown or unspecified.
Page 17 of 53
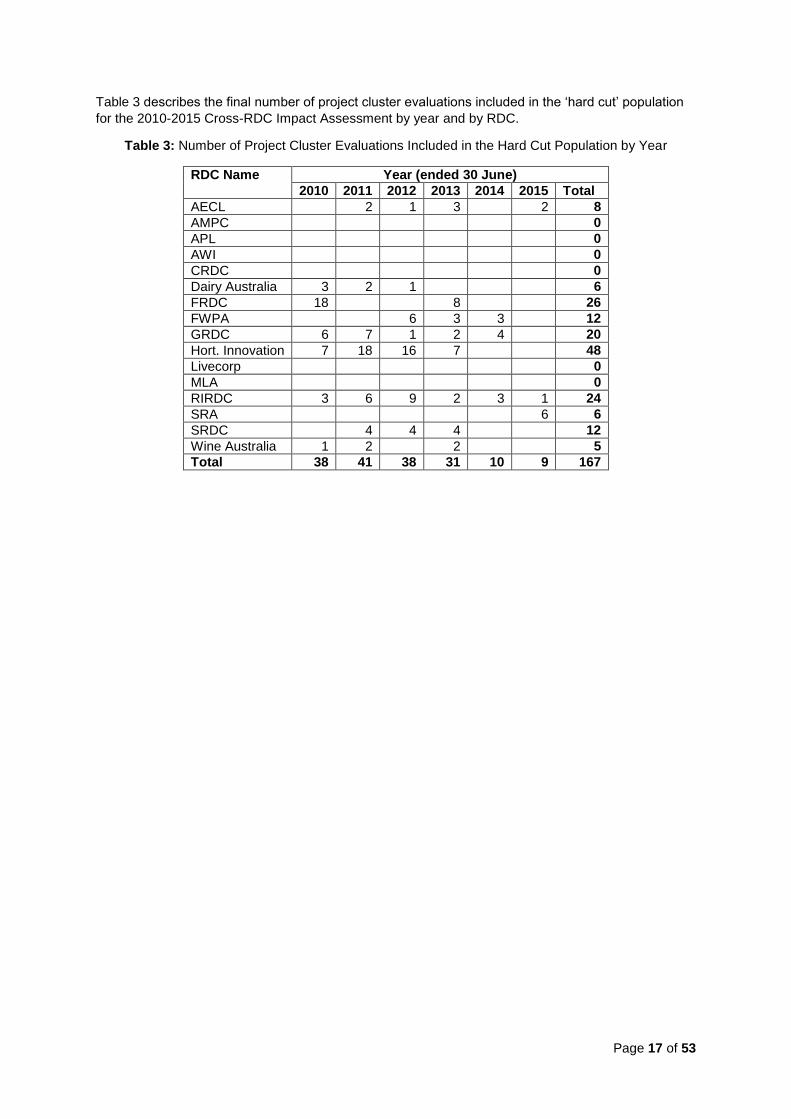
Table 3 describes the final number of project cluster evaluations included in the ‘hard cut’ population
for the 2010-2015 Cross-RDC Impact Assessment by year and by RDC.
Table 3: Number of Project Cluster Evaluations Included in the Hard Cut Population by Year
RDC Name Year (ended 30 June)
2010 2011 2012 2013 2014 2015 Total
AECL 2 1 3 2 8
AMPC 0
APL 0
AWI 0
CRDC 0
Dairy Australia 3 2 1 6
FRDC 18 8 26
FWPA 6 3 3 12
GRDC 6 7 1 2 4 20
Hort. Innovation 7 18 16 7 48
Livecorp 0
MLA 0
RIRDC 3 6 9 2 3 1 24
SRA 6 6
SRDC 4 4 4 12
Wine Australia 1 2 2 5
Total 38 41 38 31 10 9 167
Page 18 of 53
5. Impact Assessment Results (2010-2015)
5.1 Economic Evaluation Results
Aggregate Results: Hard Cut Population (167 project clusters)
Investment criteria recorded for each project cluster were reported in the dollar terms of the year that
the cluster was evaluated in (for example, investment criteria included in an economic evaluation
report submitted in 2011/12 were generally reported in 2011/12 dollar terms). The PVBs, PVCs and
NPVs for each project cluster recorded then were updated to 2015/16 dollar terms using the Gross
Domestic Product (GDP) Implicit Price Deflator (ABS, 2016) and updated BCRs were derived.
Some of the investment analyses recorded include valuation of social and/or environmental impacts.
This was noted in the data collection template. Most environmental and social impacts, however, were
not valued due to the difficulties in valuing non-market goods (discussed further in Section 6 below).
The total PVB for the 167 project clusters evaluated and recorded across the 2010 to 2015 period
was estimated at $6.3 billion with an aggregate PVC of $1.4 billion, and a NPV for the total ‘hard cut’
population of approximately $4.9 billion over a 30-year period.
To allow comparison with previous CRRDC impact assessments, the simple average BCR for this
population (calculated as the average of the individual 167 project cluster BCRs) was estimated at 6.0
to 1 after 30-years. However, a simple average is often a flawed measure as it is sensitive to any
extreme values within the data set, therefore, a weighted average was also estimated. The weighted
average was estimated by taking the total PVB across all 167 project clusters ($6.3 billion) and
dividing by the total PVC ($1.4 billion) resulting in an estimated average BCR of 4.5 to 1. That is, for
every $1 dollar invested, approximately $4.50 is returned after 30-years.
The investment criteria from the aggregate quantitative analysis for the Cross-RDC Impact
Assessment (2010-2015) are all highly positive and demonstrate that the investment by the RDCs as
a whole has been delivering significant benefits to Australia.
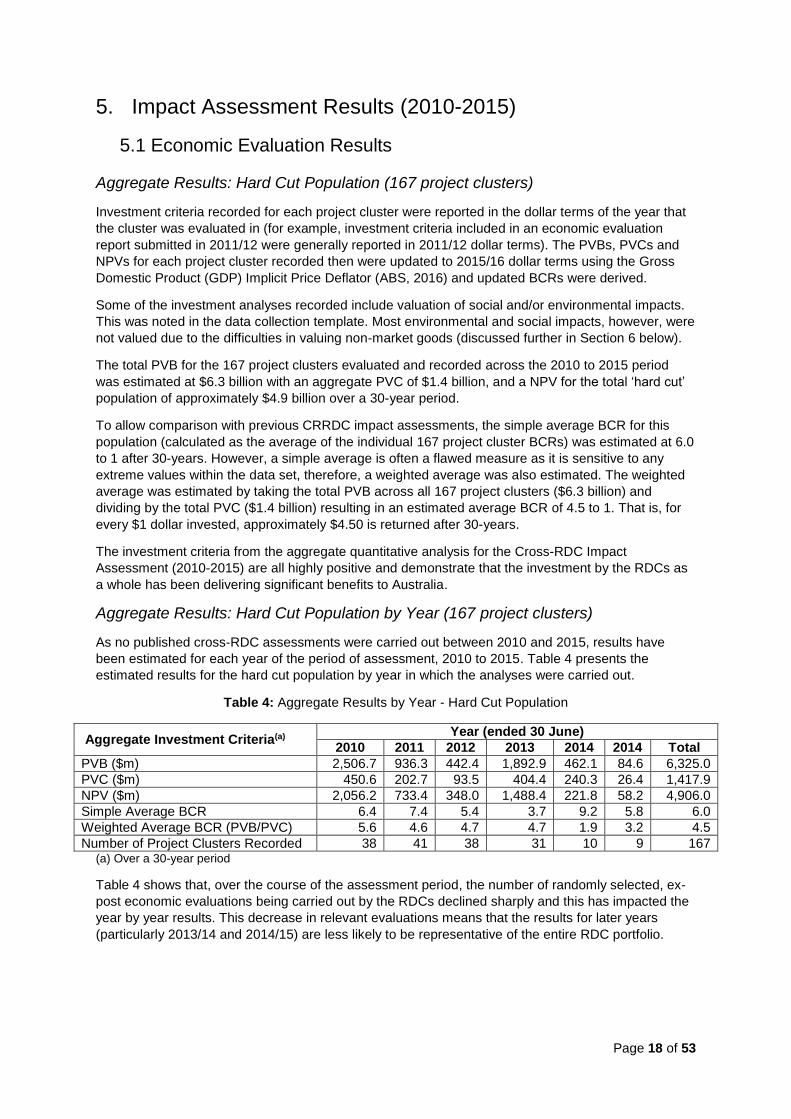
Aggregate Results: Hard Cut Population by Year (167 project clusters)
As no published cross-RDC assessments were carried out between 2010 and 2015, results have
been estimated for each year of the period of assessment, 2010 to 2015. Table 4 presents the
estimated results for the hard cut population by year in which the analyses were carried out.
Table 4: Aggregate Results by Year - Hard Cut Population
Aggregate Investment Criteria(a) Year (ended 30 June)
2010 2011 2012 2013 2014 2014 Total
PVB ($m) 2,506.7 936.3 442.4 1,892.9 462.1 84.6 6,325.0
PVC ($m) 450.6 202.7 93.5 404.4 240.3 26.4 1,417.9
NPV ($m) 2,056.2 733.4 348.0 1,488.4 221.8 58.2 4,906.0
Simple Average BCR 6.4 7.4 5.4 3.7 9.2 5.8 6.0
Weighted Average BCR (PVB/PVC) 5.6 4.6 4.7 4.7 1.9 3.2 4.5
Number of Project Clusters Recorded 38 41 38 31 10 9 167 (a) Over a 30-year period
Table 4 shows that, over the course of the assessment period, the number of randomly selected, ex-
post economic evaluations being carried out by the RDCs declined sharply and this has impacted the
year by year results. This decrease in relevant evaluations means that the results for later years
(particularly 2013/14 and 2014/15) are less likely to be representative of the entire RDC portfolio.
Page 19 of 53
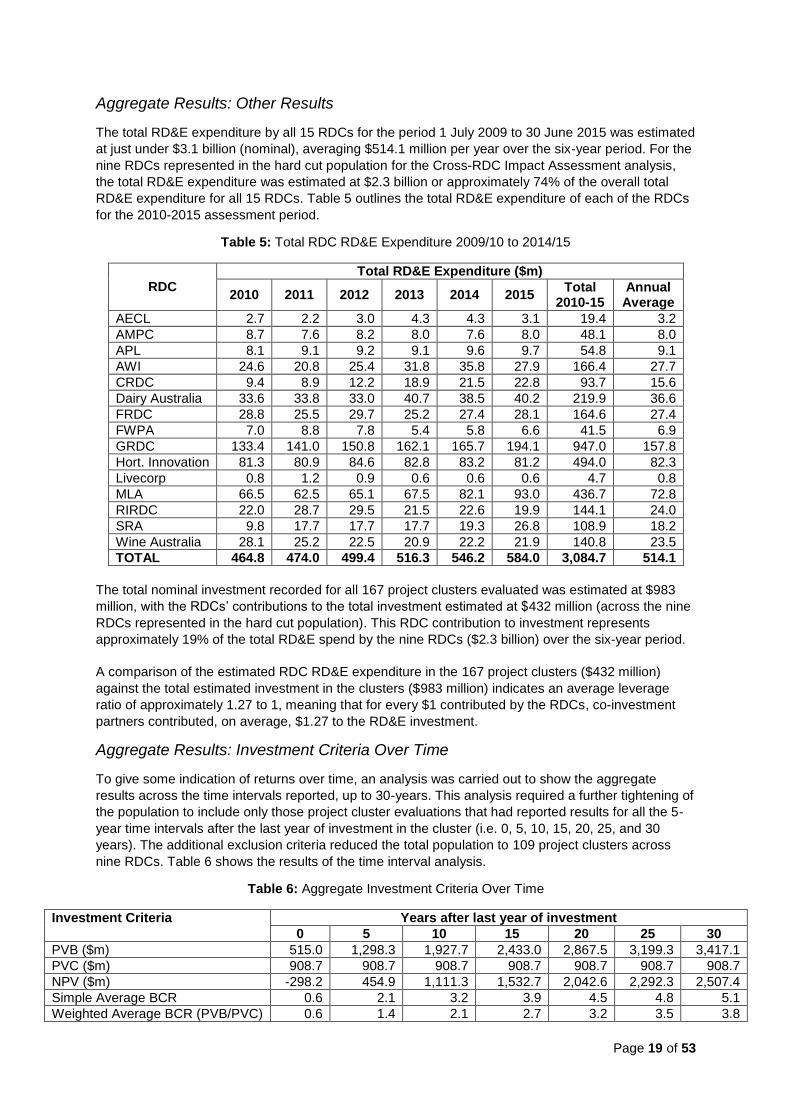
Aggregate Results: Other Results
The total RD&E expenditure by all 15 RDCs for the period 1 July 2009 to 30 June 2015 was estimated
at just under $3.1 billion (nominal), averaging $514.1 million per year over the six-year period. For the
nine RDCs represented in the hard cut population for the Cross-RDC Impact Assessment analysis,
the total RD&E expenditure was estimated at $2.3 billion or approximately 74% of the overall total
RD&E expenditure for all 15 RDCs. Table 5 outlines the total RD&E expenditure of each of the RDCs
for the 2010-2015 assessment period.
Table 5: Total RDC RD&E Expenditure 2009/10 to 2014/15
RDC
Total RD&E Expenditure ($m)
2010 2011 2012 2013 2014 2015 Total
2010-15 Annual
Average
AECL 2.7 2.2 3.0 4.3 4.3 3.1 19.4 3.2
AMPC 8.7 7.6 8.2 8.0 7.6 8.0 48.1 8.0
APL 8.1 9.1 9.2 9.1 9.6 9.7 54.8 9.1
AWI 24.6 20.8 25.4 31.8 35.8 27.9 166.4 27.7
CRDC 9.4 8.9 12.2 18.9 21.5 22.8 93.7 15.6
Dairy Australia 33.6 33.8 33.0 40.7 38.5 40.2 219.9 36.6
FRDC 28.8 25.5 29.7 25.2 27.4 28.1 164.6 27.4
FWPA 7.0 8.8 7.8 5.4 5.8 6.6 41.5 6.9
GRDC 133.4 141.0 150.8 162.1 165.7 194.1 947.0 157.8
Hort. Innovation 81.3 80.9 84.6 82.8 83.2 81.2 494.0 82.3
Livecorp 0.8 1.2 0.9 0.6 0.6 0.6 4.7 0.8
MLA 66.5 62.5 65.1 67.5 82.1 93.0 436.7 72.8
RIRDC 22.0 28.7 29.5 21.5 22.6 19.9 144.1 24.0
SRA 9.8 17.7 17.7 17.7 19.3 26.8 108.9 18.2
Wine Australia 28.1 25.2 22.5 20.9 22.2 21.9 140.8 23.5
TOTAL 464.8 474.0 499.4 516.3 546.2 584.0 3,084.7 514.1
The total nominal investment recorded for all 167 project clusters evaluated was estimated at $983
million, with the RDCs’ contributions to the total investment estimated at $432 million (across the nine
RDCs represented in the hard cut population). This RDC contribution to investment represents
approximately 19% of the total RD&E spend by the nine RDCs ($2.3 billion) over the six-year period.
A comparison of the estimated RDC RD&E expenditure in the 167 project clusters ($432 million)
against the total estimated investment in the clusters ($983 million) indicates an average leverage
ratio of approximately 1.27 to 1, meaning that for every $1 contributed by the RDCs, co-investment
partners contributed, on average, $1.27 to the RD&E investment.
Aggregate Results: Investment Criteria Over Time
To give some indication of returns over time, an analysis was carried out to show the aggregate
results across the time intervals reported, up to 30-years. This analysis required a further tightening of
the population to include only those project cluster evaluations that had reported results for all the 5-
year time intervals after the last year of investment in the cluster (i.e. 0, 5, 10, 15, 20, 25, and 30
years). The additional exclusion criteria reduced the total population to 109 project clusters across
nine RDCs. Table 6 shows the results of the time interval analysis.
Table 6: Aggregate Investment Criteria Over Time
Investment Criteria Years after last year of investment
0 5 10 15 20 25 30
PVB ($m) 515.0 1,298.3 1,927.7 2,433.0 2,867.5 3,199.3 3,417.1
PVC ($m) 908.7 908.7 908.7 908.7 908.7 908.7 908.7
NPV ($m) -298.2 454.9 1,111.3 1,532.7 2,042.6 2,292.3 2,507.4
Simple Average BCR 0.6 2.1 3.2 3.9 4.5 4.8 5.1
Weighted Average BCR (PVB/PVC) 0.6 1.4 2.1 2.7 3.2 3.5 3.8
Page 20 of 53
The results shown in Table 6 show that aggregate results across the nine RDCs represented become
positive quickly, from just 5 years after the last year of investment.
Aggregate Results: Additional Analyses/Sensitivities
Several additional analyses were carried out on total population based on different sets of exclusion
criteria in order to test the robustness of the above results. The analyses included:
25-year results
In the past, impact assessment guidelines have recommended reporting of investment criteria to 25-
years after the last year of investment (as opposed to the currently accepted 30-years). An analysis
was carried out on a varied set of exclusion criteria such that project cluster evaluations were required
to be within the assessment period (1 July 2009 to 30 June 2015), randomly chosen, include data for
the total investment in the cluster evaluated as well as data for the RDC contribution to investment in
the cluster, and include data for the NPV and BCR at 25-years after the last year of investment.
Inclusion of additional years for aggregate population (2015/16 and 2016/17)
The original, total population of 288 economic evaluation reports submitted for the current Cross-RDC
Impact Assessment included many that fell outside the relevant assessment period (2009/10 to
2014/15). As any project clusters evaluated pre-2010 ought to have been captured by the previous
CRRDC impact assessment reports (December 2008 and January 2010), an additional analysis was
carried out to investigate the impact of any additional evaluations such that the aggregate population
included project cluster evaluations that fell within the period 1 July 2009 and 30 June 2017. The
evaluations also were randomly chosen, included data for total investment in the cluster evaluated as
well as data for the RDC contribution to investment in the cluster, and included data for the NPV and
BCR at 30-years after the last year of investment.
Comparison of random population with results of selected population
Some RDCs conducted selected ex-post economic evaluations for other purposes. These evaluations
were not included in the final population for aggregation in the current Cross-RDC Impact Assessment
due to the potential for bias in the results. An additional analysis was conducted of only those project
cluster evaluations that were selected for evaluation by the individual RDC, fell into the relevant
assessment period (1 July 2009 to 30 June 2015), included data for total investment in the project
cluster and the RDC contribution to investment in the cluster, and included data for the NPV and BCR
at 30-years after the last year of investment.
Findings
Results tables for each of the three alternative analyses described above can be found in Appendix 3:
Summary Results of Sensitivity Analyses. The BCR for the selectively chosen population was
moderately higher, this was expected as some of the selected project clusters evaluated may have
been chosen as examples of successful investments by the RDCs. Others may have been selected to
assist with decisions on whether or not to continue to invest in the selected area. In general, the
results were consistent with the results of the aggregate analysis of the 167 project cluster
evaluations shown in Table 4.
Page 21 of 53
5.2 Qualitative Description of Environmental and Social Impacts
Method of aggregation
Qualitative data on environmental and social impacts, where available for each of the 288 individual
economic evaluations in the total population, were compiled and entered into the 2016 Cross-RDC
Impact Assessment data collection template described in Section 3.2. The data entered were
analysed and then grouped into seven environmental impact categories and seven social impact
categories based on the frequency of the type of specific impacts identified.
Categories and Findings
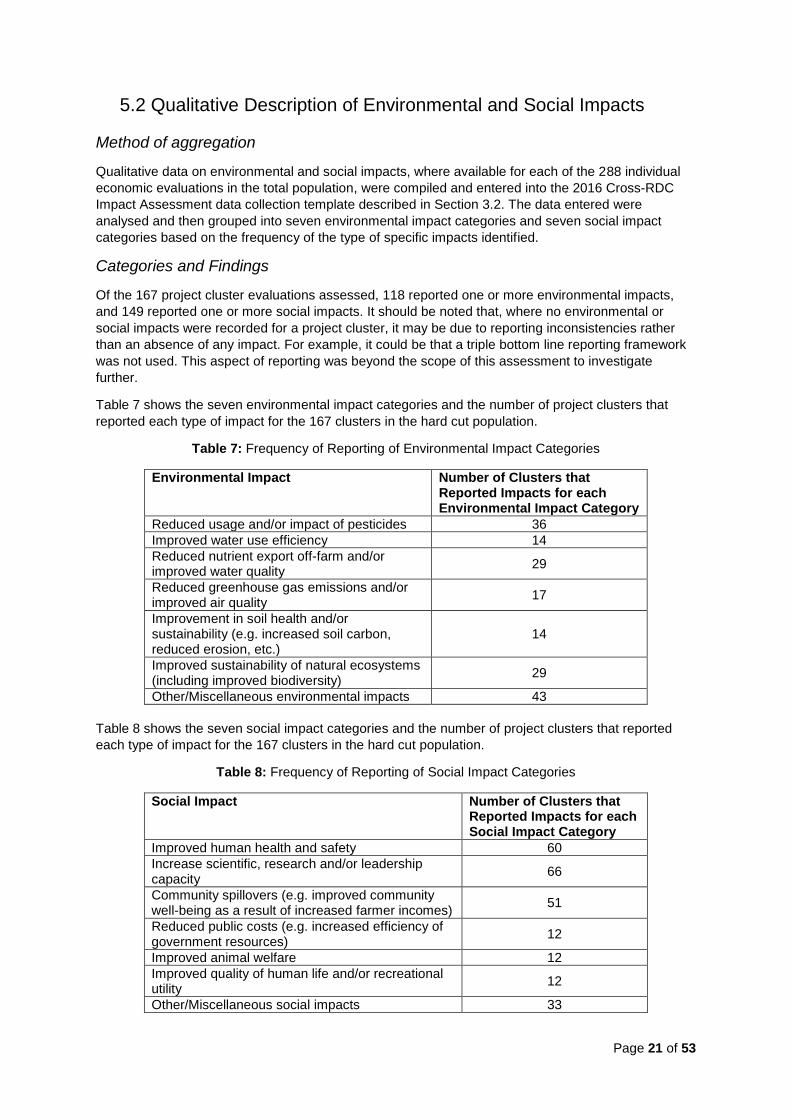
Of the 167 project cluster evaluations assessed, 118 reported one or more environmental impacts,
and 149 reported one or more social impacts. It should be noted that, where no environmental or
social impacts were recorded for a project cluster, it may be due to reporting inconsistencies rather
than an absence of any impact. For example, it could be that a triple bottom line reporting framework
was not used. This aspect of reporting was beyond the scope of this assessment to investigate
further.
Table 7 shows the seven environmental impact categories and the number of project clusters that
reported each type of impact for the 167 clusters in the hard cut population.
Table 7: Frequency of Reporting of Environmental Impact Categories
Environmental Impact Number of Clusters that Reported Impacts for each Environmental Impact Category
Reduced usage and/or impact of pesticides 36
Improved water use efficiency 14
Reduced nutrient export off-farm and/or improved water quality
29
Reduced greenhouse gas emissions and/or improved air quality
17
Improvement in soil health and/or sustainability (e.g. increased soil carbon, reduced erosion, etc.)
14
Improved sustainability of natural ecosystems (including improved biodiversity)
29
Other/Miscellaneous environmental impacts 43
Table 8 shows the seven social impact categories and the number of project clusters that reported
each type of impact for the 167 clusters in the hard cut population.
Table 8: Frequency of Reporting of Social Impact Categories
Social Impact Number of Clusters that Reported Impacts for each Social Impact Category
Improved human health and safety 60
Increase scientific, research and/or leadership capacity
66
Community spillovers (e.g. improved community well-being as a result of increased farmer incomes)
51
Reduced public costs (e.g. increased efficiency of government resources)
12
Improved animal welfare 12
Improved quality of human life and/or recreational utility
12
Other/Miscellaneous social impacts 33
Page 22 of 53
6. Public benefits
Public benefits are usually considered synonymous with environmental and social benefits but can also include the spillovers of productivity gains to other sectors of the Australian economy. The environmental and social benefits that have been reported in Table 7 and Table 8 cover the major public benefits from the RDC investment.
The Australian Government investment in the RDCs is not solely to address the delivery of public benefits as there are also elements of market failure used to justify Government funding of RD&E.
With regard to public benefits, of interest to Government is the concept of additionality. How does the Government funding increase the delivery of public benefits, given that some environmental and social benefits would have been delivered anyway as spillovers from productivity oriented research? Ex-post evaluations cannot address this issue meaningfully so it is beyond the scope of this report, and is not further discussed here.
Valuing Public Benefits
While identification of the public (social and environmental) benefits presents some challenges, quantification is even more difficult as measurement of the benefit can be problematic.
In the absence of market prices, methods to elicit willingness to pay (WTP) values for social and environmental benefits are available. These methods fall into two principal groups: revealed and stated preference methods.
Revealed preference methods use observed behaviour of individuals to estimate values for a benefit. Two common approaches are hedonic pricing and the travel cost method. An example of hedonic pricing may be an observed retail market premium of, for example, ethical foods as a measure of society’s value for such foods. Travel cost methods rely on analyses of the travel costs incurred by people in pursuing a particular interest, such as visiting a place of natural beauty or other characteristics. Such measures are more often linked to environmental benefits rather than social benefits.
Stated preference methods elicit WTP estimates directly from consumers and are based on what people say rather than on observed behaviour. Variations include contingent valuation and choice modelling.
Contingent valuation involves asking respondents direct questions on what they would be willing to pay for a good or service. Choice modelling involves a series of questions, each which asks respondents to choose their preferred option from several alternatives. Each option contains a standard set of attributes and is differentiated from other options by allowing levels of attributes to vary systematically.
Revealed preference methods should be preferred over stated preference methods due to their greater proximity to actual behaviour; however, revealed preference methods usually rely on market information or observed costs and these are not always available or relevant for some valuations. Stated preference methods can have greater relevance in rural RD&E valuations than revealed preference methods.
Benefit transfer is the process of transferring a willingness to pay value derived from an existing study or studies to another like situation. This can be a hazardous process due to significant differences in the original and new situations, unclear reporting of the original study, and incorrect interpretation in transfer. Despite its shortcomings, benefit transfer is commonly practiced. This is because there may not be any highly relevant studies carried out or available to the analyst when needed (some are embedded in the grey literature), the high cost of carrying out a new WTP study, or a judgement that an approximate value will be sufficient. It is suggested that the CRRDC and RDCs consider undertaking a body of work to develop more detailed guidelines to standardise the approach to valuation of public benefits for key impact categories (for example, water quality) to supplement the CRRDC Impact Assessment Guidelines.
Page 23 of 53
7. Alignment with CRRDC Communication Themes
Introduction
As an additional component of the CRRDC Cross-RDC Impact Assessment and Performance
Reporting Update, the evaluation team was asked to engage with the CRRDC communications team
in order to provide some potentially useful input into the CRRDC’s Stakeholder Engagement and
Communications Strategy (2015-2017) that is currently being rolled out.
The Strategy includes communication around six central themes:
1. Farmgate returns: smarter farming drives improved productivity and profitability, on and off-
farm
2. Leverage investment: co-investment and collaboration bring scale, capability and greater
impact
3. Innovation, industry good: innovation and practice improvement drive cross-sector gains
4. Market access, international competitiveness: market intelligence and market access power
demand for Australian food and fibre
5. Value for money, efficiency: return on funds invested underpins research and development
programs
6. Employment, vibrant communities: new skills and changed practices deliver jobs and boost
regional capacity
Approach
The Stage 1 impact assessment aimed to provide some sources of potential case studies for each of
the six themes using a subjective assessment (backed, in some cases, with quantitative results) of
the alignment of the outcomes and impacts of each individual project cluster with the themes.
The subjective scoring system assigned each project cluster a 0 (no alignment with theme), 1 (low
alignment), 2 (medium alignment), or 3 (high degree of alignment) against each of the six
communications themes. It was envisaged that clusters with a rating of 3 may be further investigated
by the communications team as a source of case studies for that theme.
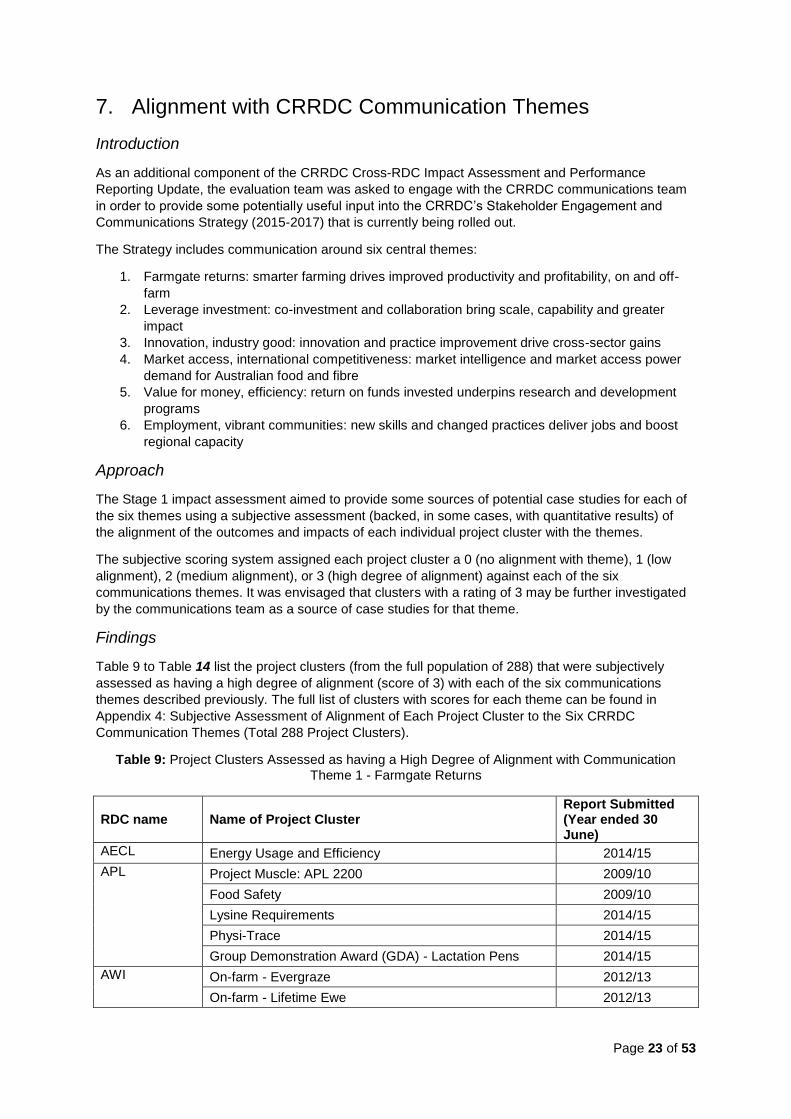
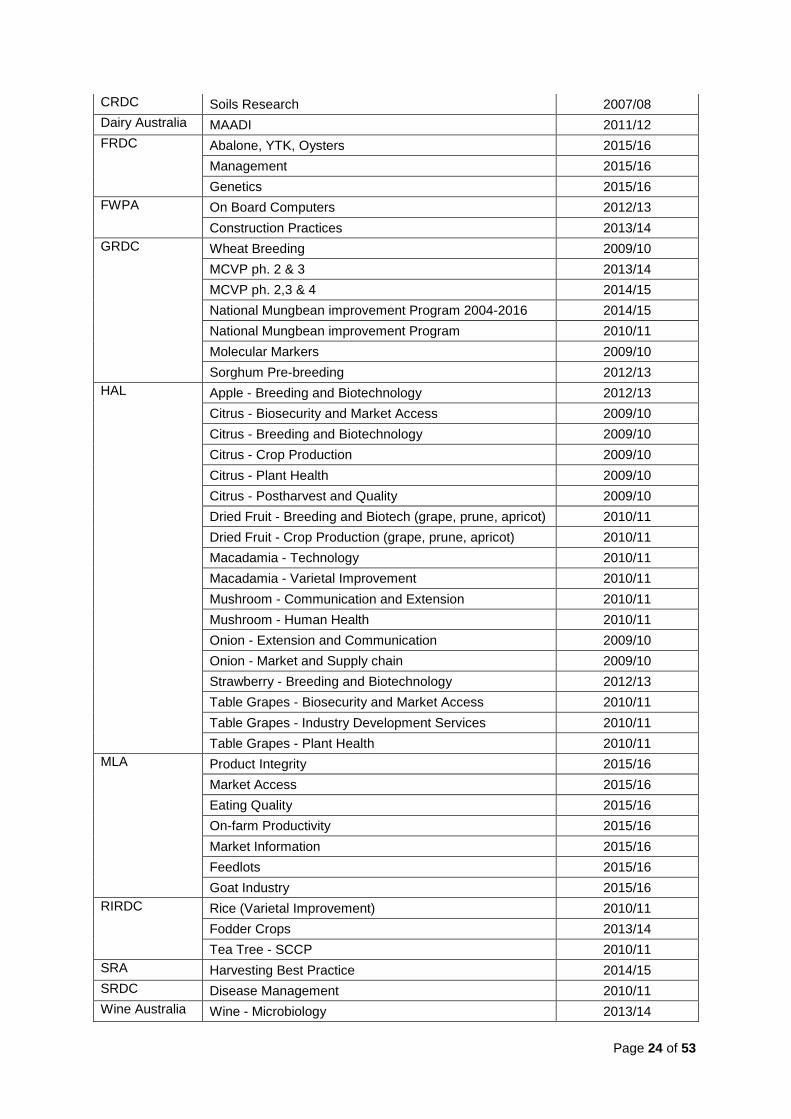
Findings
Table 9 to Table 14 list the project clusters (from the full population of 288) that were subjectively
assessed as having a high degree of alignment (score of 3) with each of the six communications
themes described previously. The full list of clusters with scores for each theme can be found in
Appendix 4: Subjective Assessment of Alignment of Each Project Cluster to the Six CRRDC
Communication Themes (Total 288 Project Clusters).
Table 9: Project Clusters Assessed as having a High Degree of Alignment with Communication
Theme 1 - Farmgate Returns
RDC name Name of Project Cluster Report Submitted (Year ended 30 June)
AECL Energy Usage and Efficiency 2014/15
APL Project Muscle: APL 2200 2009/10
Food Safety 2009/10
Lysine Requirements 2014/15
Physi-Trace 2014/15
Group Demonstration Award (GDA) - Lactation Pens 2014/15
AWI On-farm - Evergraze 2012/13
On-farm - Lifetime Ewe 2012/13
Page 24 of 53
CRDC Soils Research 2007/08
Dairy Australia MAADI 2011/12
FRDC Abalone, YTK, Oysters 2015/16
Management 2015/16
Genetics 2015/16
FWPA On Board Computers 2012/13
Construction Practices 2013/14
GRDC Wheat Breeding 2009/10
MCVP ph. 2 & 3 2013/14
MCVP ph. 2,3 & 4 2014/15
National Mungbean improvement Program 2004-2016 2014/15
National Mungbean improvement Program 2010/11
Molecular Markers 2009/10
Sorghum Pre-breeding 2012/13
HAL Apple - Breeding and Biotechnology 2012/13
Citrus - Biosecurity and Market Access 2009/10
Citrus - Breeding and Biotechnology 2009/10
Citrus - Crop Production 2009/10
Citrus - Plant Health 2009/10
Citrus - Postharvest and Quality 2009/10
Dried Fruit - Breeding and Biotech (grape, prune, apricot) 2010/11
Dried Fruit - Crop Production (grape, prune, apricot) 2010/11
Macadamia - Technology 2010/11
Macadamia - Varietal Improvement 2010/11
Mushroom - Communication and Extension 2010/11
Mushroom - Human Health 2010/11
Onion - Extension and Communication 2009/10
Onion - Market and Supply chain 2009/10
Strawberry - Breeding and Biotechnology 2012/13
Table Grapes - Biosecurity and Market Access 2010/11
Table Grapes - Industry Development Services 2010/11
Table Grapes - Plant Health 2010/11
MLA Product Integrity 2015/16
Market Access 2015/16
Eating Quality 2015/16
On-farm Productivity 2015/16
Market Information 2015/16
Feedlots 2015/16
Goat Industry 2015/16
RIRDC Rice (Varietal Improvement) 2010/11
Fodder Crops 2013/14
Tea Tree - SCCP 2010/11
SRA Harvesting Best Practice 2014/15
SRDC Disease Management 2010/11
Wine Australia Wine - Microbiology 2013/14
Page 25 of 53
Wine - Problem Solving Capability 2011/12
Grapes & Wine - Yeasts 2012/13
Table 10: Project Clusters Assessed as having a High Degree of Alignment with Communication
Theme 2 – Leverage Investment(a)
RDC name Name of Project Cluster Report Submitted (Year ended 30 June)
APL PigPass NVD 2010/11
Life Cycle Analyses 2010/11
Bungowannah Virus 2010/11
Lysine Requirements 2014/15
Group Demonstration Award (GDA) - Lactation Pens 2014/15
Postgrad Scholarship 2015/16
Finisher Performance 2015/16
Dairy Australia NCDEA 2009/10
Systems Management 2009/10
FRDC Workshops and Conferences 2009/10
FWPA LiDAR 2016/17
GRDC ACPFG 2013/14
MLA Off-farm Productivity 2015/16
Eating Quality 2012/13
RIRDC Chalkbrood Control 2011/12
Equine Amnionitis and Foetal Loss 2010/11
Fodder Crops 2013/14
Methane Recovery 2011/12
(a) Project clusters were scored according to their individual estimated leverage ratios. Ratios equal to 0
received a 0, ratios greater than 0 but less than or equal to 1.5 received a 1, ratios greater than 1.5 but
less than 3 received a 2, and ratios greater than 3 received a score of 3.
Table 11: Project Clusters Assessed as having a High Degree of Alignment with Communication
Theme 3 – Innovation, Industry Good
RDC name Name of Project Cluster Report Submitted (Year ended 30 June)
AECL Energy Usage and Efficiency 2014/15
Dairy Australia NCDEA 2009/10
FRDC Extension and Adoption 2012/13
FWPA LiDAR 2016/17
GRDC Soil Biology Initiative II 2014/15
Soil Biology (Themes 1-3) 2009/10
ACPFG 2013/14
HAL Apple - Breeding and Biotechnology 2012/13
Dried Fruit - Industry Development (grape, prune, apricot) 2010/11
MLA New Products 2015/16
Market Information 2015/16
RIRDC Child Safety 2011/12
Farm Safety Studies 2011/12
Page 26 of 53
SSF - Future Directions 2011/12
Wine Australia Grapes & Wine - Yeasts 2012/13
Table 12: Project Clusters Assessed as having a High Degree of Alignment with Communication
Theme 4 – Market Access, International Competitiveness
RDC name Name of Project Cluster Report Submitted (Year ended 30 June)
HAL Citrus - Biosecurity and Market Access 2009/10
Table Grapes - Biosecurity and Market Access 2010/11
MLA Market Access 2014/15
Product Integrity 2015/16
Market Access 2015/16
Livestock Exports 2015/16
RIRDC Fodder Crops 2013/14
Table 13: Project Clusters Assessed as having a High Degree of Alignment with Communication
Theme 5 – Value for Money, Efficiency(a)
RDC name Name of Project Cluster Report Submitted (Year ended 30 June)
Dairy Australia Cowtime Extension 2009/10
MAADI 2011/12
NCDEA 2009/10
Systems Management 2009/10
FRDC MPAs and Spatial 2009/10
FWPA Construction Practices 2013/14
Recycled Products 2013/14
GRDC National Mungbean Improvement Program 2010/11
Grain Storage 2009/10
Minor Use Chemicals 2010/11
HAL Mushroom - Communication and Extension 2010/11
Onion - Market and Supply Chain 2009/10
Persimmon - Irradiation for Market Access 2011/12
MLA Market Access 2015/16
Livestock Exports 2015/16
Eating Quality 2015/16
RIRDC Fodder Crops 2013/14
Simulation Exercise 2011/12
Tea Tree - SCCP 2010/11
SRA Harvesting Best Practice 2014/15
SRDC Disease Management 2010/11
(a) Project clusters were scored according to their individual BCRs. BCRs less than or equal to 1 received a
0, BCRs greater than 1 but less than or equal to 4 received a 1, BCRs greater than 4 but less than 12
received a 2, and BCRs greater than 12 received a score of 3.
Page 27 of 53
Table 14: Project Clusters Assessed as having a Moderate Degree(a) of Alignment with
Communication Theme 6 – Employment, Vibrant Communities
RDC name Name of Project Cluster Report Submitted (Year ended 30 June)
FRDC Workforce Development 2012/13
GRDC Partners in Grain 2011/12
Scholarships 2011/12
(a) No project clusters received a score of 3 (high degree of alignment) with communication Theme 6
(Employment). The project clusters identified in the table above received a score of 2 (medium
alignment).
Page 28 of 53
8. Issues Identified and Implications for Future Cross-RDC Impact Assessment
Lack of Continuing Commitment to the CRRDC Evaluation Approach
Over the current analysis period, 2010 to 2015, it is understood that some of the RDCs continued to
draw clusters for evaluation from the population of clusters earlier defined for the 2008 and 2010
CRRDC evaluation process, while others have not maintained consistent commitment to ex-post
evaluation including CBA. Evidence in Table 3 and Table 4 shows that the number of relevant, ex-
post economic evaluations carried out by the RDCs declined dramatically after 2013.
A partial explanation for this drop off in ex-post evaluation may be that the formal process to select
the random project clusters for each RDC to have evaluated was discontinued around 2011-2012
(originally undertaken by ACIL Tasman for the impact assessment reports published in 2008 and
2010). At this time (2011-12), the CRRDC commenced to revise the procedures and guidelines for
impact assessment. However, the drafting and feedback process during this revision process were
protracted and meant there was some uncertainty about economic evaluation requirements. Once
published, the new CRRDC Impact Assessment Procedures and Guidelines were not taken up by the
RDCs.
There has also been some structural change within the RDCs since 2012 with two of the RDCs
transitioning from statutory RDCs to industry owned.
Going forward, if the CRRDC intends to continue with regular cross-RDC impact assessment
reporting and wants the results to be comparable over time, it will require the cooperation of all the
RDCs and for them to commit to an ongoing standard evaluation process in order to achieve
meaningful, representative results across the whole of the RDC portfolio.
Inconsistent Evaluation Reporting
A major difficulty encountered during the data entry for the 288 individual project cluster evaluations
submitted for the 2010-2015 Cross-RDC Impact Assessment was the inconsistency of reporting
between RDCs and between consultancies engaged to carry out the evaluations.
Neglect of adhering to a standardised process
Some economic evaluation reports reported only the NPV for a project cluster and did not include
BCRs. The benefit-cost ratio was considered a key measure of the impact of the RDCs and has been
a key focus point of previous cross-RDC impact assessments.
As shown in Table 2, at least 31 project clusters were excluded from the population for the current
assessment as a result of missing data for the BCR and/or NPV at 30-years from the last year of
investment. If all data had been supplied this would have increased the number of evaluations.
Similarly, many evaluation reports failed to report against rolling time frames (i.e. did not include
results at intervals between the last year of investment and some final point in the future). This limited
the population available for an analysis of cross-RDC impact over time.
The minimum expectations for the reporting are covered in the CRRDC Impact Assessment
Guidelines. The guidelines state that summary measures of total project cluster results should be
presented, expressed as NPV, BCR, modified internal rate of return (MIRR) and IRR. The guidelines
also assert that, at a minimum, time-frames including current, 5, 10, 20 and 30 year NPV horizons will
be adopted. It is suggested that the guidelines should explicitly state reporting at 5,10,15, 20, 25 and
30-year time periods.
Page 29 of 53
Inconsistent estimation of investment costs
The current CRRDC Impact Assessment Guidelines state:
“The costs of adopting or implementing a new technology or other innovation may be
incorporated into the assessment either as an additional element in the estimation of
costs of the R&D project, or by deducting them from the net returns realised by
industry from adoption of the innovation.”
These alternative treatments of adoption and implementation costs in the guidelines means that there
is some inconsistency between the project cluster evaluations in terms of how the PVC has been
calculated. While not affecting the NPVs, this choice may have had an impact on the results for the
BCRs in the aggregate analyses.
It is suggested that the CRRDC revisit the Impact Assessment Guidelines and standardise the
preferred process for the treatment of additional costs for the estimation of the PVC for an evaluation.
Data on co-investment
The vast majority of project cluster evaluation reports included data for the total investment by all
partners in the project cluster and the particular RDC’s contribution to the investment in the cluster.
The co-investment portion of the total investment was generally only reported as ‘investment by
others/other investment’, lacking detail about the individual co-investment partners and their specific
investment contributions.
Sources of co-investment (e.g. industry or state Government departments) and specific leverage
ratios are of some interest to the Australian Government (and to the CRRDC) and may be useful in
decisions regarding allocation of future funding given the role of Government.
The CRRDC Impact Assessment Guidelines (Appendix 2 of the Guidelines) presents the CRRDC
Impact Assessment Reporting Template. The template specifically mentions that, for financial and in-
kind investments in R&D projects, the report should identify participating institutions, collaborators,
and other investors, and detail the year-on-year, cash and in-kind, contributions by each participant.
It appears that this process may be carried out for project level economic evaluations, but is not well
reported in evaluations at the project cluster level (more than one project). In some cases, too much
detail, particularly if a large number of other investors contributed or the cluster contains a large
number of projects, may be unnecessary and detract from the overall purpose of the project cluster
evaluation; however, particularly for project cluster evaluations where other Government investment is
involved or where more than one RDC has collaborated, this detail should be included in project
cluster economic evaluation reporting.
Loss of Corporate Memory
As significant and largely independent, dynamic organisations, each of the RDCs have experienced
varying degrees of personnel turnover in the past six years. As a result, there appears to be an issue
with loss of corporate memory regarding ex-post evaluation. Almost none of the current senior
management across all 15 RDCs were involved in the previous two cross-RDC impact assessments
(December 2008 and January 2010). The same applies to senior management at the CRRDC itself.
Consequently, the individual RDCs need constant reminding of previous and existing processes due
to personnel turnover which may inhibit effective cross-RDC impact assessment and the ability of
such assessments to be compared over time.
Lack of Emphasis on, and Limited Reporting of, Cross-RDC Collaborative
Investments
Of the 288 project cluster evaluations submitted and recorded by the evaluation team, only nine were
identified as being collaborative investments between two or more RDCs and only three of the nine
met the criteria to be included in the hard cut population for the 2010-2015 impact assessment.
Page 30 of 53
A workshop was held on July 22nd, 2016 with a selection of key RDC personnel and the CRRDC
evaluation working group. Feedback at the workshop indicated that there may have been other
collaborative investments but that these may not be clearly identified within the reports or that they
had not been formally evaluated.
In the future, it is suggested that cross-RDC collaboration needs to be assessed and reported
separately (as was done in the December 2008 CRRDC impact assessment report). Any future
evaluation framework needs to have protocols in place to ensure that cross-RDC collaborative
investments are evaluated outside of the populations of clusters and projects funded directly by each
RDC.
Page 31 of 53
9. Conclusion
The total nominal investment recorded for all 167 project clusters assessed (the hard cut population)
was estimated at $983 million, with the RDCs’ contributions to the total investment estimated at $432
million (across the nine RDCs represented in the hard cut population). The RDC contribution to the
investment represents approximately 19% of the total RD&E expenditure of the nine RDCs ($2.3
billion) over the six-year period.
A comparison of the estimated RDC RD&E expenditure in the 167 project clusters ($432 million)
against the total estimated investment in the clusters ($983 million) indicates an average leverage
ratio of approximately 1.27 to 1, meaning that for every $1 contributed by the RDCs, co-investment
partners contributed, on average, $1.27 to the RD&E investment.
The total PVB for the 167 project clusters evaluated and recorded across the 2010 to 2015 period
was estimated at $6.3 billion (in 2015/16 dollar terms) with an aggregate PVC of $1.4 billion, and a
NPV for the total ‘hard cut’ population of approximately $4.9 billion over a 30-year period.
To allow comparison with previous CRRDC impact assessments, the simple average BCR for this
population was estimated at 6.0 to 1 after 30-years. However, a simple average is often a flawed
measure as it is sensitive to any extreme values within the data set, therefore, a weighted average
was also estimated. The weighted average was estimated using the aggregate PVB ($6.3 billion) and
PVC ($1.4 billion) resulting in an estimated BCR of 4.5 to 1. That is, for every $1 dollar invested,
approximately $4.50 is returned after 30-years.
Several additional analyses were carried out on total population based on different sets of exclusion
criteria in order to test the robustness of the above results. In general, the additional results generated
were informative and were consistent with the results of the basic aggregate analysis of the 167
project cluster evaluations.
Information on environmental and social impacts for each project cluster evaluated was also recorded
in the data collection template. Qualitative data were summarised and analysed and the impacts were
then grouped into seven environmental impact categories and seven social impact categories based
on the frequency of the type of specific impacts identified. Of the 167 project cluster evaluations
assessed, 118 reported one or more environmental impacts, and 149 reported one or more social
impacts.
The cross-RDC impact assessment process for 2010-2015 identified some issues to be considered
for future assessments. These include a lack of continuing commitment to the evaluation process,
inconsistent evaluation reporting (this includes neglect of adherence to a standardised process and
ambiguous definitions within the guidelines), absence of specific data on co-investment, loss of
corporate memory, and deficient reporting of cross-RDC collaborative investments.
Overall, the results of the 2010-2015 Cross-RDC Impact Assessment are highly positive. The results
demonstrate that the investment by the RDCs as a whole has been delivering significant benefits to
Australia.
Page 32 of 53
Reference List
Australian Bureau of Statistics (2016), 5206.0 – Australian National Accounts: National Income,
Expenditure and Product, Mar 2016, Table 5. Expenditure on Gross Domestic Product (GDP),
Implicit price deflators
Council of Rural Research and Development Corporations (2016), About the Rural RDCs,
http://www.ruralrdc.com.au/about-the-rrdcs/#top, accessed: 18th July, 2016
Council of Rural Research and Development Corporations (2014), CRRDC Impact Assessment
Guidelines, Version 1 – May 2014, Canberra
Council of Rural Research and Development Corporations (2014), CRRDC Impact Assessment
Program Management Procedures, Version 1 – May 2014, Canberra
Council of Rural Research and Development Corporations Chairs (2010), Impact of Investment in
Research and Development by the Rural Research and Development Corporations - Year 2
Results, January 2010, Canberra
Council of Rural Research and Development Corporations Chairs (2008), Measuring economic,
environmental and social returns from Rural Research and Development Corporations’
investment, December 2008, Canberra
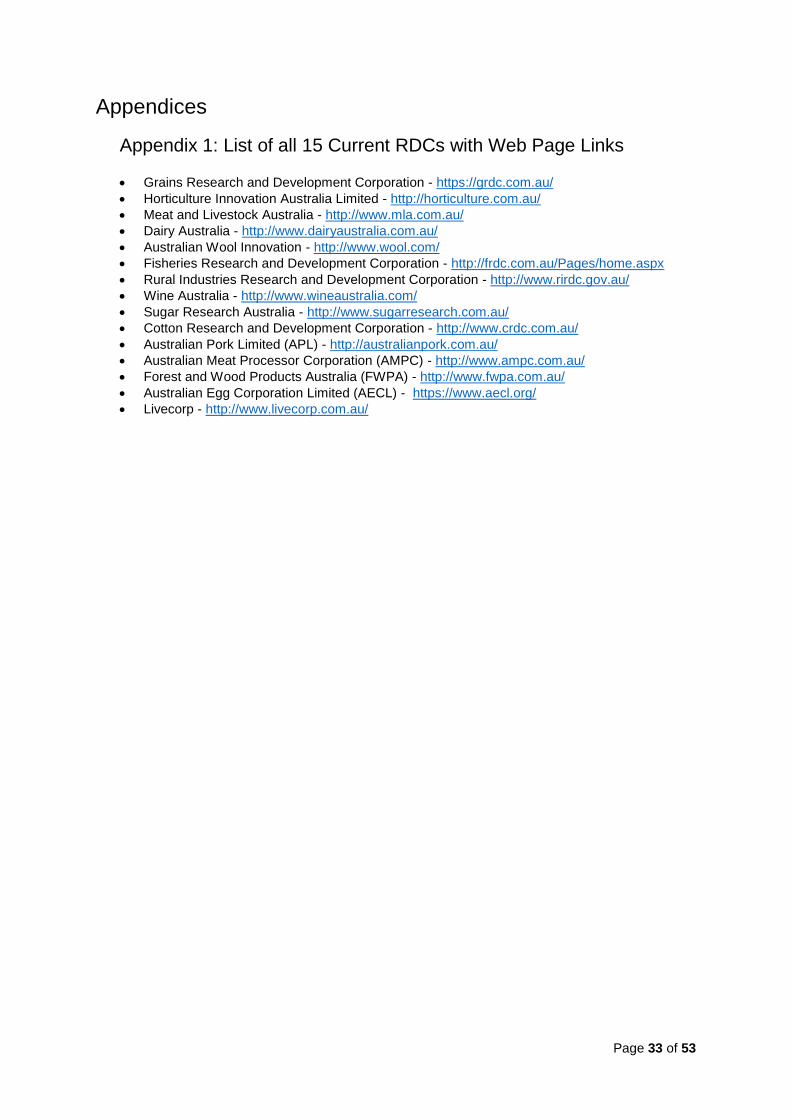
Page 33 of 53
Appendices
Appendix 1: List of all 15 Current RDCs with Web Page Links
Grains Research and Development Corporation - https://grdc.com.au/
Horticulture Innovation Australia Limited - http://horticulture.com.au/
Meat and Livestock Australia - http://www.mla.com.au/
Dairy Australia - http://www.dairyaustralia.com.au/
Australian Wool Innovation - http://www.wool.com/
Fisheries Research and Development Corporation - http://frdc.com.au/Pages/home.aspx
Rural Industries Research and Development Corporation - http://www.rirdc.gov.au/
Wine Australia - http://www.wineaustralia.com/
Sugar Research Australia - http://www.sugarresearch.com.au/
Cotton Research and Development Corporation - http://www.crdc.com.au/
Australian Pork Limited (APL) - http://australianpork.com.au/
Australian Meat Processor Corporation (AMPC) - http://www.ampc.com.au/
Forest and Wood Products Australia (FWPA) - http://www.fwpa.com.au/
Australian Egg Corporation Limited (AECL) - https://www.aecl.org/
Livecorp - http://www.livecorp.com.au/
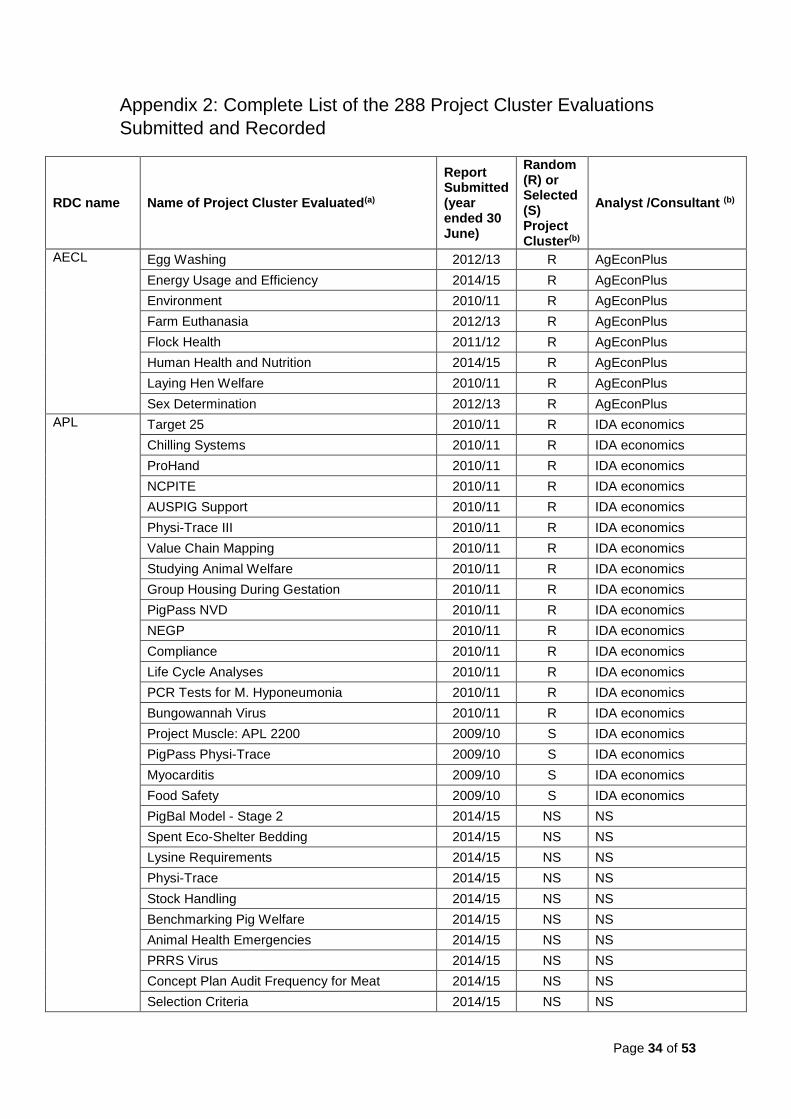
Page 34 of 53
Appendix 2: Complete List of the 288 Project Cluster Evaluations
Submitted and Recorded
RDC name Name of Project Cluster Evaluated(a)
Report Submitted (year ended 30 June)
Random (R) or Selected (S) Project Cluster(b)
Analyst /Consultant (b)
AECL Egg Washing 2012/13 R AgEconPlus
Energy Usage and Efficiency 2014/15 R AgEconPlus
Environment 2010/11 R AgEconPlus
Farm Euthanasia 2012/13 R AgEconPlus
Flock Health 2011/12 R AgEconPlus
Human Health and Nutrition 2014/15 R AgEconPlus
Laying Hen Welfare 2010/11 R AgEconPlus
Sex Determination 2012/13 R AgEconPlus
APL Target 25 2010/11 R IDA economics
Chilling Systems 2010/11 R IDA economics
ProHand 2010/11 R IDA economics
NCPITE 2010/11 R IDA economics
AUSPIG Support 2010/11 R IDA economics
Physi-Trace III 2010/11 R IDA economics
Value Chain Mapping 2010/11 R IDA economics
Studying Animal Welfare 2010/11 R IDA economics
Group Housing During Gestation 2010/11 R IDA economics
PigPass NVD 2010/11 R IDA economics
NEGP 2010/11 R IDA economics
Compliance 2010/11 R IDA economics
Life Cycle Analyses 2010/11 R IDA economics
PCR Tests for M. Hyponeumonia 2010/11 R IDA economics
Bungowannah Virus 2010/11 R IDA economics
Project Muscle: APL 2200 2009/10 S IDA economics
PigPass Physi-Trace 2009/10 S IDA economics
Myocarditis 2009/10 S IDA economics
Food Safety 2009/10 S IDA economics
PigBal Model - Stage 2 2014/15 NS NS
Spent Eco-Shelter Bedding 2014/15 NS NS
Lysine Requirements 2014/15 NS NS
Physi-Trace 2014/15 NS NS
Stock Handling 2014/15 NS NS
Benchmarking Pig Welfare 2014/15 NS NS
Animal Health Emergencies 2014/15 NS NS
PRRS Virus 2014/15 NS NS
Concept Plan Audit Frequency for Meat 2014/15 NS NS
Selection Criteria 2014/15 NS NS
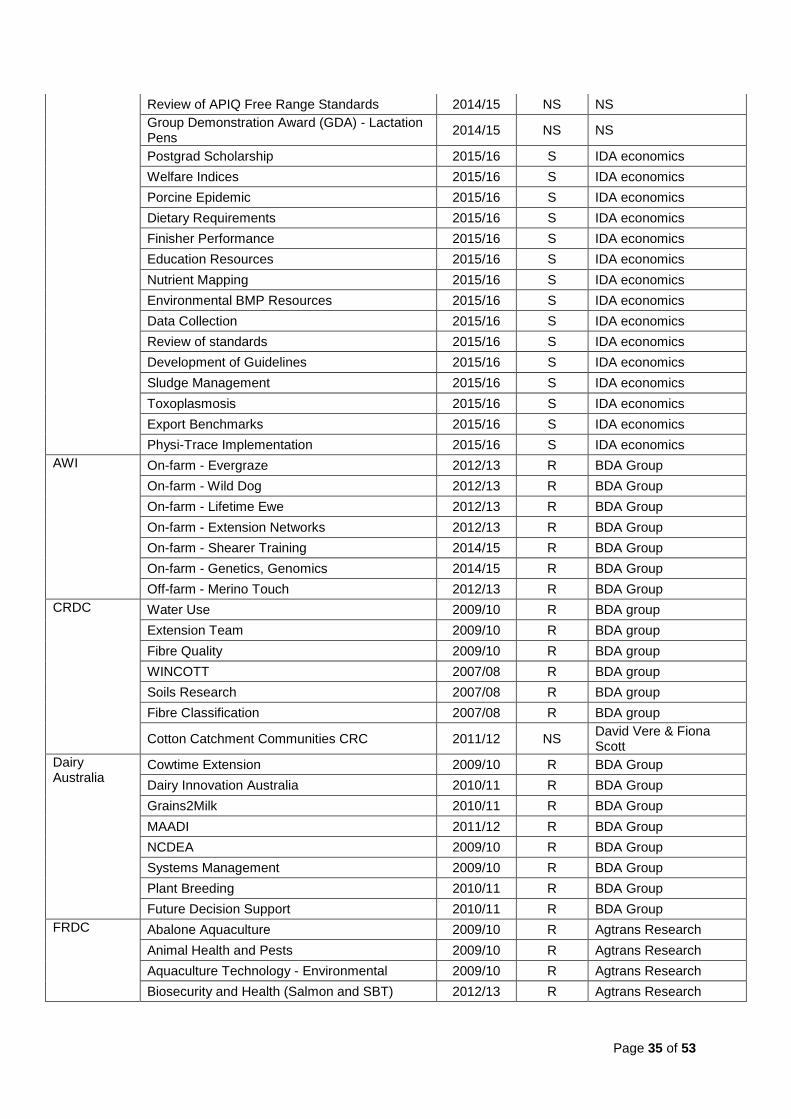
Page 35 of 53
Review of APIQ Free Range Standards 2014/15 NS NS
Group Demonstration Award (GDA) - Lactation Pens
2014/15 NS NS
Postgrad Scholarship 2015/16 S IDA economics
Welfare Indices 2015/16 S IDA economics
Porcine Epidemic 2015/16 S IDA economics
Dietary Requirements 2015/16 S IDA economics
Finisher Performance 2015/16 S IDA economics
Education Resources 2015/16 S IDA economics
Nutrient Mapping 2015/16 S IDA economics
Environmental BMP Resources 2015/16 S IDA economics
Data Collection 2015/16 S IDA economics
Review of standards 2015/16 S IDA economics
Development of Guidelines 2015/16 S IDA economics
Sludge Management 2015/16 S IDA economics
Toxoplasmosis 2015/16 S IDA economics
Export Benchmarks 2015/16 S IDA economics
Physi-Trace Implementation 2015/16 S IDA economics
AWI On-farm - Evergraze 2012/13 R BDA Group
On-farm - Wild Dog 2012/13 R BDA Group
On-farm - Lifetime Ewe 2012/13 R BDA Group
On-farm - Extension Networks 2012/13 R BDA Group
On-farm - Shearer Training 2014/15 R BDA Group
On-farm - Genetics, Genomics 2014/15 R BDA Group
Off-farm - Merino Touch 2012/13 R BDA Group
CRDC Water Use 2009/10 R BDA group
Extension Team 2009/10 R BDA group
Fibre Quality 2009/10 R BDA group
WINCOTT 2007/08 R BDA group
Soils Research 2007/08 R BDA group
Fibre Classification 2007/08 R BDA group
Cotton Catchment Communities CRC 2011/12 NS David Vere & Fiona Scott
Dairy Australia
Cowtime Extension 2009/10 R BDA Group
Dairy Innovation Australia 2010/11 R BDA Group
Grains2Milk 2010/11 R BDA Group
MAADI 2011/12 R BDA Group
NCDEA 2009/10 R BDA Group
Systems Management 2009/10 R BDA Group
Plant Breeding 2010/11 R BDA Group
Future Decision Support 2010/11 R BDA Group
FRDC Abalone Aquaculture 2009/10 R Agtrans Research
Animal Health and Pests 2009/10 R Agtrans Research
Aquaculture Technology - Environmental 2009/10 R Agtrans Research
Biosecurity and Health (Salmon and SBT) 2012/13 R Agtrans Research
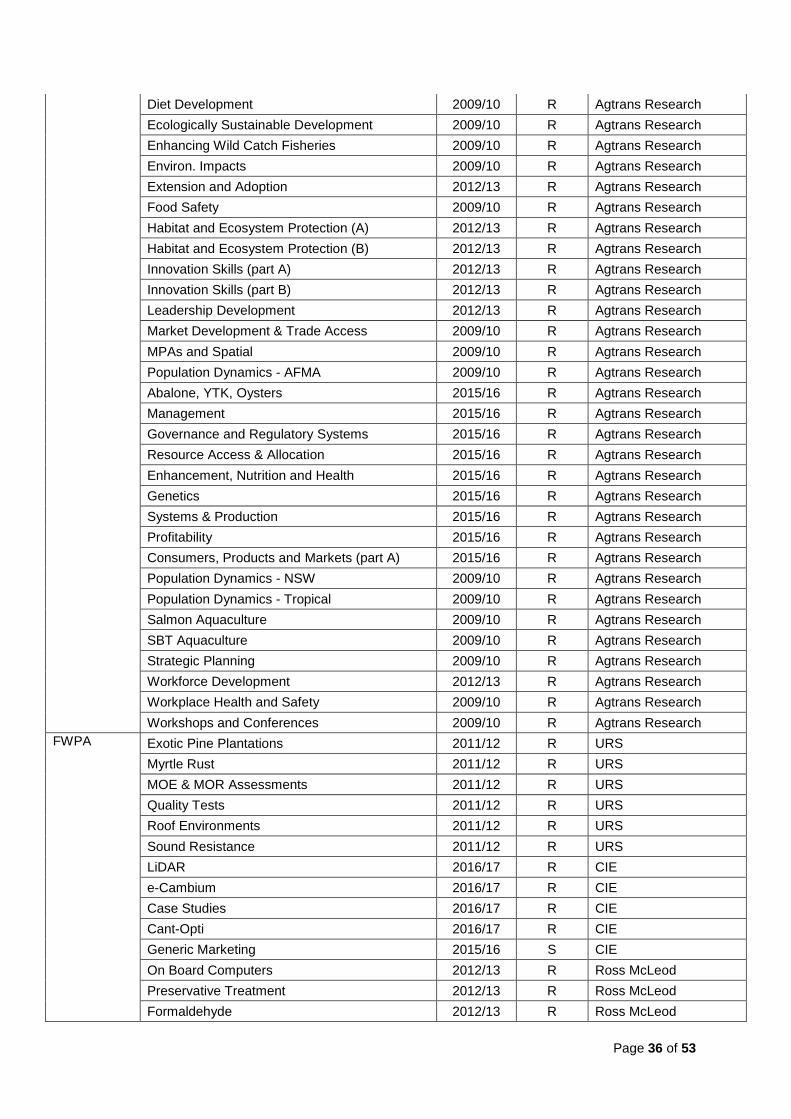
Page 36 of 53
Diet Development 2009/10 R Agtrans Research
Ecologically Sustainable Development 2009/10 R Agtrans Research
Enhancing Wild Catch Fisheries 2009/10 R Agtrans Research
Environ. Impacts 2009/10 R Agtrans Research
Extension and Adoption 2012/13 R Agtrans Research
Food Safety 2009/10 R Agtrans Research
Habitat and Ecosystem Protection (A) 2012/13 R Agtrans Research
Habitat and Ecosystem Protection (B) 2012/13 R Agtrans Research
Innovation Skills (part A) 2012/13 R Agtrans Research
Innovation Skills (part B) 2012/13 R Agtrans Research
Leadership Development 2012/13 R Agtrans Research
Market Development & Trade Access 2009/10 R Agtrans Research
MPAs and Spatial 2009/10 R Agtrans Research
Population Dynamics - AFMA 2009/10 R Agtrans Research
Abalone, YTK, Oysters 2015/16 R Agtrans Research
Management 2015/16 R Agtrans Research
Governance and Regulatory Systems 2015/16 R Agtrans Research
Resource Access & Allocation 2015/16 R Agtrans Research
Enhancement, Nutrition and Health 2015/16 R Agtrans Research
Genetics 2015/16 R Agtrans Research
Systems & Production 2015/16 R Agtrans Research
Profitability 2015/16 R Agtrans Research
Consumers, Products and Markets (part A) 2015/16 R Agtrans Research
Population Dynamics - NSW 2009/10 R Agtrans Research
Population Dynamics - Tropical 2009/10 R Agtrans Research
Salmon Aquaculture 2009/10 R Agtrans Research
SBT Aquaculture 2009/10 R Agtrans Research
Strategic Planning 2009/10 R Agtrans Research
Workforce Development 2012/13 R Agtrans Research
Workplace Health and Safety 2009/10 R Agtrans Research
Workshops and Conferences 2009/10 R Agtrans Research
FWPA Exotic Pine Plantations 2011/12 R URS
Myrtle Rust 2011/12 R URS
MOE & MOR Assessments 2011/12 R URS
Quality Tests 2011/12 R URS
Roof Environments 2011/12 R URS
Sound Resistance 2011/12 R URS
LiDAR 2016/17 R CIE
e-Cambium 2016/17 R CIE
Case Studies 2016/17 R CIE
Cant-Opti 2016/17 R CIE
Generic Marketing 2015/16 S CIE
On Board Computers 2012/13 R Ross McLeod
Preservative Treatment 2012/13 R Ross McLeod
Formaldehyde 2012/13 R Ross McLeod
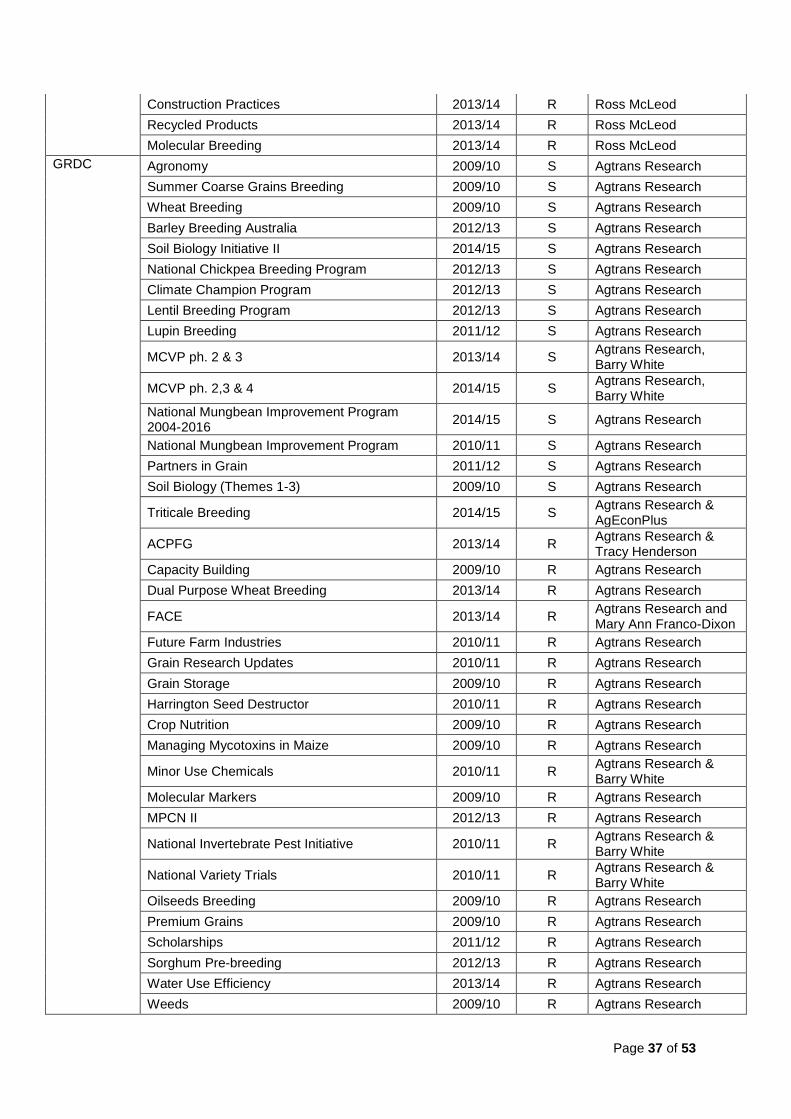
Page 37 of 53
Construction Practices 2013/14 R Ross McLeod
Recycled Products 2013/14 R Ross McLeod
Molecular Breeding 2013/14 R Ross McLeod
GRDC Agronomy 2009/10 S Agtrans Research
Summer Coarse Grains Breeding 2009/10 S Agtrans Research
Wheat Breeding 2009/10 S Agtrans Research
Barley Breeding Australia 2012/13 S Agtrans Research
Soil Biology Initiative II 2014/15 S Agtrans Research
National Chickpea Breeding Program 2012/13 S Agtrans Research
Climate Champion Program 2012/13 S Agtrans Research
Lentil Breeding Program 2012/13 S Agtrans Research
Lupin Breeding 2011/12 S Agtrans Research
MCVP ph. 2 & 3 2013/14 S Agtrans Research, Barry White
MCVP ph. 2,3 & 4 2014/15 S Agtrans Research, Barry White
National Mungbean Improvement Program 2004-2016
2014/15 S Agtrans Research
National Mungbean Improvement Program 2010/11 S Agtrans Research
Partners in Grain 2011/12 S Agtrans Research
Soil Biology (Themes 1-3) 2009/10 S Agtrans Research
Triticale Breeding 2014/15 S Agtrans Research & AgEconPlus
ACPFG 2013/14 R Agtrans Research & Tracy Henderson
Capacity Building 2009/10 R Agtrans Research
Dual Purpose Wheat Breeding 2013/14 R Agtrans Research
FACE 2013/14 R Agtrans Research and Mary Ann Franco-Dixon
Future Farm Industries 2010/11 R Agtrans Research
Grain Research Updates 2010/11 R Agtrans Research
Grain Storage 2009/10 R Agtrans Research
Harrington Seed Destructor 2010/11 R Agtrans Research
Crop Nutrition 2009/10 R Agtrans Research
Managing Mycotoxins in Maize 2009/10 R Agtrans Research
Minor Use Chemicals 2010/11 R Agtrans Research & Barry White
Molecular Markers 2009/10 R Agtrans Research
MPCN II 2012/13 R Agtrans Research
National Invertebrate Pest Initiative 2010/11 R Agtrans Research & Barry White
National Variety Trials 2010/11 R Agtrans Research & Barry White
Oilseeds Breeding 2009/10 R Agtrans Research
Premium Grains 2009/10 R Agtrans Research
Scholarships 2011/12 R Agtrans Research
Sorghum Pre-breeding 2012/13 R Agtrans Research
Water Use Efficiency 2013/14 R Agtrans Research
Weeds 2009/10 R Agtrans Research
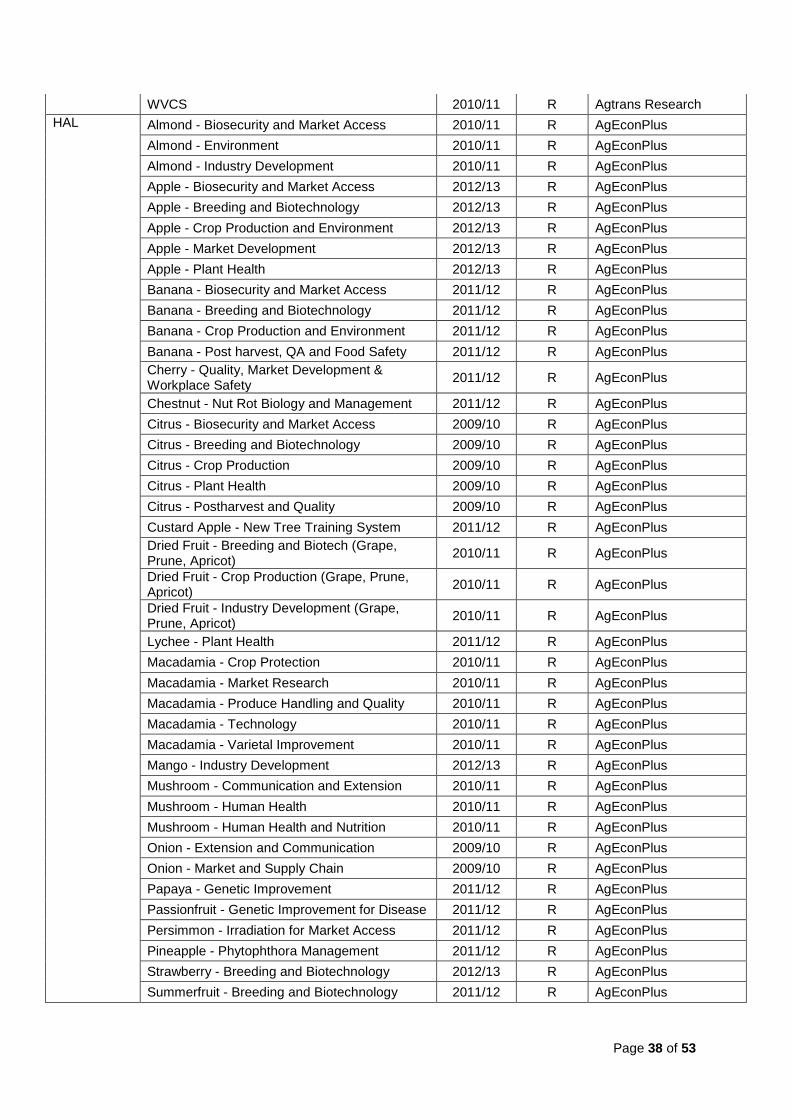
Page 38 of 53
WVCS 2010/11 R Agtrans Research
HAL Almond - Biosecurity and Market Access 2010/11 R AgEconPlus
Almond - Environment 2010/11 R AgEconPlus
Almond - Industry Development 2010/11 R AgEconPlus
Apple - Biosecurity and Market Access 2012/13 R AgEconPlus
Apple - Breeding and Biotechnology 2012/13 R AgEconPlus
Apple - Crop Production and Environment 2012/13 R AgEconPlus
Apple - Market Development 2012/13 R AgEconPlus
Apple - Plant Health 2012/13 R AgEconPlus
Banana - Biosecurity and Market Access 2011/12 R AgEconPlus
Banana - Breeding and Biotechnology 2011/12 R AgEconPlus
Banana - Crop Production and Environment 2011/12 R AgEconPlus
Banana - Post harvest, QA and Food Safety 2011/12 R AgEconPlus
Cherry - Quality, Market Development & Workplace Safety
2011/12 R AgEconPlus
Chestnut - Nut Rot Biology and Management 2011/12 R AgEconPlus
Citrus - Biosecurity and Market Access 2009/10 R AgEconPlus
Citrus - Breeding and Biotechnology 2009/10 R AgEconPlus
Citrus - Crop Production 2009/10 R AgEconPlus
Citrus - Plant Health 2009/10 R AgEconPlus
Citrus - Postharvest and Quality 2009/10 R AgEconPlus
Custard Apple - New Tree Training System 2011/12 R AgEconPlus
Dried Fruit - Breeding and Biotech (Grape, Prune, Apricot)
2010/11 R AgEconPlus
Dried Fruit - Crop Production (Grape, Prune, Apricot)
2010/11 R AgEconPlus
Dried Fruit - Industry Development (Grape, Prune, Apricot)
2010/11 R AgEconPlus
Lychee - Plant Health 2011/12 R AgEconPlus
Macadamia - Crop Protection 2010/11 R AgEconPlus
Macadamia - Market Research 2010/11 R AgEconPlus
Macadamia - Produce Handling and Quality 2010/11 R AgEconPlus
Macadamia - Technology 2010/11 R AgEconPlus
Macadamia - Varietal Improvement 2010/11 R AgEconPlus
Mango - Industry Development 2012/13 R AgEconPlus
Mushroom - Communication and Extension 2010/11 R AgEconPlus
Mushroom - Human Health 2010/11 R AgEconPlus
Mushroom - Human Health and Nutrition 2010/11 R AgEconPlus
Onion - Extension and Communication 2009/10 R AgEconPlus
Onion - Market and Supply Chain 2009/10 R AgEconPlus
Papaya - Genetic Improvement 2011/12 R AgEconPlus
Passionfruit - Genetic Improvement for Disease 2011/12 R AgEconPlus
Persimmon - Irradiation for Market Access 2011/12 R AgEconPlus
Pineapple - Phytophthora Management 2011/12 R AgEconPlus
Strawberry - Breeding and Biotechnology 2012/13 R AgEconPlus
Summerfruit - Breeding and Biotechnology 2011/12 R AgEconPlus
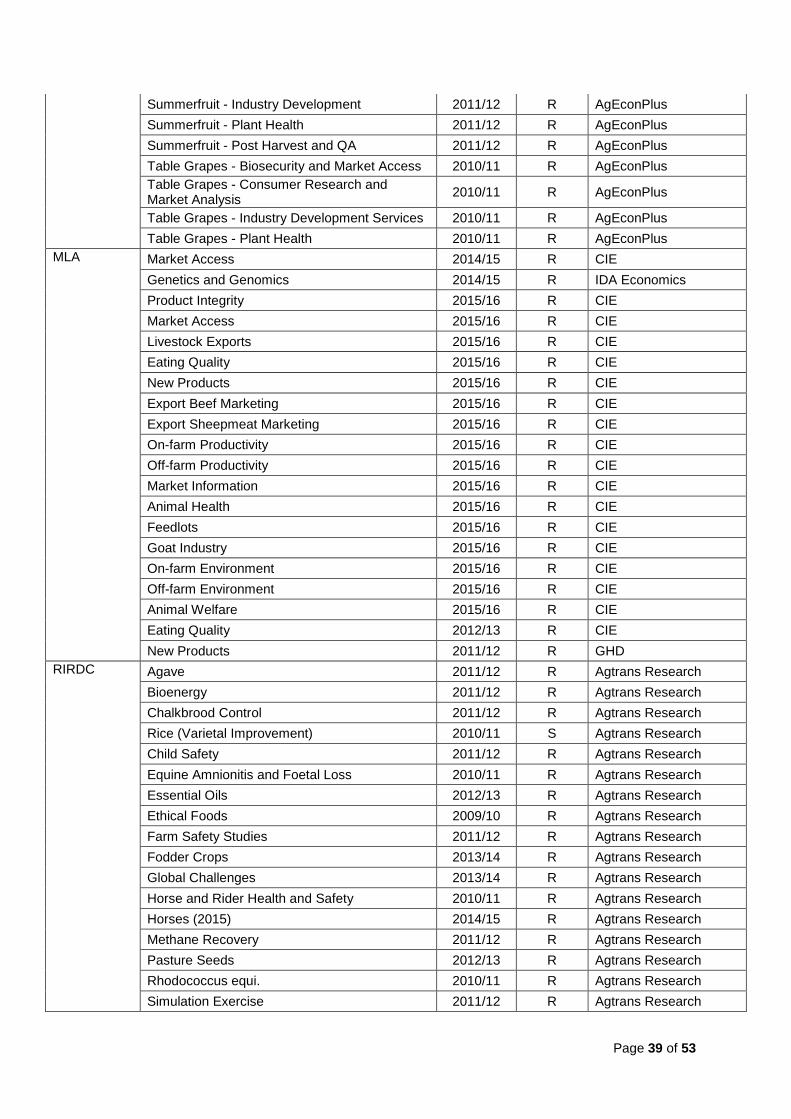
Page 39 of 53
Summerfruit - Industry Development 2011/12 R AgEconPlus
Summerfruit - Plant Health 2011/12 R AgEconPlus
Summerfruit - Post Harvest and QA 2011/12 R AgEconPlus
Table Grapes - Biosecurity and Market Access 2010/11 R AgEconPlus
Table Grapes - Consumer Research and Market Analysis
2010/11 R AgEconPlus
Table Grapes - Industry Development Services 2010/11 R AgEconPlus
Table Grapes - Plant Health 2010/11 R AgEconPlus
MLA Market Access 2014/15 R CIE
Genetics and Genomics 2014/15 R IDA Economics
Product Integrity 2015/16 R CIE
Market Access 2015/16 R CIE
Livestock Exports 2015/16 R CIE
Eating Quality 2015/16 R CIE
New Products 2015/16 R CIE
Export Beef Marketing 2015/16 R CIE
Export Sheepmeat Marketing 2015/16 R CIE
On-farm Productivity 2015/16 R CIE
Off-farm Productivity 2015/16 R CIE
Market Information 2015/16 R CIE
Animal Health 2015/16 R CIE
Feedlots 2015/16 R CIE
Goat Industry 2015/16 R CIE
On-farm Environment 2015/16 R CIE
Off-farm Environment 2015/16 R CIE
Animal Welfare 2015/16 R CIE
Eating Quality 2012/13 R CIE
New Products 2011/12 R GHD
RIRDC Agave 2011/12 R Agtrans Research
Bioenergy 2011/12 R Agtrans Research
Chalkbrood Control 2011/12 R Agtrans Research
Rice (Varietal Improvement) 2010/11 S Agtrans Research
Child Safety 2011/12 R Agtrans Research
Equine Amnionitis and Foetal Loss 2010/11 R Agtrans Research
Essential Oils 2012/13 R Agtrans Research
Ethical Foods 2009/10 R Agtrans Research
Farm Safety Studies 2011/12 R Agtrans Research
Fodder Crops 2013/14 R Agtrans Research
Global Challenges 2013/14 R Agtrans Research
Horse and Rider Health and Safety 2010/11 R Agtrans Research
Horses (2015) 2014/15 R Agtrans Research
Methane Recovery 2011/12 R Agtrans Research
Pasture Seeds 2012/13 R Agtrans Research
Rhodococcus equi. 2010/11 R Agtrans Research
Simulation Exercise 2011/12 R Agtrans Research
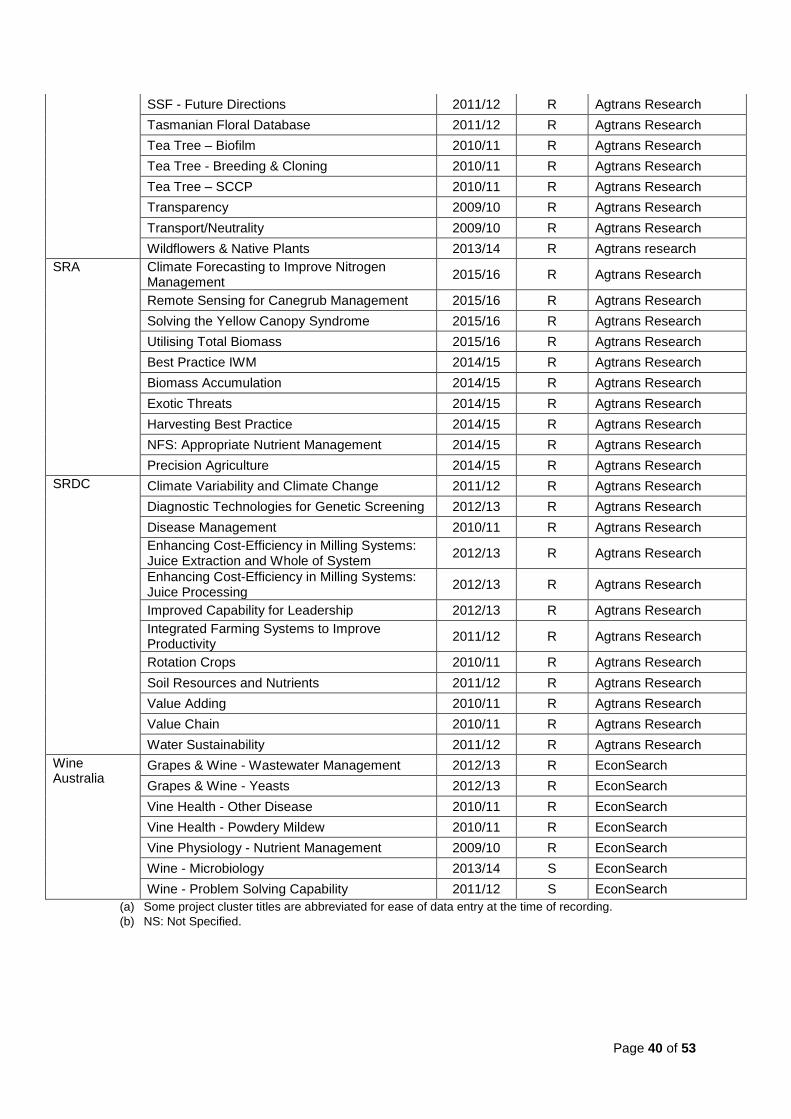
Page 40 of 53
SSF - Future Directions 2011/12 R Agtrans Research
Tasmanian Floral Database 2011/12 R Agtrans Research
Tea Tree – Biofilm 2010/11 R Agtrans Research
Tea Tree - Breeding & Cloning 2010/11 R Agtrans Research
Tea Tree – SCCP 2010/11 R Agtrans Research
Transparency 2009/10 R Agtrans Research
Transport/Neutrality 2009/10 R Agtrans Research
Wildflowers & Native Plants 2013/14 R Agtrans research
SRA Climate Forecasting to Improve Nitrogen Management
2015/16 R Agtrans Research
Remote Sensing for Canegrub Management 2015/16 R Agtrans Research
Solving the Yellow Canopy Syndrome 2015/16 R Agtrans Research
Utilising Total Biomass 2015/16 R Agtrans Research
Best Practice IWM 2014/15 R Agtrans Research
Biomass Accumulation 2014/15 R Agtrans Research
Exotic Threats 2014/15 R Agtrans Research
Harvesting Best Practice 2014/15 R Agtrans Research
NFS: Appropriate Nutrient Management 2014/15 R Agtrans Research
Precision Agriculture 2014/15 R Agtrans Research
SRDC Climate Variability and Climate Change 2011/12 R Agtrans Research
Diagnostic Technologies for Genetic Screening 2012/13 R Agtrans Research
Disease Management 2010/11 R Agtrans Research
Enhancing Cost-Efficiency in Milling Systems: Juice Extraction and Whole of System
2012/13 R Agtrans Research
Enhancing Cost-Efficiency in Milling Systems: Juice Processing
2012/13 R Agtrans Research
Improved Capability for Leadership 2012/13 R Agtrans Research
Integrated Farming Systems to Improve Productivity
2011/12 R Agtrans Research
Rotation Crops 2010/11 R Agtrans Research
Soil Resources and Nutrients 2011/12 R Agtrans Research
Value Adding 2010/11 R Agtrans Research
Value Chain 2010/11 R Agtrans Research
Water Sustainability 2011/12 R Agtrans Research
Wine Australia
Grapes & Wine - Wastewater Management 2012/13 R EconSearch
Grapes & Wine - Yeasts 2012/13 R EconSearch
Vine Health - Other Disease 2010/11 R EconSearch
Vine Health - Powdery Mildew 2010/11 R EconSearch
Vine Physiology - Nutrient Management 2009/10 R EconSearch
Wine - Microbiology 2013/14 S EconSearch
Wine - Problem Solving Capability 2011/12 S EconSearch
(a) Some project cluster titles are abbreviated for ease of data entry at the time of recording.
(b) NS: Not Specified.
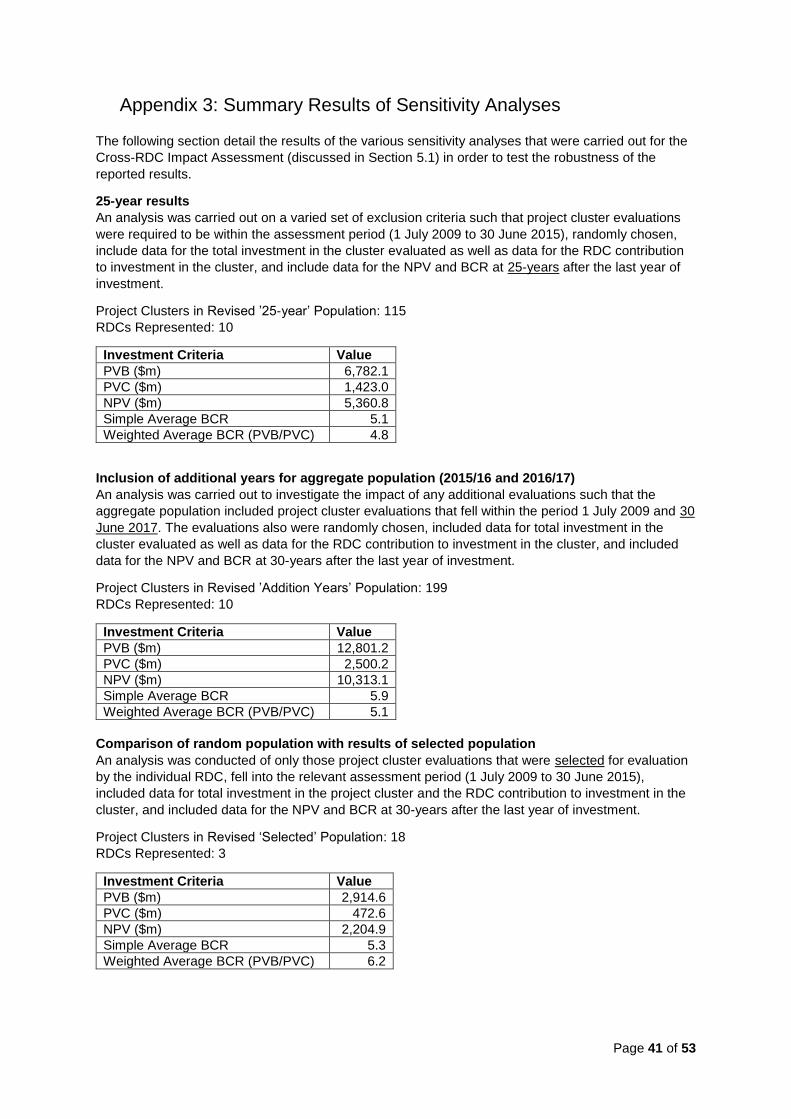
Page 41 of 53
Appendix 3: Summary Results of Sensitivity Analyses
The following section detail the results of the various sensitivity analyses that were carried out for the
Cross-RDC Impact Assessment (discussed in Section 5.1) in order to test the robustness of the
reported results.
25-year results
An analysis was carried out on a varied set of exclusion criteria such that project cluster evaluations
were required to be within the assessment period (1 July 2009 to 30 June 2015), randomly chosen,
include data for the total investment in the cluster evaluated as well as data for the RDC contribution
to investment in the cluster, and include data for the NPV and BCR at 25-years after the last year of
investment.
Project Clusters in Revised ’25-year’ Population: 115
RDCs Represented: 10
Investment Criteria Value
PVB ($m) 6,782.1
PVC ($m) 1,423.0
NPV ($m) 5,360.8
Simple Average BCR 5.1
Weighted Average BCR (PVB/PVC) 4.8
Inclusion of additional years for aggregate population (2015/16 and 2016/17)
An analysis was carried out to investigate the impact of any additional evaluations such that the
aggregate population included project cluster evaluations that fell within the period 1 July 2009 and 30
June 2017. The evaluations also were randomly chosen, included data for total investment in the
cluster evaluated as well as data for the RDC contribution to investment in the cluster, and included
data for the NPV and BCR at 30-years after the last year of investment.
Project Clusters in Revised ’Addition Years’ Population: 199
RDCs Represented: 10
Investment Criteria Value
PVB ($m) 12,801.2
PVC ($m) 2,500.2
NPV ($m) 10,313.1
Simple Average BCR 5.9
Weighted Average BCR (PVB/PVC) 5.1
Comparison of random population with results of selected population
An analysis was conducted of only those project cluster evaluations that were selected for evaluation
by the individual RDC, fell into the relevant assessment period (1 July 2009 to 30 June 2015),
included data for total investment in the project cluster and the RDC contribution to investment in the
cluster, and included data for the NPV and BCR at 30-years after the last year of investment.
Project Clusters in Revised ‘Selected’ Population: 18
RDCs Represented: 3
Investment Criteria Value
PVB ($m) 2,914.6
PVC ($m) 472.6
NPV ($m) 2,204.9
Simple Average BCR 5.3
Weighted Average BCR (PVB/PVC) 6.2
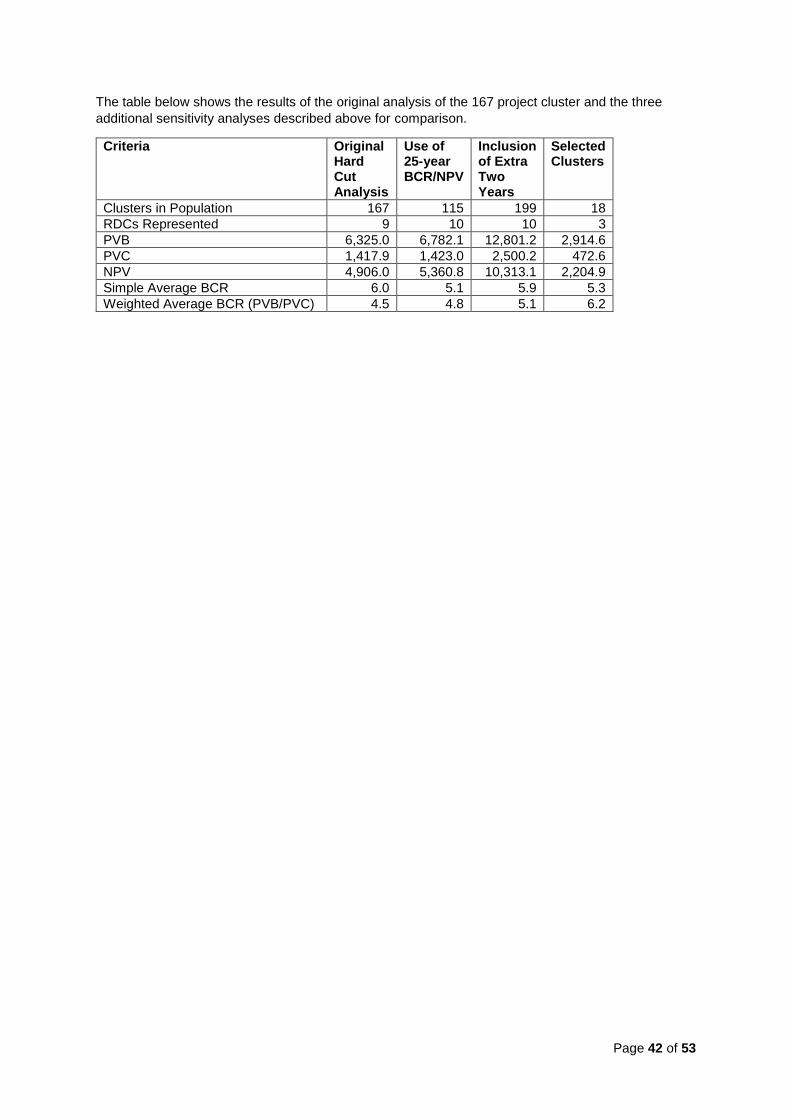
Page 42 of 53
The table below shows the results of the original analysis of the 167 project cluster and the three
additional sensitivity analyses described above for comparison.
Criteria Original Hard Cut Analysis
Use of 25-year BCR/NPV
Inclusion of Extra Two Years
Selected Clusters
Clusters in Population 167 115 199 18
RDCs Represented 9 10 10 3
PVB 6,325.0 6,782.1 12,801.2 2,914.6
PVC 1,417.9 1,423.0 2,500.2 472.6
NPV 4,906.0 5,360.8 10,313.1 2,204.9
Simple Average BCR 6.0 5.1 5.9 5.3
Weighted Average BCR (PVB/PVC) 4.5 4.8 5.1 6.2
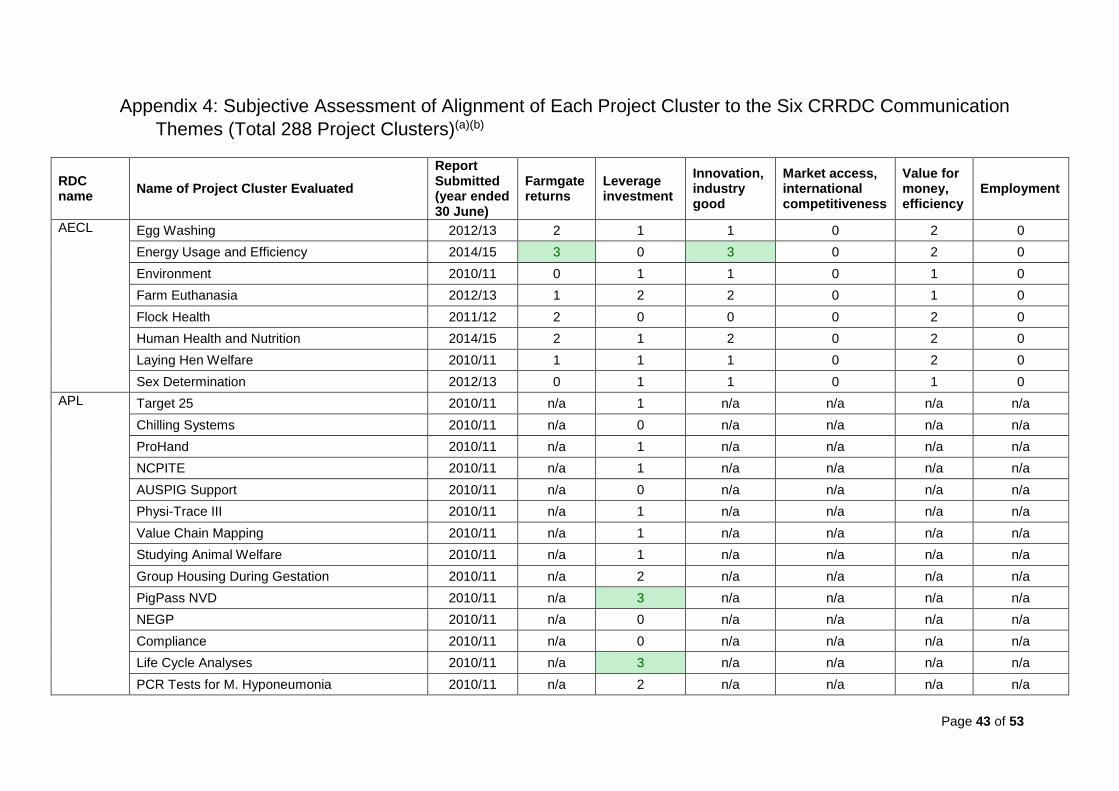
Page 43 of 53
Appendix 4: Subjective Assessment of Alignment of Each Project Cluster to the Six CRRDC Communication
Themes (Total 288 Project Clusters)(a)(b)
RDC name
Name of Project Cluster Evaluated
Report Submitted (year ended 30 June)
Farmgate returns
Leverage investment
Innovation, industry good
Market access, international competitiveness
Value for money, efficiency
Employment
AECL Egg Washing 2012/13 2 1 1 0 2 0
Energy Usage and Efficiency 2014/15 3 0 3 0 2 0
Environment 2010/11 0 1 1 0 1 0
Farm Euthanasia 2012/13 1 2 2 0 1 0
Flock Health 2011/12 2 0 0 0 2 0
Human Health and Nutrition 2014/15 2 1 2 0 2 0
Laying Hen Welfare 2010/11 1 1 1 0 2 0
Sex Determination 2012/13 0 1 1 0 1 0
APL Target 25 2010/11 n/a 1 n/a n/a n/a n/a
Chilling Systems 2010/11 n/a 0 n/a n/a n/a n/a
ProHand 2010/11 n/a 1 n/a n/a n/a n/a
NCPITE 2010/11 n/a 1 n/a n/a n/a n/a
AUSPIG Support 2010/11 n/a 0 n/a n/a n/a n/a
Physi-Trace III 2010/11 n/a 1 n/a n/a n/a n/a
Value Chain Mapping 2010/11 n/a 1 n/a n/a n/a n/a
Studying Animal Welfare 2010/11 n/a 1 n/a n/a n/a n/a
Group Housing During Gestation 2010/11 n/a 2 n/a n/a n/a n/a
PigPass NVD 2010/11 n/a 3 n/a n/a n/a n/a
NEGP 2010/11 n/a 0 n/a n/a n/a n/a
Compliance 2010/11 n/a 0 n/a n/a n/a n/a
Life Cycle Analyses 2010/11 n/a 3 n/a n/a n/a n/a
PCR Tests for M. Hyponeumonia 2010/11 n/a 2 n/a n/a n/a n/a
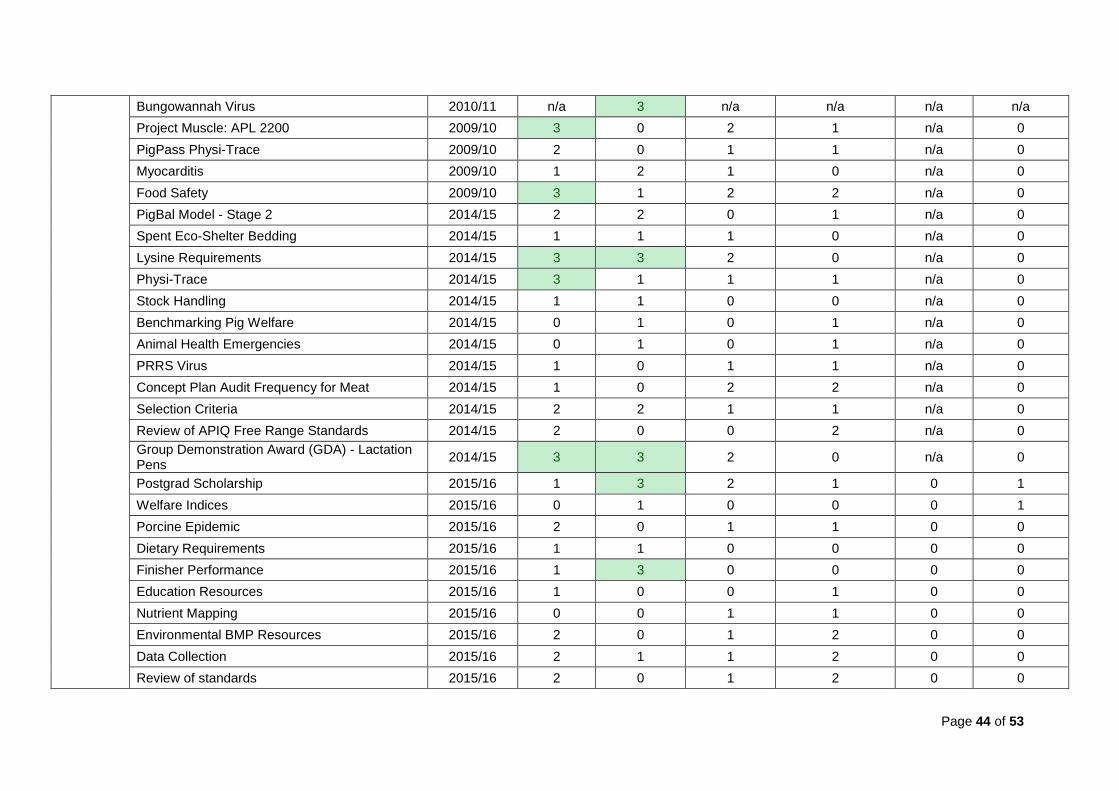
Page 44 of 53
Bungowannah Virus 2010/11 n/a 3 n/a n/a n/a n/a
Project Muscle: APL 2200 2009/10 3 0 2 1 n/a 0
PigPass Physi-Trace 2009/10 2 0 1 1 n/a 0
Myocarditis 2009/10 1 2 1 0 n/a 0
Food Safety 2009/10 3 1 2 2 n/a 0
PigBal Model - Stage 2 2014/15 2 2 0 1 n/a 0
Spent Eco-Shelter Bedding 2014/15 1 1 1 0 n/a 0
Lysine Requirements 2014/15 3 3 2 0 n/a 0
Physi-Trace 2014/15 3 1 1 1 n/a 0
Stock Handling 2014/15 1 1 0 0 n/a 0
Benchmarking Pig Welfare 2014/15 0 1 0 1 n/a 0
Animal Health Emergencies 2014/15 0 1 0 1 n/a 0
PRRS Virus 2014/15 1 0 1 1 n/a 0
Concept Plan Audit Frequency for Meat 2014/15 1 0 2 2 n/a 0
Selection Criteria 2014/15 2 2 1 1 n/a 0
Review of APIQ Free Range Standards 2014/15 2 0 0 2 n/a 0
Group Demonstration Award (GDA) - Lactation Pens
2014/15 3 3 2 0 n/a 0
Postgrad Scholarship 2015/16 1 3 2 1 0 1
Welfare Indices 2015/16 0 1 0 0 0 1
Porcine Epidemic 2015/16 2 0 1 1 0 0
Dietary Requirements 2015/16 1 1 0 0 0 0
Finisher Performance 2015/16 1 3 0 0 0 0
Education Resources 2015/16 1 0 0 1 0 0
Nutrient Mapping 2015/16 0 0 1 1 0 0
Environmental BMP Resources 2015/16 2 0 1 2 0 0
Data Collection 2015/16 2 1 1 2 0 0
Review of standards 2015/16 2 0 1 2 0 0
Page 45 of 53
Development of Guidelines 2015/16 2 1 1 2 0 0
Sludge Management 2015/16 2 0 1 0 0 0
Toxoplasmosis 2015/16 0 0 1 1 0 0
Export Benchmarks 2015/16 1 1 2 2 0 0
Physi-Trace Implementation 2015/16 1 0 1 2 0 0
AWI On-farm - Evergraze 2012/13 3 2 1 0 n/a 0
On-farm - Wild Dog 2012/13 2 2 1 1 n/a 1
On-farm - Lifetime Ewe 2012/13 3 1 1 0 n/a 0
On-farm - Extension Networks 2012/13 1 2 2 0 n/a 0
On-farm - Shearer Training 2014/15 2 0 1 0 n/a 0
On-farm - Genetics, Genomics 2014/15 0 0 1 0 n/a 0
Off-farm - Merino Touch 2012/13 2 0 1 0 n/a 0
CRDC Water Use 2009/10 1 2 1 0 n/a 0
Extension Team 2009/10 1 2 2 0 n/a 1
Fibre Quality 2009/10 0 1 1 1 n/a 0
WINCOTT 2007/08 0 0 2 0 n/a 1
Soils Research 2007/08 3 0 2 1 n/a 0
Fibre Classification 2007/08 n/a 0 n/a n/a n/a n/a
Cotton Catchment Communities CRC 2011/12 n/a 0 n/a n/a n/a n/a
Dairy Australia
Cowtime Extension 2009/10 1 1 1 0 3 0
Dairy Innovation Australia 2010/11 1 2 2 0 1 0
Grains2Milk 2010/11 1 1 1 0 1 0
MAADI 2011/12 3 2 2 0 3 0
NCDEA 2009/10 0 3 3 0 3 0
Systems Management 2009/10 2 3 2 1 3 0
Plant Breeding 2010/11 0 0 2 0 0 0
Future Decision Support 2010/11 0 0 1 0 0 0
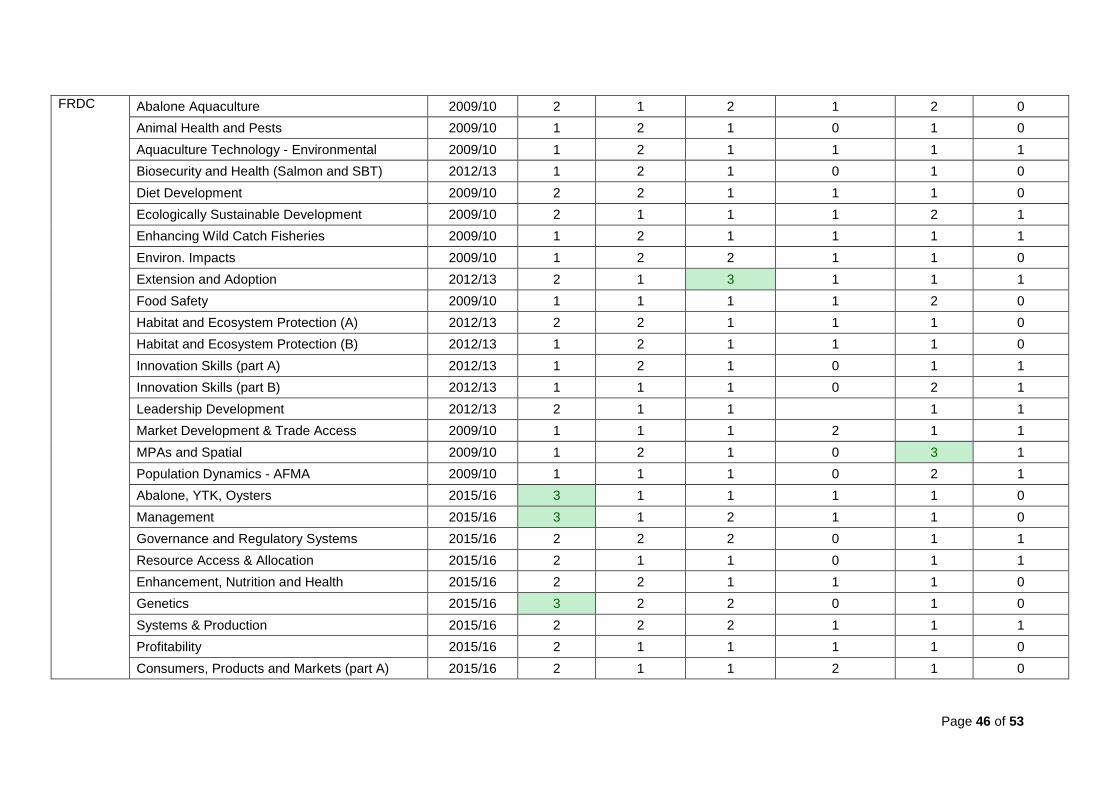
Page 46 of 53
FRDC Abalone Aquaculture 2009/10 2 1 2 1 2 0
Animal Health and Pests 2009/10 1 2 1 0 1 0
Aquaculture Technology - Environmental 2009/10 1 2 1 1 1 1
Biosecurity and Health (Salmon and SBT) 2012/13 1 2 1 0 1 0
Diet Development 2009/10 2 2 1 1 1 0
Ecologically Sustainable Development 2009/10 2 1 1 1 2 1
Enhancing Wild Catch Fisheries 2009/10 1 2 1 1 1 1
Environ. Impacts 2009/10 1 2 2 1 1 0
Extension and Adoption 2012/13 2 1 3 1 1 1
Food Safety 2009/10 1 1 1 1 2 0
Habitat and Ecosystem Protection (A) 2012/13 2 2 1 1 1 0
Habitat and Ecosystem Protection (B) 2012/13 1 2 1 1 1 0
Innovation Skills (part A) 2012/13 1 2 1 0 1 1
Innovation Skills (part B) 2012/13 1 1 1 0 2 1
Leadership Development 2012/13 2 1 1 1 1
Market Development & Trade Access 2009/10 1 1 1 2 1 1
MPAs and Spatial 2009/10 1 2 1 0 3 1
Population Dynamics - AFMA 2009/10 1 1 1 0 2 1
Abalone, YTK, Oysters 2015/16 3 1 1 1 1 0
Management 2015/16 3 1 2 1 1 0
Governance and Regulatory Systems 2015/16 2 2 2 0 1 1
Resource Access & Allocation 2015/16 2 1 1 0 1 1
Enhancement, Nutrition and Health 2015/16 2 2 1 1 1 0
Genetics 2015/16 3 2 2 0 1 0
Systems & Production 2015/16 2 2 2 1 1 1
Profitability 2015/16 2 1 1 1 1 0
Consumers, Products and Markets (part A) 2015/16 2 1 1 2 1 0
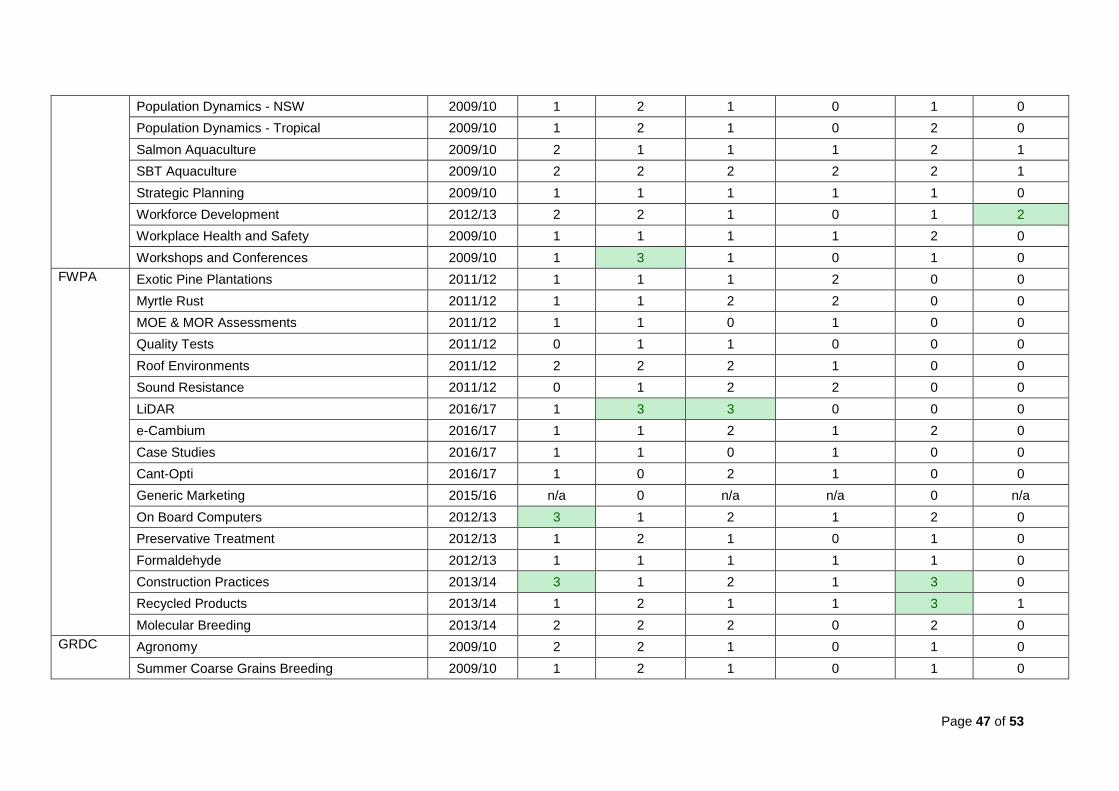
Page 47 of 53
Population Dynamics - NSW 2009/10 1 2 1 0 1 0
Population Dynamics - Tropical 2009/10 1 2 1 0 2 0
Salmon Aquaculture 2009/10 2 1 1 1 2 1
SBT Aquaculture 2009/10 2 2 2 2 2 1
Strategic Planning 2009/10 1 1 1 1 1 0
Workforce Development 2012/13 2 2 1 0 1 2
Workplace Health and Safety 2009/10 1 1 1 1 2 0
Workshops and Conferences 2009/10 1 3 1 0 1 0
FWPA Exotic Pine Plantations 2011/12 1 1 1 2 0 0
Myrtle Rust 2011/12 1 1 2 2 0 0
MOE & MOR Assessments 2011/12 1 1 0 1 0 0
Quality Tests 2011/12 0 1 1 0 0 0
Roof Environments 2011/12 2 2 2 1 0 0
Sound Resistance 2011/12 0 1 2 2 0 0
LiDAR 2016/17 1 3 3 0 0 0
e-Cambium 2016/17 1 1 2 1 2 0
Case Studies 2016/17 1 1 0 1 0 0
Cant-Opti 2016/17 1 0 2 1 0 0
Generic Marketing 2015/16 n/a 0 n/a n/a 0 n/a
On Board Computers 2012/13 3 1 2 1 2 0
Preservative Treatment 2012/13 1 2 1 0 1 0
Formaldehyde 2012/13 1 1 1 1 1 0
Construction Practices 2013/14 3 1 2 1 3 0
Recycled Products 2013/14 1 2 1 1 3 1
Molecular Breeding 2013/14 2 2 2 0 2 0
GRDC Agronomy 2009/10 2 2 1 0 1 0
Summer Coarse Grains Breeding 2009/10 1 2 1 0 1 0
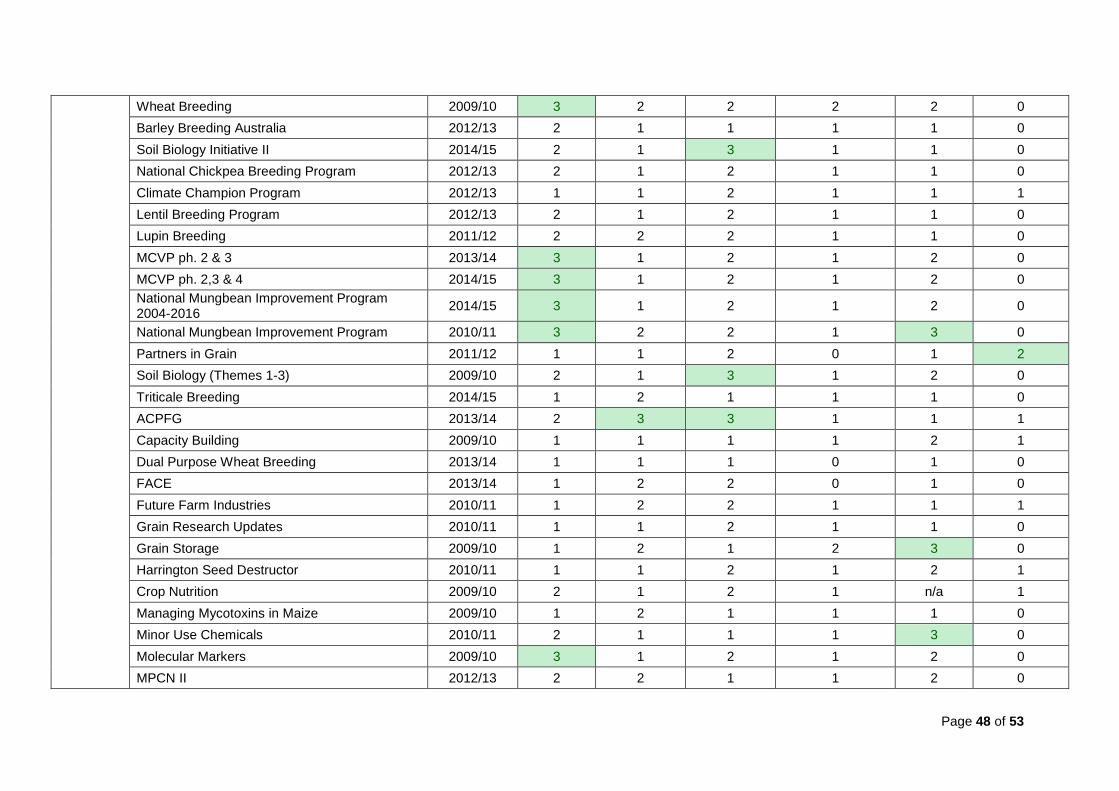
Page 48 of 53
Wheat Breeding 2009/10 3 2 2 2 2 0
Barley Breeding Australia 2012/13 2 1 1 1 1 0
Soil Biology Initiative II 2014/15 2 1 3 1 1 0
National Chickpea Breeding Program 2012/13 2 1 2 1 1 0
Climate Champion Program 2012/13 1 1 2 1 1 1
Lentil Breeding Program 2012/13 2 1 2 1 1 0
Lupin Breeding 2011/12 2 2 2 1 1 0
MCVP ph. 2 & 3 2013/14 3 1 2 1 2 0
MCVP ph. 2,3 & 4 2014/15 3 1 2 1 2 0
National Mungbean Improvement Program 2004-2016
2014/15 3 1 2 1 2 0
National Mungbean Improvement Program 2010/11 3 2 2 1 3 0
Partners in Grain 2011/12 1 1 2 0 1 2
Soil Biology (Themes 1-3) 2009/10 2 1 3 1 2 0
Triticale Breeding 2014/15 1 2 1 1 1 0
ACPFG 2013/14 2 3 3 1 1 1
Capacity Building 2009/10 1 1 1 1 2 1
Dual Purpose Wheat Breeding 2013/14 1 1 1 0 1 0
FACE 2013/14 1 2 2 0 1 0
Future Farm Industries 2010/11 1 2 2 1 1 1
Grain Research Updates 2010/11 1 1 2 1 1 0
Grain Storage 2009/10 1 2 1 2 3 0
Harrington Seed Destructor 2010/11 1 1 2 1 2 1
Crop Nutrition 2009/10 2 1 2 1 n/a 1
Managing Mycotoxins in Maize 2009/10 1 2 1 1 1 0
Minor Use Chemicals 2010/11 2 1 1 1 3 0
Molecular Markers 2009/10 3 1 2 1 2 0
MPCN II 2012/13 2 2 1 1 2 0
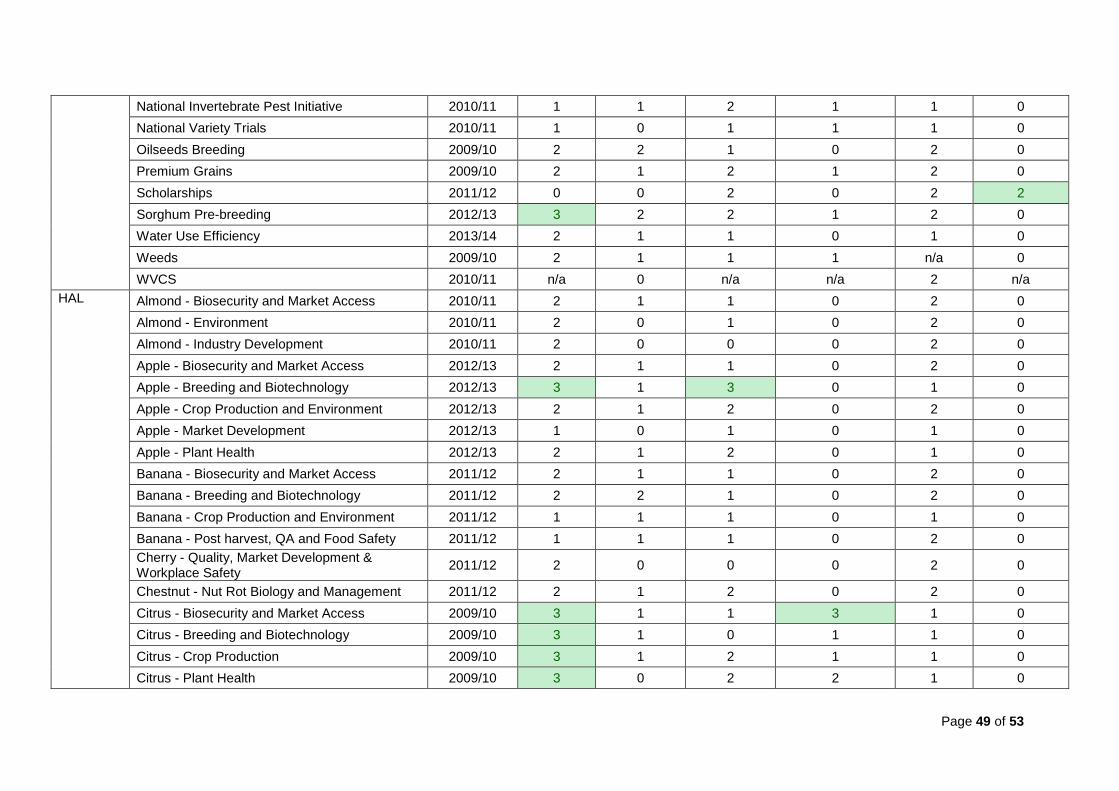
Page 49 of 53
National Invertebrate Pest Initiative 2010/11 1 1 2 1 1 0
National Variety Trials 2010/11 1 0 1 1 1 0
Oilseeds Breeding 2009/10 2 2 1 0 2 0
Premium Grains 2009/10 2 1 2 1 2 0
Scholarships 2011/12 0 0 2 0 2 2
Sorghum Pre-breeding 2012/13 3 2 2 1 2 0
Water Use Efficiency 2013/14 2 1 1 0 1 0
Weeds 2009/10 2 1 1 1 n/a 0
WVCS 2010/11 n/a 0 n/a n/a 2 n/a
HAL Almond - Biosecurity and Market Access 2010/11 2 1 1 0 2 0
Almond - Environment 2010/11 2 0 1 0 2 0
Almond - Industry Development 2010/11 2 0 0 0 2 0
Apple - Biosecurity and Market Access 2012/13 2 1 1 0 2 0
Apple - Breeding and Biotechnology 2012/13 3 1 3 0 1 0
Apple - Crop Production and Environment 2012/13 2 1 2 0 2 0
Apple - Market Development 2012/13 1 0 1 0 1 0
Apple - Plant Health 2012/13 2 1 2 0 1 0
Banana - Biosecurity and Market Access 2011/12 2 1 1 0 2 0
Banana - Breeding and Biotechnology 2011/12 2 2 1 0 2 0
Banana - Crop Production and Environment 2011/12 1 1 1 0 1 0
Banana - Post harvest, QA and Food Safety 2011/12 1 1 1 0 2 0
Cherry - Quality, Market Development & Workplace Safety
2011/12 2 0 0 0 2 0
Chestnut - Nut Rot Biology and Management 2011/12 2 1 2 0 2 0
Citrus - Biosecurity and Market Access 2009/10 3 1 1 3 1 0
Citrus - Breeding and Biotechnology 2009/10 3 1 0 1 1 0
Citrus - Crop Production 2009/10 3 1 2 1 1 0
Citrus - Plant Health 2009/10 3 0 2 2 1 0
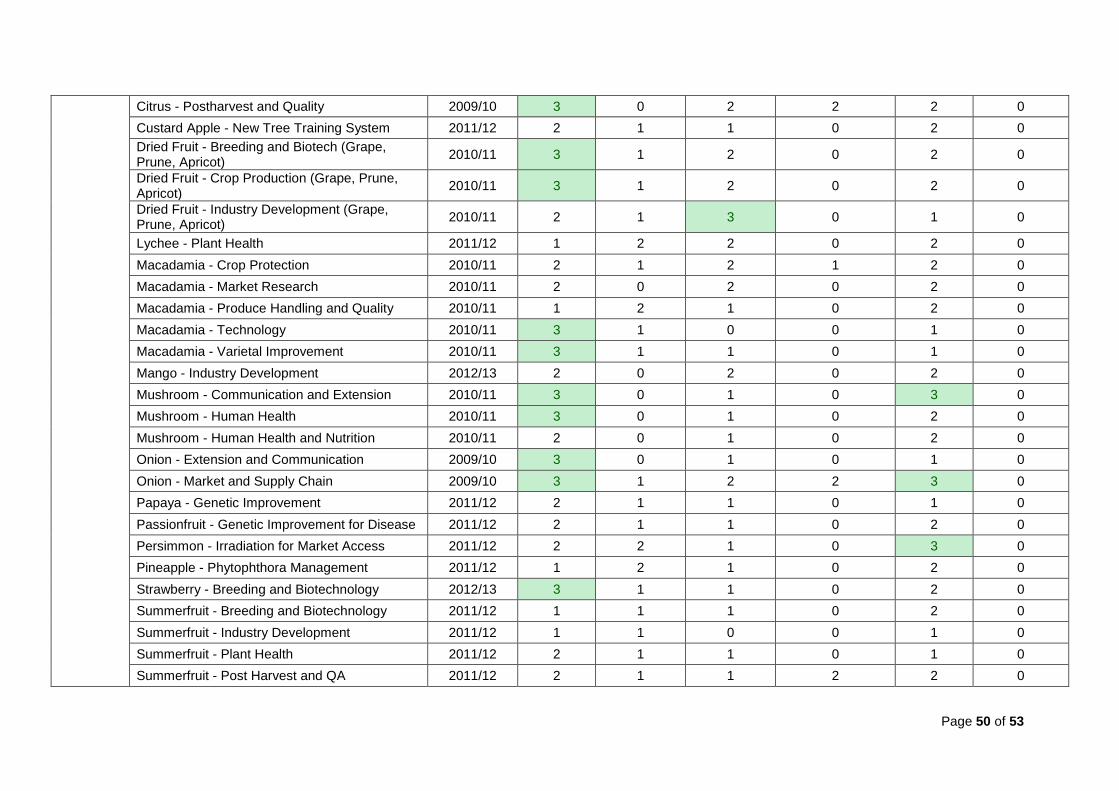
Page 50 of 53
Citrus - Postharvest and Quality 2009/10 3 0 2 2 2 0
Custard Apple - New Tree Training System 2011/12 2 1 1 0 2 0
Dried Fruit - Breeding and Biotech (Grape, Prune, Apricot)
2010/11 3 1 2 0 2 0
Dried Fruit - Crop Production (Grape, Prune, Apricot)
2010/11 3 1 2 0 2 0
Dried Fruit - Industry Development (Grape, Prune, Apricot)
2010/11 2 1 3 0 1 0
Lychee - Plant Health 2011/12 1 2 2 0 2 0
Macadamia - Crop Protection 2010/11 2 1 2 1 2 0
Macadamia - Market Research 2010/11 2 0 2 0 2 0
Macadamia - Produce Handling and Quality 2010/11 1 2 1 0 2 0
Macadamia - Technology 2010/11 3 1 0 0 1 0
Macadamia - Varietal Improvement 2010/11 3 1 1 0 1 0
Mango - Industry Development 2012/13 2 0 2 0 2 0
Mushroom - Communication and Extension 2010/11 3 0 1 0 3 0
Mushroom - Human Health 2010/11 3 0 1 0 2 0
Mushroom - Human Health and Nutrition 2010/11 2 0 1 0 2 0
Onion - Extension and Communication 2009/10 3 0 1 0 1 0
Onion - Market and Supply Chain 2009/10 3 1 2 2 3 0
Papaya - Genetic Improvement 2011/12 2 1 1 0 1 0
Passionfruit - Genetic Improvement for Disease 2011/12 2 1 1 0 2 0
Persimmon - Irradiation for Market Access 2011/12 2 2 1 0 3 0
Pineapple - Phytophthora Management 2011/12 1 2 1 0 2 0
Strawberry - Breeding and Biotechnology 2012/13 3 1 1 0 2 0
Summerfruit - Breeding and Biotechnology 2011/12 1 1 1 0 2 0
Summerfruit - Industry Development 2011/12 1 1 0 0 1 0
Summerfruit - Plant Health 2011/12 2 1 1 0 1 0
Summerfruit - Post Harvest and QA 2011/12 2 1 1 2 2 0
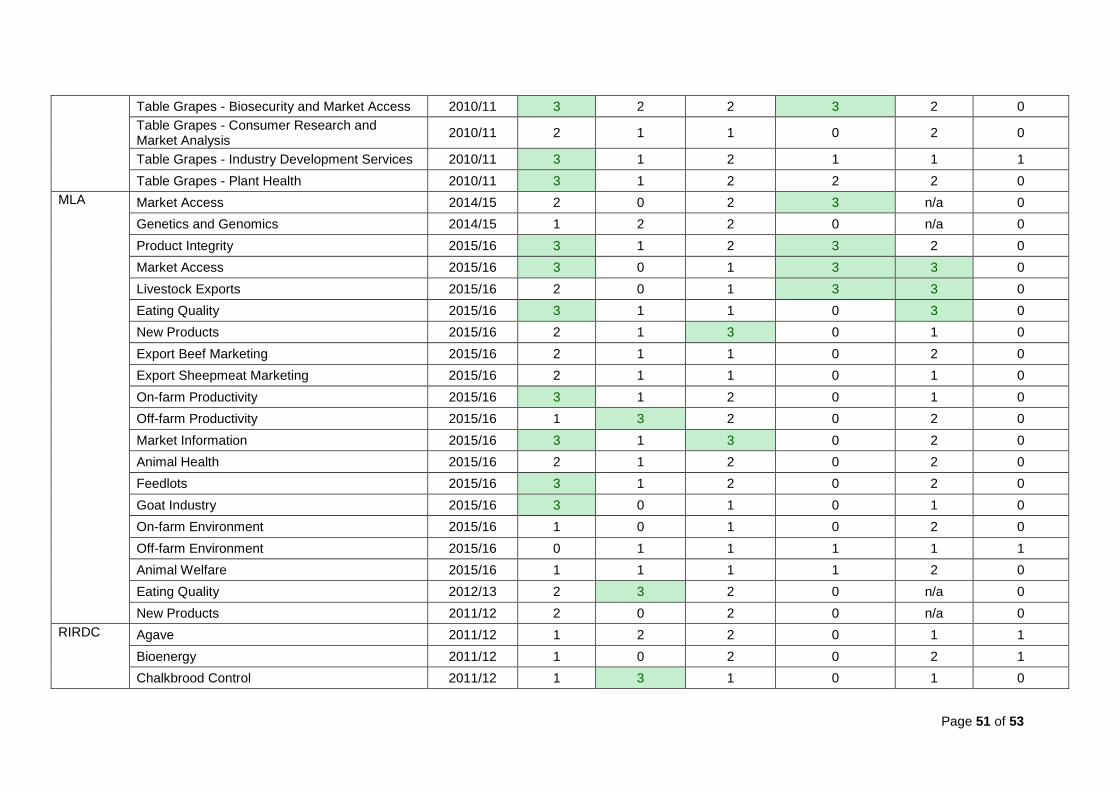
Page 51 of 53
Table Grapes - Biosecurity and Market Access 2010/11 3 2 2 3 2 0
Table Grapes - Consumer Research and Market Analysis
2010/11 2 1 1 0 2 0
Table Grapes - Industry Development Services 2010/11 3 1 2 1 1 1
Table Grapes - Plant Health 2010/11 3 1 2 2 2 0
MLA Market Access 2014/15 2 0 2 3 n/a 0
Genetics and Genomics 2014/15 1 2 2 0 n/a 0
Product Integrity 2015/16 3 1 2 3 2 0
Market Access 2015/16 3 0 1 3 3 0
Livestock Exports 2015/16 2 0 1 3 3 0
Eating Quality 2015/16 3 1 1 0 3 0
New Products 2015/16 2 1 3 0 1 0
Export Beef Marketing 2015/16 2 1 1 0 2 0
Export Sheepmeat Marketing 2015/16 2 1 1 0 1 0
On-farm Productivity 2015/16 3 1 2 0 1 0
Off-farm Productivity 2015/16 1 3 2 0 2 0
Market Information 2015/16 3 1 3 0 2 0
Animal Health 2015/16 2 1 2 0 2 0
Feedlots 2015/16 3 1 2 0 2 0
Goat Industry 2015/16 3 0 1 0 1 0
On-farm Environment 2015/16 1 0 1 0 2 0
Off-farm Environment 2015/16 0 1 1 1 1 1
Animal Welfare 2015/16 1 1 1 1 2 0
Eating Quality 2012/13 2 3 2 0 n/a 0
New Products 2011/12 2 0 2 0 n/a 0
RIRDC Agave 2011/12 1 2 2 0 1 1
Bioenergy 2011/12 1 0 2 0 2 1
Chalkbrood Control 2011/12 1 3 1 0 1 0
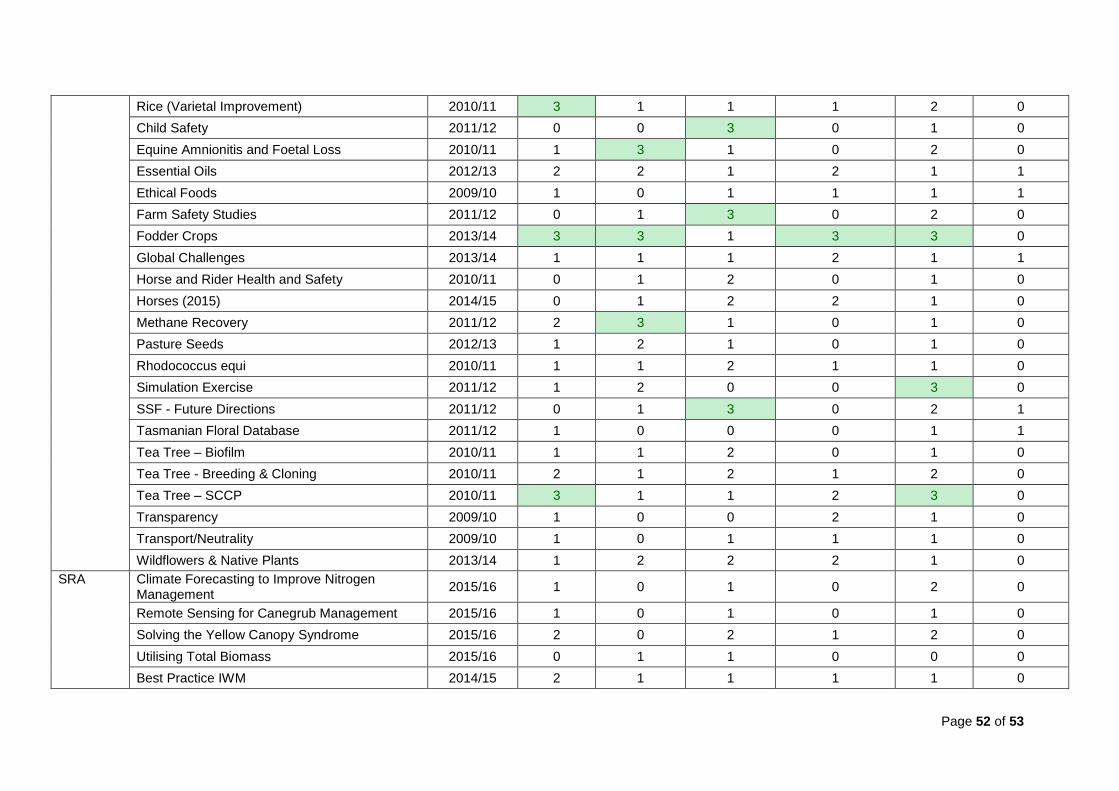
Page 52 of 53
Rice (Varietal Improvement) 2010/11 3 1 1 1 2 0
Child Safety 2011/12 0 0 3 0 1 0
Equine Amnionitis and Foetal Loss 2010/11 1 3 1 0 2 0
Essential Oils 2012/13 2 2 1 2 1 1
Ethical Foods 2009/10 1 0 1 1 1 1
Farm Safety Studies 2011/12 0 1 3 0 2 0
Fodder Crops 2013/14 3 3 1 3 3 0
Global Challenges 2013/14 1 1 1 2 1 1
Horse and Rider Health and Safety 2010/11 0 1 2 0 1 0
Horses (2015) 2014/15 0 1 2 2 1 0
Methane Recovery 2011/12 2 3 1 0 1 0
Pasture Seeds 2012/13 1 2 1 0 1 0
Rhodococcus equi 2010/11 1 1 2 1 1 0
Simulation Exercise 2011/12 1 2 0 0 3 0
SSF - Future Directions 2011/12 0 1 3 0 2 1
Tasmanian Floral Database 2011/12 1 0 0 0 1 1
Tea Tree – Biofilm 2010/11 1 1 2 0 1 0
Tea Tree - Breeding & Cloning 2010/11 2 1 2 1 2 0
Tea Tree – SCCP 2010/11 3 1 1 2 3 0
Transparency 2009/10 1 0 0 2 1 0
Transport/Neutrality 2009/10 1 0 1 1 1 0
Wildflowers & Native Plants 2013/14 1 2 2 2 1 0
SRA Climate Forecasting to Improve Nitrogen Management
2015/16 1 0 1 0 2 0
Remote Sensing for Canegrub Management 2015/16 1 0 1 0 1 0
Solving the Yellow Canopy Syndrome 2015/16 2 0 2 1 2 0
Utilising Total Biomass 2015/16 0 1 1 0 0 0
Best Practice IWM 2014/15 2 1 1 1 1 0
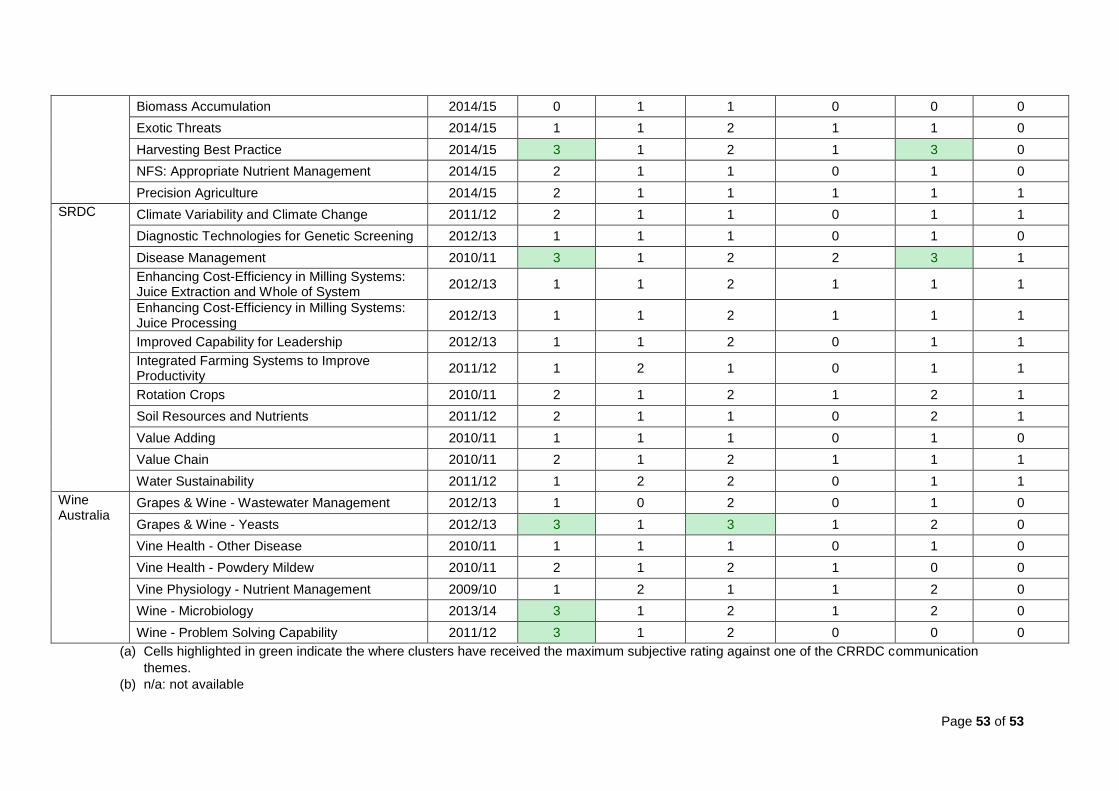
Page 53 of 53
Biomass Accumulation 2014/15 0 1 1 0 0 0
Exotic Threats 2014/15 1 1 2 1 1 0
Harvesting Best Practice 2014/15 3 1 2 1 3 0
NFS: Appropriate Nutrient Management 2014/15 2 1 1 0 1 0
Precision Agriculture 2014/15 2 1 1 1 1 1
SRDC Climate Variability and Climate Change 2011/12 2 1 1 0 1 1
Diagnostic Technologies for Genetic Screening 2012/13 1 1 1 0 1 0
Disease Management 2010/11 3 1 2 2 3 1
Enhancing Cost-Efficiency in Milling Systems: Juice Extraction and Whole of System
2012/13 1 1 2 1 1 1
Enhancing Cost-Efficiency in Milling Systems: Juice Processing
2012/13 1 1 2 1 1 1
Improved Capability for Leadership 2012/13 1 1 2 0 1 1
Integrated Farming Systems to Improve Productivity
2011/12 1 2 1 0 1 1
Rotation Crops 2010/11 2 1 2 1 2 1
Soil Resources and Nutrients 2011/12 2 1 1 0 2 1
Value Adding 2010/11 1 1 1 0 1 0
Value Chain 2010/11 2 1 2 1 1 1
Water Sustainability 2011/12 1 2 2 0 1 1
Wine Australia
Grapes & Wine - Wastewater Management 2012/13 1 0 2 0 1 0
Grapes & Wine - Yeasts 2012/13 3 1 3 1 2 0
Vine Health - Other Disease 2010/11 1 1 1 0 1 0
Vine Health - Powdery Mildew 2010/11 2 1 2 1 0 0
Vine Physiology - Nutrient Management 2009/10 1 2 1 1 2 0
Wine - Microbiology 2013/14 3 1 2 1 2 0
Wine - Problem Solving Capability 2011/12 3 1 2 0 0 0
(a) Cells highlighted in green indicate the where clusters have received the maximum subjective rating against one of the CRRDC communication
themes.
(b) n/a: not available