Embed Size (px)
Citation preview

Florida International UniversityFIU Digital Commons
FIU Electronic Theses and Dissertations University Graduate School
9-27-2012
Cross-Layer Design for Energy Efficiency on DataCenter NetworkTosmate CheocherngngarnFlorida International University, [email protected]
DOI: 10.25148/etd.FI12111301Follow this and additional works at: http://digitalcommons.fiu.edu/etd
This work is brought to you for free and open access by the University Graduate School at FIU Digital Commons. It has been accepted for inclusion inFIU Electronic Theses and Dissertations by an authorized administrator of FIU Digital Commons. For more information, please contact [email protected].
Recommended CitationCheocherngngarn, Tosmate, "Cross-Layer Design for Energy Efficiency on Data Center Network" (2012). FIU Electronic Theses andDissertations. 730.http://digitalcommons.fiu.edu/etd/730

FLORIDA INTERNATIONAL UNIVERSITY
Miami, Florida
CROSS-LAYER DESIGN FOR ENERGY EFFICIENCY ON DATA CENTER
NETWORK
A dissertation submitted in partial fulfillment of the
requirements for the degree of
DOCTOR OF PHILOSOPHY
in
ELECTRICAL ENGINEERING
by
Tosmate Cheocherngngarn
2012

ii
To: Dean Amir Mirmiran College of Engineering and Computing This dissertation, written by Tosmate Cheocherngngarn, and entitled Cross-Layer Design for Energy Efficiency on Data Center Network, having been approved in respect to style and intellectual content, is referred to you for judgment. We have read this dissertation and recommend that it be approved.
________________________________________
Jeffrey Fan
________________________________________ Hai Deng
________________________________________
Deng Pan, Co-Major Professor
________________________________________ Jean Andrian, Co-Major Professor
Date of Defense: September 27, 2012 The dissertation of Tosmate Cheocherngngarn is approved.
________________________________________ Dean Amir Mirmiran
College of Engineering and Computing
________________________________________ Dean Lakshmi N. Reddi
University Graduate School
Florida International University, 2012

iii
© Copyright 2012 by Tosmate Cheocherngngarn
All rights reserved.

iv
DEDICATION
This dissertation is dedicated to my wonderful families and lovely friends:
particularly to my grandmom, Boonnom Ruttanavisanon, for her kind support; and to my
family, Tospol, Pathummas and Pajaree Cheocherngngarn, for huge encouragement.

v
ACKNOWLEDGMENTS
I would like to express my earnest gratitude, through this acknowledgement, to
many generous and inspiring people in my life who have been extremely supportive and
encouraging throughout my doctoral studies:
To my advisor, Dr. Jean Andrian, for his generous supports and encouragement in
supervising my studies. I am most thankful for his kindness, guidance, mentorship and
inspiration to me.
To my co-major advisor, Dr. Deng Pan, for his constant support and guidance. He
provided me with encouragement and working environment that allowed me to smoothly
finish my dissertation.
To my committee members, Dr. Jeffrey Fan, and Dr. Hai Deng, for their
thoughtful guidelines and criticisms in advising my research.
Special thanks go to Dr. Giri Narasimhan for his assistances in providing financial
aid through Graduate Assistantships, Dr. Kang Yen for his constant support was essential
for me to complete the program, Ms. Amy Knightly for her angel stewardship for all
situations. In addition, I would also like to acknowledge Dr. Khokiat Kengskool for his
support before I got admitted and ever since.
I am also indebted to the past and current members of the wireless
communications research laboratory for all of our insightful technical conversations and
for making my time as a Ph.D. student an enjoyable one. Also thanks are due to
unmatched Maria, Pat, Ana and all administrative staff at the Department of Electrical
and Computer Engineering for their helpful and friendly help and support.

vi
To my former mentors in Thailand, Dr. Kittiphan Techakittiroj, Dr. Kong
Kritayakirana and Dr. Sudhiporn Patumtaewapibal, for their advice and encouragement in
pushing me to purse the PhD degree.
To my beloved Ruttanavisanon family (Grandpa, Papa Rat, Mama Lee+, Auntie
Jin, Uncle Roj, Aunt Tip, P’Joy, P’Beer, P’Bad, N’Pup and etc), The Cheocherngngarns
(Granny, Auntie Jim+, Auntie Mooh), Auntie Aoi, Auntie Dang, Mama Jane, and lovely
OSK120 friends in Thailand, for always are supportive and encouraging with their best
wishes. I want to recognize them as a major source of inspiration and encouragement for
pursuing higher education.
Last but not least, I deeply appreciate the financial supports of Graduate
Assistantships and DEA fellowship from University Graduate School. The financial
supports have greatly helped me in completing my PhD studies.

vii
ABSTRACT OF DISSERTATION
CROSS-LAYER DESIGN FOR ENERGY EFFICIENCY ON DATA CENTER
NETWORK
by
Tosmate Cheocherngngarn
Florida International University, 2012
Miami, Florida
Professor Deng Pan, Co-Major Professor
Professor Jean Andrian, Co-Major Professor
Energy efficient infrastructures or green IT (Information Technology) has
recently become a hot button issue for most corporations as they strive to eliminate every
inefficiency from their enterprise IT systems and save capital and operational costs.
Vendors of IT equipment now compete on the power efficiency of their devices, and as a
result, many of the new equipment models are indeed more energy efficient. Various
studies have estimated the annual electricity consumed by networking devices in the U.S.
in the range of 6 - 20 Terra Watt hours.
Our research has the potential to make promising solutions solve those overuses
of electricity. An energy-efficient data center network architecture which can lower the
energy consumption is highly desirable. First of all, we propose a fair bandwidth
allocation algorithm which adopts the max-min fairness principle to decrease power
consumption on packet switch fabric interconnects. Specifically, we include power aware
computing factor as high power dissipation in switches which is fast turning into a key
problem, owing to increasing line speeds and decreasing chip sizes. This efficient

viii
algorithm could not only reduce the convergence iterations but also lower processing
power utilization on switch fabric interconnects. Secondly, we study the deployment
strategy of multicast switches in hybrid mode in energy-aware data center network: a
case of famous Fat-tree topology. The objective is to find the best location to deploy
multicast switch not only to achieve optimal bandwidth utilization but also minimize
power consumption. We show that it is possible to easily achieve nearly 50% of energy
consumption after applying our proposed algorithm. Finally, although there exists a
number of energy optimization solutions for DCNs, they consider only either the hosts or
network, but not both. We propose a joint optimization scheme that simultaneously
optimizes virtual machine (VM) placement and network flow routing to maximize energy
savings. The simulation results fully demonstrate that our design outperforms existing
host- or network-only optimization solutions, and well approximates the ideal but NP-
complete linear program. To sum up, this study could be crucial for guiding future eco-
friendly data center network that deploy our algorithm on four major layers (with
reference to OSI seven layers) which are physical, data link, network and application
layer to benefit power consumption in green data center.
ix
TABLE OF CONTENTS
CHAPTER PAGE
INTRODUCTION .............................................................................................................. 1 1.1 Objective ............................................................................................................... 1 1.2 Contributions........................................................................................................... 2 1.3 Background and Related Works ............................................................................. 2 1.4 Scope of the Dissertation ........................................................................................ 4
2 FAIR BANDWIDTH ALLOCATION ALGORITHM FOR ENERGY EFFICIENCY ON PACKET SWITCH FABRIC INTERCONNECTS ................ 8
2.1 Introduction ............................................................................................................. 9 2.2 Background and Related Works ........................................................................... 11 2.3 Power Modeling with Bit Energy ......................................................................... 13 2.4 Queue-length Proportional and Max-min Fair Bandwidth Allocation ................. 16 2.4.1 Problem Formulation ............................................................................................ 16 2.4.2 Sequential Bandwidth Allocation Algorithm ........................................................ 20 2.4.3 Parallel Bandwidth Allocation .............................................................................. 23 2.5 Results and Discussions ........................................................................................ 25 2.6 Conclusions ........................................................................................................... 28
3 DEPLOYMENT OF A HYBRID MULTICAST SWITCH IN ENERGY-AWARE DATA CENTER NETWORK: A CASE OF FAT-TREE TOPOLOGY ......................................................................................................... 30
3.1 Introduction ........................................................................................................... 30 3.2 Background and Related Works ........................................................................... 35 3.2.1 Data Center Multicast ........................................................................................... 35 3.2.2 Energy-aware Data Center Network ..................................................................... 37 3.2.3 Data Center Traffic Patterns ................................................................................. 38 3.2.4 Data Center Topology ........................................................................................... 39 3.3 Power Modeling .................................................................................................... 40 3.4 Deployment of a Multicast Switch ....................................................................... 43 3.4.1 Problem Formulation ............................................................................................ 43 3.4.2 P2P Path Searching ............................................................................................... 46 3.4.3 Deployment of Multicast Switches with Single Multicast Group ........................ 47 3.5 Results and Discussions ........................................................................................ 49 3.5.1 Network Delay ...................................................................................................... 49 3.5.2 Energy Consumption and Power Saving .............................................................. 51 3.6 Conclusions ........................................................................................................... 54
4 JOINT HOST-NETWORK OPTIMIZATION FOR ENERGY-EFFICIENT DATA CENTER NETWORKING ....................................................................... 56
4.1 Introduction ........................................................................................................... 57 4.2 Background and Related Works ........................................................................... 60 4.2.1 Data Center Topology ............................................................................................60

x
4.2.2 Network-Side Optimization ...................................................................................62 4.2.3 Host-Side Optimization .........................................................................................62 4.3 Problem Formulation ............................................................................................ 63 4.4 Design Guidelines ................................................................................................. 67 4.4.1 Unified Representation of Both Types of Optimization ........................................68 4.4.2 Cluster based Parallel Processing ..........................................................................71 4.5 Host-Network Joint Optimization Scheme ........................................................... 72 4.5.1 Intra-cluster Processing ..........................................................................................73 4.5.2 Inter-cluster Processing ..........................................................................................77 4.6 Simulation Results ................................................................................................ 77 4.6.1 Comparison with Linear Program ..........................................................................77 4.6.2 Comparison with Network-only Optimization ......................................................79 4.6.3 Comparison with Host-only Optimization .............................................................81 4.7 Discussions ........................................................................................................... 84 4.7.1 Implementation ......................................................................................................84 4.7.2 Energy Consumed by VM Migration ....................................................................84 4.7.3 Safety Margins .......................................................................................................85 4.8 Conclusions ........................................................................................................... 85
5 CONCLUSIONS AND FUTURE WORKS ......................................................... 87 5.1 Summary ............................................................................................................. 87 5.2 Future Study Recommendations ........................................................................... 89 5.2.1 Fair bandwidth allocation algorithm for energy efficiency on packet switch
fabric interconnects ................................................................................................89 5.2.2 Deployment of a hybrid multicast switch in energy-aware data center network:
a case of fat-tree topology ......................................................................................89 5.2.3 Joint host-network optimization for energy-efficient data center networking .......90 5.2.4 Future Work ...........................................................................................................90
REFERENCES ................................................................................................................. 91
VITA ............................................................................................................................... 98

xi
LIST OF FIGURES
FIGURE PAGE
2.1 Example of switch fabric architecture. ................................................................. 10
2.2 Switch structure .................................................................................................... 13
2.3 Three major power consumptions on a switch fabric. .......................................... 16
2.4 Parallel processing for independent port sets. ....................................................... 23
2.5 Convergence iteration numbers of sequential and parallel algorithms. ................ 26
2.6 Internal buffer power consumption of switch interconnects. ................................ 27
2.7 Energy efficiency on NxN crossbars switch. ........................................................ 28
3.1 Carbon dioxide emissions from the DCN comparing to other usages. ................. 31
3.2 Network topologies with a source and 15 destination receivers. .......................... 32
3.3 Weekly DCN traffic fluctuation. ........................................................................... 38
3.4 Fluctuating traffic pattern of Pandora satellite radio. ........................................... 39
3.5 Examples of P2P and hybrid multicast deployment ............................................. 45
3.6 Average delay in green data center network. ........................................................ 50
3.7 Energy consumption variance. .............................................................................. 52
3.8 Node power saving comparison between peak-hour and off-peak. ...................... 53
4.1 Fluctuating DCN traffic pattern ............................................................................ 58
4.2 Unified representation of VM placement and flow routing. ................................. 70
4.3 Comparison with linear program and network-only optimization. ....................... 79
4.4 Comparison with network-only optimization. ...................................................... 81
4.5 Comparison with host-only optimization.............................................................. 83

xii
LIST OF ABBREVIATIONS AND ACRONYMS
BW Bandwidth
CPU Central Processing Unit
CICQ Combined Input-Crosspoint Queued
DCN Data Center Network
ESM Efficient and Scalable data center Multicast routing
ECMP Equal-Cost Multi-Path routing
FBFLY Flattened Butterfly topology
HOL Head of Line
ICT Information and Communications Technology
IQ Input Queued
IP
IT
Internet Protocol
Information Technology
kWh kilo Watts an hour
NP Nondeterministic Polynomial time
OSPF Open Shortest Path First
OQ Output Queued
ToR Top of Rack
VM Virtual Machine
VCQ Virtual output Queues

1
CHAPTER I
INTRODUCTION
Current data center networks exhibit poor power efficiency, because network
devices are run at full capacity all the time regardless of the traffic demand and
distribution over the network. Total energy consumption of network devices in data
centers of the US in 2006 was starting at 3 billion kWh. It has been shown that network
devices consume 20% ~ 30% energy in the whole data center [Heller et al., 2010] and the
ratio will grow with the rapid development of power-efficient hardware and energy-
aware scheduling algorithm on the server side [Nedevschi et al., 2009].
1.1 Objective
The ultimate goal of this research is to make network power proportional to actual
amount of traffic using as few network devices as possible to provide the routing service,
with little or no sacrifice on the network performance. As servers themselves become
more energy proportional with respect to the computation that they are performing, the
network becomes a significant fraction of cluster power. Meanwhile, the idle network
devices can be shut down or put into sleep mode for energy saving. Data center networks
show that energy-aware routing can effectively save power consumed by network
devices. In this research we propose several ways to optimize a green network topology
whose power consumption is more proportional to the amount of traffic it is transmitting.
Making these information and product exchanges possible are thousands of data
centers, which house about 10 million computer servers in the United States and 20
million worldwide. Operating these devices—running 24 hours a day, 7 days a week—

2
requires significant amounts of electricity [Morgan, 2006]. For some utilities, data centers
have become a major portion of load requirements. For example, Austin Energy, which
serves a high-tech region in Texas, estimates that about 8.5 percent (200 MW) of its
power is sold to data centers. Large server users such as Yahoo and Google are
increasingly mindful of electric costs and are building new server “farms” in places like
the Pacific Northwest to take advantage of the region’s low electricity rates [Loper and
Parr, 2007].
1.2 Contributions
As those motivating examples not only demonstrate the significance of this study,
but also pinpoint a major problem that needs to be tackled before a feasible solution is
realized. Today’s data center network suffers from the non-linear relationship between
cost and performance. Therefore, our research has the potential to make promising
solutions solve such problems. With the customization on four major layers to reinforce
our proposed algorithm, an energy-efficient data center network architecture which can
lower the energy consumption is highly desirable.
1.3 Background and Related Works
With the development of information technology, applications require more
resources to be integrated together to achieve both performance and efficiency as energy
efficiency becomes a major challenge in the resource integration problem. Consequently,
Data Center Networking has attracted great interests from academia and industry.

3
However, there is a difficulty in shutting off the unused links or idle line cards.
Because this strategy is combined with component-level and link-level solutions to
achieve higher network energy efficiency, the implementation complexity increases.
Network-level solutions require network-wide coordination of routers. The challenges are
two-fold, namely how to manipulate the routing paths to make as many idle links as
possible to maximize the power conservation, and how to achieve power conservation
without significantly affecting network performance and reliability. Since power-aware
traffic engineering uses fewer numbers of links at any moment, it is important to make
sure that links are not overloaded and packets do not experience extra-long delay.
Due to the current practice of tree topology, recently there have been many
proposals on new topologies for data centers. These topologies can be divided into two
categories. One is switch-center topology, i.e., putting interconnection and routing
intelligence on switches, such as Fat-Tree [Al-Fares et al., 2008] and VL2 [Greenberg et
al., 2009]. In contrast, the other category is server-centric, namely, servers, with multiple
NIC ports, also participate in interconnection and routing. BCube [Guo et al., 2009] and
FiConn [Li et al., 2009], all fall into the latter category. Abts et al. [Abts et al., 2010]
identified FBFLY – Flattened Butterfly topology. They showed that FBFLY can provide
nearly 60% power savings compared to full utilization.
In a recent work, Heller et al. [Nedevschi et al., 2009] proposed a network-wide
power manager named ElasticTree to extend the idea of power proportionality into the
network domain, as first described by Barroso [Barroso and Hlzle, 2007]. ElasticTree
optimizes the energy consumption of Data Center Networks by turning off unnecessary
links and switches during off-peak hours. It also models the problem based on the Multi-

4
Commodity Flow - MCF model, but is focused on Fat-Tree or similar tree-based
topologies. ElasticTree takes link utilization and redundancy into consideration when
calculating the minimum-power network subset.
Nedevschi et al. [Nedevschi et al., 2008] proposed a buffer-and-burst approach
which shapes traffic into small bursts to create greater opportunities for network
components to sleep. The same work also brings up the idea of rate-adaptation, which
adjusts operating rates of links according to the traffic condition. This work is also
focused on link level solutions.
There were also more and more concerns with energy saving in data center
network. New low-power hardware and smart cooling technologies were effective
methods to save energy. Intel Research proposed and evaluated a proxy architecture
which used a minimal set of servers to support different forms of idle-time behavior for
saving energy. A similar idea was proposed in [Srikantaiah et al., 2008], which believed
that consolidation of applications in cloud computing environments could present a
significant opportunity for energy optimization.
1.4 Scope of the Dissertation
The goal of this study is to have an integrated design of the potential benefits to
the power efficiency of green data center, based on our cross-layer approach. Energy
awareness can be advised based on the results of our proposed assumption. The following
brief descriptions of the three major chapters, explain the objectives, algorithms and
methodologies used in developing this study.

5
Chapter II, entitled “FAIR BANDWIDTH ALLOCATION ALGORITHM FOR
ENERGY EFFICIENCY ON PACKET SWITCH FABRIC INTERCONNECTS”,
dealing with bit energy (physical layer) and fabric switch architecture (data link layer)
uses queue length proportional allocation criterion, which allocates bandwidth to a best
effort flow proportional to its queue length, giving more bandwidth to congested flows. In
addition, the algorithms adopt the max-min fairness principle, which maximizes
bandwidth utilization and maintains fairness among flows. It specifies the amount of
bandwidth that each flow can use, and is calculated based on the total requested and
available bandwidth. It should be feasible in order to be applied in practice, and should be
efficient to fully utilize transmission capacity. Moreover energy efficiency on networking
devices becomes very critical. In this work, we propose a fair bandwidth allocation
algorithm to decrease power consumption on packet switch fabric interconnects.
Specifically, we include power aware computing factor as high power dissipation in
switches which is fast turning into a key problem, owing to increasing line speeds and
decreasing chip sizes. This efficient algorithm could lower processing power utilization
on switch fabric interconnects.
Chapter III, entitled “DEPLOYMENT OF A HYBRID MULTICAST SWITCH
IN ENERGY-AWARE DATA CENTER NETWORK: A CASE OF FAT-TREE
TOPOLOGY”, coping with one-to-many distribution on Ethernet multicast addressing
(data link layer) and IP multicast (network layer) presents a deployment of a multicast
switch in green data center as recently, energy efficiency or green IT has become a hot
issue for many IT infrastructures as they attempt to utilize energy-efficient strategies in
their enterprise IT systems in order to minimize operational costs. Networking devices

6
are shared resources connecting important IT infrastructures, especially in data center
network they are always operated 24/7 which consume a huge amount of energy and it
has been obviously shown that this energy consumption is largely independent of the
traffic through the devices. As a result, power consumption in networking devices is
becoming more and more a critical problem, which is of interest for both research
community and general public. Multicast benefits group communications in saving link
bandwidth and improving application throughput, both of which are important for green
data center. In this work, we study the deployment strategy of multicast switches in
hybrid mode in energy-aware data center network: a case of famous Fat-tree topology.
The objective is to find the best location to deploy multicast switch not only to achieve
optimal bandwidth utilization but also minimize power consumption. We show that it is
possible to easily achieve nearly 50% of energy consumption after applying our proposed
algorithm.
Chapter IV, entitled “JOINT HOST-NETWORK OPTIMIZATION FOR
ENERGY-EFFICIENT DATA CENTER NETWORKING”, involving flow routing
(network layer) and VM migration (application layer) develops a joint host-network
optimization. Data centers consume significant amounts of energy. As severs become
more energy efficient with various energy saving techniques, the data center network
(DCN) has been accounting for 20% to 50% of the energy consumed by the entire data
center. While DCNs are typically provisioned with full bisection bandwidth, DCN traffic
demonstrates fluctuating patterns. The objective of this work is to improve the energy
efficiency of DCNs during off-peak traffic time by powering off idle devices. Although
there exist a number of energy optimization solutions for DCNs, they consider only either

7
the hosts or network, but not both. In this work, we propose a joint optimization scheme
that simultaneously optimizes virtual machine (VM) placement and network flow routing
to maximize energy savings. We formulate the joint optimization problem as an integer
linear program, which is NP complete, and then propose a practical solution. First, to
effectively combine host and network based optimization, we present a unified
representation method that converts the VM placement problem to a routing problem. In
addition, to accelerate processing the large number of servers and an even larger number
of VMs, we describe a parallelizing approach that divides the DCN into clusters based on
subnet IP addresses, and processes the clusters in parallel for fast completion. Further, to
quickly find efficient paths for flows, we propose a fast topology oriented multipath
routing algorithm that uses depth-first search to quickly traverse between hierarchical
switch layers and uses the best-fit criterion to maximize flow consolidation. Finally, we
have conducted extensive simulations to compare our design with existing ones. The
simulation results fully demonstrate that our design outperforms existing host- or
network-only optimization solutions, and well approximates the ideal but NP-complete
linear program.

8
CHAPTER II
FAIR BANDWIDTH ALLOCATION ALGORITHM FOR ENERGY
EFFICIENCY ON PACKET SWITCH FABRIC INTERCONNECTS
Queue length proportional allocation criterion, which allocates bandwidth to a
best effort flow proportional to its queue length, gives more bandwidth to congested
flows. In addition, the algorithms adopt the max-min fairness principle, which maximizes
bandwidth utilization and maintains fairness among flows. It specifies the amount of
bandwidth that each flow can use, and is calculated based on the total requested and
available bandwidth. It should be feasible in order to be applied in practice, and should be
efficient to fully utilize transmission capacity. In this chapter, we propose a fair
bandwidth allocation algorithm to decrease power consumption on packet switch fabric
interconnects. We first formulate the problem based on the allocation criterion and
fairness principle. Then, we present a sequential algorithm and prove that it achieves
max-min fairness. To accelerate the allocation process, we propose a parallel version of
the algorithm, which allows different input ports and output ports to conduct calculation
in parallel, resulting in fast convergence. Specifically, we present simulation data to
demonstrate that the parallel algorithm is effective in reducing the convergence iterations.
Finally, we include power aware computing factor as high power dissipation in switches
which is fast turning into a key problem, owing to increasing line speeds and decreasing
chip sizes. This efficient algorithm managing physical layer and data link layer could
lower processing power utilization on switch fabric interconnects.

9
2.1 Introduction
Energy efficiency is becoming increasingly important in the operation of
networking infrastructure, especially in enterprise and data center networks. Energy
efficient infrastructures or green IT has recently become a hot button issue for most
corporations as they strive to eliminate all inefficiency from their enterprise IT systems
and save capital and operational costs. Vendors of IT equipment now compete on the
power efficiency of their devices, and as a result, many of the new equipment models are
indeed more energy efficient. However, compared to other IT devices such as servers and
laptops, energy efficiency of networking equipment has only recently received attention
since networks, being a shared resource, are expected to be always on. Plus, power
consumed by the network is significantly growing. Various studies have estimated the
annual electricity consumed by networking devices in the U.S. in the range of 6 - 20
Terra Watt hours [Nordman, 2008]. According to figures, the total energy consumption
of network devices in data centers of the US in 2006 was starting at 3 billion kWh. It has
been shown that network devices consume 20% ~ 30% energy in the whole data center
[Heller et al., 2010], and the ratio will grow with the rapid development of power-
efficient hardware and energy-aware scheduling algorithm on the server side [Nedevschi
et al., 2009].
The switch fabric circuit is the fundamental building block inside a network
router, it distributes all network traffic from ingress ports to egress ports shown in Figure
2.1 [Langen et al., 2000]. The performance of switch fabrics is very critical in network
applications. While most attention is focused on speed and capacity issues of switch
fabrics, power consumption is becoming more serious problem [Mahadevan, 2010].

10
Figure 2.1 Example of switch fabric architecture.
There are many different switch fabric architectures used in network routers. They
have different characteristics in terms of bandwidth, throughput and delay [Chao, 2001].
In our research, we will focus on the power consumption analysis of the packet switch
architecture, and estimate how the power consumption scales with the fair bandwidth
allocation algorithm based on the approach of D.Pan and Y.Yang.
Regardless of the switch types and fair scheduling algorithms, it is necessary to
calculate a feasible and efficient bandwidth allocation scheme as the basis for packet
scheduling [Hosaagrahara and Sethu, 2008]. The bandwidth allocation scheme specifies
the amount of bandwidth that a flow can use to transmit packets. On the one hand, the
scheme must be feasible in order to be applied in practice. In other words, the total
bandwidth allocated to all the flows at any input port or output port cannot exceed its

11
available bandwidth. On the other hand, the scheme should be efficient, which means to
fully utilize any potential transmission capacity and allocate bandwidth in a fair manner.
A bandwidth allocation scheme must be carefully calculated in order to be
feasible and efficient. On the one hand, if the bandwidth is optimum utilized, the energy
used to transmit the packets in each flow is also minimally utilized. On the other hand, if
the bandwidth is underutilized, the energy used to transmit those same packets in each
flow is wasted seriously. It is very necessary to optimum scale the claimed bandwidth of
each flow to waste the power sufficiently.
2.2 Background and Related Works
We provide a brief overview of switch structures and corresponding scheduling
algorithms based on pre-defined bandwidth allocation.
Switches buffer packets at three possible locations: output ports, input ports, and
cross points, and can be consequently divided into several categories. Output queued
(OQ) switches have buffers only at output ports. Since there is no buffer at the input side,
if multiple input ports have packets arriving at the same time that are destined to the same
output port, all the packets must be transmitted simultaneously. Thus, OQ switches need
large speedup to achieve optimal performance, and are not practical [Pan and Yang ,
2009]. On the other hand, since all the packets are already in output buffers, OQ switches
can run various fair queueing algorithms, such as WFQ [Parekh and Gallager, 1993] and
DRR [Shreedhar and Varghese, 1996], to provide different levels of performance
guarantees. The fair queueing algorithm schedules packets to ensure the allocated
bandwidth of each flow as in the ideal GPS [Parekh and Gallager, 1993] fluid model.
12
Input queued (IQ) switches have buffers at input ports, and eliminate speedup
requirements. Input buffers are usually organized as multiple virtual output queues
(VOQ) [McKeown et al., 1999], with a logical separate queue for flows to a different
destination, to avoid the Head of Line (HOL) blocking. Scheduling algorithms based on
allocated bandwidth for IQ switches try to emulate the corresponding fair queueing
algorithms for OQ switches with iterative matching. For example, iFS [Ni and Bhuyan,
2003] and iDRR [Zhang and Bhuyan, 2003] emulate WFQ [Parekh and Gallager, 1993]
and DRR [Shreedhar and Varghese, 1996], respectively. In addition, WPIM [Stiliadis and
Varma, 1995] improves PIM [Anderson et al., 1993] with bandwidth enforcement and
provides probabilistic bandwidth guarantees. However, those algorithms cannot duplicate
the exact packet departure time to achieve perfect emulation.
Combined input-crosspoint queued (CICQ) switches and combined input-output
queued (CIOQ) switches are special IQ switches with additional buffers at output ports
and crosspoints, respectively. Such switches are shown to be able to perfectly emulate
certain OQ switches with small speedup. Thus, various scheduling algorithms [Magill et
al., 2003], [Mhamdi and Hamdi, 2003], [Pan and Yang, 2008], [Turner, 2009] have been
proposed to duplicate the packet departure time of existing fair queueing algorithms for
OQ switches, and provide desired performance guarantees.

13
Figure 2.2 Switch structure
2.3 Power Modeling with Bit Energy
A packet switch fabric circuit is an on-chip interconnect network [Langen et al.,
2000]. The power consumption on switch fabrics comes from three major sources: 1) the
internal node switches; 2) the internal buffer queues; and 3) the interconnect wires. Inside
the switch fabrics, different packets travel on different data paths concurrently, and the
traffic load on each data path may change dramatically from time to time. To estimate the
dynamic power consumption in this multi-process interconnect network, we model our
power consumption based on new approach: the Bit Energy proposed by T.Ye, L. Benini,
and G. Micheli [Ye et al., 2002]. The bit energy is defined as the energy consumed for
each bit when the bit is transported inside the switch fabrics from ingress ports to egress
ports. The bit energy is the summation of the bit energy consumed on node switches,
internal buffers and interconnects wires. Researches in [Moustafa et al., 1999] and
[Oktug and Caglayan, 1997] show that buffer size of a few packets will actually achieve
ideal throughput under most network traffic conditions.

14
Table 2.1 Buffer bit energy of internal buffer consumption in Switch fabric
Input ports Total energy used (joule)
2 128
4 128
8 140
16 154
32 222
64 301
128 413
256 576
We analyse the power consumption based on a new modeling approach: the Bit
Energy by T.Ye et al in Table 2.1. The switch fabric architecture is constructed
hierarchically. A network switch consists of four main parts: 1) the ingress packet
process unit, 2) the egress packet process unit, 3) the arbiter (determines when and where
a packet should be routed from the ingress ports to the egress ports) and 4) the switch
fabrics is an interconnect network that connects the ingress ports to the egress ports.
The bit energy Ebit, is defined as the energy consumed for each bit when the bit is
transported inside the switch fabrics from ingress ports to egress ports. The bit energy Ebit
is the summation of the bit energy consumed on node switches, ESbit, on internal buffers,
EBbit , and on interconnect wires, EWbit . According to Ye et al, EBbit on internal buffers is
a significant part of total energy consumption of switch fabrics due to buffer penalty, and

15
the buffer energy will increase very fast as the packet flow throughput increases. We will
consider only this source of power consumption in our research.
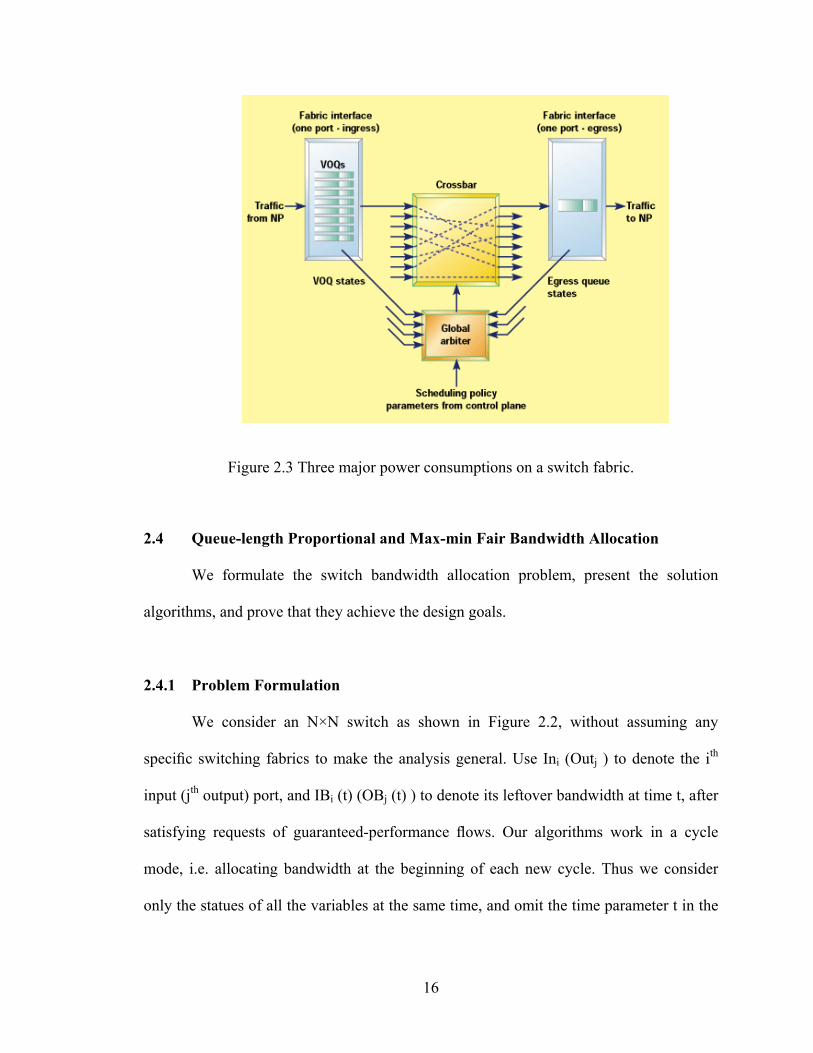
Internal buffers is used to temporarily store the packets in buffer when contention
between packets occurs at ingress and egress ports shown in Figure 2.3. The less number
of packets stored in buffers, the less power consumed. The energy consumption in buffers
comes from two sources: 1) the data access energy, consumed by each READ or WRITE
memory access operation, and 2) the refreshing energy, consumed by the memory
refreshing operation (in the case of DRAM). The bit energy on the internal buffers can be
expressed by the following equation EBbit = Eaccess + Eref where Eaccess is the energy
consumed by each access operation and Eref is the energy consumed by each memory
refreshing operation. The bigger memory spaced, the higher energy consumed. In reality,
memory is accessed on word or byte basis instead of a single bit, the Eaccess is actually the
average energy consumed for one bit.
The energy consumed by memory access is determined by the contentions
between the ingress packets. As discussed earlier, we are interested in comparing the
power consumption on different packet scheduling under the same network traffic,
therefore, we assume the destination contention has already been resolved by the arbiter
before the ingress packets are delivered to the switch fabrics. We only compare the
internal buffer energy consumption occurred from interconnect contention. on the
intermediate nodes between ingress and egress ports as shown in Figure 2.3. They direct
the packets from input ports to the next stage until reaching the destinations. The less
number of packets stored, the less power used.
16
Figure 2.3 Three major power consumptions on a switch fabric.
2.4 Queue-length Proportional and Max-min Fair Bandwidth Allocation
We formulate the switch bandwidth allocation problem, present the solution
algorithms, and prove that they achieve the design goals.
2.4.1 Problem Formulation
We consider an N×N switch as shown in Figure 2.2, without assuming any
specific switching fabrics to make the analysis general. Use Ini (Outj ) to denote the ith
input (jth output) port, and IBi (t) (OBj (t) ) to denote its leftover bandwidth at time t, after
satisfying requests of guaranteed-performance flows. Our algorithms work in a cycle
mode, i.e. allocating bandwidth at the beginning of each new cycle. Thus we consider
only the statues of all the variables at the same time, and omit the time parameter t in the

17
variables for easy reading. We use the input queue length as the bandwidth allocation
criterion, to allocate bandwidth to more congested flows. We do not consider output
queues and crosspoint queues, because the former stores packets already transmitted to
output ports, and the latter have limited and small capacities.
Denote the best-effort flow from Ini to Outj as Fij , and use Qij to represent its
input queue length at time t. Use Rij to denote the allocated bandwidth of Fij at time t.
Define the ratio between Rij and Qij to be the bandwidth share Sij , i.e.
ij
ijij
Q
RS (2.1)
which represents the bandwidth allocated to each unit of the queue length. If Fij
has no buffered packets at t, i.e. Qij = 0, set Rij and Sij to zero as well. Define the
bandwidth share matrix S to be the N × N matrix formed by all Sij , which determines the
bandwidth allocation scheme.
We now define feasibility for bandwidth allocation. A bandwidth allocation
scheme is feasible if there is no over-subscription at any input port or output port, i.e.
jiji
j
ij OBRj ,IBRii
(2.2)
Note that feasibility only makes a bandwidth allocation scheme possible to be
applied in practice. However, a feasible scheme may not be an efficient one. Thus, we
adopt max-min fairness to make the best use of available bandwidth and allocate
bandwidth in a fair manner.
We next define fairness based on the max-min fairness principle. A bandwidth
allocation scheme is max-min fair if it is feasible and there is no way to increase the
allocated bandwidth of any flow without reducing the allocated bandwidth of another

18
flow with a lower bandwidth share value. Formally, a feasible bandwidth share matrix S
is max-min fair, if for any feasible bandwidth share matrix S’ the following condition
holds
)S' S S (S S S' j'i'j'i'j'i'j'i' ij ij ij (2.3)
As can be seen, the objective of max-min fairness is twofold: increasing the
bandwidth share of each flow as much as possible to fully utilize available bandwidth,
and maximizing the minimum bandwidth share of all the flows to achieve fairness.
Theorem 1: A max-min fair bandwidth allocation scheme is unique.
Proof: By contradiction, assume that two bandwidth allocation matrices S and S’
are both max-min fair, and S ≠ S’ . Without loss of generality, assume that Sij is the
smallest entry among all the ones in S that are different from their counterparts in S’, i.e.
)S S S' (S ΛS' S ijj'i'j'i'j'i' ij ij j'i' (2.4)
We look at two possible cases regarding the relationship between Sij and S’ij .
Case 1: Sij < S’ij. Because S is max-min fair and S’ is feasible, by the definition
there exist i' and j’ such that Si'j’ ≤ Sij and Si’j’> S’i'j’. Define x = i' and y = j’ , and we have
Sij ≥ Sxy and Sxy >S’xy.
Case 2: Si’j’> S’ij. Define x = i and y = j, and we have Sij ≥ Sxy and Sxy >S’
xy.
Noting that in both cases Sxy >S’xy, because S’ is max-min fair and S is feasible,
there exist x’ and y’ such that S’x’y’ ≤ S’
xy and S’x’y’ > Sx’y’, and therefore S’
xy > Sx’y’ .
Since Sx’y’ ≠ S’x’y’ and Sij is the smallest different entry in S, we have Sx’y’ ≥ Sij . Combined
with the previous inequality S’xy > Sx’y’, we obtain S’
xy >Sij , which is a contradiction with
Sij >S’xy obtained in the above two cases.

19
Next, we give the definition of bottleneck ports, which will be the base to
calculate a max-min fair bandwidth allocation scheme. Given a bandwidth share matrix, a
port is the bottleneck port of a flow if the flow has the highest bandwidth share among all
the flows traversing the port, and the bandwidth of the port is fully allocated. Formally,
Ini is a bottleneck port of flow Fij in satisfaction matrix S if
i
x
ixix ij' ij IB RS ΛS Sj' (2.5)
and Outj is a bottleneck port of Fij in S if
j
x
xjxj ji' ij OB RS ΛS Si' (2.6)
The following theorem shows how to calculate max-min fair bandwidth
allocation.
Theorem 2: A feasible satisfaction scheme is max-min fair if and only if each flow
has a bottleneck port in it.
Proof: Assume that S is a feasible bandwidth share matrix and each flow has a
bottleneck port in S. Suppose S’ is also feasible and S’ij >Sij . Then we know that Sij < S’
ij.
Since each flow has a bottleneck port in S, we first assume that Ini is a bottleneck port of
Fij in S. By the definition of bottleneck ports, we know that ∀j’ Sij ≥ Sij’ and ∑j SijRij =
IBi.On the other hand, since S’ is feasible, we have ∑j S’ijRij ≤ IBi and thus ∑x S
’ixRix ≤ ∑x
SixRix. Because S’ij > Sij , there must exist j’ such that Sij’ > S’
ij’ , otherwise we can obtain
the contradiction that ∑x S’ixRix > ∑x SixRix. Noticing that Sij ≥ Sij; , we have found i' = i
and j’ such that Si’j’≤ Sij and Si’j’> S’i'j’ , and thus S is max-min fair. Similar reasoning can
be applied to the case that Outj is a bottleneck port of Fij in S.

20
2.4.2 Sequential Bandwidth Allocation Algorithm
We are now ready to present the bandwidth allocation algorithm. The main idea is
to find the bottleneck ports for all the flows in an iteration manner, after which a max-min
fair bandwidth share scheme is obtained by Theorem 2.
We define some notations before describing the algorithm. Initialize the
bandwidth share of each flow to zero, i.e. Sij = 0. Define the remaining bandwidth of a
port Ini (Outj) at the beginning of the nth iteration to be the available bandwidth that has
not been allocated, and denote it as Bi∗ (n) (B∗j (n)), i.e.
S
QS IB (n)B0ix
ixixi *i
(2.7)
S
QS OB (n)B0xj
xjxjj j*
(2.8)
Define the remaining queue length of a port Ini (Outj) at the beginning of the nth
iteration to be the total queue length of the flows that have not been assigned bandwidth
share values, and denote it as Qi∗ (n) (Q∗j (n)), i.e.
S
Q (n)Q0ix
ix *i
(2.9)
S
Q (n)Q0xj
xj j*
(2.10)
Define the bandwidth share of a port Ini (Outj ) at the beginning of the nth iteration
to be the ratio of the remaining bandwidth and remaining queue length, and denote it as
Si∗ (n) (S∗j (n)), i.e.
(n) Q
(n) B (n) S
*i
*i*i (2.11)

21
(n) Q
(n) B (n) S
j*
j*j* (2.12)
In each iteration, the algorithm first finds the port with the smallest bandwidth
share, and assigns the bandwidth share of the port to its flows without bandwidth share
values. As will be formally shown later, the port is the bottleneck port of all such flows.
Processing the ports one by one guarantees that eventually each flow will have a
bottleneck port.
In detail, each iteration consists of the following three steps.
1) Calculation: Calculate the bandwidth share of each remaining port.
2) Comparison and Assignment: Select the port with the smallest bandwidth
share, and assign the value as the bandwidth share of all the remaining flows of the port.
3) Update: Remove the above selected port and the flows assigned bandwidth
share values. Update the remaining bandwidth and queue length for each of the rest ports.
In the following, we show that the proposed algorithm achieves max-min fairness.
Lemma 1: The bandwidth share of a port does not decrease between iterations.
Proof: Without loss of generality, assuming that the port is an input port Ini, we
show that Si∗(n) ≥ Si∗(n+1). The proof for an output port is similar.
First, assume that a different input port Ini’ instead of Ini is selected in the nth
iteration with the smallest bandwidth share. Because Ini’ and Ini have no common flows,
the remaining bandwidth and queue length of Ini do not change, and thus
(n) S(n) Q
(n) B
1)(n Q
1)(n B 1)(n S *i
*i
*i
*i
*i*i
(2.13)

22
Next, assume that an output port Outj is selected in the nth iteration with the
smallest bandwidth share. Note that S∗j(n) ≤ Si∗(n) and that Fij will be assigned the
bandwidth share value of S∗j(n) , and we have
1)(n Q
1)(n B 1)(n S
*i
*i*i
= Q - (n) Q
(n)S * Q - (n) B
ij*i
j*ij*i
Q - (n) Q
(n)S * Q - (n) B
ij*i
*iij*i
= (n) Q
(n) B
*i
*i
(n) S *i (2.14)
Theorem 3: The bandwidth allocation algorithm achieve max-min fairness.
Proof: The key is to see that if a port assigns bandwidth share for a flow, then it is
the bottleneck port of the flow.
Without loss of generality, assume that Fij is assigned bandwidth share by Ini in
the nth iteration. Consider another flow Fij’ of Ini. If Fij is assigned bandwidth share by
Outj in an earlier iteration m, based on Lemma 1 we have Sij’ = S∗j(m) ≤ Si*(m) ≤ Si*(n) =
Sij . Otherwise, if Fij’ is assigned bandwidth share by Ini in the same iteration we know Sij’
= Si∗(n) = Sij . Therefore, Fij has the largest bandwidth share among all flows of Ini. In
addition, since Ini is selected in the nth iteration, all its remaining bandwidth is fully
allocated, i.e. Bi∗(n) = Si∗(n)Qi∗(n). Based on Theorem 2, we know that S is max-min fair.
23
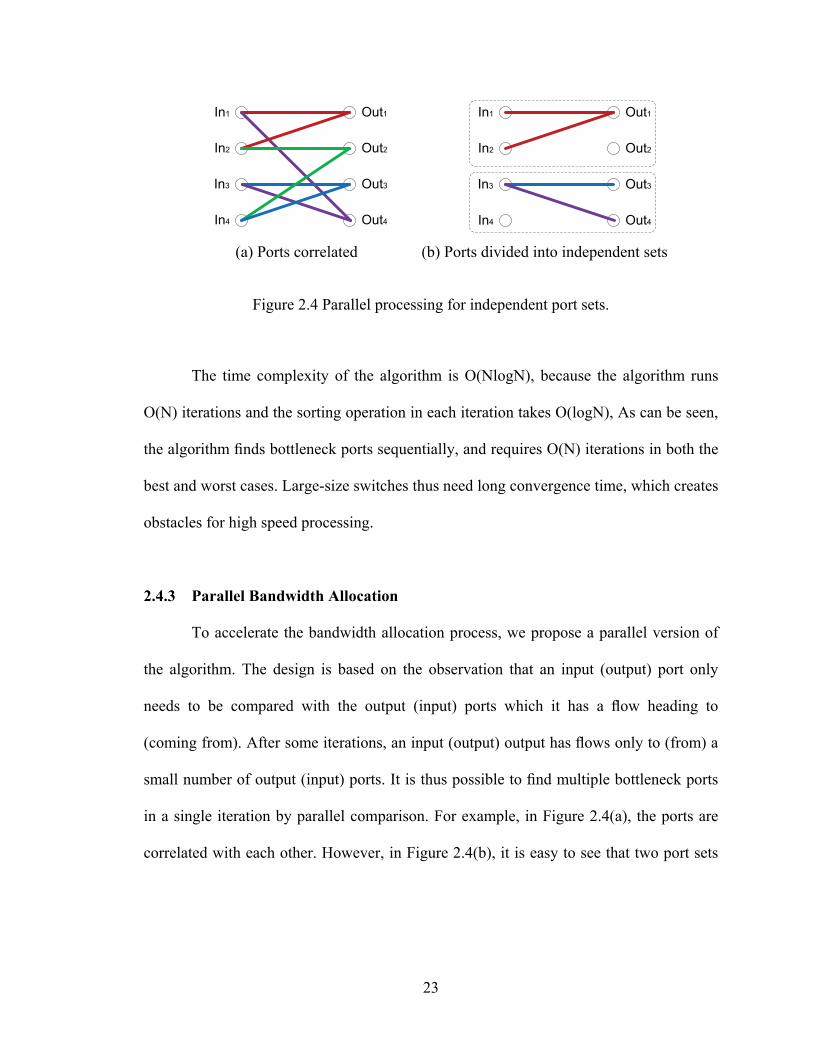
(a) Ports correlated (b) Ports divided into independent sets
Figure 2.4 Parallel processing for independent port sets.
The time complexity of the algorithm is O(NlogN), because the algorithm runs
O(N) iterations and the sorting operation in each iteration takes O(logN), As can be seen,
the algorithm finds bottleneck ports sequentially, and requires O(N) iterations in both the
best and worst cases. Large-size switches thus need long convergence time, which creates
obstacles for high speed processing.
2.4.3 Parallel Bandwidth Allocation
To accelerate the bandwidth allocation process, we propose a parallel version of
the algorithm. The design is based on the observation that an input (output) port only
needs to be compared with the output (input) ports which it has a flow heading to
(coming from). After some iterations, an input (output) output has flows only to (from) a
small number of output (input) ports. It is thus possible to find multiple bottleneck ports
in a single iteration by parallel comparison. For example, in Figure 2.4(a), the ports are
correlated with each other. However, in Figure 2.4(b), it is easy to see that two port sets

24
{In1, In2, Out1} and {In3, Out3, Out4} are independent, and that bandwidth allocation can
be conducted in parallel in the two sets.
Similarly, each entry of the bandwidth share matrix S is initialized to zero. The
parallel algorithm also works in iterations. One iteration of the algorithm consists of the
following three steps, each of which can be conducted by different input and output ports
in parallel.
1) Calculation and Distribution: An input (output) port Ini (Outj) calculates its
bandwidth share, and sends the result to every output (input) port that it has a flow
heading to (coming from).
2) Comparison and Assignment: An input (output) port Ini (Outj) compares its
own bandwidth share with that of every output (input) port received in the first step. If its
bandwidth share is the smallest, the value is assigned as the bandwidth share for all its
remaining flows.
3) Notification and Update: An input (output) port Ini (Outj) notifies every output
(input) port its bandwidth share, if it has the smallest bandwidth share in the second step.
The output (input) port will then know that the flow Fij has been assigned a bandwidth
share, and updates its remaining bandwidth and queue length. Flows already assigned
with bandwidth share are removed.
We show that the parallel algorithm also achieves max-min fairness.
Theorem 4: The parallel bandwidth allocation algorithm achieves max-min
fairness.
Proof: It is easy to see that Lemma 1 still applies to the parallel algorithm. Thus,
with the same reasoning as in the proof of Theorem 3, we know that if a port assigns its

25
bandwidth share to a flow, then it is the bottleneck port of the flow. Since each flow has a
bottleneck port, by Theorem 2 the bandwidth allocation scheme is max-min fair.
2.5 Results and Discussions
We now present simulation results to demonstrate the effectiveness of the parallel
bandwidth allocation algorithm. In the simulations, we consider switch sizes of 2n with n
from 1 to 10. We assign random values between 0 and 10000 as the queue lengths for the
flows. For a specific switch size, we conduct 20 simulation runs for the sequential
algorithm and parallel algorithm each, and calculate the average number of convergence
iterations. Figure 2.5 shows the simulation results. As can be seen, although the
convergence iteration numbers of both algorithms grow approximately linearly with the
switch size, the result of the parallel algorithm increases much slower than that of the
sequential algorithm. In detail, the average convergence iteration number of the
sequential algorithm is about twice of the switch size, which is consistent with the
analysis. The reason is that a switch of size N has N input ports and N output ports, and
each iteration of the sequential algorithms finds one bottleneck port. On the other hand,
due to parallel processing at each port, the average convergence iteration number of the
parallel algorithms is about half of the switch size. We can thus make the conclusion that
the parallel algorithm is effective in reducing the running time

26
Figure 2.5 Convergence iteration numbers of sequential and parallel algorithms.
Then we run another simulation to implement energy efficiency with queue length
proportional allocation and without. The requested bandwidth at each port is generated
randomly with the scale of 6. The simulation results show that the average power
consumption based on the parallel algorithm with max-min fairness principle to
maximize bandwidth utilization outperforms the random bandwidth allocation. A figure
below reflects the energy efficiency on switch fabric. Considering only major
consumption is caused by Internal Buffer consumption. More number of packets stored in
buffer, more energy wasted.
0 200 400 600 800 10000
500
1000
1500
2000
Switch Size
Ave
rage
Num
ber
of It
erat
ions
Convergence of Bandwidth Allocation Algorithms
Sequential AlgorithmParallel Algorithm

27
Figure 2.6 Internal buffer power consumption of switch interconnects.
A final figure is the summary of energy efficiency on N x N crossbars. As can be
seen, the switch running parallel bandwidth allocation scheme could save energy up to
10-14% comparing to the random allocation. The bigger the size, the better energy
saving. Explicitly, it can be seen that our parallel algorithm is effective in reducing the
power consumption.
0 50 100 150 200 2500
1
2
3
4
Switch size (# of ports)
Ene
rgy
Con
sum
ptio
n (K
Joul
e)
Internal Buffer Power Consumption
Proportional AllocationRandom Allocation

28
Figure 2.7 Energy efficiency on NxN crossbars switch.
2.6 Conclusions
In this work, we have studied bandwidth allocation for best effort flows in a
switch. We propose the queue-length proportional allocation criterion, the max-min
fairness principle, and bandwidth allocation algorithms that are independent of switch
structures and scheduling algorithms. First, we formulate the problem, and define
feasibility and fairness for bandwidth allocation. Then, we present the first version of the
algorithm, which calculates the allocation bandwidth in a sequential manner.
Furthermore, to accelerate the algorithm convergence, we propose a parallel version of
the algorithm, by allowing different input ports and output ports to conduct calculation in
parallel. We prove that both the sequential and parallel algorithms achieve the initial
2 4 8 16 32 64 128 2560
2
4
6
8
10
12
14Energy Efficiency
Switch size (# of ports)
Per
cent
age
savi
ng

29
design objectives. Particularly, we present simulation data to demonstrate that the parallel
algorithm is effective in reducing the convergence iterations. Lastly, we have shown that
fair bandwidth allocation for switches could not only allocate the feasible bandwidth for
each flow at both input and output ports, but also utilize the bandwidth of each flow
efficiently. As a result, power consumption on packet switch is lower 10-14% depending
on the size of crossbar switch. Overall, this feasible algorithm running on layer1 and
layer2 can make networking devices energy efficiency.

30
CHAPTER III
DEPLOYMENT OF A HYBRID MULTICAST SWITCH IN ENERGY-AWARE
DATA CENTER NETWORK: A CASE OF FAT-TREE TOPOLOGY
Recently, energy efficiency or green IT has become a hot issue for many IT
infrastructures as they attempt to utilize energy-efficient strategies in their enterprise IT
systems in order to minimize operational costs. Networking devices are shared resources
connecting important IT infrastructures, especially in data center network they are always
operated 24/7 which consume a huge amount of energy and it has been obviously shown
that this energy consumption is largely independent of the traffic through the devices. As
a result, power consumption in networking devices is becoming more and more a critical
problem, which is of interest for both research community and general public. Multicast
benefits group communications in saving link bandwidth and improving application
throughput, both of which are important for green data center. In this work, we study the
deployment strategy of multicast switches in hybrid mode which handle data link layer
and network layer in energy-aware data center network: a case of famous Fat-tree
topology. The objective is to find the best location to deploy multicast switch not only to
achieve optimal bandwidth utilization but also minimize power consumption. We show
that it is possible to easily achieve nearly 50% of energy consumption after applying our
proposed algorithm.
3.1 Introduction
Data centers aim to provide reliable and scalable computing infrastructure for
massive information and services. Accordingly, they consume huge amounts of energy

31
and exponentially increase operational costs. According to recent literature, the annual
electricity consumed by data centers in the United States is 61 billion kilowatt-hours
(kWh) in 2006 (1.5 percent of total U.S. electricity consumption) for a total electricity
cost of about $4.5 billion. The energy use of the nation’s servers and data centers in 2006
is estimated to be more than double the electricity that was consumed for this purpose in
2000 according to U.S. Environmental Protection Agency [2007]
Figure 3.1 Carbon dioxide emissions from the DCN comparing to other usages.
Energy efficiency has become nontrivial for all industries, including the IT
industry, since there is a big motivation to reduce capital and energy costs. According to
Figure 3.1 [Mankoff et al., 2008], the global information and communications technology
(ICT) industry accounts for approximately 2 percent of global carbon dioxide (CO2)
emissions; a figure is equivalent to aviation in 2007. Most likely, ICT use grows faster

32
than airline traffic in the past few years [Orgerie, 2011]. In addition, with energy
management schemes, we turn to a part of the data center that consumes 10-20% of its
total power: the network [Greenberg et al., 2009]. Thereby presenting a strong case for
reducing the energy consumed by networking devices such as switches and routers, our
goal is to outstandingly lower this growing recurring energy.
(a) Traditional data center network
(b) Fat-tree (with k=4 pods)
Figure 3.2 Network topologies with a source and 15 destination receivers.

33
As a data center is to service over ten thousand servers, inflexible and insufficient
bisection bandwidth have prompted researchers to explore alternatives to the traditional
2N tree topology (shown in Figure 3.2(a)) [Al-Fares, 2008] with designs such as VL2
[Greenberg et al., 2009], PortLand [Guo et al., 2009], and BCube [Mysore et al., 2009].
The resulting networks look more like a mesh than a tree. One such example, the famous
fat tree [Al-Fares, 2008], seen in Figure 3.2(b), is built from a large number of richly
connected switches/routers, and can support any communication pattern (i.e. full
bisection bandwidth). Traffic from clusters of servers is routed through hierarchical
design of Top-of-the-rack (ToR), Aggregation and Core switches respectively. The
lowest layer is ToR or Edge switches spreading traffic across the aggregation and core,
using multipath routing, unequal load balancing, or a number of other techniques in order
to deliver package to the destination server [Heller, 2010].
There are a number of multicast services in data center network. Servers in the
data center use IP Multicast to propagate information and communicate with clients or
other application servers. For example, the Financial Services industry, particularly the
market data infrastructure depends comprehensively on IP multicast to deliver stock
quotes [Cisco Systems Inc, 2009]. Increased reliance on multicast in next generation data
center addresses the performance requirements for IP multicasting in the data center.
Group communication widely exists in data centers hosting cloud computing [Vigfusson
et al., 2010], [Li et al., 2011]. Multicast benefits group communications by both saving
network traffic and improving application throughput. Even though multicast deployment
in the Internet bears many hindrances during the past two decades for many issues such
as compatibility, pricing model, and security concern, recently there is a perceptible

34
rebirth of it, e.g., the successful application of streaming videos [Mahimkar et al., 2009],
satellite radio, etc. The managed environment of data centers also provides a good
opportunity for multicast deployment because of a single authority which is considered
trustworthy.
Hybrid multicast approach is attractive to IT infrastructure for the following
reasons. First, the improved bandwidth efficiency provides the incentives for network
administrator to adopt the new technique as they can consolidate traffic from multiple
switches onto a single switch. Secondly, in particular, wireless bandwidth is precious and
mobile devices are power constrained. It makes mobile users happy for wireless hosts to
move multicast packet duplication from end hosts to switches. Next, the hybrid approach
allows incremental deployment of multicast switches. The hybrid approach only utilizes
the packet duplication capability of multicast switches when available, but does not
require all switches to be multicast capable. Therefore, the network administrator can
start deployment at selected areas with heavy multicast traffic as the first step. Lastly,
multicast switches in the hybrid approach are transparent to end hosts. The switches can
be implemented to automatically recognize and participate in P2P multicast networks,
and thus no change is necessary at the end hosts. Nevertheless, it is still feasible for
applications to actively detect the existence of multicast switches, and utilize them as
much as possible.
In this chapter, we study the deployment strategy of multicast switches in a
network to enable switch an IP multicast function. As discussed above, incremental
deployment is possible and we assume that the IT infrastructure plans to deploy a fixed
number of multicast switches in data center network. In addition, we assume that all

35
servers in this data center are running many multicast traffic, such as multicast groups,
broadcasting protocols to members in each individual group. Plus traffic intensity may be
obtained by either measurement or estimation. The objective is therefore to find
deployment locations and corresponding routing paths so as to achieve optimal
bandwidth utilization and minimize power consumption.
We first formulate the selective deployment and path searching problems as linear
programs. Although the linear programs obtain optimal solutions, integer linear
programming is NP-complete, and is not practical for large scale networks. Therefore, we
propose fast polynomial algorithms to obtain quick solutions. Finally, we conduct
simulations based on open-source simulator: Primessf [Liu], and the results fully
demonstrate the effectiveness of our designs.
3.2 Background and Related Works
3.2.1 Data Center Multicast
Group communication is common in modern data centers running many traffic-
intensity applications. Multicast is the technology to support this kind of one-to-many
communication pattern, for both saving network bandwidth and decreasing sender’s load.
For Web search services, the incoming user query is directed to a set of indexing servers
to look up the matching documents [Hoff, 2008]. Multicast can help accelerate the
directing process and reduce the response time. Moreover, distributed file system is
widely used in data centers, such as GFS [Ghemawat et al., 2003] in Google, and
COSMOS in Microsoft. Files are divided into many fixed size chunks, either 64 or
100MB. Each chunk is replicated to several copies and stored in servers located in

36
different racks to improve the reliability. Chunk replication is usually bandwidth-hungry,
and multicast-based replication can save the interrack bandwidth. Multicast can also
speed up the binary delivery and reduce the finishing time of any process.
Although multicast protocol is supported by most vendors’ routers/switches and
end-hosts, it is not widely deployed in the Internet due to many technological causes,
such as compatibility, pricing model, and security concern. However, we disagree that in
the managed environment of data centers, multicast is a comprehensive option to support
one-to-many communication in data center network. For instance, the natural pricing
problem is not an issue in data centers as they are usually managed by a single authority
which is considered very trusty.
Li et al.[Li et al., 2011] is using their ESM (Efficient and Scalable Data Center
Multicast Routing) technique to accommodate that challenge above. ESM, a novel
multicast routing scheme in data center networks, leverage the managed environment of
data centers, the topological characteristics of modern data center networks, as well as the
multicast group size distribution pattern. This kind of centralized controller is widely
adopted in modern data center design. For instance, in Fat-Tree [Al-Fares, 2008], a fabric
manager is responsible for managing the network fabric. In VL2 [Greenberg et al., 2009],
a number of directory servers are used to map the AA-LA relationship. The emerging
OpenFlow [Stanford University, 2008] framework also uses a controller for routing rule
decision and distribution.
We assume that ESM technique can be practically implemented in our green data
center as it addresses the challenges above by exploiting the features of modern data
center networks in most recent literature. It is not only flexible and scalable multicast

37
protocol but able to deploy in those state-of-the-art data centers networks as proved in
their breakthrough result.
3.2.2 Energy-aware Data Center Network
Gupta et al. [Gupta and Singh, 2003] were amongst the earliest researchers to
advocate conserving energy in networks. Other researchers have proposed techniques
such as putting idle sub-components (line cards, etc.) to sleep [Gupta and Singh,
2003] ,[Nedevschi et al., 2008], [Gupta and Singh, 2007], as well as adapting the rate at
which switches forward packets depending on the traffic. Nedevschi et al. [Nedevschi et
al, 2009] discuss the benefits and deployment models of a network proxy that would
allow end-hosts to sleep while the proxy keeps the network connection alive. He also
proposes shaping the traffic into small bursts at edge routers to facilitate sleeping and rate
adaptation. Further their work addresses edge routers in the Internet [Nedevschi et al.,
2008]. [Mahadevan et al., 2009] shows one of their power saving algorithms focuses on
job allocation, they perform this operation from the point of view of saving power at
network devices and show considerable energy savings can be achieved. Chiefly, their
algorithms are for data centers and enterprise networks.
Our finding confirms that the deployment of multicast switch in energy-aware data
center network including recently notable techniques: shutdown the unused links and
sleep power-hungry switches/routers can dramatically lower the total power consumption
of data center. The graph of energy consumption shows 50% decrease comparing to that
without power awareness.

38
3.2.3 Data Center Traffic Patterns
Figure 3.3 displays the plot of 7-day network traffic from the SuperJANET4
access router of service provider at Manchester recorded with MRTG [Jonesa et al.,
2003]. The normal traffic levels for the Net North West MAN vary between 70 and 300
Mbps into the MAN (solid graph) and between 200 and 400 Mbps out of the MAN (line
graph). There is a burst as visible as the sharp spikes, which occur once in a while. We
can clearly see a wave pattern, with the highest instant traffic volume at about 750 Mbps,
and the lowest at about 50 Mbps. It is obviously seen that at night time, traffic has
dropped lower than 50% of the peak regardless of incoming or outgoing direction. The
key for our energy-aware DCNs to achieve power conservation during off-peak hours is
to power off idle devices and shutdown unused links when possible.
Figure 3.3 Weekly DCN traffic fluctuation.
Another example is in Figure 3.4. It might not have been included in Facebook’s
music launch, but internet radio service Pandora has been adding more and more daily
active users on Facebook [Eldon, 2011]. At the end of last year, it was near 1.4 million at
the peak of the traffic wave you see above, plummeting over 30% every weekend. This

39
famous radio streaming application is heavily based on broadcasting communication
which is clearly seen that our algorithm can save vast energy on this growing application.
Figure 3.4 Fluctuating traffic pattern of Pandora satellite radio.
3.2.4 Data Center Topology
Recently, there is a growing interest in the community to design new data center
network architectures with high bisection bandwidth to replace those old-fashion trees
[Al-Fares et al., 2008]. Fat-Tree is the representative one among these current three-tier
architectures. Figure 2(a) illustrates the topology of Fat-Tree, which organizes the
switches in three levels. More specifically, if k is the number of ports on each single
switch, then there are k pods, with each pod consists of k/2 edge switches and k/2
aggregation switches. Each k-port switch at the edge level uses k/2 ports to connect the
k/2 servers, and uses the remaining k/2 ports to connect the k/2 aggregation-level
switches in the same pod. At the core level, there are (k/2)2 switches, and each k-port
switch has one port connecting to each pod. Thus in total, there are 5k2/4 switches that

40
interconnect k3/4 servers. Figure 3.2(a) shows one such network for k=4 Fat-Tree
topology.
To the best of our knowledge, we think that ESM technique can be practically
implemented in our green data center as it can arrange those challenges above by taking
the advantage of those most recent data center topologies. More importantly, combining
with our hybrid multicast, ESM is proved to be operated effectively on hierarchical
topology i.e. fat-tree, VL2, BCube etc. which extensively matches our proposed
framework.
3.3 Power Modeling
Projections Energy consumption can be generally defined as:
Energy = AvgPower x Time (3.1)
where Energy and AvgPower are measured in Joule and Watt, respectively, and 1
Joule =1Watt x 1 Second. Energy efficiency is equivalent to the ratio of performance;
measured as the rate of work done, to the power used [Tsirogiannis et al., 2010] and the
performance can be represented by response time or throughput of the computing system.
Energy Efficiency= Workdone
Energy=
Performance
Power (3.2)
To the best of our knowledge, no in-depth measurement study exists that
quantifies the actual energy consumed by a wide range of switches under widely varying
traffic conditions. However, [Mahadevan et al., 2009] analyzed power measurements
obtained from a variety of switches from well-known vendors such as Cisco, ProCurve,
and Brocade. They identify various control knobs as a function of switch configurations

41
and traffic flowing through the switch. Based on their analysis, they developed a power
model to estimate the power consumed by any switch. Linear power model is to estimate
the power consumed by any switch defined as:
Powerswitch=Powerchassis+numlinecard* Powerlinecard+ numportsconfigsI
configs
i=0
* PowerconfigsI*utilizationFactor (3.3)
Table 3.1 Power consumption summary for network devices in 3 hierarchical layers.
Type Plate Power
(W)
# of ports /
linecard
Idle Power
(W)
BW
(Mbps)
Core Switch 3000 24 555 48000
Aggregation Switch 875 24 133.5 48000
Edge Switch 300 48 76.4 48000
Table 3.1 [Mahadevan et al., 2009] lists the device categories. All power
measurements including PoE already are reported in Watts (except the last column is in
Mbps). 9-slot core switch is typically used as a root switch in data centers. It consumed
maximum 3000 Watts when fully operated during peak hours but 555 Watts when idle.
Aggregation switch is available as a modular chassis with 6-slots, with each slot capable
of supporting a 24-port linecard. Alternatively, 24-port 1 Gbps linecard for an aggregate
24 Gbps capacity is able to be replaced by a 4-port 10 Gbps linecard for an aggregate of
40 Gbps capacity operated during peak hours. Each linecard consumes 35-40 Watts. For
an edge switch having a line card with 48 full-duplex 1 Gbps ports, one way to fully load

42
the switch is to attach servers to each port and ensure 1 Gbps of traffic going in and
coming out of each port. Note that, as the number of active ports is increased, the impact
of port utilization (whether no load or fully loaded) on power consumption is under 5%.
We follow their finding as the result is very well-explained and they proved that
their estimated power consumption matches the real power measured by the power meter
with an error margin of below 2%. Moreover, IP options set in the packet might not affect
power consumption at switches performing MAC forwarding, processing packets that
have IP options might impact the power consumption of a gateway router which
comprehensively relate to our proposed IP multicast forwarding in those multicast
switches. Moving onto the effects of traffic, packet size does not impact power
consumption at all.
Also, we compute the node power saving as:
Nodesaving(t)= ∑ pi
i (t)total - ∑ pii (t)on∑ pi
i (t)total (3.4)
We consider a sinusoidal function reported on the node power saving as stated in
[Chiaraviglio et al., 2009] where the numerator is difference of full power and minimized
power consumed by nodes for the energy-aware network and the denominator is the
power consumed by nodes for a non-green network. Note that Node (t) is measured
during night, since the connectivity is the tightest constraint, being the offered traffic
much smaller than during peak hour. On the other hand, during the day the node power
saving decreases because the traffic is very critically intense which some unused switches
are needed to be on due to path redundancy. As traffic significantly increases in peak
hours, more network and link capacity are required in order to guarantee the maximum

43
link utilization constraint. However under that scenario it would be possible to always
turn off few nodes, so that a small power saving is still possible.
We run each experiment for 120 seconds triple and report the average power over
the entire duration. A similar reasoning can be applied to Link (t), which we
certainly plan to do it for a future work.
3.4 Deployment of a Multicast Switch
3.4.1 Problem Formulation
A network is a directed graph G = (H ∪ X, E), where H is the set of end hosts and
X is the set of switches, and E is the set of links between hosts and/or switches. Each link
(u, v) ∈ E has a non-negative weight W (u, v) ≥ 0, which may be the length or average
latency. A multicast group consists of a source host s ∈ H, and a set of destination hosts
D = {d1,...,dn}, ∀i, di ∈ H. For simplicity, we assume that a host has no switching
function. In the case of switching host, it can be easily represented as a non-switching
host plus a switch.
In the P2P mode, the switches do not perform packet duplication, and the hosts
transmit the packet by unicast paths. In detail, after a destination host receives a specific
packet, it forwards a copy to the next destination, as shown in Figure 3.5(a). Since the
switches do not conduct packet duplication, the same packet may be transmitted over a
link multiple times. For a link (u, v) ∈ E, define n(u, v) to be the number of transmissions
of the packet from u to v. Note that n(u, v) may not be equal to n(v,u). Define the cost of
the transmission path of a packet to be the sum of the product of the weight of each link
and the number of transmissions over the link, i.e.∑ ( , ) ( , )( , )∈ . Although

44
different packets may take different paths, we are interested in finding the optimal path
with the minimum cost, which can be formulated as the following linear program.
Minimize ∑ n(u, v)W(u, v)(u,v)∈E (3.5)
subject to the following constraints:
Source departure: There is at least one copy of the packet departing from the
source, i.e.
∑ n(s, v) ≥1u ∈(H ∪X) (3.6)
Destination arrival: At least one copy of the packet arrives at each destination, i.e. ∀i, ∑ n(u, di) ≥1u ∈(H ∪X) (3.7)
Source-destination connectivity: Each destination must be connected with the
source to avoid sub-tours [Hahsler and Hornik, 2007], i.e. ∀T,di ∈T ⊆H∪U \ s , ∑ n(u, v) >0u ∈ H ∪U-T , v∈T (3.8)
Switch conservation: A switch only transmits packets, without creating or
destroying any, i.e.
∀u ∈X, ∑ n(v, u)= v ∈(H ∪X) ∑ n(u, v) v ∈(H ∪X) (3.9)
In the hybrid mode, a fixed number M of switches can be upgraded with multicast
support. The multicast switches can participate in the P2P multicast group and assist
packet duplication when possible, as shown in Figure 3.5(b). If u ∈ X is upgraded as a
multicast switch, define m(u)=1; otherwise, m(u)=0. For u ∈ X, use Size(u) to represent
the size of u, i.e. the number of output ports. Note that Size(u) is not a variable but a
constant for a given switch u. Our objective is still to minimize the overall cost of the
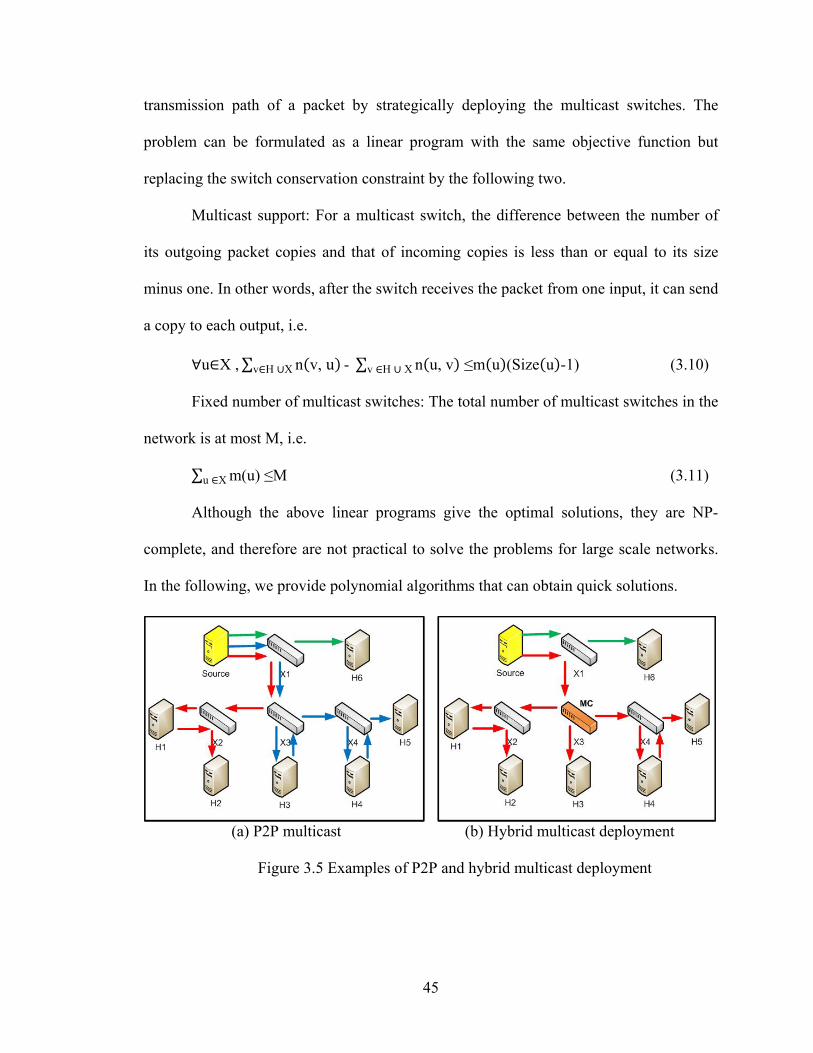
45
transmission path of a packet by strategically deploying the multicast switches. The
problem can be formulated as a linear program with the same objective function but
replacing the switch conservation constraint by the following two.
Multicast support: For a multicast switch, the difference between the number of
its outgoing packet copies and that of incoming copies is less than or equal to its size
minus one. In other words, after the switch receives the packet from one input, it can send
a copy to each output, i.e. ∀u∈X ,∑ n(v, u)v∈H ∪X - ∑ n(u, v) ≤m(u)(Size(u)-1)v ∈H ∪ X (3.10)
Fixed number of multicast switches: The total number of multicast switches in the
network is at most M, i.e. ∑ m(u) ≤Mu ∈X (3.11)
Although the above linear programs give the optimal solutions, they are NP-
complete, and therefore are not practical to solve the problems for large scale networks.
In the following, we provide polynomial algorithms that can obtain quick solutions.
(a) P2P multicast (b) Hybrid multicast deployment
Figure 3.5 Examples of P2P and hybrid multicast deployment

46
3.4.2 P2P Path Searching
As the basis to calculate the multicast switch deployment, we first present the
algorithm to find the P2P transmission paths. The basic idea is to separate the source and
destinations into two sets. Nodes in the first set have all received a copy of the packet,
and nodes in the second set have not. The algorithm then finds the minimum cost path
from the first set to the second set, by which the packet reaches one more destination. The
algorithm works in iterations, and adds a destination host to the first set in each iteration.
Use S to represent the first set and initialize it as S = {s}, and use T to represent the
second set and initialize it as T = D. The minimum cost path from S to T can be easily
found, because whenever a new host is added to S, its minimum cost path to each of the
remaining hosts in T is calculated using the Dijkstra’s algorithm.
In summary, each iteration of the algorithm includes the following steps:
1) Find the minimum cost path from a host u ∈ S to a host v ∈ T. If there are
multiple paths with the same minimum cost, select the one with the smallest index source
(assuming each host having an ID for comparison). The reason is to consolidate traffic in
certain switches so that upgrading those switches will maximize bandwidth efficiency
and power off unused switches.
2) Remove v from T and add it to S, i.e. T = T \{v} and S = S ∪{v}. Calculate the
minimum cost path from v to each remaining host in T.
It can be shown that the above algorithm obtains the optimal solution. Due to
space limitations, the detailed proof is omitted. Since the algorithm needs |D| iterations,
and the time complexity to calculate the shortest distance paths for the newly added host
in each iteration is O(|H ∪ X|2), the time complexity of the algorithm is O(|S||H ∪ X|2).

47
3.4.3 Deployment of Multicast Switches with Single Multicast Group
Next we consider the multicast switch deployment problem and start with the
simpler case with a single multicast group.
The main idea is to calculate the cost reduction to upgrade each switch in the P2P
paths obtained above, and select the one with the maximum cost reduction. Repeat the
process multiple times until we have found the deployment locations of all the M
multicast switches.
It can be noticed that not all switches will result in cost reduction if upgraded. We
define a relaying switch to be one with an in-degree greater than one in the current
transmission paths. Specifically, u ∈ X is a relaying switch if ∑ n(v, u) > 1∈( ∪ ) .
Upgrading a relaying switch will obtain cost reduction, because packet duplication at the
switch will avoid the additional incoming transmissions. In Figure 3.5(a), X2 and X4 are
relaying switches, each with an in-degree of 2; X1 and X3 are also relaying switches each
has an in-degree of 3.
After identifying the relaying switches, we need to calculate the cost reduction to
upgrade such a switch, which is the total weight of the edges for the switch to receive
relaying copies of the packet. In case the relaying switch has both incoming edges from
multiple neighbors, we need to determine which are the relaying edges. This can be done
by a breath first search with the current path from the multicast Source s, and the edge
from a farther node to a closer node is the relaying edge. For example, in Figure 3.5(a),
both (X3,X2) and (H1,X2) are incoming edges of X2, and only the latter is a relaying
edge. Both (X3,X4) and (H4,X4) are incoming edges of X4, and only the latter is a

48
relaying edge. On the other hand, if a relaying switch has n > 1 incoming edges from the
same neighbor, n − 1 of them are relaying edges. In Figure 3.5(a), (Source,X1) is a
relaying edge for X1. In case that the other node of a relaying edge is also a switch, it
must be a relaying switch as well, and we need to trace back recursively until reach a
host. In Figure 3.5(a), not only (Source,X1) and (X1,X3) form the relaying path for X3,
but also (H3,X3) is a relaying edge of X3. Calculate the total weight of all the relaying
edges to obtain the cost reduction for a relaying switch, and then select the one with the
maximum reduction.
To sum up, each iteration of the algorithm includes the following steps:
1) Identify relaying switches, and calculate the cost reduction for each of them.
2) Select the switch with the maximum cost reduction. Remove all the relaying
paths and perform packet duplication at the switch instead. Stop if there are already M
multicast switches.
3) Update the cost reduction of the remaining switches after upgrade the switch
selected in the above step.
In Figure 3.5(a), if assume that each link has the same weight of one and M =1,
X3 has the maximum cost reduction of 3, we upgrade it to a multicast switch and the
resulting hybrid transmission network is shown in Figure 3.5(b). Neither X1 nor X2 nor
X4 is picked as each of them has cost reduction of 2, 1 and 1 respectively. .
The algorithm needs M iterations. Since there are at most |D|−1 relaying paths,
each with length less than |H∪X|, the time complexity in each iteration is O(|D||H∪X|).
Therefore, the time complexity of the algorithm is O(M|D||H ∪ X|).

49
We run each experiment for 120 seconds in order to find out the average delay
three times in each scenario. A similar algorithm can be applied to multiple multicast
groups.
3.5 Results and Discussion
In this section, we show the simulation results to demonstrate the effectiveness of
our design.
3.5.1 Network Delay
We set up a UDP application package with one host being the multicast source
and all the remaining hosts being destinations. During the day, the traffic is very intense.
Source host generates traffic at the rate of 100 to 500 packets per second, and the packet
size is fixed at maximum 1200 Bytes. When there is no multicast switch in the network,
the packet is transmitted in the pure P2P mode and all links have identical bandwidth of
1Gbps. However, when there is a multicast switch (M is set to 1), it will duplicate that
packet and broadcast to remaining receivers when possible. Each simulation lasts 120
seconds.
Figure 3.6 shows the simulation results with the fat-tree topology which is widely
adopted by modern data center network based on open-source simulator - Primessf [Liu].
We set up a single multicast group with the Source host being the source and the
remaining hosts being the destinations as shown in Figure 3.2(b). We plot the average
multicast delay, calculated as the average interval of all packets from the departure at the
Source host to the arrival at each destination, under two scenarios: without multicast

50
switches, and with calculated deployment. The calculated deployment curve shows the
data when the left-most core switch exposed in Figure 3.2(b) is upgraded, which is
obtained by our algorithm described in section IV. Although those two curves grow as
the packet generation rate increases, the average multicast delay with the calculated
multicast switch deployment is only about one fourth of that of without multicast
switches. We can see that our algorithm consistently obtains shorter average multicast
delay than the P2P approach. The results fully demonstrate that our algorithm is effective
in calculating good deployment locations for multicast switches to reduce the traffic
amount and latency.
Figure 3.6 Average delay in green data center network.
0 100 200 300 400 5000
100
200
300
400
500
600
Traffic load (Mbps)
Del
ay (
usec
)
Fat−Tree with k=4 pods
P2PMulticast Deployment

51
3.5.2 Energy Consumption and Power Saving
We set up a UDP application package with one host being the multicast source
and all the remaining hosts being destinations. Assume that all switches are able to be
configured IP multicast mode. Based on our algorithm in section 3.4, a left-most core
switch in Figure 3.2(b) is upgraded to be a multicast switch. It will duplicate that packet
and broadcast to remaining receivers when possible regardless of traffic rate. During the
day, the traffic is very intense. Source host generates traffic at the rate of 100 to 500
packets per second, and the packet size is fixed at maximum 1200 Bytes. All links have
identical bandwidth of 1Gbps. However, as said in section 3.3, the traffic during night is
only nearly 50% of the peak-hour demand. We reduce the traffic generation of Source
host at the rate of 100 to 250 packets per second according to common traffic pattern in
Figure 3.3 and 3.4 having all links identical bandwidth of 1Gbps. Each simulation is run
for 120 seconds
Regarding power consumption summary in Table 3.1 and equation 3.1, after
applying our proposed algorithm to enable IP multicast function in a core switch, we
calculate the power consumption as exhibited in Figure 3.7. Energy used is reduced by
half during off-peak hours. Plus, according to the data center traffic pattern in Figure 3.3
and 3.4, we can extensively deploy this scheme on weekends so that roughly 50% of the
fully-operated power consumption is saved. We can clearly say that the optimal energy-
aware policy is also able to run during peak hours but because of redundancy and
guaranteed link utilization we need to keep few unused switches on. Thus, energy saving
is one-fourth of the maximum correspondingly. Network administrator in an enterprise or
data center networks should be able to consolidate traffic from multiple switches onto a

52
single switch so as to turn off the unused switches. As can be seen, all three curves grow
as time goes by. However, energy consumption without energy-aware scheme grows
much faster than the other two which demonstrates that our proposed hybrid multicast
mode is effectiveness decreasing energy consumption.
Figure 3.7 Energy consumption variance.
Figure 3.8 reports the breakdown of the percentage of power saving after sleeping
unused nodes detailing core and aggregation during both off-peak and peak hours.
According to equation 3.4, where the numerator is the power consumed by nodes for the
energy-aware network and the denominator is the power consumed by nodes for a non-
green network. Values have been averaged over the three different runs. The plot shows
that during off-peak hours it is possible to save power approximately 50% of nodes that
are not source/destination of traffic, being the core and aggregation nodes the largest

53
fraction of them. This reflects the fact that the network has been designed to recover from
possible faults, which requires additional resources. These additional resources are not
exploited to carry traffic during off-peak time, and then they can be powered down to
save energy. During peak hours, on the contrary, the saving is much lower, as only about
25% of power is not uselessly wasted, being the majority of core nodes. Note that, during
the day, aggregation nodes are always operatively on. These additional nodes may be
required to recover from occasional faults and unexpected incidents. This obviously
demonstrates that our proposed algorithm yields significant network energy saving.
Figure 3.8 Node power saving comparison between peak-hour and off-peak.

54
3.6 Conclusions
Energy efficiency has become a top priority in most IT enterprise. Networking
devices in data center network consist an important part of the IT infrastructure and
consume massive amounts of energy. Relatively small attention has been paid to gear up
the energy efficiency of data center networks thus far. In this work, we make several
contributions as follows. Firstly, we proposed the deployment of a multicast switch in a
hybrid multicast network, which combines the efficiency of IP multicast and the
flexibility of P2P multicast. We first formulate the problem as integer linear programming
which is NP-complete and not practical for large scale networks. We further propose fast
polynomial algorithms that obtain quick solutions. Accordingly, we conduct extensive
simulations to evaluate the transmission cost reduction and packet delay improvement,
and the simulation results fully demonstrate the effectiveness of our design which the
average delay of our calculated multicast switch deployment is only one fourth of that of
without multicast switches. Next, we calculate power consumption after deploying a
multicast switch in famous Fat-tree topology. Energy used is reduced by half during off-
peak hours. Besides, we can extensively deploy this scheme on weekends so that roughly
50% of the fully-operated power consumption is saved. During peak hours, although we
need to keep few unused switches on, energy saving is one fourth of the maximum
correspondingly. Finally, Node (t) is measured during day and night. Since the
connectivity is the tightest constraint at night, being the offered traffic much smaller than
during peak hour. Saving well approximate 50% of power is achievable. In contrast,
during the day, it would be possible to turn off few nodes, so that a minimum 25% of
power saving is promising which demonstrates that our proposed hybrid multicast mode

55
that runs on layer2 and layer3 with reference to OSI 7-layer is successful
comprehensively decreasing energy consumption.

56
CHAPTER IV
JOINT HOST-NETWORK OPTIMIZATION FOR ENERGY-EFFICIENT DATA
CENTER NETWORKING
Data centers consume significant amounts of energy. As severs become more
energy efficient with various energy saving techniques, the data center network has been
accounting for 20% to 50% of the energy consumed by the entire data center. While
DCNs are typically provisioned with full bisection bandwidth, DCN traffic demonstrates
fluctuating patterns. The objective of this work is to improve the energy efficiency of
DCNs during off-peak traffic time by powering off idle devices. Although there exist a
number of energy optimization solutions for DCNs, they consider only either the hosts or
network, but not both. In this work, we propose a joint optimization scheme that
simultaneously optimizes virtual machine (VM) placement and network flow routing to
maximize energy savings. We formulate the joint optimization problem as an integer
linear program, which is NP complete, and then propose a practical solution which
manages network layer and application layer. First, to effectively combine host and
network based optimization, we present a unified representation method that converts the
VM placement problem to a routing problem. In addition, to accelerate processing the
large number of servers and an even larger number of VMs, we describe a parallelizing
approach that divides the DCN into clusters based on subnet IP addresses, and processes
the clusters in parallel for fast completion. Further, to quickly find efficient paths for
flows, we propose a fast topology oriented multipath routing algorithm that uses depth-
first search to quickly traverse between hierarchical switch layers and uses the best-fit
criterion to maximize flow consolidation. Finally, we have conducted extensive

57
simulations to compare our design with existing ones. The simulation results fully
demonstrate that our design outperforms existing host- or network-only optimization
solutions, and well approximates the ideal but NP-complete linear program.
4.1 Introduction
Data centers have become popular computing infrastructure, because they achieve
economies of scale with hundreds of thousands of servers [Mudigonda and Yalagandula,
2010], e.g. about 300,000 servers in Microsoft’s Chicago data center from [Who has the
most web servers?]. At the same time, the huge number of servers in data centers
consume significant amounts of energy. It is estimated by U.S. environmental protection
agencies [U.S. environmental protection agencies] that national energy consumption by
data centers in 2011 will be more than 100 billion kWh, representing a $7.4 billion
annual electricity cost. As a result, energy efficiency of data centers has attracted wide
attention in recent years, mostly focusing on servers [Grunwald et al., 2000] and cooling
systems [Patel et al., 2003].
With the improvement of server energy efficiency, the other important component
of a data center, has been accounting for 20% [Shang et al., 2010] to 50% [Abts et al.,
2010] of the energy consumed by the entire data center. With the huge number of servers
in a data center, the DCN needs proportionally large bandwidth to interconnect the
servers. In addition, a DCN is typically provisioned with full bisection bandwidth
[Mysore et al., 2009] to support burst all-to-all communication. However, since DCN
traffic demonstrates fluctuating patterns, the fully provisioned bandwidth cannot be
always well utilized, resulting in resource underutilization and energy waste. For
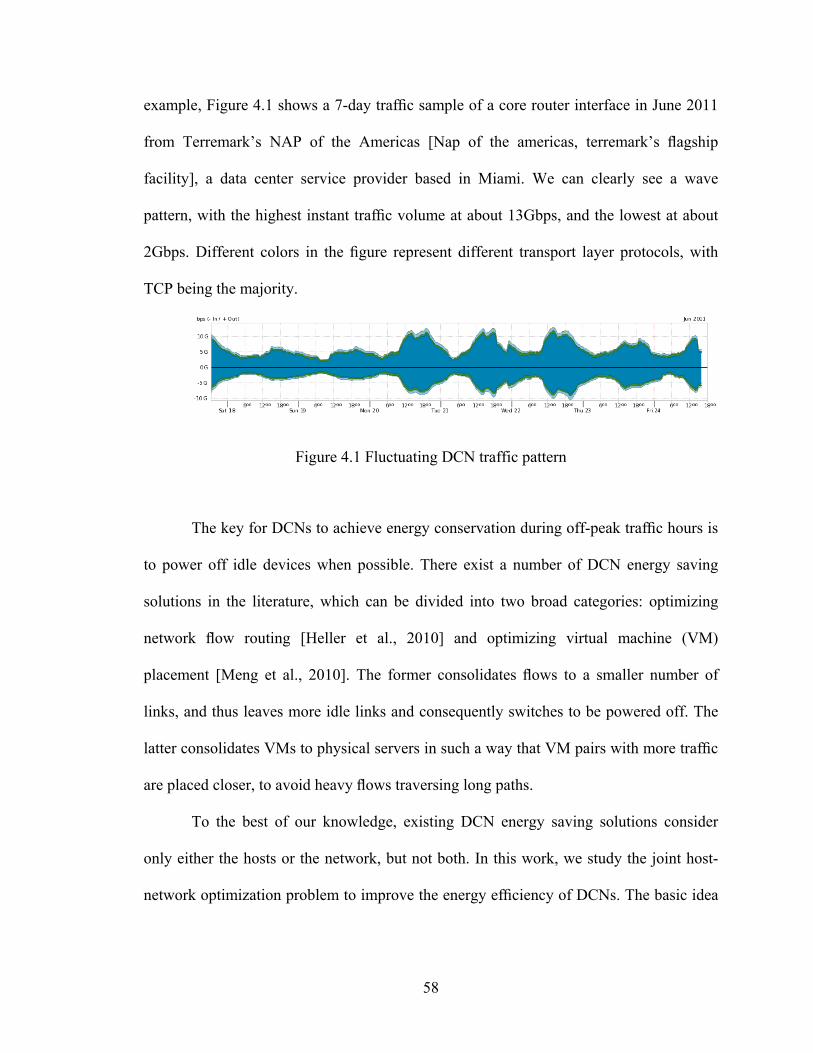
58
example, Figure 4.1 shows a 7-day traffic sample of a core router interface in June 2011
from Terremark’s NAP of the Americas [Nap of the americas, terremark’s flagship
facility], a data center service provider based in Miami. We can clearly see a wave
pattern, with the highest instant traffic volume at about 13Gbps, and the lowest at about
2Gbps. Different colors in the figure represent different transport layer protocols, with
TCP being the majority.
Figure 4.1 Fluctuating DCN traffic pattern
The key for DCNs to achieve energy conservation during off-peak traffic hours is
to power off idle devices when possible. There exist a number of DCN energy saving
solutions in the literature, which can be divided into two broad categories: optimizing
network flow routing [Heller et al., 2010] and optimizing virtual machine (VM)
placement [Meng et al., 2010]. The former consolidates flows to a smaller number of
links, and thus leaves more idle links and consequently switches to be powered off. The
latter consolidates VMs to physical servers in such a way that VM pairs with more traffic
are placed closer, to avoid heavy flows traversing long paths.
To the best of our knowledge, existing DCN energy saving solutions consider
only either the hosts or the network, but not both. In this work, we study the joint host-
network optimization problem to improve the energy efficiency of DCNs. The basic idea
59
is to simultaneously consider VM placement and network flow routing, so as to create
more energy saving opportunities. The simplest way to combine host and network based
optimization is just to naively first determine the VM placement and then the flow
routing. Unfortunately, the existing VM placement algorithm [Meng et al., 2010] is not
practical, since it does not consider the bandwidth capacity constraints of links, assumes
fixed VM memory sizes, and has high time complexity of O(|V|4), where V is the set of
VMs.
For effective joint host-network optimization, the first challenge is how to
simultaneously consider the two types of optimization problems. To address the
challenge, we present a unified representation method that converts the VM placement
problem as a routing problem, so that a single optimization solution can apply to both
types of problems. Further, the second challenge is how to accelerate the processing of
the huge number of VMs in a data center. To this end, we propose a parallelizing
approach that divides the DCN into clusters based on their subnet IP addresses, and
processes the clusters in parallel for fast completion. Finally, the third challenge is how to
quickly find efficient routing paths for the flows. To solve this problem, we propose a
topology oriented fast multipath routing algorithm, which uses depth-first search to
quickly traverse between the hierarchical layers in a DCN, and the best-fit criterion to
maximize flow consolidation.
In this chapter, we propose a joint host-network energy optimization scheme that
combines VM placement and flow routing optimization. We first formulate the problem
as an integer linear program. Since integer linear programming is NP-complete and not
suitable for practical deployment, we then propose a series of techniques to quickly and

60
effectively solve the joint optimization problem. In addition, we have implemented the
proposed scheme in a simulator and conducted extensive simulations to compare it with
existing solutions. The simulation results fully demonstrate that our scheme outperforms
existing host- or network-only optimization solutions, and well approximates the ideal
but NP-complete linear program.
4.2 Background and Related Works
In this section, we briefly review existing energy saving solutions for DCNs and
more broadly wide area networks. Those solutions can be divided into two broad
categories: network-side optimization and host-side optimization.
4.2.1 Data Center Topology
Current data centers follow to a great extend a common network architecture,
known as the three-tier architecture. At the bottom level, known as the access tier, each
server connects to one (or two, for redundancy purposes) access switch. Each access
switch connects to one (or two) switches at the aggregation tier, and finally, each
aggregation switch connects with multiple switches at the core tier. While the physical
topology in such three-tier architecture is a multi-rooted forest topology, in reality
packets are forwarded according to the logical layer-2 topology that is created with the
use of VLANs and the spanning tree algorithm. This layer-2 topology is always a tree,
usually rooted at one of the core switches.
Scaling the three-tier architecture is achieved by scaling up each individual
switch, i.e. by increasing its fan-out, rather than scaling out the topology itself. For

61
example, the core tier can accommodate 8 switches at most. Topology scaling limitations
as well as other ones such as the need for flat address space, or the high server
oversubscription, have prompted recently many parallel efforts in redefining the network
architecture of the data centers. These topologies can be divided into two categories. One
is switch-center topology, i.e., putting interconnection and routing intelligence on
switches, such as Fat-Tree [Al-Fares et al., 2008] and VL2 [Greenberg et al., 2009]. In
contrast, the other category is server-centric, namely, servers, with multiple NIC ports,
also participate in interconnection and routing. BCube [Guo et al., 2009] and FiConn [Li
et al., 2009], all fall into the latter category.
Fat-Tree is the representative one among these current three-tier architectures. It
can be routed deadlock free without additional resources, fault-tolerant through its path
diversity, full bisection bandwidth for arbitrary permutations, and performance suffer
slightly due to static routing. It is organized a k-ary fat-tree. There are k pods, each
containing two layers of k/2 switches. Each k-port switch in the lower layer is directly
connected to k/2 hosts. Each of the remaining k/2 ports is connected to k/2 of the k ports
in the aggregation layer of the hierarchy. There are (k/2)2 k-port core switches. Each core
switch has one port connected to each of k pods. The ith port of any core switch is
connected to pod i such that consecutive ports in the aggregation layer of each pod switch
are connected to core switches on (k/2) strides. In general, a fat-tree built with k-port
switches supports k3/4 hosts. In this work, we focus on fat-tree with k=4 as shown in
Figure 3.2(b).

62
4.2.2 Network-Side Optimization
In the first category, ElasticTree [Heller et al., 2010] is a DCN power manager to
find the set of switches and links that can accommodate the traffic and consume the
minimum power. In addition, ElasticTree also addresses the robustness issue so that the
optimized network has sufficient safety margins to prepare for traffic surges and network
failures. GreenTE [Zhang et al, 2010] manipulates the routing paths of wide area
networks, so that the least number of routers shall be used to satisfy the performance
constraints such as traffic demands and packet delays. Energy conservation can be
achieved by then shutting down the idle routers and links without traffic. [Fisher et al.,
2010] proposes an energy saving scheme for the idle cables in bundled links. By
reorganizing network traffic and powering off individual cables as well as the associated
line cards in the low-utilized bundles, the scheme achieves a theoretical 79%
improvement on energy efficiency for backbone networks. [Abts et al., 2010] indicates
that a flattened butterfly DCN topology is more energy efficient than the folded Clos
topology. [Mahadevan et al., 2010] presents a large power profile study for the power
manager Urja in an enterprise network, which save over 30% of the network energy.
[Shang et al., 2010] establishes a model of energy-aware routing in DCNs, and designs a
heuristic to achieve the goal.
4.2.3 Host-Side Optimization
In the host-side optimization category, one approach is to optimize VM placement
using live migrations [Clark et al., 2005], which will help consolidate VMs into fewer
physical servers and traffic flows into fewer links. [Meng et al., 2010] proposes a traffic-

63
aware VM placement scheme that localizes large traffic chunks and thus reduces load of
high layer switches. The scheme achieves energy conservation by shutting down idle
servers and switches after the placement. [Wang et al., 2011] studies the VM
consolidation problem in the context of dynamic bandwidth demands. The problem is
formulated as a stochastic bin packing problem and proved as NP-hard. We then propose
an approximation algorithm, which uses fewer servers while still satisfies all the
performance constraints. The second host-side optimization approach is to improve the
energy proportionality on the server itself. PowerNap [Meisner et al., 2009] is an energy
saving scheme for servers to quickly switch between two states: a high-performance
active state to transmit traffic, and an idle state with low power to save energy.
4.3 Problem Formulation
It is easy to see that the joint host-network energy optimization problem is a
variant of the multi-commodity problem [Cormen et al., 2009], and can be formulated as
a linear program. The optimization objective is to minimize the power consumption of all
the servers, switches, and links in a DCN. Recent studies [Heller et al., 2010],
[Mahadevan et al., 2010], [Pelley et al., 2009] indicate that power consumption of servers
and switches in data centers can be roughly modeled as linear functions, which are
suitable for linear programming. Even with non-linear power functions, various
approximation techniques [Medhi and Ramasamy, 2007] can help convert them to piece-
wise linear ones.
Model a DCN as a directed graph G = (S ∪ X, L), where a node s ∈ S is a
physical server, a node x ∈ X is a switch, and an edge (ni, nj) ∈ L is a link connecting a

64
switch and a server or two switches. Assume that V is the set of VMs, and a VM v ∈ V
must be hosted by a server s, denoted by host (s, v) = 1. When a server hosts a VM, the
former provides the latter with various resources, such as memory space and CPU time,
and we use memory space as a representative of such resources. Each server s has a
memory capacity mc(s), and each VM v has a memory demand md(v). Due to constraints
such as subnet IP addresses and hardware configurations, a VM v has a restricted set of
migration destination servers, denoted as DS(v) ⊂ S. Use on(∗) to denote that a device ∗
is powered on, which may be a switch, link or sever, and use p(∗) to denote the power
consumption of the device ∗.
Table 4.1 Notations for problem formulation.
Notation Meaning
v, s, x, f virtual machine, server, switch, or flow
(ni, nj) link connecting two nodes ni and nj , with one node being a switch,
and the other being be a switch or server
V, S, X, L, F set of virtual machines, servers, switches, links, or flows
DS(v) potential migration destination servers of VM v
md(v) memory demand of VM v
mc(s) memory capacity of server s
src(f), dst(f) source or destination VM of flow f
bd(f) bandwidth demand of flow f
bc(ni, nj) bandwidth capacity of link (ni, nj)
p(*) linear power function of ∗, where ∗ may be a server, switch, or link

65
on(*) decision variable: 1 or 0 if ∗ is powered on or off, where ∗ may be a
server, switch, or link
host(s, v) decision variable: 1or0ifVM v is or not hosted on server s
route(f, (ni, nj)) decision variable: 1or0ifflow f is or not routed through link (ni, nj)
Assume that f ∈ F is a flow in the DCN. f is defined as a triple f = (src (f), dst (f),
bd (f)), where src (f) is the source VM, dst (f) is the destination VM, and bd (f) is the
bandwidth demand. Use route (f, (ni, nj)) to denote whether flow f is routed through link
(ni, nj). fk(xi, xj) can only be either or to prohibit splitting a single flow among multiple
paths. The reason is that, as seen in Figure 4.1, more than 99% of data center traffic flows
are TCP ones [Alizadeh et al, 2010], which will suffer performance degradation with out-
of-order packet delivery. Note that a link (ni, nj) ∈ L has a bandwidth capacity bc (ni, nj).
With the above notations (summarized in Table 4.1), we can thus formulate the
joint optimization problem as the following linear program. Equation 4.1 is the objective
function, simply to minimize the total power consumption of all the switches, links, and
servers.
Minimize
SsXx L j) i,(
ji p(s)nn
)n ,p(np(x) (4.1)
Subject to
on(s)v)host(s,V,vS,s (4.2)
mc(s)on(s) v)s,md(v)host(S,sVv
(4.3)
DS(v)s
1 v)host(s,V,v , 0 v)host(s,DS(v)\Ss
(4.4)
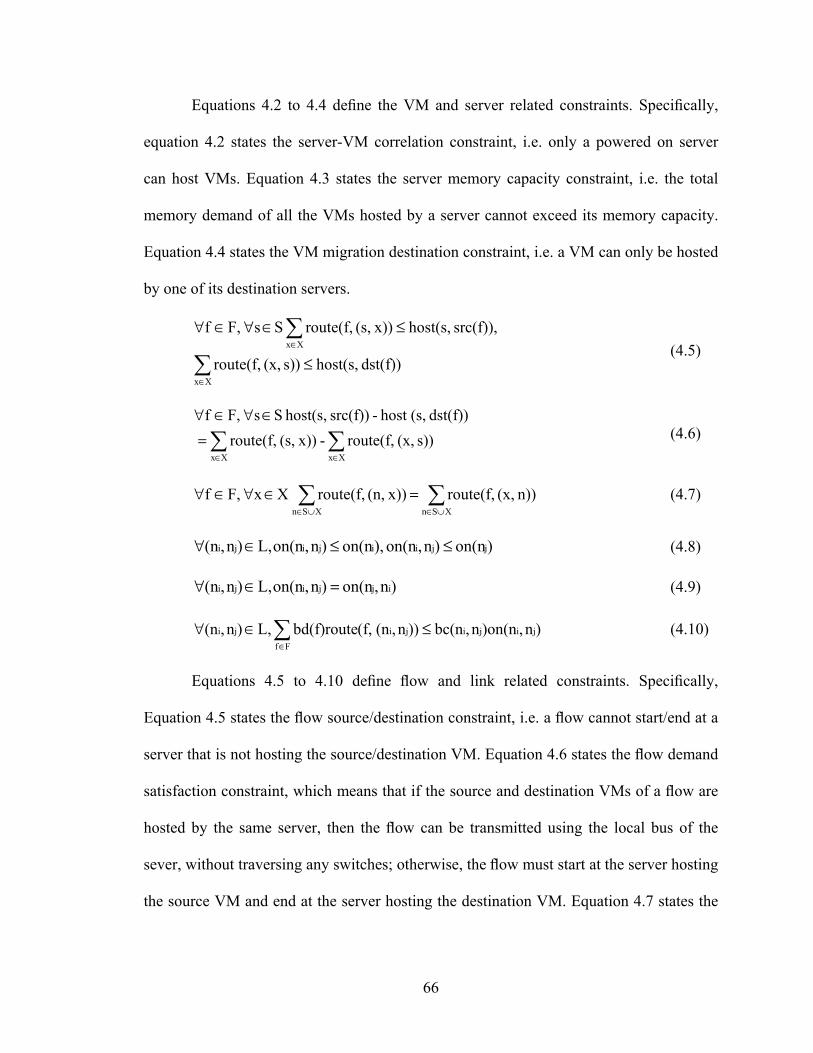
66
Equations 4.2 to 4.4 define the VM and server related constraints. Specifically,
equation 4.2 states the server-VM correlation constraint, i.e. only a powered on server
can host VMs. Equation 4.3 states the server memory capacity constraint, i.e. the total
memory demand of all the VMs hosted by a server cannot exceed its memory capacity.
Equation 4.4 states the VM migration destination constraint, i.e. a VM can only be hosted
by one of its destination servers.
dst(f)) host(s,s)) (x, route(f,
src(f)), host(s, x))(s, route(f, S s F,f
Xx
Xx
(4.5)
XxXx
s)) (x, route(f, - x))(s, route(f,
dst(f)) (s,host - src(f)) host(s, S s F,f (4.6)
XSnXSn
n)) (x, route(f, x))(n, route(f, X x F,f (4.7)
)on(n)n,on(n ),on(n)n,on(nL,)n,(n jjiijiji (4.8)
)n,on(n)n,on(nL,)n,(n ijjiji (4.9)
)n,)on(nn,bc(n))n,(n (f,bd(f)route L,)n,(n jijiji
Ff
ji
(4.10)
Equations 4.5 to 4.10 define flow and link related constraints. Specifically,
Equation 4.5 states the flow source/destination constraint, i.e. a flow cannot start/end at a
server that is not hosting the source/destination VM. Equation 4.6 states the flow demand
satisfaction constraint, which means that if the source and destination VMs of a flow are
hosted by the same server, then the flow can be transmitted using the local bus of the
sever, without traversing any switches; otherwise, the flow must start at the server hosting
the source VM and end at the server hosting the destination VM. Equation 4.7 states the

67
switch flow conservation constraint, i.e. a switch can only transmit flows but not generate
or destroy any. Equation 4.8 states the node-link correlation constraint, i.e. only a
powered on switch can have active links. Equation 4.9 states the bidirectional link power
constraint, i.e. both directions of a link should have the same on/off status [Heller et al.,
2010]. Equation 4.10 states the link bandwidth capacity constraint, i.e. the total
bandwidth demand of all the flows through a link cannot exceed its bandwidth capacity.
Ln)(x,
n) on(x,β(x) α(x)on(x) p(x) X,x (4.11)
)n ,)on(nn ,(n )n ,p(n L, )n ,(n jijijiji (4.12)
v)(s,host ε(s) δ(s)on(s) p(s)S,sVv
(4.13)
Equations 4.11 to 4.13 are sample power functions for switches, links, and
servers. Equation 4.11 defines that a powered on switch x consumes α (x) base power,
and each active port consumes additional β (x) power [Heller et al., 2010]. Equation 4.12
defines that an active link (ni, nj) consumes 2γ(ni, nj) power, or γ(ni, nj) for each direction.
Equation 4.13 defines that a server s consumes δ (s) base power, and each hosted VM
consumes additional € s power due to increased CPU usage [Pelley et al., 2009].
Since integer linear programing is NP-complete, the above formulation is not
suitable for practical deployment, but it can still be an ultimate bench mark to evaluate
other approximation solutions.
4.4 Design Guidelines
In this section, we elaborate our design guidelines to quickly and efficiently solve
the joint optimization problem.

68
4.4.1 Unified Representation of Both Types of Optimization
For effective joint optimization, the first challenge is that there are two types of
optimization, i.e. VM placement and flow routing, and it is not clear how to
simultaneously consider them. We propose a unified representation method that converts
the VM placement problem to a routing problem, so that a single solution can apply to
both optimization problems. DCNs are typically organized in a multiple-layer
hierarchical structure. For example, Figure 4.2(a) shows a fat tree based DCN with core,
aggregation, and top-of-rack (ToR) three layers of switches, and an additional layer of
servers.
The key observation is that the VM-server relationship is similar to that of sever-
switch. A VM can select to reside on one of multiple allowed servers, and send its traffic
through the physical network adapter of the hosting server. This is similar to the selection
made by a server to pick one of multiple connected ToR switches to send its traffic.
Inspired by the observation, we add an additional hierarchical layer of VMs. In detail, we
create in the graph a new node for each VM, and use an edge to connect it with a server if
it can migrate to the server. Figure 4.2(b) shows a simple example, where v1,v2, and v3
can migrate to any server connected by the same aggregation switch, and v4 can migrate
to any server connected by the same ToR switch. In the optimization process, we search
routing paths for the flows between VM pairs. If a VM has a path to a server in the
optimization result, then the VM will be hosted by the server. In this way, we provide a
unified view to solve both optimization problems.
The next challenge is then to determine the capacity of the newly added edges
between VMs and servers. Theoretically, a server can sustain a very large amount of

69
traffic between two hosted VMs by the local bus, and therefore the bandwidth capacity
constraints are not important for VM-server edges. However, the servers do have memory
capacity constraints with the VMs. To reflect such constraints, we create a dummy node
for each server, and use an edge to connect them whose capacity will be the memory
capacity of the server. We now let the VMs connect to the dummy node instead of the
server. Specifically, if a VM can migrate to a server, the VM has an edge with infinite
capacity connecting to the dummy node of the server. When search a path for a flow
between the dummy node and the server or vice versa, the demand of the flow will be the
memory demand of the closer end VM instead of bandwidth demand. In this way, the
VMs connected to a server is constrained by the server memory capacity. Figure 4.2(c)
shows the results after adding the dummy nodes to Figure 4.2(b).
Finally, there is a difference between a VM node and a physical server node.
While a server can send different flows to different ToR switches, a VM has to send all
its flows through the same physical server. In other words, a VM can select only one of
the links connecting to different dummy nodes. If a VM has multiple traffic flows, all of
them should share the same path between the VM and the hosting server.

70
Figure 4.2 Unified representation of VM placement and flow routing.

71
4.4.2 Cluster based Parallel Processing
To accelerate processing the huge number of VMs in a data center, we propose a
parallelizing approach that divides the DCN into clusters to reduce the problem size, and
processes the clusters in parallel for fast completion. The design is based on the
requirement that live VM migration needs to keep ongoing network connections and
therefore the current IP address [Mysore et al., 2009]. Although with existing techniques
such as mobile IP [Kurose and Ross, 2007], it is possible for an IP address to move into a
different subnet (or a foreign network in the term of mobile IP) and keep the ongoing
connections, there is an expensive overhead caused by triangle routing [Kurose and Ross,
2007]. As a result, we assume that a VM will only migrate within its own subnet [Mysore
et al., 2009], which consists of a fixed set of servers connecting to the same router
interface by the predefined wiring. Note that a VM may not be able to migrate to every
server in the subnet because of other constraints, such as different hardware
configurations.
The main idea is to organize the servers and VMs in the same subnet as a cluster,
and conduct intra- and inter-cluster processing separately at reduced scales. For intra-
cluster processing, we find the paths for all traffic flows between the VMs in the cluster,
and as a result determine the placement of such VMs. If a VM has only inter-cluster
flows, i.e. to VMs in other clusters, we simply calculate its placement according to its
memory and bandwidth demands. The reasoning is that the DCN topology is usually
symmetric, and VM placement anywhere in the cluster is not likely to affect inter-cluster
routing.

72
The advantages are two-fold. First, by dividing the problem into a few smaller
scale ones, the parallelizing approach reduces the solution search space and allows fast
completion. Second, since intra-cluster processing of different clusters are independent, it
can be done in parallel to reduce the total processing time.
4.5 Host-Network Joint Optimization Scheme
With the above design guidelines, we now present a fast topology oriented
multipath routing algorithm to quickly search paths for the intra- and inter-cluster flows.
The design utilizes the hierarchical feature of DCN topologies to conduct fast routing.
The basic idea is to use depth-first search to find a sequence of best-fit links for the flow.
Since a path usually includes links connecting nodes at different layers, depth first search
can quickly traverse the layers. If the search has exhausted all the links in a layer and
cannot proceed further, it is necessary to backtrack to the previous layer [Cormen et al.,
2009] and try the next candidate. For easy description, we define the VMs to be the
lowest layer, and the upstream direction to be from a lower layer node to a higher layer
one.
When there are multiple available links to the next hierarchical layer, the best-fit
criterion selects the one with the best matching capacity, i.e. the smallest and sufficient
capacity, so as to consolidate the flows to a few links and improve energy conservation.
Compared with the first-fit criterion that also tends to consolidate flows but has O(N) time
complexity to select from N links, best-fit achieves O(logN) time complexity by
conducting binary search on a sorted list. Note also that N increases with the DCN size.
Compared with worst-fit that distributes flows to available links in a load balancing way,

73
best-fit maximizes flow consolidation. A concern is then whether the flow consolidation
by best-fit will exhaust bandwidth of a specific link, and block a future flow that has to
use this link. Fortunately, a switch in a typical DCN has more than one link to switches in
the neighboring layers for path redundancy, and therefore the probability for all the links
to be unavailable is small. Further, exhaustive depth-first search with backtracking
guarantees to explore every possible path, and we observe that all the three selection
criteria have similar routing success ratios, close to 100% under reasonable traffic loads,
as shown in section 4.6.
As the initialization, the scheme uses the unified representation method in Section
4.4.1 to show all the VMs, servers, and switches in a graph. The scheme first processes
each cluster, which is the subgraph corresponding to the subnet, and then searches paths
between the subgraphs for inter-cluster flows.
4.5.1 Intra-cluster Processing
Intra-cluster processing starts with sorting the VMs in the cluster by their memory
demands in a decreasing order, for two reasons. First, VM migrations consume energy,
which is proportional to the VM memory image size. By sorting the VM memory
demands, we intend to keep the VMs with large memory images intact and move those
with small ones. Second, the scheme will use best-fit decreasing for VM placement, since
it has better performance than best-fit [Cormen et al., 2009]. This will result in a smaller
number of hosting servers.
Next, the scheme searches paths for intra-cluster flows using the depth-first best-
fit rule. The scheme picks among the VMs with intra-cluster flows the one with the

74
largest memory demand, and processes its intra-cluster flows one by one. Initially, neither
the source nor the destination VM has found a hosting server, the path will include three
possible sections: VM-to-server, server-to-switch-to-server, and server-to-VM. Note that
if the two VMs migrate to the same server, the path does not need to traverse any switch.
The first step of the path searching is to determine the necessary layer to connect
the source and destination VMs. Hosts in DCNs usually have IP addresses corresponding
to their topological locations. For example, in a fat tree based DCN, hosts in the same
pod usually share the same subnet address [Mysore et al., 2009]. Thus, it is easy to
determine by which layer the two edge switches can be connected. Since the network
topology and IP address assignment are known in advance, it is appropriate to do the
calculation for all IP addresses in advance and store the results, so that they can be
quickly obtained during path searching. Determining the connecting layer avoids wasting
bandwidth of switches at higher layers, which will be available for future flows.
After determining the connecting layer, the scheme searches paths for intra-
cluster flows using the depth-first best-fit rule. Specifically, starting from the source VM,
the scheme searches upstream by selecting the best-fit link to the next higher layer. After
reaching the connecting layer, the searching direction turns downstream, similarly by
selecting the best-fit link to the next lower layer. For certain topologies, such as the fat
tree, the downstream path to a specific server is determined after reaching the connecting
layer. Since the depth-first best-fit rule does not guarantee a path on the first try,
backtracking with the next candidate or to a higher layer may be necessary. However, the
depth-first search guarantees O (|N|+|E|) time complexity [Cormen et al., 2009], where N

75
and E are the node and edge set, respectively. For easy understanding, Table 4.2 gives the
pseudo code description of the depth-first best-fit search.
Table 4.2 Pseudo code description of depth-first best-fit search.
DFS(s, d,G) // s: source, d: destination, G: network
1 H = necessary-layer-to-connect(s, d,G);
2 path = {};
3 u = s;
4 next =1; // flag indicating search direction, 1: upstream, -1: downstream
5 return SEARCH(u, path, next);
SEARCH(u, path, next) {
1 if(u = d) {path = path + u; return true;}
2 if ( layer-of(u)= H) next = −1; // reverse search direction after reaching connecting layer
3 if( next = −1 && layer-of(u)=1) return false;
4 neighbors = adjacent nodes of u in layer (layer-of(u)+ next);
5 found = false;
6 while (neighbors = ∅ && found = false) {
7 v = best-fit(neighbors); neighbors = neighbors − v;
8 found = SEARCH(v, path,next);
9 };
10 return found;

76
Recall that for the VM-to-server section, the capacity between the dummy node
represents the available memory capacity of the server and the flow demand is the
memory demand of the source VM. If the source VM is connected to multiple servers and
they have the same smallest but sufficient capacity, preference will be given to the
current hosting server of the VM. If the servers in the cluster are homogeneous in terms
of memory and bandwidth configurations, the first VM will stay on its current server, and
thus we avoid migrating the VM with the largest memory demand among the ones with
intra-cluster flows. Similarly, for the sever-VM section, the link capacity between the
server and the dummy node is the server memory space, and the flow demand is the
memory demand of the destination VM.
Once the scheme finds the path for an intra-cluster flow, the placement of the
source and destination VMs are determined as well based on the VM-to-server and
server-to-VM paths. The scheme will thus move the VMs to the selected servers, so that
additional flows of the VMs can start from the servers instead.
After the scheme finishes processing a flow, it picks another among the remaining
ones of the same VM or the VM with the next largest memory demand. The processing
of the newly selected flow is similar. However, since the source and destination VMs of
the flow may have been determined, the scheme searches a path between the servers
instead of the VMs. The scheme continues the iterations until finishes processing the
VMs with intra-cluster flows. For each of the remaining VMs with only inter-cluster
flows, the scheme decides only its hosting server based on the memory and bandwidth
demands by the best-fit criterion with priority given to the memory demand.

77
4.5.2 Inter-cluster Processing
Inter-cluster processing searches paths for flows between different clusters, using
the same depth-first best-fit rule. After intra-cluster processing is done, all the VMs have
found their hosting servers and corresponding ToR switches. Similar as intra-cluster
processing, inter-cluster processing first determines the necessary layer to connect the
source and destination ToR switches, which is solely based on the network topology and
can be calculated in advance. Then, starting from the source ToR switch, the scheme
searches upstream by selecting the best-fit link. After reaching the connecting layer, the
scheme turns downstream by also selecting the best-fit link. Again, backtracking may be
necessary to successfully find a path. Figure 4.2(d) shows the example optimization
results after applying the joint optimization scheme to the DCN in Figure 4.2(a), where a
VM pair with the same color has a flow between them.
4.6 Simulation Results
We have implemented the proposed joint host-network energy optimization
scheme in a simulator, and compared it with the network-only [Heller et al., 2010], host-
only [Meng et al., 2010], and the linear programing optimization solutions. The
simulation results demonstrate that our design outperforms the network- and host-only
optimization solutions, and well approximates the ideal linear program.
4.6.1 Comparison with Linear Program
First, we compare our joint optimization scheme with the ideal linear program, as
well as the network-only optimization solution.We use the 32-bit IBM ILOG CPLEX

78
[Ibm ilog cplex optimizer] as the linear program solver. For network-only optimization,
we pick the greedy-bin packing algorithm in [Heller et al., 2010], because the topology-
aware heuristic uses different assumptions by splitting a flow among multiple paths. We
do not include host-only optimization in this subsection, because it assumes that all the
VMs have the same memory demand.
Since the linear program is NP-complete, the simulations can only be at small
scales. We consider a fat tree with k, i.e. k3/4 = 16 servers, with each link having a
bandwidth capacity of 1Gbps. Each server has a memory capacity of 8GB. The memory
demand of a VM is a random number between 500MB to 1GB, and the number of VMs
is determined by the memory load parameter. We restrict that a VM can only migrate to a
server connected by the same aggregation layer switch, i.e. within the same pod [Mysore,
2009]. Each VM has 2 flows in average with uniformly distributed destinations, and the
the flow bandwidth demand is determined by the traffic load parameter. We use equations
4.11 and 4.13 as the switch and server power functions, respectively, with α (x) = δ (s)
and β (x) = € (x) =10, and assume that links are powered by the switches and consume no
additional energy.

79
Figure 4.3 Comparison with linear program and network-only optimization.
In Figure 4.3, we let the memory load equal to the traffic load, which changes
from 0.1 to 0.9, and compare the power saving percentages of the three solutions. We can
see that our scheme is consistently superior over network-only optimization, up to 40%
better. On the other hand, our scheme well approximates the linear program, which is
NP-complete. We tried to solve the linear program with a higher load or a larger network
size, but CPLEX reported insufficient memory errors due to too many constraints.
4.6.2 Comparison with Network-only Optimization
Next, we compare the joint and network-only optimization solutions on a fat tree
with k = 16. The simulation settings are similar to those in the previous subsection.
In Figure 4.4(a), we adjust the memory and traffic load, and compare the power
saving percentage of the two solutions. Joint optimization consistently outperforms
network-only optimization. While the power consumption of network-only optimization
0 0.1 0.2 0.3 0.4 0.50
20
40
60
80
100
Memory and traffic load
Per
cent
age
of fu
ll po
wer
Fat tree with k=4
Linear ProgramJointNetwork−only

80
0 0.2 0.4 0.6 0.8 10
20
40
60
80
100
Memory and traffic load
Per
cent
age
of fu
ll po
wer
Fat tree with k=16
JointNetwork−only
0 0.2 0.4 0.6 0.8 10
20
40
60
80
100
Percentage of intra−cluster traffic
Per
cent
age
of fu
ll po
wer
Fat tree with k=16
JointNetwork−only
0 0.2 0.4 0.6 0.8 10
20
40
60
80
100
Traffic load
Per
cent
age
of fu
ll po
wer
Fat tree with k=16
JointNetwork−only
0 0.2 0.4 0.6 0.8 10
20
40
60
80
100
Memory load
Per
cent
age
of fu
ll po
wer
Fat tree with k=16
JointNetwork−only
increases quickly with the load, joint optimization demonstrates energy proportionality.
In Figure 4.4(b), we fix the memory and traffic load at 0.3 and adjust the percentage of
intra-cluster traffic. Joint optimization still performs much better than network-only
optimization. As the percentage of intra-cluster traffic increases, we can see that the
performance of joint optimization improves, because there are more optimization
opportunities for intra-cluster processing. In Figure 4.4(c), we fix the memory load at 0.5
and adjust the traffic load. The power consumption of both solutions increases with the
traffic load, but joint optimization still beats network-only optimization. In Figure 4.4(d),
we fix the traffic load at 0.5 and adjust the memory load, and the conclusion is similar to
that in Figure 4.4(c). In Figure 4.4(e), we use the following different power functions:
)(1 200powerswitch ports totalof #powers active of # (4.14)
)(1 200powerserver memory available totalVMs hosted ofmemory (4.15)
(a) Different memory and traffic loads. (b) Different traffic patterns.

81
0 0.2 0.4 0.6 0.8 10
20
40
60
80
100
Memory and traffic load
Per
cent
age
of fu
ll po
wer
Fat tree with k=16
JointNetwork−only
0 0.2 0.4 0.6 0.8 190
95
100
105
110
Memory and traffic load
Rou
ting
succ
ess
ratio
Fat tree with k=16
JointNetwork−only
(c) Different traffic loads. (d) Different memory loads.
(e) Different power functions. (f) Routing success ratios.
Figure 4.4 Comparison with network-only optimization.
Under the new power functions, joint optimization still performs better than
network-only optimization. Finally, in Figure 4.4(f), we compare the routing success ratio
of the two solutions. Although our scheme is not designed to work under heavy loads for
a high routing success ratio, it achieves about 100% routing success under reasonably
heavy loads, and so does network-only optimization.
4.6.3 Comparison with Host-only Optimization
Finally, we compare the joint and host-only optimization solutions on a fat tree
with k . Since the host-only optimization solution considers VM placement but not flow
routing, we use a OSPF like ECMP multipath routing algorithm for it in the simulations.
Because host-only optimization assumes fixed VM memory demands, we use a value of
0.8GB.

82
In Figure 4.5(a), we adjust the memory and traffic load, and compare the power
saving percentage of the two solutions. Both solutions demonstrate similar and
proportional power efficiencies, with joint optimization having a slight advantage. In
Figure 4.5(b), we fix the memory and traffic load at 0.3 and adjust the percentage of intra-
cluster traffic. Joint optimization is still better than network-only optimization. Similarly,
the performance of joint optimization improves with the increase of intra-cluster traffic,
because there are more optimization opportunities. In Figure 4.5(c), we fix the memory
load at 0.5 and adjust the traffic load. Joint optimization is initially better than host-only
optimization, but becomes worse after the traffic load is greater than 0.6. This implies
that host-only optimization does a better job in terms of VM placement. However, we
should also notice that, host-only optimization has higher time complexity as the cost. On
the other hand, the performance of host-only optimization is not sensitive to the change
of traffic load, because it optimizes only VM placement. In Figure 4.5(d), we fix the
traffic load at 0.5 and adjust the memory load. Joint optimization is initially worse than
host-only optimization, but becomes better after the memory load is grater than 0.5. It is
interesting to note that the performance of host-only optimization is almost linear to the
memory load. Finally, in Figure 4.5(e), we use the second set of switch and server power
functions, and joint optimization still outperforms host-only optimization.

83
0 0.2 0.4 0.6 0.8 10
20
40
60
80
100
Memory and traffic load
Per
cent
age
of fu
ll po
wer
Fat tree with k=16
JointHost−only
0 0.2 0.4 0.6 0.8 10
20
40
60
80
100
Traffic load
Per
cent
age
of fu
ll po
wer
Fat tree with k=16
JointHost−only
0 0.2 0.4 0.6 0.8 10
20
40
60
80
100
Memory load
Per
cent
age
of fu
ll po
wer
Fat tree with k=16
JointHost−only
0 0.2 0.4 0.6 0.8 10
20
40
60
80
100
Percentage of intra−cluster traffic
Per
cent
age
of fu
ll po
wer
Fat tree with k=16
JointHost−only
(a) Different memory and traffic loads. (b) Different traffic patterns.
(c) Different traffic loads. (d) Different memory loads.
(e) Different power functions.
Figure 4.5 Comparison with host-only optimization.
0 0.2 0.4 0.6 0.8 10
20
40
60
80
100
Memory and traffic load
Per
cent
age
of fu
ll po
wer
Fat tree with k=16
JointHost−only

84
4.7 Discussions
In this section, we discuss the implementation of the proposed joint optimization
scheme and other practical issues.
4.7.1 Implementation
The implementation of the joint optimization scheme requires a network
controller such as one based on the Open-Flow [Mckeown et al., 2006] protocol, and a
VM controller such as VMW are vMotion [Vmware vmotion for live migration of virtual
machines]. OpenFlow enables the network controller to control the flow routing paths by
manipulating the flow table in each switch. OpenFlow has been considered in many
recent data center designs [Heller et al., 2010], [Mysore, 2009] for various purposes.
Although OpenFlow uses a central logical controller, there exist many proposals [Curtis
et al., 2011], [Yu et al., 2010] to enhance its scalability. vMotion continuously monitors
VM performance, and is able to perform live VM migrations with zero downtime.
The ToR switches and the VM controller periodically collect the flow and VM
information, respectively, and send it to the network controller. Then, the network
controller will run the joint optimization scheme to calculate the VM placement and flow
routing. Finally, the controller sends the optimized results to all the switches and VM
controller to enforce the flow routing and VM placement.
4.7.2 Energy Consumed by VM Migration
It should be noted that while we try to reduce energy consumption by migrating
VMs, the operation of VM migration itself also consumes energy, but it is fortunately a

85
one-time overhead. Since VM migration is essentially to copy the VM memory image
between servers, its energy consumption can be estimated by by the size of the VM
memory image. While all the existing DCN energy optimization solutions target
minimizing instant power, the VM migration overheads can be considered by deducting
them from the the expected energy savings by a solution, if we know the duration of the
current traffic matrix.
4.7.3 Safety Margins
While our design uses the best-fit criterion to maximize flow consolidation, it is
necessary to leave certain safety margins for redundancy and traffic burst. This can be
done by leaving a certain percentage of the link capacity untouched in the optimization
process, and it will be our future work to determine a reasonable percentage value.
4.8 Conclusions
The data center network has become a major fraction of the energy consumption
of a data center. In this work, we propose a joint host-network optimization scheme that
directs layer 3 and layer 7 to improve the energy efficiency of DCNs. First, we present a
unified representation method to convert the virtual machine placement problem to a
routing problem, so that a single solution can apply to both types of optimization. Next,
we describe a parallelizing approach that divides the DCN into clusters based on subnet
IP addresses, and processes the clusters in parallel for fast completion. Further, we
propose a fast topology oriented mutipath routing algorithm that can quickly find paths
by using depth-first search to traverse between the hierarchical layers, and maximize

86
energy conservation by using the best-fit criterion to consolidate flows. Besides, network
performance (in term of routing success ratio) has very little sacrifice. In other words, our
algorithm has routing success ratio almost 100% even in heavy traffic condition. Finally,
we have conducted extensive simulations to compare our design with existing ones. The
simulation results demonstrate that our design is superior over existing host- or network-
only optimization solutions, and well approximates the ideal linear program

87
CHAPTER V
CONCLUSIONS AND FUTURE WORKS
5.1 Summary
This dissertation aims to understand energy efficiency on data center network by
implementation of our combined algorithm on four major layers (physical, data link,
network and application layer) with reference to OSI seven layers. Each chapter included
in this dissertation attempts to cover the hypotheses and objectives proposed in this study.
As demonstrated in previous chapters, several statements regarding the assessment of
power consumption practices can be addressed as the following:
1. Fair bandwidth allocation algorithm for energy efficiency on packet switch
fabric interconnects. We have shown that fair bandwidth allocation involving bit energy
(physical layer) and fabric switch architecture (data link layer) for switches could not
only allocate the feasible bandwidth for each flow at both input and output ports, but also
utilize the bandwidth of each flow efficiently. As a result, power consumption on packet
switch is lower 10-14% depending on the size of switch. Overall, this feasible algorithm
can make networking devices energy efficiency.
2. Deployment of a hybrid multicast switch in energy-aware data center network:
a case of fat-tree topology. All the proposed energy efficiency practices dealing with
one-to-many delivery on Ethernet multicast addressing (data link layer) and IP multicast
(network layer) have shown remarkable contributions in reducing electricity demand.
Firstly, we proposed the deployment of a multicast switch in a hybrid multicast network,
which combines the efficiency of IP multicast and the flexibility of P2P multicast. We
conduct extensive simulations to evaluate the transmission cost reduction and packet

88
delay improvement, and the simulation results fully demonstrate the effectiveness of our
design which the average delay of our calculated multicast switch deployment is only one
fourth of that of without multicast switches. Next, we calculate power consumption after
deploying a multicast switch in famous Fat-tree topology. Energy used is reduced by half
during off-peak hours. Besides, we can extensively deploy this scheme on weekends so
that roughly 50% of the fully-operated power consumption is saved. During peak hours,
although we need to keep few unused switches on, energy saving is one fourth of the
maximum correspondingly. Finally, Node (t) is measured during day and night.
Since the connectivity is the tightest constraint at night, being the offered traffic much
smaller than during peak hour. Saving well approximate 50% of power is achievable. In
contrast, during the day, it would be possible to turn off few nodes, so that a minimum
25% of power saving is promising which demonstrates that our proposed hybrid multicast
mode is successful comprehensively decreasing energy consumption.
3. Joint host-network optimization for energy-efficient data center networking. We
propose a joint host-network optimization scheme coping with flow routing (network
layer) and VM migration (application layer) to improve the energy efficiency of DCNs.
First, we present a unified representation method to convert the virtual machine
placement problem to a routing problem, so that a single solution can apply to both types
of optimization. Next, we describe a parallelizing approach that divides the DCN into
clusters based on subnet IP addresses, and processes the clusters in parallel for fast
completion. Further, we propose a fast topology oriented mutipath routing algorithm that
can quickly find paths by using depth-first search to traverse between the hierarchical
layers, and maximize energy conservation by using the best-fit criterion to consolidate

89
flows. Besides, network performance (in term of routing success ratio) has very little
sacrifice. In other words, our algorithm has routing success ratio almost 100% even in
heavy traffic condition. Finally, we have conducted extensive simulations to compare our
design with existing ones. The simulation results demonstrate that our design is superior
over existing host- or network-only optimization solutions, and well approximates the
ideal linear program.
5.2 Future Study Recommendations
5.2.1 Fair bandwidth allocation algorithm for energy efficiency on packet switch
fabric interconnects
While our work is deploying on non-deterministic time domain, we can set up a
threshold for time deterministic on input requested flows. Since multicast traffic is also an
important component of the Internet, our future work includes extending the parallel
bandwidth allocation algorithm to switches with multicast flows. Counting interconnect
wires power consumption and node switch power consumption into our power modeling
is also recommended.
5.2.2 Deployment of a hybrid multicast switch in energy-aware data center
network: a case of fat-tree topology
For future work, we would recommend to implement this algorithm on a bigger
network model: 8-pod Fat-tree topology so as to prove the scalability of our proposed
algorithm. Plus the analysis of Link (t) and Node (t) on multiple multicast

90
groups is also recommended. Besides, we will address IBM ILOG CPLEX optimizer in
order to mathematically analyze the efficiency of the integer linear programming.
5.2.3 Joint host-network optimization for energy-efficient data center networking
While our design uses the best-fit criterion to maximize flow consolidation, it is
necessary to leave certain safety margins for redundancy and traffic burst. This can be
done by leaving a certain percentage of the link capacity untouched in the optimization
process, and it will be our future work to determine a reasonable percentage value.
5.2.4 Future Work
Combining all proposed algorithms into a unified implementation would be left to
be done in the future. There are issues of compatibility and consistency being considered.
Not only energy savings but also a saving cost of less-demanded electricity can be added
as a proof of economic effect.

91
REFERENCES
A. C. Orgerie, “Energy-Efficiency in Wired Communication Networks,” COST Training School, Brasov - Romania, Mar 2011.
A. Greenberg, J. Hamilton, D. Maltz, and P. Patel, "The Cost of a Cloud: Research Problems in Data Center Networks," ACM SIGCOMM CCR, Jan 2009.
A. Greenberg, N. Jain, S. Kandula, C. Kim, P. Lahiri, D. Maltz, P. Patel, and S. Sengupta, “Vl2: a scalable and flexible data center network,” in ACM SIGCOMM, Barcelona, Spain, Aug. 2009.
A. Mahimkar, Z. Ge, A. Shaikh, J. Wang, J. Yates, Y. Zhang, and Q. Zhao, "Towards automated performance diagnosis in a large IPTV network," ACM SIGCOMM, pp. 231–242, 2009.
A. Moustafa, M. Youssef, N. El-Derini and H. H. Aly, “Structure and Performance Evaluation of a Replicated Banyan Network Based ATM Switch,” IEEE Sym. on Computers and Communications 1999.
A. Parekh and R. Gallager, "A generalized processor sharing approach to flow control in integrated services networks: the single node case," IEEE/ACM Transactions on Networking, 1(3):344–357, Jun. 1993.
A. R. Curtis, J. C. Mogul, J. Tourrilhes, P. Yalagandula, P. Sharma, and S. Banerjee, “Devoflow: Scaling flow management for high-performance networks,” in ACM SIGCOMM, Toronto, ON, Canada, Aug. 2011.
B. Heller, S. Seetharaman, P. Mahadevan, Y. Yiakoumis, P. Sharma, S. Banerjee, and Nick McKeown, "ElasticTree: Saving Energy in Data Center Network," NSDI Proceedings of the 7th USENIX conference on Networked systems design and implementation, Pages 17-17, 2010.
B. Magill, C. Rohrs, and R. Stevenson, "Output-queued switch emulation by fabrics with limited memory," IEEE Journal on Selected Areas in Communications, 21(4):606–615, May 2003.
B. Nordman, "Networks, Energy and Energy Efficiency," Cisco Green Research Symposium, March 2008.

92
C. Clark, K. Fraser, S. Hand, J. G. Hansen, E. Jul, C. Limpach, I. Pratt, and A. Warfield, “Live migration of virtual machines,” in USENIX NSDI, Berkeley, CA, Apr. 2005.
C. Guo, G. Lu, D. Li, H. Wu, X. Zhang, Y. Shi, C. Tian, Y. Zhang, and S. Lu, “Bcube: a high performance, server-centric network architecture for modular data centers,” in ACM SIGCOMM, Barcelona, Spain, Aug. 2009.
C. Patel, C. Bash, R. Sharma, M. Beitelmam, and R. Friedrich, “Smart cooling of data centers,” in InterPack, Maui, HI, Jul. 2003.
Cisco Systems, Inc, "Multicast with Cisco Nexus 7000," Cisco Systems, Inc, 2009.
D. Abts, M. R. Marty, P. M. Wells, P. Klausler, and H. Liu, “Energy proportional datacenter networks,” in ACM ISCA, Saint-Malo, France, Jun. 2010.
D. Grunwald, P. Levis, K. I. Farkas, C. B. Morrey, III, and M. Neufeld, “Policies for dynamic clock scheduling,” in USENIX OSDI, San Diego, CA, Oct. 2000.
D. Langen, A. Brinkmann and U. Ruckert, “High level estimation of the area and power consumption of on-chip interconnects,” IEEE Int’l ASIC/SOC Conference, 2000.
D. Li, C. X. Guo, H. T. Wu and K Tan, "FiConn: Using Backup Port for Server Interconnection in Data Centers," IEEE INFOCOM, 2009.
D. Li, H. Cui, Y. Hu, Y. Xia, and X. Wang, "Scalable data center multicast using multi-class bloom filter," IEEE ICNP, Oct.2011.
D. Li, Y. Li, J. Wu, S. Su, and J. Yu, "ESM: Efficient and Scalable Data Center Multicast Routing," IEEE Transaction on Networking, 2011.
D. Medhi and K. Ramasamy, "Network Routing: Algorithms, Protocols, and Architectures," Morgan Kaufmann, 2007.
D. Meisner, B. T. Gold, and T. F. Wenisch, “Powernap: eliminating server idle power,” in ASPLOS, Washington, DC, Mar. 2009.
D. Pan and Y. Yang, "Localized independent packet scheduling for buffered crossbar switches," IEEE Transactions on Computers, 58(2):260–274, Feb. 2009.

93
D. Pan and Y. Yang, "Max-min fair bandwidth allocation algorithms for packet switches," IEEE International Parallel and Distributed Processing Symposium (IPDPS 2007), Long Beach, CA, Mar. 2007.
D. Pan and Y. Yang, "Providing flow based performance guarantees for buffered crossbar switches," In IEEE IPDPS, Miami, FL, Apr. 2008.
D. Stiliadis and A. Varma, "Providing bandwidth guarantees in an input-buffered crossbar switch," In IEEE INFOCOM ’95, Boston, MA, Apr. 1995.
D. Tsirogiannis, S. Harizopoulos, and M. Shah, “Analyzing the energy effciency of a database server," ACM SIGMOD, pp. 231–242, 2010.
E. Eldon, "Instant message, music services are now among the most engaging Facebook apps," http://www.insidefacebook.com/author/eldon/, Nov 2011.
H. J. Chao, Cheuk H. Lam and E. Oki, “Broadband Packet Switching Technologies: A Practical Guide to ATM Switches and IP Routers,” Wiley-Interscience 2001.
Ibm ilog cplex optimizer, http://www-01.ibm.com/software/integration/optimization/cplex-optimizer/.
J. Kurose and K. Ross, "Computer networking: a top-down approach," 4th ed. Addison Wesley, 2007.
J. Liu, "Parallel Real-time Immersive network Modeling Environment (PRIME)," https://www.primessf.net/bin/view/Public/PRIMEProject, Modeling and Networking Systems Research Group, Florida International University.
J. Loper and S. Parr, "Energy Efficiency in Data Centers: A New Policy Frontier Environmental Quality Management," Alliance to Save Energy, 2007.
J. Mankoff, R. Kravets, and E. Blevis, "Some Computer Science Issues in Creating a Sustainable World," IEEE Computer Society, vol.41, no.8, pp.102-105, Aug 2008.
J. Mudigonda and P. Yalagandula, “Spain: Cots data-center ethernet for multipathing over arbitrary topologies,” in USENIX NSDI, San Josa, CA, Apr. 2010.
J. Turner, "Strong performance guarantees for asynchronous crossbar schedulers," IEEE/ACM Transactions on Networking, 17(4):1017–1028, Aug. 2009.

94
K. Chen, C. Guo, H. Wu, J. Yuan, Z. Feng, Y. Chen, S. Lu, and W. Wu, “Generic and automatic address configuration for data center networks,” in ACM SIGCOMM, New Delhi, India, Aug. 2010.
L. A. Barroso and U. Hlzle, "The Case for Energy-Proportional Computing," Computer, 2007.
L. Chiaraviglio, M. Mellia, and F. Neri, "Energy-aware Backbone Networks: a Case Study," GreenComm, 2009.
L. Mhamdi and M. Hamdi, "Output queued switch emulation by a one-cell-internally buffered crossbar switch," In IEEE GLOBECOM, San Francisco, CA, Dec. 2003.
M. Al-Fares, A. Loukissas, and A. Vahdat, “A scalable, commodity data center network architecture,” in ACM SIGCOMM, Seattle, WA, Aug. 2008.
M. Alizadeh, A. Greenberg, D. A. Maltz, J. Padhye, P. Patel, B. Prabhakar, S. Sengupta, and M. Sridharan, “Data center tcp (dctcp),” in ACM SIGCOMM, New Delhi, India, Aug. 2010.
M. Gupta and S. Singh, "Energy conservation with low power modes in Ethernet LAN environments," IEEE INFOCOM (MiniSymposium), May 2007.
M. Gupta and S. Singh, "Greening of the Internet," ACM SIGCOMM, Aug 2003.
M. Hahsler and K. Hornik, "TSP - infrastructure for the traveling salesperson problem, "Journal of Statistical Software, pp.1-21, Dec. 2007.
M. Hosaagrahara and H. Sethu, “Max-min fairness in inputqueued switches,” IEEE Transactions on Parallel and Distributed Systems, vol. 19 , no. 4, pp. 462-475, Apr. 2008.
M. Shreedhar and G. Varghese, "Efficient fair queuing using deficit round robin," IEEE/ACM Transactions on Networking, 4(3):375–385, Jun. 1996.
M. Wang, X. Meng, and L. Zhang, “Consolidating virtual machines with dynamic bandwidth demand in data centers,” in INFOCOM, Shanghai, China, Apr. 2011.
M. Yu, J. Rexford, M. J. Freedman, and J. Wang, “Scalable flow-based networking with difane,” in ACM SIGCOMM, New Delhi, India, Aug. 2010.

95
M. Zhang, C. Yi, B. Liu, and B. Zhang, “Greente: Power-aware traffic engineering,” in IEEE ICNP, Koyoto, Japan, Oct. 2010.
Morgan T. P, "The server market begins to cool in Q4. The Linux Beacon," http://www.itjungle.com/tlb/tlb022806-story03.html, February 2006.
N. McKeown, A. Mekkittikul, V. Anantharam, and J. Walrand, "Achieving 100% throughput in an input queued switch," IEEE Transactions on Communications, 47(8):1260–1267, Aug. 1999.
N. Mckeown, S. Shenker, T. Anderson, L. Peterson, J. Turner, H. Balakrishnan, and J. Rexford, “Openflow: enabling innovation in campus networks,” ACM SIGCOMM Computer Communication Review, vol. 38, no. 2, pp. 69–74, Apr. 2006.
N. Ni and L. Bhuyan, "Fair scheduling for input buffered switches," Cluster Computing, 6(2):105–114, Apr. 2003.
Nap of the americas, terremark’s flagship facility, http://www.terremark.com/technology-platform/nap-of-the-americas.aspx.
P. Mahadevan, A. Shah, and C. Bash, “Reducing lifecycle energy use of network switches,” in ISSST, 2010.
P. Mahadevan, P. Sharma, S. Banerjee, and P. Ranganathan, "A Power Benchmarking Framework for Network Devices," IFIP Networking, May 2009.
P. Mahadevan, P. Sharma, S. Banerjee, and P. Ranganathanl, "Energy Aware Network Operations," INFOCOM, 2009.
P. Mahadevan, S. Banerjee, and P. Sharma, “Energy proportionality of an enterprise network,” in ACM SIGCOMM Workshop on Green Networking, New Delhi, India, Aug. 2010.
R. H. Jonesa, S. Parsleyb, and R. Spencera, "High data rate transmission in high resolution radio astronomy—vlbiGRID," Future Generation Computer Systems, pp. 883–896, Aug 2003.
R. N. Mysore, A. Pamboris, N. Farrington, N. Huang, P. Miri, S. Radhakrishnan, V. Subramanya, and A. Vahdat, “Portland: a scalable fault-tolerant layer2 data center network fabric,” in ACM SIGCOMM, Barcelona, Spain, Aug. 2009.

96
S. F. Oktug and M. U. Caglayan, “Design and performance evaluation of a banyan network based interconnection structure for ATM switches," Selected Areas in Communications, IEEE Journal on , June 1997.
S. Ghemawat, H. Gobio, and S. Leungm, "The Google file system," ACM SOSP, pp. 29–43, 2003.
S. Nedevschi, J. Chandrashenkar, B. Nordman, S. Ratnasamy, and N. Taft, "Skilled in the Art of Being Idle: Reducing Energy Waste in Networked Systems," NSDI, Apr 2009.
S. Nedevschi, L. Popa, G. Iannaccone, S. Ratnasamy, and D. Wetherall, "Reducing Network Energy Consumption via Rate-Adaptation and Sleeping," NSDI, Apr 2008.
S. Pelley, D. Meisner, T. F. Wenish, and J. W. VanGilder, “Understanding and abstracting total data center power,” in ISCA 2009: Workshop on Energy Efficient Design (WEED), Jun. 2009.
S. Srikantaiah, A. Kansal and F. Zhao, "Energy Aware Consolidation for Cloud Computing," HotPower, 2008.
Stanford University, "OpenFlow," http://www.openflowswitch.org/, Stanford, CA, 2008.
T. Anderson, S. Owicki, J. Saxe, and C. Thacker, "High-speed switch scheduling for local-area networks," ACM Trans. Comput. Syst., 11(4):319–352, Nov. 1993.
T. H. Cormen, C. E. Leiserson, R. L. Rivest, and C. Stein, "Introduction to Algorithms," 3rd ed. MIT Press, 2009.
T. Hoff, "Google architecture," http://highscalability.com/google-architecture, Jul 2008.
T. Ye, L. Benini and G. Micheli, "Analysis of Power Consumption on Switch Fabrics in Network Routers," ACM DAC 2002, New Orleans, LA, June 2002.
U.S. Environmental Protection Agency, “Report to Congress on Server and Data Center Energy Efficiency,” http://www.energystar.gov/ia/partners/prod_development/ downloads/EPA_Datacenter_Report_Congress_Final1.pdf, Aug 2007.
Vmware vmotion for live migration of virtual machines, http://www.vmware.com/products/vmotion/overview.html.

97
W. Fisher, M. Suchara, and J. Rexford, “Greening backbone networks: reducing energy consumption by shutting off cables in bundled links,” in ACM SIGCOMM Workshop on Green Networking, New Delhi, India, Aug. 2010.
Who has the most web servers? http://www.datacenterknowledge.com/archives/2009/10/13/facebook-now-has-30000-servers/.
X. Meng, V. Pappas, and L. Zhang, “Improving the scalability of data center networks with traffic-aware virtual machine placement,” in INFOCOM, San Diego, CA, Mar. 2010.
X. Zhang and L. Bhuyan, "Deficit round-robin scheduling for input-queued switches," IEEE Journal on Selected Areas in Communications, 21(4):584–594, May 2003.
Y. Shang, D. Li, and M. Xu, “Energy-aware routing in data center network,” in ACM SIGCOMM Workshop on Green Networking, NewDelhi, India, Aug. 2010.
Y. Vigfusson, H. Abu-Libdeh, and M. Balakrishnan, "Dr. multicast: Rx for data center communication scalability," ACM Eurosys, pp. 349–362, Apr 2010.

98
VITA
TOSMATE CHEOCHERNGNGARN
EDUCATION
2011 Doctoral Candidate, Electrical and Computer Engineering, Florida
International University, Miami, FL 2006 Bachelor of Science in Computer Engineering, Assumption University,
Bangkok, Thailand
PROFESSIONAL EXPERIENCE
2008−2012 Graduate Assistant, Department of Electrical and Computer Engineering, Florida International University, Miami, FL
2006−2008 Network and System Administrator, THAICOM Public Company, Bangkok, Thailand
2003−2006 Teaching Assistant, Computer Engineering, Assumption University, Bangkok, Thailand
PUBLICATIONS Journals: T. Cheocherngngarn, J. Andrian, and D. Pan, “Deployment Of A Hybrid Multicast Switch In Energy-Aware Data Center Network: A Case Of Fat-Tree Topology,” ISRN Communications and Networking Journal, vol. 2012.
T. Cheocherngngarn, J. Andrian, and D. Pan, “Analyzing the Energy Efficiency on a Deployment of Multicast Switch in Green Data Center Network,” International Journal of Research and Reviews in Computer Science, Aug 2012.
Conference Proceedings: T. Cheocherngngarn, H. Jin, J. Andrian, D. Pan, and J. Liu, “Depth-first worst-fit search based multipath routing for data center networks,'' IEEE Global Communications Conference (GLOBECOM), Anaheim, CA, Dec. 2012.

99
T. Cheocherngngarn, J. Andrian, D. Pan, and K. Kengskool, “Power Efficiency in Energy-aware Data Center Network,” MAESC Conference, Memphis, TN, May 2012.
T. Cheocherngngarn, J. Andrian, Z. Yang, and D. Pan, “Queue-length proportional and max-min fair bandwidth allocation for best effort flows,'' IEEE Global Communications Conference (GLOBECOM), Houston, TX, Dec. 2011.
T. Cheocherngngarn, J. Andrian, D. Pan, K. Kengskool, and P. Putthapipat, “Fair Bandwidth Allocation Algorithm for Energy Efficiency on Packet Switch Fabric Interconnects,” MAESC Conference, Memphis, TN, May 2011.
AWARDS/SCHOLARSHIPS/HONORS
2012 DEA Fellowship, Florida International University 2008 Graduate Assistantship, Florida International University 2007 Cisco Certified CCNA, CCNP and CCSP 2005 Gold Medal of Academic Excellence and Certificate of Honors from His
Royal Highness Crown Prince Maha Vajiralongkorn under His Majesty the King’s Patronage