Embed Size (px)
Citation preview
C ross-Channel Synergies between Web and Mobile Advertising:
A Randomized F ield Experiment
Sang Pil Han College of Business
City University of Hong Kong
Anindya Ghose Stern School of Business,
New York University
Sung Hyuk Park Business School
Korea Advanced Institute of Science and Technology [email protected]
Updated: September 11, 2013
1
C ross-Channel Synergies between Web and Mobile Advertising:
A Randomized F ield Experiment
ABSTRACT
As companies divert more funds from traditional media towards digital advertising, they are interested in understanding what effects the two channels of advertising—web advertising and mobile advertising—have on consumer choices. Any analysis that measures the effects of web and mobile advertising only separately remains incomplete. In this paper, we design and execute a randomized field experiment to estimate causal effects of cross-channel interdependence between web and mobile advertising. We conduct a consumer-level analysis to attribute cross-channel advertising to click-throughs and conversions at the individual consumer-level. This helps isolate the effect of complementarity or substitution across platforms (web and mobile) from the role of the quantity of advertising, confound with carry-over, and consumer heterogeneity. We find that a mix of online and mobile display ad acts as a better memory cue that triggers consumers to recall product and eventually click/purchase, as compared to either online ad only or mobile ad only. Hence, in channel planning, optimal decisions in one need to take account of the effects in the other. Further, we present results from policy simulations regarding the optimal level of web and mobile advertising using CPM (cost per thousand impressions) based pricing. These synergistic relationships run counter to the single-click methodology in use and suggest that, for a market in which advertising dollars are allocated based on their influence on purchase behavior, new methods must be developed to insure efficient market functioning.
Keywords: Mobile Advertising, Web Advertising, Interdependence, Randomized Field Experiment, Policy Simulations
2
INTRODUCTION
In the increasingly advertising-filled, multi-channel environment, consumers are exposed
to more than one advertising message from a marketer through different channels. As mobile
devices such as smartphones and tablets become popular ecommerce channels, consumers can
browse for products and make purchases anywhere and anytime. According to Google’s recent
report on consumer behavior in the new multi-screen world (2012a), nine out of ten people use
multiple screens sequentially to accomplish a task over time. For example, a consumer may
click on display advertising about a new product on a smartphone first, but she does not need
to finish her purchase task on the same device on which she clicks; she can wrap up the
purchase decision on the same site subsequently through a laptop or a PC while sitting at work
or home. Hence, any analysis that gives web advertising all the credit for conversions or
mobile advertising all the credit for click-throughs remains incomplete and flawed.1
The purpose of this paper is to analyze the relationship between web advertising and
mobile advertising to examine how their interaction affects consumer behavior as measured
by click-throughs and conversions. In particular, we examine whether exposures to display
advertising through both web and mobile channels are likely to increase click-throughs and
conversions more, as compared to advertising on either channel alone.
There are, on the one hand, a number of reasons for positive synergies between web and
mobile display advertising. Display advertising can generate brand awareness and increase
purchase intent. As smartphones and tablets are frequently used throughout the day, mobile
display advertising can operate a persuasive marketing message by serving as a memory cue
that can trigger consumers to think about the advertised product based on existing knowledge
they have stored in their memories through prior web advertising exposures. Similarly, web
display advertising can reinforce acquisition and brand messages that users may receive from
3
web display advertising. Thus, display advertising can serve as a valuable initial step into the
purchase process across multiple devices.
On the other hand, there are also reasons for negative synergies between web and mobile
advertising. Brand messaging through both can provide redundant brand messages and
possibly lead to inefficiency in marketing resource allocation if the message gets through
irrespective of the channel. Because consumers are exposed to mobile advertising while on
the move and maybe distracted, mobile advertisements are delivered through a noisy channel
and people are likely to pay minimal attention (Bart et al. 2013).
A few papers have looked at the direction and magnitude of the interdependence between
two advertising channels. Yang and Ghose (2010) have shown that organic and sponsored
search listings have a positive interdependence, such that the presence of an advertiser in the
organic listings increases its click-through and conversion rates in the paid listings, and vice-
versa. In contrast, there is evidence that display ads can have a negative impact on sponsored
search advertising when consumers get exposed to them before seeing the search ads (Ghose
et al. 2011). In addition, display ads can increase searches for a company’s own and
competitor brands (Lewis and Nyugen 2012), offline direct marketing substitutes for paid
search advertising (Goldfarb and Tucker 2011a) and offline billboard advertising substitutes
for web display advertising (Goldfarb and Tucker 2011b). Therefore, it is difficult to simply
draw on prior results and infer whether web and mobile advertisements are complements or
substitutes. It is an empirical question that can be context-specific.
Digital advertising offers unprecedented opportunities for measuring the effects of
advertising. Lewis et al. (2013) attribute the potential advances to two key factors: 1) ad
delivery and purchases at the individual level can be linked and 2) ad delivery can be
randomized. It is generally considered that observational data from non-experimental
methods can induce bias – selection bias and omitted heterogeneity – in the estimates of
4
advertising effectiveness (Lewis et al. 2013). Experiments can overcome the selection bias
and endogeneity issues.
To examine this question, we design and execute a controlled field experiment. A
randomized field experiment is required in our setting mainly for two reasons: 1) Advertisers
can prefer to advertise through a particular channel than the other based on their channel-
specific prior ad performance. 2) Either the advertiser or the media, or both can select a
particular product to be advertised based on its preference and prior sales performance, etc.
Therefore, to avoid these endogeneity issues, by using a time-based experimental design, we
randomize both the channel assignment in our experiment and the selection of products to be
advertised. In the context of a digital products (ebook) retailer, we periodically switch on and
switch off web and mobile ads on ebooks in order to assess the effect that ads in each channel
have on user behavior, separately and collectively.
We perform our initial analyses using product-level data. Results show that when both
web and mobile advertising are switched on: 1) the web click-through rate is 34-percent
higher than when only web advertising is on; 2) the mobile click-through rate is 23-percent
higher than when only mobile advertising is on; 3) the web conversion rate is 36-percent
higher than when only web advertising is inactive; and, notably, 4) the mobile conversion rate
is 16-percent lower than when only mobile advertising is present, though it is not statistically
significant. Moreover, we find the cross-channel conversion rate from mobile to web is 2.7
times higher than that from web to mobile. Despite this, the net change in sales (revenues) is
positive when both web and mobile advertising are switched on compared to when only one
channel is switched on, suggesting the presence of a reinforcement effect in consumers’
minds from seeing both ads.
In our main model, we conduct an individual consumer-level analysis to attribute cross-
channel advertising to click-throughs and conversions at the individual user-level. This helps
5
isolate the effect of complementarity or substitution across platforms (web and mobile) from
the role of the quantity of advertising, confound with carry-over, and consumer heterogeneity.
Overall, we find that the product-level initial results from the experiment are nicely
corroborated by this individual consumer-level result. Our results on positive cross-channel
synergies between online and mobile ads in click-throughs and conversions indicate that,
after controlling for the total amount of advertising exposures, a mix of web and mobile
display ads results in more frequent actions – click and purchase, as compared to exposures to
either web ad or mobile ad only. To summarize, we show that web and mobile work together
and affect each other such that there is an increase in clicks and conversions when consumers
see the same ad on both channels as compared to when they see an ad on only one channel.
Based on the experiment results, we present policy simulation results on the optimal
level of web and mobile advertising. Specifically, we examine the profit-maximizing rates of
web and mobile advertising impressions when channel-specific costs per impression are
given to the advertiser. Insights into such questions can provide useful guidelines for
marketers who deal with resource-allocation decisions between web and mobile advertising
channels.
The rest of this paper is organized as follows. In Section 2, we provide related literature
to build the theoretical framework. Section 3 presents the randomized field experiment design
and settings and discusses initial analyses based on product-level data. Section 4 provides the
main model results based on individual consumer-level ad exposure and response data.
Section 5 discusses the implications of the results and concludes.
6
RE LAT E D L IT ERATURE
In this section, we discuss the literature that has examined the interdependence between
different kinds of advertising channels and platforms. We also discuss related literature on
mobile marketing and user behavior.
Interdependence between Advertising Channels
An emerging stream of literature has examined the interdependence between advertising
channels. The outcome of such research has important managerial implications for whether a
firm should invest in both channels (if there exists a synergistic effect) or in just one of the two
(if there is no synergistic effect). Rutz and Bucklin (2011) show that there are spillovers
between search advertising on branded and generic keywords; some customers may start with a
generic search to gather information, but they later use a branded search to complete their
transaction. Ghose and Yang (2010) provide evidence of horizontal spillover effects from
search advertising that result in purchases across other product categories. Using both archival
data and randomized field experiment, Yang and Ghose (2010) find that organic listings have a
positive affect on clicks and conversions on paid listings, and vice versa. Agarwal et al. (2012)
find that competing organic listings in higher positions have a negative impact on conversion
performance for generic keywords, but may help conversion performance for more specific
keywords. Goldfarb and Tucker (2011c) show that targeted advertising and highly visible
display advertising work better separately than they do together. Goldfarb and Tucker (2011a)
find that offline direct marketing substitutes for paid search advertising for legal services.
Goldfarb and Tucker (2011b) show that online display advertising is most effective in places
that ban offline advertising for alcoholic beverages.
7
Mobile Marketing and User Behavior in the Mobile Internet
Our paper builds on and relates to the literature on mobile marketing. Shankar and
Balasubramanian (2009) provide an extensive review of mobile marketing. Shankar et al.
(2010) develop a conceptual framework for mobile marketing in the retailing environment
and discuss retailers’ mobile marketing practices. Sinisalo (2011) examines the role of the
mobile medium among other channels within multichannel CRM communication. Bart et al.
(2013) study mobile advertising campaigns and find that they are effective at increasing
favorable attitudes and purchase intentions for higher (versus lower) involvement products,
and for products that are seen as more utilitarian (versus more hedonic).
Recently, mobile couponing and location-based advertising have gained increasing
interest as a marketing tool. Dickinger and Kleijnen (2008) find that a segment of “value
seekers” are more prone to mobile-coupon redemption. Molitor et al. (2013) show that the
higher the discount from mobile coupons and the closer the consumers are to the physical
store offering the coupon, the more likely they are to download the mobile coupons. Previous
studies have examined consumer perceptions and attitudes towards mobile location-based
advertising (e.g., Brunner and Kumar 2007; Xu et al. 2009). Gu (2012) examines both the
short-term and long-term sales effects of location-based advertising.
There is also an emerging stream of literature on consumer behavior on the mobile
Internet. For example, Ghose and Han (2011) find that there is a negative and statistically
significant temporal interdependence between content generation and usage on the mobile
Internet. Ghose et al. (2013) explore how Internet browsing behavior varies between mobile-
phone and PC users in a natural experimental setting. They show that search costs are higher
and the benefit of browsing for geographically close matches with retail stores is higher on
the mobile internet compared to the PC internet.
8
In summary, the literature has shown that whether different types of advertising are
complements or substitutes depends on the context. Hence, the direction and the overall
magnitude of the mobile advertising effect above and beyond that of web advertising is an
important empirical question.
A RANDOMIZ E D F I E LD E XPERIM E NT
In this section, we describe the empirical context and experiment design and discuss
initial analyses based on product-level data.
Experimental Settings and Design
We conduct an experiment in collaboration with one of the largest digital goods retailers
in South Korea. Their website is designed to help consumers browse and purchase various
digital goods, primarily ebooks for reading. It provides information such as title, book cover
image, price, genre, content size, rating and so forth, for more than 200,000 ebooks. The
ebook retailer has a total of 1.5 million subscribed users with accumulated 5 million ebook
downloads as of June 2013.
On the website, consumers can browse ebooks by clicking on genre links or featured
ebook links on the home page or/and typing search keywords in a query box. There are PC and
mobile (Web and app) versions of the service. However, the service features offered are the
same regardless of whether a user accesses the service through a PC or a mobile device.
Ebooks are downloaded and read using a PC or in a mobile device. For this study, we
emphasize results that include consumers who have accessed the company’s website via both
mobile phones and PCs (i.e., dual channel users). This helps us to identify the “within-
consumer” effect of cross-channel interdependence on user click and purchase decisions.
9
The digital ebook company features ebooks on this own website and mobile app splash
screen. We turn on and off this featuring (like an ad) for a total of 30 different ebooks selected.
The selection of ebooks to be advertised has implications for measuring the ad effectiveness in
our context. In the absence of experimental manipulation, the advertiser (ebook author or
publisher in our context) can determine to advertise a particular ebook based on its preference
and prior sales performance. Moreover, the platform (ebook retailer) may not consider the
effectiveness of the ad on a particular ebook, rather it may internalize the cross-product effects:
Advertising one ebook might lead to lower sales of other ebooks on the site. Furthermore, the
selection of advertising channel can be endogenous. Ebook publishers or/and ebook company
can prefer to advertise ebooks through particular channel(s) than the other based on their
channel-specific prior ad performance. Hence, in the absence of exogenous variation of
advertising channel, non-experimental estimates of ad effectiveness would lead to biased
estimates of cross-channel ad effectiveness.
We address the challenges in measuring ad effectiveness by using a time-based design in
our experiment. We randomize the channel assignment and also randomly select 30 ebooks for
the experiment. Over the course of the experiment, we periodically switch on and switch off
web and mobile ads on ebooks in order to assess the effect that ads in each channel have on
user behavior, separately and collectively. For example, the company displays book-cover
advertising for an e-book through only a web channel from Monday to Wednesday in week 1.
Then, the company displays the same book- cover advertising through both web and mobile
channels from Thursday to Saturday in week 1. Next, the company pauses its advertising in
the web channel while continuing to advertise through the mobile channel from Monday to
Wednesday in week 2. Finally, the company pauses its advertising through both web and
mobile channels from Thursday to Saturday in week 2. We track and measure click-throughs
and conversion results from both web and mobile channels throughout the experiment period.
10
This is because consumers can purchase an e-book through either of the two channels
regardless of whether the e-book ad is displayed on the web channel or on the mobile channel,
or both.
We conduct the field experiment over a six week period over the months of June and July
2012. Table 1 demonstrates the advertising schedule in our field experiment. In the first
period (Week 1 – Week 2), we conduct the experiment for the first ten e-books (i.e., A1 – J1),
and then in the second period (Week 3 – Week 4), we conduct the experiment for another ten
e-books (i.e., A2 – J2). Lastly, in the third period (Week 5 – Week 6), we conduct the
experiment for the last ten e-books (i.e., A3 – J3). In each period, we randomly assign five e-
books to Cohort 1 and the remaining five to Cohort 2. The only difference in terms of
manipulation between Cohorts 1 and 2 is the order in which a particular advertising channel
is used during the experimental period. We find that our results remain qualitatively the same,
regardless of this order effect. Moreover, each treatment runs for three days in our experiment.
<< Insert Table 1 about here>>
The dataset for the field experiment includes approximately 26 million advertising
transaction records during the six-week period. The set of books include personal-
development books, social and history books, business and economics books, and other genre
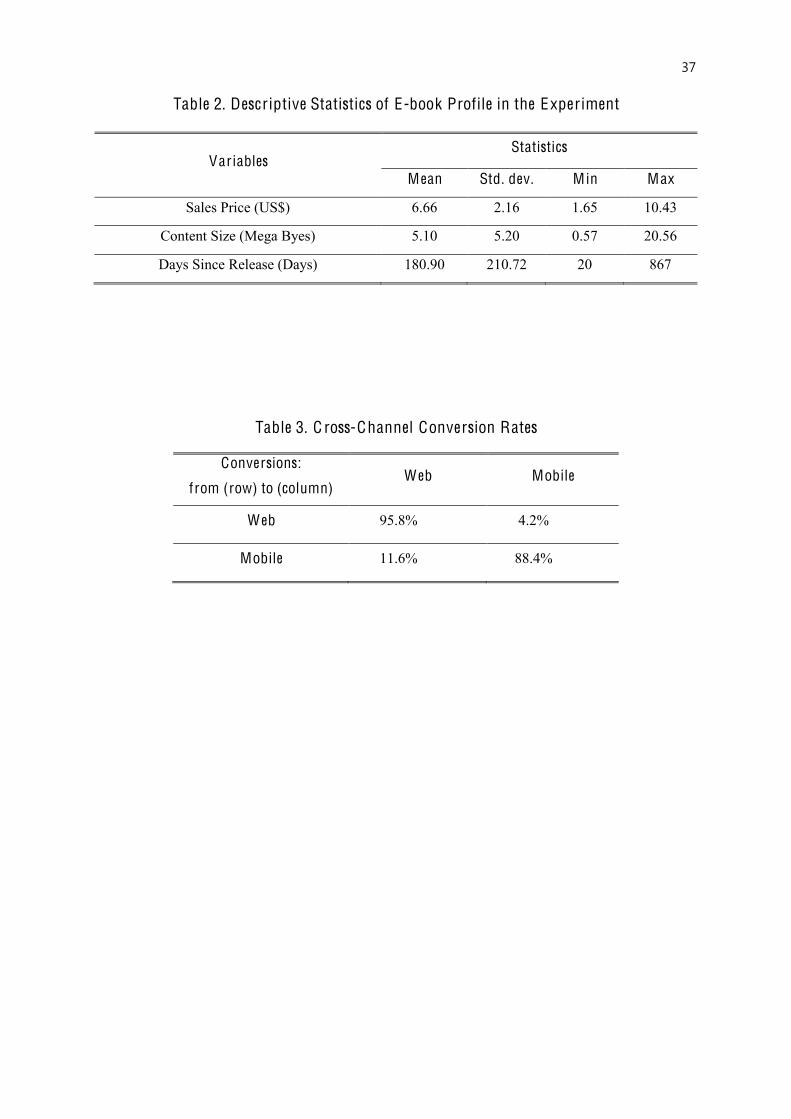
books. Table 2 shows the descriptive statistics of ebook profiles used in the experiment.
<< Insert Table 2 about here>>
Initial Analyses of Cross-Channel Interdependence using Ebook-level Data
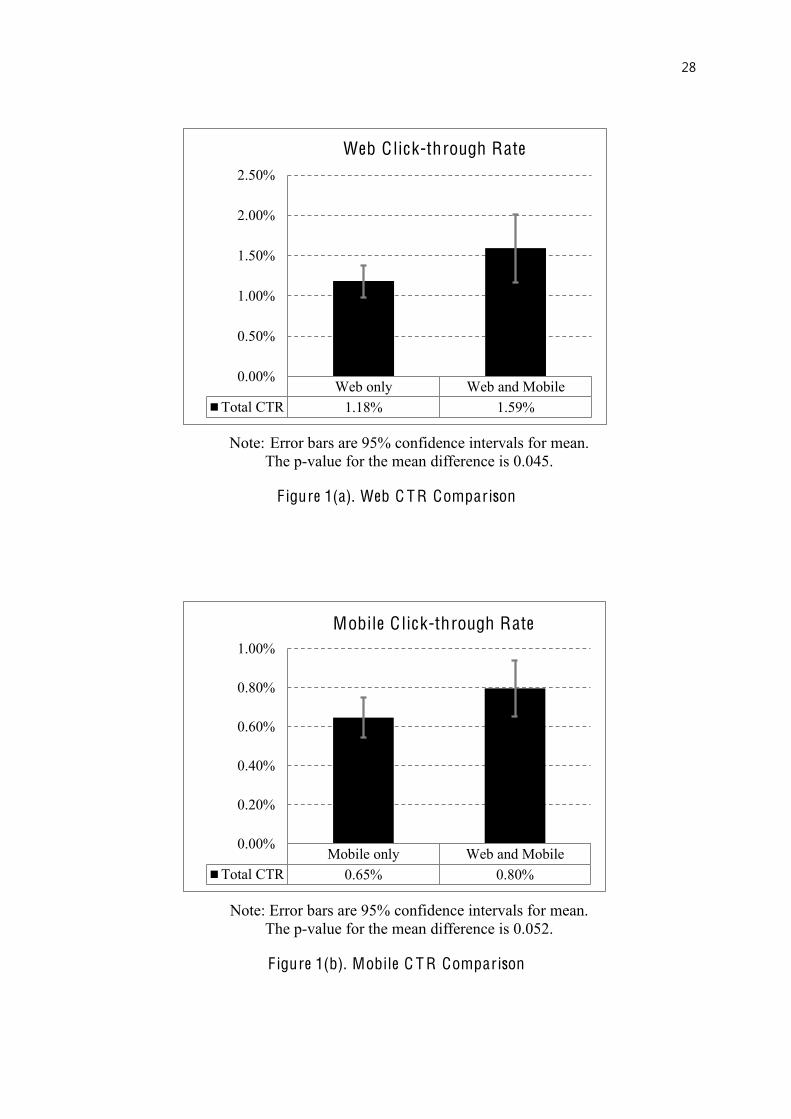
Based on the ebook-level analysis of the field experimental data, we find that when both
web and mobile advertising are available to consumers, the web click-through rate is 34-
percent higher than when only web advertising is present (see Figure 1(a)). Note that the error
bars are 95% confidence intervals for the mean. A two-sample t-test reveals that the
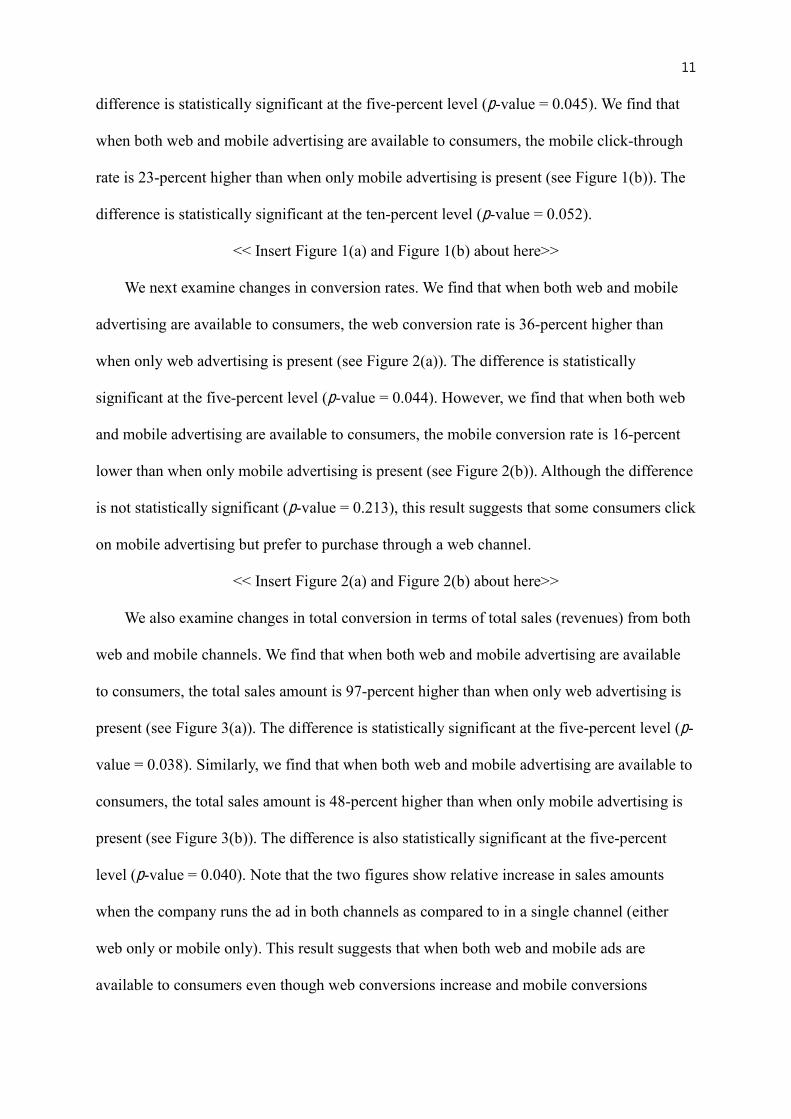
11
difference is statistically significant at the five-percent level (p-value = 0.045). We find that
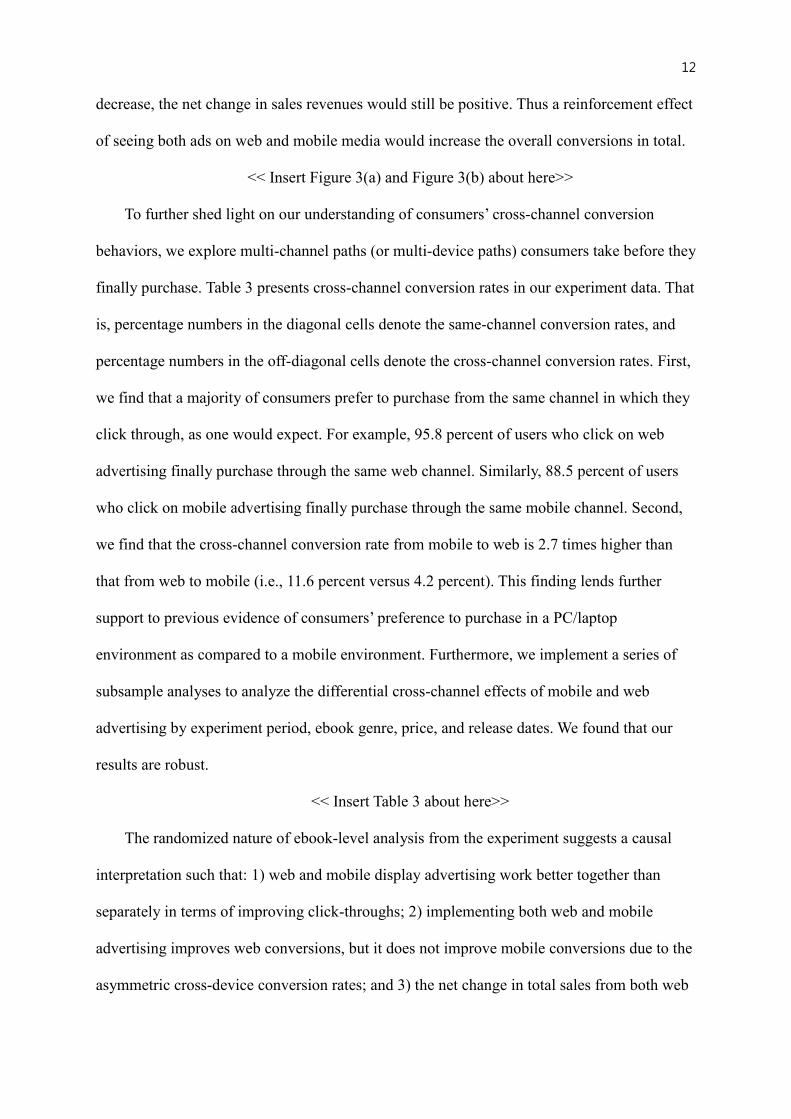
when both web and mobile advertising are available to consumers, the mobile click-through
rate is 23-percent higher than when only mobile advertising is present (see Figure 1(b)). The
difference is statistically significant at the ten-percent level (p-value = 0.052).
<< Insert Figure 1(a) and Figure 1(b) about here>>
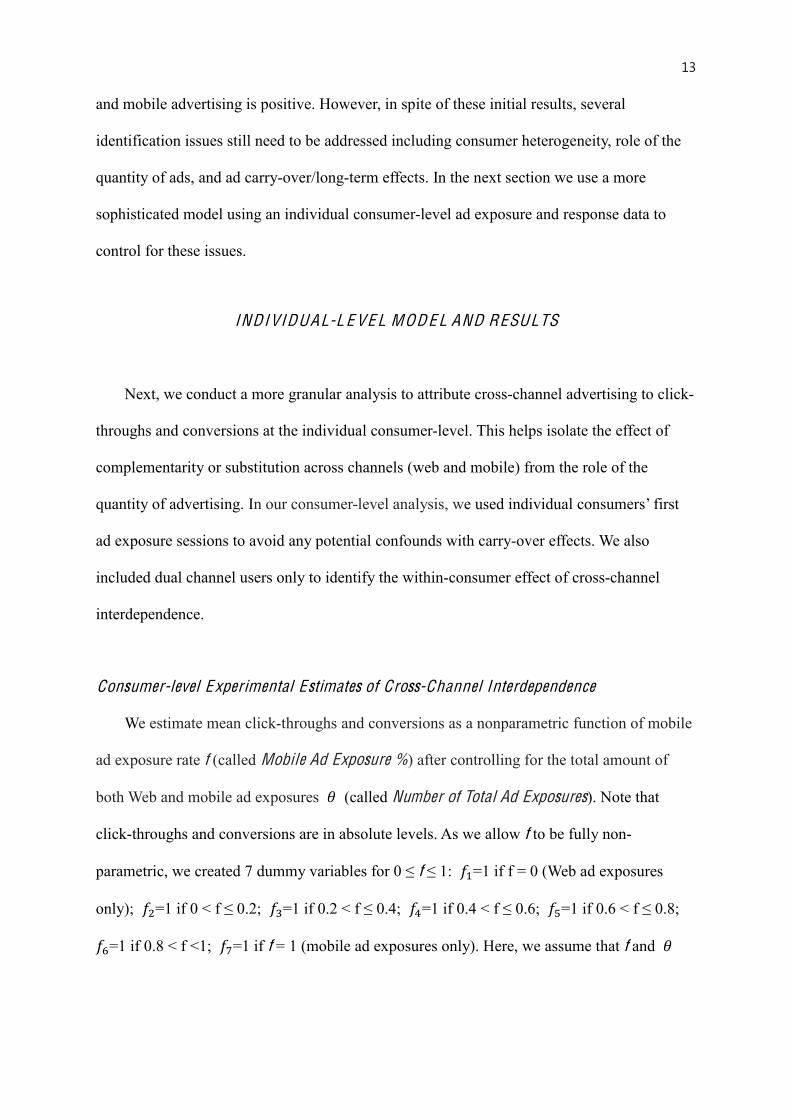
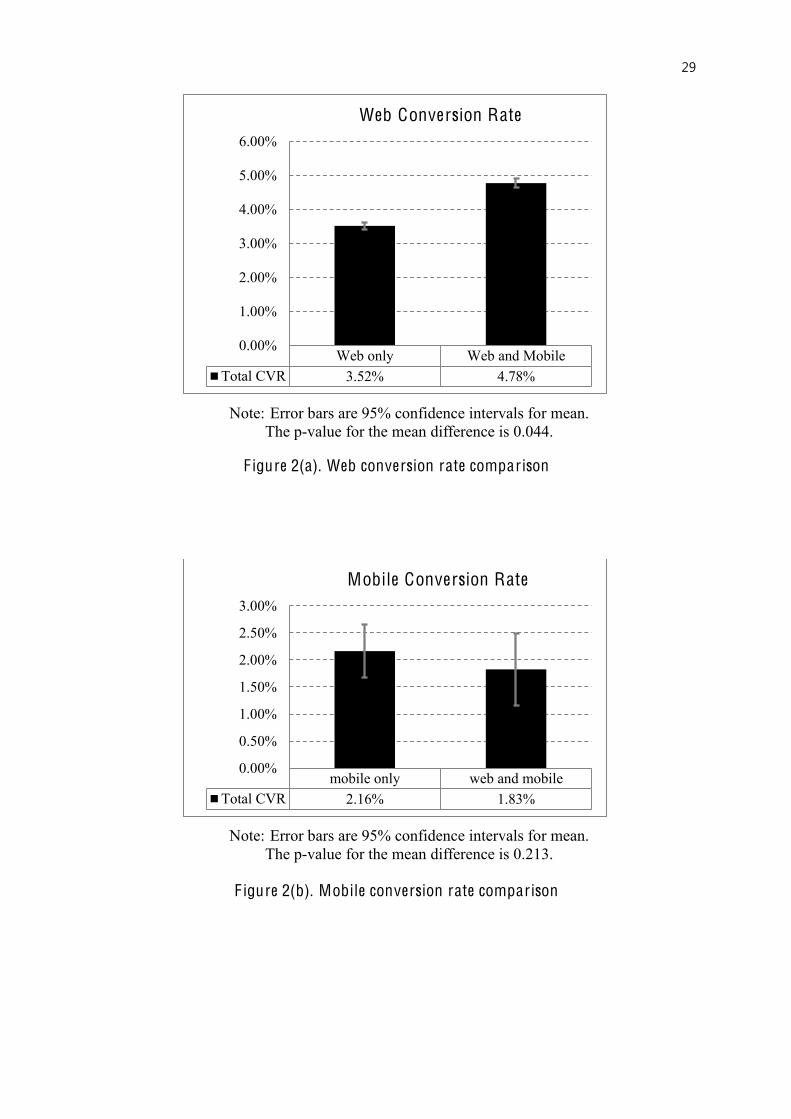
We next examine changes in conversion rates. We find that when both web and mobile
advertising are available to consumers, the web conversion rate is 36-percent higher than
when only web advertising is present (see Figure 2(a)). The difference is statistically
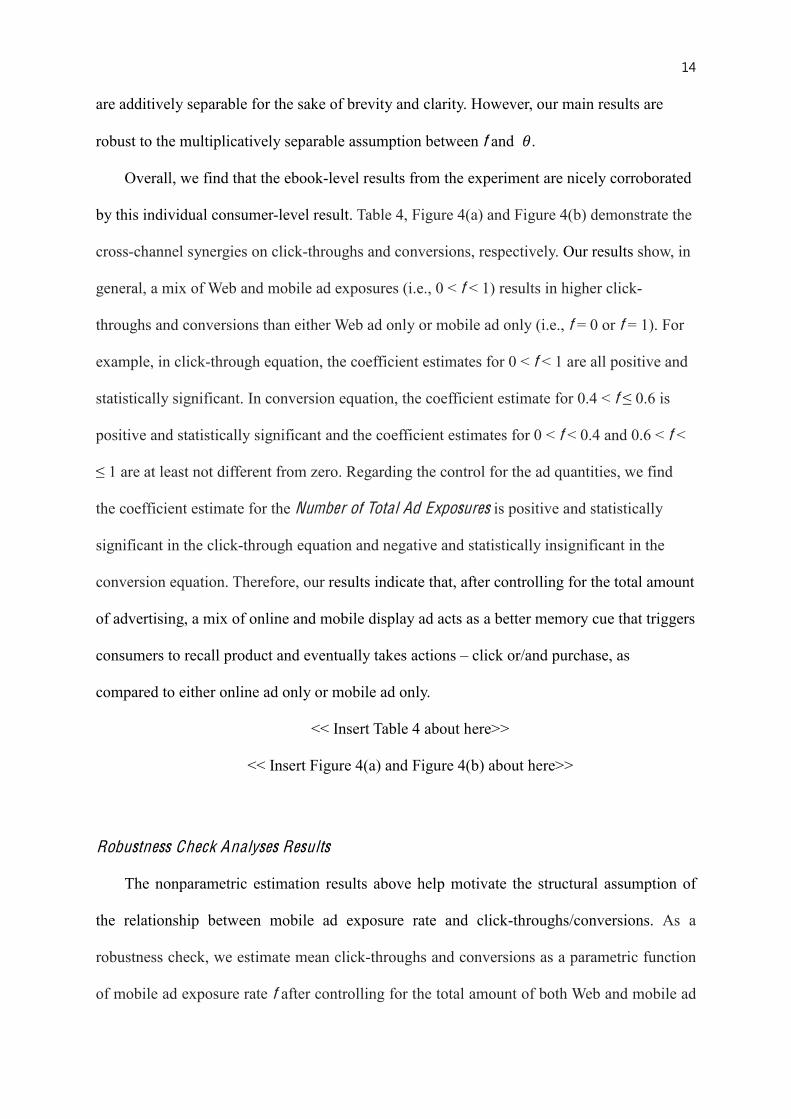
significant at the five-percent level (p-value = 0.044). However, we find that when both web
and mobile advertising are available to consumers, the mobile conversion rate is 16-percent
lower than when only mobile advertising is present (see Figure 2(b)). Although the difference
is not statistically significant (p-value = 0.213), this result suggests that some consumers click
on mobile advertising but prefer to purchase through a web channel.
<< Insert Figure 2(a) and Figure 2(b) about here>>
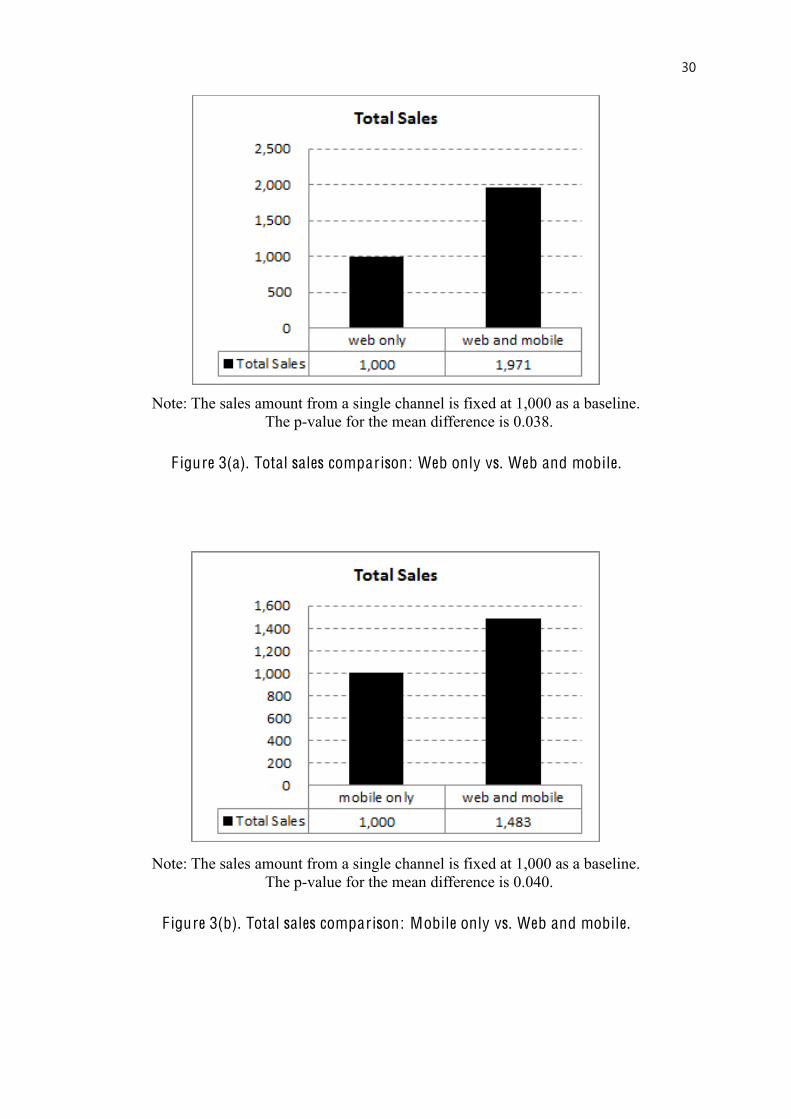
We also examine changes in total conversion in terms of total sales (revenues) from both
web and mobile channels. We find that when both web and mobile advertising are available
to consumers, the total sales amount is 97-percent higher than when only web advertising is
present (see Figure 3(a)). The difference is statistically significant at the five-percent level (p-
value = 0.038). Similarly, we find that when both web and mobile advertising are available to
consumers, the total sales amount is 48-percent higher than when only mobile advertising is
present (see Figure 3(b)). The difference is also statistically significant at the five-percent
level (p-value = 0.040). Note that the two figures show relative increase in sales amounts
when the company runs the ad in both channels as compared to in a single channel (either
web only or mobile only). This result suggests that when both web and mobile ads are
available to consumers even though web conversions increase and mobile conversions
12
decrease, the net change in sales revenues would still be positive. Thus a reinforcement effect
of seeing both ads on web and mobile media would increase the overall conversions in total.
<< Insert Figure 3(a) and Figure 3(b) about here>>
To further shed light on our understanding of consumers’ cross-channel conversion
behaviors, we explore multi-channel paths (or multi-device paths) consumers take before they
finally purchase. Table 3 presents cross-channel conversion rates in our experiment data. That
is, percentage numbers in the diagonal cells denote the same-channel conversion rates, and
percentage numbers in the off-diagonal cells denote the cross-channel conversion rates. First,
we find that a majority of consumers prefer to purchase from the same channel in which they
click through, as one would expect. For example, 95.8 percent of users who click on web
advertising finally purchase through the same web channel. Similarly, 88.5 percent of users
who click on mobile advertising finally purchase through the same mobile channel. Second,
we find that the cross-channel conversion rate from mobile to web is 2.7 times higher than
that from web to mobile (i.e., 11.6 percent versus 4.2 percent). This finding lends further
support to previous evidence of consumers’ preference to purchase in a PC/laptop
environment as compared to a mobile environment. Furthermore, we implement a series of
subsample analyses to analyze the differential cross-channel effects of mobile and web
advertising by experiment period, ebook genre, price, and release dates. We found that our
results are robust.
<< Insert Table 3 about here>>
The randomized nature of ebook-level analysis from the experiment suggests a causal
interpretation such that: 1) web and mobile display advertising work better together than
separately in terms of improving click-throughs; 2) implementing both web and mobile
advertising improves web conversions, but it does not improve mobile conversions due to the
asymmetric cross-device conversion rates; and 3) the net change in total sales from both web
13
and mobile advertising is positive. However, in spite of these initial results, several
identification issues still need to be addressed including consumer heterogeneity, role of the
quantity of ads, and ad carry-over/long-term effects. In the next section we use a more
sophisticated model using an individual consumer-level ad exposure and response data to
control for these issues.
INDIVIDUAL-L E VE L MOD E L AND RESULTS
Next, we conduct a more granular analysis to attribute cross-channel advertising to click-
throughs and conversions at the individual consumer-level. This helps isolate the effect of
complementarity or substitution across channels (web and mobile) from the role of the
quantity of advertising. In our consumer-level analysis, we used individual consumers’ first
ad exposure sessions to avoid any potential confounds with carry-over effects. We also
included dual channel users only to identify the within-consumer effect of cross-channel
interdependence.
Consumer-level Experimental Estimates of Cross-Channel Interdependence
We estimate mean click-throughs and conversions as a nonparametric function of mobile
ad exposure rate f (called Mobile Ad Exposure %) after controlling for the total amount of
both Web and mobile ad exposures 𝜃 (called Number of Total Ad Exposures). Note that
click-throughs and conversions are in absolute levels. As we allow f to be fully non-
parametric, we created 7 dummy variables for 0 ≤ f ≤ 1: 𝑓#=1 if f = 0 (Web ad exposures
only); 𝑓$=1 if 0 < f ≤ 0.2; 𝑓%=1 if 0.2 < f ≤ 0.4; 𝑓&=1 if 0.4 < f ≤ 0.6; 𝑓'=1 if 0.6 < f ≤ 0.8;
𝑓(=1 if 0.8 < f <1; 𝑓)=1 if f = 1 (mobile ad exposures only). Here, we assume that f and 𝜃
14
are additively separable for the sake of brevity and clarity. However, our main results are
robust to the multiplicatively separable assumption between f and 𝜃.
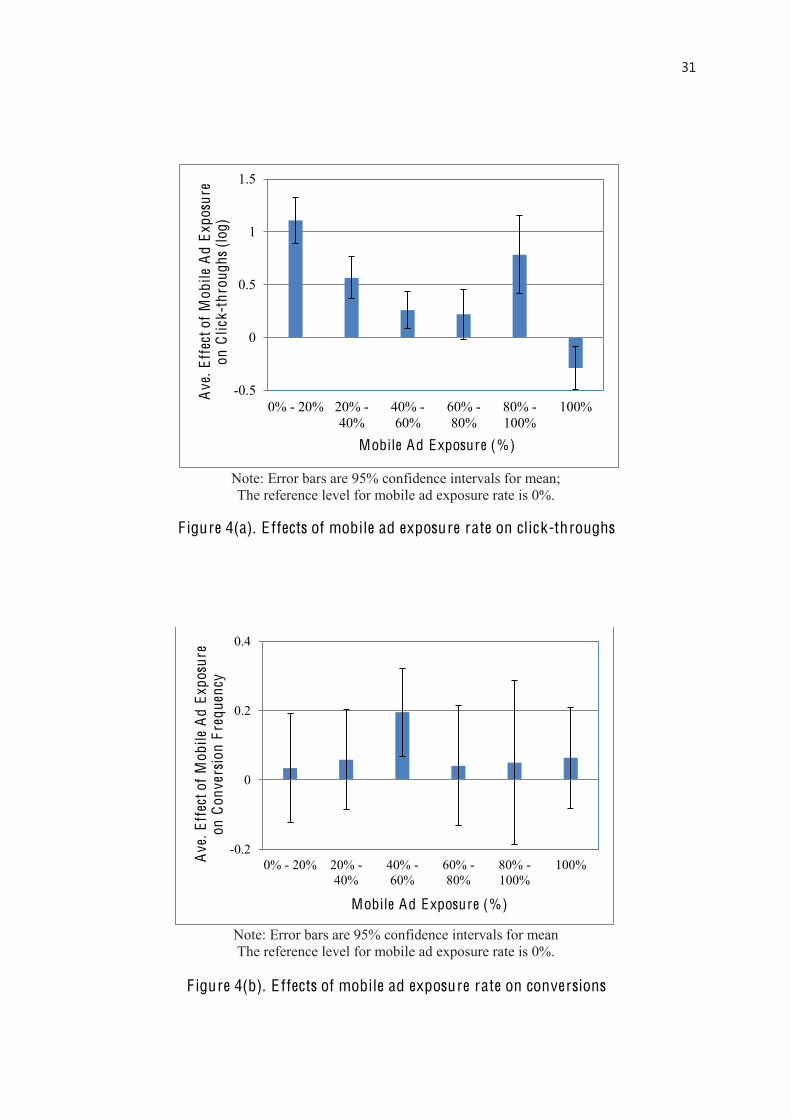
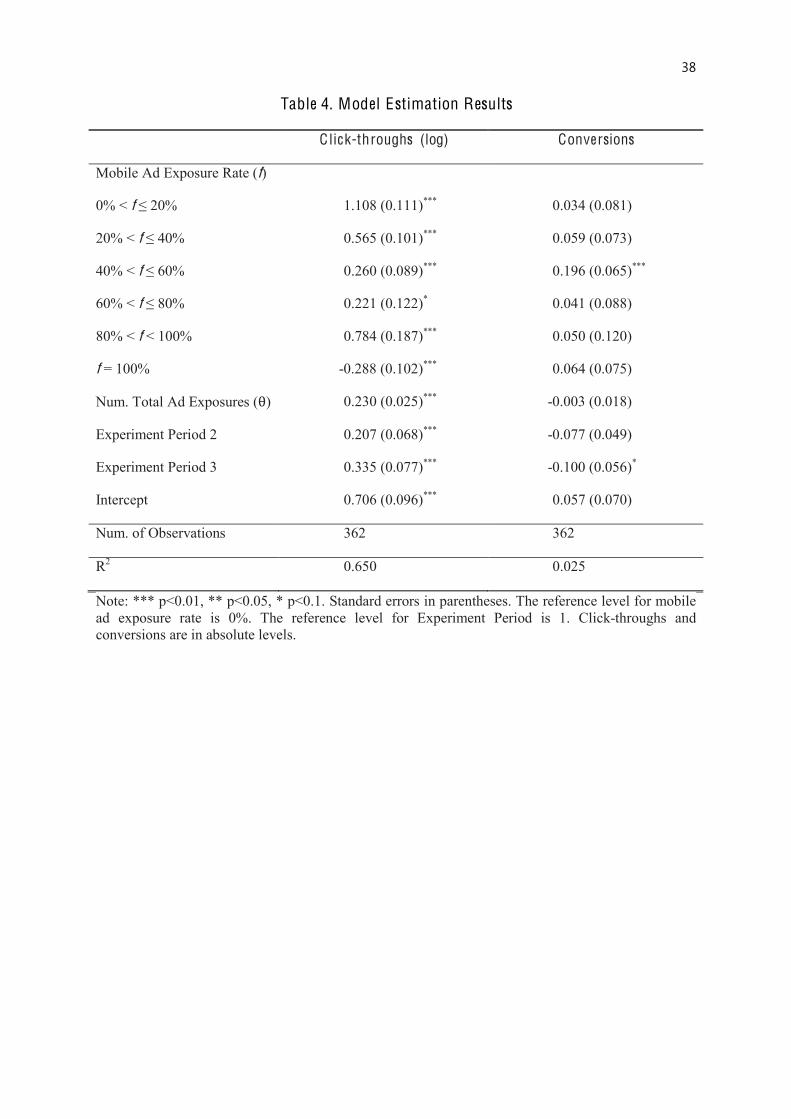
Overall, we find that the ebook-level results from the experiment are nicely corroborated
by this individual consumer-level result. Table 4, Figure 4(a) and Figure 4(b) demonstrate the
cross-channel synergies on click-throughs and conversions, respectively. Our results show, in
general, a mix of Web and mobile ad exposures (i.e., 0 < f < 1) results in higher click-
throughs and conversions than either Web ad only or mobile ad only (i.e., f = 0 or f = 1). For
example, in click-through equation, the coefficient estimates for 0 < f < 1 are all positive and
statistically significant. In conversion equation, the coefficient estimate for 0.4 < f ≤ 0.6 is
positive and statistically significant and the coefficient estimates for 0 < f < 0.4 and 0.6 < f <
≤ 1 are at least not different from zero. Regarding the control for the ad quantities, we find
the coefficient estimate for the Number of Total Ad Exposures is positive and statistically
significant in the click-through equation and negative and statistically insignificant in the
conversion equation. Therefore, our results indicate that, after controlling for the total amount
of advertising, a mix of online and mobile display ad acts as a better memory cue that triggers
consumers to recall product and eventually takes actions – click or/and purchase, as
compared to either online ad only or mobile ad only.
<< Insert Table 4 about here>>
<< Insert Figure 4(a) and Figure 4(b) about here>>
Robustness Check Analyses Results
The nonparametric estimation results above help motivate the structural assumption of
the relationship between mobile ad exposure rate and click-throughs/conversions. As a
robustness check, we estimate mean click-throughs and conversions as a parametric function
of mobile ad exposure rate f after controlling for the total amount of both Web and mobile ad
15
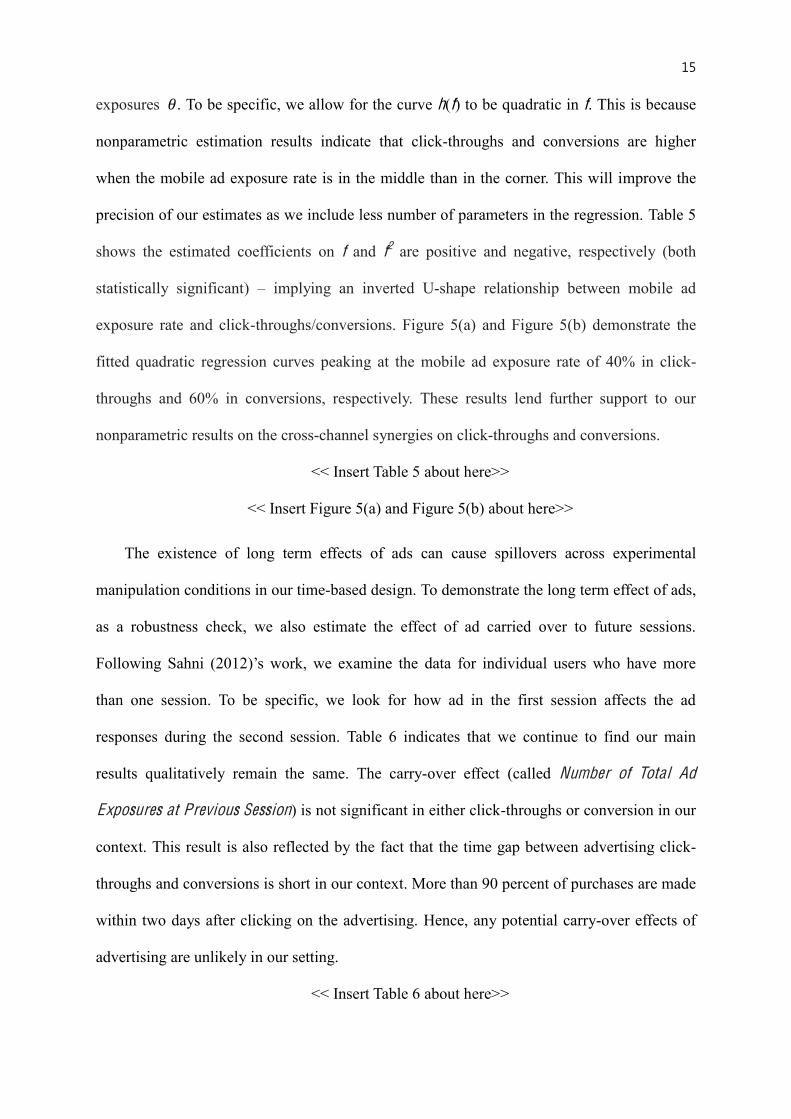
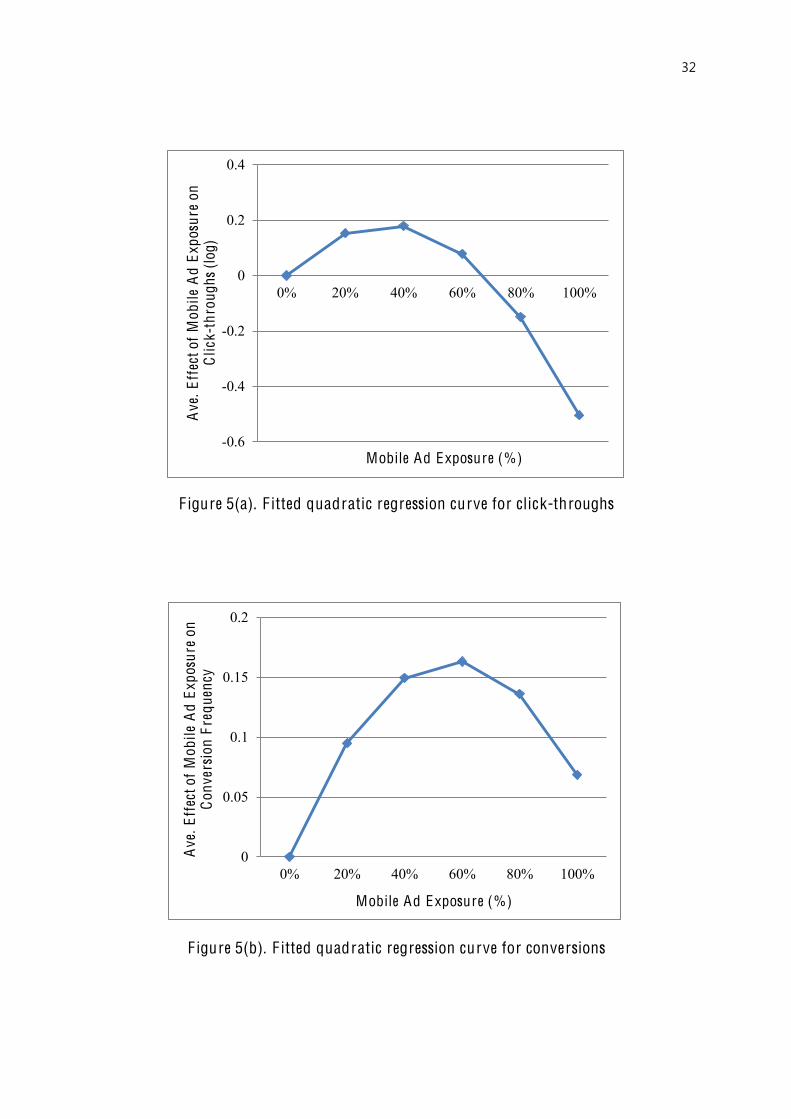
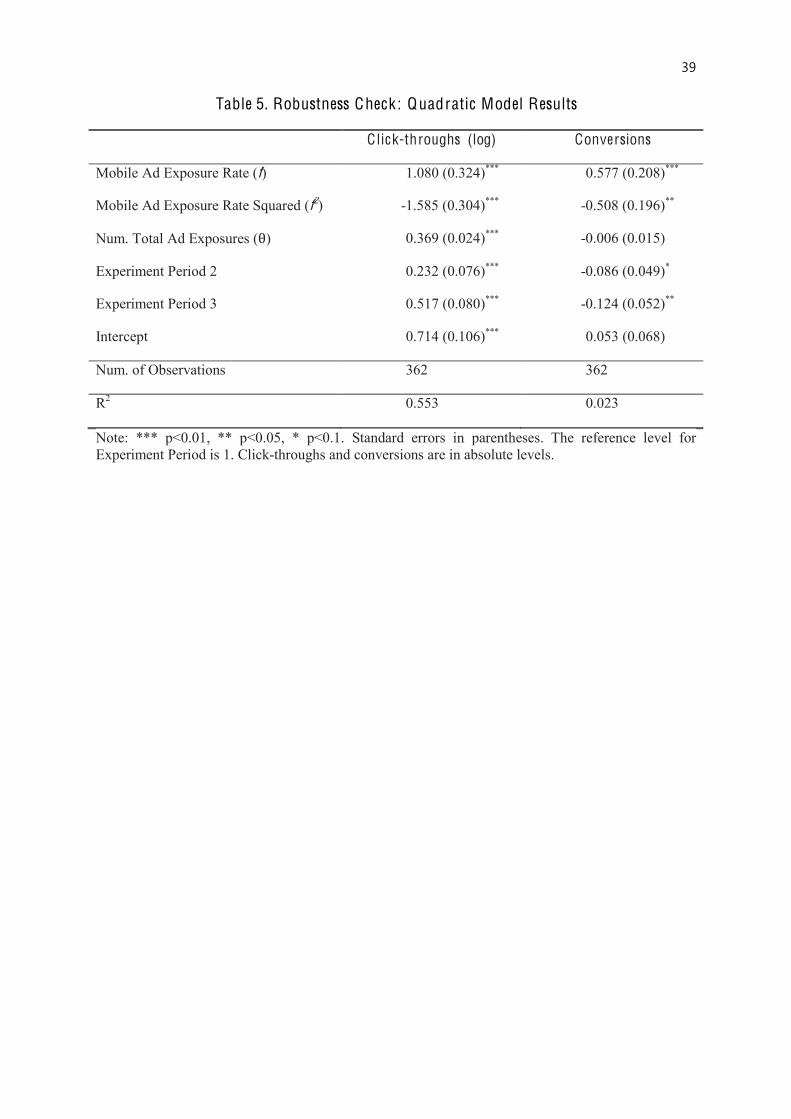
exposures 𝜃. To be specific, we allow for the curve h(f) to be quadratic in f. This is because
nonparametric estimation results indicate that click-throughs and conversions are higher
when the mobile ad exposure rate is in the middle than in the corner. This will improve the
precision of our estimates as we include less number of parameters in the regression. Table 5
shows the estimated coefficients on f and f2 are positive and negative, respectively (both
statistically significant) – implying an inverted U-shape relationship between mobile ad
exposure rate and click-throughs/conversions. Figure 5(a) and Figure 5(b) demonstrate the
fitted quadratic regression curves peaking at the mobile ad exposure rate of 40% in click-
throughs and 60% in conversions, respectively. These results lend further support to our
nonparametric results on the cross-channel synergies on click-throughs and conversions.
<< Insert Table 5 about here>>
<< Insert Figure 5(a) and Figure 5(b) about here>>
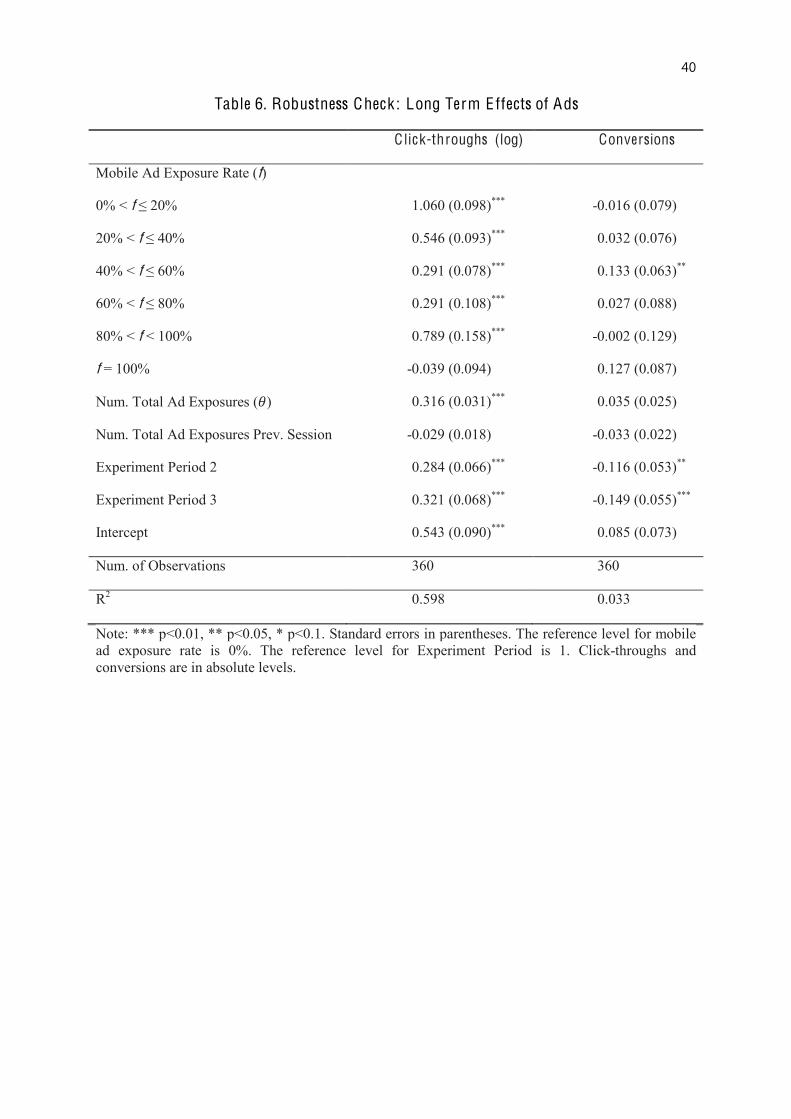
The existence of long term effects of ads can cause spillovers across experimental
manipulation conditions in our time-based design. To demonstrate the long term effect of ads,
as a robustness check, we also estimate the effect of ad carried over to future sessions.
Following Sahni (2012)’s work, we examine the data for individual users who have more
than one session. To be specific, we look for how ad in the first session affects the ad
responses during the second session. Table 6 indicates that we continue to find our main
results qualitatively remain the same. The carry-over effect (called Number of Total Ad
Exposures at Previous Session) is not significant in either click-throughs or conversion in our
context. This result is also reflected by the fact that the time gap between advertising click-
throughs and conversions is short in our context. More than 90 percent of purchases are made
within two days after clicking on the advertising. Hence, any potential carry-over effects of
advertising are unlikely in our setting.
<< Insert Table 6 about here>>
16
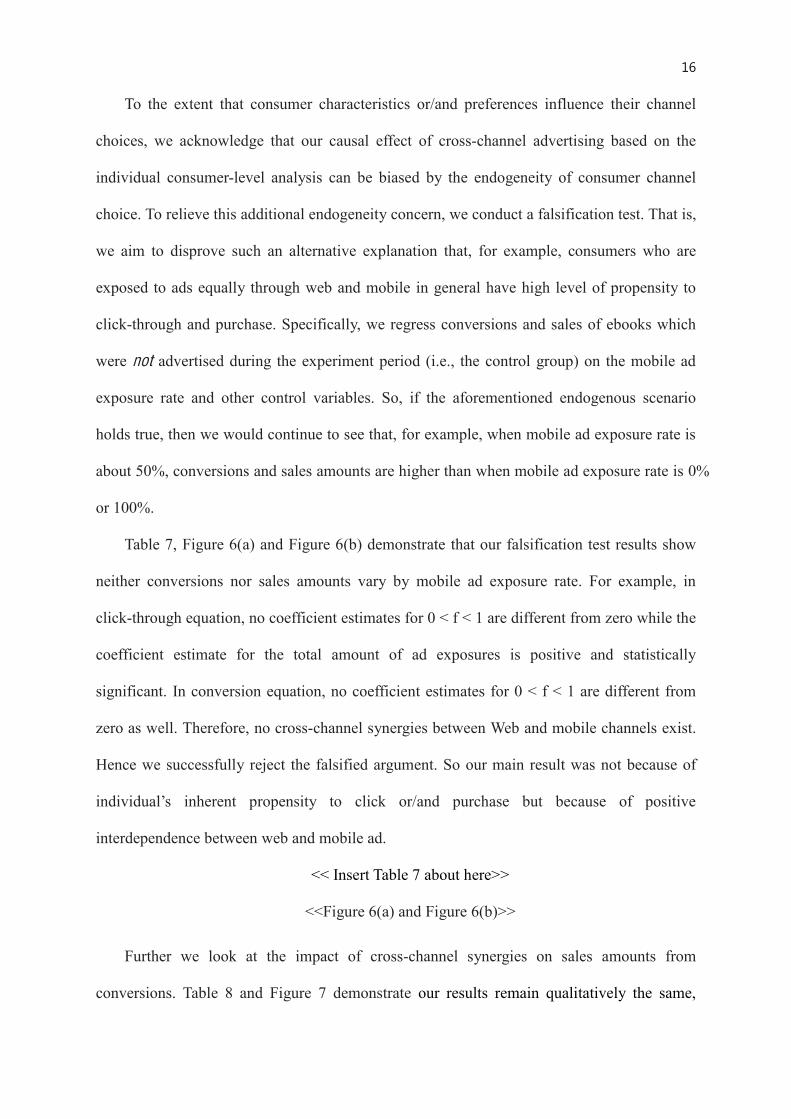
To the extent that consumer characteristics or/and preferences influence their channel
choices, we acknowledge that our causal effect of cross-channel advertising based on the
individual consumer-level analysis can be biased by the endogeneity of consumer channel
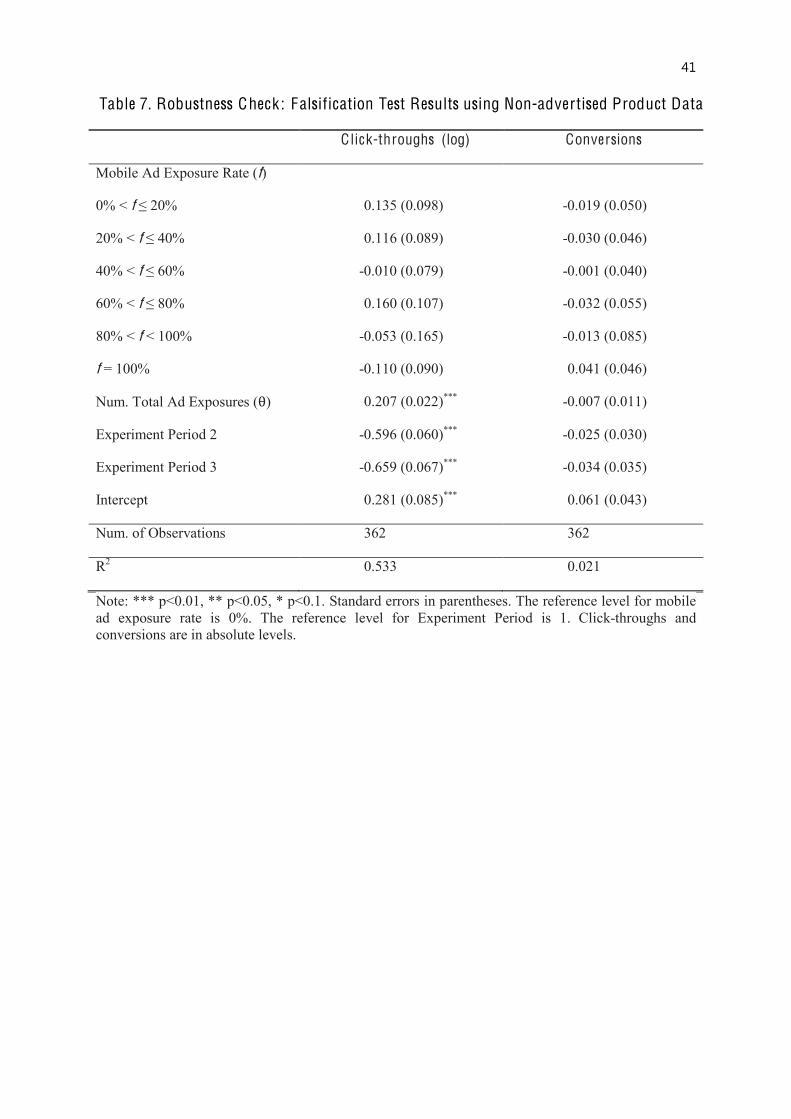
choice. To relieve this additional endogeneity concern, we conduct a falsification test. That is,
we aim to disprove such an alternative explanation that, for example, consumers who are
exposed to ads equally through web and mobile in general have high level of propensity to
click-through and purchase. Specifically, we regress conversions and sales of ebooks which
were not advertised during the experiment period (i.e., the control group) on the mobile ad
exposure rate and other control variables. So, if the aforementioned endogenous scenario
holds true, then we would continue to see that, for example, when mobile ad exposure rate is
about 50%, conversions and sales amounts are higher than when mobile ad exposure rate is 0%
or 100%.
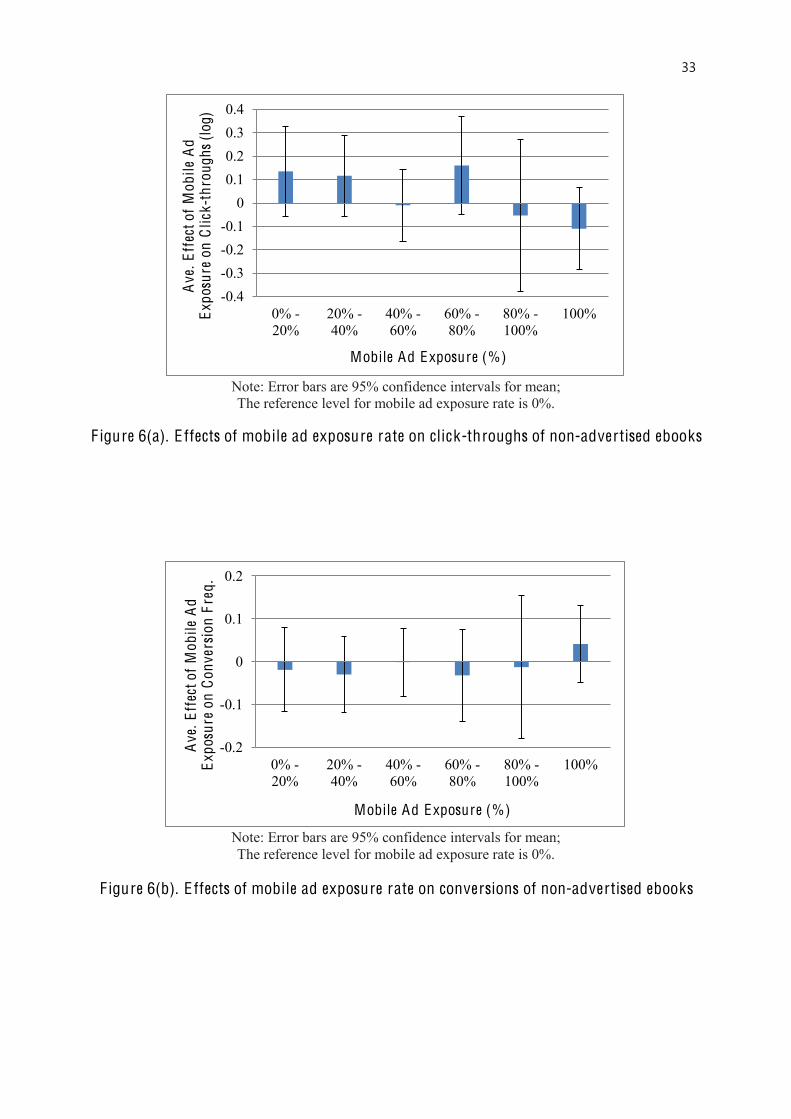
Table 7, Figure 6(a) and Figure 6(b) demonstrate that our falsification test results show
neither conversions nor sales amounts vary by mobile ad exposure rate. For example, in
click-through equation, no coefficient estimates for 0 < f < 1 are different from zero while the
coefficient estimate for the total amount of ad exposures is positive and statistically
significant. In conversion equation, no coefficient estimates for 0 < f < 1 are different from
zero as well. Therefore, no cross-channel synergies between Web and mobile channels exist.
Hence we successfully reject the falsified argument. So our main result was not because of
individual’s inherent propensity to click or/and purchase but because of positive
interdependence between web and mobile ad.
<< Insert Table 7 about here>>
<<Figure 6(a) and Figure 6(b)>>
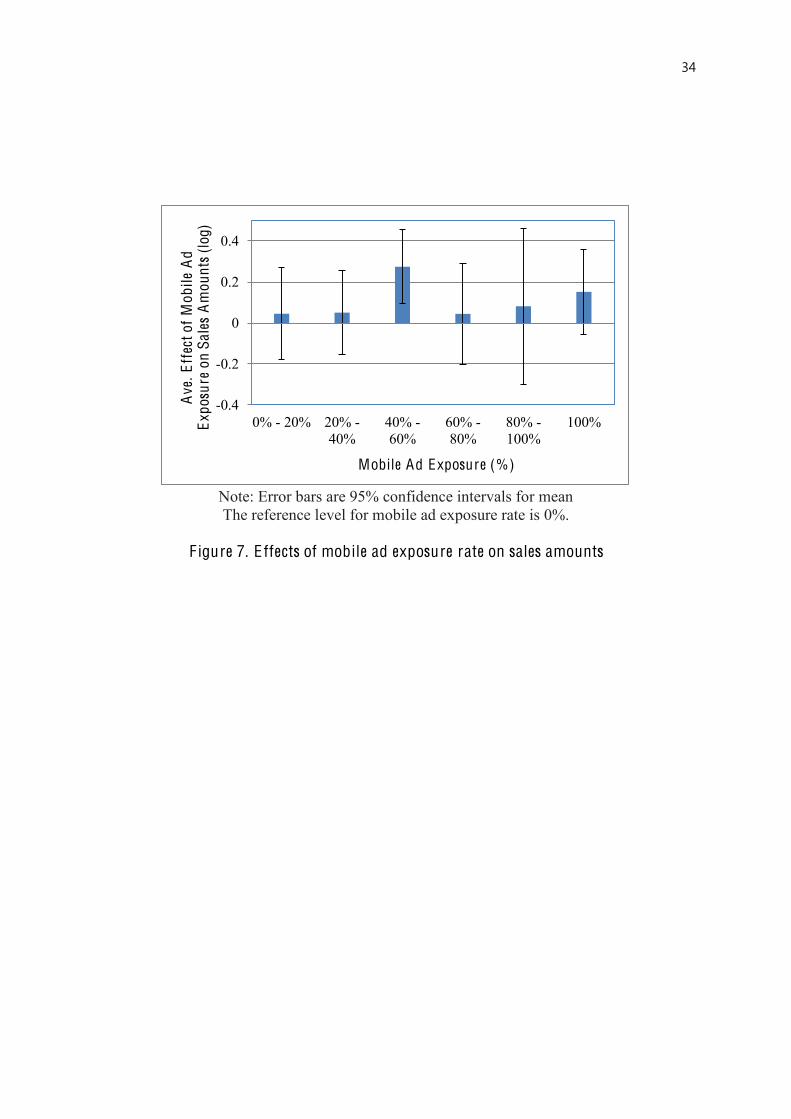
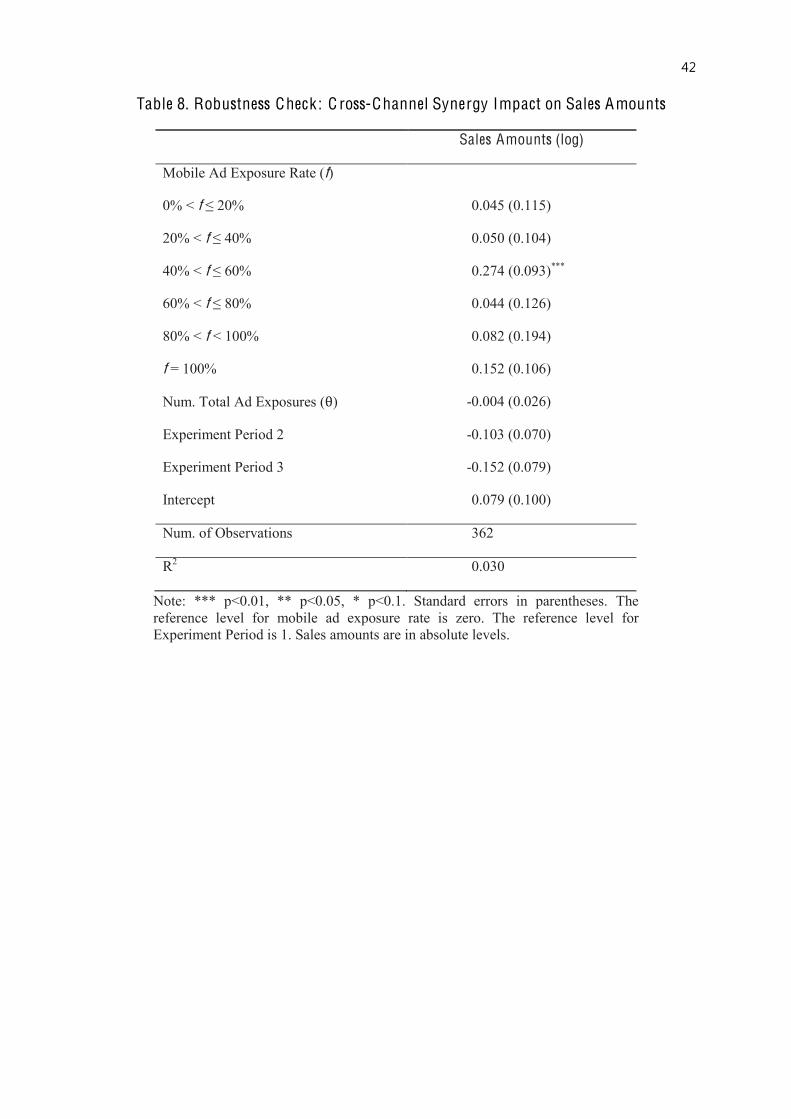
Further we look at the impact of cross-channel synergies on sales amounts from
conversions. Table 8 and Figure 7 demonstrate our results remain qualitatively the same,
17
regardless of whether we use the absolute level of conversion frequencies or sales amounts
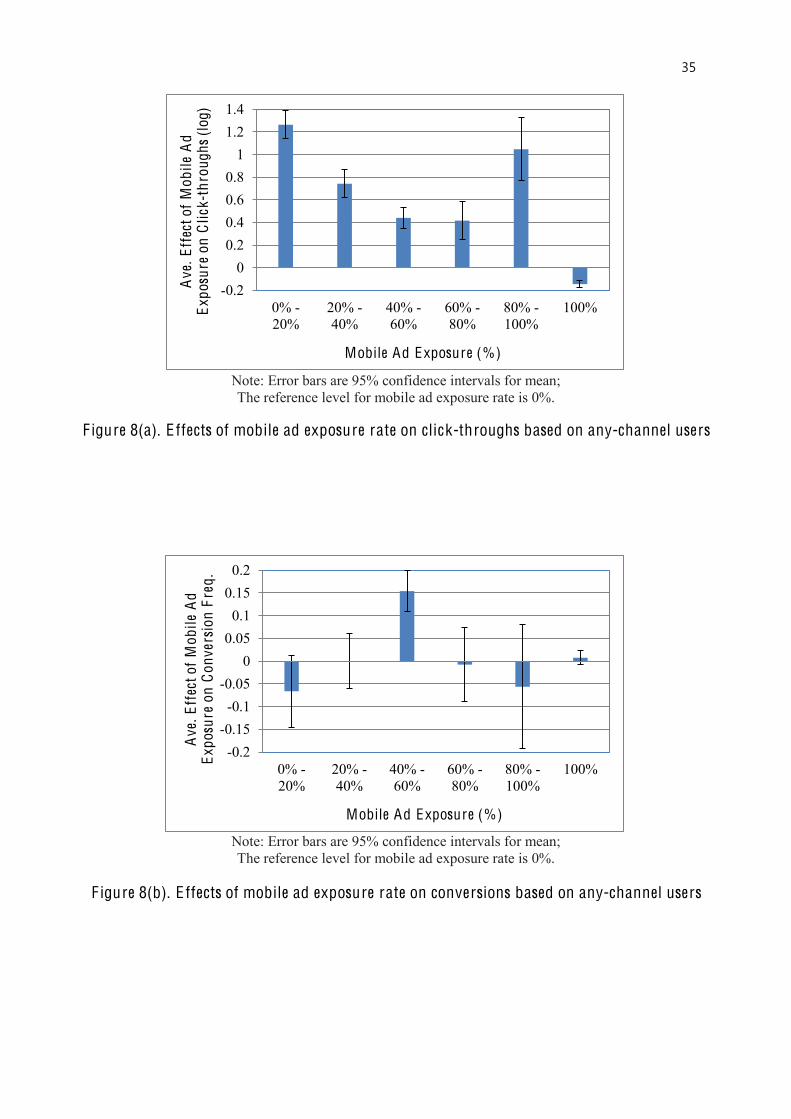
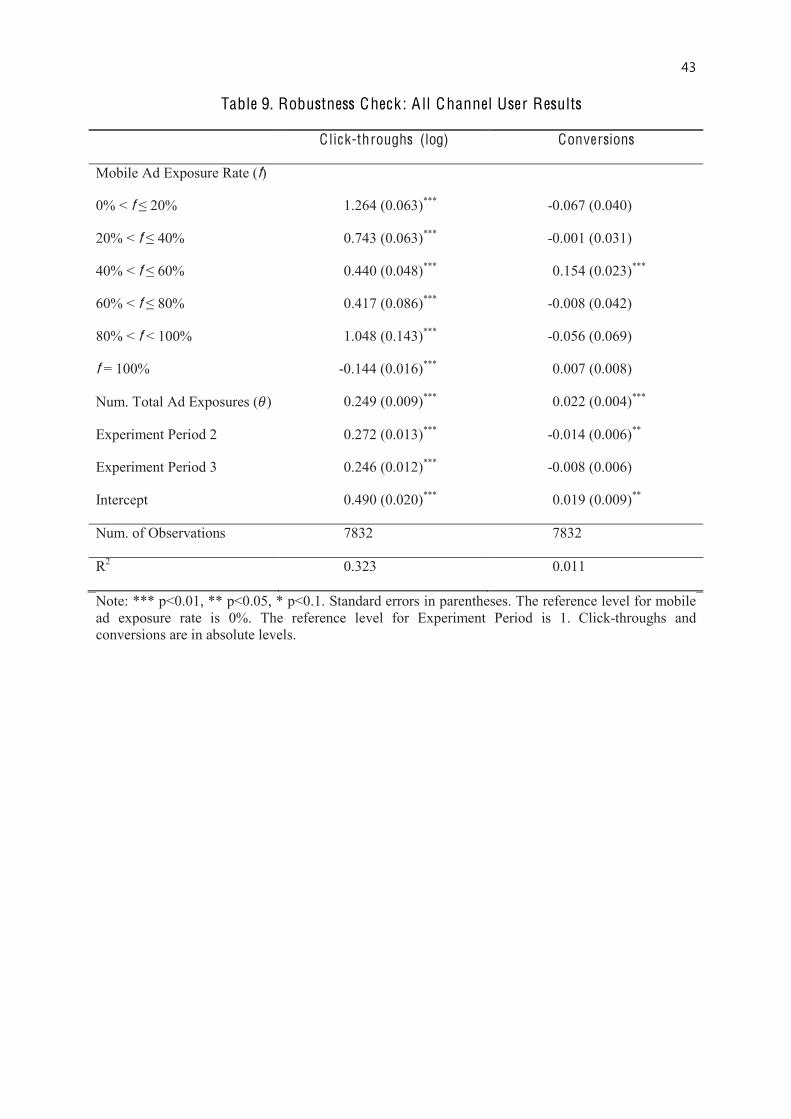
from conversions. Lastly, we relax the dual-channel use restriction. Table 9, Figure 8(a), and
Figure 8(b) demonstrate the result based on the entire sample of consumers in our data. We
find the results qualitatively remain the same as our main results.
<< Insert Table 8 and Table 9 about here>>
<< Insert Figure 7(a), Figure 7(b), and Figure 8 about here>>
To summarize, the individual consumer-level analysis from the experiment suggests a
causal interpretation such that: 1) web and mobile advertising work together and affect each
other positively in terms of improving click-throughs and conversions; 2) an inverted U-
shape relationship between mobile ad exposure rate and click-throughs/conversions; and 3)
long term effects of advertising is negligible in our context. Therefore, in advertising
planning, optimal decisions in one channel need to take account of the effects in the other
channel.
Optimal Policies for Web and Mobile Advertising
We next use the field experiment results and conduct simulations to evaluate and
recommend optimal policies for web and mobile advertising. Specifically, we address the
following question: What are the profit-maximizing percentages of web and mobile
advertising impressions when channel-specific costs for per-unit impressions are given to the
advertiser? The answers to these questions will provide useful guidelines for marketing
practitioners who deal with resource-allocation decisions between web and mobile
advertising channels. Our simulation results for optimal advertising policies are based on
cost-per-mile (CPM) pricing.
We consider a scenario in which an advertiser sets its target impressions for each
channel—web and mobile—given the values of web CPM and mobile CPM. We assume that
18
the advertiser maximizes its profit while satisfying budget constraints. An advertiser will use
both web and mobile advertising if and only if the profit from both is greater than that from
either channel alone. If the advertiser decides to use both web and mobile advertising, the
exact percentage of mobile advertising and web advertising is determined by comparing the
profits from five discrete percentage intervals (i.e., 0% - 20%, 20% - 40%, 40% - 60%, 60% -
80%, and 80% - 100%). Table 10 provides notations and parameter descriptions and
summarizes an advertiser’s cost, advertising budget constraint, conversion, revenue, and
profit when only web advertising is used, when only mobile advertising is used, when both
web and mobile advertising are used, respectively.
<< Insert Table 10 about here>>
Table 11 presents the optimal percentages of web and mobile advertising impressions.
The vertical axis denotes web CPM, and the horizontal axis denotes mobile CPM. We use the
midpoint of each interval. We find that, for example, when web CPM = $6 and mobile CPM =
$4, the profit-maximizing percentages of mobile and web advertising impressions are 50%
and 50%, respectively. That is, an advertiser should have 100,000 mobile impressions when
there are 100,000 web impressions. Also, we find that the optimal mobile and web
advertising percentages are 50% and 50% in a wide range of web CPM and mobile CPM.
<< Insert Table 11 about here>>
Further our simulation result demonstrates an important trade-off between revenue and
cost factors where increasing one decreases the other depending upon the values of web CPM
and mobile CPM. Our main results indicate that conversions and revenues are maximized
when the mobile ad exposure rate is around 50% (f= 0.5). However, as the CPM of one
channel becomes cheaper than the other, while the revenue would still be maximized, the cost
would be at the suboptimal level because an advertiser could minimize the cost by allocating
its advertising budget more (less) on the cheaper (more expensive) channel. For example,
19
when mobile CPM = $4, as web CPM decreases from $6 to $2 the profit-maximizing
percentages of mobile and web advertising impressions are still 50% and 50%, respectively.
So the revenue gain from the equal ad spending continues to exceed the potential cost saving
from increasing ad spending on the cheaper channel within the range of web CPM $2 – $6
when mobile CPM = $4. However, when web CPM reaches as low as $1, then it is optimal
for the advertiser to increase its web ad spending up to 90% and decrease its mobile ad
spending down to only 10%.
DISCUSSION AND IMPLICATIONS
As consumers increasingly use mobile devices to access the internet, they are exposed to
advertisings from marketers through the web and mobile channels. This paper provides an
understanding of how the interplay between web and mobile display advertising affects click-
throughs and conversions on both channels. We demonstrate that there exist positive cross-
channel synergies between online and mobile ads in click-throughs and conversions and that
their impact varies by the channel through which users are exposed to these two types of
advertising. Thus, we show that web and mobile work together and affect each other. Optimal
decisions in one need to take account of the effects in the other.
First, and most directly, this study has important implications for how to allocate
advertising dollars across multiple channels and multiple devices. Despite the fact that user
behavior has evolved and spans many channels, budgets and teams in companies and
organizations are often siloed by channel. Hence, our results on cross channel synergies can
provide useful guidelines for marketers who deal with resource-allocation decisions between
web and mobile advertising channels. This study is directly related to the issue of digital
attribution (“holy grail of digital marketing” today).
20
Our results suggest that companies can improve digital advertising click-throughs by
using both the web and mobile channels simultaneously, rather than separately. This can have
implications for increasing brand awareness and purchase intent in a multichannel
environment. During a series of ad exposures, a mix of web and mobile display ad acts as a
better memory cue that triggers consumers to recall product and eventually click/purchase, as
compared to either online ad only or mobile ad only. Increasingly, companies are spending
more dollars on mobile advertising. This result suggests that the mobile advertising channel
can significantly increase even the web channel’s effectiveness by improving total click-
throughs. According to eMarketer (2011), while ten percent of the average U.S. adult’s day is
now spent on mobile, mobile accounts for only one percent of firms’ advertising spending,
which suggests that there is a material upside to more mobile-advertising spending. Moreover,
our policy-simulation results provide practical guidelines for advertisers and companies in
making their resource-allocation decisions between web and mobile advertising channels.
These results provide advertisers with insights about how they can quantify the impact of
mobile advertising on click-throughs and conversions in an increasingly multiscreen world.
Our results show that consumers exhibit asymmetric cross-device conversion patterns by
purchasing a product through PCs and laptops after clicking on mobile ads disproportionately
more than the other way around. While there is a positive “reinforcement effect” of seeing the
same ad twice on two different media for web conversions, it seems this positive effect is
counterbalanced by other forces that end up reducing mobile conversions. Hence, when
evaluating the effectiveness of advertising channels, it is critical that marketers not measure
their effects separately but rather incorporate the cross-channel interdependence effects we
have identified in this paper. Hence, practitioners and researchers can reach the wrong
conclusion on the economic value of web advertising and mobile advertising if they consider
only the same-channel effect and they neglect the cross-channel interdependence effect.
21
Moreover, many industry reports indicate that there is a major mobile monetization gap,
with conversion rates and CPMs much lower on mobile than on the PC Internet. Some
consumers hesitate to purchase products through mobile devices due to smaller screen sizes,
security concerns about sending credit-card information over wireless networks, among
others (Marinsoftware 2012). This study can provide companies with insights about how they
can improve their mobile conversion rates. For example, when sponsored messages are
accompanied by mobile display advertising, companies should allow users not only to make a
purchase immediately (i.e., 1-click ordering), but also to have a quick access to business
information (i.e., contact numbers, product information). However, despite the fact that 61
percent of consumers would quickly move on to another site if they did not find what they
were looking for right away on a mobile site, 79 percent of large web advertisers still do not
have a mobile optimized site (Google 2012b). Thus, companies should develop a mobile
transaction-friendly website or app to win their mobile consumers from the competition. For
example, they can improve their mobile conversion rates by providing mobile-friendly
features such as faster loading (less than five seconds), large buttons, easy search, limited
scrolling and pinching, etc. (Google 2012b).
Data availability issues suggest that some caution is warranted in interpreting our key
findings. For example, our data on mobile advertising does not distinguish advertising that
appeared on mobile phones from those on tablets, which have somewhat larger screens than
phones but are somewhat heavier and less mobile. Future research can examine
interdependence among web, tablet, and smartphone advertising. In addition, our analysis
assumes that all clicks are intentional. It is possible that some clicks are accidental, especially
with mobile devices, due to smaller screen sizes and touchscreen input errors (Gigaom 2012).
Future research may model the interdependence between web and mobile advertising by
figuring out a way to screen out accidental clicks. Notwithstanding these limitations, our

22
analysis documents that web and mobile display advertising work better together than
separately. To the extent that consumers use both desktops/laptops and mobile devices
seamlessly in their searches and purchases, the increasing size of the mobile Internet may
have profound implications for the future direction of the mobile economy.
23
RE F ERE NC ES
Agarwal, Ashish, Kartik Hosanagar, Michael Smith (2012), “Do Organic Results Help or Hurt Sponsored Search Performance,” Working Paper, SSRN. Bart, Yakov, Andrew Stephen, Miklos Sarvary (2013), “ A Field Study of Mobile Display Advertising Effects on Consumer Attitudes and Intentions,” Working Paper, SSRN. Brunner, Gordon, Anand Kumar (2007) “Attitude Toward Location-Based Advertising,” Journal of Interactive Advertising, 7 (2), 3-15. Dickinger, Astrid, Mirella Kleijnen (2008) “Coupons Going Wireless: Determinants of Consumer Intentions to Redeem Mobile Coupons,” Journal of Interactive Marketing, 22 (3), 23-39. Dynamic Logic (2004) “Consumer Perceptions of Various Ad Formats,” in Beyond the Click: Insights from Online Advertising Research, Available at http://www.dynamiclogic.com. eMarketer (2011) “Average Time Spent Per Day with Major Media by US Adults 2011,” Available at http://techcrunch.com/2011/12/12/time-spent-mobile-print/. eMarketer (2012) “Twitter Earns More Mobile Ad Revenue Than Facebook,” Available at http://adage.com/article/digital/twitter-earns-mobile-ad-revenue-facebook-long/237035/. Gartner (2011) “Gartner Says Worldwide Mobile Application Store Revenue Forecast to Surpass $15 Billion in 2011,” Available at http://www.gartner.com/it/page.jsp?id=1529214.
Ghose, Anindya and Sha Yang (2010) “Modeling Cross-Category Purchases in Sponsored Search Advertising. Working Paper, SSRN.
Ghose, Anindya and Sang Pil Han (2011) “An Empirical Analysis of User Content Generation and Usage Behavior on the Mobile Internet,” Management Science, 57 (9), 1671-1691. Ghose, Anindya, Avi Goldfarb, and Sang Pil Han (2013) “How is the Mobile Internet Different? Search Costs and Local Activities,” Information Systems Research, 24 (3), 613-631. Gigaom (2012) “40 Percent of Mobile Ad Clicks are Fraud or Accidents,” Available at
24
http://gigaom.com/2012/08/31/report-40-percent-of-mobile-clicks-are-fraud-or-accidents/. Goldfarb, Avi and Catherine Tucker (2011a) “Search Engine Advertising: Channel Substitution when Pricing Ads to Context,” Management Science, 57 (3), 458-470. Goldfarb, Avi and Catherine Tucker (2011b) “Advertising Bans and the Substitutability of Online and Offline Advertising,” Journal of Marketing Research, 48 (2), 207-228.
Goldfarb, Avi and Catherine Tucker (2011c) “Online Display Advertising: Targeting and Obtrusiveness,” Marketing Science, 30 (3), 389-404. Google (2012a) “The New Multi-screen World: Understanding Cross-platform Consumer Behavior,” Available at http://services.google.com/fh/files/misc/multiscreenworld_final.pdf. Google (2012b) “Mobile-friendly Sites Turn Visitors Into Customers,” Available at http://googlemobileads.blogspot.com/2012/09/mobile-friendly-sites-turn-visitors.html. Greene, William (1999) Econometric Analysis, 4th ed. Prentice Hall, Upper Saddle River, NJ. Gu, Bin (2012) “Quantifying the Dynamic Sales Impact of Location-based Mobile Advertising Technologies,” Working Paper, Arizona State University. Hausman, Jerry (1975) “An Instrumental Variable Approach to Full Information Estimators for Linear and Certain Nonlinear Econometric models,” Econometrica, 43, 727–738. International Telecommunications Union (ITU) (2011) “ICT Facts and Figures,” Available at http://www.itu.int/ITU-D/ict/facts/2011/material/ICTFactsFigures2011.pdf. Jerath, Kinshuk, Liye Ma, and Young-Hoon Park, Kannan Srinivasan (2009) “A “Position Paradox” in Sponsored Search Auctions,” Johnson School Research Paper, 36-09, Cornell University, Ithaca, NY. Lahiri, Kajal and Peter Schmidt (1978) “On the Estimation of Triangular Structural Systems,” Econometrica, 46 (5), 1217–1221.
25
Lewis, Randall and Dan Nguyen (2012) “Wasn’t That Ad for an iPad? Display Advertising’s Impact on Advertiser- and Competitor-Branded Search,” Working Paper. Lewis, Randall, Justin Rao, David Reiley (2013) “Measuring the Effects of Advertising: The Digital Frontier,” Working Paper. Manchanda, Puneet, Jean-Pierre Dubé, Khim Yong Goh, and Pradeep Chintagunta (2006) “The Effect of Banner Advertising on Internet Purchasing,” Journal of Marketing Research, 43 (1), 98-108. Marlinsoftware (2012) “The State of Mobile Search Advertising in the US,” Available at http://www.marinsoftware.com/resources/whitepapers/2012-mobile-advertising-report. Molitor, Dominik, Philipp Reichhart, and Martin Spann (2013) “Location-based Advertising: What is the Value of Physical Distance on the Mobile Internet?” Working Paper, Ludwig-Maximilians University. Sahni, Navdeep S (2012) “Effect of Temporal Spacing between Advertising Exposures: Evidence from Online Field Experiments,” Working Paper. Shankar, Venkatesh and Sridhar Balasubramanian (2009) “Mobile Marketing: A Synthesis and Prognosis,” Journal of Interactive Marketing, 23 (2), 118-129. Shankar, Venkatesh, Alladi Venkatesh, Charles Hofacker, and Prasad Naik (2010) “Mobile Marketing in the Retailing Environment: Current Insights and Future Research Avenues,” Journal of Interactive Marketing, 24 (2), 111-120. Sinisalo, Jaakko (2011) “The Role of the Mobile Medium in Multichannel CRM Communication,” International Journal of Electronic Customer Relationship Management, 5 (1), 23-45. Sultan, Fareena, Andrew Rohm, and Tao Gao (2009) “Factors Influencing Consumer Acceptance of Mobile Marketing: A Two Country Study of Youth Markets,” Journal of Interactive Marketing, 23 (4), 308-320. Rutz, Oliver and Randolph Bucklin (2011) “From Generic to Branded: A Model of Spillover Dynamics in Paid Search Advertising,” Journal of Marketing Research, Forthcoming.

26
Xu, Heng, Lih-Bin Oh, and Hock-Hai Teo (2009) “Perceived Effectiveness of Text vs. Multimedia Location-based Advertising Messaging,” International Journal of Mobile Communications, 7 (2), 154-177. Yang, Sha and Anindya Ghose (2010) “Analyzing the Relationship Between Organic and Sponsored Search Advertising: Positive, Negative, or Zero Interdependence?” Marketing Science, 29 (4), 602-623.

27
F OOTNOT ES
1. In this paper we use the term web advertising to refer to display ads shown online to
PC/desktop users.
28
Note: Error bars are 95% confidence intervals for mean.
The p-value for the mean difference is 0.045.
F igure 1(a). Web C T R Comparison
Note: Error bars are 95% confidence intervals for mean.
The p-value for the mean difference is 0.052.
F igure 1(b). Mobile C T R Comparison
Web only Web and MobileTotal CTR 1.18% 1.59%
0.00%
0.50%
1.00%
1.50%
2.00%
2.50%
Web C lick-through Rate
Mobile only Web and MobileTotal CTR 0.65% 0.80%
0.00%
0.20%
0.40%
0.60%
0.80%
1.00%Mobile C lick-through Rate
29
Note: Error bars are 95% confidence intervals for mean.
The p-value for the mean difference is 0.044.
F igure 2(a). Web conversion rate comparison
Note: Error bars are 95% confidence intervals for mean.
The p-value for the mean difference is 0.213.
F igure 2(b). Mobile conversion rate comparison
Web only Web and MobileTotal CVR 3.52% 4.78%
0.00%
1.00%
2.00%
3.00%
4.00%
5.00%
6.00%
Web Conversion Rate
mobile only web and mobileTotal CVR 2.16% 1.83%
0.00%
0.50%
1.00%
1.50%
2.00%
2.50%
3.00%
Mobile Conversion Rate
30
Note: The sales amount from a single channel is fixed at 1,000 as a baseline.
The p-value for the mean difference is 0.038.
F igure 3(a). Total sales comparison: Web only vs. Web and mobile.
Note: The sales amount from a single channel is fixed at 1,000 as a baseline. The p-value for the mean difference is 0.040.
F igure 3(b). Total sales comparison: Mobile only vs. Web and mobile.
31
Note: Error bars are 95% confidence intervals for mean; The reference level for mobile ad exposure rate is 0%.
F igure 4(a). E ffects of mobile ad exposure rate on click-throughs
Note: Error bars are 95% confidence intervals for mean The reference level for mobile ad exposure rate is 0%.
F igure 4(b). E ffects of mobile ad exposure rate on conversions
-0.5
0
0.5
1
1.5
0% - 20% 20% -40%
40% -60%
60% -80%
80% -100%
100%
Ave
. Eff
ect o
f M
obile
Ad
Expo
sure
on
Clic
k-th
roug
hs (l
og)
Mobile Ad Exposure (%)
-0.2
0
0.2
0.4
0% - 20% 20% -40%
40% -60%
60% -80%
80% -100%
100%Ave
. Eff
ect o
f M
obile
Ad
Expo
sure
on
Con
vers
ion
Freq
uenc
y
Mobile Ad Exposure (%)
32
F igure 5(a). F itted quadratic regression curve for click-throughs
F igure 5(b). F itted quadratic regression curve for conversions
-0.6
-0.4
-0.2
0
0.2
0.4
0% 20% 40% 60% 80% 100%
Ave
. Eff
ect o
f M
obile
Ad
Expo
sure
on
Clic
k-th
roug
hs (l
og)
Mobile Ad Exposure (%)
0
0.05
0.1
0.15
0.2
0% 20% 40% 60% 80% 100%
Ave
. Eff
ect o
f M
obile
Ad
Expo
sure
on
Con
vers
ion
Freq
uenc
y
Mobile Ad Exposure (%)
33
Note: Error bars are 95% confidence intervals for mean; The reference level for mobile ad exposure rate is 0%.
F igure 6(a). E ffects of mobile ad exposure rate on click-throughs of non-advertised ebooks
Note: Error bars are 95% confidence intervals for mean; The reference level for mobile ad exposure rate is 0%.
F igure 6(b). E ffects of mobile ad exposure rate on conversions of non-advertised ebooks
-0.4-0.3-0.2-0.1
00.10.20.30.4
0% -20%
20% -40%
40% -60%
60% -80%
80% -100%
100%
Ave
. Eff
ect o
f M
obile
Ad
Expo
sure
on
Clic
k-th
roug
hs (l
og)
Mobile Ad Exposure (%)
-0.2
-0.1
0
0.1
0.2
0% -20%
20% -40%
40% -60%
60% -80%
80% -100%
100%
Ave
. Eff
ect o
f M
obile
Ad
Expo
sure
on
Con
vers
ion
Freq
.
Mobile Ad Exposure (%)
34
Note: Error bars are 95% confidence intervals for mean The reference level for mobile ad exposure rate is 0%.
F igure 7. E ffects of mobile ad exposure rate on sales amounts
-0.4
-0.2
0
0.2
0.4
0% - 20% 20% -40%
40% -60%
60% -80%
80% -100%
100%
Ave
. Eff
ect o
f M
obile
Ad
Expo
sure
on
Sale
s A
mou
nts
(log)
Mobile Ad Exposure (%)
35
Note: Error bars are 95% confidence intervals for mean; The reference level for mobile ad exposure rate is 0%.
F igure 8(a). E ffects of mobile ad exposure rate on click-throughs based on any-channel users
Note: Error bars are 95% confidence intervals for mean; The reference level for mobile ad exposure rate is 0%.
F igure 8(b). E ffects of mobile ad exposure rate on conversions based on any-channel users
-0.20
0.20.40.60.8
11.21.4
0% -20%
20% -40%
40% -60%
60% -80%
80% -100%
100%
Ave
. Eff
ect o
f M
obile
Ad
Expo
sure
on
Clic
k-th
roug
hs (l
og)
Mobile Ad Exposure (%)
-0.2-0.15-0.1
-0.050
0.050.1
0.150.2
0% -20%
20% -40%
40% -60%
60% -80%
80% -100%
100%
Ave
. Eff
ect o
f M
obile
Ad
Expo
sure
on
Con
vers
ion
Freq
.
Mobile Ad Exposure (%)

36
Table 1. F ield Experiment Design: web and Mobile Advertising Schedule
E-books T ime Cohort 1
A , B , C , D , E
Cohort 2
F , G , H , I , J
10 e-books
A1, B1, C1, D1, E1,
F1, G1, H1, I1, J1
Mon – Wed in Week 1 web Mobile
Thur – Sat in Week 1 web & Mobile None
Mon – Wed in Week 2 Mobile web
Thur – Sat in Week 2 None web & Mobile
10 e-books
A2, B2, C2, D2, E2,
F2, G2, H2, I2, J2
Mon – Wed in Week 3 web Mobile
Thur – Sat in Week 3 web & Mobile None
Mon – Wed in Week 4 Mobile web
Thur – Sat in Week 4 None web & Mobile
10 e-books
A3, B3, C3, D3, E3,
F3, G3, H3, I3, J3
Mon – Wed in Week 5 web Mobile
Thur – Sat in Week 5 web & Mobile None
Mon – Wed in Week 6 Mobile web
Thur – Sat in Week 6 None web & Mobile
37
Table 2. Descriptive Statistics of E-book Profile in the Experiment
Variables Statistics
Mean Std. dev. M in Max
Sales Price (US$) 6.66 2.16 1.65 10.43
Content Size (Mega Byes) 5.10 5.20 0.57 20.56
Days Since Release (Days) 180.90 210.72 20 867
Table 3. C ross-Channel Conversion Rates
Conversions:
from (row) to (column) W eb Mobile
W eb 95.8% 4.2%
Mobile 11.6% 88.4%
38
Table 4. Model Estimation Results
Click-throughs (log) Conversions
Mobile Ad Exposure Rate (f)
0% < f ≤ 20% 1.108 (0.111)*** 0.034 (0.081)
20% < f ≤ 40% 0.565 (0.101)*** 0.059 (0.073)
40% < f ≤ 60% 0.260 (0.089)*** 0.196 (0.065)***
60% < f ≤ 80% 0.221 (0.122)* 0.041 (0.088)
80% < f < 100% 0.784 (0.187)*** 0.050 (0.120)
f = 100% -0.288 (0.102)*** 0.064 (0.075)
Num. Total Ad Exposures (θ) 0.230 (0.025)*** -0.003 (0.018)
Experiment Period 2 0.207 (0.068)*** -0.077 (0.049)
Experiment Period 3 0.335 (0.077)*** -0.100 (0.056)*
Intercept 0.706 (0.096)*** 0.057 (0.070)
Num. of Observations 362 362
R2 0.650 0.025
Note: *** p<0.01, ** p<0.05, * p<0.1. Standard errors in parentheses. The reference level for mobile ad exposure rate is 0%. The reference level for Experiment Period is 1. Click-throughs and conversions are in absolute levels.
39
Table 5. Robustness Check: Quadratic Model Results
Click-throughs (log) Conversions
Mobile Ad Exposure Rate (f) 1.080 (0.324)*** 0.577 (0.208)***
Mobile Ad Exposure Rate Squared (f2) -1.585 (0.304)*** -0.508 (0.196)**
Num. Total Ad Exposures (θ) 0.369 (0.024)*** -0.006 (0.015)
Experiment Period 2 0.232 (0.076)*** -0.086 (0.049)*
Experiment Period 3 0.517 (0.080)*** -0.124 (0.052)**
Intercept 0.714 (0.106)*** 0.053 (0.068)
Num. of Observations 362 362
R2 0.553 0.023
Note: *** p<0.01, ** p<0.05, * p<0.1. Standard errors in parentheses. The reference level for Experiment Period is 1. Click-throughs and conversions are in absolute levels.
40
Table 6. Robustness Check: Long Term E ffects of Ads
C lick-throughs (log) Conversions
Mobile Ad Exposure Rate (f)
0% < f ≤ 20% 1.060 (0.098)*** -0.016 (0.079)
20% < f ≤ 40% 0.546 (0.093)*** 0.032 (0.076)
40% < f ≤ 60% 0.291 (0.078)*** 0.133 (0.063)**
60% < f ≤ 80% 0.291 (0.108)*** 0.027 (0.088)
80% < f < 100% 0.789 (0.158)*** -0.002 (0.129)
f = 100% -0.039 (0.094) 0.127 (0.087)
Num. Total Ad Exposures (𝜃) 0.316 (0.031)*** 0.035 (0.025)
Num. Total Ad Exposures Prev. Session -0.029 (0.018) -0.033 (0.022)
Experiment Period 2 0.284 (0.066)*** -0.116 (0.053)**
Experiment Period 3 0.321 (0.068)*** -0.149 (0.055)***
Intercept 0.543 (0.090)*** 0.085 (0.073)
Num. of Observations 360 360
R2 0.598 0.033
Note: *** p<0.01, ** p<0.05, * p<0.1. Standard errors in parentheses. The reference level for mobile ad exposure rate is 0%. The reference level for Experiment Period is 1. Click-throughs and conversions are in absolute levels.
41
Table 7. Robustness Check: Falsification Test Results using Non-advertised Product Data
C lick-throughs (log) Conversions
Mobile Ad Exposure Rate (f)
0% < f ≤ 20% 0.135 (0.098) -0.019 (0.050)
20% < f ≤ 40% 0.116 (0.089) -0.030 (0.046)
40% < f ≤ 60% -0.010 (0.079) -0.001 (0.040)
60% < f ≤ 80% 0.160 (0.107) -0.032 (0.055)
80% < f < 100% -0.053 (0.165) -0.013 (0.085)
f = 100% -0.110 (0.090) 0.041 (0.046)
Num. Total Ad Exposures (θ) 0.207 (0.022)*** -0.007 (0.011)
Experiment Period 2 -0.596 (0.060)*** -0.025 (0.030)
Experiment Period 3 -0.659 (0.067)*** -0.034 (0.035)
Intercept 0.281 (0.085)*** 0.061 (0.043)
Num. of Observations 362 362
R2 0.533 0.021
Note: *** p<0.01, ** p<0.05, * p<0.1. Standard errors in parentheses. The reference level for mobile ad exposure rate is 0%. The reference level for Experiment Period is 1. Click-throughs and conversions are in absolute levels.
42
Table 8. Robustness Check: C ross-Channel Synergy Impact on Sales Amounts
Sales Amounts (log)
Mobile Ad Exposure Rate (f)
0% < f ≤ 20% 0.045 (0.115)
20% < f ≤ 40% 0.050 (0.104)
40% < f ≤ 60% 0.274 (0.093)***
60% < f ≤ 80% 0.044 (0.126)
80% < f < 100% 0.082 (0.194)
f = 100% 0.152 (0.106)
Num. Total Ad Exposures (θ) -0.004 (0.026)
Experiment Period 2 -0.103 (0.070)
Experiment Period 3 -0.152 (0.079)
Intercept 0.079 (0.100)
Num. of Observations 362
R2 0.030
Note: *** p<0.01, ** p<0.05, * p<0.1. Standard errors in parentheses. The reference level for mobile ad exposure rate is zero. The reference level for Experiment Period is 1. Sales amounts are in absolute levels.
43
Table 9. Robustness Check: A ll Channel User Results
Click-throughs (log) Conversions
Mobile Ad Exposure Rate (f)
0% < f ≤ 20% 1.264 (0.063)*** -0.067 (0.040)
20% < f ≤ 40% 0.743 (0.063)*** -0.001 (0.031)
40% < f ≤ 60% 0.440 (0.048)*** 0.154 (0.023)***
60% < f ≤ 80% 0.417 (0.086)*** -0.008 (0.042)
80% < f < 100% 1.048 (0.143)*** -0.056 (0.069)
f = 100% -0.144 (0.016)*** 0.007 (0.008)
Num. Total Ad Exposures (𝜃) 0.249 (0.009)*** 0.022 (0.004)***
Experiment Period 2 0.272 (0.013)*** -0.014 (0.006)**
Experiment Period 3 0.246 (0.012)*** -0.008 (0.006)
Intercept 0.490 (0.020)*** 0.019 (0.009)**
Num. of Observations 7832 7832
R2 0.323 0.011
Note: *** p<0.01, ** p<0.05, * p<0.1. Standard errors in parentheses. The reference level for mobile ad exposure rate is 0%. The reference level for Experiment Period is 1. Click-throughs and conversions are in absolute levels.
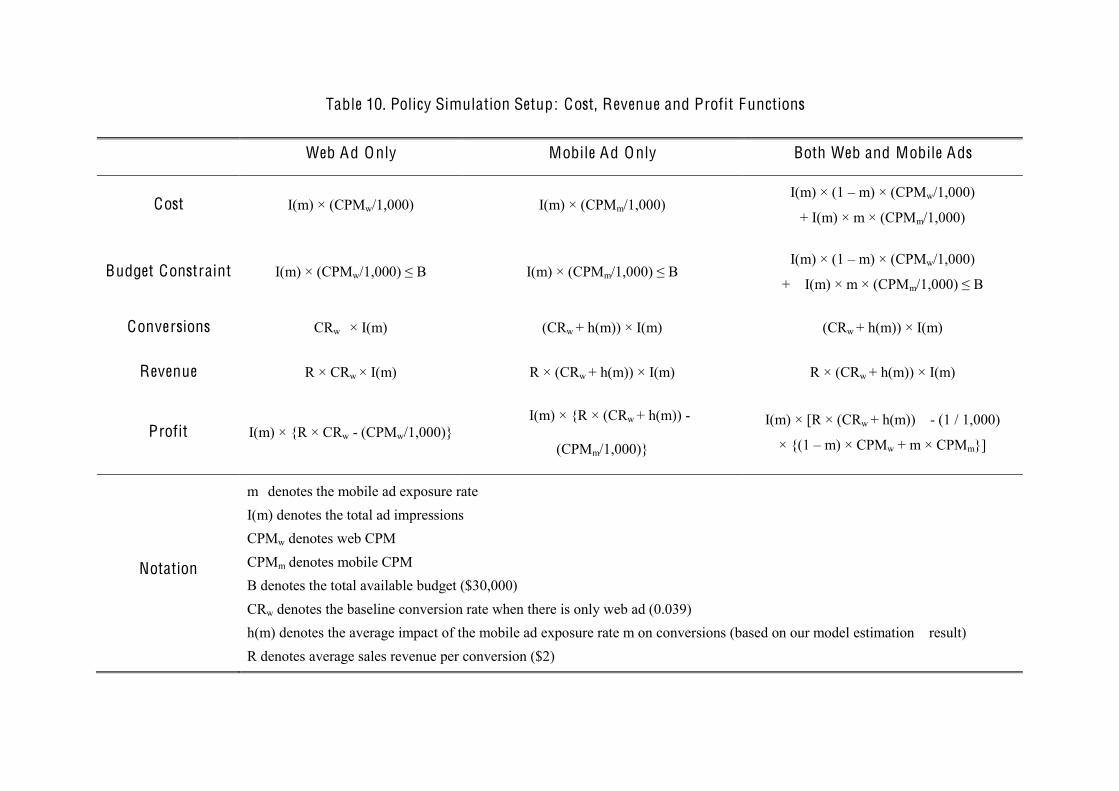
Table 10. Policy Simulation Setup: Cost, Revenue and Profit Functions
Web Ad Only Mobile Ad Only Both Web and Mobile Ads
Cost I(m) × (CPMw/1,000) I(m) × (CPMm/1,000) I(m) × (1 – m) × (CPMw/1,000)
+ I(m) × m × (CPMm/1,000)
Budget Constraint I(m) × (CPMw/1,000) ≤ B I(m) × (CPMm/1,000) ≤ B I(m) × (1 – m) × (CPMw/1,000)
+ I(m) × m × (CPMm/1,000) ≤ B
Conversions CRw × I(m) (CRw + h(m)) × I(m) (CRw + h(m)) × I(m)
Revenue R × CRw × I(m) R × (CRw + h(m)) × I(m) R × (CRw + h(m)) × I(m)
Profit I(m) × R × CRw - (CPMw/1,000) I(m) × R × (CRw + h(m)) -
(CPMm/1,000)
I(m) × [R × (CRw + h(m)) - (1 / 1,000)
× (1 – m) × CPMw + m × CPMm]
Notation
m denotes the mobile ad exposure rate I(m) denotes the total ad impressions CPMw denotes web CPM CPMm denotes mobile CPM B denotes the total available budget ($30,000) CRw denotes the baseline conversion rate when there is only web ad (0.039) h(m) denotes the average impact of the mobile ad exposure rate m on conversions (based on our model estimation result) R denotes average sales revenue per conversion ($2)
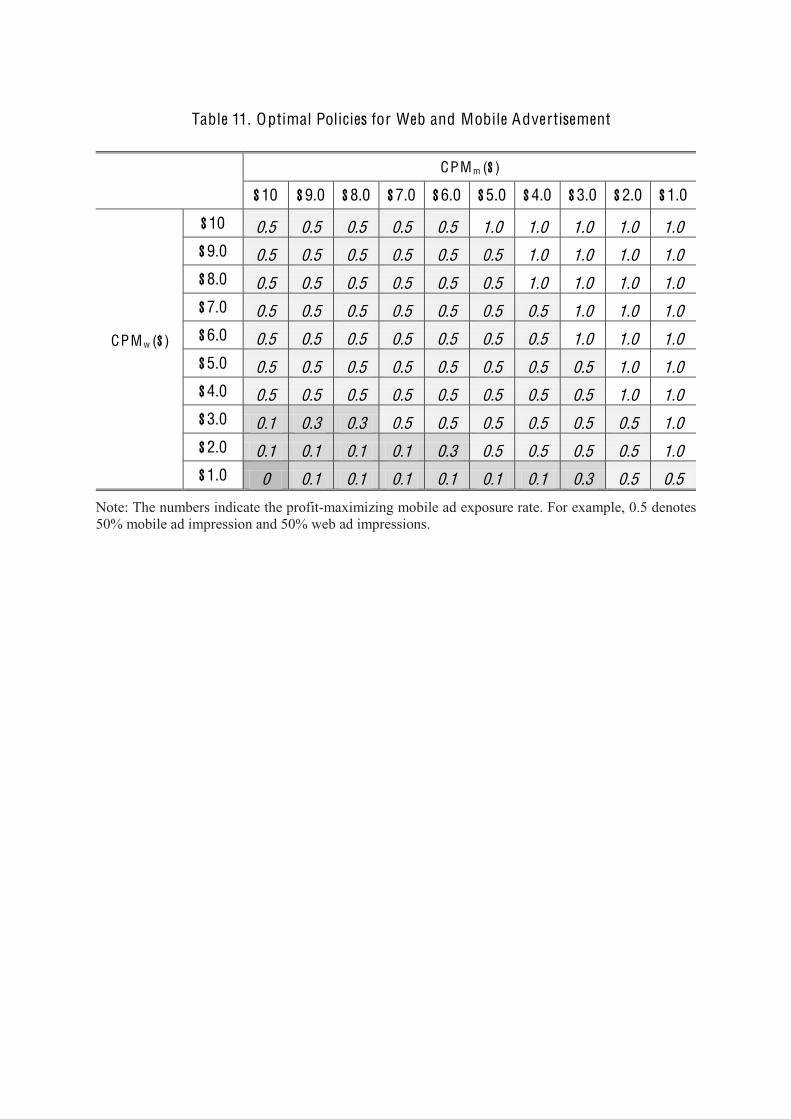
Table 11. Optimal Policies for Web and Mobile Advertisement
CPM m ($)
$10 $9.0 $8.0 $7.0 $6.0 $5.0 $4.0 $3.0 $2.0 $1.0
CPMw ($)
$10 0.5 0.5 0.5 0.5 0.5 1.0 1.0 1.0 1.0 1.0 $9.0 0.5 0.5 0.5 0.5 0.5 0.5 1.0 1.0 1.0 1.0 $8.0 0.5 0.5 0.5 0.5 0.5 0.5 1.0 1.0 1.0 1.0 $7.0 0.5 0.5 0.5 0.5 0.5 0.5 0.5 1.0 1.0 1.0 $6.0 0.5 0.5 0.5 0.5 0.5 0.5 0.5 1.0 1.0 1.0 $5.0 0.5 0.5 0.5 0.5 0.5 0.5 0.5 0.5 1.0 1.0 $4.0 0.5 0.5 0.5 0.5 0.5 0.5 0.5 0.5 1.0 1.0 $3.0 0.1 0.3 0.3 0.5 0.5 0.5 0.5 0.5 0.5 1.0 $2.0 0.1 0.1 0.1 0.1 0.3 0.5 0.5 0.5 0.5 1.0 $1.0 0 0.1 0.1 0.1 0.1 0.1 0.1 0.3 0.5 0.5
Note: The numbers indicate the profit-maximizing mobile ad exposure rate. For example, 0.5 denotes 50% mobile ad impression and 50% web ad impressions.