Embed Size (px)
Citation preview

11
Cross-Border Higher Education
(CBHE) for Labor Market Needs:
Mobility of Public-Funded Malaysian
Students to Japan over Years
Paper presented for the 14th UNESCO-APEID Conference on
October 23, 2010 (Session 5.B.2 Cross-border Higher
Education for Regional Integration and Labor Market in East
Asia: Case of Malaysian-Japanese Cooperation for Human
Japan International Cooperation Agency
Research Institute (JICA-RI)
Yoshiko Koda ([email protected])
Takako Yuki ([email protected])
Yeeyoung Hong

2
Outline
1. Introduction(1) Motivation
(2) Research question
(3) Definition, methods, and data
2. Contextual background(1) Changing Malaysian Economy
(2) Human Resource Development (HRD) • HRD policies
• Domestic Higher Education Institution (HEI) Development
• Cross-Border Higher Education (CBHE)
(3) Manufacturing firms‟ view on high level HRD
3. Malaysian Students in Japan
4. Findings of labor market outcomes of CBHE: a case between Malaysia and Japan (i.e., “HELP”)
(1) Post Graduation Activities
(2) Sectors of Employment (Relevance)
(3) Location of Employment (Brain Drain)
5. Changing roles of Japanese ODA

3
Introduction
4
Motivation: Why Labor Market
Outcomes of CBHE? (1)
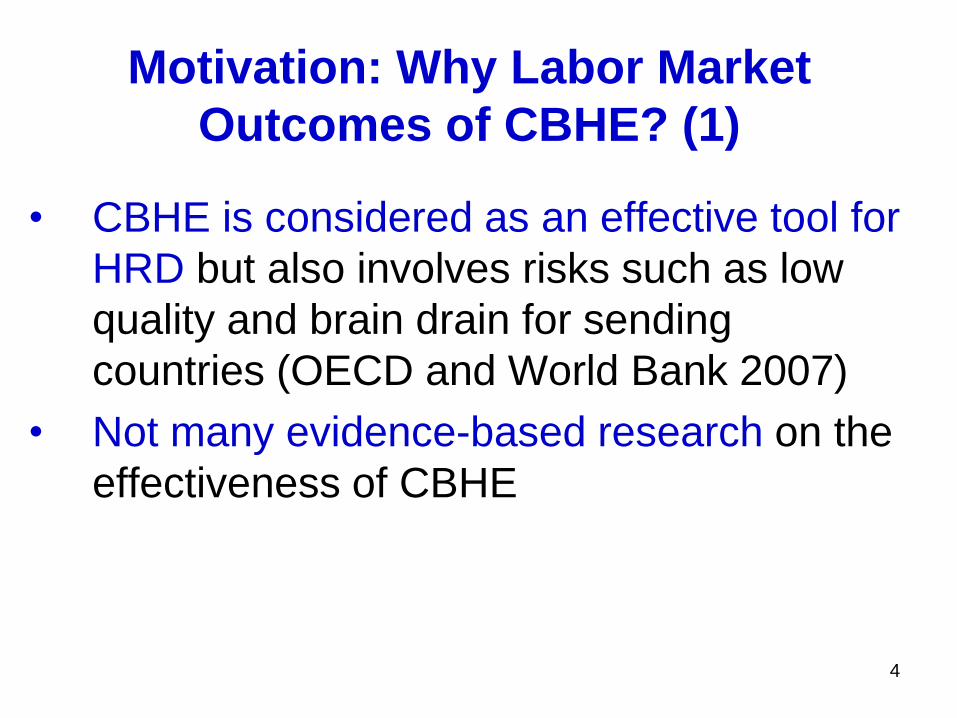
• CBHE is considered as an effective tool for
HRD but also involves risks such as low
quality and brain drain for sending
countries (OECD and World Bank 2007)
• Not many evidence-based research on the
effectiveness of CBHE
5
Motivation: Concentration of Japanese ODA for
High Level Human Resource Development
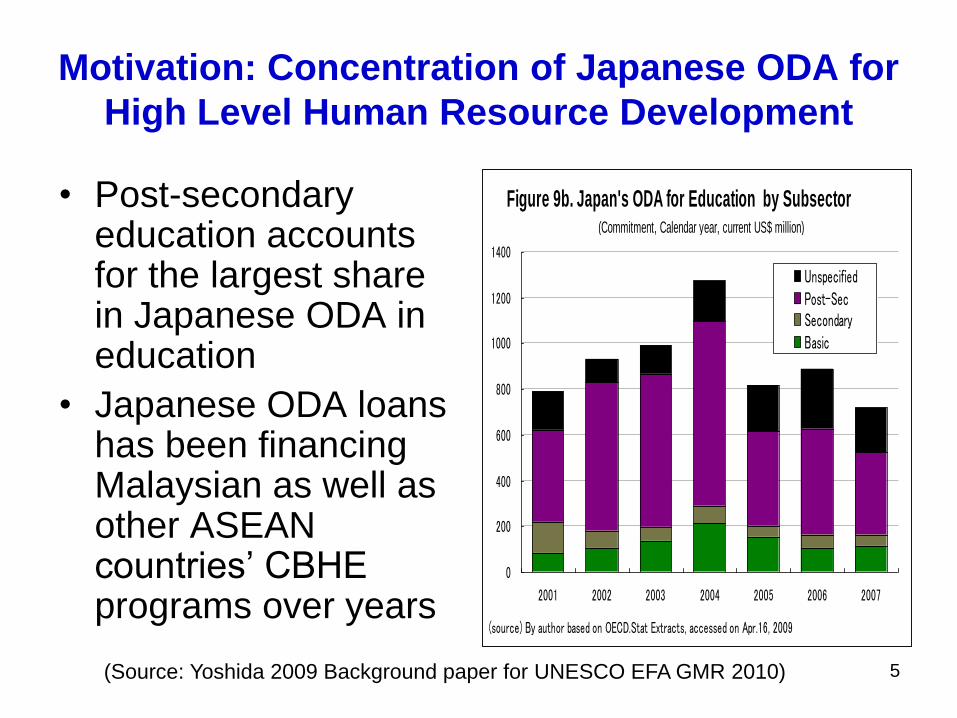
• Post-secondary education accounts for the largest share in Japanese ODA in education
• Japanese ODA loans has been financing Malaysian as well as other ASEAN countries‟ CBHE programs over years
0
200
400
600
800
1000
1200
1400
2001 2002 2003 2004 2005 2006 2007
UnspecifiedPost-SecSecondaryBasic
(source) By author based on OECD.Stat Extracts, accessed on Apr.16, 2009
Figure 9b. Japan's ODA for Education by Subsector (Commitment, Calendar year, current US$ million)
(Source: Yoshida 2009 Background paper for UNESCO EFA GMR 2010)
6
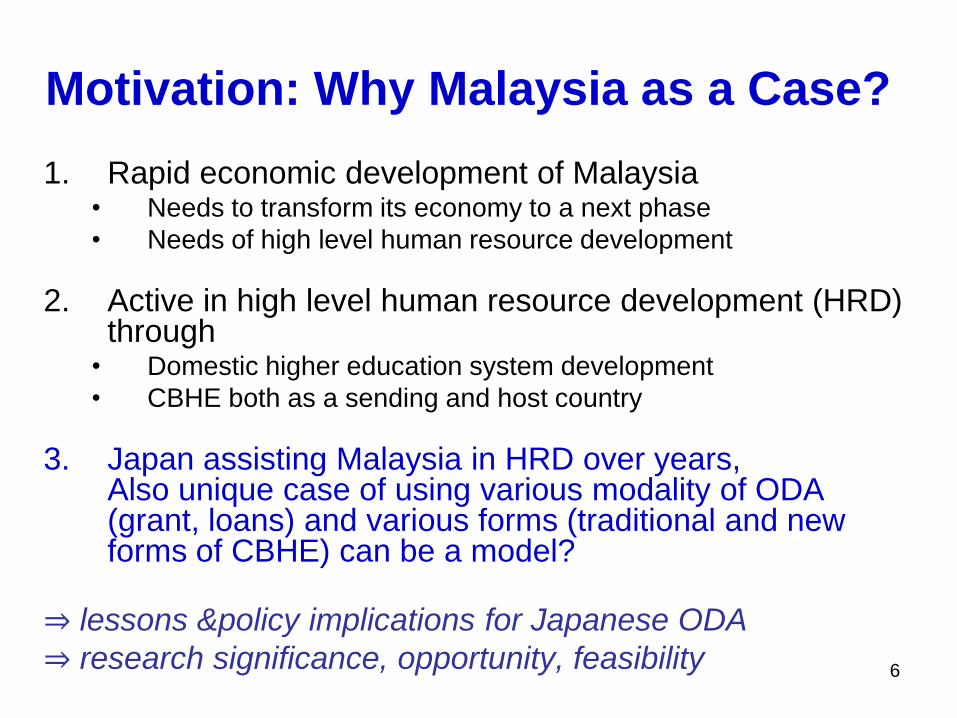
Motivation: Why Malaysia as a Case?
1. Rapid economic development of Malaysia• Needs to transform its economy to a next phase
• Needs of high level human resource development
2. Active in high level human resource development (HRD) through
• Domestic higher education system development
• CBHE both as a sending and host country
3. Japan assisting Malaysia in HRD over years, Also unique case of using various modality of ODA (grant, loans) and various forms (traditional and new forms of CBHE) can be a model?
⇒ lessons &policy implications for Japanese ODA
⇒ research significance, opportunity, feasibility

7
Research Question
• How and to what extent have the cross-border higher education programs, assisted by the Japanese ODA loans, met the HRD needs of the manufacturing industry, under changing economic and educational contexts over time?
Specifically, we focus on initial post graduation activities (i.e., employment, skill relevance, and brain drain) of “HELP” graduates between 1999 and 2008 (studied from mid-1990s) in this paper

8
Definition, Methods, and Data
• Background research
• Our definition of CBHE in this paper
includes conventional study abroad as well
as newer modes, namely twinning
• Descriptive statistical analysis
• Use of project data for Higher Education
Loan Project (HELP) with limited scopes
• Other published and unpublished data

9
Contextual Background
10
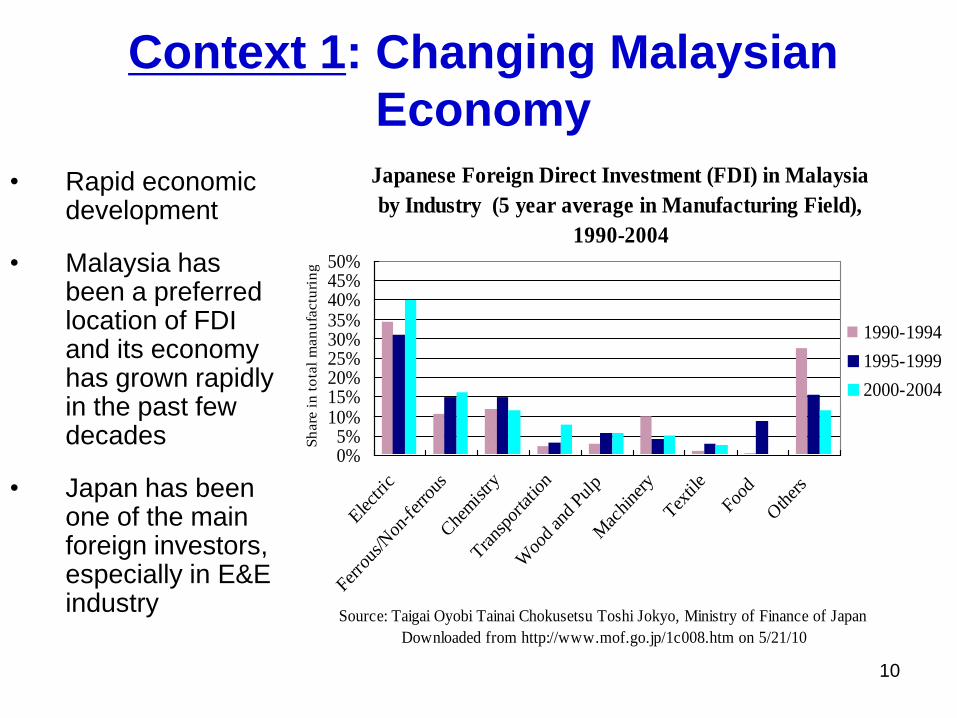
Context 1: Changing Malaysian
Economy
• Rapid economic development
• Malaysia has been a preferred location of FDI and its economy has grown rapidly in the past few decades
• Japan has been one of the main foreign investors, especially in E&E industry
Japanese Foreign Direct Investment (FDI) in Malaysia
by Industry (5 year average in Manufacturing Field),
1990-2004
0%5%
10%15%20%25%30%35%40%45%50%
Elect
ric
Ferro
us/N
on-fer
rous
Che
mistry
Tra
nspo
rtatio
n
Woo
d an
d Pul
p
Mac
hine
ry
Tex
tile
Food
Oth
ers
Sh
are
in
to
tal
man
ufa
ctu
rin
g
1990-1994
1995-1999
2000-2004
Source: Taigai Oyobi Tainai Chokusetsu Toshi Jokyo, Ministry of Finance of Japan
Downloaded from http://www.mof.go.jp/1c008.htm on 5/21/10

11
Context 1: Changing Malaysian
Economy
• but…
– Other countries (e.g. Thailand) caught up
around 2000, losing comparative advantage as
a low cost production site
• Need to transform its economy to high
value-added one
– Relatively small pool of high-quality workforce
for Malaysia to become a preferred location for
higher value-added industries (PICS 2003)
12
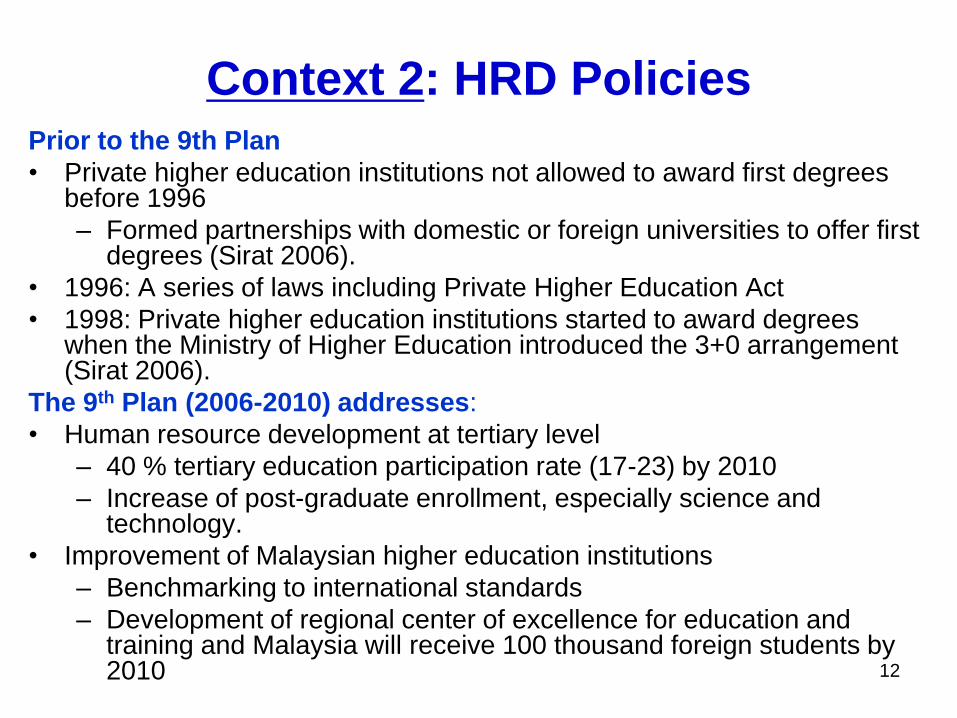
Prior to the 9th Plan
• Private higher education institutions not allowed to award first degrees before 1996
– Formed partnerships with domestic or foreign universities to offer first degrees (Sirat 2006).
• 1996: A series of laws including Private Higher Education Act
• 1998: Private higher education institutions started to award degrees when the Ministry of Higher Education introduced the 3+0 arrangement (Sirat 2006).
The 9th Plan (2006-2010) addresses:
• Human resource development at tertiary level
– 40 % tertiary education participation rate (17-23) by 2010
– Increase of post-graduate enrollment, especially science and technology.
• Improvement of Malaysian higher education institutions
– Benchmarking to international standards
– Development of regional center of excellence for education and training and Malaysia will receive 100 thousand foreign students by 2010
Context 2: HRD Policies
13
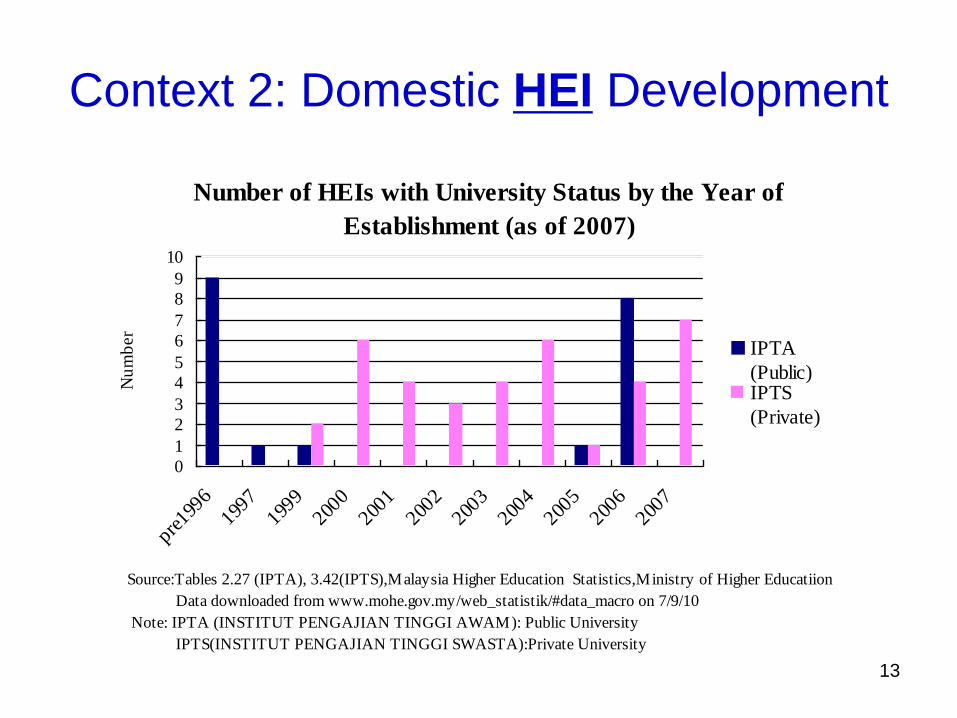
Context 2: Domestic HEI Development
Number of HEIs with University Status by the Year of
Establishment (as of 2007)
0
1
2
3
4
5
6
7
8
9
10
pre199
6199
7199
9200
0200
1200
2200
3200
4200
5200
6200
7
Nu
mb
er
IPTA
(Public)IPTS
(Private)
Source:Tables 2.27 (IPTA), 3.42(IPTS),Malaysia Higher Education Statistics,Ministry of Higher Educatiion
Data downloaded from www.mohe.gov.my/web_statistik/#data_macro on 7/9/10
Note: IPTA (INSTITUT PENGAJIAN TINGGI AWAM): Public University
IPTS(INSTITUT PENGAJIAN TINGGI SWASTA):Private University

14
Context 2: Rapid Increase of
Enrollment at Domestic Universities
• The number of engineering students enrolled at undergraduate level almost doubled from38,649 in 2002 to 75,170 in 2009
• But stayed around 15 to 17% of the total number of undergraduates since the latter also nearly doubled during this period
Share of Students Enrolled in Technology-related
Fields to Total Enrollment at Each Level (%)
2002-2009
0%
5%
10%
15%
20%
25%
2002
2003
2004
2005
2006
2007
2008
2009
Under-gradaute
Master
PhD
Note : Technology-related fields include engineering, architecture, manufacturing etc.
For details, see individual table in original source.
Source: Authors' calculation using the data from Malaysia Higher Education Statistics,
Ministry of Higher Educatiion
Data downloaded from www.mohe.gov.my/web_statistik/#data_macro on

15
Context 2: Increasing Number of Graduates
with Domestic University Degrees
Number of Higher Education Graduates in Malaysia by Level, 2002-2008
-
20,000
40,000
60,000
80,000
100,000
120,000
140,000
160,000
2002 2003 2004 2005 2006 2007 2008
Year
Nu
mb
er
of
gra
du
ate
s
Diploma
Phd
Master
Undergradaute
Source: Malaysia Higher Education Statistics, Ministry of Higher Educatiion. Data downloaded from
www.mohe.gov.my/web_statistik/statistik_pdf_2008_05/data_makro_1-3.pdf on 7/9/10
University
degrees
16
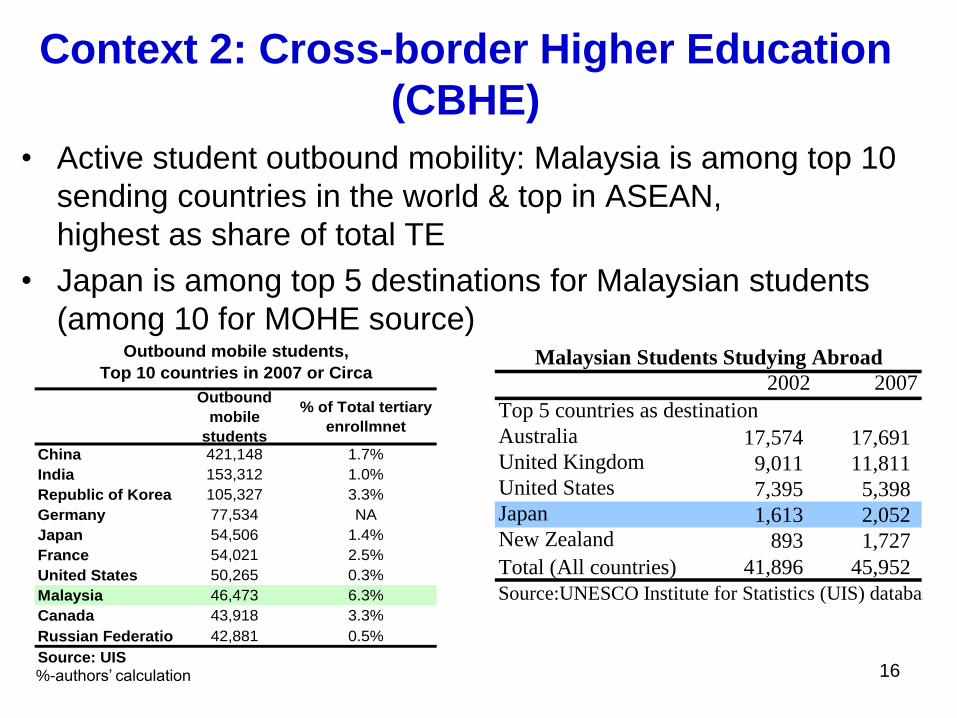
Context 2: Cross-border Higher Education
(CBHE)
• Active student outbound mobility: Malaysia is among top 10
sending countries in the world & top in ASEAN,
highest as share of total TE
• Japan is among top 5 destinations for Malaysian students
(among 10 for MOHE source)
Outbound
mobile
students
% of Total tertiary
enrollmnet
China 421,148 1.7%
India 153,312 1.0%
Republic of Korea 105,327 3.3%
Germany 77,534 NA
Japan 54,506 1.4%
France 54,021 2.5%
United States 50,265 0.3%
Malaysia 46,473 6.3%
Canada 43,918 3.3%
Russian Federation 42,881 0.5%
Source: UIS
Outbound mobile students,
Top 10 countries in 2007 or Circa2002 2007
Top 5 countries as destination
Australia 17,574 17,691 United Kingdom 9,011 11,811 United States 7,395 5,398 Japan 1,613 2,052 New Zealand 893 1,727
Total (All countries) 41,896 45,952
Source:UNESCO Institute for Statistics (UIS) database
Malaysian Students Studying Abroad
%-authors‟ calculation

17
Context 3: Manufacturing Firms’ Views on
High Level HRD• According PICS 2007 report, some improvement in availability of
professionals, including engineers, but not enough
• More concerns about quality and relevance: “shortage of basic & technical skills of knowledge and skills” as the important constraint for filling vacancies
• Non-negligible percentage of employees with university degree holders are educated overseas
Industry Educated locally
(univ grad)
Educated abroad
(univ grad)
Foreigners
(univ grad)Total
Food processing 85% 14% 2% 100%
Textiles 85% 12% 3% 100%
Garments 88% 13% 0% 100%
Chemicals 81% 14% 5% 100%
Rubber and plastics 93% 5% 2% 100%
Machinery and equipment 69% 17% 14% 100%
E&E 87% 11% 2% 100%
Electric applian 96% 3% 2% 100%
Electronics 79% 19% 2% 100%
Auto parts 75% 18% 6% 100%
Wood and funiture 85% 4% 11% 100%
Total 86% 11% 3% 100%
Source: Authors' calculation using the data from Productivity and Investment Climate Survey(PICS)2
2007, World Bank
Share of Newly Recruited University Degree Holders within Each Industry in 2006
% within Industries

18
Context 3: Manufacturing Firms’ Views
on High Level HRD
Malaysians
Professionals
educated
abroad are
viewed fare
well
Comparison of Performance of Professionals
by Types of Education in 2006
0%
10%
20%
30%
40%
50%
60%
70%
Overseas educated vs.
locally educated
Overseas educated vs.
foreigners
Lower
Higher
No
differenc
e
Note: This table only shows the firms with at least one engineer.
Source: Authors' calculation using the data from Productivity and Investment
Climate Survey (PICS)2 2007, World Bank
Those in
Japan, too?
19
Malaysian Students in Japan

20
Malaysian Students in Japan
They are mainly publicly-funded students
2000-2004 2005-2009
Japanese government scholarships 14% 11%
Malaysian government scholarships 50% 56%
Private funds 36% 33%Total 100% 100%
Malaysian Students in Japan by Fund Type, 2000-2009
All Levels of Post-Secondary Education (excluding short-term exchange students)
Note:
The data collection methods between 2000 and 2004 are not unified, thus, the figures are indicative figures. The
data for 2005-2009 exclude short-term exchange students
All levels means post graduate, undergraduate, and other tertiary education such as junior colleges
Source: 2005-2009: Japan Student Service Organization (JASSO). Unpublished data (received on May 26, 2010)
2000-2004: Tsujii (2006) "Ryugakusei Fea to Mareshia no Kyoiku Seido."

21
Malaysian Students in JapanThey Are Mostly in Engineering Fields
All Subjects Engineering Share of Engineering
Ave.2005-09 Ave.2005-09 Ave.2005-09
Malsyaian students
Japanese government scholarships 67 41 62%
Share in all foreign students 5% 9%
Foreign government funds 916 860 94%
Share in all foreign students 81% 87%
Private funds 348 114 33%
Share in all foreign students 1% 3%
Total 1331 1015 76%
Share in all foreign students 2% 17%
All foreign students
Japanese government scholarships 1309 465 36%
Foreign government funds 1171 1013 87%
Private funds 51313 4469 9%
Total 53792 5946 11%
Note: No. of students include both new entrants and existing students
Number of Malaysian Undergradaute Students in Japan and the Share in All Foreign
Undergradaute Students by Fund Type and Subject, 2005-2009
Source: Japan Student Services Organization(JASSO) unpublished data received 5/26/10 and 8/23/10 revised version

22
Japanese ODA Loans Cover a Large
Proportion of Publicly-funded Malaysian
Students in Japan (1999-2008)Share of Japanese ODA Loan Students(HELP and LEP) to Total Undergraduate Students Funded by Malaysian
Government Scholarships in Japan (excluding short-term exchange students), 2005-2008
Types of Funds All Subjects Engineering
2005 2006 2007200
8
Ave.
2005-082005 2006 2007 2008
Ave.
2005-08
Share of HELP to Malaysian
government scholarships (%)21% 12% 6% 8% 12% 23% 13% 7% 8% 13%
Share of LEP to Malaysian
government scholarships (%)50% 33% 17% 0% 24% 55% 35% 18% 0% 26%
Share of HELP&LEP to Malaysian
government scholarships (%)71% 45% 24% 8% 36% 78% 48% 25% 8% 39%
Note: HELP=Higher Education Loan Projects, LEP= Look East Programs
LEP data includes only those years that are covered by yen loan for the purpose of this study.Malaysia government has been sending students to
Japanese universities through LEP since 1982.
Source: Authors' calculation using the data from Japan Student Services Organization(JASSO) unpublished data. Received on May 26, 2010
and YPM and JICA internal data

23
Findings of Labor Market
Outcomes of CBHE Program
between Malaysia and Japan
24
Main Findings of Labor Market
Outcomes of HELP Graduates
• Overall, employment rate of HELP graduates
(„99-08)
Remain relatively stable over years, except for 1 year
At similar level as domestic public universities
(technology fields)
• HELP graduates tend to be employed in the
sector for which the programs intended to
produce human resources
• HELP graduates tend to remain less in Japan
after study (Bachelor) than other foreign students
(04-07)

25
Main Findings 1: Post Graduation
Activities
• 80% of graduates either employed or in further study
• Employment rate of HELP graduates remain stable between 1999 and 2008, except one year
Post Graduation Activities of HELP 1&2 Graduates
(Undergraduate-level), 1999-2008
0%
10%
20%
30%
40%
50%
60%
70%
80%
90%
100%
1999
2000
2001
2002
2003
2004
2005
2006
2007
2008
Year
Others (%)
Job search upon returning
to Malaysia (%)
Further study (%)
Employed (%)
Note: Others mostly include graduates without information or graduates with limited
information such as returting to Malaysia after graduation or undecided.
Source: Authors' calculation using the data from YPM Yayasan Pelanjaran Mara (YPM)

26
Main Findings 1: Post Graduation Activities
Malaysian Domestic Public University
Graduates in Technical Fields
Year of
graduation
Local Government
related
NGOs Others Total**
MNC total
Number Share in total
2006 1,718 331 7.2% 2,731 0 0 137 26 4,612
2007 2,196 450 7.1% 3,884 0 0 182 58 6,320
2008 2,182 461 6.8% 3,901 416 77 184 45 6,805
2009 1,156 242 4.4% 3,818 262 33 180 52 5,501
Total 7,252 1,484 6.4% 14,334 678 110 683 181 23,238
Note:* The dinifition whether "Japanese firms" or not is created by authors using the data on firm names and address
** The number of participating universities and the responding rates differ by year.
Source: Authors' calculation using the data from "Malaysian Ministry of Higher Education's Graduate Tracer Study."
Employment of Malaysian Domestic Public University Graduates
(Undergradaute-level, Technical Fields) by Type of Employers, 2006-2009
Multi-National Cooperation (MNC) Independent
of which, affliated with Japan*
• Availability of tracer study data
• Similarity of student characteristics with HELP (Bumiputra)
27
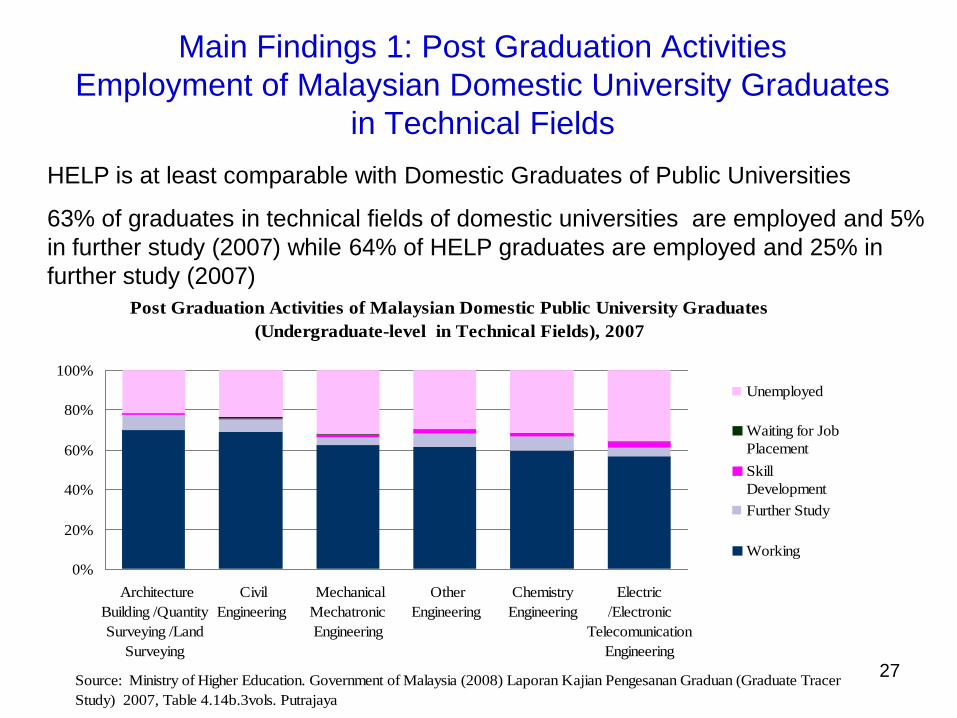
Main Findings 1: Post Graduation Activities
Employment of Malaysian Domestic University Graduates
in Technical Fields
HELP is at least comparable with Domestic Graduates of Public Universities
63% of graduates in technical fields of domestic universities are employed and 5%
in further study (2007) while 64% of HELP graduates are employed and 25% in
further study (2007)
Post Graduation Activities of Malaysian Domestic Public University Graduates
(Undergraduate-level in Technical Fields), 2007
0%
20%
40%
60%
80%
100%
Architecture
Building /Quantity
Surveying /Land
Surveying
Civil
Engineering
Mechanical
Mechatronic
Engineering
Other
Engineering
Chemistry
Engineering
Electric
/Electronic
Telecomunication
Engineering
Unemployed
Waiting for Job
Placement
Skill
Development
Further Study
Working
Source: Ministry of Higher Education. Government of Malaysia (2008) Laporan Kajian Pengesanan Graduan (Graduate Tracer
Study) 2007, Table 4.14b.3vols. Putrajaya
28
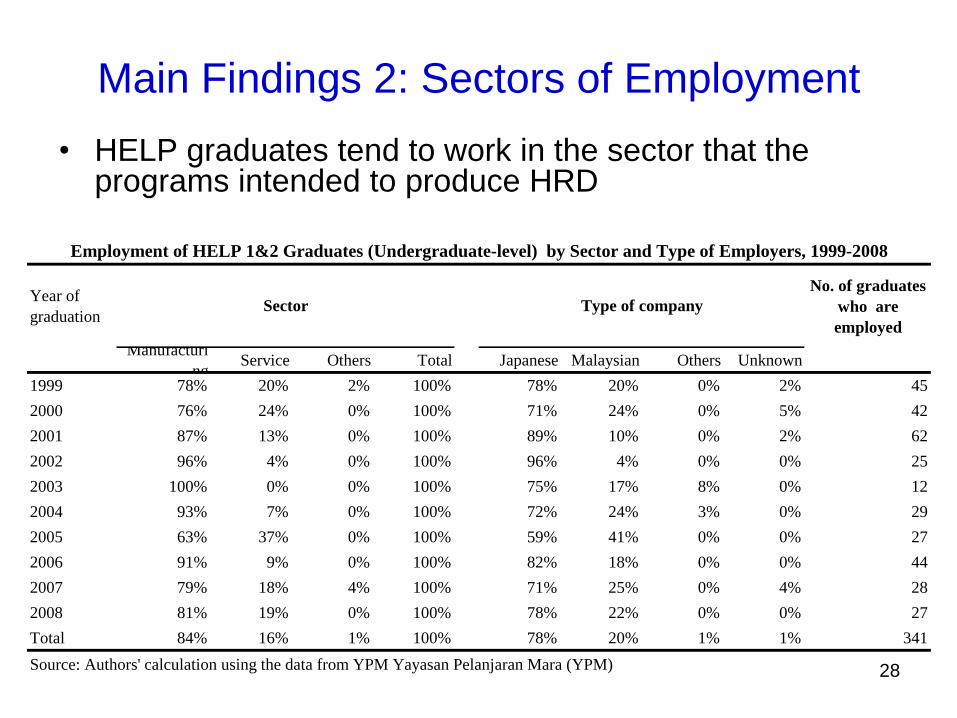
Main Findings 2: Sectors of Employment
• HELP graduates tend to work in the sector that the programs intended to produce HRD
Year of
graduation
No. of graduates
who are
employed
Manufacturi
ngService Others Total Japanese Malaysian Others Unknown
1999 78% 20% 2% 100% 78% 20% 0% 2% 45
2000 76% 24% 0% 100% 71% 24% 0% 5% 42
2001 87% 13% 0% 100% 89% 10% 0% 2% 62
2002 96% 4% 0% 100% 96% 4% 0% 0% 25
2003 100% 0% 0% 100% 75% 17% 8% 0% 12
2004 93% 7% 0% 100% 72% 24% 3% 0% 29
2005 63% 37% 0% 100% 59% 41% 0% 0% 27
2006 91% 9% 0% 100% 82% 18% 0% 0% 44
2007 79% 18% 4% 100% 71% 25% 0% 4% 28
2008 81% 19% 0% 100% 78% 22% 0% 0% 27
Total 84% 16% 1% 100% 78% 20% 1% 1% 341
Source: Authors' calculation using the data from YPM Yayasan Pelanjaran Mara (YPM)
Employment of HELP 1&2 Graduates (Undergraduate-level) by Sector and Type of Employers, 1999-2008
Sector Type of company

29
Main Findings 3: Location of Employment
(HELP Graduates)
Graduation yearNo. of graduates
who are employed
Malaysia Japan Unknown
1999 91% 9% 0% 45
2000 90% 7% 2% 42
2001 94% 5% 2% 62
2002 88% 12% 0% 25
2003 83% 17% 0% 12
2004 97% 3% 0% 29
2005 96% 4% 0% 27
2006 70% 30% 0% 44
2007 57% 43% 0% 28
2008 67% 33% 0% 27
Total 84% 15% 1% 341
Location
Employment of HELP 1&2 Graduates (Undergraduate-level)
by Location of Employers (% ), 1999-2008
Note: 35% of firms located in Japan have Malaysia branch.
Source: Authors' calculation using the data from YPM Yayasan Pelanjaran Mara (YPM)
• Before 2006, a vast majority of HELP graduates went
home after completing their degrees

30
Main Findings 3: Location of Employment
(Foreign Graduates with Japanese
University Degrees)
• Other foreign graduates in Japan tend to stay in
Japan than HELP graduates
Total graduates Employed Further study Others Home countries Japan Other locations
2005 7,253 39.5% 38.6% 21.9% 20.9% 78.4% 0.8%
2006 10,177 41.8% 32.0% 26.1% 16.4% 83.2% 0.4%
2007 10,870 44.5% 30.6% 24.8% 13.6% 86.2% 0.2%
2008 11,215 46.1% 27.5% 26.4% 12.4% 87.2% 0.4%
Total 39,515 43.3% 31.6% 25.1% 15.2% 84.4% 0.4%
Location of Employment for the Employed
Source:Gaikokujin Ryugakusei Shinro Jokyo Gakui Jokyo Chosa Kekka (Table1. Gaikokujin Ryugakusei Shinro Jokyo Chosa
Kekka), Japan Student Services Organization(JASSO),Various years
Post Graduation Activities of Japanese University Graduates (Undergraduate-level), 2005-2008
Post Graduation Activities

31
Main Findings 3: Location of Employment
External Factors May Affect Graduate‟s Decision to Stay or
Go Home

32
Changing roles of Japanese
ODA
33
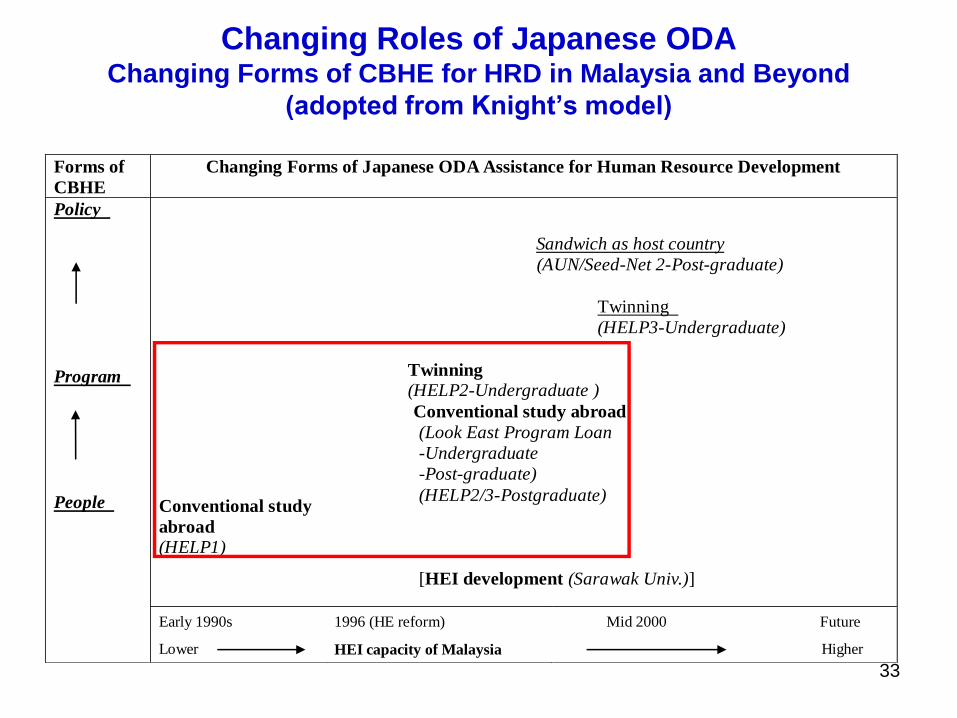
Changing Roles of Japanese ODAChanging Forms of CBHE for HRD in Malaysia and Beyond
(adopted from Knight’s model)
Forms of
CBHE
Changing Forms of Japanese ODA Assistance for Human Resource Development
Policy
Program
People
Conventional study
abroad
(HELP1)
Sandwich as host country
(AUN/Seed-Net 2-Post-graduate)
Twinning
(HELP3-Undergraduate)
Twinning
(HELP2-Undergraduate )
Conventional study abroad
(Look East Program Loan
-Undergraduate
-Post-graduate)
(HELP2/3-Postgraduate)
[HEI development (Sarawak Univ.)]
Early 1990s
Lower
1996 (HE reform)
HEI capacity of Malaysia
Mid 2000 Future
Higher

34
Thank you very much!

35
Malaysian Students in Japan (details)
2000 2001 2002 2003 2004 2005 2006 2007 2008 2009 2000-2004 2005-2009
Japanese government
scholarships276 265 253 276 255 245 245 254 230 209 14% 11%
Malaysian government
scholarships1,033 923 965 1,007 841 1,106 1,149 1,195 1,300 1,395 50% 56%
Private funds 547 615 667 719 914 737 738 672 704 749 36% 33%
Total 1,856 1,803 1,885 2,002 2,010 2,088 2,132 2,121 2,234 2,353 100% 100%
Note: The data collection methods between 2000 and 2004 are not unified, thus, the figures are indicative figures 2005-2009 data
excludes short- term exchange students
Source: 2005-2009: Japan Student Service Organization (JASSO). Unpublished data (received on May 26, 2010)
2000-2004: Tsujii (2006) "Ryugakusei Fea to Mareshia no Kyoiku Seido."
Note: The methods of data collection has changed since 2004, thus, not compatible with the data before 2004. All levels means post
graduate, undergraduate, and other tertiary education such as junior colleges
Number of Malaysian Students in Japan by Fund Type, 2000-2009
All Levels of Post-Secondary Education (excluding short-term exchange students)

36
Malaysian students in Japan (details)
Share of
Engineering
2005 2006 2007 2008 2009Ave.
2005-092005 2006 2007 2008 2009
Ave.
2005-09
Ave.
2005-09
Japanese government
scholarships78 72 72 62 49 67 48 47 47 37 28 41 62%
Share in all foreign
students6% 5% 5% 5% 4% 5% 11% 10% 10% 8% 6% 9%
Foreign government
funds859 892 883 949 998 916 779 845 834 892 949 860 94%
Share in all foreign
students93% 91% 90% 69% 63% 81% 98% 96% 96% 75% 71% 87%
Private funds 404 364 315 309 348 348 142 120 105 103 98 114 33%
Share in all foreign
students1% 1% 1% 1% 1% 1% 3% 3% 2% 2% 2% 3%
Total 1,341 1,328 1,270 1,320 1,395 1,331 969 1,012 986 1,032 1,075 1,015 76%
Share in all foreign
students2% 2% 2% 3% 3% 2% 17% 17% 18% 17% 17% 17%
Japanese government
scholarships1,345 1,317 1,316 1,293 1,272 1,309 450 458 461 478 476 465 36%
Foreign government
funds925 985 976 1,385 1,582 1,171 795 877 867 1,185 1,341 1,013 87%
Private funds 53,165 51,733 50,097 49,650 51,918 51,313 4,347 4,625 4,264 4,521 4,586 4,469 9%
Total 55,435 54,035 52,389 52,328 54,772 53,792 5,592 5,960 5,592 6,184 6,403 5,946 11%
Note: No. of students include both new entrants and existing students
Source: Japan Student Services Organization(JASSO) unpublished data received 5/26/10 and 8/23/10 revised version
Engineering
All foreign students
Number of Malaysian Undergradaute Students in Japan and the Share in All Foreign Undergradaute Students
by Fund Type and Subject, 2005-2009
Malsyaian students
All Subjects

37
Changing Roles of Japanese ODA
Next Step
① Graduates from HELP I and II [all identifiable],
mainly on their employment & educational
experiences
② Graduates from Look East Program for graduates
2004-06 (Bachelor of engineering) as a
comparator group for HELP II
③ Firms as actual and potential employers of HELP
and university graduates in engineering fields
(mainly Japanese affiliated firms in Malaysia)

38
Changing Roles of Japanese ODA
Changing Modality of CBHE Programs between Malaysia
and Japan
Profiles of Programs
HELP I HELP II Look East
Types of program Conventional
Study
Abroad
Twinning
(1+3)*
Conventional
Study
Abroad
Subject areas
Engineering Engineering
Mainly
engineerin
g
Expected years of
graduation1999-2003 2004-2008 2004-2008
No. of students 310 280 885+4
Entry requirement for
the programsTop level
(SPM)
Top level
(SPM)
Top level
(SPM)
* 1 year in Malaysia and 3 years in Japan
39
Changing Roles of Japanese ODA
Next Step
• Differences in the above CBHE programs (i.e. modality) are not considered in the analysis of this paper due to the limited scope of the data
• In the subsequent paper, we will explore the question whether there are any differences in labor market outcomes between different modalities of CBHE programs
• Newly collected data for this research will be used for the next paper

40
Key Literature
CBHE• Jane Knight. 2008. Higher Education in Turmoil. Sense Publishers
• OECD and World Bank. 2007. Cross-border Tertiary Education: A Way
Towards Capacity Development. Washington, DC
• Sirat, Morshidi. 2006. “Transnational higher education in Malaysia:
Balancing benefits and concerns through regulations”. In Huang, F. (ed.),
Transnational Higher Education in Asia and the Pacific Region. Hiroshima:
Research Institute for Higher Education. Hiroshima University
Twinning (not many empirical research comparing newer forms of CBHE with
more conventional forms?)
• Lewis, Philip E. and Graham R. Pratt. 1996. “Growth in Malaysian Demand
for Business Education: the Australian Response.” Journal of Higher
Education Policy and Management, 18, 2:207-216
Tracer study
Graduate Tracer Study=Laporan Kajian Pengesanan Graduan 2007(Malaysia), Destinations of Leavers from Higher Education (UK), National
Graduate Survey (Canada), Japan Scholarship Program (ADB), Tracer
Study-Joint Japan/World Bank Graduate Scholarship Program (World
Bank)