Embed Size (px)
Citation preview

Work ing PaPer Ser i e Sno 1203 /
CroSS-Border
Banking and the
international
tranSMiSSion
of finanCial
diStreSS during
the CriSiS of
2007-2008
by Alexander Popov and Gregory F. Udell
2010J une

WORKING PAPER SER IESNO 1203 /
In 2010 all ECB publications
feature a motif taken from the
€500 banknote.
CROSS-BORDER BANKING AND
THE INTERNATIONAL TRANSMISSION
OF FINANCIAL DISTRESS DURING
THE CRISIS OF 2007-2008 1
by Alexander Popov 2 and Gregory F. Udell 3
of Economics, the University of Granada,
2 Corresponding author: European Central Bank, Financial Research Division, Kaiserstrasse 29,
D-60311 Frankfurt, Germany, email: [email protected]
3 Indiana University.
This paper can be downloaded without charge from http://www.ecb.europa.eu or from the Social Science Research Network electronic library at http://ssrn.com/abstract_id=1610193.
NOTE: This Working Paper should not be reported as representing the views of the European Central Bank (ECB). The views expressed are those of the authors
and do not necessarily reflect those of the ECB.
2010J une
1 We thank Willem Buiter, Santiago Carbo-Valverde, Nicola Cetorelli, Nandini Gupta, Philip Hartmann, Florian Heider, Sebnem Kalemli-Ozcan,
Steven Ongena, and seminar participants at
the
Marco Pagano, George Pennacchi, Richard Portes, Alberto Pozzolo, Peter Praet, JJorg Rocholl, J
Bank of Finland, Bocconi University, the European Central Bank, the Stockholm School
the University of New South Wales, the ECB-EC conference “Financial integration and stability: The legacy of the crisT is”, the
J13th Conference of the Swiss Society for Financial Market Research, the BCBS/CEPR?JFI workshop / / Systemic risk and
financial regulation - causes and lessons from the crisis , and the Bundesbank CFS workshop.
“
” / Interconnectedness of
financial institutions: Microeconomic evidence, aggregate outcomes, and conseq uences for economic policy
“
”q
for useful discussions, as well as Dana Schaffer and Francesca Fabbri for outstanding research assistance.
,
© European Central Bank, 2010
AddressKaiserstrasse 2960311 Frankfurt am Main, Germany
Postal addressPostfach 16 03 1960066 Frankfurt am Main, Germany
Telephone+49 69 1344 0
Internethttp://www.ecb.europa.eu
Fax+49 69 1344 6000
All rights reserved.
Any reproduction, publication and reprint in the form of a different publication, whether printed or produced electronically, in whole or in part, is permitted only with the explicit written authorisation of the ECB or the authors.
Information on all of the papers published in the ECB Working Paper Series can be found on the ECB’s website, http://www.ecb.europa.eu/pub/scientific/wps/date/html/index.en.html
ISSN 1725-2806 (online)
3ECB
Working Paper Series No 1203
Abstract 4
Non-technical summary 5
1 Introduction 7
2 Data 11
3 Empirical methodology and identifi cation 15
3.1 Main empirical model 15
3.2 Isolating demand shocks 18
4 Empirical results 20
4.1 Bank credit application 20
4.2 Transmission of fi nancial distress 21
4.3 International transmission of fi nancial distress 23
4.4 Transmission of fi nancial distress: foreign vs. domestic 24
4.5 Transmission of fi nancial distress: differential effects 25
5 Conclusion 27
References 29
Tables and fi gures 33
Appendices 46
CONTENTS
2010June

4ECBWorking Paper Series No 1203
Abstract
We study the e�ect of �nancial distress in foreign parent banks on local SME �nanc-ing in 14 central and eastern European countries during the early stages of the 2007-2008�nancial crisis. We use survey data on applicant and non-applicant �rms that enableus to disentangle e�ects driven by shocks to the banking system from recession-drivendemand shocks that may vary across lenders. We �nd strong evidence that credit tight-ened in the relatively early stages of the crises caused by the following types of bank�nancial distress: 1) low equity ratio; 2) low Tier 1 capital ratio; and 3) losses on �nan-cial assets. We also �nd that foreign banks transmit to Main Street a larger portion ofsimilar �nancial shocks than domestic banks. The observed decline in credit is greateramong high-risk �rms and �rms with fewer tangible assets.JEL classi�cation: E44, E51, F34, G21Keywords: credit crunch, �nancial crisis, bank lending channel, business lending
2010June

5ECB
Working Paper Series No 1203
While evidence abounds of a bank-driven “capital crunch” in Europe during the recent financial crisis, the question of the relative contribution of foreign banks vs. domestic banks to this process has been left largely unanswered. In order to fill this void, we combine data on 141 banks from
2005 and 2008 waves of the Business Environment and Enterprise Performance Survey. While we do not have an exact match between a firm and a bank, we can still match firms and banks by locality of incorporation (operation). This allows us to empirically address two questions: 1) Did firms in localities populated by banks affected by the crisis face higher rejection rates than firms in localities populated by “healthy” banks? And 2) Did firms in localities populated by foreign banks affected by the crisis face higher rejection rates than firms in localities populated by similarly affected domestic banks?
Importantly, in answering both questions, one has to account for the contamination of the estimates by demand shifts, as firms’ financial positions also deteriorated during the recession, decreasing their appetite for bank loans. To that end, we employ data on applicant firms to control for the changing risk in the pool of borrowers. More importantly, recent research has shown that only 1/3 of constrained firms are firms that apply and are rejected, while 2/3 of constrained firms are firms that need a loan but are discouraged from applying. Therefore, even using the universe of loan application will not lead to the construction of proper proxies for credit constraints. To address the issue, we use survey data on firms that stayed out of the application process because they were discouraged by high interest rates, high collateral requirements, and high rejection rates, distinguishing them from firms which stayed out of the application process because they were in good financial health.
We find strong evidence for the international transmission of financial distress. In particular, credit tightened in the relatively early stages of the crises as a result of: 1) low equity ratios; 2) low Tier 1 capital ratios; and 3) severe losses on financial assets. For example, we find that in foreign bank-dominated markets if the average Tier 1 capital ratio of the parent of banks present in a particular locality decreases by 2 standard deviations, the probability of firms in that locality being constrained increased by about 55%. The estimates involving equity capital and losses on financial assets are of similar magnitude. Importantly, foreign banks are more likely to shrink their portfolio in response to financial distress, especially low Tier 1 capital ratios, the measure of financial distress that is most consistently associated with credit rationing. Finally, we find that financial distress is transmitted differently across firms and industries, in that firms that are informationally opaque and firms with fewer tangible assets suffer the most.
The evidence in the paper points to several important policy conclusions. First, while the benefits of financial integration are well understood, we have also shown some of the costs associated with it,
2010June
Bankscope with data on about 5,400 firms in 14 Central and Eastern European countries from the

6ECBWorking Paper Series No 1203
especially at times of exceptional downside risk. Second, we find that various measures of bank capital depletion are associated with the transmission of distress, while, for example, exposure to problem loans and the size of the deposit base are not. This finding should inform the debate on the pro-cyclicality of capital requirements.
The financial crisis of 2007-2008 has finally laid to rest the idea that the effect of large financial shocks can be confined locally. In this paper, we demonstrate empirically how the collapse of housing values in the U.S. has affected the financing conditions of, for example, Slovak firms through the deteriorating portfolios of Austrian, Belgian, and Italian banks, loaded with assets backed by those mortgages, and operating in Slovakia through their subsidiaries. While the credit crunch only started in the third quarter of 2007, banks kept tightening credit standards until as late as the fourth quarter of 2008, and most likely long after that. Thus, despite the coordinated actions of various national and supranational authorities, which kept the global financial system from collapsing after the fall of Lehman Brothers in September 2008, it is likely that the losses that the financial system endured have induced, and will continue to induce, a much larger impact on the real sector than the one estimated in this paper. The true extent of the credit crunch will only become clear with the availability of new, more comprehensive data.
2010June

7ECB
Working Paper Series No 1203
1 Introduction
The increasing integration of the European banking industry o�ers the prospect of important
gains in terms of e�ciency and diversi�cation, but it also creates potential risks. One such risk
is associated with the possibility that a shock to a cross-border bank's capital will result in a
reduction in lending to �rms and consumers in an economic environment that is uncorrelated with
the origins of that shock. Given the size and penetration of a number of west European and U.S.
banks in central and eastern Europe, their �nancial distress associated with the meltdown of sub-
prime mortgages and securitized products in 2007 and 2008 and the run on banks by short-term
creditors, counterparties, and borrowers concerned about the liquidity and solvency of the banking
sector1, may have led to such a realization.2 The goal of this paper is to put this hypothesis to the
test.
We investigate one key mechanism through which foreign �nancial distress may have been trans-
mitted to local economic conditions, namely the supply of credit to small and medium enterprises.
SMEs dominate the corporate landscape in central and eastern Europe, comprising up to 99% of
all �rms. Moreover, because of their opacity SMEs may be particularly vulnerable to contractions
in the supply of credit. With this high dependency on the SME sector and with immature capital
markets, banks are by far the main provider of funds for capital investment and expansion. An
important feature of the central and eastern European banking market is its ownership structure.
In particular, foreign ownership in the banking sector has grown so dramatically in the recent
decade, that by 2008 foreign banks controlled around 80% of the assets in the the region's banking
industry. The serious �nancial distress of pan-European banks like Erste, KBC, and Societe Gen-
erale since 2007 stemming from economic circumstances unrelated to their operation in central and
eastern Europe provides a natural experiment to study the channels through which the e�ects of
1See Brunnermeier (2009), Gorton (2009), and Ivashina and Scharfstein (2009) for a timeline of the 2007-2008global �nancial crisis. See Table 1 for developments concerning the �nancial sector in the countries covered by thispaper.
2Signs of the negative e�ects of the global �nancial crisis on business �rms in emerging Europe through the channelof bank lending were seen as early as the Fall of 2007. For instance, in October, the EBRD's chief economist ErikBerglof warned that "the crisis in the West will be a serious one which will last for some time and this means itwill de�nitely have an impact on our countries [...] due to the di�culties and higher costs associated with obtainingcredit" (EBRD (2007)). The euro zone Bank Lending Survey indicated that euro zone banks started tighteninglending standards in Q3:2007 (ECB (2008)).
2010June

8ECBWorking Paper Series No 1203
2010June

9ECB
Working Paper Series No 1203 2010June
10ECBWorking Paper Series No 1203
2010June

11ECB
Working Paper Series No 1203
borrowers declined by 79% by the end of 2008 relative to the peak of the credit boom (Q2:2007).
They analyze the e�ect that the failure of Lehman Brothers had on the syndicated loan market
to identify the reduction in new lending. Jimenez, Ongena, Peydro, and Saurina (2009) use the
universe of bank loans by Spanish banks to identify separately the bank lending channel and the
balance sheet channel, and �nd that they dampen each other: more liquid �rms are less vulnerable
to the contraction of bank lending, and if banks have ample liquidity, the balance sheet channel
partially shuts down. Finally, Puri, Rocholl, and Ste�en (2009) test the e�ect of deteriorating
balance sheets of U.S. banks on lending to business �rms in Germany. While they account for the
shift in �rms' loan demand, they do not account for the variation across lenders in the change in
the composition of �rms that select themselves out of the application process.
The paper proceeds as follows. Section 2 presents the data. Section 3 describes the empirical
methodology and the identi�cation strategy. Section 4 presents the empirical results. Section 5
concludes with the main �ndings of the paper.
2 Data
The data for our analysis come from three main sources. The core �rm level data come from the 2008
version of the Business Environment and Enterprise Performance Survey (BEEPS), administered
jointly by the World Bank and the European Bank for Reconstruction and Development.7 The
survey were carried out between March 10th and April 20th 2008 among 11; 668 �rms from 30
countries in central and eastern Europe and the former Soviet Union. The survey response rate
was 36:9%. Surveyees who declined to participate or were unavailable for interviews accounted for
38:3% of the original target group. Firms that were ineligible due to the necessity to ful�ll industry
quotas and �rm size quotas accounted for the remainder. We narrowed that sample down to the
countries that were most relevant in terms of foreign bank penetration. We complement this data
with analogical information on �rms operating in the same countries and localities derived from
the 2005 version of the survey. The �nal sample consists of 5; 380 �rms in 14 countries: Albania,
Bulgaria, Croatia, Czech Republic, Estonia, Hungary, Latvia, Lithuania, Macedonia, Montenegro,
7The dataset has recently started being used in published work, notably in Brown, Japelli, and Pagano (2009).
2010June
12ECBWorking Paper Series No 1203
2010June

13ECB
Working Paper Series No 1203 2010June

14ECBWorking Paper Series No 1203
2010June

15ECB
Working Paper Series No 1203
example, the Greek banks operate mostly in south-eastern Europe, the Scandinavian banks in the
Baltic countries, and the Austrian banks in central Europe. In addition, there is one domestic
"global" bank, the Hungarian OTP, as well as cross-border penetration by, for example, Parex
Group - Latvia and Snoras Bank - Lithuania.
3 Empirical methodology and identi�cation
3.1 Main empirical model
We start by using the 2008 cross-section data on bank balance sheets, �rm characteristics, and
credit constraints to check for a "credit crunch" by estimating the following basic model:
Yijkl = �1 �Xijkl + �2 � Financejk + �3 �Dk + �4 �Dl + "ijkl (1)
where Yijkl is a dummy variable equal to 1 if �rm i in city j in country k in industry l is
credit constrained in �scal year 2007; Xijkl is a matrix of �rm characteristics; Financejk is the
index of bank health in city j in country k; Dk is a matrix of country dummies; Dl is a matrix of
industry dummies; and "ijkl is an idiosyncratic error term. The �rm level characteristics control for
observable �rm-level heterogeneity. The two sets of dummy variables control for any unobserved
market and industry variation. Essentially, they eliminate the contamination of the estimates by
sectoral and macroeconomic circumstances, like growth opportunities, common to all �rms in the
same industry, or taxes, common to all �rms in a particular country.
Next, we pool the 2005 and 2008 samples in order to be able to conduct a proper pre-post
analysis using both �rms that were observed in 2007/2008 (the beginning of the �nancial crisis)
and in 2004/2005 (the peak of the credit cycle). We estimate the model
Yijkt = �1 �Xijkt + �2 � Financejk + �3 �Dk + �4 �Dt + "ijkl (2)
That procedure is analogical to (1), with the exception that we include year �xed e�ects to
account for the change in common macro factors between 2005 and 2008, and we exclude the
2010June

16ECBWorking Paper Series No 1203
2010June

17ECB
Working Paper Series No 1203 2010June

18ECBWorking Paper Series No 1203
Yijkl = �1 �Xijkl + �2 � Financejk � Zl + �3 �Dl + �4 �Djk + "ijkl (4)
Now the location dummies in Djk absorb the e�ect of locality-speci�c unobservables. The inter-
action term containing the industry-level benchmark for information opacity and asset tangibility
in Zl allows us to measure whether the potential e�ect of the credit crunch is indeed strongest for
those �rms which theory predicts are most vulnerable to credit market shutdowns.
Finally, we need to emphasize that throughout the paper, it is implicitly assumed that the
e�ect of bank �nancial distress is localized and realized predominately by �rms headquartered in
the locality in which the bank has operations. All our empirical speci�cations presume that �rms
borrow from banks located near their address of incorporation, which is identical to the approach
in, for example, Gormley (2009). In general this is expected to hold as banks tend to derive
market power ex ante from geographical proximity (e.g., Degryse and Ongena (2005)). Lending
support to that conjecture, empirical work regarding lending relationships in di�erent countries
has demonstrated that the average distance between �rms and banks is usually very small. For
example, Petersen and Rajan (2002) �nd that the median distance between a �rm and its main
bank in 1993 was only �ve miles (eight kilometers).
3.2 Isolating demand shocks
It is a common challenge of studies that analyze the association between �nancial distress and
bank lending to isolate supply shocks satisfactorily. Namely, it is likely that not only does loan
demand weaken for all �rms in periods when bank capital declines, but the composition of �rms that
demand credit during recessions changes. The solutions to this problem vary in the literature. For
example, Peek and Rosengren (1997) bypass this issue by claiming that the identi�cation problem
is rather weak in the case of the international transmission of �nancial shocks into a recession-free
environment. However, the �nancial crisis of 2007-2008 was followed by one of the deepest global
recessions in postwar history, and this recession was already being predicted as soon as the extent of
the sub-prime mortgage meltdown became apparent in late summer 2007. Hence, as we observe the
2010June

19ECB
Working Paper Series No 1203 2010June

20ECBWorking Paper Series No 1203
4 Empirical results
4.1 Bank credit application
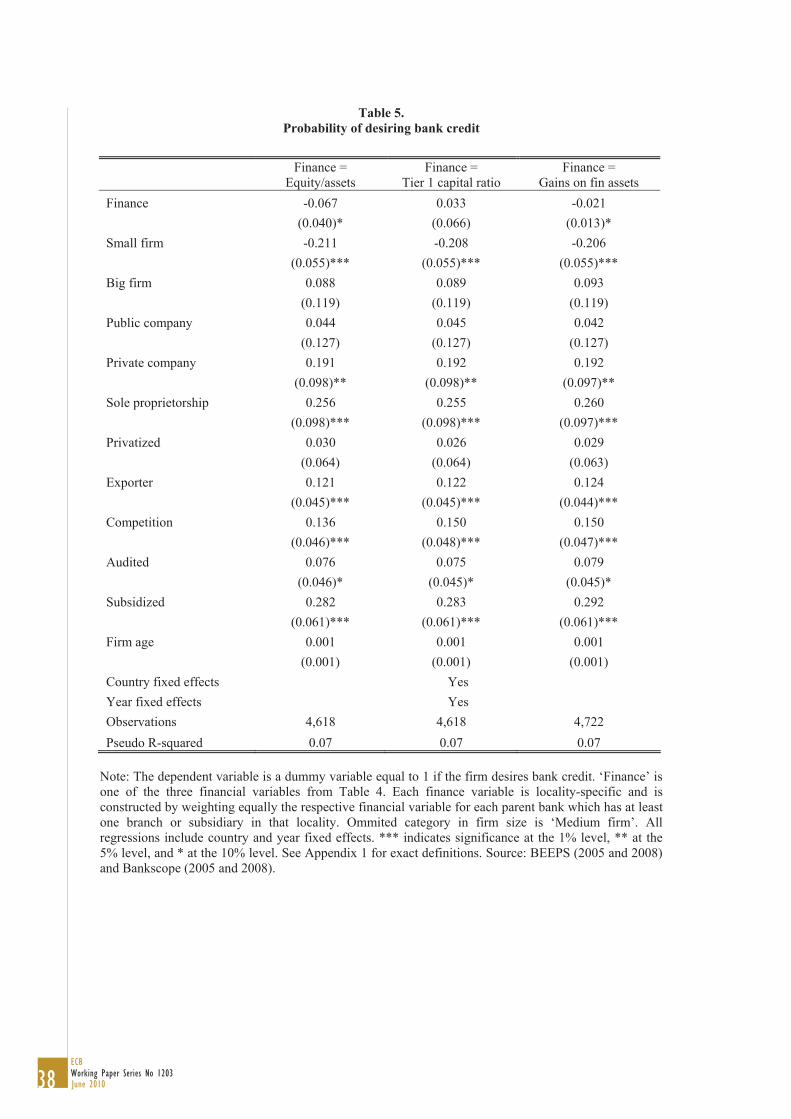
Before considering our main empirical model, we �rst consider the bank credit application tests
that we use for our Heckman selection correction. Table 5 presents the results from the �rst stage
probit regression. The probability of needing bank credit is higher for �rms in more �nancially
distressed localities, in the sense of a low bank equity ratio and large losses on �nancial assets.
This implies that not accounting for that selection would bias the estimates of the transmission of
�nancial distress towards zero. If there is such transmission, then by making sure that it is not
the case that the �nancially strong �rms are selecting themselves out of the application process in
locations where banks are severely distressed, we will be measuring an even stronger e�ect than
when selection is not accounted for.
The need for bank credit increases in the size of the �rm, which is somewhat surprising as one
would expect small �rms to have a higher preference for bank credit. However, in a beginning-of-a-
recession environment it might be that small �rms are better equipped to �nance investment with
cash ows than - potentially - more highly leveraged large �rms. In addition, some of the size e�ects
may be picked by ownership and structural characteristics, as sole properitorships and stand-alone
�rms have a higher demand for loans. The probability of desiring credit is higher for exporters
potentially due to their faster expansion, and for audited �rms, which might simply imply that �rms
choose to be audited (i.e., they are willing to pay for transparency) when they plan to apply for
bank credit.14 It may also be the case that audited �rms have access to �nancial statement lending
which may be a cheaper lending technology. In all, these results justify our selection procedure:
�nancial distress not only (potentially) a�ects business lending, but also the degree to which �rms
demand loans. Not accounting for this will introduce bias into the main estimates.
14The results are broadly consistent with Ongena and Popov (2009) who apply a double selection technique to theBEEPS 2005 sample.
2010June
21ECB
Working Paper Series No 1203
4.2 Transmission of �nancial distress
4.2.1 Nonparametric di�erence-in-di�erences estimates
Table 6 gives a simple non-parametric illustration of the validity of our empirical strategy. We
average the data on rejection rates across localities for the 2008 sample, and for two distinct
criteria: a�ected vs. non-a�ected, and foreign bank-dominated vs. domestic bank-dominated. In
determining which localities are a�ected, we look at Tier 1 capital and de�ne "a�ected" as localities
where the average Tier 1 capital ratio of banks present in that locality is in the bottom half of the
distribution in 2008. Likewise, we de�ne "foreign-bank dominated" as localities where more than
half of the branches of all banks present in that localities are held by subsidiaries or branches of
foreign banks. The table implies that our estimates depend on the di�erential response of foreign
vs. domestic banks to their respective �nancial problems. In particular, average rejection rates
across localities dominated by a�ected vs. non-a�ected banks are statistically identical if the banks
involved are mostly domestic (42:1% vs. 38:9%). However, in localities populated predominantly
by a�ected foreign banks rejection rates were at 38:8%, while in localities populated predominantly
by non-a�ected foreign banks rejection rates were at 23:4%, and this di�erence is signi�cant at the
1% level. This result is the �rst (albeit arguably imperfect) piece of evidence that foreign banks
reacted to their respective �nancial troubles by shrinking their loan portfolios relatively more.
4.2.2 Cross-section results
Table 7 reports the estimates of the e�ect of parent banks' �nancial distress on credit constraints
faced by local �rms for all �rms present in BEEPS 2008. We report the results of the model
in equation (1) alongside the results from the Heckman selection-corrected version of it in order
to contrast the two approaches. The three main explanatory variables of interest are: the ratio
of equity over total assets; the Tier 1 capital ratio; and the gain on �nancial assets over total
assets.15 We �rst report the results from the model in which each bank is given equal weight in
each locality where the bank is present (Panel A). As expected, all else equal, small �rms are more
15The e�ect of other variables, like the ratio of problem loans to total loans, pro�t, money market funding, andgain on available for sales securities was tested, but the results were insigni�cant.
2010June

22ECBWorking Paper Series No 1203
2010June

23ECB
Working Paper Series No 1203
4.2.3 Pooled 2008 and 2005 data
We next repeat the empirical tests on the sample of �rms that are present either in the 2008
and the 2005 BEEPS, employing equation (2) and the Heckman selection-corrected version of it.
This allows us to account for the changing composition of �rms that select themselves out of the
applciation process, going from the peak to the trough of the credit cycle. In other words, the
information on whether �rms do not apply for credit because they don't need it, or because they
are discouraged, and how that changes over time, is used to eliminate the potential contamination
of our estimates by the correlation between credit needs and bank �nancial health. These results
are reported in Table 8.16 In this speci�cation, only Tier 1 capital seems to matter for credit
constraints, once the e�ect of demand for credit is eliminated (Panel A). Similar to the full sample,
once we weigh the probability of �rms doing business with a particular bank by the number of
branches the bank has in the locality of the �rm, the e�ect of low Tier 1 capital ratio on rejection
probabilities becomes larger and signi�cant at the 5% level (Panel B). In addition, lower capital
ratios are also associated with higher rejection probabilities - a two standard deviations decrease
in this variable results in a 24% higher rejection probability. Importantly, we con�rm that not
accounting for selection introduces downward bias. This time, once year e�ects are eliminated, the
sign of the inverse of Mill's ratio is generally negative, implying that unobservables which increase
the probability of needing bank credit, also decrease the probability of being constrained in credit
markets.
4.3 International transmission of �nancial distress
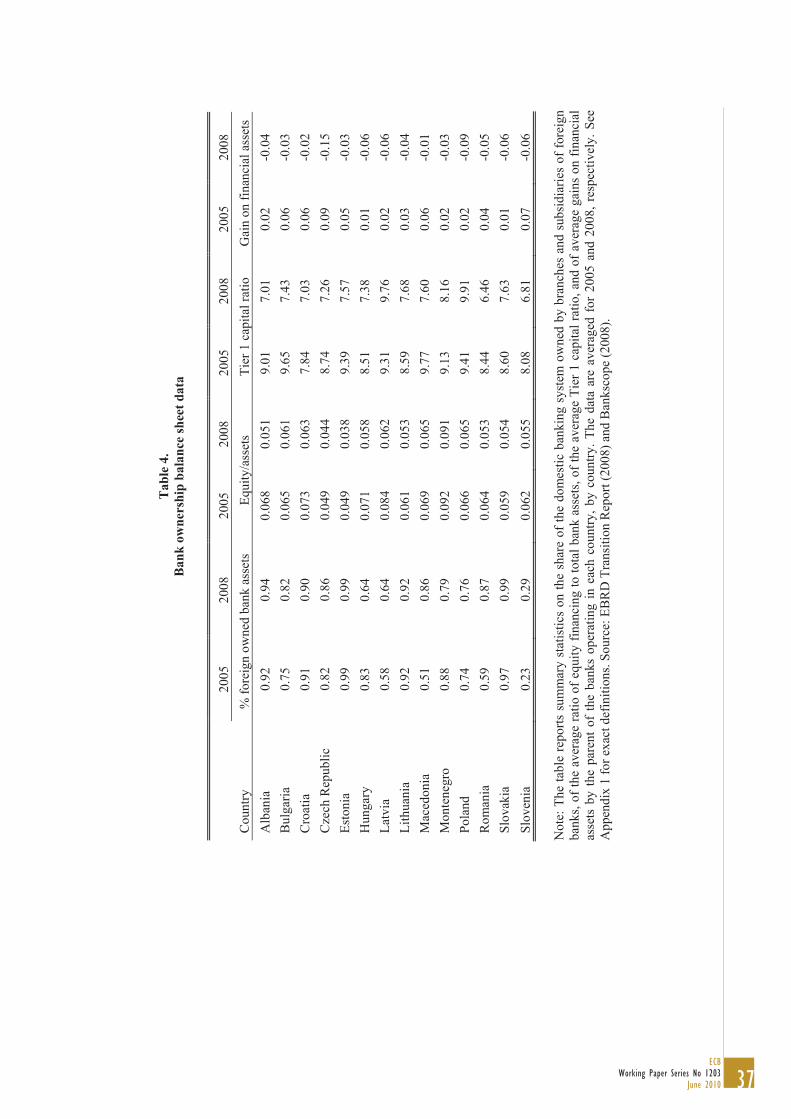
The analysis so far conveys little information on the international transmission of �nancial shocks.
As illustrated by Table 4, still relatively large portions of the banking sector are owned by domestic
banks. That share in 2008 is 21% for the sample, 24% for Poland, 36% for Hungary and Latvia,
and 71% for Slovenia. In essence, so far we have measured the transmission of distress from the
�nancial to the corporate sector regardless of bank ownership. For that reason, we next improve
the model by restricting the sample to localilties where a majority of the assets of present banks
16In all tables to follow, only coe�cients of interest are reported for brevity.
2010June

24ECBWorking Paper Series No 1203
are held by foreign banks. That share is calculated individually for each locality by calculating the
share of retail branches held by subsidiaries and branches of foreign banks present in that particular
locality by the total number of bank branches in that locality. We then look at localities with at
least 2/3 foreign presence.
Table 9 reports the estimates of this empirical exercise on the international transmission of
�nancial distress during the 2007-2008 crisis. It turns out that once we restrict our attention to
foreign bank-dominated localities, all measures of �nancial distress matter (in the pooled sample).
In other words, higher �nancial distress is associated with lower loan granting probability when
�nancial distress is measured as a low equity ratio, a low Tier 1 capital ratio, or high losses on
�nancial assets. Numerically, a 2-standard deviation decrease in equity capital, Tier 1 capital, and
gains on �nancial assets is associated with a 31%, 40%, and 11% increase in rejection rates, respec-
tively. This result holds after the correction for the possibility that weak �rms select themselves
out of the application process in the case of Tier 1 capital and equity capital, and only appears
before accounting for selection in the case of losses on �nancial assets in the pooled sample.
4.4 Transmission of �nancial distress: foreign vs. domestic
An important question that arises given the evidence so far is, do foreign or domestic banks transmit
a larger portion of an identical �nancial shock. Table 10 reports the estimates from the di�erence-
in-di�erences regression where we compare the transmission of �nancial distress by domestic and
foreign banks, that is, equation (3). Tellingly, whenever signi�cant, the interaction e�ect implies
that foreign banks react to the same shock to balance sheets by shrinking their portfolio more than
domestic banks. This is observed in the case of shocks to Tier 1 capital and to equity capital. In
the case of equity capital, we observe the e�ect both in the 2008 and in the pooled samples, while
in the case of Tier 1 capital ratios the e�ect is observed only in the 2008 sub-sample. Consequently,
we can conclude with a fair degree of statistical certainty that foreign banks transmit more of an
identical �nancial shock to their capital than domestic banks.
Apart from a parametric con�rmation of the non-parametric observation in Table 6, this result
o�ers important insights into the role of foreign banks in emerging markets. In general, the e�ect of
2010June

25ECB
Working Paper Series No 1203
foreign banks on business lending in the literature is ambiguous. A large literature has found that
foreign bank presence is associated with higher access to loans (Clarke, Cull, and Peria (2006)),
higher �rm-level sales (Giannetti and Ongena (2009)), and lower loan rates and higher �rm leverage
(Ongena and Popov (2009)). On the other hand, Berger, Klapper, and Udell (2001), Mian (2006),
and Gormley (2009) show that foreign banks tend to �nance only larger, established, and more
pro�table �rms. Our paper complements that picture by providing evidence that while at the peak
of the credit cycle lending by foreign banks is indistinguishable from lending by domestic banks in
terms of acceptance rates, foreign banks do tend to shrink their loan portfolio following a capital
crunch, even after controlling for the degree of �nancial distress.
4.5 Transmission of �nancial distress: di�erential e�ects
Finally, we ask which �rms are most a�ected from the transmission of �nancial distress. There
are clear arguments in the literature on which �rms and industries should be most a�ected by
credit rationing. Information asymmetries and the tangibility of the �rm's assets, for example, are
expected to play an important role in explaining di�erences in credit availability across �rms. High-
risk �rms tend to su�er more from credit rationing, especially when foreign bank lending is involved
(Berger, Klapper, and Udell (2001)). In a global recessionary environment, �rms are expected to
be riskier if, for example, a large share of their pro�ts traditionally comes from exports. Regarding
asset tangibility, Berger, Ofek, and Swary (1996) show that �rms with less tangible assets are more
likely to lose access to credit when banks reprice risk. The rationale is that lenders rely more on
collateral when making lending decision rather than investing in costly screening technologies, and
this problem will tend to be exacerbated in an environment where risk is suddenly priced higher.
We proceed by collecting data on mature U.S. �rms and using it to construct industry bench-
marks for asset tangibility. The rationale for doing so goes back to Rajan and Zingales (1998) who
argued that the actual capital structure of small �rms is a function of �nancial constraints, while
the capital structure of large mature �rms is more representative of the cross-industry variations in
the scale of projects, gestation period, the ratio of hard vs. soft information, the ratio of tangible
vs. intangible assets, follow-up investments, etc. In addition, doing so for large U.S. �rms makes
2010June

26ECBWorking Paper Series No 1203
2010June

27ECB
Working Paper Series No 1203
in industries with low per-worker capital.
5 Conclusion
The �nancial crisis of 2007-2008, which started with the meltdown of sub-prime mortgages and
securitized products and which has been characterized by severe losses and depletion of bank
capital, has spurred unprecedented government recapitalization programs and liquidity injections
by central banks. Since the inception of the crisis, it was feared that this depletion of capital may
result in a severe credit crunch, especially to the corporate sector in countries populated by the
hardest hit banks. Because the European economy is heavily bank-dependent and SMEs - usually
the most vulnerable to a credit crunch due to their opacity - comprise up to 99% of the corporate
sector, it was feared that European �rms would be particularly heavily hit, despite the fact that
the causal factors of the credit crunch originated elsewhere.
In this paper, we investigate empirically the international transmission of �nancial distress,
from the loss in value of �nancial assets to the balance sheets of big European and U.S. banks to
business lending in their foreign markets - speci�cally, central and eastern Europe. Several current
unpublished studies have documented a credit crunch associated with weakened capital positions,
however, ours is the �rst one to simultaneously 1) demonstrate the cross-border dimensions of this
phenomenon, and 2) eliminate the contamination of the lending channel by selection bias resulting
from the changing composition of �rms' demand for credit during recessions and by the failure to
account for discouragement in the proxy for credit constraint.
We �nd that di�erent types of �nancial distress at western European and U.S. parent banks
are associated with a signi�cant impact on business lending to central and eastern European �rms.
While we do not observe an actual match between a bank and a �rm, we match �rms and banks
by the locality of their respective operation. We �nd that as early as late 2007/early 2008, �rms
reported higher credit constraints in localities populated by branches or subsidiaries of banks who
in 2007 and 2008 had low equity capital, low Tier 1 capital ratios, and had recorded severe losses
on �nancial assets. Importantly, we �nd that this e�ect is stronger for localities predominantly
2010June

28ECBWorking Paper Series No 1203
2010June

29ECB
Working Paper Series No 1203
References
[1] Beck, T., Demirg�u�c-Kunt, A., and V. Maksimovic, 2005. Financial and legal constraints to
growth: Does �rm size matter? Journal of Finance 60, 137-177
[2] Berger, A., Klapper, L., and G. Udell, 2001. The ability of banks to lend to informationally
opaque small businesses. Journal of Banking and Finance, 25(12), 2127-2167.
[3] Berger, A., and G. Udell, 1994. Did risk-based capital allocate bank credit and cause a "credit
crunch" in the United States? Journal of Money, Credit, and Banking 26, 585-628.
[4] Berger, P., Ofek, E., and I. Swary, 1996. Investor valuation of the abandonment option. Journal
of Financial Economics, 42(2), 257-287.
[5] Bernanke, B., and C. Lown, 1991. The credit crunch. Brookings Papers on Economics Activity
2, 205-248.
[6] Brown, M., Jappelli, T., and M. Pagano, 2009. Information sharing and credit: Firm-level
evidence from transition countries. Journal of Financial Intermediation 18, 151-172.
[7] Brown, M., Ongena, S., Popov, A., and P. Yesin, 2009. Who needs credit and who gets credit
in emerging Europe? European Central Bank mimeo.
[8] Brunnermeier, M., 2009. Deciphering the liquidity and credit crunch 2007-2008. Journal of
Economic Perspectives 23, 77-100.
[9] Cerqueiro, G., 2009. Bank concentration, credit quality and loan rates. CentER mimeo.
[10] Cetorelli, N., and L. Goldberg, 2008. Banking globalization, monetary transmission, and the
lending channel. NBER Working Paper No. W14101.
[11] Chakravarty, S., and T. Yilmazer, 2009. A multistage model of loans and the role of relation-
ships. Financial Management (forthcoming).
[12] Chava, S., and A. Purnanandam, 2009. The e�ect of a banking crisis on bank-dependent
borrowers. Journal of Financial Economics (forthcoming).
2010June
30ECBWorking Paper Series No 1203
2010June

31ECB
Working Paper Series No 1203 2010June

32ECBWorking Paper Series No 1203
2010June

33ECB
Working Paper Series No 1203
Figu
re 1
. Ori
gin
and
targ
et c
ount
ries
in th
e da
ta
The
map
show
s the
cro
ss-b
orde
rdim
ensi
on o
f the
und
erly
ing
data
. Cou
ntrie
s in
dark
col
or (A
ustri
a, B
elgi
um, D
enm
ark,
Fin
land
, Fra
nce,
Ger
man
y, G
reec
e, N
ethe
rland
s, an
d Sw
eden
) are
thos
e in
whi
ch th
e pa
rent
ban
ks in
the
data
set a
re in
corp
orat
ed. C
ount
ries
in li
ght c
olor
(Alb
ania
, Bul
garia
, Cro
atia
, Cze
ch R
epub
lic, E
ston
ia, H
unga
ry, L
atvi
a,
Lith
iani
a, M
aced
onia
, Mon
tene
gro,
Pol
and,
Rom
ania
, Slo
vaki
a, a
nd S
love
nia)
are
thos
e w
here
the
firm
s in
the
data
set a
re in
corp
orat
ed.
2010June

34ECBWorking Paper Series No 1203
Table 1. Timeline of events during the 2007-2008 crisis concerning banks and countries in the data
Timeline Country Event
Aug. 2007 – Aug. 2008 Germany Bayerische LandesBank is one of three LandesBanken
to receive capital injections, credit lines, and asset-backed securities loss guranatees.
Sept. 2008 France The government recapitalizes Dexia. U.S. Emergency Economic Stabilization Act, containing a
commitment for up to 700 bln. USD to purchase bad assets from banks.
Italy The parliament approves a law granting the government the possibility to recapitalize distressed banks.
Netherlands The government announces that public fudns can be used for bank recapitalization, of which 20 bln. EUR are immediately available.
France The Government approves 320 bln. EUR to provide loans to banks and other financial firms, including a 40 billion euro recapitalization plan.
Sweden The government announces that it will guarantee up to 1.5 trillion SEK in new debt issues, and a 15 billion SEK stabilization fund.
Oct. 2008
Germany The government announces a 400 billion EUR plan to guarantee bank financing, including a 70 billion EUR recapitalization fund.
US The Treasury subscribes 20 bln. USD preferred shares at Citigroup and ring-fences its troubled assets worth up to 300 billion USD.
Italy The government approves a law to inject capital into sound banks.
Nov. 2008
Germany Bayerische LandesBank receives 7 billion EUR of capital from the Bavarian state.
Dec. 2008 Germany The Finance ministry provides Bayerische LandesBank with 15 billion EUR .
Germany The Finance ministry provides Commerzank with a 8.2 billion EUR loan, and buys 1.8 trillion EUR worth of equity.
France The government implements a second round of bank recapitalization for 10.5 billion EUR.
Jan. 2009
Netherlands The Dutch government provides a cack-up facility to back up the risks of ING’s securitized mortgage portfolio worth 35.1 billion EUR.
2010June

35ECB
Working Paper Series No 1203
Tab
le 2
. Su
mm
ary
stat
istic
s: F
irm
cha
ract
eris
tics
coun
try
# fir
ms
Smal
l firm
B
ig fi
rm
Publ
ic
com
pany
Pr
ivat
eco
mpa
ny
Sole
prop
rieto
rshi
p Pr
ivat
ized
Su
bsid
ized
Ex
porte
r C
ompe
titio
n A
udite
d A
lban
ia
133
0.90
0.
04
0.00
0.
33
0.63
0.
08
0.03
0.
27
0.65
0.
63
Bul
garia
45
7 0.
84
0.02
0.
05
0.47
0.
43
0.14
0.
07
0.25
0.
63
0.43
C
roat
ia
208
0.81
0.
04
0.06
0.
51
0.38
0.
23
0.20
0.
36
0.85
0.
47
Cze
ch R
epub
lic
316
0.72
0.
03
0.07
0.
61
0.29
0.
09
0.22
0.
46
0.82
0.
54
Esto
nia
402
0.78
0.
03
0.16
0.
62
0.19
0.
10
0.16
0.
34
0.75
0.
80
Hun
gary
40
6 0.
73
0.06
0.
01
0.65
0.
31
0.15
0.
22
0.34
0.
87
0.75
La
tvia
38
5 0.
70
0.04
0.
02
0.69
0.
23
0.14
0.
12
0.34
0.
80
0.70
Li
thua
nia
386
0.75
0.
03
0.02
0.
71
0.22
0.
15
0.17
0.
37
0.78
0.
39
Mac
edon
ia
477
0.80
0.
03
0.06
0.
56
0.23
0.
17
0.04
0.
41
0.85
0.
59
Mon
tene
gro
134
0.85
0.
01
0.04
0.
27
0.69
0.
12
0.03
0.
15
0.68
0.
53
Pola
nd
621
0.79
0.
02
0.05
0.
24
0.67
0.
12
0.13
0.
28
0.81
0.
37
Rom
ania
70
9 0.
70
0.03
0.
06
0.66
0.
22
0.14
0.
10
0.18
0.
71
0.38
Sl
ovak
ia
349
0.70
0.
06
0.05
0.
18
0.64
0.
13
0.15
0.
34
0.79
0.
57
Slov
enia
39
7 0.
71
0.05
0.
10
0.62
0.
25
0.23
0.
24
0.61
0.
80
0.44
To
tal
5,38
0 0.
76
0.03
0.
06
0.53
0.
36
0.14
0.
14
0.33
0.
77
0.53
Not
e: T
he ta
ble
pres
ents
sta
tistic
s on
the
num
ber
of f
irms
and
the
shar
e of
firm
s by
siz
e, o
wne
rshi
p, p
rivat
izat
ion
hist
ory,
sub
sidi
es f
rom
cen
tral a
nd lo
cal g
over
nmen
ts,
acce
ss to
fore
ign
prod
uct m
arke
ts, d
egre
e of
com
petit
ion,
and
acc
ess
to in
tern
atio
nal a
uditi
ng, b
y co
untry
. See
App
endi
x 1
for e
xact
def
initi
ons.
Sour
ce: B
EEPS
(200
8 an
d 20
05).
2010June

36ECBWorking Paper Series No 1203
Table 3. Summary statistics: Credit demand and access
2008 2005 Country Need loan Constrained Need loan Constrained Albania 0.29 0.47 0.74 0.46 Bulgaria 0.58 0.52 0.65 0.45 Croatia 0.59 0.42 0.77 0.19 Czech Republic 0.53 0.32 0.78 0.38 Estonia 0.54 0.27 0.58 0.47 Hungary 0.41 0.31 0.88 0.42 Latvia 0.59 0.48 0.74 0.58 Lithuania 0.60 0.23 0.70 0.61 Macedonia 0.59 0.50 0.77 0.82 Montenegro 0.78 0.48 0.80 0.45 Poland 0.53 0.41 0.66 0.59 Romania 0.61 0.33 0.75 0.47 Slovakia 0.53 0.40 0.60 0.38 Slovenia 0.64 0.15 0.77 0.12 Total 0.57 0.37 0.72 0.46
Note: The table presents statistics on the share of firms who declare bank loans desirable, and the share of firms out of those that need a lon that have been formally rejected or did not apply because they found access to finance too difficult, by country. The data are for the fiscal year 2007 (until March 31, 2008). See Appendix 1 for exact definitions. Source: BEEPS (2008 and 2005).
2010June
37ECB
Working Paper Series No 1203
Tab
le 4
. B
ank
owne
rshi
p ba
lanc
e sh
eet d
ata
20
05
2008
20
05
2008
20
05
2008
20
05
2008
C
ount
ry
% fo
reig
n ow
ned
bank
ass
ets
Equi
ty/a
sset
s Ti
er 1
cap
ital r
atio
G
ain
on fi
nanc
ial a
sset
s A
lban
ia
0.92
0.
94
0.06
8 0.
051
9.01
7.
01
0.02
-0
.04
Bul
garia
0.
75
0.82
0.
065
0.06
1 9.
65
7.43
0.
06
-0.0
3 C
roat
ia
0.91
0.
90
0.07
3 0.
063
7.84
7.
03
0.06
-0
.02
Cze
ch R
epub
lic
0.82
0.
86
0.04
9 0.
044
8.74
7.
26
0.09
-0
.15
Esto
nia
0.99
0.
99
0.04
9 0.
038
9.39
7.
57
0.05
-0
.03
Hun
gary
0.
83
0.64
0.
071
0.05
8 8.
51
7.38
0.
01
-0.0
6 La
tvia
0.
58
0.64
0.
084
0.06
2 9.
31
9.76
0.
02
-0.0
6 Li
thua
nia
0.92
0.
92
0.06
1 0.
053
8.59
7.
68
0.03
-0
.04
Mac
edon
ia
0.51
0.
86
0.06
9 0.
065
9.77
7.
60
0.06
-0
.01
Mon
tene
gro
0.88
0.
79
0.09
2 0.
091
9.13
8.
16
0.02
-0
.03
Pola
nd
0.74
0.
76
0.06
6 0.
065
9.41
9.
91
0.02
-0
.09
Rom
ania
0.
59
0.87
0.
064
0.05
3 8.
44
6.46
0.
04
-0.0
5 Sl
ovak
ia
0.97
0.
99
0.05
9 0.
054
8.60
7.
63
0.01
-0
.06
Slov
enia
0.
23
0.29
0.
062
0.05
5 8.
08
6.81
0.
07
-0.0
6
Not
e: T
he ta
ble
repo
rts s
umm
ary
stat
istic
s on
the
shar
e of
the
dom
estic
ban
king
sys
tem
ow
ned
by b
ranc
hes
and
subs
idia
ries
of fo
reig
n ba
nks,
of th
e av
erag
e ra
tio o
f equ
ity fi
nanc
ing
to to
tal b
ank
asse
ts, o
f th e
ave
rage
Tie
r 1 c
apita
l rat
io, a
nd o
f ave
rage
gai
ns o
n fin
anci
al
asse
ts b
y th
e pa
rent
of
the
bank
s op
erat
ing
in e
ach
coun
try, b
y co
untry
. The
dat
a ar
e av
erag
ed f
or 2
005
and
2008
, res
pect
ivel
y. S
ee
App
endi
x 1
for e
xact
def
initi
ons.
Sour
ce: E
BR
D T
r ans
ition
Rep
ort (
2008
) and
Ban
ksco
pe (2
008)
.
2010June
38ECBWorking Paper Series No 1203
Table 5. Probability of desiring bank credit
Finance =
Equity/assets Finance =
Tier 1 capital ratio Finance =
Gains on fin assets Finance -0.067 0.033 -0.021 (0.040)* (0.066) (0.013)* Small firm -0.211 -0.208 -0.206 (0.055)*** (0.055)*** (0.055)*** Big firm 0.088 0.089 0.093 (0.119) (0.119) (0.119) Public company 0.044 0.045 0.042 (0.127) (0.127) (0.127) Private company 0.191 0.192 0.192 (0.098)** (0.098)** (0.097)** Sole proprietorship 0.256 0.255 0.260 (0.098)*** (0.098)*** (0.097)*** Privatized 0.030 0.026 0.029 (0.064) (0.064) (0.063) Exporter 0.121 0.122 0.124 (0.045)*** (0.045)*** (0.044)*** Competition 0.136 0.150 0.150 (0.046)*** (0.048)*** (0.047)*** Audited 0.076 0.075 0.079 (0.046)* (0.045)* (0.045)* Subsidized 0.282 0.283 0.292 (0.061)*** (0.061)*** (0.061)*** Firm age 0.001 0.001 0.001 (0.001) (0.001) (0.001) Country fixed effects Yes Year fixed effects Yes Observations 4,618 4,618 4,722 Pseudo R-squared 0.07 0.07 0.07
Note: The dependent variable is a dummy variable equal to 1 if the firm desires bank credit. ‘Finance’ is one of the three financial variables from Table 4. Each finance variable is locality-specific and is constructed by weighting equally the respective financial variable for each parent bank which has at least one branch or subsidiary in that locality. Ommited category in firm size is ‘Medium firm’. All regressions include country and year fixed effects. *** indicates significance at the 1% level, ** at the 5% level, and * at the 10% level. See Appendix 1 for exact definitions. Source: BEEPS (2005 and 2008) and Bankscope (2005 and 2008).
2010June

39ECB
Working Paper Series No 1203
Table 6. Affected vs. non-affected banks: rejection rates
Foreign-dominated Domestic-dominated Affected localities 0.388 0.421 Non-affected localities 0.234 0.389 Difference 0.154*** 0.032
Note: The table reports a difference-in-differences estimate from a Mann-Whitney two-sided test. ‘Affected’ are localities where the average Tier 1 capital ratio of banks present in the bottom half of its distribution. For each locality, the variable is constructed by weighting by number of branches for each parent bank which has at least one branch or subsidiary in that locality. ‘Foreign banks-dominated’ are localities where more than half of the branches are held by subsidiaries or branches of foreign banks. The statistical significance of the difference-in-differences estimate from a two-sided Mann-Whitney test can be found next to the difference, where *** indicates significance at the 1% level. Source: BEEPS (2008) and Bankscope (2008).
2010June

40ECBWorking Paper Series No 1203
Table 7. Probability of being constrained (2008 sample)
Panel A. Equally weighted bank data for each locality
Finance = Equity/assets Finance =
Tier 1 capital Finance =
Gains on fin assets Finance -0.001 -0.003 -0.174 -0.173 0.036 0.064 (0.003) (0.004) (0.105)* (0.110)* (0.039) (0.043) Small firm 0.393 0.543 0.394 0.556 0.395 0.543 (0.084)*** (0.105)*** (0.084)*** (0.110)*** (0.084)*** (0.109)*** Big firm -0.184 -0.141 -0.186 -0.138 -0.187 -0.132 (0.185) (0.194) (0.186) (0.195) (0.186) (0.194) Public company 0.322 0.315 0.323 0.314 0.324 -0.312 (0.216) (0.226) (0.216) (0.226) (0.216) (0.226) Private company -0.104 -0.127 -0.106 -0.129 -0.102 -0.118 (0.171) (0.183) (0.171) (0.183) (0.171) (0.182) Sole proprietorship -0.065 -0.017 0.064 -0.015 0.065 -0.001 (0.177) (0.196) (0.177) (0.196) (0.177) (0.195) Privatized -0.031 -0.034 -0.029 -0.030 -0.031 -0.024 (0.099) (0.107) (0.099) (0.107) (0.099) (0.106) Exporter -0.211 -0.254 -0.214 -0.254 -0.211 -0.242 (0.075)*** (0.089)*** (0.075)*** (0.087)*** (0.075)*** (0.086)*** Audited -0.285 -0.349 -0.283 -0.350 -0.285 -0.343 (0.070)*** (0.084)*** (0.070)*** (0.085)** (0.070)*** (0.085)*** Subsidized -0.072 -0.270 -0.074 -0.268 -0.073 -0.243 (0.090) (0.143)* (0.090) (0.142)* (0.090) (0.140)* Inverse Mill's ratio 0.294 0.294 0.247 (0.211) (0.209) (0.202) Country fixed effects Yes Industry fixed effects Yes Observations 2,082 2,005 2,082 2,005 2,082 2,005 Pseudo R-squared 0.12 0.13 0.12 0.13 0.12 0.13
Note: The dependent variable is a dummy variable equal to 1 if the firm is credit constrained. ‘Finance’ is one of the three financial variables from Table 4. Each finance variable is locality-specific and is constructed by weighting equally the respective financial variable for each parent bank which has at least one branch or subsidiary in that locality. Ommited category in firm size is ‘Medium firm’. ‘Inverse Mill’s ratio’ is the inverse of Mills’ratio from the probit model in Table 5 for each respective financial variable. Omitted categories from the probit equation in Table 5 are ‘Competition’ and ‘Firm age’. The analysis is performed on all firms present in the 2008 survey. *** indicates significance at the 1% level, ** at the 5% level, and * at the 10% level. See Appendix 1 for exact definitions. Source: BEEPS (2008) and Bankscope (2008).
2010June

41ECB
Working Paper Series No 1203
Table 7. Probability of being constrained (2008 sample)
Panel B. Branch-weighted bank data for each locality
Finance = Equity/assets Finance =
Tier 1 capital Finance =
Gains on fin assets Finance -0.127 -0.147 -0.164 -0.165 0.103 0.259 (0.519) (0.534) (0.081)** (0.082)** (0.407) (0.418) Small firm 0.354 0.501 0.350 0.492 0.355 0.571 (0.081)*** (0.102)*** (0.081)*** (0.104)*** (0.084)*** (0.110)*** Big firm -0.093 -0.001 -0.189 -0.143 -0.188 -0.142 (0.181) (0.189) (0.186) (0.195) (0.186) (0.194) Public company 0.268 0.243 0.318 0.303 0.325 0.317 (0.202) (0.211) (0.216) (0.227) (0.216) (0.226) Private company -0.131 -0.193 -0.104 -0.133 -0.101 -0.133 (0.158) (0.169) (0.171) (0.183) (0.171) (0.182) Sole proprietorship -0.022 -0.099 0.074 0.008 0.067 -0.027 (0.164) (0.186) (0.177) (0.196) (0.177) (0.196) Privatized -0.066 -0.094 -0.021 -0.020 -0.028 -0.035 (0.095) (0.103) (0.096) (0.107) (0.099) (0.107) Exporter -0.207 -0.261 -0.207 -0.259 -0.208 -0.259 (0.073)*** (0.085)*** (0.075)*** (0.085)*** (0.075)*** (0.086)*** Audited -0.275 -0.308 -0.249 -0.309 -0.247 -0.362 (0.067)*** (0.080)*** (0.070)*** (0.080)*** (0.070)*** (0.085)*** Subsidized -0.123 -0.323 -0.124 -0.317 -0.073 -0.290 (0.087) (0.141)** (0.090) (0.141)** (0.090) (0.141)** Inverse Mill's ratio 0.311 0.298 0.340 (0.214) (0.215) (0.207)* Country fixed effects Yes Industry fixed effects Yes Observations 2,082 2,013 2,082 2,013 2,082 2,005 Pseudo R-squared 0.11 0.10 0.11 0.10 0.11 0.13
Note: The dependent variable is a dummy variable equal to 1 if the firm is credit constrained. ‘Finance’ is one of the three financial variables from Table 4. Each finance variable is locality-specific and is constructed by weighting by number of branches the respective financial variable for each parent bank which has at least one branch or subsidiary in that locality. Omitted category in firm size is ‘Medium firm’. ‘Inverse Mill’s ratio’ is the inverse of Mills’ratio from the probit model in Table 5 for each respective financial variable. Omitted categories from the probit equation in Table 5 are ‘Competition’ and ‘Firm age’. The analysis is performed on all firms present in the 2008 survey. *** indicates significance at the 1% level, ** at the 5% level, and * at the 10% level. See Appendix 1 for exact definitions. Source: BEEPS (2008) and Bankscope (2008).
2010June

42ECBWorking Paper Series No 1203
Table 8. Probability of being constrained (pooled 2005 and 2008 samples)
Panel A. Equally weighted bank data for each locality
Finance = Equity/assets Finance =
Tier 1 capital Finance =
Gains on fin assets Finance 0.059 0.060 -0.162 -0.159 0.009 -0.001 (0.074) (0.074) (0.128) (0.129)* (0.022) (0.022) Inverse Mill's ratio -0.154 -0.154 -0.150 (0.094)* (0.093)* (0.076)** Country fixed effects Yes Year fixed effects Yes Observations 2,373 2,344 2,373 2,344 2,422 2,393 Pseudo R-squared 0.14 0.15 0.14 0.15 0.14 0.14
Panel B. Branch-weighted bank data for each locality
Finance = Equity/assets Finance =
Tier 1 capital Finance =
Gains on fin assets Finance -0.073 -0.071 -0.089 -0.096 -0.008 -0.007 (0.043)* (0.043)* (0.052)* (0.050)** (0.009) (0.009) Inverse Mill's ratio -0.156 -0.122 -0.091 (0.094)* (0.080)* (0.050)* Country fixed effects Yes Year fixed effects Yes Observations 2,373 2,344 2,373 2,344 2,422 2,393 Pseudo R-squared 0.14 0.15 0.14 0.15 0.14 0.14
Note: The dependent variable is a dummy variable equal to 1 if the firm is credit constrained. ‘Finance’ is one of the three financial variables from Table 4. Each finance variable is locality-specific and is constructed by weighting equally (Panel A) or by number of branches (Panel B) the respective financial variable for each parent bank which has at least one branch or subsidiary in that locality. ‘Inverse Mill’s ratio’ is the inverse of Mills’ratio from the probit model in Table 5 for each respective financial variable. The regressions also include the rest of the independent variables from table 6. Omitted categories from the probit equation in Table 5 are ‘Competition’ and ‘Firm age’. The analysis is performed on all firms present in the 2008 survey. *** indicates significance at the 1% level, ** at the 5% level, and * at the 10% level. See Appendix 1 for exact definitions. Source: BEEPS (2005 and 2008) and Bankscope (2005 and 2008).
2010June

43ECB
Working Paper Series No 1203
Table 9. Probability of being constrained, foreign banks dominated localities
Panel A. 2008 sample
Finance = Equity/assets Finance =
Tier 1 capital Finance =
Gains on fin assets Finance -0.017 -0.052 -0.386 -0.349 0.168 -0.789 (0.010)* (0.087) (0.212)* (0.169)** (0.148) (0.787) Inverse Mill's ratio 0.662 0.616 0.635 0.563 0.646 0.648 (0.359)* (0.358)* (0.359)* (0.361) (0.361)* (0.356)* Country fixed effects Yes Industry fixed effects Yes Observations 1,178 1,178 1,178 1,178 1,178 1,178 Pseudo R-squared 0.11 0.11 0.09 0.11 0.09 0.11
Panel B. Pooled 2008 and 2005 samples
Finance = Equity/assets Finance =
Tier 1 capital Finance =
Gains on fin assets Finance -0.367 -0.153 -0.829 -0.576 -0.369 -0.004 (0.295) (0.075)** (0.503)* (0.300)** (0.222)* (0.015) Inverse Mill's ratio -0.022 -0.083 -0.017 -0.021 -0.078 -0.034 (0.117) (0.091) (0.116) (0.117) (0.088) (0.055) Country fixed effects Yes Year fixed effects Yes Observations 1,372 1,372 1,372 1,372 1,403 1,403 Pseudo R-squared 0.16 0.16 0.16 0.16 0.16 0.16
Note: The dependent variable is a dummy variable equal to 1 if the firm is credit constrained. ‘Finance’ is one of the three financial variables from Table 4. Each finance variable is locality-specific and is constructed by weighting equally (Columns 1, 3, and 5) or by number of branches (Columns 2, 4, and 6) the respective financial variable for each parent bank which has at least one branch or subsidiary in that locality. ‘Inverse Mill’s ratio’ is the inverse of Mills’ratio from the probit model in Table 5 for each respective financial variable. The regressions also include the rest of the independent variables from table 6. The analysis is performed on all firms present in the 2008 survey (Panel A) and on the pooled sample of firms present either in the 2008 or the 2005 survey (Panel B). Only localities where more than 67% of banking assets are owned by branches or subsidiaries of foreign banks are included in the regressions. *** indicates significance at the 1% level, ** at the 5% level, and * at the 10% level. See Appendix 1 for exact definitions. Source: BEEPS (2005 and 2008) and Bankscope (2005 and 2008).
2010June

44ECBWorking Paper Series No 1203
Table 10. Probability of being constrained: foreign vs. domestic banks
Panel A. 2008 sample
Finance = Equity/assets Finance =
Tier 1 capital Finance =
Gains on fin assets Finance*Foreign -0.011 -0.182 -0.451 -0.222 0.147 -0.549 (0.007)* (0.095)** (0.191)** (0.125)* (0.092) (0.758) Finance -0.009 0.109 0.173 -0.056 0.088 -0.641 (0.006) (0.089) (0.066)*** (0.120) (0.069) (0.707) Foreign 0.339 1.388 3.574 2.752 0.353 0.079 (0.190)* (0.654)** (1.439)*** (1.795) (0.201) (0.253) Inverse Mill's ratio 0.515 0.482 0.510 0.444 0.503 0.508 (0.310) (0.309) (0.313) (0.310) (0.312) (0.308) Country fixed effects Yes Industry fixed effects Yes Observations 1,428 1,428 1,428 1,428 1,428 1,428 Pseudo R-squared 0.11 0.11 0.11 0.11 0.11 0.11
Panel B. Pooled 2008 and 2005 samples
Finance = Equity/assets Finance =
Tier 1 capital Finance =
Gains on fin assets Finance*Foreign -0.570 -0.210 0.345 -0.098 -0.121 -0.016 (0.346)* (0.074)*** (0.240) (0.116) (0.359) (0.017) Finance 0.043 0.053 -0.167 -0.002 -0.038 -0.001 (0.093) (0.061) (0.166) (0.095) (0.031) (0.019) Foreign 0.467 1.511 0.204 1.018 0.455 0.142 (0.196)** (0.504)*** (0.203) (1.022) (0.297)* (0.178) Inverse Mill's ratio -0.598 -0.437 -0.597 -0.430 -0.476 -0.253 (0.088)*** (0.074)*** (0.088)*** (0.074)*** (0.075)*** (0.052)*** Country fixed effects Yes Year fixed effects Yes Observations 1,650 1,650 1,650 1,650 1,696 1,710 Pseudo R-squared 0.12 0.12 0.12 0.12 0.12 0.13
Note: The dependent variable is a dummy variable equal to 1 if the firm is credit constrained. ‘Finance’ is one of the three financial variables from Table 4. Each finance variable is locality-specific and is constructed by weighting equally (Columns 1, 3, and 5) or by number of branches (Columns 2, 4, and 6) the respective financial variable for each parent bank which has at least one branch or subsidiary in that locality. ‘Foreign’ is a dummy equal to 1 if the share of branches in each locality owned by branches or subsidiaries of foreign banks is more than 2/3, and to 0 if it is less than 1/3. ‘Inverse Mill’s ratio’ is the inverse of Mills’ratio from the probit model in Table 5 for each respective financial variable. The regressions also include the rest of the independent variables from table 6. The analysis is performed on all firms present in the 2008 survey (Columns (2), (4), and (6)) and on the subsample of firms present in both the 2008 and the 2005 survey (Columns (3), (5), and (7)). All regressions include country and industry fixed effects (Panel A), and country, industry, and year fixed efefcts (Panel B). *** indicates significance at the 1% level, ** at the 5% level, and * at the 10% level. See Appendix 1 for exact definitions. Source: BEEPS (2005 and 2008) and Bankscope (2005 and 2008).
2010June

45ECB
Working Paper Series No 1203
Table 11. Probability of being constrained: differential effects
Panel A. Equally weighted bank data for each locality
Tier 1 capital * Exporter -0.027 (0.049) Tier 1 capital * R&D intensity -0.123 (0.063)** Tier 1 capital * capital intensity -0.026 (0.044) City fixed effects Yes Industry fixed effects Yes Observations 1,226 1,226 1,226 Pseudo R-squared 0.15 0.16 0.16
Panel B. Branch-weighted bank data for each locality
Tier 1 capital * Exporter -0.155 (0.078)** Tier 1 capital * R&D intensity -0.182 (0.098)* Tier 1 capital * capital intensity -0.186 (0.080)** City fixed effects Yes Industry fixed effects Yes Observations 1,226 1,226 1,226 Pseudo R-squared 0.16 0.16 0.16
Note: The dependent variable is a dummy variable equal to 1 if the firm is credit constrained. ‘Finance’ is one of the three financial variables from Table 4. Each finance variable is locality-specific and is constructed by weighting equally (Panel A) or by number of branches (Panel B) the respective financial variable for each parent bank which has at least one branch or subsidiary in that locality. ‘R&D intensity’ is a dummy equal to 1 if the industry is in the top 50% of the distribution of industry medians of the ratio of research and development expenses to sales for mature Compustat firms over the period 1990-2000. ‘Capital intensity’ is a dummy equal to 1 if the industry is in the bottom 50% of the distribution of industry medians of capital usage per worker with external funds for mature Compustat firms over the period 1990-2000. ‘Inverse Mill’s ratio’ is the inverse of Mills’ratio from the probit model in Table 5 for each respective financial variable. The regressions also include the rest of the independent variables from table 6. The analysis is performed on all firms present in the 2008 survey. All regressions include city and industry fixed effects. *** indicates significance at the 1% level, ** at the 5% level, and * at the 10% level. See Appendix 1 for exact definitions. Source: BEEPS (2008) and Bankscope (2008).
2010June

46ECBWorking Paper Series No 1203
A
ppen
dix
1. V
aria
bles
– D
efin
ition
s an
d so
urce
s
Var
iabl
e N
ame
Def
initi
on
Sour
ce
Firm
cha
ract
eris
tics
Smal
l firm
D
umm
y=1
if fir
m h
as le
ss th
an 9
9 em
ploy
ees
BEE
PS 2
005
& 2
008
Med
ium
firm
D
umm
y=1
if th
e fir
m h
as b
etw
ee 1
00 a
nd 4
99 e
mpl
oyee
s B
EEPS
200
5 &
200
8
Big
firm
D
umm
y=1
if fir
m h
as m
ore
than
500
em
ploy
ees
BEE
PS 2
005
& 2
008
Size
D
umm
y=1
if th
e fir
m h
as m
ore
than
10
empl
oyee
s B
EEPS
200
5 &
200
8
Age
D
umm
y=1
if m
ore
than
10
year
s hav
e el
apse
d si
nce
the
firm
’s in
corp
orat
ion
BEE
PS 2
005
& 2
008
Publ
ic c
ompa
ny
Dum
my=
1 if
firm
is a
shar
ehol
der c
ompa
ny /
shar
es tr
aded
in th
e st
ock
mar
ket
BEE
PS 2
005
& 2
008
Priv
ate
com
pany
D
umm
y=1
if fir
m is
a sh
areh
olde
r com
pany
/ sh
ares
trad
ed p
rivat
ely
if at
all
BEE
PS 2
005
& 2
008
Sole
pro
prie
tors
hip
Dum
my=
1 if
firm
is a
sole
pro
prie
tors
hip
BEE
PS 2
005
& 2
008
Priv
atiz
ed
Dum
my=
1 if
the
firm
wen
t fro
m st
ate
to p
rivat
e ow
ners
hip
in th
e pa
st
BEE
PS 2
005
& 2
008
Subs
idiz
ed
Dum
my=
1 if
the
firm
has
rece
ived
stat
e su
bsid
ized
in th
e pa
st y
ear
BEE
PS 2
005
& 2
008
Expo
rter
Dum
my=
1 if
firm
’s p
rodu
ctio
n is
at l
east
par
tially
exp
orte
d B
EEPS
200
5 &
200
8
Com
petit
ion
Dum
my=
1 if
pres
sure
from
com
petit
iors
is “
fairl
y” o
r “ve
ry”
seve
re
BEE
PS 2
005
& 2
008
Aud
ited
Dum
my=
1 if
the
firm
has
its f
inan
cial
acc
ount
s ext
erna
lly a
udite
d B
EEPS
200
5 &
200
8
Firm
age
N
umbe
r of y
ears
sinc
e th
e fir
m’s
yea
r of i
ncor
pora
tion
BEE
PS 2
005
& 2
008
Stan
d-al
one
firm
D
umm
y=1
if th
e fir
m is
stan
d-al
one,
0 if
it is
par
t of l
arge
r est
ablis
hmen
t B
EEPS
200
5 &
200
8
2010June
47ECB
Working Paper Series No 1203
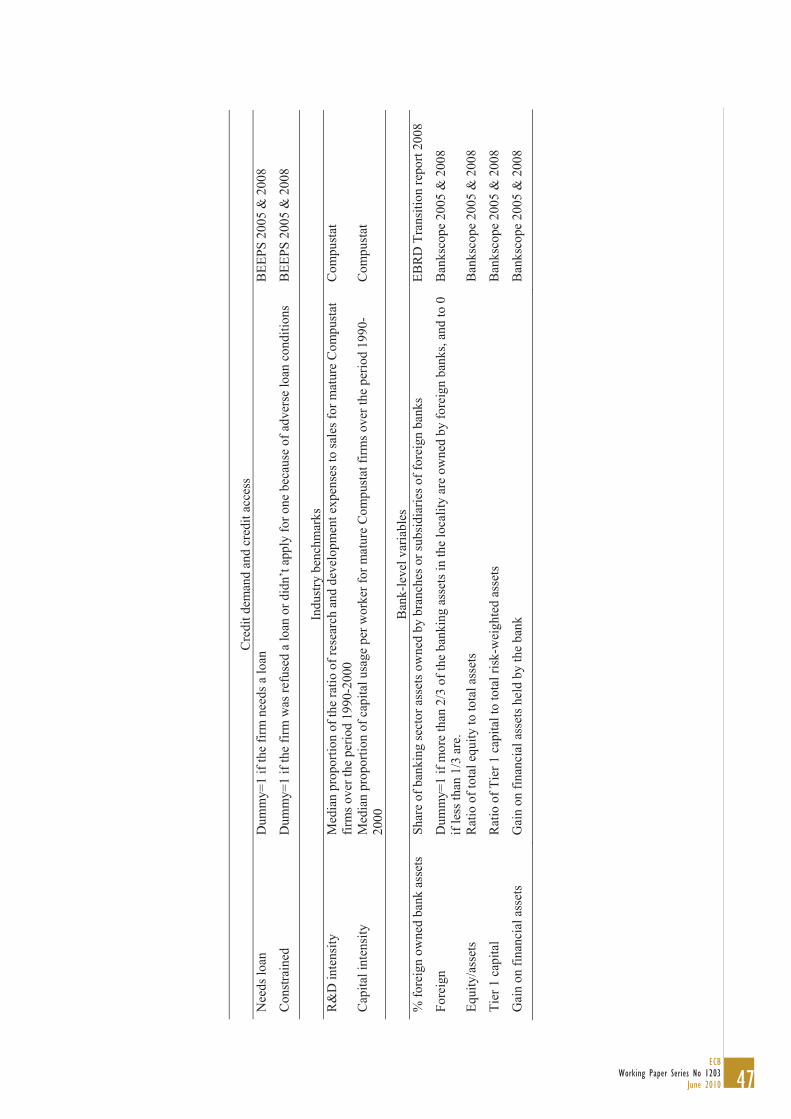
Cre
dit d
eman
d an
d cr
edit
acce
ss
Nee
ds lo
an
Dum
my=
1 if
the
firm
nee
ds a
loan
B
EEPS
200
5 &
200
8
Con
stra
ined
D
umm
y=1
if th
e fir
m w
as re
fuse
d a
loan
or d
idn’
t app
ly fo
r one
bec
ause
of a
dver
se lo
an c
ondi
tions
B
EEPS
200
5 &
200
8
Indu
stry
ben
chm
arks
R
&D
inte
nsity
M
edia
n pr
opor
tion
of th
e ra
tio o
f res
earc
h an
d de
velo
pmen
t exp
ense
s to
sale
s for
mat
ure
Com
pust
at
firm
s ove
r the
per
iod
1990
-200
0 C
ompu
stat
Cap
ital i
nten
sity
M
edia
n pr
opor
tion
of c
apita
l usa
ge p
er w
orke
r for
mat
ure
Com
pust
at fi
rms o
ver t
he p
erio
d 19
90-
2000
C
ompu
stat
Ban
k-le
vel v
aria
bles
%
fore
ign
owne
d ba
nk a
sset
s Sh
are
of b
anki
ng se
ctor
ass
ets o
wne
d by
bra
nche
s or s
ubs i
diar
ies o
f for
eign
ban
ks
EBR
D T
rans
ition
repo
rt 20
08
Fore
ign
Dum
my=
1 if
mor
e th
an 2
/3 o
f the
ban
king
ass
ets i
n th
e lo
calit
y ar
e ow
ned
by fo
reig
n ba
nks,
and
to 0
if
less
than
1/3
are
. B
anks
cope
200
5 &
200
8
Equi
ty/a
sset
s R
atio
of t
otal
equ
ity to
tota
l ass
ets
Ban
ksco
pe 2
005
& 2
008
Tier
1 c
apita
l R
atio
of T
ier 1
cap
ital t
o to
tal r
is k-w
eigh
ted
asse
ts
Ban
ksco
pe 2
005
& 2
008
Gai
n on
fina
ncia
l ass
ets
Gai
n on
fina
ncia
l ass
ets h
eld
by th
e ba
nk
Ban
ksco
pe 2
005
& 2
008
2010June

48ECBWorking Paper Series No 1203
Appendix 2. Domestic and parent banks in the sample Country Bank Parent bank and country of incorporation Albania Alpha Bank Alpha Bank - Greece Raiffeisen Raiffeisen - Austira Banka Kombetare Trektare domestic Tirana Bank Pireus Bank - Greece Intessa San Paolo Bank Albania Intessa San Paolo - Italy National Bank of Greece National Bank of Greece Emporiki Emporiki Bank - Greece Banka Credins domestic Bulgaria Alpha bank Alpha Bank - Greece Unicredit Bulbank UniCredit Group - Italy DSK OTP - Hungary First Investment Bank domestic PostBank EFG Eurobank - Greece Expressbank Societe Generale - France United Bulgarian Bank National Bank of Greece Reiffeisen Raiffeisen - Austira Piraeus Piraeus Bank - Greece Croatia Zagrebaska Bank UniCredit Group - Italy Privredna Bank Zagreb Intessa San Paolo - Italy Erste & Steiermarkische Bank Erste Group - Austria Raiffeisen Bank Raiffeisen - Austria Societe Generale - Splitska Banka Societe Generale - France Hypo Alde Adria Bank Hypo Group - Austria OTP Banka Hrvatska OTP - Hungary Slavonska Banka domestic Hrvatska Postanska Banka domestic Czech Republic Ceska Sporitelna Erste Group - Austria CSOB KBC - Belgium Komercni Banka Societe Generale - France UniCredit Bank CR UniCredit Group - Italy Citibank Citibank - US Ceskomoravska zarucni a rozvojova banka domestic GE Money Bank GE Money - US Hypotecni Banka KBC - Belgium Raiffeisenbank Raiffeisen - Austira Estonia Swedbank Estonia Swedbank - Sweden SEB Skandinavska Enskilda Banken - Sweden Sampo Pank Danske Pank - Denmark Nordea Nordea Bank - Finland Hungary OTP Bank domestic K&H Commercial and Credit Bank KBC - Belgium MKB Bank Bayerische Landesbank - Germany CIB Bank Intessa San Paolo - Italy Raiffeisen Bank Raiffeisen - Austira Erste Bank Hungary Erste Group - Austria KDB Bank KDB Seoul - Korea UniCredit Bank Hungary UniCredit Group - Italy Latvia Parex domestic Hansabank Swedbank - Sweden Latvijas Krajbanka Snoras Bank - Lithuania SMP Bank domestic
2010June

49ECB
Working Paper Series No 1203
Lithuania SEB Skandinavska Enskilda Banken - Sweden Sampo Pank Danske Pank - Denmark Nordea Nordea Bank - Finland Snoras Bank domestic Ukio Bankas domestic Hansabankas Swedbank - Sweden Parex Bankas Parex Group - Latvia Macedonia Alpha Bank Alpha Bank - Greece Stopanska Banka National Bank of Greece Komercijalna Banka domestic NLB Tutunska Banka NLB - Slovenia Ohridska Banka Societe Generale - France Pro Credit Bank Pro Credit Group Montenegro AtlasMont Bank domestic Crnogorska Komercijalna Banka OTP - Hungary Hypo-Alpe-Adria Bank Hypo Group - Austria Komercijalna Banka ad Budva domestic NLB Montenegro Banka NLB - Slovenia Prva Banka Crne Gore domestic Invest Banka Montenegro domestic Podgoricka Banka SG Societe Generale - France Opportunity Bank domestic Poland PKO Bank domestic Bank Pekao UniCredit Group - Italy Bank BPH UniCredit Group - Italy Bank Zachodni WBK AIB - Ireland ING Bank Slaski ING Bank - Netherlands Bank Pocztowy domestic Kredyt Bank KBC - Belgium mBank Commerzbank - Germany Getin Bank domestic Romania BCR Erste Group - Austria BRD Group Societe General Societe Generale - France Volksbank Romania Volksbank - Austria Raiffeisen Bank Raiffeisen - Austira Alpha Bank Romania Alpha Bank - Greece UniCredit Tiriac Bank UniCredit Group - Italy Banca Transilvania domestic Bancpost EFG Eurobank - Greece CEC Bank domestic Slovakia Vseobecna Uverova banka Intessa San Paolo - Italy Slovenska Sporitelna Erste Group - Austria Tatra Banka Raiffeisen - Austira OTP Banka Slovensko OTP - Hungary Dexia Banka Slovensko Dexia - Belgium UniCredit Bank Slovakia UniCredit Group - Italy Volksbank Slovensko Volksbank - Austria CSOB Slovakia KBC - Belgium Slovenia Nova Ljubljanska Banka KBC - Belgium Nova Kreditna Banka Maribor domestic Abanka domestic SKB Societe Generale - France UniCredit UniCredit Group - Italy Banka Koper Intessa San Paolo - Italy Banka Celje domestic Reiffeisen Krekova banka Raiffeisen - Austira
2010June

Work ing PaPer Ser i e Sno 1118 / november 2009
DiScretionary FiScal PolicieS over the cycle
neW eviDence baSeD on the eScb DiSaggregateD aPProach
by Luca Agnello and Jacopo Cimadomo