Embed Size (px)
Citation preview
CROPS
IN
MANITOBA
2012
Janet Honey Prepared for
Department of Agribusiness and Agricultural Economics
University of Manitoba
1
CONTENTS
CROPS IN MANITOBA: Page
Statistical History ………………………………………………………………………………….2 Number of Farms, Area, Yield, Production and Value by Type of Crop ………………….3
Wheat …………………………………………………………………….……………3 Barley ………………………………………………………………………………….3 Oats ………………………………………………………………………………….4 Rye and mixed grains …………………………………………………………………4 Grain corn …………………………………………………………………………………4 Canola ………………………………………………………………………………….5 Flaxseed ………………………………………………………………………………….5 Soybeans ………………………………………………………………………………… 5 Sunflowers ………………………………………………………………………………….6 Industrial hemp ………………………………………………………………………….6 Specialty crops ………………………………………………………………………….6 Pulses ………………………………………………………………………………….7 Minor specialty crops ………………………………………………………………….7 Wild rice ………………………………………………………………………………….8 Potatoes and other vegetables ………………………………………………………….8 Forage crops ………………………………………………………………………………….8 Fertilizer, Pesticides, etc ………………………………………………………………………….9 Tillage and Soil Conservation Practices …………………………………………………………10 Farm Type and Location …………………………………………………………………………11 Crop Prices …………………………………………………………………………………………12 Processing and Trade …………………………………………………………………………13 . Manitoba Grain and Oilseed Statistics …………………………………………………………15 Manitoba Pulse and Specialty Crop Statistics …………………………………………………16 Manitoba Forage Crop Statistics …………………………………………………………………17 Data Sources: Agriculture and Agri-Food Canada Bank of Canada Canadian Food Inspection Agency Canadian Wheat Board Manitoba Agriculture, Food and Rural Initiatives Statistics Canada United States Department of Agriculture
March 2013
2
CROPS IN MANITOBA
Southern Manitoba has the climate and soil to grow a wide range of crops, but grains such as wheat and barley have dominated since farming began. The development in the 1920s and introduction in the mid 1930s of rust-resistant wheat varieties and, later, of other disease-resistant crops as well as the development of canola in the mid 1960s allowed Manitoba farmers to chose crops best suited to their operation.
Statistical History
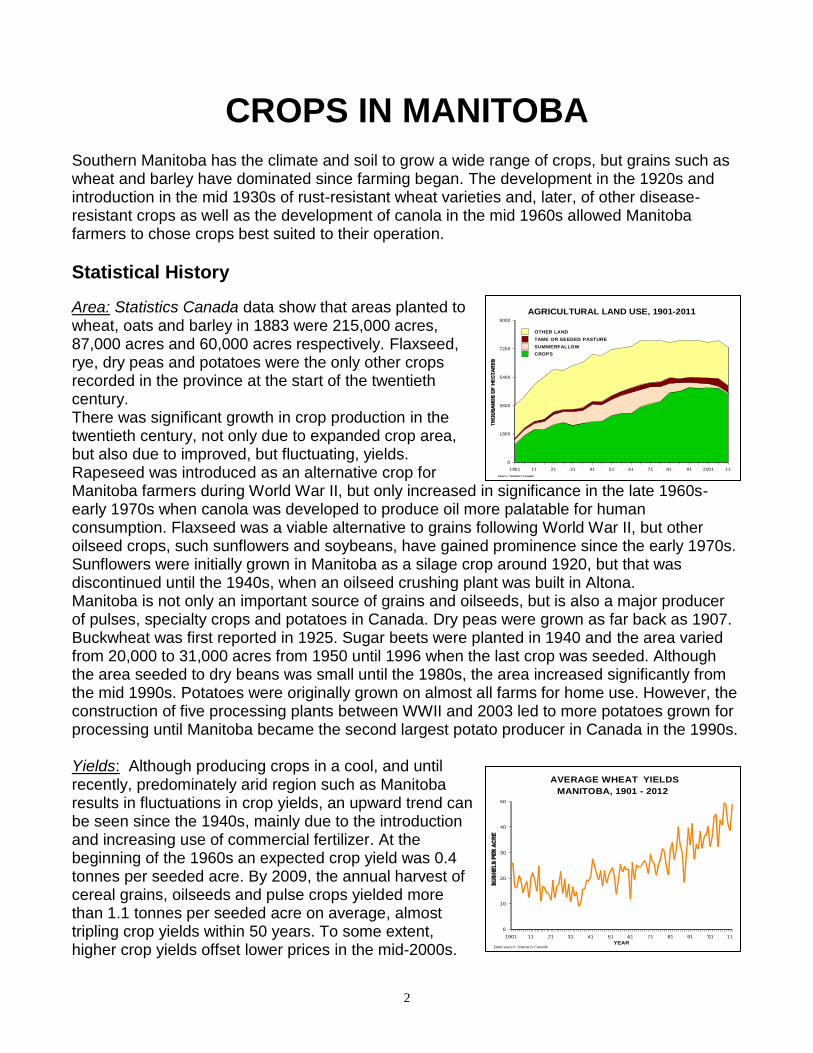
Area: Statistics Canada data show that areas planted to wheat, oats and barley in 1883 were 215,000 acres, 87,000 acres and 60,000 acres respectively. Flaxseed, rye, dry peas and potatoes were the only other crops recorded in the province at the start of the twentieth century. There was significant growth in crop production in the twentieth century, not only due to expanded crop area, but also due to improved, but fluctuating, yields. Rapeseed was introduced as an alternative crop for Manitoba farmers during World War II, but only increased in significance in the late 1960s-early 1970s when canola was developed to produce oil more palatable for human consumption. Flaxseed was a viable alternative to grains following World War II, but other oilseed crops, such sunflowers and soybeans, have gained prominence since the early 1970s. Sunflowers were initially grown in Manitoba as a silage crop around 1920, but that was discontinued until the 1940s, when an oilseed crushing plant was built in Altona. Manitoba is not only an important source of grains and oilseeds, but is also a major producer of pulses, specialty crops and potatoes in Canada. Dry peas were grown as far back as 1907. Buckwheat was first reported in 1925. Sugar beets were planted in 1940 and the area varied from 20,000 to 31,000 acres from 1950 until 1996 when the last crop was seeded. Although the area seeded to dry beans was small until the 1980s, the area increased significantly from the mid 1990s. Potatoes were originally grown on almost all farms for home use. However, the construction of five processing plants between WWII and 2003 led to more potatoes grown for processing until Manitoba became the second largest potato producer in Canada in the 1990s. Yields: Although producing crops in a cool, and until recently, predominately arid region such as Manitoba results in fluctuations in crop yields, an upward trend can be seen since the 1940s, mainly due to the introduction and increasing use of commercial fertilizer. At the beginning of the 1960s an expected crop yield was 0.4 tonnes per seeded acre. By 2009, the annual harvest of cereal grains, oilseeds and pulse crops yielded more than 1.1 tonnes per seeded acre on average, almost tripling crop yields within 50 years. To some extent, higher crop yields offset lower prices in the mid-2000s.
1901 11 21 31 41 51 61 71 81 91 2001 11
0
1800
3600
5400
7200
9000
OTHER LAND
TAME OR SEEDED PASTURE
SUMMERFALLOW
CROPS
AGRICULTURAL LAND USE, 1901-2011
Source: Statistics Canada
YEAR
1901 11 21 31 41 51 61 71 81 91 '01 11
0
10
20
30
40
50
MANITOBA, 1901 - 2012
AVERAGE WHEAT YIELDS
Data source: Statistics Canada
3
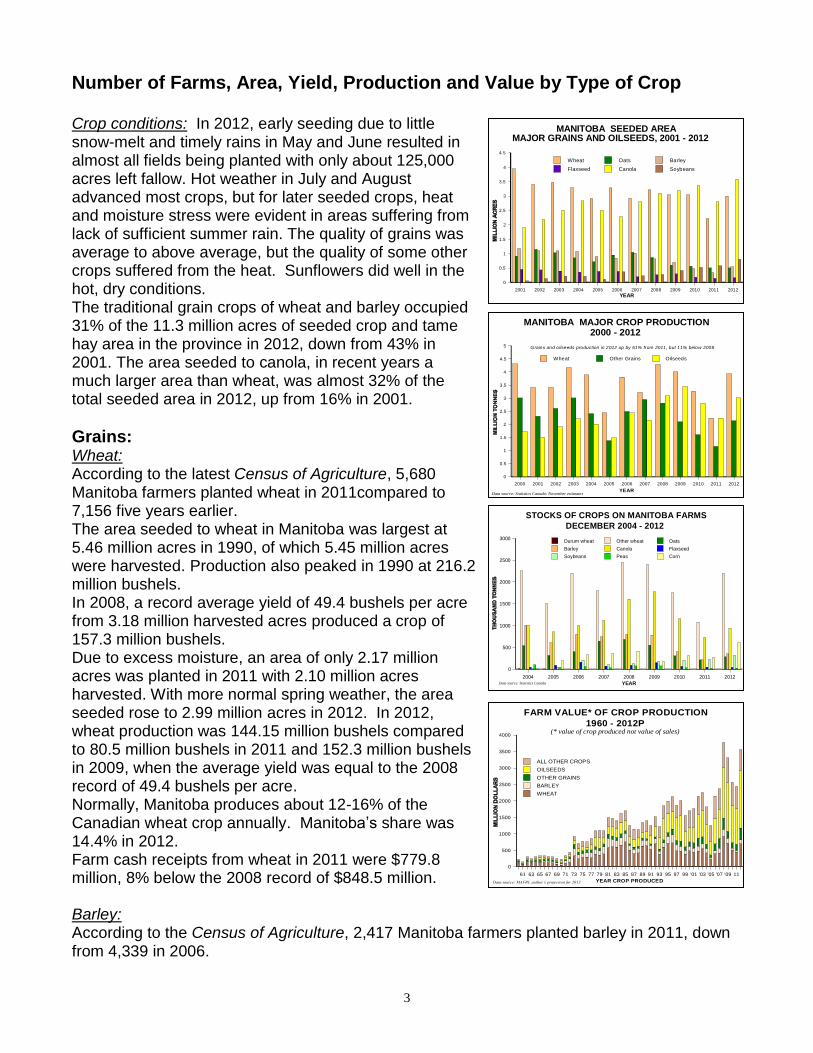
Number of Farms, Area, Yield, Production and Value by Type of Crop Crop conditions: In 2012, early seeding due to little snow-melt and timely rains in May and June resulted in almost all fields being planted with only about 125,000 acres left fallow. Hot weather in July and August advanced most crops, but for later seeded crops, heat and moisture stress were evident in areas suffering from lack of sufficient summer rain. The quality of grains was average to above average, but the quality of some other crops suffered from the heat. Sunflowers did well in the hot, dry conditions. The traditional grain crops of wheat and barley occupied 31% of the 11.3 million acres of seeded crop and tame hay area in the province in 2012, down from 43% in 2001. The area seeded to canola, in recent years a much larger area than wheat, was almost 32% of the total seeded area in 2012, up from 16% in 2001.
Grains: Wheat: According to the latest Census of Agriculture, 5,680 Manitoba farmers planted wheat in 2011compared to 7,156 five years earlier. The area seeded to wheat in Manitoba was largest at 5.46 million acres in 1990, of which 5.45 million acres were harvested. Production also peaked in 1990 at 216.2 million bushels. In 2008, a record average yield of 49.4 bushels per acre from 3.18 million harvested acres produced a crop of 157.3 million bushels. Due to excess moisture, an area of only 2.17 million acres was planted in 2011 with 2.10 million acres harvested. With more normal spring weather, the area seeded rose to 2.99 million acres in 2012. In 2012, wheat production was 144.15 million bushels compared to 80.5 million bushels in 2011 and 152.3 million bushels in 2009, when the average yield was equal to the 2008 record of 49.4 bushels per acre. Normally, Manitoba produces about 12-16% of the Canadian wheat crop annually. Manitoba’s share was 14.4% in 2012. Farm cash receipts from wheat in 2011 were $779.8 million, 8% below the 2008 record of $848.5 million. Barley: According to the Census of Agriculture, 2,417 Manitoba farmers planted barley in 2011, down from 4,339 in 2006.
YEAR2001 2002 2003 2004 2005 2006 2007 2008 2009 2010 2011 2012
0
0.5
1
1.5
2
2.5
3
3.5
4
4.5
Wheat Oats Barley
Flaxseed Canola Soybeans
MAJOR GRAINS AND OILSEEDS, 2001 - 2012MANITOBA SEEDED AREA
YEAR
2000 2001 2002 2003 2004 2005 2006 2007 2008 2009 2010 2011 2012
0
0.5
1
1.5
2
2.5
3
3.5
4
4.5
5
Wheat Other Grains Oilseeds
2000 - 2012MANITOBA MAJOR CROP PRODUCTION
Data source: Statistics Canada: November estimates
Grains and oilseeds production in 2012 up by 61% from 2011, but 11% below 2008
YEAR
2004 2005 2006 2007 2008 2009 2010 2011 2012
0
500
1000
1500
2000
2500
3000Durum wheat Other wheat Oats
Barley Canola Flaxseed
Soybeans Peas Corn
DECEMBER 2004 - 2012
STOCKS OF CROPS ON MANITOBA FARMS
Data source: Statistics Canada
YEAR CROP PRODUCED
61 63 65 67 69 71 73 75 77 79 81 83 85 87 89 91 93 95 97 99 '01 '03 '05 '07 '09 11
0
500
1000
1500
2000
2500
3000
3500
4000
ALL OTHER CROPS
OILSEEDS
OTHER GRAINS
BARLEY
WHEAT
1960 - 2012P
FARM VALUE* OF CROP PRODUCTION
(* value of crop produced not value of sales)
Data source: MAFRI, author’s projection for 2012
4
The area seeded to barley in Manitoba was largest at 2.4 million acres in 1981 when the crop’s value peaked at $277.3 million. The area planted to barley was 0.54 million acres in 2012, up from 0.34 million acres in 2011. The harvested area in 2012 was 0.51 million acres with a yield of 56.2 bushels per acre, well below the record yield of 71.5 bushels per acre in 2009. Barley production rose from the weather-affected 12.0 million bushels in 2011 to 28.4 million bushels in 2012, which was only one quarter of the 1985 record level of 116.0 million bushels. Farm cash receipts from barley sales (excl. farm to farm sales) in 2011 were $47.7 million compared to $116.3 million in 2008. Manitoba normally produces 6-12% of the Canadian barley crop. In 2012, almost 8% of the national crop was produced in the province. Oats: According to the Census of Agriculture, 3,930 Manitoba farmers seeded oats in 2011 compared to 5,798 five years earlier. The area of oats seeded and harvested was greatest in 1921 at 2.2 million acres when oats were used mainly for animal feed. The agricultural industry began to rely more on machinery and less on horses, so the area of oats declined. From a low of only 0.27 million acres harvested in 1991, the growing popularity of oats for human consumption and pet food led to an increase in oat area seeded to 1.15 million acres by 2002. The record average yield of 90.5 bushels per acre occurred in 2008. An area of 0.50 million acres was seeded to oats in both 2011 and 2012, down from 0.56 million acres in 2010 and 0.86 million acres in 2008. The area harvested in 2012 was 0.465 million acres with an average yield of 79.4 bushels per acre and a crop of 36.9 million bushels. Farm cash receipts from the sales of oats in 2008 were record high at $184.2 million, but fell to $115.5 million in 2009. Receipts rose to $126.8 million in 2011, 31% below the 2008 record. Manitoba produces 20-30% of the Canadian oat crop. The share in 2012 was 21%. Rye and mixed grains: Manitoba farmers also grow other grains, such as rye and mixed grains. In 2011, 393 farmers grew rye, down from 637 in 2006, while 196 farmers grew mixed grains in 2011 compared to 314 in 2006. These two crops were grown on 75,000 and about 22,000 acres respectively in 2011, down from 96,000 and 44,000 acres in 2006. The areas planted in 2012 were 100,000 acres of rye and about 10,000 acres of mixed grains with production of 4.9 million and 0.1 million bushels respectively. Farm cash receipts from rye in 2011 were $12.9 million compared to $10.3 million in 2010. Grain corn: Very little corn for grain was grown prior to 1978 as most corn was produced for silage and fodder. However, with the development of varieties more suited to the Manitoba climate, the area of grain corn increased over the years. In 1981, 225,000 acres were harvested, the largest on record until 2012, producing 17 million bushels of corn. The Census of Agriculture showed about 150,000 acres of grain corn were planted in Manitoba in 2006 by 577 producers. The planted area rose to 180,000 acres in 2011 when 713 farmers grew corn. Production of the corn crop peaked first in 2003 at 19.5 million bushels worth $62.5 million. In 2012, a record 300,000 acres of grain corn were planted with a record 290,000 acres harvested. Corn production was 32.1 million bushels in 2012, also a new record, up from 16.3 million bushels the previous year. Farm cash receipts from sales of grain corn were record high at $83.1 million in 2011, up from $56.6 million in 2010. The value of corn sales in 2012 is expected to be even higher.
5
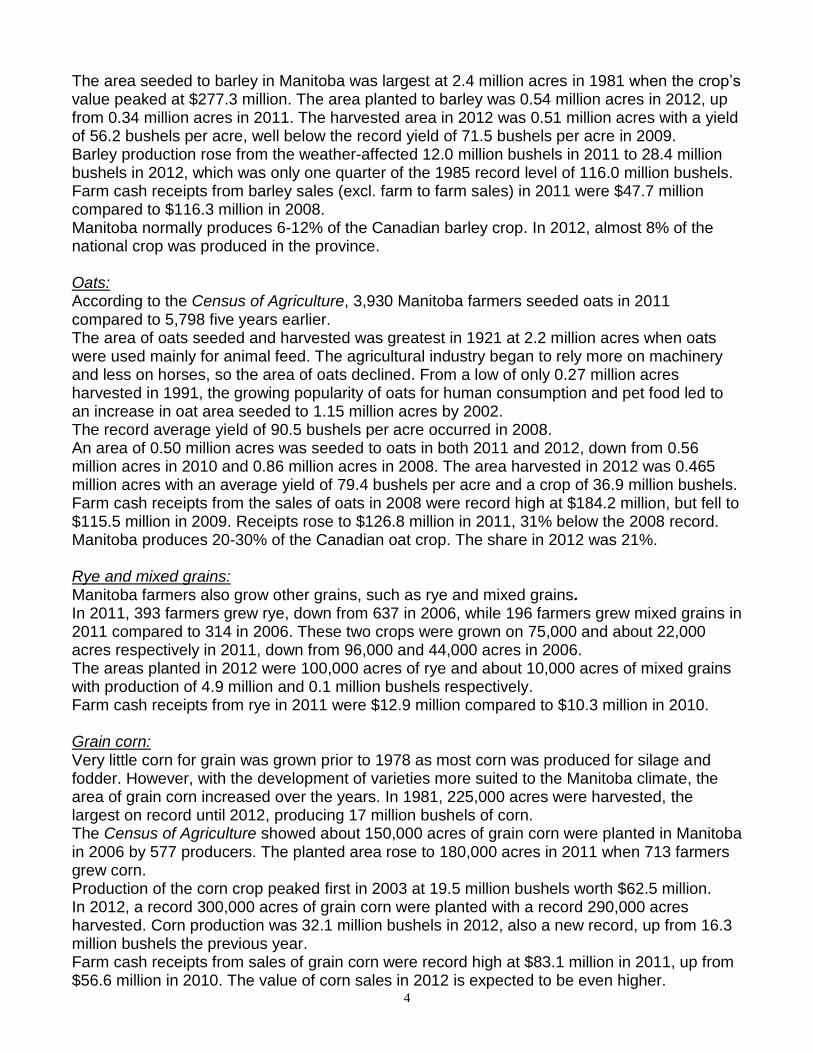
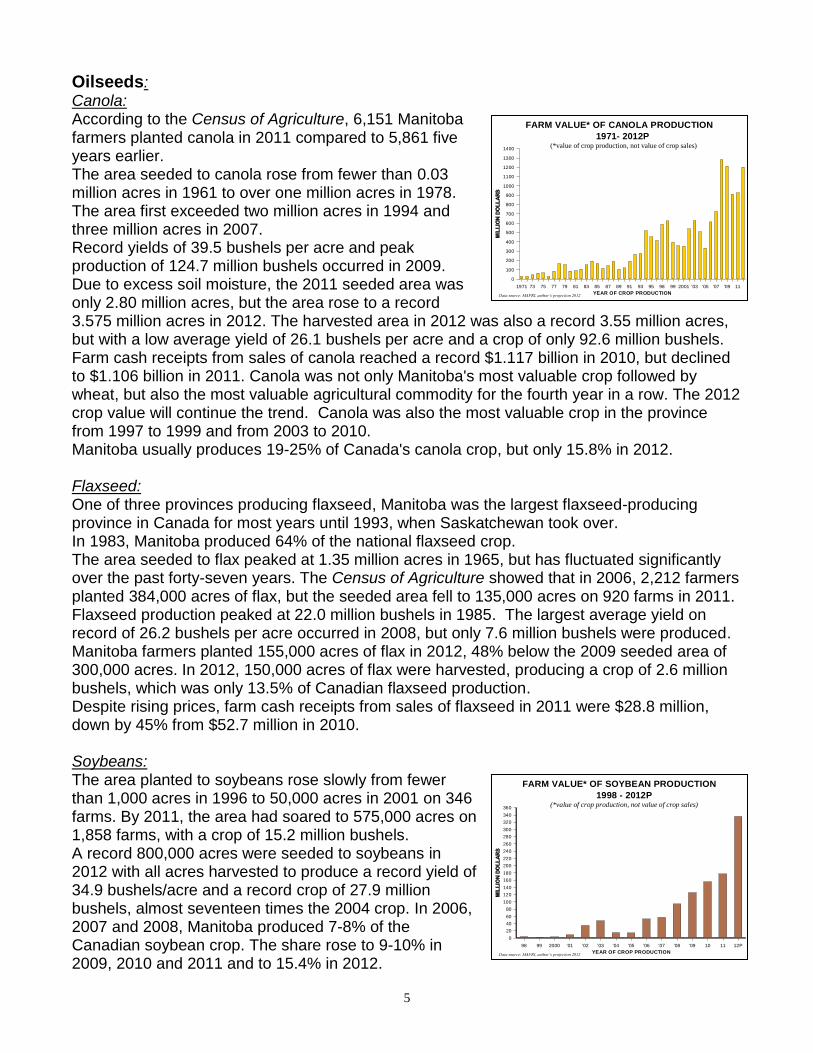
Oilseeds: Canola: According to the Census of Agriculture, 6,151 Manitoba farmers planted canola in 2011 compared to 5,861 five years earlier. The area seeded to canola rose from fewer than 0.03 million acres in 1961 to over one million acres in 1978. The area first exceeded two million acres in 1994 and three million acres in 2007. Record yields of 39.5 bushels per acre and peak production of 124.7 million bushels occurred in 2009. Due to excess soil moisture, the 2011 seeded area was only 2.80 million acres, but the area rose to a record 3.575 million acres in 2012. The harvested area in 2012 was also a record 3.55 million acres, but with a low average yield of 26.1 bushels per acre and a crop of only 92.6 million bushels. Farm cash receipts from sales of canola reached a record $1.117 billion in 2010, but declined to $1.106 billion in 2011. Canola was not only Manitoba's most valuable crop followed by wheat, but also the most valuable agricultural commodity for the fourth year in a row. The 2012 crop value will continue the trend. Canola was also the most valuable crop in the province from 1997 to 1999 and from 2003 to 2010. Manitoba usually produces 19-25% of Canada's canola crop, but only 15.8% in 2012. Flaxseed: One of three provinces producing flaxseed, Manitoba was the largest flaxseed-producing province in Canada for most years until 1993, when Saskatchewan took over. In 1983, Manitoba produced 64% of the national flaxseed crop. The area seeded to flax peaked at 1.35 million acres in 1965, but has fluctuated significantly over the past forty-seven years. The Census of Agriculture showed that in 2006, 2,212 farmers planted 384,000 acres of flax, but the seeded area fell to 135,000 acres on 920 farms in 2011. Flaxseed production peaked at 22.0 million bushels in 1985. The largest average yield on record of 26.2 bushels per acre occurred in 2008, but only 7.6 million bushels were produced. Manitoba farmers planted 155,000 acres of flax in 2012, 48% below the 2009 seeded area of 300,000 acres. In 2012, 150,000 acres of flax were harvested, producing a crop of 2.6 million bushels, which was only 13.5% of Canadian flaxseed production. Despite rising prices, farm cash receipts from sales of flaxseed in 2011 were $28.8 million, down by 45% from $52.7 million in 2010. Soybeans: The area planted to soybeans rose slowly from fewer than 1,000 acres in 1996 to 50,000 acres in 2001 on 346 farms. By 2011, the area had soared to 575,000 acres on 1,858 farms, with a crop of 15.2 million bushels. A record 800,000 acres were seeded to soybeans in 2012 with all acres harvested to produce a record yield of 34.9 bushels/acre and a record crop of 27.9 million bushels, almost seventeen times the 2004 crop. In 2006, 2007 and 2008, Manitoba produced 7-8% of the Canadian soybean crop. The share rose to 9-10% in 2009, 2010 and 2011 and to 15.4% in 2012.
YEAR OF CROP PRODUCTION
1971 73 75 77 79 81 83 85 87 89 91 93 95 98 99 2001 '03 '05 '07 '09 11
0
100
200
300
400
500
600
700
800
900
1000
1100
1200
1300
1400
1971- 2012P
FARM VALUE* OF CANOLA PRODUCTION
Data source: MAFRI, author’s projection 2012
(*value of crop production, not value of crop sales)
YEAR OF CROP PRODUCTION
98 99 2000 '01 '02 '03 '04 '05 '06 '07 '08 '09 10 11 12P
0
20
40
60
80
100
120
140
160
180
200
220
240
260
280
300
320
340
360
1998 - 2012P
FARM VALUE* OF SOYBEAN PRODUCTION
Data source: MAFRI, author’s projection 2012
(*value of crop production, not value of crop sales)
6
Soybean farm cash receipts for 2011 were $155.4 million, but 2012 may be a new record. Sunflowers: By far the largest producer of the three Prairie Provinces, Manitoba's sunflower area peaked at 380,000 acres in 1979, producing a record 460 million pounds of sunflower seed, almost all of the nation’s production. Since then, problems due to weather, disease and insects reduced the area of sunflowers harvested down to 57,000 acres in 1986 and to 63,000 acres in 1996. In 2006, 614 farmers seeded about 190,200 acres, while 35,000 acres were planted on 226 farms five years later. In 2012, the area seeded to sunflowers rose 100,000 acres. The 2012 crop of 191.6 million pounds was 42% of the record 1979 crop. The largest average yield on record was 1,955 pounds per acre in 2012. Farm cash receipts from sales of sunflower seed in 2011 were valued at $27.1 million, up from $26.1 million in 2010, but down from the peak value of $68.1 million in 2007. Manitoba, the “Sunflower Capital of Canada”, produced almost the entire national sunflower crop from 2006 to 2012 compared to 85-90% in the early 2000s. Industrial hemp: Hemp has been grown mainly for seed in Manitoba since the ban on growing hemp was lifted in1998. Harvested area has varied from 29,000 acres with seed production of 16.8 million pounds valued at $8.4 million in 2006 down to 1,400 acres with seed production of 0.7 million pounds valued at 0.4 million in 2008. Over 15,700 acres were planted in Manitoba in 2012, almost 28% of the total licensed area in Canada. Seed production was about 12 million pounds in 2012, double the size of the 2011 crop. Exports of hemp seed, oil, oilcake and fibre were valued at $15.8 million in 2012.
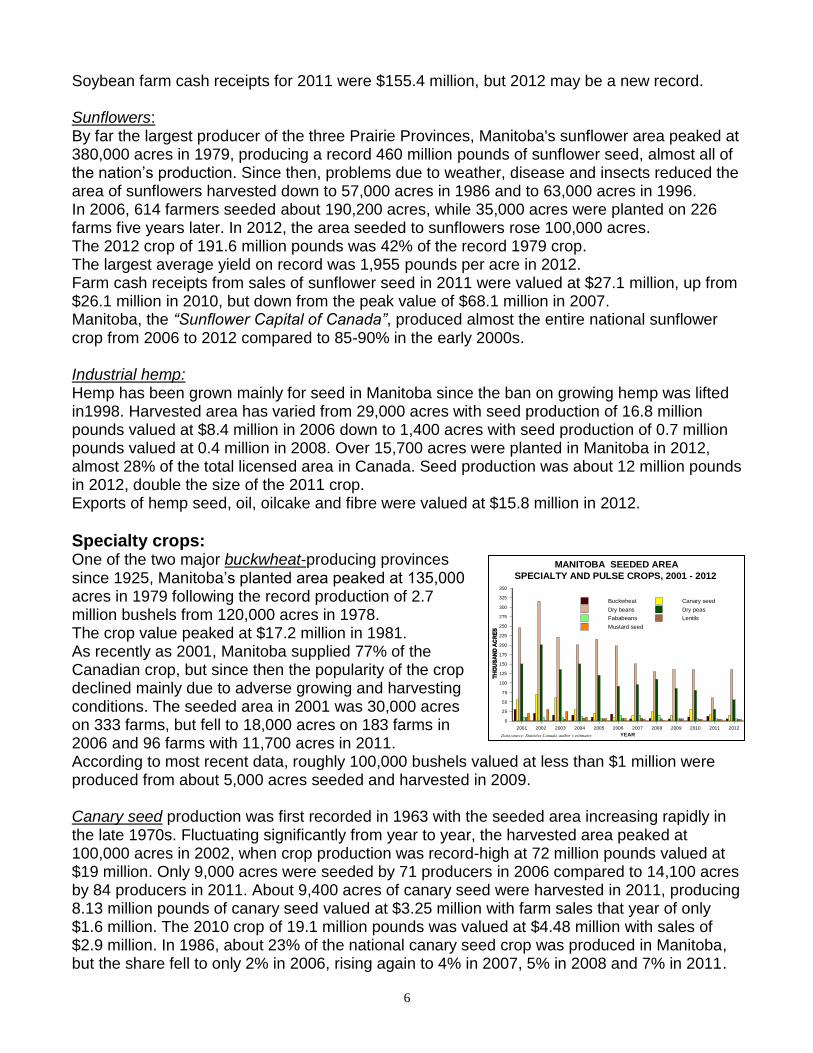
Specialty crops: One of the two major buckwheat-producing provinces since 1925, Manitoba’s planted area peaked at 135,000 acres in 1979 following the record production of 2.7 million bushels from 120,000 acres in 1978. The crop value peaked at $17.2 million in 1981. As recently as 2001, Manitoba supplied 77% of the Canadian crop, but since then the popularity of the crop declined mainly due to adverse growing and harvesting conditions. The seeded area in 2001 was 30,000 acres on 333 farms, but fell to 18,000 acres on 183 farms in 2006 and 96 farms with 11,700 acres in 2011. According to most recent data, roughly 100,000 bushels valued at less than $1 million were produced from about 5,000 acres seeded and harvested in 2009. Canary seed production was first recorded in 1963 with the seeded area increasing rapidly in the late 1970s. Fluctuating significantly from year to year, the harvested area peaked at 100,000 acres in 2002, when crop production was record-high at 72 million pounds valued at $19 million. Only 9,000 acres were seeded by 71 producers in 2006 compared to 14,100 acres by 84 producers in 2011. About 9,400 acres of canary seed were harvested in 2011, producing 8.13 million pounds of canary seed valued at $3.25 million with farm sales that year of only $1.6 million. The 2010 crop of 19.1 million pounds was valued at $4.48 million with sales of $2.9 million. In 1986, about 23% of the national canary seed crop was produced in Manitoba, but the share fell to only 2% in 2006, rising again to 4% in 2007, 5% in 2008 and 7% in 2011.
YEAR
2001 2002 2003 2004 2005 2006 2007 2008 2009 2010 2011 2012
0
25
50
75
100
125
150
175
200
225
250
275
300
325
350
Buckwheat Canary seed
Dry beans Dry peas
Fababeans Lentils
Mustard seed
SPECIALTY AND PULSE CROPS, 2001 - 2012
MANITOBA SEEDED AREA
Data source: Statistics Canada, author’s estimates
7
Mustard seed planted area was 3,100 acres on 21 farms in 2011, compared to 5,500 acres on 29 farms in 2006 and 16,000 acres on 115 Manitoba farms in 2001. Depending on the season, about 1-6% of Canada’s mustard seed came from Manitoba. A very small area of mustard was planted in 2012.
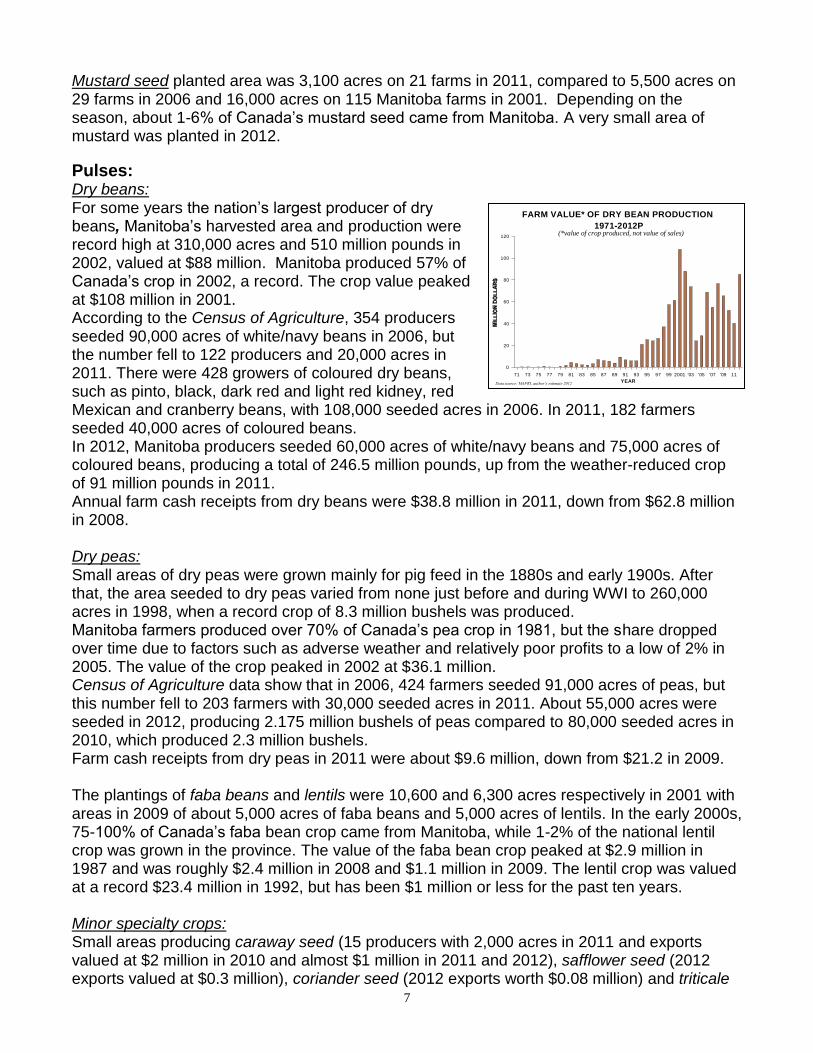
Pulses: Dry beans: For some years the nation’s largest producer of dry beans, Manitoba’s harvested area and production were record high at 310,000 acres and 510 million pounds in 2002, valued at $88 million. Manitoba produced 57% of Canada’s crop in 2002, a record. The crop value peaked at $108 million in 2001. According to the Census of Agriculture, 354 producers seeded 90,000 acres of white/navy beans in 2006, but the number fell to 122 producers and 20,000 acres in 2011. There were 428 growers of coloured dry beans, such as pinto, black, dark red and light red kidney, red Mexican and cranberry beans, with 108,000 seeded acres in 2006. In 2011, 182 farmers seeded 40,000 acres of coloured beans. In 2012, Manitoba producers seeded 60,000 acres of white/navy beans and 75,000 acres of coloured beans, producing a total of 246.5 million pounds, up from the weather-reduced crop of 91 million pounds in 2011. Annual farm cash receipts from dry beans were $38.8 million in 2011, down from $62.8 million in 2008. Dry peas: Small areas of dry peas were grown mainly for pig feed in the 1880s and early 1900s. After that, the area seeded to dry peas varied from none just before and during WWI to 260,000 acres in 1998, when a record crop of 8.3 million bushels was produced. Manitoba farmers produced over 70% of Canada’s pea crop in 1981, but the share dropped over time due to factors such as adverse weather and relatively poor profits to a low of 2% in 2005. The value of the crop peaked in 2002 at $36.1 million. Census of Agriculture data show that in 2006, 424 farmers seeded 91,000 acres of peas, but this number fell to 203 farmers with 30,000 seeded acres in 2011. About 55,000 acres were seeded in 2012, producing 2.175 million bushels of peas compared to 80,000 seeded acres in 2010, which produced 2.3 million bushels. Farm cash receipts from dry peas in 2011 were about $9.6 million, down from $21.2 in 2009. The plantings of faba beans and lentils were 10,600 and 6,300 acres respectively in 2001 with areas in 2009 of about 5,000 acres of faba beans and 5,000 acres of lentils. In the early 2000s, 75-100% of Canada’s faba bean crop came from Manitoba, while 1-2% of the national lentil crop was grown in the province. The value of the faba bean crop peaked at $2.9 million in 1987 and was roughly $2.4 million in 2008 and $1.1 million in 2009. The lentil crop was valued at a record $23.4 million in 1992, but has been $1 million or less for the past ten years. Minor specialty crops: Small areas producing caraway seed (15 producers with 2,000 acres in 2011 and exports valued at $2 million in 2010 and almost $1 million in 2011 and 2012), safflower seed (2012 exports valued at $0.3 million), coriander seed (2012 exports worth $0.08 million) and triticale
YEAR
71 73 75 77 79 81 83 85 87 89 91 93 95 97 99 2001 '03 '05 '07 '09 11
0
20
40
60
80
100
120
1971-2012P
FARM VALUE* OF DRY BEAN PRODUCTION
Data source: MAFRI, author’s estimate 2012
(*value of crop produced, not value of sales)
8
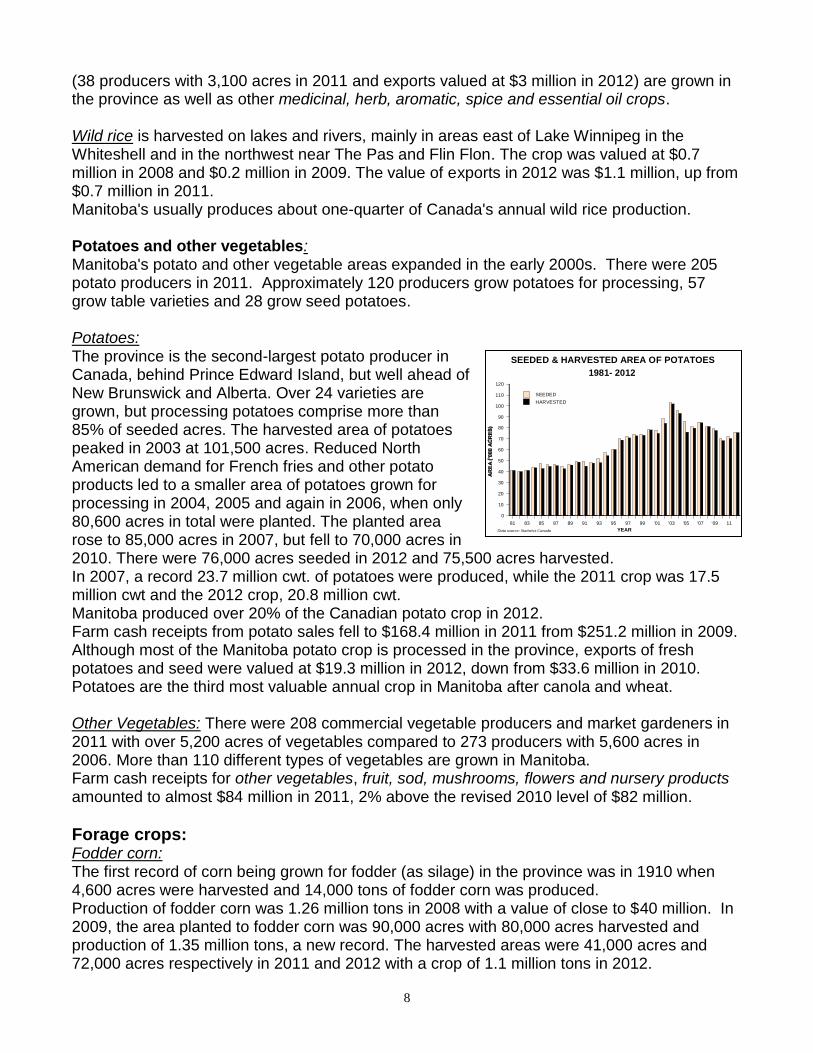
(38 producers with 3,100 acres in 2011 and exports valued at $3 million in 2012) are grown in the province as well as other medicinal, herb, aromatic, spice and essential oil crops. Wild rice is harvested on lakes and rivers, mainly in areas east of Lake Winnipeg in the Whiteshell and in the northwest near The Pas and Flin Flon. The crop was valued at $0.7 million in 2008 and $0.2 million in 2009. The value of exports in 2012 was $1.1 million, up from $0.7 million in 2011. Manitoba's usually produces about one-quarter of Canada's annual wild rice production. Potatoes and other vegetables: Manitoba's potato and other vegetable areas expanded in the early 2000s. There were 205 potato producers in 2011. Approximately 120 producers grow potatoes for processing, 57 grow table varieties and 28 grow seed potatoes. Potatoes: The province is the second-largest potato producer in Canada, behind Prince Edward Island, but well ahead of New Brunswick and Alberta. Over 24 varieties are grown, but processing potatoes comprise more than 85% of seeded acres. The harvested area of potatoes peaked in 2003 at 101,500 acres. Reduced North American demand for French fries and other potato products led to a smaller area of potatoes grown for processing in 2004, 2005 and again in 2006, when only 80,600 acres in total were planted. The planted area rose to 85,000 acres in 2007, but fell to 70,000 acres in 2010. There were 76,000 acres seeded in 2012 and 75,500 acres harvested. In 2007, a record 23.7 million cwt. of potatoes were produced, while the 2011 crop was 17.5 million cwt and the 2012 crop, 20.8 million cwt. Manitoba produced over 20% of the Canadian potato crop in 2012. Farm cash receipts from potato sales fell to $168.4 million in 2011 from $251.2 million in 2009. Although most of the Manitoba potato crop is processed in the province, exports of fresh potatoes and seed were valued at $19.3 million in 2012, down from $33.6 million in 2010. Potatoes are the third most valuable annual crop in Manitoba after canola and wheat. Other Vegetables: There were 208 commercial vegetable producers and market gardeners in 2011 with over 5,200 acres of vegetables compared to 273 producers with 5,600 acres in 2006. More than 110 different types of vegetables are grown in Manitoba. Farm cash receipts for other vegetables, fruit, sod, mushrooms, flowers and nursery products amounted to almost $84 million in 2011, 2% above the revised 2010 level of $82 million.
Forage crops: Fodder corn: The first record of corn being grown for fodder (as silage) in the province was in 1910 when 4,600 acres were harvested and 14,000 tons of fodder corn was produced. Production of fodder corn was 1.26 million tons in 2008 with a value of close to $40 million. In 2009, the area planted to fodder corn was 90,000 acres with 80,000 acres harvested and production of 1.35 million tons, a new record. The harvested areas were 41,000 acres and 72,000 acres respectively in 2011 and 2012 with a crop of 1.1 million tons in 2012.
YEAR
81 83 85 87 89 91 93 95 97 99 '01 '03 '05 '07 '09 11
0
10
20
30
40
50
60
70
80
90
100
110
120
SEEDED
HARVESTED
1981- 2012
SEEDED & HARVESTED AREA OF POTATOES
Data source: Statistics Canada
9
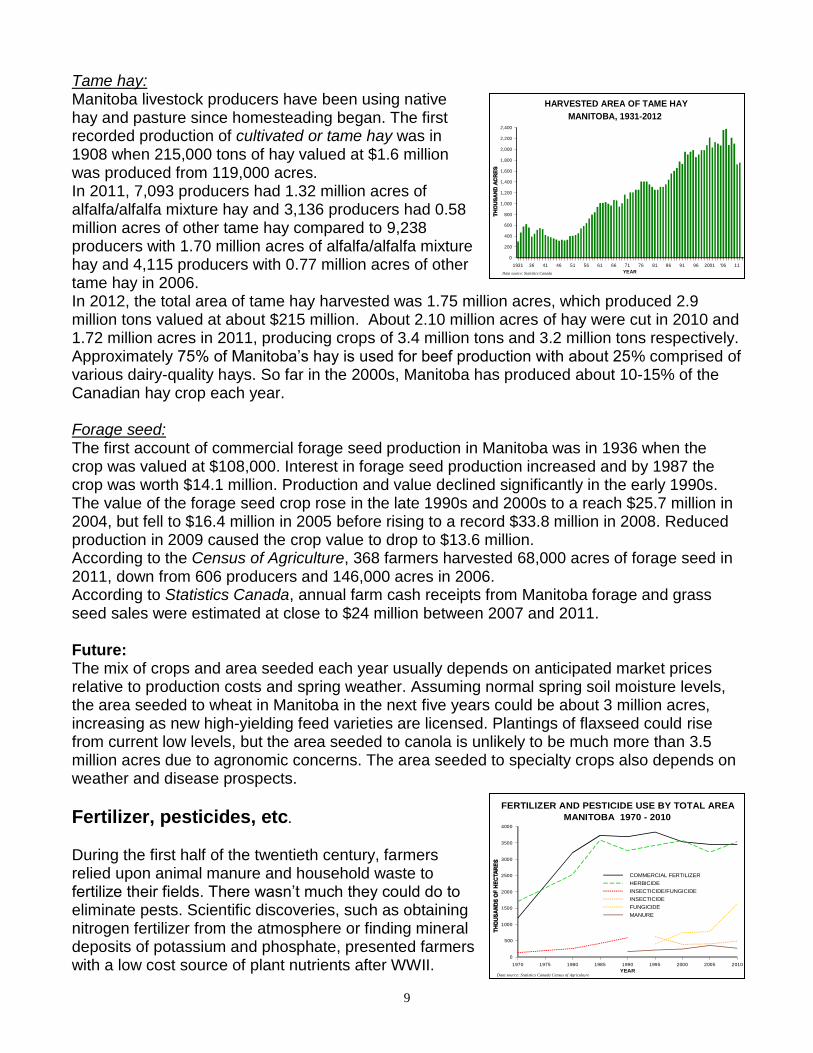
Tame hay: Manitoba livestock producers have been using native hay and pasture since homesteading began. The first recorded production of cultivated or tame hay was in 1908 when 215,000 tons of hay valued at $1.6 million was produced from 119,000 acres. In 2011, 7,093 producers had 1.32 million acres of alfalfa/alfalfa mixture hay and 3,136 producers had 0.58 million acres of other tame hay compared to 9,238 producers with 1.70 million acres of alfalfa/alfalfa mixture hay and 4,115 producers with 0.77 million acres of other tame hay in 2006. In 2012, the total area of tame hay harvested was 1.75 million acres, which produced 2.9 million tons valued at about $215 million. About 2.10 million acres of hay were cut in 2010 and 1.72 million acres in 2011, producing crops of 3.4 million tons and 3.2 million tons respectively. Approximately 75% of Manitoba’s hay is used for beef production with about 25% comprised of various dairy-quality hays. So far in the 2000s, Manitoba has produced about 10-15% of the Canadian hay crop each year. Forage seed: The first account of commercial forage seed production in Manitoba was in 1936 when the crop was valued at $108,000. Interest in forage seed production increased and by 1987 the crop was worth $14.1 million. Production and value declined significantly in the early 1990s. The value of the forage seed crop rose in the late 1990s and 2000s to a reach $25.7 million in 2004, but fell to $16.4 million in 2005 before rising to a record $33.8 million in 2008. Reduced production in 2009 caused the crop value to drop to $13.6 million. According to the Census of Agriculture, 368 farmers harvested 68,000 acres of forage seed in 2011, down from 606 producers and 146,000 acres in 2006. According to Statistics Canada, annual farm cash receipts from Manitoba forage and grass seed sales were estimated at close to $24 million between 2007 and 2011. Future: The mix of crops and area seeded each year usually depends on anticipated market prices relative to production costs and spring weather. Assuming normal spring soil moisture levels, the area seeded to wheat in Manitoba in the next five years could be about 3 million acres, increasing as new high-yielding feed varieties are licensed. Plantings of flaxseed could rise from current low levels, but the area seeded to canola is unlikely to be much more than 3.5 million acres due to agronomic concerns. The area seeded to specialty crops also depends on weather and disease prospects.
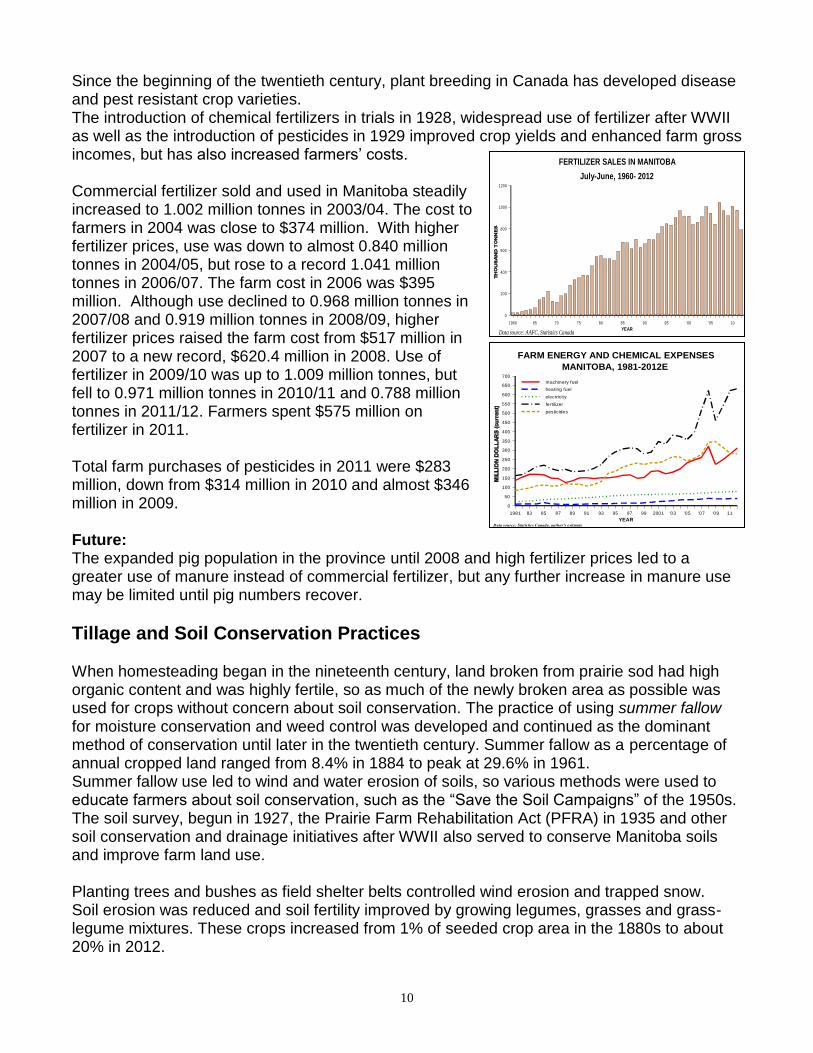
Fertilizer, pesticides, etc.
During the first half of the twentieth century, farmers relied upon animal manure and household waste to fertilize their fields. There wasn’t much they could do to eliminate pests. Scientific discoveries, such as obtaining nitrogen fertilizer from the atmosphere or finding mineral deposits of potassium and phosphate, presented farmers with a low cost source of plant nutrients after WWII.
YEAR
1931 36 41 46 51 56 61 66 71 76 81 86 91 96 2001 '06 11
0
200
400
600
800
1,000
1,200
1,400
1,600
1,800
2,000
2,200
2,400
MANITOBA, 1931-2012
HARVESTED AREA OF TAME HAY
Data source: Statistics Canada
YEAR
1970 1975 1980 1985 1990 1995 2000 2005 2010
0
500
1000
1500
2000
2500
3000
3500
4000
COMMERCIAL FERTILIZER
HERBICIDE
INSECTICIDE/FUNGICIDE
INSECTICIDE
FUNGICIDE
MANURE
MANITOBA 1970 - 2010
FERTILIZER AND PESTICIDE USE BY TOTAL AREA
Data source: Statistics Canada Census of Agriculture
10
Since the beginning of the twentieth century, plant breeding in Canada has developed disease and pest resistant crop varieties. The introduction of chemical fertilizers in trials in 1928, widespread use of fertilizer after WWII as well as the introduction of pesticides in 1929 improved crop yields and enhanced farm gross incomes, but has also increased farmers’ costs. Commercial fertilizer sold and used in Manitoba steadily increased to 1.002 million tonnes in 2003/04. The cost to farmers in 2004 was close to $374 million. With higher fertilizer prices, use was down to almost 0.840 million tonnes in 2004/05, but rose to a record 1.041 million tonnes in 2006/07. The farm cost in 2006 was $395 million. Although use declined to 0.968 million tonnes in 2007/08 and 0.919 million tonnes in 2008/09, higher fertilizer prices raised the farm cost from $517 million in 2007 to a new record, $620.4 million in 2008. Use of fertilizer in 2009/10 was up to 1.009 million tonnes, but fell to 0.971 million tonnes in 2010/11 and 0.788 million tonnes in 2011/12. Farmers spent $575 million on fertilizer in 2011. Total farm purchases of pesticides in 2011 were $283 million, down from $314 million in 2010 and almost $346 million in 2009. Future: The expanded pig population in the province until 2008 and high fertilizer prices led to a greater use of manure instead of commercial fertilizer, but any further increase in manure use may be limited until pig numbers recover.
Tillage and Soil Conservation Practices
When homesteading began in the nineteenth century, land broken from prairie sod had high organic content and was highly fertile, so as much of the newly broken area as possible was used for crops without concern about soil conservation. The practice of using summer fallow for moisture conservation and weed control was developed and continued as the dominant method of conservation until later in the twentieth century. Summer fallow as a percentage of annual cropped land ranged from 8.4% in 1884 to peak at 29.6% in 1961. Summer fallow use led to wind and water erosion of soils, so various methods were used to educate farmers about soil conservation, such as the “Save the Soil Campaigns” of the 1950s. The soil survey, begun in 1927, the Prairie Farm Rehabilitation Act (PFRA) in 1935 and other soil conservation and drainage initiatives after WWII also served to conserve Manitoba soils and improve farm land use. Planting trees and bushes as field shelter belts controlled wind erosion and trapped snow. Soil erosion was reduced and soil fertility improved by growing legumes, grasses and grass-legume mixtures. These crops increased from 1% of seeded crop area in the 1880s to about 20% in 2012.
YEAR
1960 65 70 75 80 85 90 95 '00 '05 10
0
200
400
600
800
1000
1200
July-June, 1960- 2012
FERTILIZER SALES IN MANITOBA
Data source: AAFC, Statistics Canada
YEAR
1981 83 85 87 89 91 93 95 97 99 2001 '03 '05 '07 '09 11
0
50
100
150
200
250
300
350
400
450
500
550
600
650
700
machinery fuel
heating fuel
electricity
fertilizer
pesticides
MANITOBA, 1981-2012E
FARM ENERGY AND CHEMICAL EXPENSES
Data source: Statistics Canada, author’s estimate
11
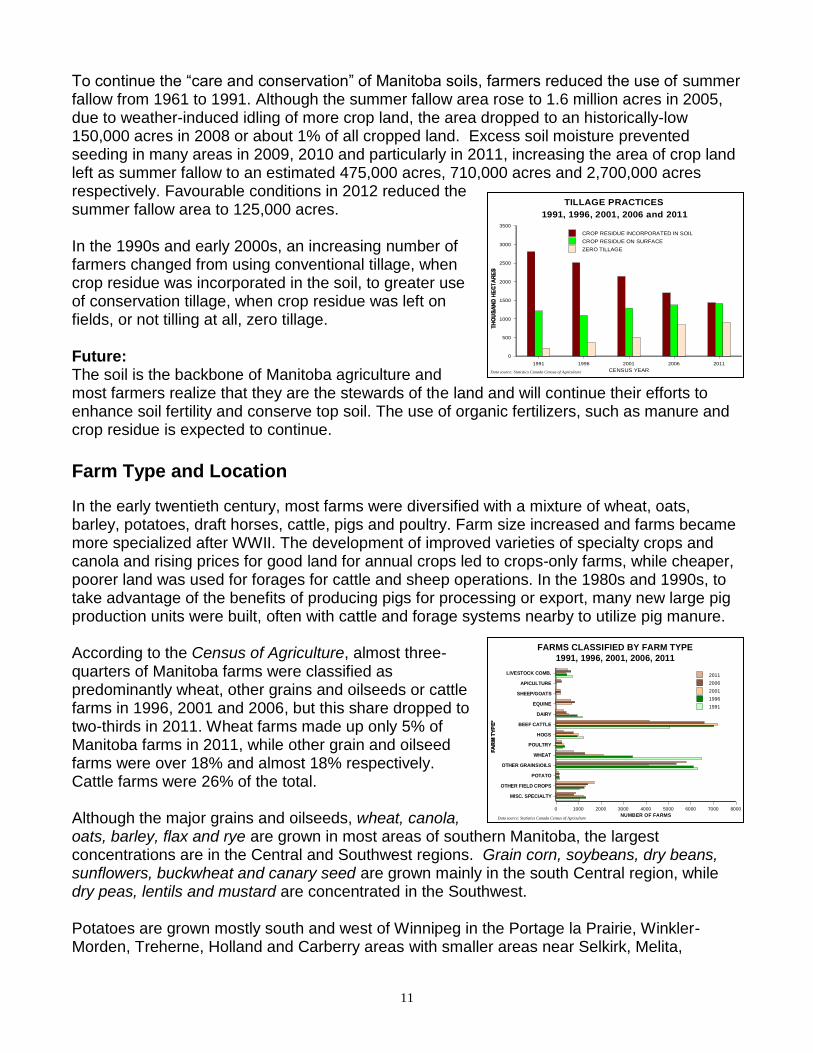
To continue the “care and conservation” of Manitoba soils, farmers reduced the use of summer fallow from 1961 to 1991. Although the summer fallow area rose to 1.6 million acres in 2005, due to weather-induced idling of more crop land, the area dropped to an historically-low 150,000 acres in 2008 or about 1% of all cropped land. Excess soil moisture prevented seeding in many areas in 2009, 2010 and particularly in 2011, increasing the area of crop land left as summer fallow to an estimated 475,000 acres, 710,000 acres and 2,700,000 acres respectively. Favourable conditions in 2012 reduced the summer fallow area to 125,000 acres. In the 1990s and early 2000s, an increasing number of farmers changed from using conventional tillage, when crop residue was incorporated in the soil, to greater use of conservation tillage, when crop residue was left on fields, or not tilling at all, zero tillage. Future: The soil is the backbone of Manitoba agriculture and most farmers realize that they are the stewards of the land and will continue their efforts to enhance soil fertility and conserve top soil. The use of organic fertilizers, such as manure and crop residue is expected to continue.
Farm Type and Location
In the early twentieth century, most farms were diversified with a mixture of wheat, oats, barley, potatoes, draft horses, cattle, pigs and poultry. Farm size increased and farms became more specialized after WWII. The development of improved varieties of specialty crops and canola and rising prices for good land for annual crops led to crops-only farms, while cheaper, poorer land was used for forages for cattle and sheep operations. In the 1980s and 1990s, to take advantage of the benefits of producing pigs for processing or export, many new large pig production units were built, often with cattle and forage systems nearby to utilize pig manure. According to the Census of Agriculture, almost three-quarters of Manitoba farms were classified as predominantly wheat, other grains and oilseeds or cattle farms in 1996, 2001 and 2006, but this share dropped to two-thirds in 2011. Wheat farms made up only 5% of Manitoba farms in 2011, while other grain and oilseed farms were over 18% and almost 18% respectively. Cattle farms were 26% of the total. Although the major grains and oilseeds, wheat, canola, oats, barley, flax and rye are grown in most areas of southern Manitoba, the largest concentrations are in the Central and Southwest regions. Grain corn, soybeans, dry beans, sunflowers, buckwheat and canary seed are grown mainly in the south Central region, while dry peas, lentils and mustard are concentrated in the Southwest. Potatoes are grown mostly south and west of Winnipeg in the Portage la Prairie, Winkler-Morden, Treherne, Holland and Carberry areas with smaller areas near Selkirk, Melita,
CENSUS YEAR
1991 1996 2001 2006 2011
0
500
1000
1500
2000
2500
3000
3500
CROP RESIDUE INCORPORATED IN SOIL
CROP RESIDUE ON SURFACE
ZERO TILLAGE
1991, 1996, 2001, 2006 and 2011
TILLAGE PRACTICES
Data source: Statistics Canada Census of Agriculture
NUMBER OF FARMS
MISC. SPECIALTY
OTHER FIELD CROPS
POTATO
OTHER GRAINS\OILS
WHEAT
POULTRY
HOGS
BEEF CATTLE
DAIRY
EQUINE
SHEEP/GOATS
APICULTURE
LIVESTOCK COMB.
0 1000 2000 3000 4000 5000 6000 7000 8000
2011
2006
2001
1996
1991
1991, 1996, 2001, 2006, 2011
FARMS CLASSIFIED BY FARM TYPE
Data source: Statistics Canada Census of Agriculture
12
Dauphin and Steinbach. Large commercial vegetable farms are concentrated west, north and south of Winnipeg, particularly in the Portage la Prairie and Marquette areas. Generally hay and pasture are found on land unsuitable for annual crops throughout southern Manitoba, while fodder corn is grown in more southerly areas.
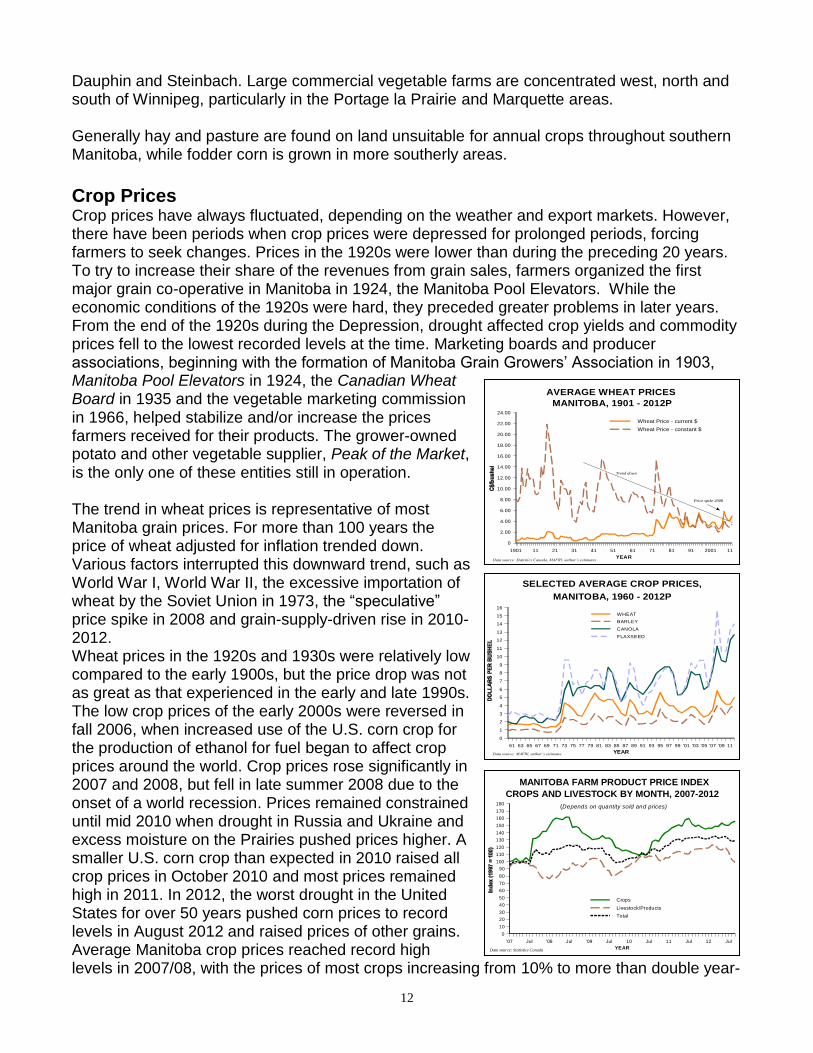
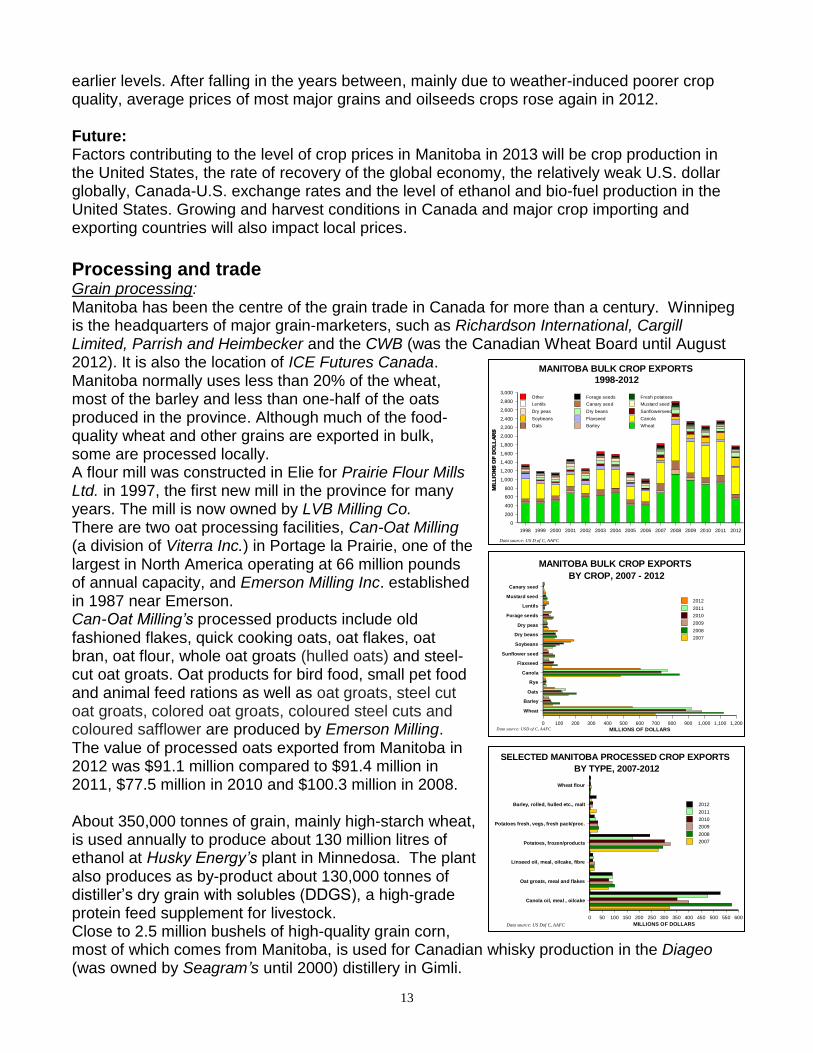
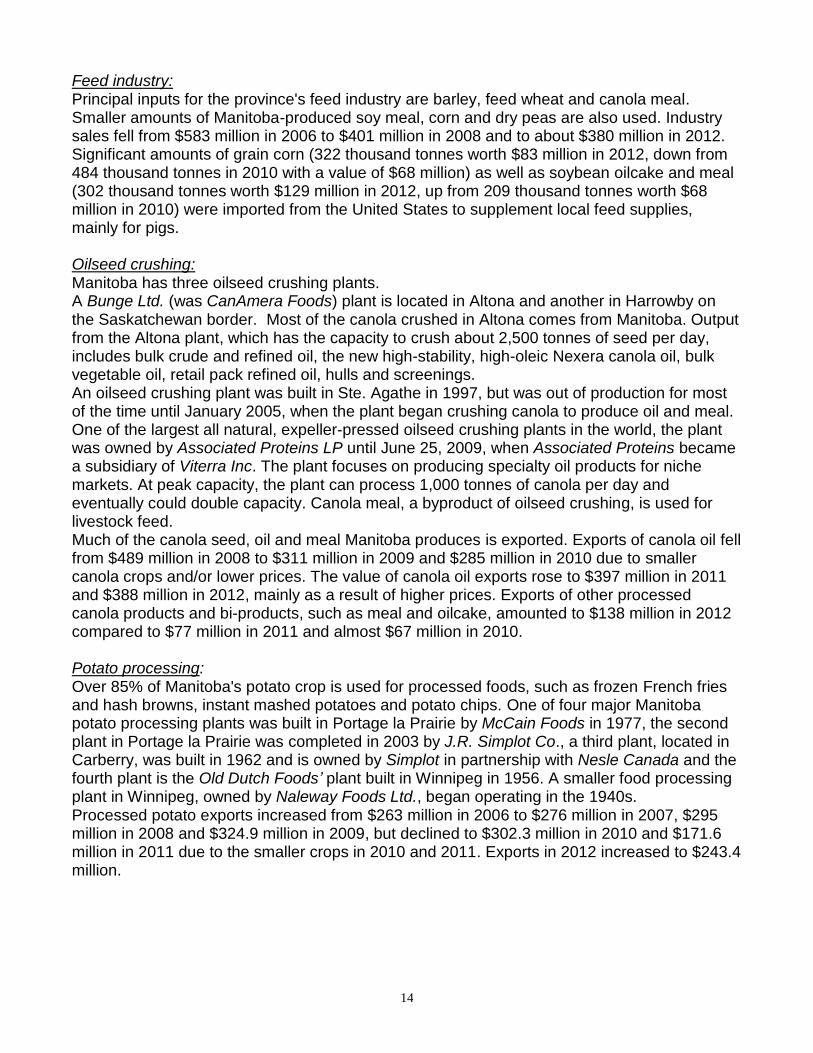
Crop Prices Crop prices have always fluctuated, depending on the weather and export markets. However, there have been periods when crop prices were depressed for prolonged periods, forcing farmers to seek changes. Prices in the 1920s were lower than during the preceding 20 years. To try to increase their share of the revenues from grain sales, farmers organized the first major grain co-operative in Manitoba in 1924, the Manitoba Pool Elevators. While the economic conditions of the 1920s were hard, they preceded greater problems in later years. From the end of the 1920s during the Depression, drought affected crop yields and commodity prices fell to the lowest recorded levels at the time. Marketing boards and producer associations, beginning with the formation of Manitoba Grain Growers’ Association in 1903, Manitoba Pool Elevators in 1924, the Canadian Wheat Board in 1935 and the vegetable marketing commission in 1966, helped stabilize and/or increase the prices farmers received for their products. The grower-owned potato and other vegetable supplier, Peak of the Market, is the only one of these entities still in operation. The trend in wheat prices is representative of most Manitoba grain prices. For more than 100 years the price of wheat adjusted for inflation trended down. Various factors interrupted this downward trend, such as World War I, World War II, the excessive importation of wheat by the Soviet Union in 1973, the “speculative” price spike in 2008 and grain-supply-driven rise in 2010-2012. Wheat prices in the 1920s and 1930s were relatively low compared to the early 1900s, but the price drop was not as great as that experienced in the early and late 1990s. The low crop prices of the early 2000s were reversed in fall 2006, when increased use of the U.S. corn crop for the production of ethanol for fuel began to affect crop prices around the world. Crop prices rose significantly in 2007 and 2008, but fell in late summer 2008 due to the onset of a world recession. Prices remained constrained until mid 2010 when drought in Russia and Ukraine and excess moisture on the Prairies pushed prices higher. A smaller U.S. corn crop than expected in 2010 raised all crop prices in October 2010 and most prices remained high in 2011. In 2012, the worst drought in the United States for over 50 years pushed corn prices to record levels in August 2012 and raised prices of other grains. Average Manitoba crop prices reached record high levels in 2007/08, with the prices of most crops increasing from 10% to more than double year-
YEAR
1901 11 21 31 41 51 61 71 81 91 2001 11
0
2.00
4.00
6.00
8.00
10.00
12.00
14.00
16.00
18.00
20.00
22.00
24.00
Wheat Price - current $
Wheat Price - constant $
MANITOBA, 1901 - 2012P
AVERAGE WHEAT PRICES
Data source: Statistics Canada, MAFRI, author’s estimates
Price spike 2008
Trend down
YEAR
61 63 65 67 69 71 73 75 77 79 81 83 85 87 89 91 93 95 97 99 '01 '03 '05 '07 '09 11
0
1
2
3
4
5
6
7
8
9
10
11
12
13
14
15
16
WHEAT
BARLEY
CANOLA
FLAXSEED
MANITOBA, 1960 - 2012P
SELECTED AVERAGE CROP PRICES,
Data source: MAFRI, author’s estimates
YEAR
'07 Jul '08 Jul '09 Jul 10 Jul 11 Jul 12 Jul
0
10
20
30
40
50
60
70
80
90
100
110
120
130
140
150
160
170
180
Crops
Livestock/Products
Total
CROPS AND LIVESTOCK BY MONTH, 2007-2012
MANITOBA FARM PRODUCT PRICE INDEX
Data source: Statistics Canada
(Depends on quantity sold and prices)
13
earlier levels. After falling in the years between, mainly due to weather-induced poorer crop quality, average prices of most major grains and oilseeds crops rose again in 2012. Future: Factors contributing to the level of crop prices in Manitoba in 2013 will be crop production in the United States, the rate of recovery of the global economy, the relatively weak U.S. dollar globally, Canada-U.S. exchange rates and the level of ethanol and bio-fuel production in the United States. Growing and harvest conditions in Canada and major crop importing and exporting countries will also impact local prices.
Processing and trade Grain processing: Manitoba has been the centre of the grain trade in Canada for more than a century. Winnipeg is the headquarters of major grain-marketers, such as Richardson International, Cargill Limited, Parrish and Heimbecker and the CWB (was the Canadian Wheat Board until August 2012). It is also the location of ICE Futures Canada. Manitoba normally uses less than 20% of the wheat, most of the barley and less than one-half of the oats produced in the province. Although much of the food-quality wheat and other grains are exported in bulk, some are processed locally. A flour mill was constructed in Elie for Prairie Flour Mills Ltd. in 1997, the first new mill in the province for many years. The mill is now owned by LVB Milling Co. There are two oat processing facilities, Can-Oat Milling (a division of Viterra Inc.) in Portage la Prairie, one of the largest in North America operating at 66 million pounds of annual capacity, and Emerson Milling Inc. established in 1987 near Emerson. Can-Oat Milling’s processed products include old fashioned flakes, quick cooking oats, oat flakes, oat bran, oat flour, whole oat groats (hulled oats) and steel-cut oat groats. Oat products for bird food, small pet food and animal feed rations as well as oat groats, steel cut oat groats, colored oat groats, coloured steel cuts and coloured safflower are produced by Emerson Milling. The value of processed oats exported from Manitoba in 2012 was $91.1 million compared to $91.4 million in 2011, $77.5 million in 2010 and $100.3 million in 2008. About 350,000 tonnes of grain, mainly high-starch wheat, is used annually to produce about 130 million litres of ethanol at Husky Energy’s plant in Minnedosa. The plant also produces as by-product about 130,000 tonnes of distiller’s dry grain with solubles (DDGS), a high-grade protein feed supplement for livestock. Close to 2.5 million bushels of high-quality grain corn, most of which comes from Manitoba, is used for Canadian whisky production in the Diageo (was owned by Seagram’s until 2000) distillery in Gimli.
1998 1999 2000 2001 2002 2003 2004 2005 2006 2007 2008 2009 2010 2011 2012
0
200
400
600
800
1,000
1,200
1,400
1,600
1,800
2,000
2,200
2,400
2,600
2,800
3,000
Other Forage seeds Fresh potatoes
Lentils Canary seed Mustard seed
Dry peas Dry beans Sunflowerseed
Soybeans Flaxseed Canola
Oats Barley Wheat
1998-2012
MANITOBA BULK CROP EXPORTS
Data source: US D of C, AAFC
MILLIONS OF DOLLARS
Wheat
Barley
Oats
Rye
Canola
Flaxseed
Sunflower seed
Soybeans
Dry beans
Dry peas
Forage seeds
Lentils
Mustard seed
Canary seed
0 100 200 300 400 500 600 700 800 900 1,000 1,100 1,200
2012
2011
2010
2009
2008
2007
BY CROP, 2007 - 2012
MANITOBA BULK CROP EXPORTS
Data source: USD of C, AAFC
MILLIONS OF DOLLARS
Canola oil, meal , oilcake
Oat groats, meal and flakes
Linseed oil, meal, oilcake, fibre
Potatoes, frozen/products
Potatoes fresh, vegs, fresh pack/proc.
Barley, rolled, hulled etc., malt
Wheat flour
0 50 100 150 200 250 300 350 400 450 500 550 600
2012
2011
2010
2009
2008
2007
BY TYPE, 2007-2012
SELECTED MANITOBA PROCESSED CROP EXPORTS
Data source: US Dof C, AAFC
14
Feed industry: Principal inputs for the province's feed industry are barley, feed wheat and canola meal. Smaller amounts of Manitoba-produced soy meal, corn and dry peas are also used. Industry sales fell from $583 million in 2006 to $401 million in 2008 and to about $380 million in 2012. Significant amounts of grain corn (322 thousand tonnes worth $83 million in 2012, down from 484 thousand tonnes in 2010 with a value of $68 million) as well as soybean oilcake and meal (302 thousand tonnes worth $129 million in 2012, up from 209 thousand tonnes worth $68 million in 2010) were imported from the United States to supplement local feed supplies, mainly for pigs. Oilseed crushing: Manitoba has three oilseed crushing plants. A Bunge Ltd. (was CanAmera Foods) plant is located in Altona and another in Harrowby on the Saskatchewan border. Most of the canola crushed in Altona comes from Manitoba. Output from the Altona plant, which has the capacity to crush about 2,500 tonnes of seed per day, includes bulk crude and refined oil, the new high-stability, high-oleic Nexera canola oil, bulk vegetable oil, retail pack refined oil, hulls and screenings. An oilseed crushing plant was built in Ste. Agathe in 1997, but was out of production for most of the time until January 2005, when the plant began crushing canola to produce oil and meal. One of the largest all natural, expeller-pressed oilseed crushing plants in the world, the plant was owned by Associated Proteins LP until June 25, 2009, when Associated Proteins became a subsidiary of Viterra Inc. The plant focuses on producing specialty oil products for niche markets. At peak capacity, the plant can process 1,000 tonnes of canola per day and eventually could double capacity. Canola meal, a byproduct of oilseed crushing, is used for livestock feed. Much of the canola seed, oil and meal Manitoba produces is exported. Exports of canola oil fell from $489 million in 2008 to $311 million in 2009 and $285 million in 2010 due to smaller canola crops and/or lower prices. The value of canola oil exports rose to $397 million in 2011 and $388 million in 2012, mainly as a result of higher prices. Exports of other processed canola products and bi-products, such as meal and oilcake, amounted to $138 million in 2012 compared to $77 million in 2011 and almost $67 million in 2010. Potato processing: Over 85% of Manitoba's potato crop is used for processed foods, such as frozen French fries and hash browns, instant mashed potatoes and potato chips. One of four major Manitoba potato processing plants was built in Portage la Prairie by McCain Foods in 1977, the second plant in Portage la Prairie was completed in 2003 by J.R. Simplot Co., a third plant, located in Carberry, was built in 1962 and is owned by Simplot in partnership with Nesle Canada and the fourth plant is the Old Dutch Foods’ plant built in Winnipeg in 1956. A smaller food processing plant in Winnipeg, owned by Naleway Foods Ltd., began operating in the 1940s. Processed potato exports increased from $263 million in 2006 to $276 million in 2007, $295 million in 2008 and $324.9 million in 2009, but declined to $302.3 million in 2010 and $171.6 million in 2011 due to the smaller crops in 2010 and 2011. Exports in 2012 increased to $243.4 million.
15
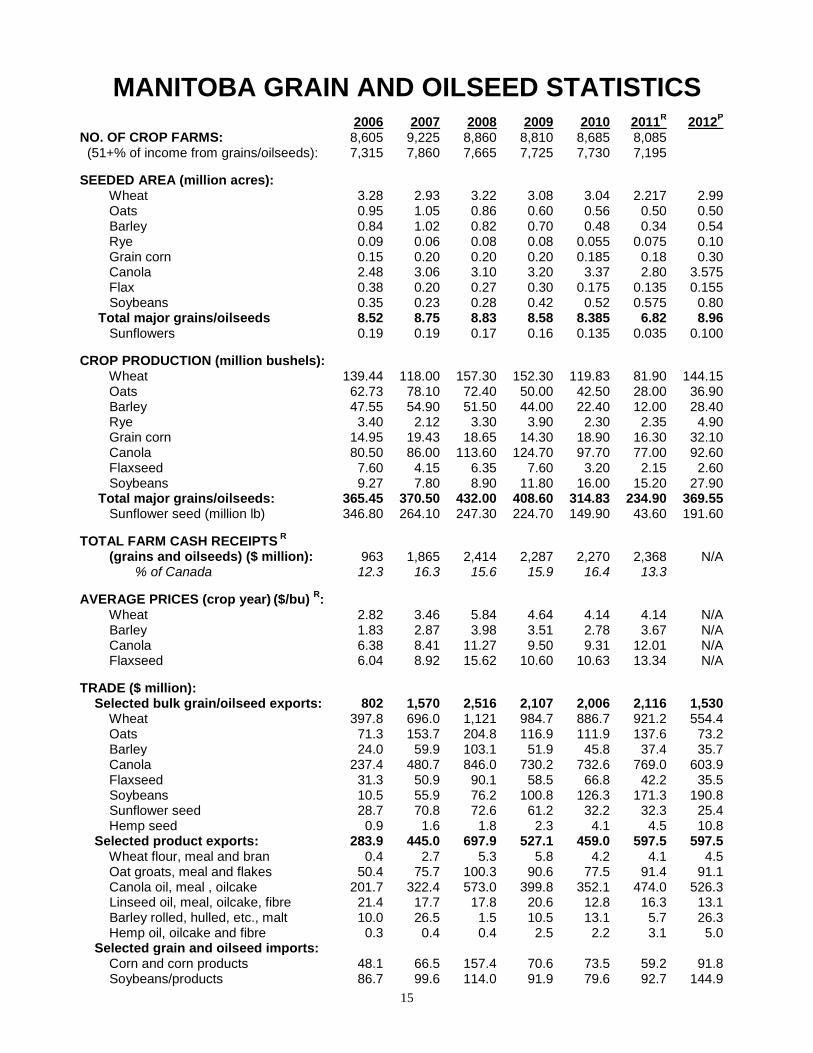
MANITOBA GRAIN AND OILSEED STATISTICS
2006 2007
2008
2009
2010
2011R
2012P
NO. OF CROP FARMS: 8,605 9,225 8,860 8,810 8,685 8,085 (51+% of income from grains/oilseeds): 7,315 7,860 7,665 7,725 7,730 7,195
SEEDED AREA (million acres): Wheat 3.28 2.93 3.22 3.08 3.04 2.217 2.99 Oats 0.95 1.05 0.86 0.60 0.56 0.50 0.50 Barley 0.84 1.02 0.82 0.70 0.48 0.34 0.54 Rye 0.09 0.06 0.08 0.08 0.055 0.075 0.10 Grain corn 0.15 0.20 0.20 0.20 0.185 0.18 0.30 Canola 2.48 3.06 3.10 3.20 3.37 2.80 3.575 Flax 0.38 0.20 0.27 0.30 0.175 0.135 0.155 Soybeans 0.35 0.23 0.28 0.42 0.52 0.575 0.80 Total major grains/oilseeds 8.52 8.75 8.83 8.58 8.385 6.82 8.96 Sunflowers 0.19 0.19 0.17 0.16 0.135 0.035 0.100
CROP PRODUCTION (million bushels): Wheat 139.44 118.00 157.30 152.30 119.83 81.90 144.15 Oats 62.73 78.10 72.40 50.00 42.50 28.00 36.90 Barley 47.55 54.90 51.50 44.00 22.40 12.00 28.40 Rye 3.40 2.12 3.30 3.90 2.30 2.35 4.90 Grain corn 14.95 19.43 18.65 14.30 18.90 16.30 32.10 Canola 80.50 86.00 113.60 124.70 97.70 77.00 92.60 Flaxseed 7.60 4.15 6.35 7.60 3.20 2.15 2.60 Soybeans 9.27 7.80 8.90 11.80 16.00 15.20 27.90 Total major grains/oilseeds: 365.45 370.50 432.00 408.60 314.83 234.90 369.55 Sunflower seed (million lb) 346.80 264.10 247.30 224.70 149.90 43.60 191.60
TOTAL FARM CASH RECEIPTS R
(grains and oilseeds) ($ million): 963 1,865 2,414 2,287 2,270 2,368 N/A % of Canada 12.3 16.3 15.6 15.9 16.4 13.3
AVERAGE PRICES (crop year) ($/bu)
R:
Wheat
2.82 3.46 5.84 4.64 4.14 4.14 N/A
Barley 1.83 2.87 3.98 3.51 2.78 3.67 N/A
Canola 6.38 8.41 11.27 9.50 9.31 12.01 N/A
Flaxseed 6.04 8.92 15.62 10.60 10.63 13.34 N/A
TRADE ($ million): Selected bulk grain/oilseed exports: 802 1,570 2,516 2,107 2,006 2,116 1,530 Wheat 397.8 696.0 1,121 984.7 886.7 921.2 554.4 Oats 71.3 153.7 204.8 116.9 111.9 137.6 73.2 Barley 24.0 59.9 103.1 51.9 45.8 37.4 35.7 Canola 237.4 480.7 846.0 730.2 732.6 769.0 603.9 Flaxseed 31.3 50.9 90.1 58.5 66.8 42.2 35.5 Soybeans 10.5 55.9 76.2 100.8 126.3 171.3 190.8 Sunflower seed 28.7 70.8 72.6 61.2 32.2 32.3 25.4 Hemp seed 0.9 1.6 1.8 2.3 4.1 4.5 10.8 Selected product exports: 283.9 445.0 697.9 527.1 459.0 597.5 597.5 Wheat flour, meal and bran 0.4 2.7 5.3 5.8 4.2 4.1 4.5 Oat groats, meal and flakes 50.4 75.7 100.3 90.6 77.5 91.4 91.1 Canola oil, meal , oilcake 201.7 322.4 573.0 399.8 352.1 474.0 526.3 Linseed oil, meal, oilcake, fibre 21.4 17.7 17.8 20.6 12.8 16.3 13.1 Barley rolled, hulled, etc., malt 10.0 26.5 1.5 10.5 13.1 5.7 26.3 Hemp oil, oilcake and fibre 0.3 0.4 0.4 2.5 2.2 3.1 5.0 Selected grain and oilseed imports: Corn and corn products 48.1 66.5 157.4 70.6 73.5 59.2 91.8 Soybeans/products 86.7 99.6 114.0 91.9 79.6 92.7 144.9
16
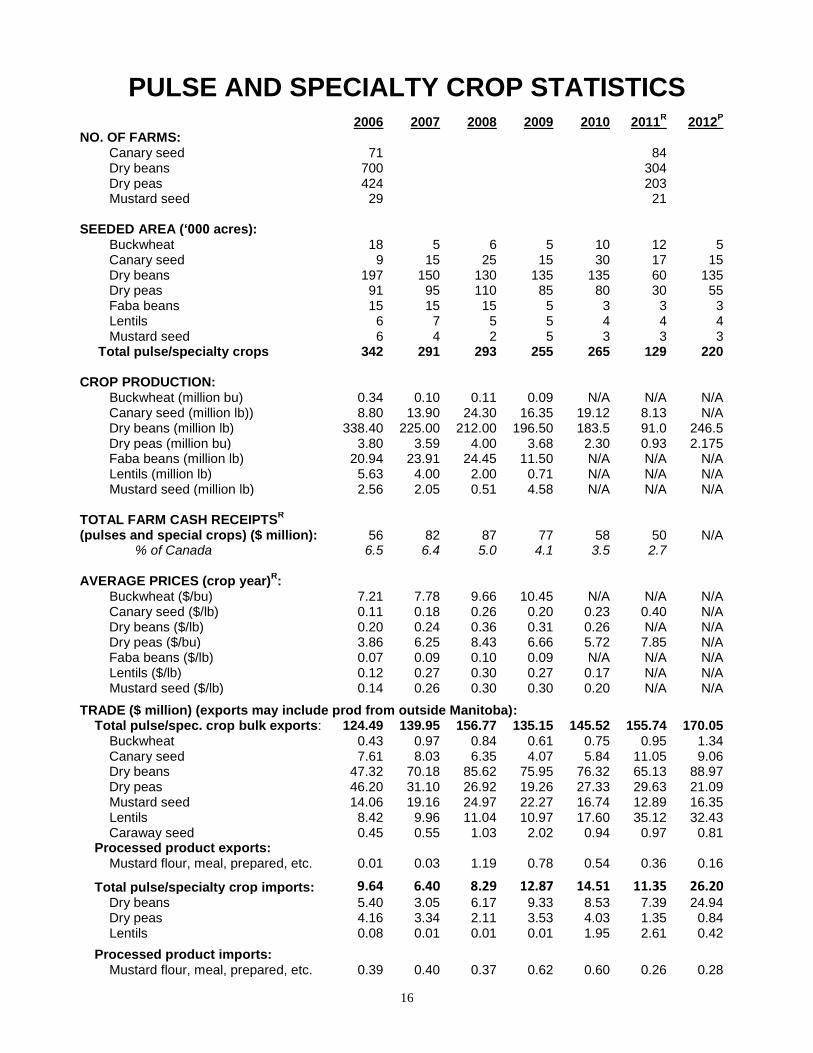
PULSE AND SPECIALTY CROP STATISTICS
2006 2007
2008
2009
2010
2011R
2012P
NO. OF FARMS: Canary seed 71 84 Dry beans 700 304 Dry peas 424 203 Mustard seed 29 21 SEEDED AREA (‘000 acres): Buckwheat 18 5 6 5 10 12 5 Canary seed 9 15 25 15 30 17 15 Dry beans 197 150 130 135 135 60 135 Dry peas 91 95 110 85 80 30 55 Faba beans 15 15 15 5 3 3 3
Lentils 6 7 5 5 4 4 4
Mustard seed 6 4 2 5 3 3 3
Total pulse/specialty crops 342 291 293 255 265 129 220 CROP PRODUCTION: Buckwheat (million bu) 0.34 0.10 0.11 0.09 N/A N/A N/A Canary seed (million lb)) 8.80 13.90 24.30 16.35 19.12 8.13 N/A Dry beans (million lb) 338.40 225.00 212.00 196.50 183.5 91.0 246.5 Dry peas (million bu) 3.80 3.59 4.00 3.68 2.30 0.93 2.175 Faba beans (million lb) 20.94 23.91 24.45 11.50 N/A N/A N/A
Lentils (million lb) 5.63 4.00 2.00 0.71 N/A N/A N/A
Mustard seed (million lb) 2.56 2.05 0.51 4.58 N/A N/A N/A
TOTAL FARM CASH RECEIPTS
R
(pulses and special crops) ($ million): 56 82 87 77 58 50 N/A % of Canada 6.5 6.4 5.0 4.1 3.5 2.7 AVERAGE PRICES (crop year)
R:
Buckwheat ($/bu) 7.21 7.78 9.66 10.45 N/A N/A N/A
Canary seed ($/lb) 0.11 0.18 0.26 0.20 0.23 0.40 N/A
Dry beans ($/lb) 0.20 0.24 0.36 0.31 0.26 N/A N/A
Dry peas ($/bu) 3.86 6.25 8.43 6.66 5.72 7.85 N/A
Faba beans ($/lb) 0.07 0.09 0.10 0.09 N/A N/A N/A
Lentils ($/lb) 0.12 0.27 0.30 0.27 0.17 N/A N/A
Mustard seed ($/lb) 0.14 0.26 0.30 0.30 0.20 N/A N/A
TRADE ($ million) (exports may include prod from outside Manitoba): Total pulse/spec. crop bulk exports: 124.49 139.95 156.77 135.15 145.52 155.74 170.05 Buckwheat 0.43 0.97 0.84 0.61 0.75 0.95 1.34 Canary seed 7.61 8.03 6.35 4.07 5.84 11.05 9.06 Dry beans 47.32 70.18 85.62 75.95 76.32 65.13 88.97 Dry peas 46.20 31.10 26.92 19.26 27.33 29.63 21.09 Mustard seed 14.06 19.16 24.97 22.27 16.74 12.89 16.35 Lentils 8.42 9.96 11.04 10.97 17.60 35.12 32.43 Caraway seed 0.45 0.55 1.03 2.02 0.94 0.97 0.81 Processed product exports: Mustard flour, meal, prepared, etc. 0.01 0.03 1.19 0.78 0.54 0.36 0.16
Total pulse/specialty crop imports: 9.64 6.40 8.29 12.87 14.51 11.35 26.20 Dry beans 5.40 3.05 6.17 9.33 8.53 7.39 24.94 Dry peas 4.16 3.34 2.11 3.53 4.03 1.35 0.84 Lentils 0.08 0.01 0.01 0.01 1.95 2.61 0.42
Processed product imports: Mustard flour, meal, prepared, etc. 0.39 0.40 0.37 0.62 0.60 0.26 0.28
17
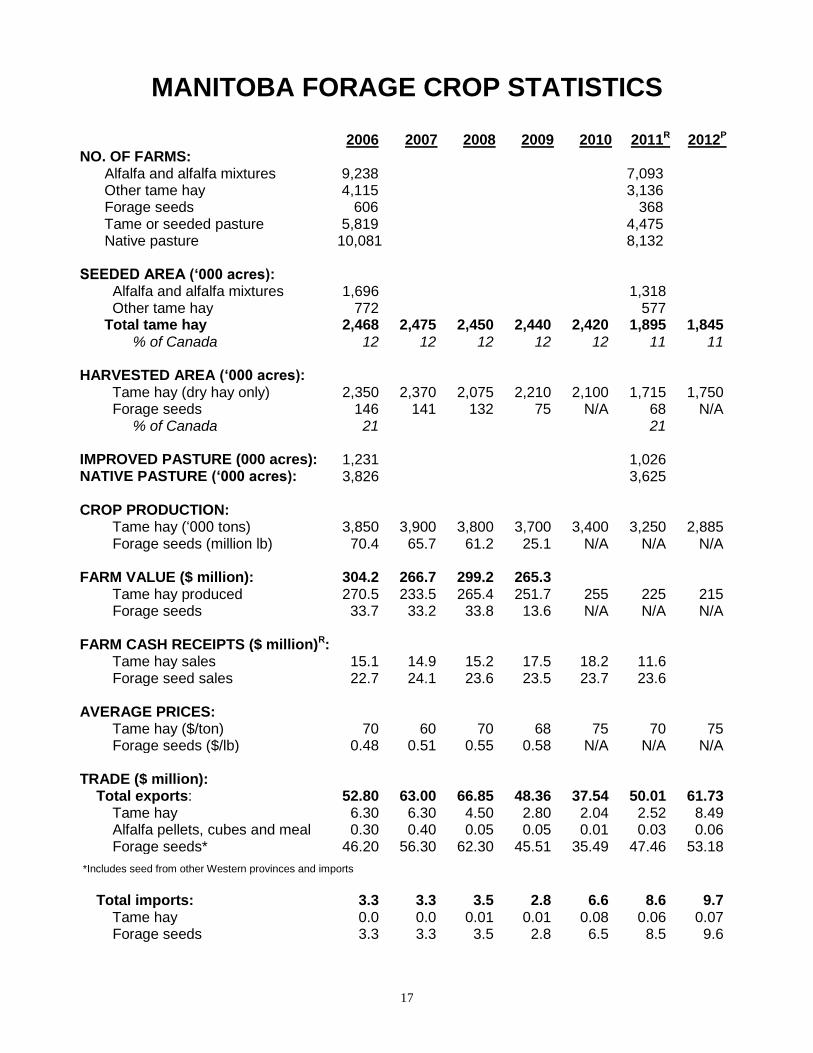
MANITOBA FORAGE CROP STATISTICS
2006 2007 2008 2009 2010
2011R
2012P NO. OF FARMS:
Alfalfa and alfalfa mixtures 9,238 7,093 Other tame hay 4,115 3,136 Forage seeds 606 368 Tame or seeded pasture 5,819 4,475 Native pasture 10,081 8,132 SEEDED AREA (‘000 acres): Alfalfa and alfalfa mixtures 1,696 1,318 Other tame hay 772 577 Total tame hay 2,468 2,475 2,450 2,440 2,420 1,895 1,845 % of Canada 12 12 12 12 12 11 11 HARVESTED AREA (‘000 acres): Tame hay (dry hay only) 2,350 2,370 2,075 2,210 2,100 1,715 1,750 Forage seeds 146 141 132 75 N/A 68 N/A % of Canada 21 21 IMPROVED PASTURE (000 acres): 1,231 1,026 NATIVE PASTURE (‘000 acres): 3,826 3,625 CROP PRODUCTION: Tame hay (‘000 tons) 3,850 3,900 3,800 3,700 3,400 3,250 2,885 Forage seeds (million lb) 70.4 65.7 61.2 25.1 N/A N/A N/A
FARM VALUE ($ million): 304.2 266.7 299.2 265.3 Tame hay produced 270.5 233.5 265.4 251.7 255 225 215 Forage seeds 33.7 33.2 33.8 13.6 N/A N/A N/A
FARM CASH RECEIPTS ($ million)R: Tame hay sales 15.1 14.9 15.2 17.5 18.2 11.6 Forage seed sales 22.7 24.1 23.6 23.5 23.7 23.6 AVERAGE PRICES: Tame hay ($/ton) 70 60 70 68 75 70 75 Forage seeds ($/lb) 0.48 0.51 0.55 0.58 N/A N/A N/A
TRADE ($ million): Total exports: 52.80 63.00 66.85 48.36 37.54 50.01 61.73 Tame hay 6.30 6.30 4.50 2.80 2.04 2.52 8.49 Alfalfa pellets, cubes and meal 0.30 0.40 0.05 0.05 0.01 0.03 0.06 Forage seeds* 46.20 56.30 62.30 45.51 35.49 47.46 53.18
*Includes seed from other Western provinces and imports
Total imports: 3.3 3.3 3.5 2.8 6.6 8.6 9.7 Tame hay 0.0 0.0 0.01 0.01 0.08 0.06 0.07 Forage seeds 3.3 3.3 3.5 2.8 6.5 8.5 9.6