Embed Size (px)
Citation preview

CROP PRODUCTS REPORTOctober 24, 1992
C r o p P r o d u c t N a m e P r i c e U n i t W e i g h t C a s hp e r o f p e r F l o wU n i t M e s . U n i t R o w
P E A C H E S W H O L S A L E 1 2 . 5 0 0 0 b u 6 0 . 0 0 0 0 2 0P E C A N S I M P R O V E D . 8 0 0 0 l b s 1 . 0 0 0 0 2 0
/0^\
Information presented is prepared solely as a general guide and is not Intended to recognise or predict the costsand returns from any one part icular farm or ranch operation. These projections were col lected and developed bystaff members of the Texas Agricul tural Extension Service and approved for publ icat ion.
C4.85

TRACTORS, IMPLEMENTS AND EQUIPMENTOCTOBER 24, 1992
DESCRIPTION
FIRST NAHEQUALIFYING NAHEHORSEPOHER RATING (HP)USEFUL LIFE (HR OR HI)FUEL TYPEREHAINING LIFE (HR OR HI)FUEL CON. (UNIT/HR OR /HI)ANNUAL USE (HR OR HI)S P E E D ( H I / H )H I D T H ( F T )FIELD EFFICIENCY (%)C A P A C I T Y ( A C / H R )POHER UNIT HULTIPLIERLABOR HULTIPLIERCURRENT LIST PRICE ($)S A LVA G E VA L U E ( X )CURRENT HARKET VALUE ($)L E A S E PAY H E N T ( $ )ANNUAL LICENSE & TAX ($)ANNUAL INSURANCE ($)ON FARH HIRED LABOR (HR)OFF FARH PARTS & LABOR ($)ON FARH OHNER LABOR (HR)ANNUAL USE BASE (HR OR HI)R E P A I R C O E F F I C I E N T 8 1 . 0 2 9D E P R E C I A T I O N F A C T O R 8 1 . 6 8Y E A R S O H N E D ,R E P A I R C O E F F I C I E N T 8 2 1 . 5D E P R E C I A T I O N F A C T O R 8 2 . 9 2CAPACITY (DEF..CALC.)F U E L U S E ( D E F . . C A L C . ) CR & H C A L C . ( 8 1 , 8 2 ) 2LEASE CALC. (HOUR,YEAR)
TRACTOR IHPLEHENT IHPLEHENT IHPLEHENT IHPLEHENT IHPLEHENT
TRACTOR DISC--TANDEH FERT. SPREADER SHREDDER SPRAYER SPRAYER40 HP 8 FT AIRBLAST HYDRO.
40 30 20 20 30 3012000 2500 1200 2000 1200 1200
DI12000 2500 1200 2000 1200 1200
360 100 50 50 75 2004.5 4 4 4.8 4.8
8 20 6.7 24 1980 67 85 50 50
1.1 1.1 1.1 1.1 1.11.2 1.2 1.2 1.2 1.2
15900 2200 60010
2400 7000 1750
14300 2200 600 2400 7000 1750
.364.610
1.3.885
CC2
.777.610
1.4.885
CC2
.23. 610
1.4.885
CC2
.777.610
1.4.885
CC2
.777.66
1.4.885
CC2
DESCRIPTION IHPLEHENT EQUIPHENT EQUIPHENT
FIRST NAHEQUALIFYING NAHEHORSEPOHER RATING (HP)USEFUL LIFE (HR OR HI)FUEL TYPEREHAINING LIFE (HR OR HI)FUEL CON. (UNIT/HR OR /HI)ANNUAL USE (HR OR HI)S P E E D ( H I / H )H I D T H ( F T )FIELD EFFICIENCY (X)C A P A C I T Y ( A C / H R )POHER UNIT HULTIPLIERLABOR HULTIPLIERCURRENT LIST PRICE ($)S A LVA G E VA L U E ( % )CURRENT HARKET VALUE ($)L E A S E PAY H E N T ( $ )ANNUAL LICENSE & TAX ($)ANNUAL INSURANCE ($)ON FARH HIRED LABOR (HR)OFF FARH PARTS & LABOR ($)ON FARH OHNER LABOR (HR)ANNUAL USE BASE (HR OR HI)REPAIR COEFFICIENT #1DEPRECIATION FACTOR #1YEARS OHNEDREPAIR COEFFICIENT 82DEPRECIATION FACTOR 82CAPACITY (DEF..CALC.)FUEL USE (DEF..CALC.)R & H C A L C . ( 8 1 , 8 2 )LEASE CALC. (HOUR,YEAR)
TRAILERFLATBED
11800
1800
120
851
1.11
1300
1300
.105.610
1.4.885
DC2
COOLERSTORAGE
7500EL
75001
504
2600
2600
130
504
PICKING BOXESPEACHES
1800
18001
120
400
400
20
120
Information presented is prepared solely as a general guide and Is not Intended to recognise or predict the costsand returns from any one part icular farm or ranch operation. These projections were collected and developed bystaff members of the Texas Agricultural Extension Service and approved for publ icat ion.
C4.86

OPERATING INPUT RESOURCESOctober 24, 1992
j f * \
Operat ing Input P r i c e Uni t Cashper o f Flow
U n i t Measure RowBACTERIAL SPOT .553 appl 45BORER CONTROL 6.684 appl 45CONTAINERS PEACH .42 each 55DORMANT SEASON 14.00 appl 45FIFTH COVER 9.926 appl 45FIRST COVER 9.926 appl 45FOURTH COVER 9.926 appl 45FULL BLOOM 4.85 appl 45FUNGICIDE PECAN 12.59 lbs 45HARVESTING LABOR 3.75 hour 38HERB,POST-EMERGE TREES 18.74 acre 45HERB,PRE-EMERGE NEW TREE 61.00 acre 45HERB,PRE-EMERGE TREE 67.75 acre 45INSECT. WEEVIL PECAN 3.625 lbs 45INSECTICIDE PECAN 3.625 p t s 45NITROGEN .26 lbs 44PEACH TREE 2.50 t r e e 43PECAN TREE 6 FT 6.25 each 43PETAL FALL 9.926 appl 45PHOSPHORUS .25 lbs 44PINK BUD • 9.926 appl 45PLANTING LABOR 3.75 hour 38POTASSIUM . 10 l bs 44PREHARVEST SPRAY 1ST CROP 10.729 appl 45PREHARVEST SPRAY 2ND CROP 10.729 appl 45PREHARVEST SPRAY 3RD CROP 10.729 appl 45PRUNING LABOR 3.75 hour 38SECOND COVER 9.926 appl 45SEVENTH COVER 9.926 appl 45SHUCK SPLIT 9.926 appl 45SIXTH COVER 9.926 appl 45THINNING LABOR 3.75 hour 38THIRD COVER 9.926 appl 45ZINC .642 lbs 45
Information presented Is prepared solely as a general guide and Is not intended to recognise or predict the costsand returns from any one part icular farm or ranch operation. These projections were col lected and developed bystaff members of the Texas Agricul tural Extension Service and approved for publ icat ion.
C4.87

AUTO OR TRUCK RESOURCESOCTOBER 24, 1992
DESCRIPTION AUTO OR TRUCK
FIRST NAHEQUALIFYING NAHEHORSEPOHER RATING (HP)USEFUL LIFE (HR OR HI)FUEL TYPEREHAINING LIFE (HR OR HI)FUEL CON. (UNIT/HR OR /HI)ANNUAL USE (HR OR HI)S P E E D ( H I / H )H I D T H ( F T )FIELD EFFICIENCY (X)C A P A C I T Y ( A C / H R )POHER UNIT HULTIPLIERLABOR HULTIPLIERCURRENT LIST PRICE ($)S A LVA G E VA L U E ( X )CURRENT HARKET VALUE <$)L E A S E PAY H E N T ( $ )ANNUAL LICENSE & TAX ($)ANNUAL INSURANCE ($)ON FARH HIRED LABOR (HR)OFF FARH PARTS & LABOR ($)ON FARH OHNER LABOR (HR)ANNUAL USE BASE (HR OR HI)REPAIR COEFFICIENT #1DEPRECIATION FACTOR #1YEARS OHNEDREPAIR COEFFICIENT 82DEPRECIATION FACTOR #2CAPACITY (DEF..CALC.)FUEL USE (DEF..CALC.)R & H C A L C . ( 8 1 , 8 2 )LEASE CALC. (HOUR,YEAR)
PICKUP TRUCK3/4 TON
84000GA
8400015
2100030
1300016.7
11000
75600
315
21000
Information presented is prepared solely as a general guide and is not intended to recognise or predict the costsand returns from any one part icular farm or ranch operation. These projections were col lected and developed bystaff members of the Texas Agricultural Extension Service and approved for publ icat ion.
C4 .88
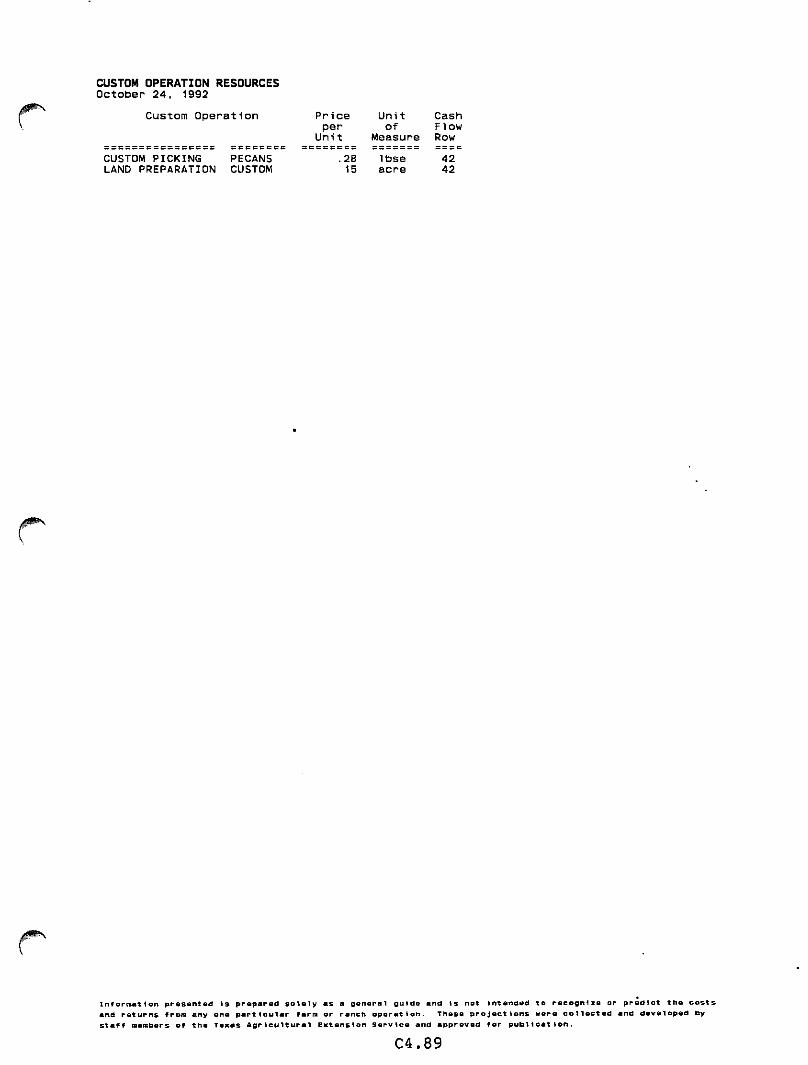
CUSTOM OPERATION RESOURCESOctober 24, 1992
Custom Operation
================ ========CUSTOM PICKING PECANSLAND PREPARATION CUSTOM
Pr iceper
U n i t
U n i to f
Measure
CashFlowRow======= == = =
.2815
Ibseac re
4242
/0^\
Information presented is prepared solely as a general guide and is not Intended to recognise or predict the costsand returns from any one part icular farm or ranch operation. These projections were col lected and developed byStaff members of the Texas Agricultural Extension Service and approved for publ icat ion.
C4.89

LABOR RESOURCESOCTOBER 24, 1992
DESCRIPTION OTHER LABOR OTHER LABORFIRST NAHE OPERATOR LABOR OTHER LABORQUALIFYING NAHEC O S T O R V A L U E ( S / H R ) 4 . 5 4 . 5TOTAL HAGE BENEFITS (X)L A B O R T Y P E ( A , B ) B A
- ^ ^
Information presented Is prepared solely as a general guide and is not intended to recognise or predict the costsand returns from any one part icular farm or ranch operation. These projections were collected and developed bystaff membors of the Texas Agricultural Extension Service and approved for publ icat ion.
C4.90

J P N
LAND RESOURCESOCTOBER 24, 1992
D E S C R I P T I O N L A N D
FIRST NAHE LAND RENTQUALIFYING NAHE CROPLANDHARKET VALUE ($/AC)PROPERTY TAX ($/AC)APPRECIATION RATE (%)INTEREST RATE (X)ANNUAL LEASE ($/AC) 25APP. CALCUATIONS (Y,N) N
Information presented Is prepared solely as a general guide and is not Intended to recognise or predict the costsand returns from any one part icular farm or ranch operation. These projections were collected and developed bystaff members of the Texas Agricultural Extension Service and approved for publ icat ion.
C4.91

PERENNIAL CROP RESOURCESOCTOBER 24, 1992
DESCRIPTION PERENNIAL CROP PERE•NNIAL CROP PERE;nnial crop pere'NNIAL CROP PERE'NNIAL CROP PERENNIAL CROP
FIRST NAHE PEACH PEACH PEACH PEACH PEACH PEACHIRQUALIFYING NAHE 1 1A 2 2A 3A 1HARKET VALUE ($/AC) 597.67 597.67 504.80 504.80 540.79 1075.08PROPERTY TAX ($/AC)REHAINING LIFE (YR) 12 12 12 12 12 12SALVAGE VALUE (%) 100 100 100APPRECIATION RATE (%>INTEREST RATE (X) 4.5 4.5 4.5 4.5 4.5 4.5ANNUAL LEASE ($/AC)APP. CALCUATIONS (Y,N) N N N N N N
DESCRIPTIONFIRST NAHEQUALIFYING NAHEHARKET VALUE ($/AC)PROPERTY TAX ($/AC)REHAINING LIFE (YR)SALVAGE VALUE (X)APPRECIATION RATE (%)INTEREST RATE (X)ANNUAL LEASE ($/AC)APP. CALCUATIONS (Y,N)
PERENNIAL CROP PERENNIAL CROP PERENNIAL CROP PERENNIAL CROP PERENNIAL CROP PERENNIAL CROP
PEACHIR1A
1075.08
12
4.5
N
PEACHIR2
878.12
12100
4.5
N
PEACHIR2A
878.12
12
4.5
N
PEACHIR3A
457.55
12
4.5
N
PECAN1
803.52
20100
4.5
N
PECAN1A
803.52
11
4.5
N
DESCRIPTION PERENNIAL CROP PERENNIAL CROP PERENNIAL CROPBBKSBBSBaranammsBmtaBB namooinm
FIRST NAHEQUALIFYING NAHEHARKET VALUE ($/AC)PROPERTY TAX ($/AC)REHAINING LIFE (YR)SALVAGE VALUE (%)APPRECIATION RATE (X)INTEREST RATE <%)ANNUAL LEASE ($/AC)APP. CALCUATIONS (Y,N)
PECAN4
506.8720
100
4.5N
PECAN4A
506.8711
4.5N
PECAN9A
361.0711
4.5N
^ " \
Information presented is prepared solely as a general guide and 1s not intended to recognise or predict the costsand returns from any one part icular farm or ranch operation. These projections were collected and developed bystaff members of the Texas Agricultural Extension Service and approved for publ icat ion.
C4.92

BUILDINGS OR IMPROVEMENTS RESOURCESOCTOBER 24, 1992
D E S C R I P T I O N B U I L D . O R I H P.
F I R S T N A H E S H E DQUALIFYING NAHEFUEL - UTILITY COST ($/YR)R E H A I N I N G L I F E ( Y R ) 1 5C U R R E N T H A R K E T VA L U E ( $ ) 4 0 0 0S A LVA G E VA L U E ( X )PROPERTY TAXES ($/YR)A N N U A L L E A S E ( $ )ON FARH HIRED LABOR (HR)O F F FA R H PA RT S & L A B O R ( $ ) 1 0 0ON FARH OHNER LABOR (HR)LEASE CALC. (ANNUAL)
Information presented is prepared solely as a general guide and is not Intended to recognise or predict the costsand returns from any one part icular farm or ranch operation. These projections were col lected and developed bystaff members of the Texas Agricultural Extension Service and approved for publ icat ion.
C4.93

IRRIGATION EQUIPMENTOCTOBER 24, 1992
DESCRIPTION
FIRST NAHEQUALIFYING NAMEHORSEPOHER RATING (HP)FUEL TYPEFUEL CON. (UNIT/HR OR /HI)USEFULL LIFE (HR)REHAINING LIFE (HR)EFFICIENCY (%)HIRED LABOR PER SET (HR)OHNER LABOR PER SET (HR)NUHBER OF SETSCURRENT LIST PRICE ($)SALVAGE PERCENT (X)CURRENT HARKET VALUE ($)LEASE PAYHENT ($)ON FARH HIRED LABOR (HR)OFF FARH PARTS & LABOR ($)ON FARH OHNER LABOR (HR)ANNUAL USE BASE (HR)R & H ENG. ESTIHATE (X)R & H C A L C . ( # 1 , # 2 )LEASE CALC. (HOUR,YEAR)FUEL USE ( DEF.,CALC.)
DIST. SYS. POHER
ELECT
PLANT
. MOTOR
PUHP P U H P 1HATER SOURCE
DRIP $300-1200/A CENT PUMP & FILT SUBHERSIBLE PUMP HELL 250 FT0 35 HP
35EL
15 60000 32000 40000 2015 60000
8732000
10040000
7020
2.25 NA NA NA NANA NA NA NA
126 NA NA NA NA25000 3500 500 3500 7500
25000 3500
2.52
500
4.02
3500
4.02
7500
'*"e\
Information presented Is prepared solely as a general guide and is not intended to recognise or predict the cost)and returns from any one part icular farm or ranch operation. These projections were collected and developed bystaff members of the Texas Agricultural Extension Service and approved for publ icat ion.
C4.94

MACHINERY COST REPORTOCTOBER 24, 1992
RESOURCE NAHE UNIT reBmrrmTTrrrrm VARIABLE EXPENSES ««»»»»»»«»»» =«» FIXED EXPENSES •==•»•= TOTALFUEL OPER. & OPER. CUSTOM REPAIR REPAIR HOURLY DEPREC. ANNUAL TAXES, EXPENSES& MANAGE. INPUT OPER. & MAINT. & HAINT. LEASE & LEASE LICENSE
L U B E L A B O R O F F F A R H L A B O R I N T E R E S T & I N S U R .
TRACTOR 40 HPSBBB a$/KR 1.871 0.000 0.000 0.000
connBao be0.277 0 .000 0.000 2.403 0 .000
- a u a » a s s0.263 4.814
DISC-TANDEH 8 FT $/HR 0.000 0.000 0.000 0.000 0.401 0 .000 0.000 3.377 0.000 0.146 3.924FERT. SPREADER $/HR 0.000 0.000 0.000 0.000 0.141 0 .000 0.000 1.842 0.000 0.079 2.062SHREDDER $/HR 0.000 0.000 0.000 0.000 0.167 0 .000 0.000 7.369 0.000 0.318 7.853SPRAYER AIRBLAST S/HR 0.000 0.000 0.000 0.000 1.930 0 .000 0.000 14.328 0.000 0.618 16.876SPRAYER HYDRO. S/HR 0.000 0 .000 0.000 0.000 0 .714 0 .000 0.000 1.720 0.000 0.058 2.492TRAILER FLATBED S/HR 0.000 0 .000 0.000 0.000 0.058 0 .000 0.000 1.663 0.000 0.072 1.793COOLER STORAGE S/HR 0.105 0.000 0.000 0.000 0.258 0 .000 0.000 0.950 0 .000 0.034 1.346PICKING BOXES PEACHES S/HR 0.000 0 .000 0.000 0.000 0.167 0 .000 0.000 0.612 0.000 0.022 0.801PICKUP TRUCK 3/4 TON S/HI 0.078 0 .000 0.000 0.000 0.015 0 .000 0.000 0.166 0 .000 0.032 0.290
TRACTOR 40 HP $/AC 0.280 0 .914 0.000 0.000 0.047 0.000 0.000 0.410 0 .000 0.045 1.695FERT. SPREADER $/AC 0.000 0 .000 0.000 0.000 0.022 0.000 0 .000 0.283 0 .000 0.012 0.317
APPLY FERTILIZER $/AC 0.280 0 .914 0 .000 0.000 0.068 0.000 0 .000 0.693 0 .000 0.057 2.012
TRACTOR 40 HP $/AC 0.647 1.701 0 .000 0.000 0.087 0.000 0 .000 0.778 0 .000 0 .083 3.296DISC-TANDEH 8 FT $/AC 0.000 0.000 0 .000 0.000 0.115 0.000 0 .000 0.967 0 .000 0.042 1.124
DISCING S/AC 0.647 1.701 0 .000 0.000 0.202 0.000 0 .000 1.745 0 .000 0 .125 4.420
TRACTOR 40 HP $/AC 0 . 2 11 4.950 0 .000 0.000 0.304 0.000 0 .000 2.686 0 .000 0.289 8.440TRAILER FLATBED S/AC 0.000 0.000 0 .000 0.000 0.058 0.000 0 .000 1.663 0 .000 0.072 1.793
HAULING PEACHES $/AC 0 . 2 11 4.950 0.000 0.000 0.363 0.000 0 .000 4.349 0 .000 0.361 10.233
TRACTOR 40 HP S/AC 0.658 2.151 0.000 0.000 0.110 0.000 0 .000 0.986 0 .000 0.105 4.009SHREDDER $/AC 0.000 0.000 0.000 0.000 0.060 0.000 0 .000 2.669 0 .000 0.115 2.844
SHREDDING S/AC 0.658 2.151 0.000 0.000 0.170 0.000 0 .000 3 .654 0 .000 0.220 6.853
TRACTOR 40 HP $/AC 0.323 0.851 0.000 0.000 0.044 0.000 0 .000 0.411 0.000 0.041 1.670SPRAYER AIRBLAST $/AC 0.000 0.000 0.000 0.000 0.276 0.000 0 .000 2 .052 0.000 0.088 2.417
SPRAYING AIRBLAST $/AC 0.323 0.851 0.000 0 .000 0.320 0.000 0 .000 2 .463 0.000 0.130 4.087
TRACTOR 40 HP $/AC 0.408 1.075 0.000 0 .000 0.055 0 .000 0 .000 0.495 0.000 0.052 2.085SPRAYER HYDRO. $/AC 0.000 0.000 0.000 0 .000 0.129 0 .000 0 .000 0.311 0.000 0.010 0.451
SPRAYING HYDRO. $/AC 0.408 1.075 0.000 0 .000 0.184 0.000 0 .000 0.806 0.000 0.063 2.536
Information presented is prepared solely as a general guide and is not intended to recognise or predict the costsand returns from any one part icular farm or ranch operation. These projections were col lected and developed bystaff members of the Texas Agricultural Extension Service and approved for publ icat ion.
C4.95
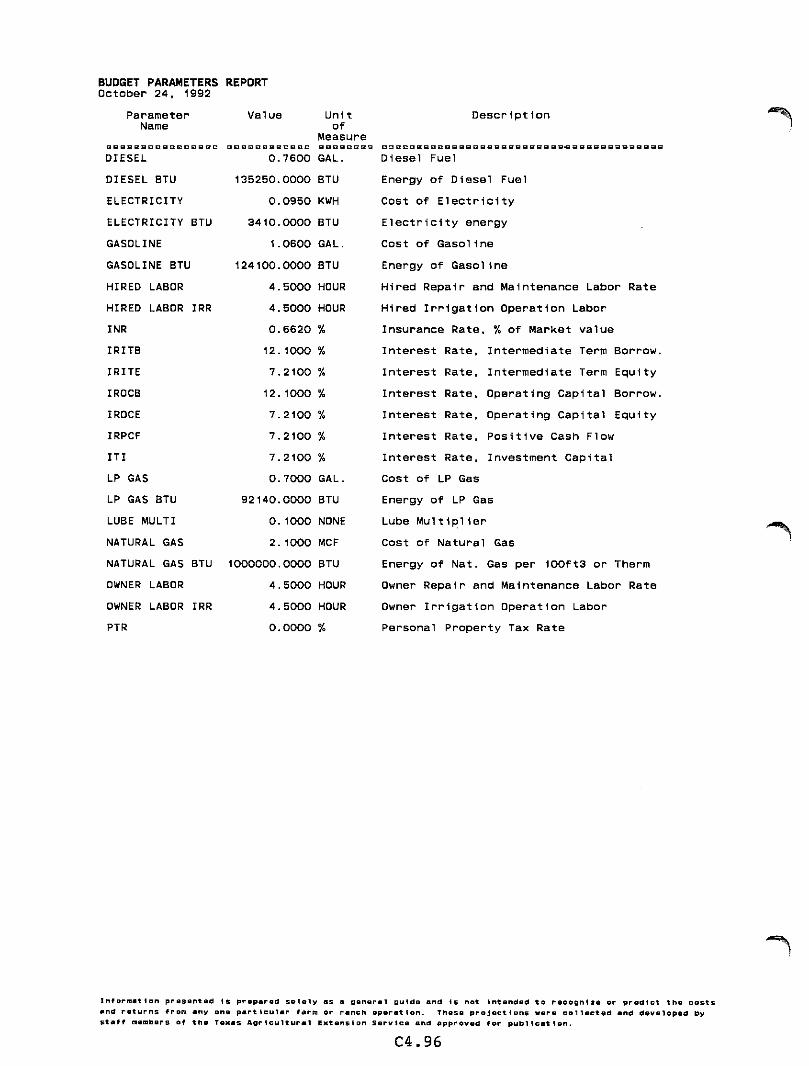
BUDGET PARAMETERS REPORTOctober 24, 1992
ParameterName
DIESEL
Value
============0.7600
U n i to f
MeasureGAL.
DIESEL BTU 135250.0000 BTUELECTRICITY 0.0950 KWHELECTRICITY BTU 3410.0000 BTUGASOLINE 1.0600 GAL.GASOLINE BTLI 124100.0000 BTUHIRED LABOR 4.5000 HOURHIRED LABOR IRR 4.5000 HOURINR 0.6620 %IRITB 12.1000 %IRITE 7.2100 %IROCB 12.1000 %IROCE 7.2100 %IRPCF 7.2100 %ITI 7.2100 %LP GAS 0.7000 GAL.LP GAS BTU 92140.0000 BTULUBE MULTI 0.1000 NONENATURAL GAS 2.1000 MCFNATURAL GAS BTU 1000000.0000 BTUOWNER LABOR 4.5000 HOUROWNER LABOR IRR 4.5000 HOURPTR 0.0000 %
D e s c r i p t i o n
Diesel Fuel
Energy of Diesel FuelC o s t o f E l e c t r i c i t y
E l e c t r i c i t y e n e r g yCost of Gasoline
Energy of GasolineHired Repair and Maintenance Labor Rate
H i red I r r i ga t ion Opera t ion LaborInsurance Rate, % of Market valueInterest Rate, Intermediate Term Borrow.Interest Rate, In termediate Term Equi ty
Interest Rate, Operat ing Capi ta l Borrow.In teres t Rate , Opera t ing Cap i ta l Equ i tyInterest Rate, Posi t ive Cash FlowInterest Rate , Investment Capi ta lCost of LP Gas
Energy of LP GasLube Mu l t i p l i e rCost of Natural Gas
Energy of Nat. Gas per 100ft3 or ThermOwner Repair and Maintenance Labor RateOwner I r r igat ion Operat ion LaborPersonal Property Tax Rate
< y * y \
Information presented Is prepared solely as a general guldo and is not intended to recognise or predict the costsand returns from any one part icular farm or ranch operation. These projections were collected and developed bystaff members of the Texas Agricultural Extension Service and approved for publ icat ion.
C4.96

r

* " >
D
-1

B-124KL04)TEXAS AGRICULTURAL EXTENSION SERVICE . THE TEXAS A&M UNIVERSITY SYSTEM
Z e r l e L . C a r p e n t e r , D i r e c t o r . C o l l e g e S t a t i o n . Te x a s
r TEXAS LIVESTOCK ENTERPRISE BUDGETS
NORTH CENTRAL TEXAS DISTRICTProjected for 1992
r
Data collected and submitted by Dr. Kenneth W. Stokes
E d u c a t i o n a l p r o g r a m s c o n d u c t e d b y t h e Te x a s A g r i c u l t u r a l E x t e n s i o n S e r v i c e s e r v e p e o p l e o f a l l a g e s r e g a r d l e s s o f s o c i oe c o n o m i c l e v e l , r a c e , c o l o r , s e x , r e l i g i o n o r n a t i o n a l o r i g i n .
C o o p e r a t i v e E x t e n s i o n W o r k I n A g r i c u l t u r e a n d H o m e E c o n o m i c s , T h e Te x a s A S M U n i v e r s i t y S y s t e m a n d t h e U n i t e d S t a t e sD e p a r t m e n t o f A g r i c u l t u r e c o o p e r a t i n g . D i s t r i b u t e d i n f u r t h e r a n c e o f t h e A c t s o f C o n g r e s s o f H a y S , 1 9 1 4 , a s a m e n d e d ,and June 30, 19 14.ISO - 12-91 , New

~ )
"1
■ >

P r o j e c t i o n s f o r P l a n n i n g P u r p o s e s O n l y B - 1 2 4 1 ( L 0 4 )Not to be Used without Updating after October 24, 1992.
COW-CALF PRODUCTION IMPROVED PASTURES 40 COW HERDNor th Cent ra l Texas Dis t r ic t (4 )
1992 Projected Costs and Returns per Head=============================================-==========================__-=-- yourP R O D U C T I O N D e s c r i p t i o n Q u a n t i t y U n i t $ / U n i t R e t u r n E s t i m a t e
C U L L C O W S B E E F O . I O H d 9 . 0 0 0 c w t . 4 7 . 5 0 0 0 4 2 . 7 5H E I F E R C A L V E S 0 . 2 8 H d 4 . 5 0 0 c w t . 8 5 . 0 0 0 0 1 0 7 . 1 0 "S T E E R C A L V E S 0 . 4 3 H d 4 . 8 0 0 c w t . 9 5 . 0 0 0 0 1 9 6 . 0 8
T o t a l G R O S S I n c o m e 3 4 5 . 9 3OPERATING INPUT or CUSTOM OPERATION
D e s c r i p t i o n I n p u t U s e U n i t $ / U n i t C o s tH A Y B E R M U D A 2 4 . 7 5 0 c w t . 3 . 0 0 0 7 4 . 2 5M I S C E L L A N E O U S C O W - C A L F 1 . 0 0 0 h e a d 1 0 . 0 0 0 1 0 . 0 0P A S T U R E B E R M U D A 1 . 8 0 0 a c r e 3 7 . 3 2 0 6 7 . 1 8S A L E S C O M M I S S I O N C U L L C O W 0 . 9 0 0 c w t . 1 . 2 5 0 1 . 1 3 'S A L E S C O M M I S S I O N S T O C K E R 3 . 1 8 0 c w t . 2 . 0 0 0 6 . 3 6 'S A L T & M I N E R A L S 0 . 4 9 0 c w t . 7 . 9 3 0 3 . 8 9S U P P L E M E N T 1 . 5 0 0 c w t . 1 0 . 7 5 0 1 6 . 1 3V E T . M E D I C I N E C O W - C A L F 1 . 0 0 0 h e a d 7 . 0 0 0 7 . 0 0F u e l - 5 . 9 2L u b e 0 . 5 9R e p a i r 3 . 1 8
T o t a l O P E R A T I N G I N P U T a n d C U S T O M O P E R A T I O N C o s t s 1 9 5 . 6 1Res idua l re turns to cap i ta l , ownersh ip
l a b o r , l a n d , m a n a g e m e n t , a n d p r o fi t 1 5 0 . 3 2C A P I T A L I N V E S T M E N T D e s c r i p t i o n Q u a n t i t y U n i t R a t e o f C o s t
I n v e s t e d R e t u r nI n t e r e s t - I T B o r r o w e d 1 0 9 9 . 2 9 4 D o l . 0 . 1 2 1 1 3 3 . 0 0I n t e r e s t - O C B o r r o w e d 1 3 1 . 0 3 5 D o l . 0 . 1 2 1 1 5 . 8 6I n t e r e s t - O C E a r n e d - 3 . 0 3 3 D o l . 0 . 0 7 2 - 0 . 2 2
T o t a l C A P I T A L I N V E S T M E N T C o s t s 1 4 8 . 6 4Residual re turns to ownersh ip, labor,
l a n d , m a n a g e m e n t , a n d p r o fi t 1 . 6 8OWNERSHIP COST Descr ip t ion (Deprec ia t ion , Taxes , and Insurance) Cost
M a c h i n e r y a n d E q u i p m e n t 4 0 . 4 9L i v e s t o c k 1 7 . 3 7T o t a l O W N E R S H I P C o s t s 5 7 . 8 6==============================================================================R e s i d u a l r e t u r n s t o l a b o r , l a n d , m a n a g e m e n t , a n d p r o fi t - 5 6 . 1 9L A B O R C O S T D e s c r i p t i o n I n p u t U s e U n i t A v e r a g e C o s t
RateM a c h i n e r y a n d E q u i p m e n t 3 . 1 0 8 H r . 4 . 9 4 9 1 5 . 3 8O t h e r 5 . 4 0 0 H r . 5 . 0 0 0 2 7 . 0 0
T o t a l L A B O R C o s t s 4 2 . 3 8R e s i d u a l r e t u r n s t o l a n d , m a n a g e m e n t , a n d p r o fi t - 9 8 . 5 7L A N D C O S T D e s c r i p t i o n I n p u t U s e U n i t R a t e o f C o s t
ReturnBERMUDA PASTURE
A n n u a l L e a s e 1 . 8 0 0 A c r e 2 0 . 0 0 0 3 6 . 0 0NATIVE PASTURE
A n n u a l L e a s e 2 . 0 0 0 A c r e 8 . 0 0 0 1 6 . 0 0T o t a l L A N D C o s t s 5 2 . 0 0R e s i d u a l r e t u r n s t o m a n a g e m e n t a n d p r o fi t - 1 5 0 . 5 7
-WARNING- No Management Cost Specified
R e s i d u a l r e t u r n s t o p r o fi tTota l Pro jected Cost of Product ion
•150.57496.50
Information presented Is prepared solely as a general guide and Is not intended to recognise or predict the costsand returns from any one part icular farm or ranch operation. These project ions were col lected and developed bystaff members of the Texas Agricul tural Extension Service and approved for publ icat ion.
L4.1

Project ions for Planning Purposes OnlyNot to be Used without Updating after October 24, 1992,
Cow-Calf Production Improved Pastures 40 Cow HerdNor th Cent ra l Texas Dis t r ic t (4 )
1992 Projected Costs and Returns per Head
B-124KL04)
GROSS INCOME DescriptionC U L L C O W S B E E F 0.
0.0.
Quant -. 1 0 H d 9 ., 2 8 H d 4 ,. 4 3 H d 4 .
[ty_.000.500.800
U n i tcwt .cwt .cwt .
$ / Unit47.500085.OOOO95.OOOO
To t a l42.75
107.10196.08345.93
To t a l0 .262.52
74.25-0 .2215.8627.0010.0067. 180 .56
21.741.136 .363.89
16.137.00
253.63
YourEst imate
HEIFER CALVESSTEER CALVES
Total GROSS IncomeVARIABLE COST Description
B A R N H A YF E N C I N G O N E M I L EH A Y B E R M U D AInterest - EarnedInterest - OC BorrowedLIVESTOCK LABORMISCELLANEOUS COW-CALFP A S T U R E B E R M U D APENS & EQUIPMENTPICKUP TRUCK 3/4 TONSALES COMMISSIONCULL COWSALES COMMISSIONSTOCKERSALT & MINERALSSUPPLEMENTVET. MEDICINE COW-CALF
Total VARIABLE COSTBreak-Even Price, Total Variable Cost
GROSS INCOME minus VARIABLE COSTFIXED COST Description
Machinery and EquipmentL i ves tockLand
50.28 per cwt. Of STEER CALVES92.30
U n i t T o t a lAcreAcre
Total FIXED CostBreak-Even Price, Total Cost $ 167.95 per cwt. of STEER CALVES
Total of ALL Cost
NET PROJECTED RETURNS
103.7387.1452.00
s s s s s s s242.87
496.50•150.57
^
Information presented is prepared solely as a general guide and is not intended to recognise or predict the costsand returns from any one part icular farm or ranch operation. These projections were collected and developed bystaff members of the Texas Agricultural Extension Service and approved for publ icat ion.
L4.2
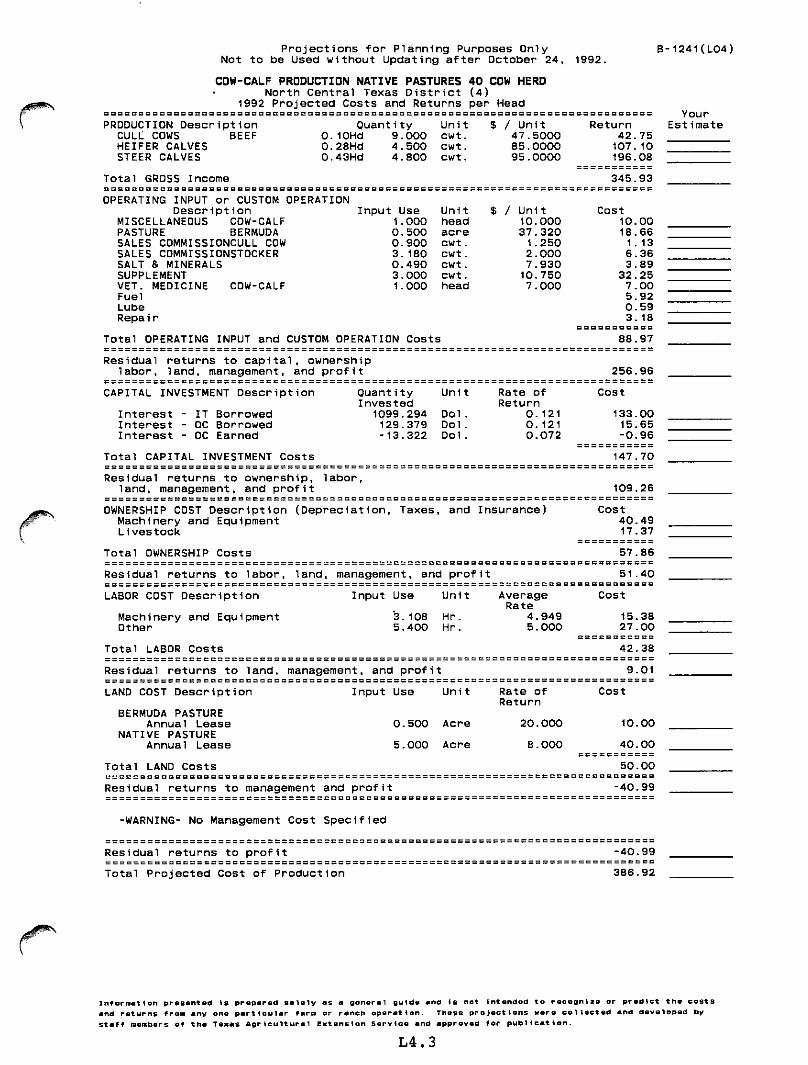
P r o j e c t i o n s f o r P l a n n i n g P u r p o s e s O n l y B - 1 2 4 1 ( L 0 4 )Not to be Used without Updating after October 24, 1992.
COW-CALF PRODUCTION NATIVE PASTURES 40 COW HERDNor th Cent ra l Texas D is t r i c t (4 )
1992 Projected Costs and Returns per Heads s s s = = s s c s s = s = s s s = = s s = = = = = c = = = s = = = = = = = = = = s = = = = = s s s s s s s s s s s s s s s s s s s s s s s s s s s s s s s Y O U TP R O D U C T I O N D e s c r i p t i o n Q u a n t i t y U n i t $ / U n i t R e t u r n E s t i m a t e
C U L L C O W S B E E F O . I O H d 9 . 0 0 0 c w t . 4 7 . 5 0 0 0 4 2 . 7 5H E I F E R C A L V E S 0 . 2 8 H d 4 . 5 0 0 c w t . 8 5 . 0 0 0 0 1 0 7 . 1 0S T E E R C A L V E S 0 . 4 3 H d 4 . 8 0 0 c w t . 9 5 . 0 0 0 0 1 9 6 . 0 8
T o t a l G R O S S I n c o m e 3 4 5 . 9 3OPERATING INPUT or CUSTOM OPERATION
D e s c r i p t i o n I n p u t U s e U n i t $ / U n i t C o s tM I S C E L L A N E O U S C O W - C A L F 1 . 0 0 0 h e a d 1 0 . 0 0 0 1 0 . 0 0P A S T U R E B E R M U D A 0 . 5 0 0 a c r e 3 7 . 3 2 0 1 8 . 6 6S A L E S C O M M I S S I O N C U L L C O W 0 . 9 0 0 c w t . 1 . 2 5 0 1 . 1 3S A L E S C O M M I S S I O N S T O C K E R 3 . 1 8 0 c w t . 2 . 0 0 0 6 . 3 6S A L T & M I N E R A L S 0 . 4 9 0 c w t . 7 . 9 3 0 3 . 8 9S U P P L E M E N T 3 . 0 0 0 c w t . 1 0 . 7 5 0 3 2 . 2 5V E T . M E D I C I N E C O W - C A L F 1 . 0 0 0 h e a d 7 . 0 0 0 7 . 0 0F u e l 5 . 9 2L u b e 0 . 5 9R e p a i r 3 . 1 8
T o t a l O P E R A T I N G I N P U T a n d C U S T O M O P E R A T I O N C o s t s 8 8 . 9 7Res idua l re turns to cap i ta l , ownersh ip
l a b o r , l a n d , m a n a g e m e n t , a n d p r o fi t 2 5 6 . 9 6C A P I T A L I N V E S T M E N T D e s c r i p t i o n Q u a n t i t y U n i t R a t e o f C o s t
I n v e s t e d R e t u r nI n t e r e s t - I T B o r r o w e d 1 0 9 9 . 2 9 4 D o l . 0 . 1 2 1 1 3 3 . 0 0I n t e r e s t - O C B o r r o w e d 1 2 9 . 3 7 9 D o l . 0 . 1 2 1 1 5 . 6 5I n t e r e s t - O C E a r n e d - 1 3 . 3 2 2 D o l . 0 . 0 7 2 - 0 . 9 6
T o t a l C A P I T A L I N V E S T M E N T C o s t s 1 4 7 . 7 0==============================================================================Residual re turns to ownersh ip, labor,
l a n d , m a n a g e m e n t , a n d p r o fi t 1 0 9 . 2 6OWNERSHIP COST Descr ip t ion (Deprec ia t ion , Taxes, and Insurance) Cost
M a c h i n e r y a n d E q u i p m e n t 4 0 . 4 9L i v e s t o c k 1 7 . 3 7T o t a l O W N E R S H I P C o s t s 5 7 . 8 6==============================================================================R e s i d u a l r e t u r n s t o l a b o r , l a n d , m a n a g e m e n t , a n d p r o fi t 5 1 . 4 0
L A B O R C O S T D e s c r i p t i o n I n p u t U s e U n i t A v e r a g e C o s tRate
M a c h i n e r y a n d E q u i p m e n t 3 . 1 0 8 H r . 4 . 9 4 9 1 5 . 3 8O t h e r 5 . 4 0 0 H r . 5 . 0 0 0 2 7 . 0 0
T o t a l L A B O R C o s t s 4 2 . 3 8R e s i d u a l r e t u r n s t o l a n d , m a n a g e m e n t , a n d p r o fi t 9 . 0 1==============================================================================L A N D C O S T D e s c r i p t i o n I n p u t U s e U n i t R a t e o f C o s t
ReturnBERMUDA PASTURE
A n n u a l L e a s e 0 . 5 0 0 A c r e 2 0 . 0 0 0 1 0 . 0 0NATIVE PASTURE
A n n u a l L e a s e 5 . 0 0 0 A c r e 8 . 0 0 0 4 0 . 0 0T o t a l L A N D C o s t s 5 0 . 0 0==============================================================================R e s i d u a l r e t u r n s t o m a n a g e m e n t a n d p r o fi t - 4 0 . 9 9
-WARNING- No Management Cost Specifieds s a s s s s s s s s s s s s s s s s s s s s s s s s s s s c s c s c :R e s i d u a l r e t u r n s t o p r o fi t===================================:Tota l Pro jected Cost of Product ion
-40.99: ss s c sc386.92
Information presented is prepared solely as a general guide and Is not Intended to recognise or predict the costsand returns from any one part icular farm or ranch operation. These projections were col lected and developed bystaff members of the Texas Agricultural Extension Service and approved for publ icat ion.
L4.3

Project ions for Planning Purposes OnlyNot to be Used without Updating after October 24, 1992,
Cow-Calf Production Native Pastures 40 Cow HerdNor th Cent ra l Texas Dis t r ic t (4 )
1992 Projected Costs and Returns per Head
B-1241(L04)
GROSS INCOME DescriptionC U L L C O W S B E E F 0 .
0 .0 .
Q u a n t i t y U n i t1 0 H d 9 . 0 0 0 c w t .2 8 H d 4 . 5 0 0 c w t .4 3 H d 4 . 8 0 0 c w t .
e C o s t $ - 1 . 8 3 p e
U n i t: s c s s
AcreAcre
114.85 per cwt . o f
$ / U n i t T o t a l4 7 . 5 0 0 0 4 2 . 7 58 5 . 0 0 0 0 1 0 7 . 1 09 5 . 0 0 0 0 1 9 6 . 0 8
345.93To t a l
0.262.52
-0 .9615.6527.0010.0018.660.56
21.741. 136.363.89
32.257 .00
146.05■r cwt. of STEER CALVES
199.88To t a l
103.7387.1450.00
s s s s s s s s s s s240.87
STEER CALVES
386.92-40.99
YourEst imate
HEIFER CALVESSTEER CALVES
Total GROSS Income
VARIABLE COST DescriptionB A R N H A Y
ari abl
COST
F E N C I N G O N E M I L EIn teres t - EarnedInterest - OC BorrowedLIVESTOCK LABORMISCELLANEOUS COW-CALFP A S T U R E B E R M U D APENS & EQUIPMENTPICKUP TRUCK 3/4 TONSALES COMMISSIONCULL COWSALES COMMISSIONSTOCKERSALT & MINERALSSUPPLEMENTVET. MEDICINE COW-CALF
Total VARIABLE COSTB r e a k - E v e n P r i c e , To t a l V i
GROSS INCOME minus VARIABLEFIXED COST Description
Machinery and Equipment
•>st $
L i ves tockLand
Total FIXED CostB r e a k - E v e n P r i c e , To t a l C t
Total of ALL CostNET PROJECTED RETURNS
^
Information presented Is prepared solely as a general guide and Is not intended to recognise or predict the costsand returns from any one part icular farm or ranch operation. These projections were collected and developed bystaff members of the Texas Agricultural Extension Service and approved for publ icat ion.
L4.4

s 0 ^ \
Project ions for Planning Purposes OnlyNot to be Used without Updating after October 24, 1992,
STOCKER STEERS (WHEAT GRAZING NOV-FEB 120 DAYS)Nor th Cent ra l Texas Dis t r ic t (4 )
1992 Projected Costs and Returns per HeadP R O D U C T I O N D e s c r i p t i o n Q u a n t i t y U n i t $ / U n i t
F E E D E R S T E E R S 6 7 0 L B . 0 . 9 8 H d 6 . 7 0 0 c w t . 8 4 . 0 0 0 0
B-1241(L04)
Total GROSS Income
Return551.54551.54
YourEst imate
OPERATING INPUT or CUSTOM OPERATIOND e s c r i p t i o n
H A Y B E R M U D AMISCELLANEOUS STOCKERP A S T U R E N A T I V ESALES COMMISSIONSTOCKERSALT & MINERALSSTOCKER STEERSSUPPLEMENTVET. MEDICINE STOCKERWHEAT $/CWT GAINFuelLubeRepa i r
Total OPERATING INPUT and CUSTOM OPERATION CostsRes idua l re turns to cap i ta l , ownersh ip
labor, land, management, and profitCAPITAL INVESTMENT Description
Input Use2.0001.0000.2506.7000.1884.8000.5001.0001.900
Uni tcwt .headacrecwt .cwt .cwt .cwt .headcwt .
$ / Unit3.0004 .0008 .0002.0007 .930
95.00010.7507.000
25.000
Cost6 .004 .002 .00
13.401.49
456.005 .387 .00
47.501.410. 140 .30
544.62
6 .93
I n t e r e s tI n t e r e s t
IT BorrowedOC Borrowed
n Q u a n t i t y U n i t R a t e o f C o s tInvested R e t u r n
143.170 Dol . 0 . 1 2 1 1 7 . 3 2320.183 Dol . 0 . 1 2 1 3 8 . 7 4
Total CAPITAL INVESTMENT Costs 5 6 . 0 6
•49.14Residual re turns to ownersh ip, labor,
land, management, and profit===============================================================:OWNERSHIP COST Description (Depreciation, Taxes, and Insurance)
Machinery and EquipmentTotal OWNERSHIP CostsResidual returns to labor, land, management, and profit
Cost15.2015.20
LABOR COST Description
Machinery and EquipmentOther
Input Use0.9171.900
U n i tH r.H r.
AverageRate4.8645.000
Total LABOR Costs================================================:Residual returns to land, management, and profit
-64.33:========Cost
4.469 .50
13.96-78.29
■WARNING- No Land Cost Specified
Residual returns to management and profit •78.29
•WARNING- No Management Cost Specified
R e s i d u a l r e t u r n s t o p r o fi tTota l Pro jected Cost of Product ion
-78 .29
629.84
Information presented Is prepared solely as a general guide and Is not Intended to recognise or predict the costsand returns from any one particular farm or ranch operation. These projections were.col leeted and developed bystaff members of the Texas Agricultural Extension Service and approved for publ icat ion.
L4.5

Project ions for Planning Purposes OnlyNot to be Used without Updating after October 24, 1992
Stocker Steers (Wheat Grazing Nov-Feb 120 Days)Nor th Cent ra l Texas Dis t r ic t (4 )
1992 Projected Costs and Returns per Head
B-124KL04)
GROSS INCOME DescriptionFEEDER STEERS 670 LB.
Total GROSS IncomeVARIABLE COST Description
H A Y B E R M U D AInterest - OC BorrowedLIVESTOCK LABORMISCELLANEOUS STOCKERP A S T U R E N A T I V EPENS & EQUIPMENTPICKUP TRUCK 3/4 TONSALES COMMISSIONSTOCKERSALT & MINERALSSTOCKER STEERSSUPPLEMENTVET. MEDICINE STOCKERWHEAT $/CWT GAIN
Total VARIABLE COSTBreak-Even Pr ice, Total Var iable Cost
GROSS INCOME minus VARIABLE COSTFIXED COST Description=================================
Machinery and EquipmentTotal FIXED Cost
Q u a n t i t y U n i t0 . 9 8 H d 6 . 7 0 0 c w t .
$ / U n i t T o t a l8 4 . 0 0 0 0 5 5 1 . 5 4
s s s s s s s s s s s551.54
To ta l6 .00
38.749 .504 .002.001.135.19
13.401.49
456.005.387 .00
47 .50s s s s s s s s s s s
597.3290.97 per cwt. of FEEDER STEERS
-45.77U n i t
Acre32.52
To t a ls s s s s s s s s s s
32.52
Break-Even Price, Total Cost $Total of ALL Cost
NET PROJECTED RETURNS
95.92 per cwt. Of FEEDER STEERS629.84
-78.29
YourEst imate
/S"*%
^ \
^ V
Information presented Is prepared solely as a general guide and is not Intended to recognise or predict the costsand returns from any one part icular farm or ranch operation. These projections were col lected and developed bystaff members of the Texas Agricultural Extension Service and approved for publ icat ion.
L4.6

/ f # s ^ N
P r o j e c t i o n s f o r P l a n n i n g P u r p o s e s O n l y B - 1 2 4 1 ( L 0 4 )Not to be Used without Updating after October 24, 1992.
STOCKER STEERS (WHEAT GRAZING NOV-MAY 210 DAYS)Nor th Cent ra l Texas Dis t r ic t (4 )
1992 Projected Costs and Returns per Heads = = = = = = = = = = = = = = = s = = = = = = s = = = = = = = = = = = = = = = = = = = = = = = = = = = = = : = = = = = = = = = = = = = = = = = = s = = = = s s Yo u rP R O D U C T I O N D e s c r i p t i o n Q u a n t i t y U n i t $ / U n i t R e t u r n E s t i m a t e
F E E D E R S T E E R S 8 4 0 L B . 0 . 9 8 H d 8 . 4 0 0 c w t . 7 7 . 0 0 0 0 6 3 3 . 8 6T o t a l G R O S S I n c o m e 6 3 3 . 8 6OPERATING INPUT or CUSTOM OPERATION
D e s c r i p t i o n I n p u t U s e U n i t $ / U n i t C o s tH A Y B E R M U D A 2 . 0 0 0 c w t . 3 . 0 0 0 6 . 0 0M I S C E L L A N E O U S S T O C K E R 1 . 0 0 0 h e a d 4 . 0 0 0 4 . 0 0P A S T U R E N A T I V E 0 . 2 5 0 a c r e 8 . 0 0 0 2 . 0 0S A L E S C O M M I S S I O N S T O C K E R 8 . 4 0 0 c w t . 2 . 0 0 0 1 6 . 8 0S A L T & M I N E R A L S 0 . 3 0 0 c w t . 7 . 9 3 0 2 . 3 8S T O C K E R S T E E R S 4 . 8 0 0 c w t . 9 5 . 0 0 0 4 5 6 . 0 0S U P P L E M E N T 0 . 5 0 0 c w t . 1 0 . 7 5 0 5 . 3 8V E T . M E D I C I N E S T O C K E R 1 . 0 0 0 h e a d 7 . 0 0 0 7 . 0 0W H E A T $ / C W T G A I N 3 . 6 0 0 c w t . 2 5 . 0 0 0 9 0 . 0 0F u e l 1 . 4 1L u b e 0 . 1 4R e p a i r 0 . 3 0
T o t a l O P E R A T I N G I N P U T a n d C U S T O M O P E R A T I O N C o s t s 5 9 1 . 4 1Res idua l re turns to cap i ta l , ownersh ip
l a b o r , l a n d , m a n a g e m e n t , a n d p r o fi t 4 2 . 4 6C A P I T A L I N V E S T M E N T D e s c r i p t i o n Q u a n t i t y U n i t R a t e o f C o s t
I n v e s t e d R e t u r nI n t e r e s t - I T B o r r o w e d 1 4 3 . 1 7 0 D o l . 0 . 1 2 1 1 7 . 3 2I n t e r e s t - O C B o r r o w e d 3 4 2 . 1 0 5 D o l . 0 . 1 2 1 4 1 . 3 9I n t e r e s t - O C E a r n e d - 0 . 5 7 6 D o l . 0 . 0 7 2 - 0 . 0 4
T o t a l C A P I T A L I N V E S T M E N T C o s t s ' 5 8 . 6 8==============================================================================Residual re turns to ownersh ip, labor,
l a n d , m a n a g e m e n t , a n d p r o fi t - 1 6 . 2 2OWNERSHIP COST Descr ip t ion (Deprec ia t ion , Taxes, and Insurance) Cost
M a c h i n e r y a n d E q u i p m e n t 1 5 . 2 0T o t a l O W N E R S H I P C o s t s 1 5 . 2 0==============================================================================R e s i d u a l r e t u r n s t o l a b o r , l a n d , m a n a g e m e n t , a n d p r o fi t - 3 1 . 4 2
L A B O R C O S T D e s c r i p t i o n I n p u t U s e U n i t A v e r a g e C o s tRate
M a c h i n e r y a n d E q u i p m e n t 0 . 9 1 7 H r . 4 . 8 6 4 4 . 4 6O t h e r 3 . 0 4 0 H r . 5 . 0 0 0 1 5 . 2 0
s s s s s s s s s s sT o t a l L A B O R C o s t s 1 9 . 6 6R e s i d u a l r e t u r n s t o l a n d , m a n a g e m e n t , a n d p r o fi t - 5 1 . 0 8==============================================================================
-WARNING- No Land Cost Specified==============================================================================R e s i d u a l r e t u r n s t o m a n a g e m e n t a n d p r o fi t - 5 1 . 0 8
■WARNING- No Management Cost SpecifiedS S S S S S S S S S S S S S S S S S S S S S S S S S S S S S S S S S SR e s i d u a l r e t u r n s t o p r o fi ts s s s s s s s s s s s s s s s s s s s s s s s s s s s s s s s s s :Tota l Pro jected Cost of Product ion
-51.08684.94
Information presented is prepared solely as a general guide and is not intended to recognise or predict the costsand returns from any one part icular farm or ranch operation. These projections were col lected and developed bystaff members of the Texas Agricul tural Extension Service and approved for publ icat ion.
L4.7
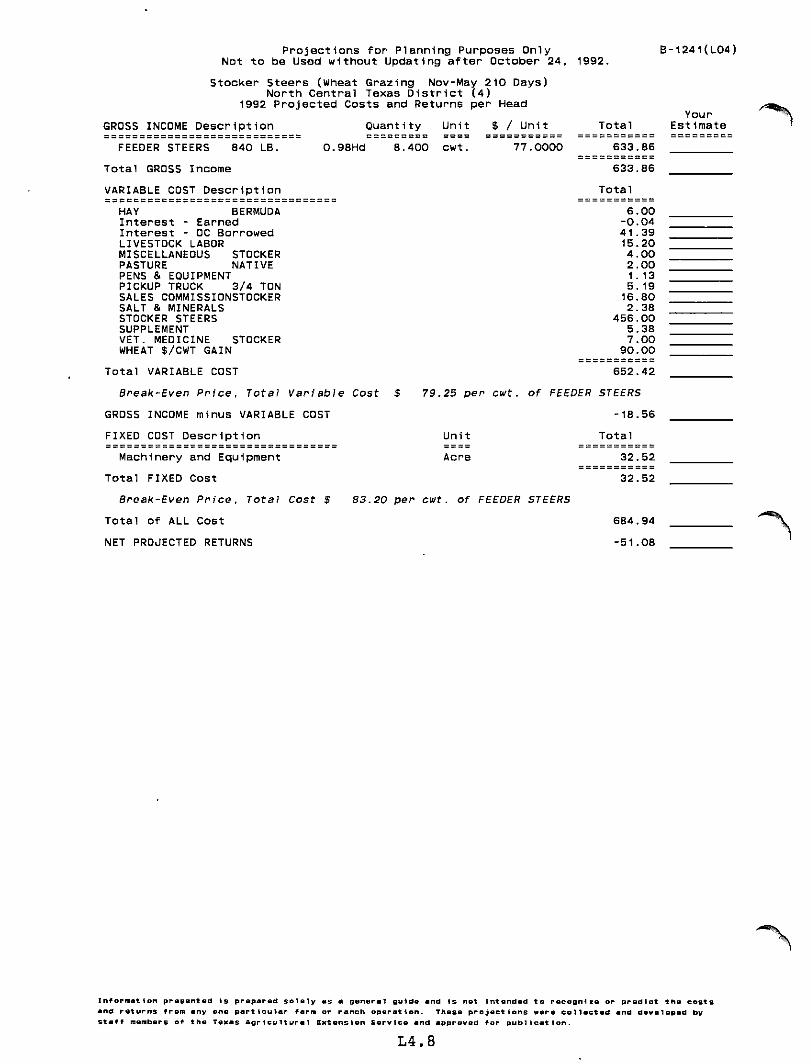
Project ions for Planning Purposes OnlyNot to be Used without Updating after October 24, 1992.
Stocker Steers (Wheat Grazing Nov-May 210 Days)Nor th Cent ra l Texas D is t r i c t (4 )
1992 Projected Costs and Returns per Head
B-1241(L04)
GROSS INCOME DescriptionFEEDER STEERS 840 LB.
Total GROSS Income
Q u a n t i t y U n i t $ / U n i t0 . 9 8 H d 8 . 4 0 0 c w t . 7 7 . 0 0 0 0
To ta l633.86633.86
To ta l6 .00
-0 .0441.3915.204 .002 .001.135 .19
16.802 .38
456.005 .387 .00
90.00T o t a l V A R I A B L E C O S T 6 5 2 . 4 2
B r e a k - E v e n P r i c e , To t a l Va r i a b l e C o s t $ 7 9 . 2 5 p e r c w t . o f F E E D E R S T E E R S
G R O S S I N C O M E m i n u s V A R I A B L E C O S T - 1 8 . 5 6F I X E D C O S T D e s c r i p t i o n U n i t T o t a l
M a c h i n e r y a n d E q u i p m e n t A c r e 3 2 . 5 2T o t a l F I X E D C o s t 3 2 . 5 2
B r e a k - E v e n P r i c e , To t a l C o s t $ 8 3 . 2 0 p e r c w t . o f F E E D E R S T E E R S
T o t a l o f A L L C o s t 6 8 4 . 9 4N E T P R O J E C T E D R E T U R N S - 5 1 . 0 8
VARIABLE COST DescriptionH A Y B E R M U D AInterest - EarnedInterest - OC BorrowedLIVESTOCK LABORMISCELLANEOUS STOCKERP A S T U R E N A T I V EPENS & EQUIPMENTPICKUP TRUCK 3/4 TONSALES COMMISSIONSTOCKERSALT & MINERALSSTOCKER STEERSSUPPLEMENTVET. MEDICINE STOCKERWHEAT $/CWT GAIN
YourEst imate
Information presented is prepared solely as a general guide and is not intended to recognise or predict the costsand returns from any one part icular farm or ranch operation. These projections were col lected and developed bystaff members of the Texas Agricultural Extension Service and approved for publ icat ion.
L4.8

J ^ '
Project ions for Planning Purposes OnlyNot to be Used without Updating after October 24,
STOCKER CALF PRODUCTION (NATIVE PASTURE)Nor th Cent ra l Texas D is t r i c t (4 )
1992 Projected Costs and Returns per Head
1992,B-1241(L04)
PRODUCTION DescriptionFEEDER STEERS 730 LB.
Total GROSS Income
Q u a n t i t y U n i t $ / U n i t0 . 9 8 H d 7 . 3 0 0 c w t . 8 0 . 0 0 0 0
: = = = = = = = = = Yo u rR e t u r n E s t i m a t e
572.32 '572.32
OPERATING INPUT or CUSTOM OPERATIOND e s c r i p t i o n
H A Y B E R M U D AMISCELLANEOUS STOCKERP A S T U R E N A T I V ESALES COMMISSIONSTOCKERSALT & MINERALS
I n p u t U s e U n i t4 . 0 0 0 c w t .1.000 head4 . 0 0 0 a c r e7 . 3 0 0 c w t .0 . 2 6 3 c w t .4 . 8 0 0 c w t .0 . 7 5 0 c w t .2 .000 head
STOCKER STEERSSUPPLEMENTVET. MEDICINE STOCKERFuelLubeRepair
Total OPERATING INPUT and CUSTOM OPERATION CostsRes idua l re turns to cap i ta l , ownersh ip
labor, land, management, and profit
$ / Unit3.0004 .0008.0002.0007.930
95.00010.7507.000
Cost12.004 .00
32.0014.602.08
456.008 .06
14.001.41O. 140 .30
544.60
CAPITAL INVESTMENT DescriptionInterest - IT BorrowedInterest - OC BorrowedInterest - OC Earned
Total CAPITAL INVESTMENT Costs
Quant i tyInvested143.170313.148-0.119
U n i tDol .Dol .Dol .
Rate ofReturn
0.1210.1210.072
27.72Cost
17.3237.89-0.0155.20
Residual re turns to ownersh ip, labor,land, management, and profit==================================================================
OWNERSHIP COST Description (Depreciation, Taxes, and Insurance)Machinery and Equipment
Total OWNERSHIP CostsResidual returns to labor, land, management, and profit
I n p u t U s e U n i t A v e r a g eRate
M a c h i n e r y a n d E q u i p m e n t 0 . 9 1 7 H r . 4 . 8 6 4O t h e r 2 . 0 0 0 H r . 5 . 0 0 0
-27.48Cost
15.2015.20
-42 .68
LABOR COST Description Cost4 .46
10.00Total LABOR CostsResidual returns to land, management, and profit================================================:
14.46■57.14
■WARNING- No Land Cost Specified
R e s i d u a l r e t u r n s t o m a n a g e m e n t a n d p r o fi t - 5 7 . 1 4
■WARNING- No Management Cost Specifieds s s s s s s s s s s s s s s s s s s s s s s s s s s s s s s :R e s i d u a l r e t u r n s t o p r o fi tTota l Pro jected Cost o f Product ion
: s s s s s s s s s s s s s s s :-57. 14629.46
Information presented Is prepared solely as a general guide and Is not Intended to recognise or predict the costsand returns from any one part icular farm or ranch operation. These projections were col lected and developed bystaff members of the Texas Agricultural Extension Service and approved for publ icat ion.
L4.9

Project ions for Planning Purposes OnlyNot to be Used without Updating after October 24, 1992.
Stocker Calf Product ion (Nat ive Pasture)Nor th Cent ra l Texas D is t r i c t (4 )
1992 Projected Costs and Returns per Head
G R O S S I N C O M E D e s c r i p t i o n Q u a n t i t y U n i t $ / U n i t T o t a lF E E D E R S T E E R S 7 3 0 L B . 0 . 9 8 H d 7 . 3 0 0 c w t . 8 0 . 0 0 0 0 5 7 2 . 3 2
T o t a l G R O S S I n c o m e 5 7 2 . 3 2V A R I A B L E C O S T D e s c r i p t i o n T o t a l= = = = = = = = = = = = = = = = = = = = = = = = = = = = = = = = = s s s s s s s s s s s
H A Y B E R M U D A 1 2 . 0 0I n t e r e s t - E a r n e d - 0 . 0 1I n t e r e s t - O C B o r r o w e d 3 7 . 8 9L I V E S T O C K L A B O R 1 0 . 0 0M I S C E L L A N E O U S S T O C K E R 4 . 0 0P A S T U R E N A T I V E 3 2 . 0 0P E N S & E Q U I P M E N T 1 . 1 3P I C K U P T R U C K 3 / 4 T O N 5 . 1 9S A L E S C O M M I S S I O N S T O C K E R 1 4 . 6 0S A L T & M I N E R A L S 2 . 0 8S T O C K E R S T E E R S 4 5 6 . 0 0S U P P L E M E N T 8 . 0 6V E T . M E D I C I N E S T O C K E R 1 4 . 0 0
T o t a l V A R I A B L E C O S T 5 9 6 . 9 4B r e a k - E v e n P r i c e , To t a l Va r i a b l e C o s t $ 8 3 . 4 4 p e r c w t . o f F E E D E R S T E E R S
G R O S S I N C O M E m i n u s V A R I A B L E C O S T - 2 4 . 6 2F I X E D C O S T D e s c r i p t i o n U n i t T o t a l
M a c h i n e r y a n d E q u i p m e n t A c r e 3 2 . 5 2s s s s s s s s s s sT o t a l F I X E D C o s t 3 2 . 5 2
B r e a k - E v e n P r i c e , To t a l C o s t $ 8 7 . 9 8 p e r c w t . o f F E E D E R S T E E R S
T o t a l o f A L L C o s t 6 2 9 . 4 6N E T P R O J E C T E D R E T U R N S - 5 7 . 1 4
B-1241(L04)
YourEst imate
^ * % | v
Information presented is prepared solely as a general guide and is not intended to recognise or predict the costsand returns from any one part icular farm or ranch operation. These projections were collected and developed bystaff members of the Texas Agricultural Extension Service and approved for publ icat ion.
L4.10

P r o j e c t i o n s f o r P l a n n i n g P u r p o s e s O n l yN o t t o b e U s e d w i t h o u t U p d a t i n g a f t e r O c t o b e r 2 4 ,
DAIRY PRODUCTION (WITHOUT SILAGE)N o r t h C e n t r a l Te x a s D i s t r i c t ( 4 )
1 9 9 2 P r o j e c t e d C o s t s a n d R e t u r n s p e r H e a d
1992,B - 1 2 4 K L 0 4 )
PRODUCTION Descr ipt ionBREEDING HEIFERSB U L L C A L V E S D A I R YC U L L C O W S D A I R YHEIFER CALVES DAIRYMILK
0 .22Hd
Q u a n t i t y0.2OO0 . 4 5 0
13 .0000 . 0 3 0
135 .000
Total GROSS Income
OPERATING INPUT or CUSTOM OPERATIOND e s c r i p t i o n
BREEDING DAIRYGRAIN MIXHAYMGMT. RECORDSMILK REPLACERMISCELLANEOUS DAIRYPASTURE DAIRYSALTSUPPLIES DAIRYUTILITIESVET. MEDICINE DAIRYHAULING MILKFuelLubeRepa1r
I n p u t U s e1 . 0 0 0
6 6 . 4 0 0111 . 0 0 0
1 . 0 0 04 0 . 0 0 0
1 . 0 0 050
0 0 0720
1 . 0 0 01 . 0 0 01 . 0 0 0
135 .000
U n i theadheadc w t .c w t .c w t .
U n i theadc w t .c w t .headl b .heada c r ec w t .headheadheadc w t .
$ / U n i t7 5 0 . 0 0 0 0125 .00004 7 . 5 0 0 0
150 .00001 3 . 1 0 0 0
$ / U n i t2 4 . 5 0 0
7 . 9 0 03 . 0 0 0
18 .0000 . 9 1 0
15 .0002 0 . 0 0 0
5 . 3 0 03 4 . 7 5 04 0 . 0 0 03 0 . 0 0 0
0 . 7 2 0
Total OPERATING INPUT and CUSTOM OPERATION Costs
R e t u r n150 .005 6 . 2 5
135 .854 . 5 0
1768 .50
2 11 5 . 1 0
C o s t2 4 . 5 0
5 2 4 . 5 63 3 3 . 0 0
1 8 . 0 03 6 . 4 01 5 . 0 0
1 0 0 . 0 03 . 8 2
3 4 . 7 54 0 . 0 03 0 . 0 09 7 . 2 012 .44
1 . 2 48 . 3 8
1279 .29
R e s i d u a l r e t u r n s t o c a p i t a l , o w n e r s h i pl a b o r , l a n d , m a n a g e m e n t , a n d p r o fi t
Q u a n t i t yI n v e s t e d
2495 .2372 . 1 5 4
- 2 4 6 . 11 7
U n i t
Dol .Dol .Dol .
R a t e o fR e t u r n
0 . 1 2 10.1210.072
CAPITAL INVESTMENT DescriptionInterest - IT BorrowedInterest - OC BorrowedInterest - OC Earned
Total CAPITAL INVESTMENT CostsResidual re turns to ownersh ip, labor,
land, management, and profitOWNERSHIP COST Description (Depreciation, Taxes, and Insurance)
Machinery and EquipmentL i ves tock
Total OWNERSHIP CostsResidual returns to labor, land, management, and profitLABOR COST Description
Machinery and EquipmentOther
Input Use U n i t6 . 2 1 9 H r,
48 .000 Hr,
AverageRate
5.0005.000
Total LABOR CostsResidual returns to land, management, and profit
L A N D C O S T D e s c r i p t i o n I n p u t U s ePASTURE RENT DAIRY
Annual Lease .
U n i t
5 . 0 0 0 A c r e
Rate ofReturn
2.000Total LAND CostsResidual returns to management and profitS S S S S S S S S S S S S S S S S S S S S S S S S S S S S S S S S S S S S S S S S S S S S S S S S S S S S S S S S S S S S S S C S I
-WARNING- No Management Cost Specified
8 3 5 . 8 1
C o s t
3 0 1 . 9 00 . 2 6
- 1 7 . 7 5s s s s s s s s s s s
284 .41:===========
5 5 1 . 4 0
C o s t165.512 0 . 3 4
185 .85
3 6 5 . 5 5:===========
C o s t
3 1 . 1 02 4 0 . 0 0
s s s s s s s s s s s2 7 1 . 1 0
9 4 . 4 5
C o s t
1 0 . 0 0s s s s s s s s s s s
1 0 . 0 0
8 4 . 4 5
Yo u rE s t i m a t e
s s s s s s s s s s s s s s s s s s s s s s s s s s :R e s i d u a l r e t u r n s t o p r o fi t
:========8 4 . 4 5
To t a l P r o j e c t e d C o s t o f P r o d u c t i o n 2 0 3 0 . 6 5
Information presented is prepared solely as a general guide and is not intended to recognise or predict the costsand returns from any one part icular farm or ranch operation. These projections were col lected and developed bystaff members of the Texas Agricultural Extension Service and approved for publ icat ion.
L 4 . l l

Project ions for Planning Purposes OnlyNot to be Used without Updating after October 24, 1992.
Dai ry Product ion (w i thout S i lage)Nor th Cent ra l Texas Dis t r ic t (4 )
1992 Projected Costs and Returns per Head
B-124KL04)
GROSS INCOME Description============================
BREEDING HEIFERSBULL CALVES DAIRYC U L L C O W S D A I R Y 0 . 2 2 H dHEIFER CALVES DAIRYMILK
Total GROSS IncomeVARIABLE COST Description
B A R N H A YB R E E D I N G D A I R YBULK MILK COOLERCALF HUTCHESDIGGER/WAGON SILAGEFEED MILLFEED SYSTEMF E E D E R M E C H A N I CFEEDING AREAGRAIN MIXH A U L I N G M I L KHAYHAY RACKSHOLDING AREAInterest - EarnedInterest - OC BorrowedLIVESTOCK LABORMANURE SYSTEMMGMT. RECORDSMILK REPLACERMILK ROOMMILKING EQUIP.MILKING PARLORMILKING STALLSMISCELLANEOUS DAIRYP A S T U R E D A I R YPICKUP TRUCK 3/4 TONSALTS I L O H O R I Z O NS U P P L I E S D A I R YT R A C T O R 4 0 H PUTILITIESVET. MEDICINE DAIRYW A G O N M A N U R EWATER SYSTEM
Total VARIABLE COST
GROSS INCOME minus VARIABLE COSTFIXED COST Descriptions s s s s s s s s s s s s s s s s s s s s s s s s s s s s s s s :
Machinery and EquipmentL ives tockLand
Total FIXED Cost
Total of ALL CostNET PROJECTED RETURNS
Quant i ty U n i tS S S Sheadheadcwt .cwt .cwt .
U n i tAcreAcre
$ / Unit750.0000125.000047.5000
150.000013.1000
YourT o t a l E s t i m a t e
0.200 150.000.450 56.25
1 1 3 . 0 0 0 135.850.030 4 .50
135.000 1768.502115.10
To t a l
0. 1024.500 .630.010 .550 .700 .090 .330 .06
524.5697.20
333.000.060.06
-17.750.26
240.000.19
18.0036.400.221.250.450 .70
15.00100.0038. 133.820.06
34.759.15
40.0030.000.230.19
1532.90
582.20To ta l
s s s s s s s s s s s373.56114.1910.00
497.752030.65
84.45
-"**%
~ \ >
Information presented is prepared solely as a general guide and Is not Intended to recognise or predict the costsand returns from any one part icular farm or ranch operation. These projections were collected and developed bystaff members of the Texas Agricultural Extension Service and approved for publ icat ion.
L4.12

P r o j e c t i o n s f o r P l a n n i n g P u r p o s e s O n l yN o t t o b e U s e d w i t h o u t U p d a t i n g a f t e r O c t o b e r 2 4
DAIRY PRODUCTION (WITH SILAGE)N o r t h C e n t r a l Te x a s D i s t r i c t ( 4 )
1992 P ro jec ted Cos ts and Re tu rns pe r Head
1992.B - 1 2 4 K L 0 4 )
PRODUCTION Descript ionBREEDING HEIFERSB U L L C A L V E S D A I R YC U L L C O W S D A I R YHEIFER CALVES DAIRYMILK
Total GROSS Income
0 .22Hd
Q u a n t i t y0 . 2 0 00 . 4 5 0
13 .0000 . 0 3 0
135 .000
U n i theadheadc w t .c w t .c w t .
$ / U n i t7 5 0 . 0 0 0 0125 .00004 7 . 5 0 0 0
150 .00001 3 . 1 0 0 0
R e t u r n1 5 0 . 0 0
5 6 . 2 5135 .85
4 . 5 01 7 6 8 . 5 0
2 11 5 . 1 0OPERATING INPUT or CUSTOM OPERATION
D e s c r i p t i o nBREEDING DAIRYGRAIN MIXHAYMGMT. RECORDSMILK REPLACERMISCELLANEOUS DAIRYPASTURE DAIRYSALTSORGHUM SILAGESUPPLIES DAIRYUTILITIESVET. MEDICINE DAIRYHAULING MILKFuelLubeRepa i r
Input Use U n i t1.000 head
66.400 cwt .39.000 cwt .
1.000 head40.000 lb .
1.000 head5.000 ac re0.720 cwt .
11.500 ton1.000 head1.000 head1.000 head
135.000 cwt .
$ / U n i t2 4 . 5 0 0
7 . 9 0 03 . 0 0 0
1 8 . 0 0 00 . 9 1 0
1 5 . 0 0 02 0 . 0 0 0
5 . 3 0 02 5 . 0 0 03 4 . 7 5 04 0 . 0 0 03 0 . 0 0 00 . 7 2 0
C o s t2 4 . 5 0
5 2 4 . 5 611 7 . 0 0
1 8 . 0 03 6 . 4 01 5 . 0 0
1 0 0 . 0 03 . 8 2
2 8 7 . 5 03 4 . 7 54 0 . 0 03 0 . 0 09 7 . 2 012 .44
1 . 2 48 . 3 8
Total OPERATING INPUT and CUSTOM OPERATION Costs
R e s i d u a l r e t u r n s t o c a p i t a l , o w n e r s h i pl a b o r , l a n d , m a n a g e m e n t , a n d p r o fi t
1350 .79
CAPITAL INVESTMENT Descr ip t ion
I n t e r e s tI n t e r e s tI n t e r e s t
I T B o r r o w e dOC BorrowedOC Earned
Q u a n t i t yI n v e s t e d
2495 .2372 . 8 6 3
- 2 1 0 . 8 7 9
U n i t
Dol .Dol .Dol .
R a t e o fR e t u r n
0.1210.1210.072
Total CAPITAL INVESTMENT Costs
764 .31s s s s s s s sC o s t
3 0 1 . 9 00 . 3 5
- 1 5 . 2 0
2 8 7 . 0 4
R e s i d u a l r e t u r n s t o o w n e r s h i p , l a b o r ,l a n d , m a n a g e m e n t , a n d p r o fi t
O W N E R S H I P C O S T D e s c r i p t i o n ( D e p r e d a t i o n , Ta x e s , a n d I n s u r a n c e )Mach ine ry and Equ ipmen tL i v e s t o c k
4 7 7 . 2 7i s s s c s a s sC o s t
165.512 0 . 3 4
Yo u rE s t i m a t e
Total OWNERSHIP Costs 185 .85
2 9 1 . 4 3
C o s t
3 1 . 1 02 4 0 . 0 0
s s s s s s s s s2 7 1 . 1 0
2 0 . 3 3s s s s s s s s sC o s t
1 0 . 0 0
1 0 . 0 0
10 .33
R e s i d u a l r e t u r n s t o l a b o r , l a n d , m a n a g e m e n t , a n d p r o fi t
L A B O R C O S T D e s c r i p t i o n I n p u t U s e U n i t A v e r a g eR a t e
M a c h i n e r y a n d E q u i p m e n t 6 . 2 1 9 H r . 5 . 0 0 0O t h e r 4 8 . 0 0 0 H r . 5 . 0 0 0
Tota l LABOR Cos ts
R e s i d u a l r e t u r n s t o l a n d , m a n a g e m e n t , a n d p r o fi t
L A N D C O S T D e s c r i p t i o n I n p u t U s e U n i t
PASTURE RENT DA IRYAnnua l Lease 5 . 0 0 0 A c r e
:==========R a t e o fR e t u r n
2 . 0 0 0
To ta l LAND Cos ts
R e s i d u a l r e t u r n s t o m a n a g e m e n t a n d p r o fi tc===========qc===========b=======================cc==============:
-WARNING- No Management Cost Specified
^ # ^ \
R e s i d u a l r e t u r n s t o p r o fi t
Tota l Pro jected Cost o f Product ion
10.33
2104.77
Information presented is prepared solely as a general guide and Is not Intended to recognise or predict the costsand returns from any one part icular farm or ranch operation. These projections were col lected and developed bystaff members of the Texas Agricultural Extension Service and approved for publ icat ion.
L4.13