Embed Size (px)
Citation preview
Crop Insurance in Karnataka
Vijay Kalavakondaa and Olivier Mahulb
a Financial Analyst, Financial Sector Operations and Policy Department, World Bank, Washington, D.C. b Senior Insurance Specialist, Financial Sector Operations and Policy Department, World Bank, Washington, D.C.
This paper is based on the World Bank report entitled “Karnataka Crop Insurance Study” requested by the Government of Karnataka and delivered in September 2003.
Abstract The paper examines the performance of the crop insurance scheme in Karnataka, a southern state of India and the second driest state in the country. The analysis highlights weaknesses in product design, implementation challenges, and operational problems. The finding is that the crop insurance scheme in its current form does not achieve its objectives, either explicit (risk management) or implicit (safety net and containment of both the central and state governments’ contingent liability). The crop insurance scheme performs poorly both in terms of coverage (number of hectares insured and number of farmers purchasing insurance) and financial performance. This paper provides a framework for designing a crop insurance scheme based on the premise that insurance is a cost effective risk management technique. The paper also provides some new ideas and thinking toward both improving the existing crop insurance scheme and exploring alternatives to the current product, based on an area-yield approach. Keywords: basis risk, crop insurance, risk management, area yield, rainfall insurance, agricultural credit, small and marginal farmers World Bank Policy Research Working Paper 3654, July 2005
The Policy Research Working Paper Series disseminates the findings of work in progress to encourage the exchange of ideas about development issues. An objective of the series is to get the findings out quickly, even if the presentations are less than fully polished. The papers carry the names of the authors and should be cited accordingly. The findings, interpretations, and conclusions expressed in this paper are entirely those of the authors. They do not necessarily represent the view of the World Bank, its Executive Directors, or the countries they represent. Policy Research Working Papers are available online at http://econ.worldbank.org.
Correspondence details: Vijay Kalavakonda, Contractual Savings and Insurance Unit, Financial Operations and Policy Department, World Bank, 1818 H Street NW, Washington, DC 20433, USA; Tel 1 + 202 458 4624; Fax 1+ 202 522-2098; Email [email protected].
Olivier Mahul, Contractual Savings and Insurance Unit, Financial Operations and Policy Department, World Bank, 1818 H Street NW, Washington, DC 20433, USA; Tel 1 + 202 458 8955; Fax 1+ 202 522-3198; Email [email protected].
Pub
lic D
iscl
osur
e A
utho
rized
Pub
lic D
iscl
osur
e A
utho
rized
Pub
lic D
iscl
osur
e A
utho
rized
Pub
lic D
iscl
osur
e A
utho
rized
GLOSSARY
ACRONYMS AICI Agriculture Insurance Corporation of India CCIS Comprehensive Crop Insurance Scheme CRF Calamity Relief Fund DES Directorate of Economics and Statistics FONDEN Fund for National Disasters, Mexico NAIS National Agriculture Insurance Scheme NCCF National Calamity Contingency Fund NCCM National Center for Calamity Management PCIS Pilot Crop Insurance Scheme RBI Reserve Bank of India TERMS District Administrative subdivision of a state Kharif season June to October Panchayat Village or subdivision of a taluk Rabi season November to March Summer season April to June Taluk Subdivision of a district
EXCHANGE RATE
US$1 = Rs.46
(May 05, 2003)
TABLE OF CONTENTS
1. Introduction................................................................................................................................ 1 2. Agriculture in Karnataka............................................................................................................ 2
A. Holdings .............................................................................................................................. 2 B. Cropping Patterns................................................................................................................ 3 C. Rainfall Pattern in Karnataka .............................................................................................. 3 D. Scope for Intervening with Weather Instruments ............................................................... 4
3. Characteristics of Farmers’ Income........................................................................................... 6 A. Sources of Income............................................................................................................... 6 B. Risk-Mitigating Strategies................................................................................................... 7 C. Prioritization of Mitigating Strategies................................................................................. 7
4. Current Crop insurance Scheme ................................................................................................ 8 A. Earlier Indian Crop insurance Schemes .............................................................................. 8 B. National Crop insurance Scheme ........................................................................................ 8
Crops covered ..................................................................................................................... 9 Eligibility for coverage ....................................................................................................... 9 Risks covered ...................................................................................................................... 9 Sum insured ........................................................................................................................ 9 Premium rates ..................................................................................................................... 9 Premium subsidy................................................................................................................. 9 Scheme approach ................................................................................................................ 9 Indemnity and deductible rates ........................................................................................... 9 Loss assessment and indemnity ........................................................................................ 10 Corpus fund....................................................................................................................... 10 Risk sharing ...................................................................................................................... 10
C. Institutional Mechanism for Delivering Crop Insurance................................................... 11 D. Claim-Settlement Process ................................................................................................. 11 E. Reinsurance ....................................................................................................................... 11 F. Disaster Relief ................................................................................................................... 12
5. The National Agricultural Insurance Scheme in Karnataka .................................................... 13 A. Breadth of Coverage ......................................................................................................... 13 B. Operational Effectiveness ................................................................................................. 15 C. Financial Performance....................................................................................................... 16
6. Linkages With The Agriculture Credit Program ..................................................................... 20 A. Rural Credit Flows............................................................................................................ 20 B. Crop Credit and Crop Insurance........................................................................................ 21
7. Conclusions and Recommendations ........................................................................................ 24 A. Conclusions....................................................................................................................... 24 B. Recommendations ............................................................................................................. 25
Product design................................................................................................................... 26 Operational effectiveness.................................................................................................. 27 Financial performance ...................................................................................................... 27 Access to credit ................................................................................................................. 28 Weather derivatives .......................................................................................................... 28
ii
Revenue insurance. ........................................................................................................... 28 Risk sharing ...................................................................................................................... 29
References..................................................................................................................................... 30 Tables
Table 1. Sources of income by farm size classes (percent) ........................................................... 6 Table 2. NAIS—Coverage and claims analysis across borrower and nonborrower, Kharif 2000
to Kharif 2003................................................................................................................ 14 Table 3. Progress of a claim from loss to payment, various seasons........................................... 16 Table 4. Distribution of NAIS costs, Karnataka, Kharif 2000 to Kharif 2002 ............................ 16 Table 5. Farmers in Karnataka vs farmers covered under NAIS................................................. 17 Table 6. Farmers covered under NAIS by region and size, Karnataka........................................ 19 Table 7. Primary sources of credit for small and marginal farmers (percent) ............................ 20 Table 8. Comparison of loans disbursed and loans covered under NAIS, Karnataka ................. 23 Figures Figure 1. The variability of rainfall in Karnataka (percentage departure from the mean).............. 4 Figure 2. Actuarial performance of crop insurance, Kharif season ............................................. 18 Figure 3. Actuarial performance of crop insurance, Rabi season ................................................ 18
iii
ACKNOWLEDGMENTS
The authors would like to thank Dr M.J. Bhende, Institute for Social Economic Change, Bangalore, INDIA, V.S. Prakash, Drought Monitoring Cell, Bangalore, Karnataka, and Kolli N. Rao, Agriculture Insurance Corporation of India whose contributions made this paper possible. The authors are grateful for the comments provided by Rodney Lester, Carlos Cuevas, and Panayotis Varangis (World Bank) and Professor Jerry Skees, University of Kentucky. The authors would also like to thank Dina Umali-Deininger (World Bank) for both her support in ensuring the completion of the study. The authors would like to acknowledge the valuable editorial contribution by Kathleen A. Lynch.
1. INTRODUCTION
Karnataka state, with more than 75 percent of its arable land in the rainfed regions, has the second largest drought-prone area in India (after Rajasthan). Minimizing the impact of natural disaster–related crop losses, particularly from drought, is therefore a major public policy objective for its government. An effective crop insurance system is a critical part of a strategy to cushion income losses for farmers, finance inputs for agricultural production in the next planting season after a drought and deepen the penetration of agricultural credit for investment to boost agricultural productivity. The State of Karnataka has participated in every crop insurance program introduced in India since 1972. The current National Agriculture Insurance Scheme (NAIS), launched in 2000 during the Rabi season (November to March), is intended to provide farmers with insurance coverage and financial support against failure of any notified crop as a result of agricultural calamities and to restore farmers’ credit eligibility after a crop failure before the next planting season. The World Bank, at the request of the government of Karnataka evaluated the impact of the NAIS in the state, taking into account Karnataka’s patterns of land holdings, cropping, and rainfall, as well as the characteristics of farmers’ incomes and risk management strategies (World Bank 2003).1 The assessment addressed the program’s product design, breadth of coverage, incentives to farmer participation, operational effectiveness, impact on expanding access to credit, and financial performance. The study also examined the relationship between weather parameters and crop production in Karnataka in light of the development of markets for transferring and hedging weather risk. Drought has a significant impact on small and marginal farmers, according to the study.2 In Karnataka, the number of small and marginal land holdings has been increasing for 25 years, resulting in a growing proportion of the rural population with incomes that are highly vulnerable to natural disasters. The reduction of poor farmers’ vulnerability is an important part of the state’s development and poverty alleviation agenda. Poor households, with no or few assets to fall back on, are especially vulnerable to risks that reduce incomes and increase expenditures. By ensuring sufficient liquidity right after a disaster, a natural disaster insurance strategy can help speed recovery, ensure effective use of scarce government funds, and reduce the risk-enhancing effects of moral hazard. In addition, market-based risk-transfer mechanisms can assist in the internalization of risk and lead to desirable mitigation activity.
1 This paper is based on that report. 2 Of the 1,013,390 farmers participating in the NAIS in 2000-01, 499,781 (49.3 percent) are considered small and marginal farmers.
2
2. AGRICULTURE IN KARNATAKA Land reform has been successful in Karnataka, as reflected by the relatively large number of landholders in the state. As a result of land reform coupled with inheritance law in particular, the average land holding as of 1996 was 1.95 hectares, compared to holdings of 1.45 and 0.48 hectares, respectively, for small and marginal farmers. Although small and marginal farmers account for 69 percent of total holdings, they operate only 31 percent of the total area. As per the 1991 Census, there were 17.3 million workers in Karnataka. Of this total, farmers accounted for 5.92 million (34 percent); agricultural laborers, 5 million (29 percent); and “other” workers, 6.38 million (37 percent). The small landholding pattern and a high dependence of the labor force on agriculture (more than two-thirds of all workers in the state) are reflected in the cropping pattern. More than 50 percent of the net sown area is devoted toward cereals and pulses, primarily for consumption purposes. Karnataka over the past 43 years (1960–61 to 2002–03) has had a rainfall deficit an average of 1 out of every 4.3 years. Rainfall deficits occurred in 12 out of the 43 years during Kharif season (the main cropping season, June to October), and in 21 out of the 43 years during Rabi season. A policy of cultivating cereals and pulses in a state where more than 75 percent of arable land is dependent on rainfall requires innovative risk management instruments to hedge against yield variability. A. Holdings The total number of holdings in Karnataka increased from 3.55 million in 1971 to 6.22 million in 1996. During the same period, small and marginal households increased from 54 percent of total holdings to 69 percent, while the area held by these smallholders expanded from 15.6 percent to 30.8 percent.3 As a result, the average size of holdings decreased from 3.2 hectares in 1971 to 1.95 hectares in 1996. Small and marginal farms comprise half of the holdings in northern Karnataka and 75 percent in the southern and coastal regions of the state. The large increase in the number of small and marginal holdings in Karnataka, largely reflecting growing population pressure, is a matter of serious concern. The average holding of less than 2 hectares is smaller that the 3-hectare estimate of threshold viability. The declining size of holdings constrains the pace of agricultural development because small farmers are less able than larger farmers to invest in land development activities or in adoption of capital-intensive technology. Moreover, small—generally poorer—farmers are more vulnerable to poverty after disaster-related income losses. As marginal land holdings become less and less viable, the number of marginal farmers leaving farming will swell the ranks of the urban poor.
3 Marginal holdings operate less than 1 hectare; small holdings, between 1 and 2 hectares; medium holdings, between 2 and 10 hectares; and large holdings, more than 10 hectares.
3
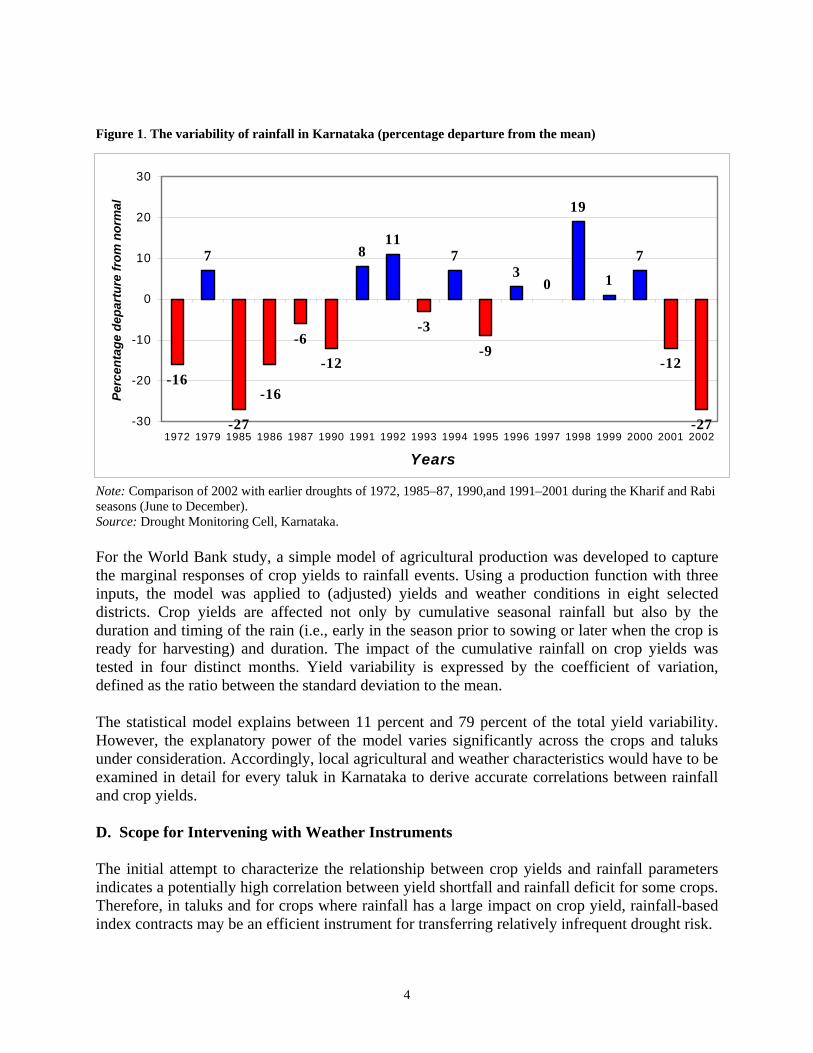
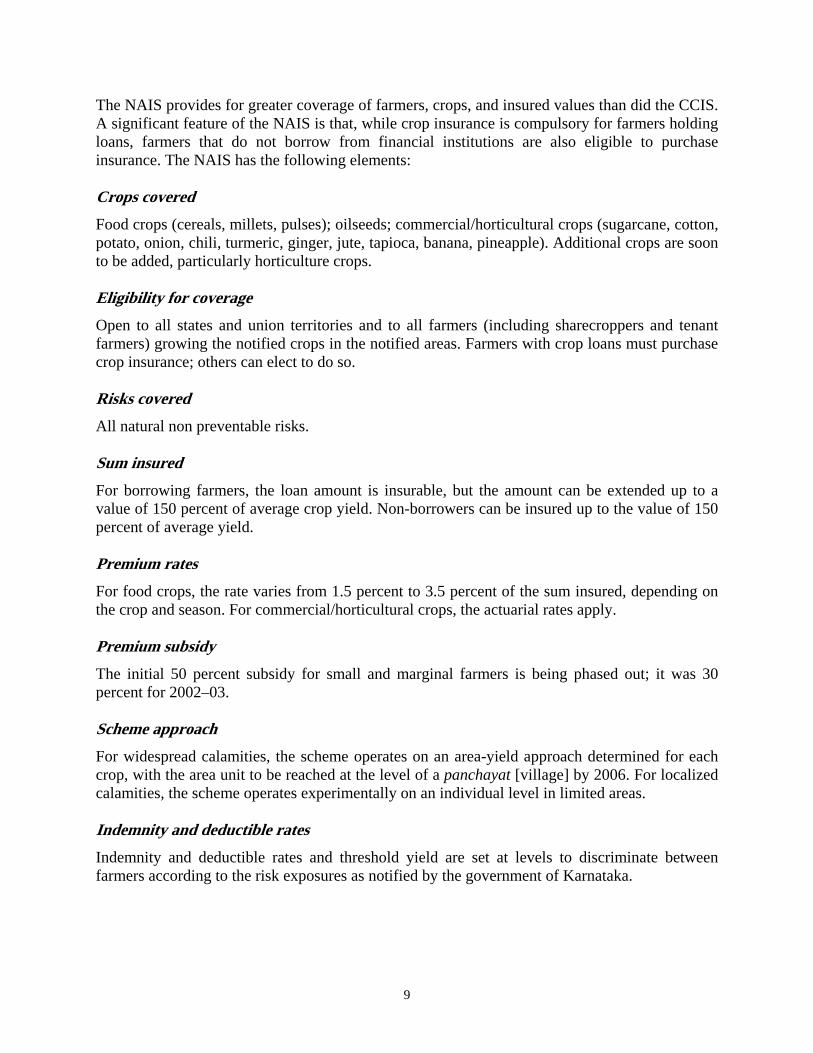
B. Cropping Patterns The net sown area in Karnataka is normally about 11.2 million hectares. Only 24 percent of the arable area is under irrigation, so most of the cultivable area depends on the occurrence and distribution of pre-monsoon and southwest monsoon precipitation. The cropping pattern of Karnataka is dominated by crops planted during the Kharif southwest monsoon season (June to October). Normally, 65 percent of the net sown area is planted with crops during Kharif depending on pre-monsoon and southwest monsoon rains. Similarly, about 30 percent and 5 percent of the area is sown during Rabi, the northeast monsoon season (November to March) and the summer season (April to June), respectively, depending on the quantum of residual moisture. According to 1999–2000 data, 45 percent of the net sown area in Karnataka is under cereals, 14 percent under pulses, and 20 percent under oilseeds. In recent years, the area under horticultural crops has been growing rapidly due to economic liberalization, availability of infrastructure, and incentives provided by the central and state governments for the promotion of horticultural crops. The shift from subsistence farming to more remunerative horticultural crops has been apparent since the early 1990s. Karnataka now ranks third among the states in the production of fruits, with 11 percent of India’s total fruit production. The area under horticultural crops in the state expanded from 0.8 million hectares in 1980–81 to 1.8 million hectares in 1999–2000, registering a growth rate of 4 percent annually. At the micro level, the proportion of area under food crops decreases with an increasing size of holding. The relatively higher share of food crops on small holdings indicates a lower level of commercialization and a predominance of subsistence farming on small and marginal farms. In general, cash crops comprise a larger proportion of irrigated land than food grain crops across farm sizes and social groups. The proportion of irrigated land under cereals was higher on small farms than on large farms, and the opposite was true in the case of oilseeds. Finally, most of northern Karnataka and rainfed areas of southern Karnataka have a largely diversified cropping pattern, while the coastal and irrigated regions tend toward more monocropping. C. Rainfall Pattern in Karnataka Two-thirds of Karnataka’s geographical area is arid or semi-arid. Out of 27 districts, 18 districts are drought prone with annual normal rainfall of less than 750 mm. The normal annual rainfall of the state is 1,139 mm, received over 55 rainy days. Of the annual rainfall, 71 percent is received during the Kharif season, 17 percent during the Rabi season, and the remaining 12 percent during the pre-monsoon season. Because rainfall is highly variable over space and time and irrigation is limited, agricultural production is correspondingly variable. Even during the good rainfall years, at least 25 percent of the taluks [district subdivisions] in the state are affected by uneven distribution of rainfall, and even the assured rainfall areas like the coastal region can experience drought-like conditions. The variability of rainfall from 1901 to 1970 is presented in figure 1. The 2002 drought in Karnataka was as intense as the 1985 drought (27 percent rainfall deficit from the mean). The impact of the 2002 drought was particularly severe, because the deficit in rainfall coincided with the main Kharif cropping season 2002.
4
Figure 1. The variability of rainfall in Karnataka (percentage departure from the mean)
Note: Comparison of 2002 with earlier droughts of 1972, 1985–87, 1990,and 1991–2001 during the Kharif and Rabi seasons (June to December). Source: Drought Monitoring Cell, Karnataka.
For the World Bank study, a simple model of agricultural production was developed to capture the marginal responses of crop yields to rainfall events. Using a production function with three inputs, the model was applied to (adjusted) yields and weather conditions in eight selected districts. Crop yields are affected not only by cumulative seasonal rainfall but also by the duration and timing of the rain (i.e., early in the season prior to sowing or later when the crop is ready for harvesting) and duration. The impact of the cumulative rainfall on crop yields was tested in four distinct months. Yield variability is expressed by the coefficient of variation, defined as the ratio between the standard deviation to the mean. The statistical model explains between 11 percent and 79 percent of the total yield variability. However, the explanatory power of the model varies significantly across the crops and taluks under consideration. Accordingly, local agricultural and weather characteristics would have to be examined in detail for every taluk in Karnataka to derive accurate correlations between rainfall and crop yields. D. Scope for Intervening with Weather Instruments The initial attempt to characterize the relationship between crop yields and rainfall parameters indicates a potentially high correlation between yield shortfall and rainfall deficit for some crops. Therefore, in taluks and for crops where rainfall has a large impact on crop yield, rainfall-based index contracts may be an efficient instrument for transferring relatively infrequent drought risk.
-16
7
-27
-6
-12
811
-3
7
-9
30
19
1
7
-12
-27
-16
-30
-20
-10
0
10
20
30
1972 1979 1985 1986 1987 1990 1991 1992 1993 1994 1995 1996 1997 1998 1999 2000 2001 2002
Years
Perc
enta
ge d
epar
ture
from
nor
mal
5
The next step in considering how to address the systemic and basis risks arising from the differential impact of rainfall variations on crop yield throughout the state would be to study how area-yield based and weather-index based insurance contracts could be efficiently combined, based on their respective comparative advantages in coping with the covariate and noncovariate sources of risk.
6
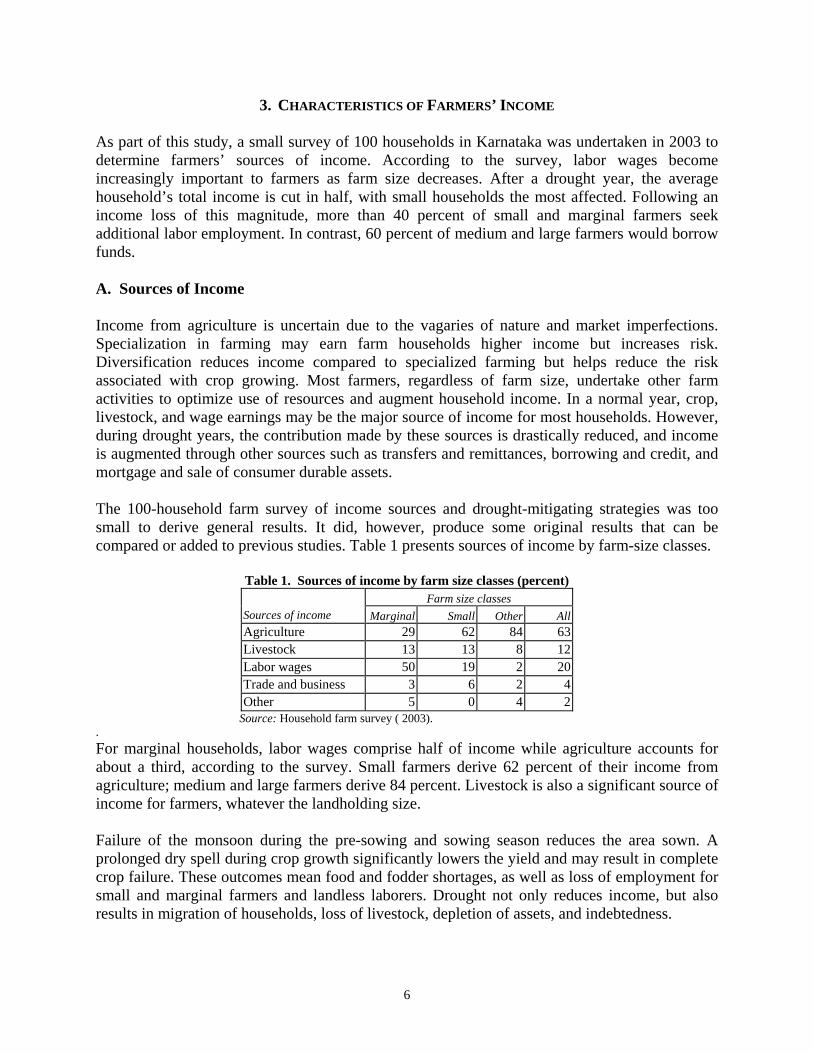
3. CHARACTERISTICS OF FARMERS’ INCOME As part of this study, a small survey of 100 households in Karnataka was undertaken in 2003 to determine farmers’ sources of income. According to the survey, labor wages become increasingly important to farmers as farm size decreases. After a drought year, the average household’s total income is cut in half, with small households the most affected. Following an income loss of this magnitude, more than 40 percent of small and marginal farmers seek additional labor employment. In contrast, 60 percent of medium and large farmers would borrow funds. A. Sources of Income Income from agriculture is uncertain due to the vagaries of nature and market imperfections. Specialization in farming may earn farm households higher income but increases risk. Diversification reduces income compared to specialized farming but helps reduce the risk associated with crop growing. Most farmers, regardless of farm size, undertake other farm activities to optimize use of resources and augment household income. In a normal year, crop, livestock, and wage earnings may be the major source of income for most households. However, during drought years, the contribution made by these sources is drastically reduced, and income is augmented through other sources such as transfers and remittances, borrowing and credit, and mortgage and sale of consumer durable assets. The 100-household farm survey of income sources and drought-mitigating strategies was too small to derive general results. It did, however, produce some original results that can be compared or added to previous studies. Table 1 presents sources of income by farm-size classes.
Table 1. Sources of income by farm size classes (percent) Farm size classes
Sources of income Marginal Small Other All Agriculture 29 62 84 63 Livestock 13 13 8 12 Labor wages 50 19 2 20 Trade and business 3 6 2 4 Other 5 0 4 2
Source: Household farm survey ( 2003). . For marginal households, labor wages comprise half of income while agriculture accounts for about a third, according to the survey. Small farmers derive 62 percent of their income from agriculture; medium and large farmers derive 84 percent. Livestock is also a significant source of income for farmers, whatever the landholding size. Failure of the monsoon during the pre-sowing and sowing season reduces the area sown. A prolonged dry spell during crop growth significantly lowers the yield and may result in complete crop failure. These outcomes mean food and fodder shortages, as well as loss of employment for small and marginal farmers and landless laborers. Drought not only reduces income, but also results in migration of households, loss of livestock, depletion of assets, and indebtedness.
7
The survey analysis provides estimates of the post-drought reduction in household income. As expected, a drought primarily affects agricultural income (minus 57 percent for the average household). Although the reduction in total income for the average household is 52 percent, small households lose more income (minus 56 percent). The total income of marginal households is reduced by 44 percent because of the relatively lower reduction in labor wages (minus 39 percent), their primary source of income. B. Risk-Mitigating Strategies Farmers and rural societies have devised strategies to reduce risks and to cope with income shortfalls. Risk-reduction strategies include crop diversification, cultivation of drought- or flood-resistant crops, labor employment, and other diversification into nonfarm income-earning activities. Risk-reduction strategies stabilize farm income but at a lower level. Farmers use different strategies to adjust to an income shortfall, including transfers from relatives, borrowing for consumption, increasing labor participation, sale of assets and stored produce, and migration in search of better employment opportunities. Traditional risk-coping mechanisms cannot, however, deal effectively with the covariability problem because a drought affects an entire area. For example, financial assistance in the form of transfers or loans from relatives and friends may not be forthcoming when production and price risks simultaneously affect nearly everyone living in a small rural community. Similarly, borrowing for consumption is costly when risk affects most area residents. During a crisis, liquidated assets will fetch low prices because many farmers are trying to sell at the same time. C. Prioritization of Mitigating Strategies The household survey collected information on the coping mechanisms used by households in Karnataka after a drought. More than 40 percent of the small and marginal farm operators identified wage employment as the preferred strategy, while medium and large farm households preferred borrowing. More than 10 percent of the marginal and small farms would sell goats and sheep to overcome the shortage in household income. About one-fourth of medium and large farms would use savings. None of the households would reduce consumption, sell stored farm produce, or sell farm implements. Small and marginal farmers are highly exposed to an income shortage in the event of drought because of their low resource endowment and savings. Large and medium farm operators have more resources and can better manage fluctuations in income. The after-effects of drought and other such catastrophic events for small farmers are more severe because they are more likely to face a liquidity problem in purchasing farming inputs for the next planting season.
8
4. CURRENT CROP INSURANCE SCHEME Karnataka has participated in every crop insurance scheme introduced in India since 1972, when the first scheme, based on an individual farm approach for cotton, was initiated. A. Earlier Indian Crop insurance Schemes The Indian government started the Pilot Crop Insurance Scheme (PCIS) in 1979, which shifted from the individual farm-based approach to an area-yield approach, available to any farmer utilizing agricultural credit. In 1985, the Indian government introduced the Comprehensive Crop Insurance Scheme (CCIS), linked to short-term crop loans and implemented on an area-yield basis; claims in excess of premiums were shared equally between the state and national governments (as had been the case with the PCIS). In 1997, an Experimental Crop Insurance Scheme similar to the CCIS was launched for small and marginal farmers with a 100 percent premium subsidy, but it was discontinued after one season due to administrative and financial difficulties. All these insurance programs have generated claims well in excess of premiums. B. National Crop insurance Scheme The current crop insurance system, the National Agricultural Insurance Scheme (NAIS), was introduced in 1999 and first utilized in Karnataka in 2000. The stated objectives of the scheme are to:
• Provide insurance coverage for all crops and financial support to all farmers in the event any notified crop fails as a result of natural calamities, pests, and diseases.
• Restore the credit eligibility of farmers, after a crop failure, for the next crop season. • Encourage farmers to adopt progressive farming practices, high-value inputs, and higher
technology in agriculture. • Help stabilize farm incomes, particularly in disaster years.
The government’s policy on crop insurance is also influenced by concerns that agricultural risks could cause welfare problems for the farming community, lead to default on loan repayments, cause an aversion to riskier but higher value crops, lead to suboptimal use of resources, and destabilize commodity supplies. At another level, the nature of risks and the financial capacity of the farming community have a significant influence on the government’s policy. These considerations include:
• Many agricultural risks are systemic (covariate) in nature, with a single event leading to multiple, highly correlated crop losses.
• Catastrophic losses are the norm rather than the exception. Consequently, crop insurance is expensive. This is particularly the case in Karnataka where 75 percent of the arable land is dependent on rainfall and where the state has witnessed rainfall deficiency 1 out of every 4.3 years.
• Production risks vary significantly across the country. • The Indian farmer’s ability to pay is extremely limited.
9
The NAIS provides for greater coverage of farmers, crops, and insured values than did the CCIS. A significant feature of the NAIS is that, while crop insurance is compulsory for farmers holding loans, farmers that do not borrow from financial institutions are also eligible to purchase insurance. The NAIS has the following elements: Crops covered Food crops (cereals, millets, pulses); oilseeds; commercial/horticultural crops (sugarcane, cotton, potato, onion, chili, turmeric, ginger, jute, tapioca, banana, pineapple). Additional crops are soon to be added, particularly horticulture crops. Eligibility for coverage Open to all states and union territories and to all farmers (including sharecroppers and tenant farmers) growing the notified crops in the notified areas. Farmers with crop loans must purchase crop insurance; others can elect to do so. Risks covered All natural non preventable risks. Sum insured For borrowing farmers, the loan amount is insurable, but the amount can be extended up to a value of 150 percent of average crop yield. Non-borrowers can be insured up to the value of 150 percent of average yield. Premium rates For food crops, the rate varies from 1.5 percent to 3.5 percent of the sum insured, depending on the crop and season. For commercial/horticultural crops, the actuarial rates apply. Premium subsidy The initial 50 percent subsidy for small and marginal farmers is being phased out; it was 30 percent for 2002–03. Scheme approach For widespread calamities, the scheme operates on an area-yield approach determined for each crop, with the area unit to be reached at the level of a panchayat [village] by 2006. For localized calamities, the scheme operates experimentally on an individual level in limited areas. Indemnity and deductible rates Indemnity and deductible rates and threshold yield are set at levels to discriminate between farmers according to the risk exposures as notified by the government of Karnataka.
10
• Three indemnity rates—90 percent, 80 percent, 60 percent—correspond to low-risk, medium-risk, and high-risk areas are available for all crops.4 For example, in the case of a 90 percent indemnity, the farmer retains area yield losses up to a deductible equal to 10 percent of guarantee yield. The insured farmers in a unit area may also opt for a higher indemnity upon payment of additional premium. (Indemnity limits are fixed, with one indemnity level per crop per state.)
• The threshold yield, the guaranteed yield for a crop in an insurance unit, is the moving average of the previous three years’ average yield for rice and wheat, and the previous five years’ average yield for other crops, multiplied by the indemnity rate.
Loss assessment and indemnity The loss assessment and indemnity payout is a function of both the area-yield approach and the individual farm-based indemnity approach, depending on the loss event.
• Widespread calamities. If the actual yield per hectare of the insured crop for the defined area falls short of the specified threshold yield, all the insured farmers growing that crop in the defined area are deemed to have suffered a yield shortfall. The scheme seeks to provide coverage against such a contingency.
• Localized calamities. Losses are assessed and claims settled individually for occurrence of localized perils such as hailstorms, landslides, cyclones, and floods.
Corpus fund To meet catastrophic losses exceeding 150 percent of premiums, where the premium is actuarially charged, a corpus fund is created with 50:50 contributions from the central government, and states or union territories. Risk sharing A formula has been devised for sharing risk between the national government and the states, depending on the type of crop. Transitional provisions have been established pending the implementation of an actuarial regime for food crops and oilseeds within five years. When the NAIS was introduced, the government decided to continue with the flat-rate system followed in the earlier schemes, based on the claims experience of the CCIS. The flat rate, based on the type of crop and the level of indemnity desired by the farmer, is the same throughout the country. The flat-rate premium applies to all basic crops including food grains, pulses, and oilseeds. The government intends to phase out the flat-rate system and replace it by an actuarial system by 2008. Actuarial rates apply for horticulture and commercial crops notified by the central and state governments.
4 Crops are classified as low risk when the variation coefficient is less than 15 percent; medium risk, between 16 percent and 30 percent; and high risk, higher than 30 percent.
11
C. Institutional Mechanism for Delivering Crop Insurance Various ministries and government organizations are involved in the design and delivery of crop insurance. Product design is carried out at the national level by the Agriculture Insurance Corporation of India in consultation with the Ministry of Agriculture, Government of India. The scheme is operational at the taluk level. The central and state Ministries for Agriculture make the decisions on crop notification, channeling of the premium subsidy, and contribution to the corpus fund. Similarly the central and state Ministries for Finance determine the funding to be earmarked for crop insurance each year and are directly involved in mobilizing resources, particularly when claims exceed premium revenue. The state Revenue Department issues certificates that provide information on land holdings, crops sown, and crop yield. These certificates become the basis for insurance coverage. The state Directorate of Economics and Statistics (DES) carries out the crop-cutting experiments to measure production yields. The Agriculture Insurance Corporation of India (AICI), is the implementing agency of the NAIS. All insurance-related cash flows such as premiums, claims, and subsidies are maintained by AICI. Claim settlements are based on instruction from AICI. The apex banks, state and district cooperative banks, and primary agricultural cooperative societies and banks are the main credit institutions. They also collect premiums and settle loss claims. D. Claim-Settlement Process The claim settlement process depends closely on the crop-cutting experiments that determine the actual area yield for different unit areas. Once the yield data are received from the state government (by the cut-off dates prescribed for the various crop seasons), claims are worked out from declarations received from participating financial institutions for each notified area, and approval is obtained. The funds needed to pay claims beyond the risk-sharing limits of the AICI are provided by both the central and state governments under the corpus fund. The claim checks along with claim particulars are released to the financial institution involved, which in turn credits the accounts of the individual farmers. Claims for all crops have to be approved by the AICI. However, the government may elect to scrutinize a claim within its risk liability. E. Reinsurance The NAIS does not purchase reinsurance to spread risk under the existing crop insurance program. Instead, the state and central government act as de facto reinsurers, since the costs of any claims in excess of premiums less administration cost are shared equally. In years when premium revenue exceeds claims, the money is transferred into the corpus fund, which can be tapped during adverse years. Although the NAIS is described as a national scheme, there is no pooling of risks between the states. The AICI maintains separate records at the state level for premiums and claims. Claims are settled against the premiums received from the respective states, and any claims in excess of premiums for a particular state are shared by the central government and that state government.
12
F. Disaster Relief In practice, the NAIS is complemented by state and national disaster relief programs that provide benefits to farmers in the event of drought. The Calamity Relief Fund meets immediate relief needs for the victims of cyclones, drought, earthquakes, fires, floods, and hailstorms. Under this arrangement a Calamity Relief Fund (CRF) is constituted in each state to receive funds, 75 percent of which come from the central government in the form of nonplan grants. Individual state funding volumes are based on relatively short-term averages, adjusted for inflation and mitigation efforts. Central government transfers are subject to receipt of proof from the states that CRF funding is being appropriately managed. States may also draw on up to 25 percent of the central funds due in the following year, subject to subsequent adjustment. Unused CRF funds may be carried forward to the next fiscal planning period. Following a severe disaster, the central National Calamity Contingency Fund (NCCF) meets relief expenditures in excess of a state’s CRF fund, subject to oversight by the National Center for Calamity Management (NCCM), constituted by the Ministry of Home Affairs. The NCCM monitors the occurrence and impact of the hazards mentioned above under the CRF. Funds are released to states after a decision by a High Level Committee on Calamity Relief. Assistance provided to the states by the central government from the NCCF is financed by an immediate levy of a special surcharge on federal taxes for a limited period. These programs provided Rs.2.3 billion (approximately US$50 million) to farmers from the central government in 2002 and were supplemented by an additional Rs.0.5 billion from the state government, funding a range of disaster relief services.
13
5. THE NATIONAL AGRICULTURAL INSURANCE SCHEME IN KARNATAKA
The NAIS was introduced in Karnataka during the Kharif 2000 season. Through 2002 (five crop seasons), the scheme covered 1.9 million farmers—about 16 percent of farmers and 14 percent of the farmed area, with a claims-to-premium ratio of about seven. This experience reflects the occurrence of three successive drought years, including the particularly severe drought of 2002. Has the NAIS been effective? The assessment found that
• The breadth of coverage is low, with only 16 percent of farmers subscribing to the crop insurance scheme.
• The operational effectiveness could be improved, especially the claim-settlement process. Delays defeat the purpose of assisting farmers in time for the next planting season and serve as a disincentive for participation in the crop insurance scheme.
• The financial performance could also be improved. The state and national governments have paid about 90 percent of the total cost of the NAIS over the last several years. Premium rates are not commensurate with risk, leaving the NAIS—even in most nondrought years—dependent on substantial fiscal support from the national and state governments.
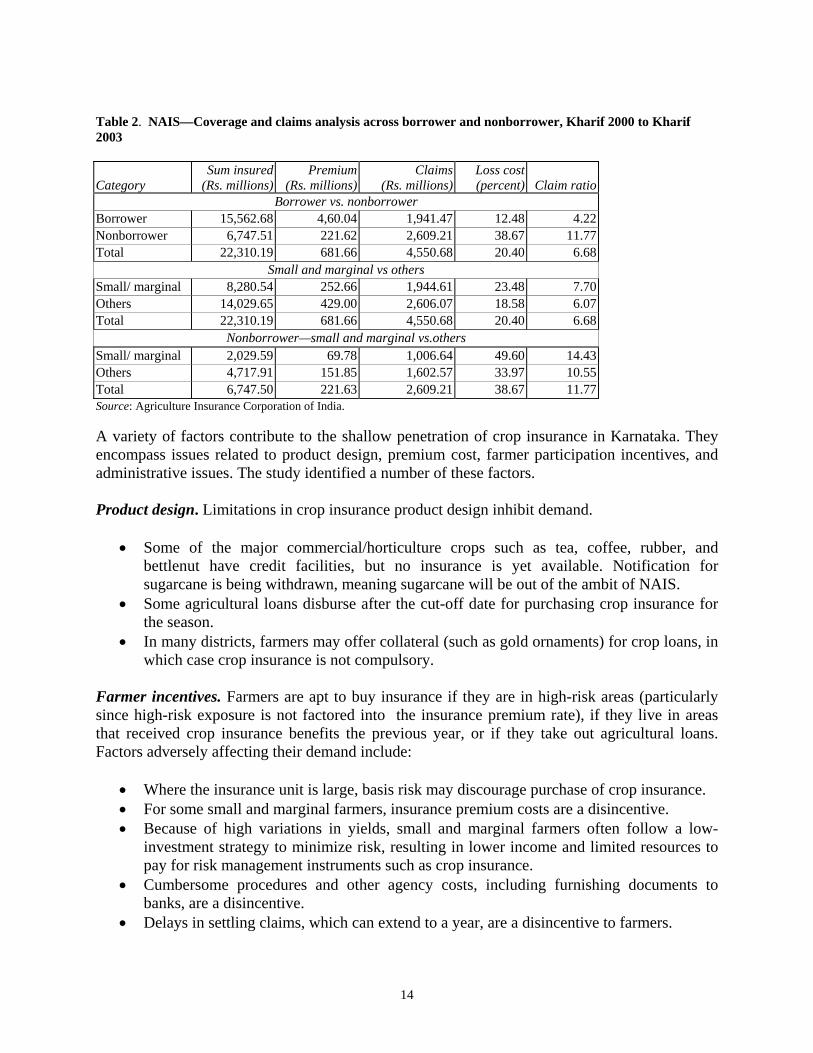
A. Breadth of Coverage The NAIS builds on the previous CCIS by extending eligibility to nonborrowing farmers. Since the NAIS was initiated, the number of insured farmers has been growing at a rapid pace, largely because this scheme was opened to all farmers and the three consecutive years of drought were unprecedented. Nonborrowing farmers made up 30 percent of the all insured in Karnataka in 2002 under the NAIS. However, despite the growth in participation, only 16.3 percent of all farmers in Karnataka are covered under the NAIS, and less than 14 percent of the area under major insurable crops is covered, despite the substantial subsidies built into the premiums. Although participation in the NAIS is absolutely mandatory as a matter of policy for farmers accessing credit through formal financial institutions—it is not in practice. Of the 16 percent of farmers in Karnataka who utilized agricultural credit in 2002–03, only 22.7 percent of their crop loans were insured in 2002. Small and marginal farmers constitute 69 percent of farm holdings in Karnataka, but only 49 percent of farmers participate in the NAIS. One reason may be that medium and large farmers have better access to crop loans than small and marginal farmers. The claims ratio for nonborrowing farmers is almost three times higher than for borrowing farmers, revealing adverse selection (table 2). The causes of adverse selection include the higher participation rate of nonborrowing farmers from high-risk areas and the fact that some less risky crops and areas are not notified. The data also show that, among the nonborrowers, small and marginal farmers have a lower involvement in terms of sums insured and premiums collected than other farmers, but their loss ratio is almost 50 percent higher.
14
Table 2. NAIS—Coverage and claims analysis across borrower and nonborrower, Kharif 2000 to Kharif 2003
Category Sum insured
(Rs. millions) Premium
(Rs. millions)Claims
(Rs. millions)Loss cost(percent) Claim ratio
Borrower vs. nonborrower Borrower 15,562.68 4,60.04 1,941.47 12.48 4.22 Nonborrower 6,747.51 221.62 2,609.21 38.67 11.77 Total 22,310.19 681.66 4,550.68 20.40 6.68
Small and marginal vs others Small/ marginal 8,280.54 252.66 1,944.61 23.48 7.70 Others 14,029.65 429.00 2,606.07 18.58 6.07 Total 22,310.19 681.66 4,550.68 20.40 6.68
Nonborrower—small and marginal vs.others Small/ marginal 2,029.59 69.78 1,006.64 49.60 14.43 Others 4,717.91 151.85 1,602.57 33.97 10.55 Total 6,747.50 221.63 2,609.21 38.67 11.77 Source: Agriculture Insurance Corporation of India. A variety of factors contribute to the shallow penetration of crop insurance in Karnataka. They encompass issues related to product design, premium cost, farmer participation incentives, and administrative issues. The study identified a number of these factors. Product design. Limitations in crop insurance product design inhibit demand.
• Some of the major commercial/horticulture crops such as tea, coffee, rubber, and bettlenut have credit facilities, but no insurance is yet available. Notification for sugarcane is being withdrawn, meaning sugarcane will be out of the ambit of NAIS.
• Some agricultural loans disburse after the cut-off date for purchasing crop insurance for the season.
• In many districts, farmers may offer collateral (such as gold ornaments) for crop loans, in which case crop insurance is not compulsory.
Farmer incentives. Farmers are apt to buy insurance if they are in high-risk areas (particularly since high-risk exposure is not factored into the insurance premium rate), if they live in areas that received crop insurance benefits the previous year, or if they take out agricultural loans. Factors adversely affecting their demand include:
• Where the insurance unit is large, basis risk may discourage purchase of crop insurance. • For some small and marginal farmers, insurance premium costs are a disincentive. • Because of high variations in yields, small and marginal farmers often follow a low-
investment strategy to minimize risk, resulting in lower income and limited resources to pay for risk management instruments such as crop insurance.
• Cumbersome procedures and other agency costs, including furnishing documents to banks, are a disincentive.
• Delays in settling claims, which can extend to a year, are a disincentive to farmers.
15
Administrative issues. Impediments to broader participation in the NAIS are insufficient awareness of the crop insurance scheme among bankers and limited commitment to the scheme among district administration officials. In some parts of the state, associations and unions representing farmers’ interests have obtained legal stay orders against compulsory provisions of the scheme. Crop loans in many districts are also disbursed by banks against hypothecation (of some asset including land) or against gold ornaments used as collateral, thus bypassing crop insurance. The NAIS operates on the basis of area yield. While the area-yield approach is appropriate for Karnataka, some weaknesses in its implementation could be addressed. The economic rationale for the area-yield approach is to trade off costs stemming from informational asymmetries against costs due to retention of basis risk. Under the NAIS, such a tradeoff does not occur effectively because insurance premium rates are calculated at the national level and thus they do not take local yield-risk heterogeneity into account. As a consequence, the existing crop insurance scheme exhibits the main disadvantages of both individual and area-yield systems. Like individual crop-yield insurance, the insurance premium does not take all the individual risk characteristics into account, leading to problems of adverse selection. Although local crop-yield data are available, they are not effectively used in pricing crop insurance contracts. As under standard area-yield crop insurance, the indemnity paid to farmers is not based on own-loss but on an index that is imperfectly correlated with the loss, generating basis risk that is costly for risk-averse farmers. B. Operational Effectiveness As mentioned earlier, a host of institutions are involved in the design, delivery, and servicing of the NAIS. From 10 to 15 different governmental departments (both national and state) and public sector institutions (including commercial banks) are involved. This leads to coordination problems, turf battles, lack of interest in product promotion, delays in claim settlement, and lack of enforcement of mandatory cover. The complex institutional mechanism for delivery of crop insurance is reflected in declining efficiency and responsiveness. The most serious problem is the delay in claim settlement. As mentioned above, this delay is a significant disincentive for farmers to purchase crop insurance. The primary reasons for the delay are the time taken to carry out the crop-cutting experiments and, when claims exceed premiums by a large margin, delayed flow of funds from the state government5. These delays prevent the restoration of farmers’ credit eligibility in time for the following crop season. The farmer is technically in default on the initial crop loan until repayment from the funds settling the claim. During this period, the farmer is not eligible for a new credit. Claim settlement usually takes a full year—two cropping cycles in some areas—defeating a basic purpose of the crop insurance scheme. The fastest NAIS has ever repaid claims was six months
5 Loss assessments by the DES take a long time (between six and nine months). Cash flow from the state government to the implementing agency to settle claims in excess of premiums is a lengthy process, and the transfer of premium and claim information to different institutions leads to additional delays in claim settlement. Further, banks take nearly a month to credit funds to the beneficiary farmer.
16
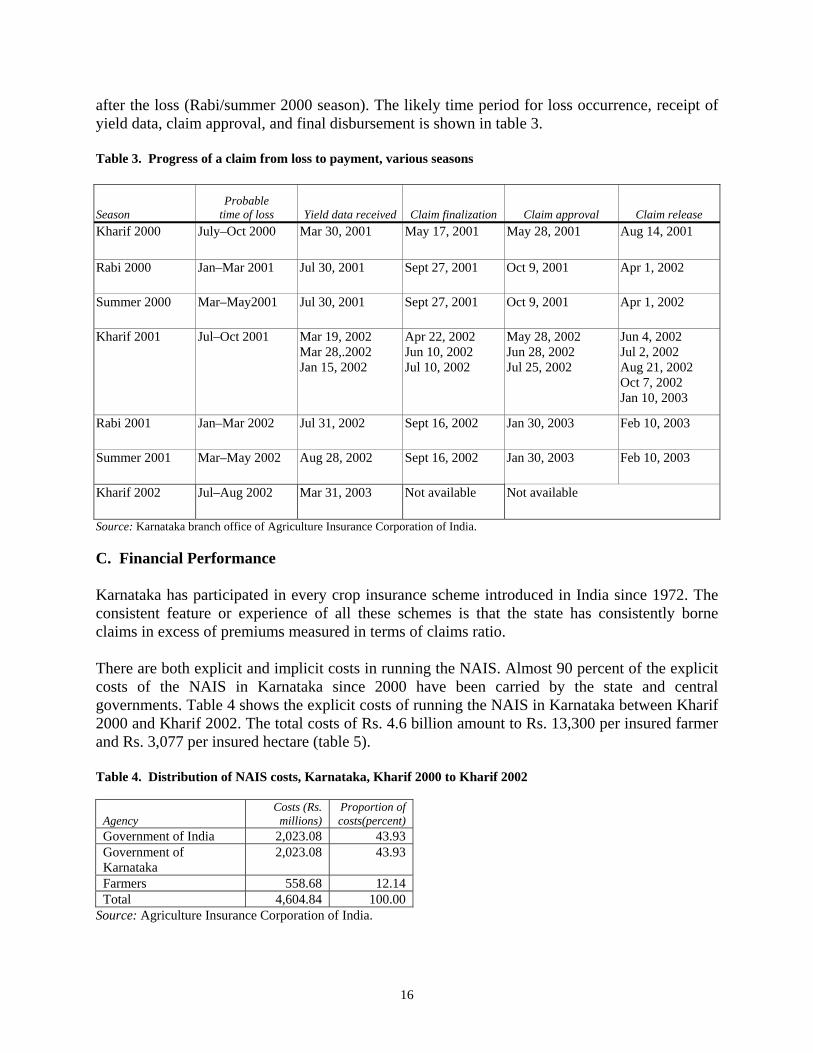
after the loss (Rabi/summer 2000 season). The likely time period for loss occurrence, receipt of yield data, claim approval, and final disbursement is shown in table 3. Table 3. Progress of a claim from loss to payment, various seasons
Season Probable
time of loss Yield data received Claim finalization Claim approval Claim release Kharif 2000 July–Oct 2000 Mar 30, 2001 May 17, 2001 May 28, 2001 Aug 14, 2001
Rabi 2000 Jan–Mar 2001 Jul 30, 2001 Sept 27, 2001 Oct 9, 2001 Apr 1, 2002
Summer 2000 Mar–May2001 Jul 30, 2001 Sept 27, 2001 Oct 9, 2001 Apr 1, 2002
Kharif 2001 Jul–Oct 2001 Mar 19, 2002 Mar 28,.2002 Jan 15, 2002
Apr 22, 2002 Jun 10, 2002 Jul 10, 2002
May 28, 2002 Jun 28, 2002 Jul 25, 2002
Jun 4, 2002 Jul 2, 2002 Aug 21, 2002 Oct 7, 2002 Jan 10, 2003
Rabi 2001 Jan–Mar 2002 Jul 31, 2002 Sept 16, 2002 Jan 30, 2003 Feb 10, 2003
Summer 2001 Mar–May 2002 Aug 28, 2002 Sept 16, 2002 Jan 30, 2003 Feb 10, 2003
Kharif 2002 Jul–Aug 2002 Mar 31, 2003 Not available Not available
Source: Karnataka branch office of Agriculture Insurance Corporation of India. C. Financial Performance
Karnataka has participated in every crop insurance scheme introduced in India since 1972. The consistent feature or experience of all these schemes is that the state has consistently borne claims in excess of premiums measured in terms of claims ratio. There are both explicit and implicit costs in running the NAIS. Almost 90 percent of the explicit costs of the NAIS in Karnataka since 2000 have been carried by the state and central governments. Table 4 shows the explicit costs of running the NAIS in Karnataka between Kharif 2000 and Kharif 2002. The total costs of Rs. 4.6 billion amount to Rs. 13,300 per insured farmer and Rs. 3,077 per insured hectare (table 5). Table 4. Distribution of NAIS costs, Karnataka, Kharif 2000 to Kharif 2002
Agency Costs (Rs. millions)
Proportion of costs(percent)
Government of India 2,023.08 43.93 Government of Karnataka
2,023.08 43.93
Farmers 558.68 12.14 Total 4,604.84 100.00
Source: Agriculture Insurance Corporation of India.
17
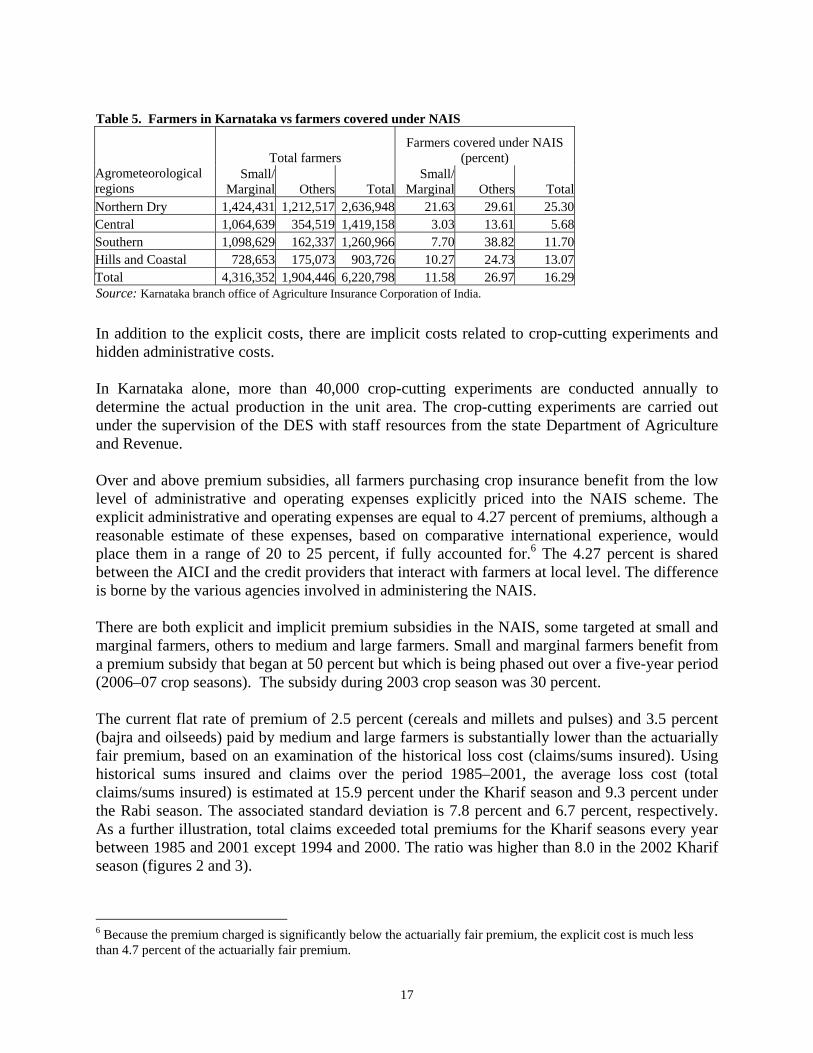
Table 5. Farmers in Karnataka vs farmers covered under NAIS
Total farmers Farmers covered under NAIS
(percent) Agrometeorological regions
Small/Marginal Others Total
Small/Marginal Others Total
Northern Dry 1,424,431 1,212,517 2,636,948 21.63 29.61 25.30Central 1,064,639 354,519 1,419,158 3.03 13.61 5.68Southern 1,098,629 162,337 1,260,966 7.70 38.82 11.70Hills and Coastal 728,653 175,073 903,726 10.27 24.73 13.07Total 4,316,352 1,904,446 6,220,798 11.58 26.97 16.29Source: Karnataka branch office of Agriculture Insurance Corporation of India.
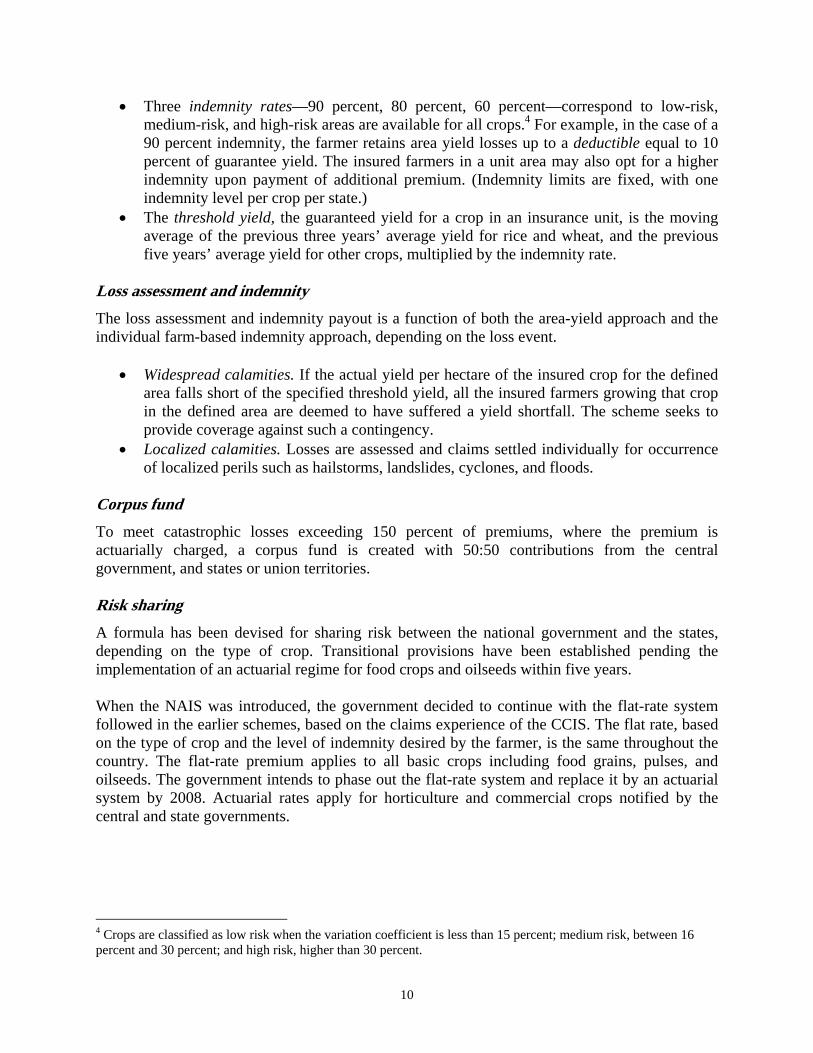
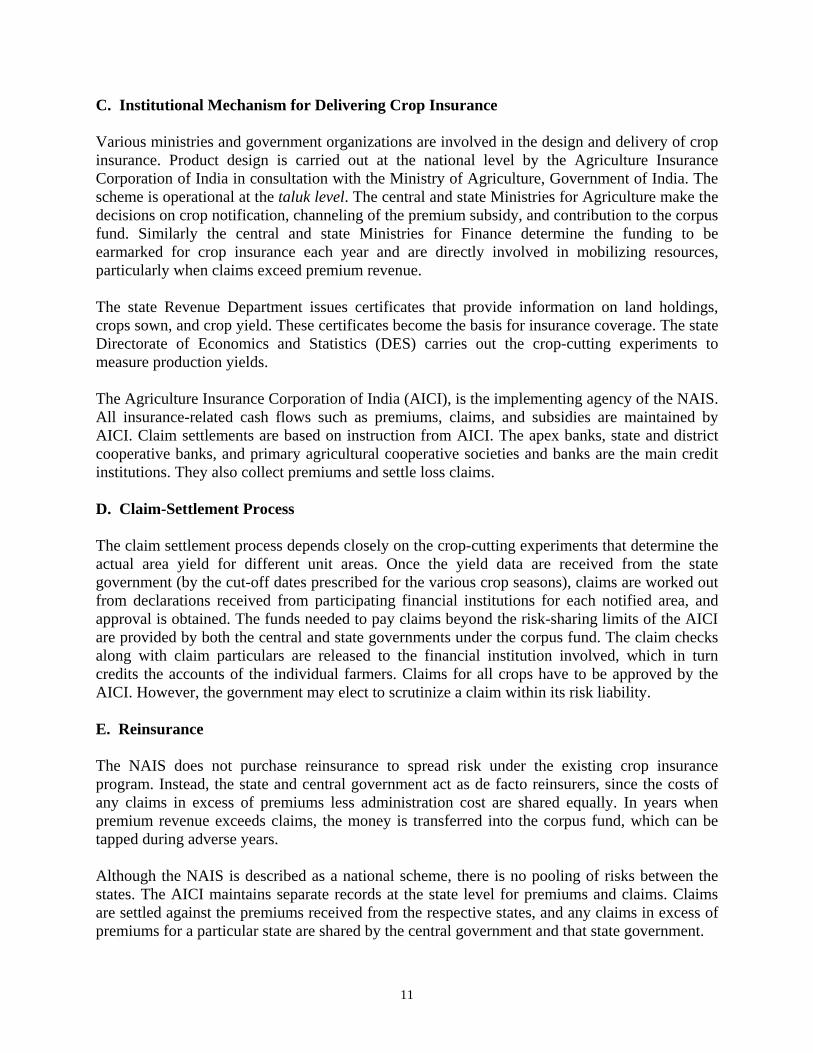
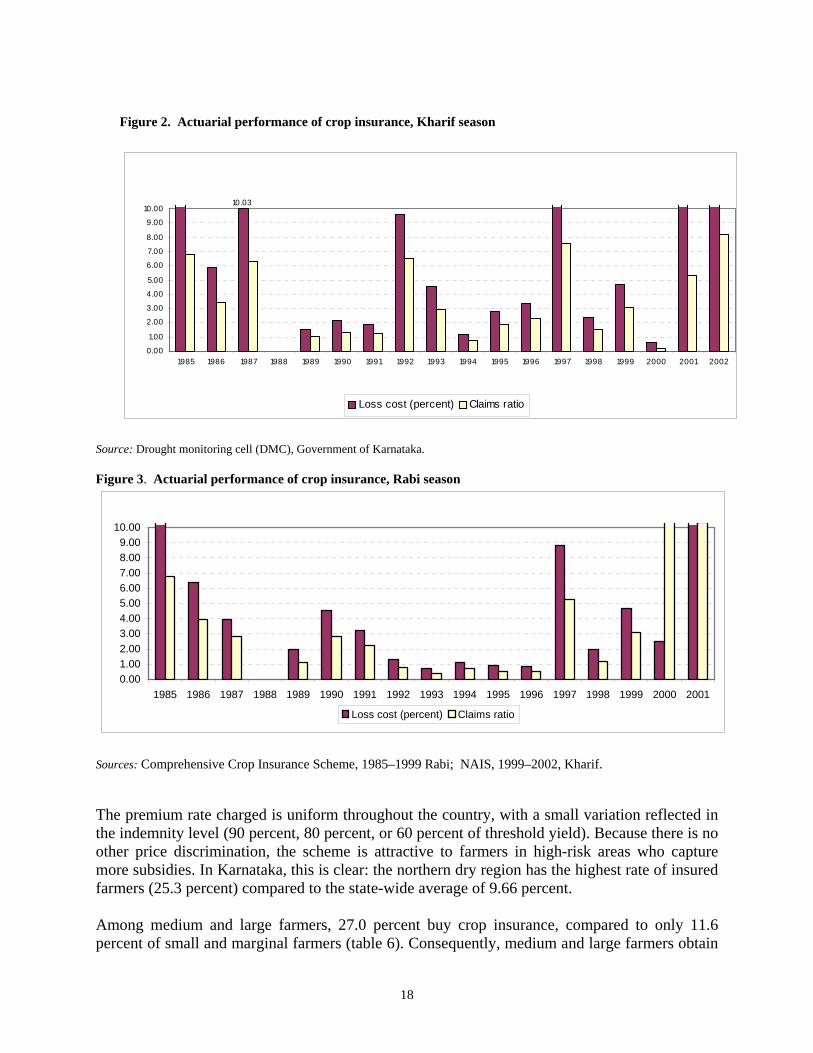
In addition to the explicit costs, there are implicit costs related to crop-cutting experiments and hidden administrative costs. In Karnataka alone, more than 40,000 crop-cutting experiments are conducted annually to determine the actual production in the unit area. The crop-cutting experiments are carried out under the supervision of the DES with staff resources from the state Department of Agriculture and Revenue. Over and above premium subsidies, all farmers purchasing crop insurance benefit from the low level of administrative and operating expenses explicitly priced into the NAIS scheme. The explicit administrative and operating expenses are equal to 4.27 percent of premiums, although a reasonable estimate of these expenses, based on comparative international experience, would place them in a range of 20 to 25 percent, if fully accounted for.6 The 4.27 percent is shared between the AICI and the credit providers that interact with farmers at local level. The difference is borne by the various agencies involved in administering the NAIS. There are both explicit and implicit premium subsidies in the NAIS, some targeted at small and marginal farmers, others to medium and large farmers. Small and marginal farmers benefit from a premium subsidy that began at 50 percent but which is being phased out over a five-year period (2006–07 crop seasons). The subsidy during 2003 crop season was 30 percent. The current flat rate of premium of 2.5 percent (cereals and millets and pulses) and 3.5 percent (bajra and oilseeds) paid by medium and large farmers is substantially lower than the actuarially fair premium, based on an examination of the historical loss cost (claims/sums insured). Using historical sums insured and claims over the period 1985–2001, the average loss cost (total claims/sums insured) is estimated at 15.9 percent under the Kharif season and 9.3 percent under the Rabi season. The associated standard deviation is 7.8 percent and 6.7 percent, respectively. As a further illustration, total claims exceeded total premiums for the Kharif seasons every year between 1985 and 2001 except 1994 and 2000. The ratio was higher than 8.0 in the 2002 Kharif season (figures 2 and 3).
6 Because the premium charged is significantly below the actuarially fair premium, the explicit cost is much less than 4.7 percent of the actuarially fair premium.
18
Figure 2. Actuarial performance of crop insurance, Kharif season
10.03
0.00
1.00
2.00
3.00
4.00
5.00
6.00
7.00
8.00
9.00
10.00
1985 1986 1987 1988 1989 1990 1991 1992 1993 1994 1995 1996 1997 1998 1999 2000 2001 2002
Loss cost (percent) Claims ratio
Source: Drought monitoring cell (DMC), Government of Karnataka. Figure 3. Actuarial performance of crop insurance, Rabi season
0.001.002.003.004.005.006.007.008.009.00
10.00
1985 1986 1987 1988 1989 1990 1991 1992 1993 1994 1995 1996 1997 1998 1999 2000 2001
Loss cost (percent) Claims ratio
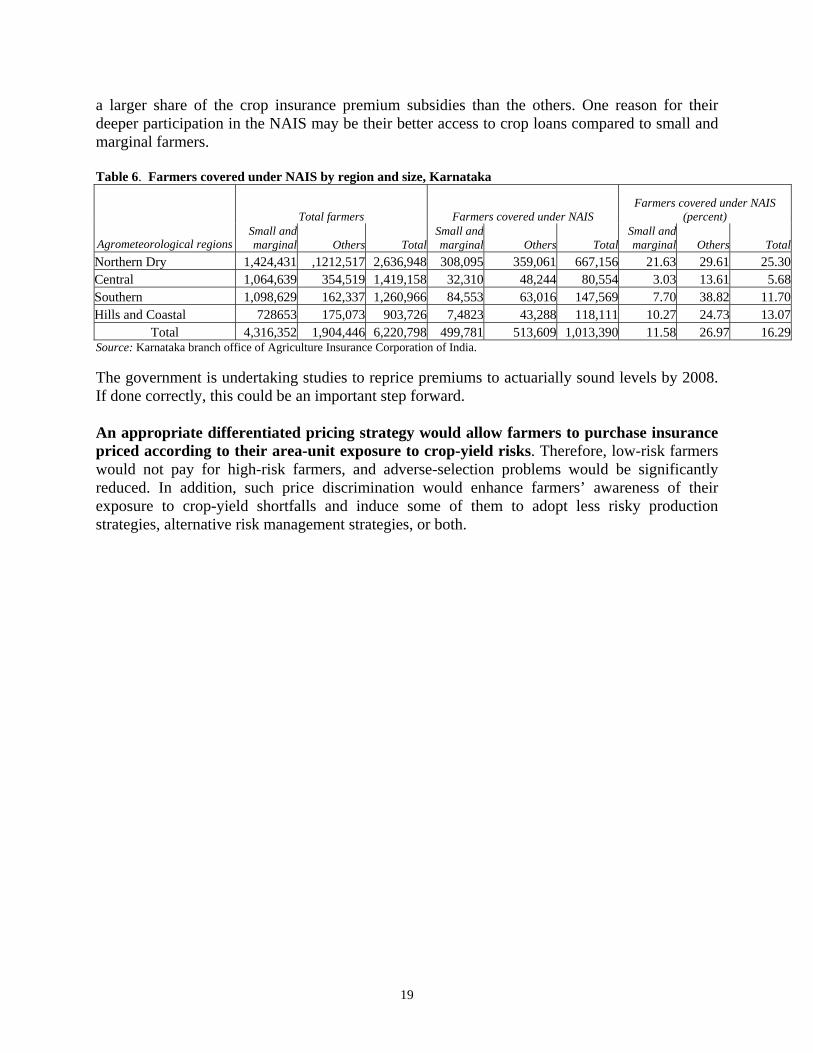
Sources: Comprehensive Crop Insurance Scheme, 1985–1999 Rabi; NAIS, 1999–2002, Kharif. The premium rate charged is uniform throughout the country, with a small variation reflected in the indemnity level (90 percent, 80 percent, or 60 percent of threshold yield). Because there is no other price discrimination, the scheme is attractive to farmers in high-risk areas who capture more subsidies. In Karnataka, this is clear: the northern dry region has the highest rate of insured farmers (25.3 percent) compared to the state-wide average of 9.66 percent. Among medium and large farmers, 27.0 percent buy crop insurance, compared to only 11.6 percent of small and marginal farmers (table 6). Consequently, medium and large farmers obtain
19
a larger share of the crop insurance premium subsidies than the others. One reason for their deeper participation in the NAIS may be their better access to crop loans compared to small and marginal farmers. Table 6. Farmers covered under NAIS by region and size, Karnataka
Total farmers Farmers covered under NAIS Farmers covered under NAIS
(percent)
Agrometeorological regions Small and marginal Others Total
Small and marginal Others Total
Small and marginal Others Total
Northern Dry 1,424,431 ,1212,517 2,636,948 308,095 359,061 667,156 21.63 29.61 25.30Central 1,064,639 354,519 1,419,158 32,310 48,244 80,554 3.03 13.61 5.68Southern 1,098,629 162,337 1,260,966 84,553 63,016 147,569 7.70 38.82 11.70Hills and Coastal 728653 175,073 903,726 7,4823 43,288 118,111 10.27 24.73 13.07
Total 4,316,352 1,904,446 6,220,798 499,781 513,609 1,013,390 11.58 26.97 16.29Source: Karnataka branch office of Agriculture Insurance Corporation of India. The government is undertaking studies to reprice premiums to actuarially sound levels by 2008. If done correctly, this could be an important step forward. An appropriate differentiated pricing strategy would allow farmers to purchase insurance priced according to their area-unit exposure to crop-yield risks. Therefore, low-risk farmers would not pay for high-risk farmers, and adverse-selection problems would be significantly reduced. In addition, such price discrimination would enhance farmers’ awareness of their exposure to crop-yield shortfalls and induce some of them to adopt less risky production strategies, alternative risk management strategies, or both.
20
6. LINKAGES WITH THE AGRICULTURE CREDIT PROGRAM
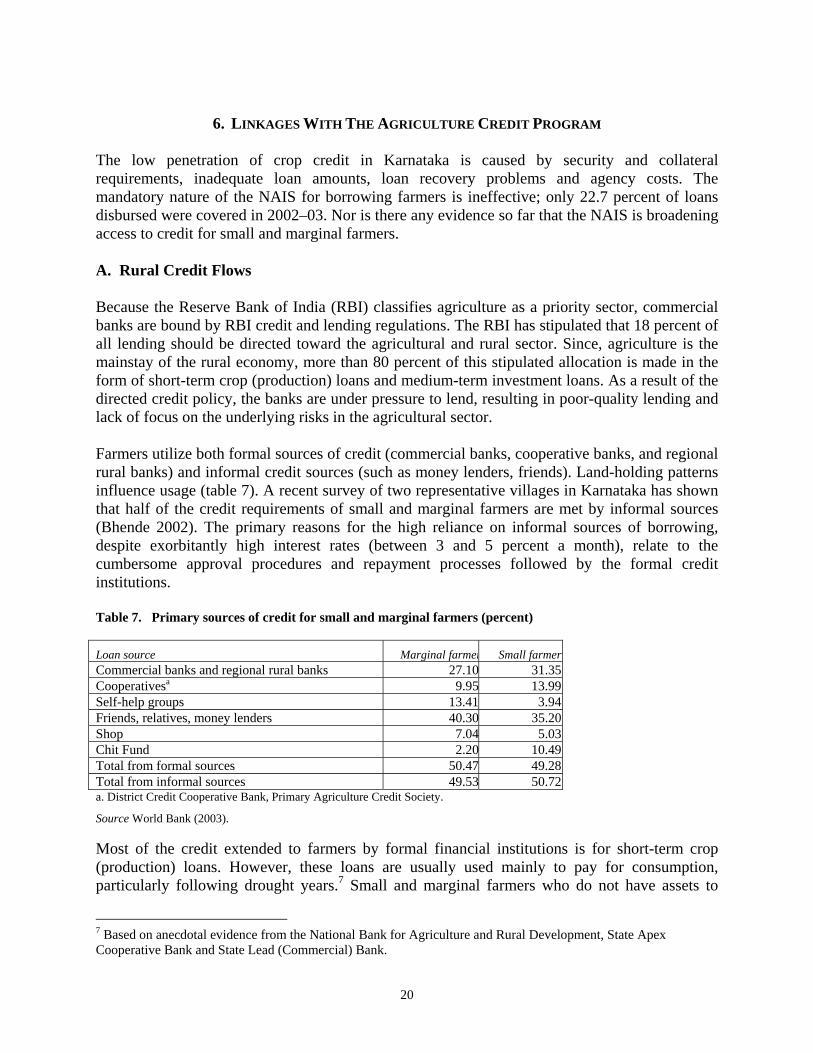
The low penetration of crop credit in Karnataka is caused by security and collateral requirements, inadequate loan amounts, loan recovery problems and agency costs. The mandatory nature of the NAIS for borrowing farmers is ineffective; only 22.7 percent of loans disbursed were covered in 2002–03. Nor is there any evidence so far that the NAIS is broadening access to credit for small and marginal farmers. A. Rural Credit Flows Because the Reserve Bank of India (RBI) classifies agriculture as a priority sector, commercial banks are bound by RBI credit and lending regulations. The RBI has stipulated that 18 percent of all lending should be directed toward the agricultural and rural sector. Since, agriculture is the mainstay of the rural economy, more than 80 percent of this stipulated allocation is made in the form of short-term crop (production) loans and medium-term investment loans. As a result of the directed credit policy, the banks are under pressure to lend, resulting in poor-quality lending and lack of focus on the underlying risks in the agricultural sector. Farmers utilize both formal sources of credit (commercial banks, cooperative banks, and regional rural banks) and informal credit sources (such as money lenders, friends). Land-holding patterns influence usage (table 7). A recent survey of two representative villages in Karnataka has shown that half of the credit requirements of small and marginal farmers are met by informal sources (Bhende 2002). The primary reasons for the high reliance on informal sources of borrowing, despite exorbitantly high interest rates (between 3 and 5 percent a month), relate to the cumbersome approval procedures and repayment processes followed by the formal credit institutions. Table 7. Primary sources of credit for small and marginal farmers (percent) Loan source Marginal farmer Small farmerCommercial banks and regional rural banks 27.10 31.35Cooperativesa 9.95 13.99Self-help groups 13.41 3.94Friends, relatives, money lenders 40.30 35.20Shop 7.04 5.03Chit Fund 2.20 10.49Total from formal sources 50.47 49.28Total from informal sources 49.53 50.72a. District Credit Cooperative Bank, Primary Agriculture Credit Society.
Source World Bank (2003). Most of the credit extended to farmers by formal financial institutions is for short-term crop (production) loans. However, these loans are usually used mainly to pay for consumption, particularly following drought years.7 Small and marginal farmers who do not have assets to
7 Based on anecdotal evidence from the National Bank for Agriculture and Rural Development, State Apex Cooperative Bank and State Lead (Commercial) Bank.
21
pledge as collateral obtain consumption loans in the informal sector at the high interest rates mentioned above. According to 1991–1992 data of the National Sample Survey Organisation (the most recent data available), only 15.6 percent of farmers borrowed from institutional lenders. This fraction hides a large heterogeneity among groups of farmers. Access to credit improves with holding size: 9.0 percent for marginal holdings, 18.0 percent for small holdings, 21.1 percent for medium holdings, and 24.0 percent for large holdings. The use of purchased agricultural inputs is growing, with small and marginal farms and medium and large farms using comparable levels of inputs such as seed, fertilizers, and plant protection chemicals per unit of land. The increasing commercialization and demand for market inputs creates demand for credit. Because small and marginal farmers are asset poor and lack tangible collateral, they have little access to cheap institutional credit. As a result, most small and marginal farmers resort to purchasing inputs on informal sector credit and compromising on input quality, to the detriment of crop yield. Some key reasons for the low penetration of credit in Karnataka are:
• Security/collateral requirements. • Inadequate loan amounts. Small and marginal farmers need consumption credit as well as
credit for inputs. Lacking any other source to meet their consumption requirements, they utilize production loans for consumption, especially during droughts.
• Low recovery rates. The recovery rate was as low as 39 percent for primary agricultural credit societies and as high as 72 percent for state cooperative banks in 1996 (Deshpande and Raju 2001). Low recovery rates are due to: crop-yield loss from drought; use of crop loans for consumption (or nonproductive activity); and crop-income loss due to price fluctuations, particularly in the case of horticultural crops.8 .
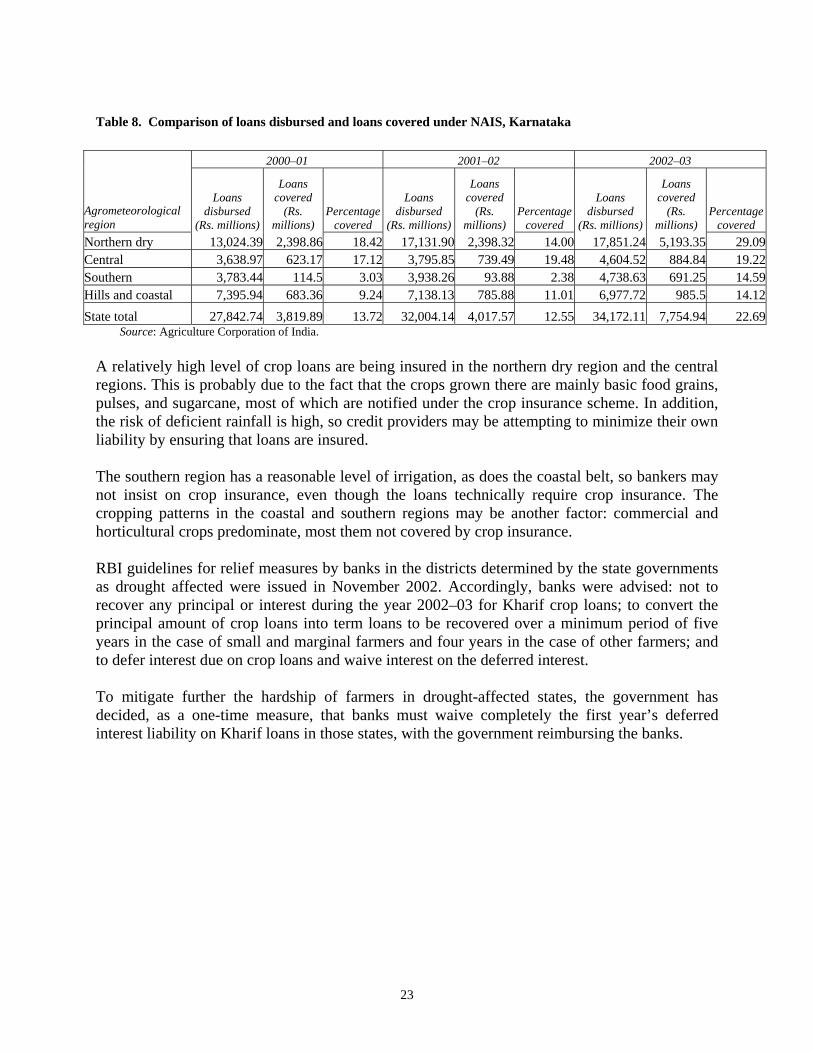
B. Crop Credit and Crop Insurance The NAIS is mandatory for all farmers who borrow from formal financial institutions and voluntary for nonborrowing farmers (a major change from the earlier CCIS). Comparison of crop (production) loans disbursed at district level for 2000–01, 2001–02, and 2002–03 (table 8) against crop insurance coverage revealed the following:
• The coverage of crop loans under NAIS during 2000–01 was low at 13.7 percent. In only 8 districts out of 26 did the coverage exceed 20 percent, and in 14 districts the coverage was under 10 percent. Coverage was Rs.3.8 billion against loan disbursements of Rs.27.8 billion.
8 In 1995/96, horticultural production contributed more than 44 percent of the value of agricultural production in Karnataka.
22
• In 2001–02, although the nominal amount covered increased, the percentage covered declined. As against loan disbursement of Rs.32.0 billions, the coverage was only Rs.4.0 billion (12.6 percent).
• The period 2002–03 is crucial because of inclusion of annual commercial/horticultural crops in the state under NAIS. The coverage of loans under NAIS increased significantly. Against loan disbursements of Rs.34.1 billion, coverage was Rs.7.8 billion (22.7 percent).
23
Table 8. Comparison of loans disbursed and loans covered under NAIS, Karnataka
2000–01 2001–02 2002–03
Agrometeorological region
Loans disbursed
(Rs. millions)
Loans covered
(Rs. millions)
Percentage covered
Loans disbursed
(Rs. millions)
Loans covered
(Rs. millions)
Percentage covered
Loans disbursed
(Rs. millions)
Loans covered
(Rs. millions)
Percentage covered
Northern dry 13,024.39 2,398.86 18.42 17,131.90 2,398.32 14.00 17,851.24 5,193.35 29.09Central 3,638.97 623.17 17.12 3,795.85 739.49 19.48 4,604.52 884.84 19.22Southern 3,783.44 114.5 3.03 3,938.26 93.88 2.38 4,738.63 691.25 14.59Hills and coastal 7,395.94 683.36 9.24 7,138.13 785.88 11.01 6,977.72 985.5 14.12State total 27,842.74 3,819.89 13.72 32,004.14 4,017.57 12.55 34,172.11 7,754.94 22.69
Source: Agriculture Corporation of India.
A relatively high level of crop loans are being insured in the northern dry region and the central regions. This is probably due to the fact that the crops grown there are mainly basic food grains, pulses, and sugarcane, most of which are notified under the crop insurance scheme. In addition, the risk of deficient rainfall is high, so credit providers may be attempting to minimize their own liability by ensuring that loans are insured. The southern region has a reasonable level of irrigation, as does the coastal belt, so bankers may not insist on crop insurance, even though the loans technically require crop insurance. The cropping patterns in the coastal and southern regions may be another factor: commercial and horticultural crops predominate, most them not covered by crop insurance. RBI guidelines for relief measures by banks in the districts determined by the state governments as drought affected were issued in November 2002. Accordingly, banks were advised: not to recover any principal or interest during the year 2002–03 for Kharif crop loans; to convert the principal amount of crop loans into term loans to be recovered over a minimum period of five years in the case of small and marginal farmers and four years in the case of other farmers; and to defer interest due on crop loans and waive interest on the deferred interest. To mitigate further the hardship of farmers in drought-affected states, the government has decided, as a one-time measure, that banks must waive completely the first year’s deferred interest liability on Kharif loans in those states, with the government reimbursing the banks.
24
7. CONCLUSIONS AND RECOMMENDATIONS As stated at the outset of this report, minimizing the impact of natural disaster–related crop losses, particularly losses due to drought, is a significant public policy objective for the government of Karnataka. An effective crop insurance system is a critical element of a strategy to cushion income losses for farmers, finance inputs for agricultural production in the next planting season, and deepen the penetration of agricultural credit for investment to boost agricultural productivity. A. Conclusions At the same time, Karnataka presents a challenging environment in which to implement a crop insurance program. The large and growing number of small and marginal holdings makes it difficult to expand the reach of a program to all farmers, including those who are most vulnerable to extreme poverty in the event of a catastrophic yield loss. Frequent droughts increase the importance of crop insurance, while compounding the difficulties of designing a crop insurance system that is financially viable for the government yet affordable for farmers. In practice, Karnataka appears to have a two-part system for compensating farmers for crop losses. Although this study focuses on crop insurance, the national and state disaster-relief programs play an equally important role after natural disasters, and these programs extend to a wider swath of small and marginal farmers than does the NAIS, which in any event reaches only 10 percent of farmers in Karnataka. This coexistence of crop insurance and disaster relief programs for farmers is not unique to India. Crop insurance is unlikely to gain widespread penetration among farmers in Karnataka to the point of displacing the need for disaster relief in the event of serious drought. With only 16 percent of farmers accessing formal credit and less that a third of these buying crop insurance, the base is not a strong enough for the program to become central to the agricultural risk management agenda. Moreover, as subsidies for small and marginal farmers are reduced and premiums rise, the higher cost of crop insurance will continue to limit demand, especially if the government shifts to actuarial determination of food crop and oilseed premiums. Even without the premium increases, higher participation rates would only add to the fiscal burden of the scheme. However, the government should address the design problems that have been identified as disincentives to farmer participation in the NAIS, while taking measures to improve its operational effectiveness and financial performance. Consequently, if the Karnataka government is considering how best to limit the impact of disasters while supporting improvements in the crop insurance scheme, it might explicitly consider how crop insurance and disaster relief programs could best be structured to work better in tandem. Crop insurance may be less effective than disaster relief for coping with very infrequent but severe events and may best be utilized as a complement to other existing risk management instruments. One of the motivations for the government to support crop insurance, apart from the risk management benefit, is to cap government expenses after a disaster. At present, no capping
25
occurs at either state or national levels. The low coverage of crop loans and insured farmers, the flaws in premium ratings, and severe and frequent droughts have imposed a substantial burden on state and national finances following droughts. In addition to covering crop insurance claims, the government provides disaster-relief measures such as food aid, employment, reduced interest on crop loans, and seed and fertilizer subsidies to encourage farmers to grow during the next cropping cycle. In the aftermath of the 2002 drought, the Karnataka government (and those of other affected states), had to petition the central government ad hoc for allocations from the National Calamity Contingency Fund in order to finance disaster relief. If crop insurance and disaster relief are to be considered elements of a coherent strategy, several key issues have to be addressed.
• First among these is ensuring that the approach takes into account the situation and incentives facing small and marginal farmers. Lessons would have to learned from the failed experiment in 1997 with fully subsidized crop insurance for small and marginal farmers.
• Second, the appropriate roles for government and the private sector in the strategy would have to be clearly defined.
• Third, the linkages between state and national programs would have to be explicitly considered, together with the possible effects on them of program innovations.
In this context, the government might consider a general disaster relief–crop insurance strategy, under which it would
• Automatically cover from public resources systemic catastrophic risks that occur less frequently than, say, 1 in 15 years, based on objective rainfall and temperature records.
• Integrate this coverage with the calamity relief and mitigation mechanisms currently in place and allocate most calamity relief to small and marginal farmers.
• Set a policy framework under which market-based, consumption-smoothing mechanisms (including NAIS) can play a greater role in covering crop-yield risks for cash income farmers and agribusiness (this could include fixed rupee premium subsidies, but not claims subsidies).
• Work with the national crop insurer to fix the design, operational, and financial problems of the NAIS.
• Seek to reinsure public and NAIS catastrophic risks on international markets. • Employ more progressive premium structures.
B. Recommendations Four main recommendations flow from these conclusions.
1. The government should formalize a disaster relief program focused on covering catastrophic, systemic natural disaster risks for small and marginal farmers.
In Mexico, the government established a Fund for Natural Disasters (FONDEN) as a last resort source of post-disaster financing for reconstruction of public infrastructure and compensation to low-income producers for crop and livestock losses arising from natural disasters. FONDEN is a
26
disaster-relief program rather than an insurance program, but the agricultural component has characteristics similar to crop insurance programs (Skees et al. 2002: 16–17). For example, loss claims trigger field inspections. Farmers are provided cash at a predetermined level per hectare, and assistance is capped at 5 hectares per farmer, which is both efficient and weights the assistance to smaller holders. Irrigated or insured land is not eligible for payments. One drawback of the scheme is that the declaration of disaster areas is the outcome of a political decisionmaking process that, together with arranging state or municipal coparticipation payments, can take time. Such a program in Karnataka could be based on an area-yield index, building on the existing crop insurance scheme. It would also be possible to introduce a weather-related trigger (for example, a 25 percent deficit in rainfall, equivalent to the 1985 and 2002 droughts). A significant advantage of establishing a scheme of this type is that the arrangements for assessing claims and delivering relief could be determined before the drought or other disaster occurs. If Karnataka were to establish such a program—independently or in conjunction with the existing central/state calamity relief arrangements—explicit decisions would have to be made at the outset of fiscal cost that could be supported and relevant funding mechanisms. From this starting point it would be possible to examine a number of scenarios for the frequency of disasters that would be covered, the range of eligible farmers and the amount of assistance to be offered in order to arrive at the optimum affordable solution. Such criteria would need to be objectively defined to deal with political economy pressures. With the parameters established, it would be possible to calculate the premium value of the assistance being offered to farmers, as if it were a crop insurance program.
2. The government should undertake a set of reforms to improve product design of the NAIS and make the scheme more operationally effective and financially viable.
The key goals in reforming the NAIS should be to
• Replace its risk-taking role with respect to the small and marginal farmer segments. It could possibly continue to have an agency role.
• Address product design and other disincentives for farmer participation in order to improve scheme coverage.
• Find a more efficient way to estimate area yields and shortfalls, and fix the problems that delay settlement of claims.
• Move to setting premiums actuarially, so that the full pure premium becomes explicit and subsidies are provided only through flat-rate premium support and possibly some administrative cost transfer.
Product design
Some useful changes in the NAIS insurance product might be possible if a disaster relief program were to be adopted. If the benefits of a disaster relief program were extended to all farmers, but with hectare limits for medium and large farms, the NAIS would not have to cover catastrophic risks. The product could be redesigned to cover losses based on, for example, a rainfall shortage in 1 out of 15 years With the catastrophic tail removed from the distribution, it would be more feasible for a larger group of farmers to pay the actuarial pure premium for
27
insurance (premium issues are discussed below under financial performance). Private insurers should be permitted to underwrite this product. Medium and large farmers seeking increased coverage could obtain it from private insurers. The area-based approach adopted in the current NAIS program is fundamentally sound in concept. However, a number of steps could be taken to make it work better in practice. First, decreasing the size of the unit areas, as is planned, is an important step where cost-effective. Nevertheless, a further study should first investigate the benefits (lower basis risk) and the costs (higher agency costs due to moral hazard, adverse selection problems, or both) of such a decrease. Second, a longer time series of area-yield experience is needed to establish a central trend line and to set threshold yields—four-to-five year moving averages are not sufficient. Third, the program of extensive crop-cutting experiments and local control is expensive and creates incentives to underreport yields. As part of product design, underwriting procedures should be improved to more accurately assess high-risk areas and likely loss experience to determine the appropriate premium levels under an actuarially based system. The NAIS should also take steps to address the issues related to product design and farmer incentives identified earlier in the study such as increasing the number of notified crops and linking insurance contract deadlines more closely to credit cycles. Of particular importance is improving the efficiency of the claim-settlement process (discussed below under operational effectiveness). Operational effectiveness The government should examine how to reduce the delay in settling claims, which is about one year under the NAIS. A number of steps could be taken to address this problem.
• First, providing partial insurance indemnities right after the occurrence of an insured loss could help farmers restore credit eligibility, replace lost income, or both. Partial insurance could be provided based on a rain shortfall trigger. This would require an understanding of the correlation between rain shortfalls and yield losses for crops grown in each area unit.
• Second, loss assessment functions need to be revised. The NAIS crop-cutting experiment system needs to be made more efficient. The NAIS should create a small-loss assessment policy and overview unit to report each year on the cost and effectiveness of the system and to recommend improvements. For small and marginal farmers, infrequent catastrophe payouts could be based on objective weather and satellite data.
• Third, the establishment of a premium structure based on actuarial calculations would remove the required contributions from the national and state governments to pay claims, mitigating one source of delay.
Financial performance The financial performance of the NAIS could be improved by basing premium calculations on actuarial determination of risks and setting gross (after flat subsidy) pure premiums at levels to cover expected claims. As well as improving the financial condition of the NAIS, such an approach would potentially reduce adverse selection and improve farmer awareness of risks. The government plans to move premiums on food crops and oilseeds to an actuarial basis within five
28
years, which would be an important step. The implicit administrative costs under the scheme should be made explicit and steps taken to explore ways of reducing them. Access to credit The role of credit cooperatives could be enhanced to expand small and marginal farmers’ access to credit. Economies of scale are a useful way of sharing the fixed cost burden of new technology and improving farming practices. Economies of scale also help make provision of credit and insurance more effective. Small and marginal farmers could join to make decisions collectively on insurance purchases, credit, and access to markets.
3. The government should establish a policy framework inviting the private sector to expand its role in covering more frequent and individual crop-yield risks.
There is substantial scope for the private sector to add value by participating in the crop insurance market. First, private insurance companies should be permitted to underwrite the NAIS crop insurance product if they find it profitable to do so. Second, the private insurance market is well suited to offer companion “wrap-around” products that will enable individual farmers to increase their insurance cover or to cover individual basis risk.
4. The government should seek to reinsure catastrophic drought risks and those under NAIS on international markets.
Hedging the government’s fiscal exposure to drought is a useful risk management decision at the macroeconomic level. The government has enough experience with drought to estimate the average annual cost of all drought-related insurance and relief programs. Based upon these calculations, the government could consider reinsuring itself in the international market. This could have the benefits of spreading the cost of disasters over many years, since premiums are paid annually; providing immediate liquidity following a disaster, which will facilitate a more proactive response, instead of a scramble for resources; and bringing about discipline in financial planning at the macro level. Credible area-yield assessments would be required to trigger reinsurance payments, and the government might have to assume a high deductible before the reinsurance market pays out. Weather derivatives Weather derivatives could also be considered insurance tools. A preliminary study (World Bank 2003) shows that rainfall variability could explain a large part of crop-yield variability (up to 79 percent for specific crops in specific taluks). Such innovative instruments could be combined with area-yield insurance products to speed up the assessment of crop-yield losses. Revenue insurance. Price risk is also an important risk component, particularly for horticultural farmers. Therefore, revenue insurance products, covering joint yield and price risks, could be investigated.
29
Risk sharing Risk-sharing reforms in the NAIS could also allow the government to assess its contingent liability following droughts and to investigate risk-sharing tools at the national level (risk pooling across the states) and the international level (reinsurance).
30
REFERENCES
Bhende, M. J. (2002), “Flow of credit to small and marginal farmers: A case study of Karnataka,” Agricultural Development and Rural Transformation Unit, ISEC, Bangalore, Ministry of Agriculture, Government of India, New Delhi.
Deshpande, R.S. and Raju, K.V. (2001) Rural policy for growth and poverty reduction, Institute for Social and Economic Change Report, Institute for Social and Economic Change, Bangalore, Dec. World Bank. 2003. Karnataka Crop Insurance Study. Washington, D.C.: World Bank, South Asia Region.
ADDITIONAL READINGS Agro-climatic Regional Planning Unit (1998), Agro-Climatic Regional Planning—Recent Developments, ARPU Working Paper no. 10, Planning Commission, Ahmedabad.
Ansari, H. (2000), “The Insurance Industry in India,” from a survey by the Financial Express on ‘Insuring India’s Growth,’ pp. 8-12. Vistas of Risk Management.
Aziz, Abdul and Sudhir Krishna, (1997), Land Reforms in India: Karnataka Promises Kept and Missed, Sage, New Delhi.
Basu, D. N. and V. Rajagopalan (1991), “Agro-climatic Regional Planning: Regional Indicators and Typologies,” Indian Journal of Agricultural Economics, Vol. 45 (3).
Bhende, M. J. and H. G. Hanumappa (1994), “Agro-Climatic Regional Planning: A sub-regional Analysis,” Agricultural Development and Rural Transformation Unit, ISEC, Bangalore, Directorate of Economics and Statistics, Ministry of Agriculture, Government of India, New Delhi,.
Bhende, M. J. (2000). “Cropping Pattern and resource use efficiency in major crops: a case study of Karnataka,” Agricultural Development and Rural Transformation Unit, ISEC, Bangalore, Directorate of Economics and Statistics, Ministry of Agriculture, Government of India, New Delhi.
Bhende, M. J. and H. G. Hanumappa (2001), “Agrarian Structure and Indicators of Agricultural Performance: A Case Study of Karnataka,” IASSI Quarterly, vol. 17(1) July—September.
Binswanger, H. P. and N. S. Jodha (1978), Manual of instructions for economic investigators in ICRISAT’s village level studies. Vol. II, ICRISAT Economics Program Village Level Studies Series, Patancheru, A.P. India.
Dandekar, V.M. (1985), “Crop insurance in India: A review 1976-77 to 1984-85,” Economic and Political Weekly.
Dantwala, M. L. (1986), “Agrarian Structure and Agrarian Relations in India” in M. L. Dantwala and others (eds.) Indian Agricultural Development Since Independence—A Collection of Essays. New Delhi: Oxford and IBH Publishing Company Pvt. Ltd.
Deshpande, R. S. (2002), “Farmers suicides in Karnataka,” Economic and Political Weekly, Vol. 37 (26), June 29, 2002.
Doherty, N. and O. Mahul (2001), “Mickey Mouse, Moral Hazard and Securitization: Decomposing Informative Triggers,” working paper, Wharton School of the University of Pennsylvania.
31
General Insurance Corporation of India (GIC) (1985-2002). Data and Reference material of CCIS and NAIS.
Government of India, (1997), Approach Paper to the Ninth Five –Year Plan (1997-2002), A draft paper circulated during the meeting of the National Development Council held on 16th January 1997, at New Delhi, Planning Commission.
Government of India, (1999), “Agro-Climatic Regional Planning: An Overview,” Planning Commission, Government of India, New Delhi. December 1989.
Government of Karnataka (1993), Report of the Expert Committee on stagnation of Agricultural Productivity in Karnataka during 1980s” (Chairman: Shri T. R. Satish Chandran), Bangalore.
Government of Karnataka (1995), Report on Census of Agricultural Holdings in Karnataka 1990-91, Part II, and State Agricultural Commissioner, Directorate of Economics and Statistics, Govt. of Karnataka, November 1995.
Government of Karnataka (1998), Annual Plan 1997-98, vol. I. Bangalore: Planning, Institutional Finance and Statistics and Science and Technology Department.
Government of Karnataka (1999), Agricultural Census 1995-96: Part I, Report on Operational Holdings in Karnataka, directorate of Economics and Statistics and State Agricultural Census Commissioner, Bangalore.
Government of Karnataka (1999), Agricultural Census 1995-96: Part II, Report on Operational Holdings in Karnataka, directorate of Economics and Statistics and State Agricultural Census Commissioner, Bangalore.
Kumar, P. (2001), “Agricultural Performance and Productivity” in S. S. Acharya and D. P. Chaudhari (eds.) Indian Agricultural Policy at the Crossroads, Rawat Publications, Jaipur.
Mahul, O. (1999). Optimum Area Yield Crop Insurance, American Journal of Agricultural Economics, 81(1): 75-82.
Mahul, O. (2001). Optimal Insurance Against Climatic Experience, American Journal of Agricultural Economics, 83(3): 593-604.
Mahul, O. (2002). Coping with Catastrophic Risk: The Role of (Non)-Participating Contracts, INRA Department of Economics, 2002. Presented at the 29th Seminar of the European Group of Risk and Insurance Economists, Nottingham, UK, September 2002.
Mahul, O. (2003). Hedging Price Risk in the Presence of Crop Yield and Revenue Insurance, European Review of Agricultural Economics, 30(2): 1-23.
Martin, S.W., B. Barnett and K. Coble (2001), Developing and Pricing Precipitation Insurance, Journal of Agricultural and Resource Economics 26(1), 261-274.
Mishra, P.K. (1996), Agricultural Risk, Insurance and Income—A study of the impact and design of India’s Comprehensive Crop Insurance Scheme, Avebury Ashgate Publishing Limited.
Parchure, Rajas (2002), “Varsha Bonds and Options, a Capital Market Solutions for Crop Insurance problems,” working paper, National Insurance Academy, Pune, India.
PartnerRe (2000), Proceedings of “International Agricultural Insurance Seminar held at Locarno, Switzerland from 5th to 10th September, 2000.
32
Prakash (2003), Background Note, for a workshop on ”Drought mitigation planning in Karnataka State: A review” held at Kannada Sangha Bhavana, University of Agricultural Sciences, Habbal, Bangalore, May 21-22, 2003.
Rao, H.C.H., S. K. Ray and K. Subba Rao (1988), Unstable Agriculture and Droughts: Implications for Policy, New Delhi: Vikas Publications House.
Rao, K.N. (2002), “Crop Insurance in India—Past, Present and Future Vision,” The Journal of Business Perspective, July, 2002.
Ray, P.K. (1991), A Practical Guide to Multi-risk Crop Insurance for Developing Countries, Oxford and IBH Publishing Co. Pvt. Ltd.
Sangwan, S. S. (1991), “Dynamics of Increasing Potato Acreage in Uttar Pradesh: An Inter-regional Analysis of Farmer’s’ Response,” Indian Journal of Agricultural Economics, Vol. 46(3).
Sawant, S. D. and C. V. Achutan (1995), “Agricultural Growth across Crops and Regions: Emerging Trends and Patterns,” Economic and Political Weekly, Vol. 30(12).
Sathyapriya, V. S. (1996), “Export Potential of Horticultural Crops in Karnataka: A Study of Selected Fruits,” Institute for Social and Economic Change, Bangalore, Directorate of Economics and Statistics, Ministry of Agriculture, Government of India, New Delhi.
Singh, R. P., M. Asokan and T. S. Walker (1982), “Size, composition, and other aspects of rural income in the semi-arid tropics of India,” Economics Program Progress Report 33, International Crops Research Institute for the Semi-Arid Tropics (ICRISAT), Patancheru, Andhra Pradesh 502324, India.
Skees, J., P. Varangis, D. Larson and P. Siegel, “Can Financial Markets be Tapped to Help Poor People Cope with Weather Risks?” World Bank Working Paper, 2002.
Turvey, C. (2001), “Weather Derivatives for Specific Event Risks in Agriculture,” Review of Agricultural Economics 23(2), 333-351.
Umamaheshwari, L, S. Krishnamoorthy, P Nasurudeen, and Roop Kumar Kolli (2001), “Pattern of Drought and survival strategies of farm households in a drought-prone district in Tamil Nadu,” Indian Journal of Agricultural Economics, Vol. 56 (4).
University of Agricultural Sciences (1996), Small farmers Economic Viability in Karnataka: An Interim Research Report (Kannada), State Planning Board, Government of Karnataka, Bangalore.
Walker, T. S., R. P.Singh, M. Asokan and H. P. Binswanger (1983), “Fluctuations in income in three villages of India’s semi-arid tropics,” Economics Program, Progress Report 57, International Crops Research Institute for the Semi-Arid Tropics, Patancheru, 502324, India.