Embed Size (px)
Citation preview

Cronfa - Swansea University Open Access Repository
_____________________________________________________________
This is an author produced version of a paper published in :
Computers
Cronfa URL for this paper:
http://cronfa.swan.ac.uk/Record/cronfa24656
_____________________________________________________________
Paper:
Matthew, E., Chao, T. & Robert, L. (2015). Design of a Flow Visualisation Framework. Computers, 4(1), 24-38.
http://dx.doi.org/10.3390/computers4010024
_____________________________________________________________ This article is brought to you by Swansea University. Any person downloading material is agreeing to abide by the
terms of the repository licence. Authors are personally responsible for adhering to publisher restrictions or conditions.
When uploading content they are required to comply with their publisher agreement and the SHERPA RoMEO
database to judge whether or not it is copyright safe to add this version of the paper to this repository.
http://www.swansea.ac.uk/iss/researchsupport/cronfa-support/
Computers 2013, xx, 1-x; doi:10.3390/——
OPEN ACCESS
computersISSN 2073-431X
www.mdpi.com/journal/computers
Article
Design of a Flow Visualisation FrameworkMatt Edmunds 1,*, Chao Tong 1, Robert S. Laramee 1
1 Computer Science Dept, Swansea University, Wales, UK.
* Author to whom correspondence should be addressed; [email protected]
Received: xx / Accepted: xx / Published: xx
Abstract: Research software often consists of individual isolated prototype applications.Small proof of concept applications are usually enough for demonstrating new algorithms.However, the unification of new research algorithms into a cohesive software framework hasadvantages. Adding new features to an existing pipeline reduces implementation overhead.The researcher is more able to compare and contrast existing or previous work with newresearch. Utilizing previously implemented techniques, researchers are able to combinevisualization options in new ways that typical research prototypes cannot. The softwareapplication can be made available to the domain expert for evaluation and future use. Thesegoals are in part realized by utilizing recent advancements in game design technology, andby leveraging features available with recent graphics hardware. Described is the design ofa feature rich flow visualization software framework in more detail than a typical researchpaper. In contrast to most research prototypes, the system we present handles real-worldsimulation data sets by interfacing directly with the commercial package called tecplot. Wepresent a description of our system in detail where as previously published work focuses onthe research contribution. The effectiveness and scalability of the approach is also discussed.
Keywords: Software; Design; Application
1. Introduction
Computational fluid dynamics (CFD) is a rapidly developing tool for fluid analysis [1]. With widereaching industrial applications such as automotive, aerospace, weather, and medical, its an increasinglyimportant software application used to speed up the design process while reducing costs. With increasingdata complexity and size, the ability of the user to interpret the CFD results becomes increasinglydifficult. Post processing software aims to alleviate this challenge by providing visualization methods for
Computers 2013, xx 2
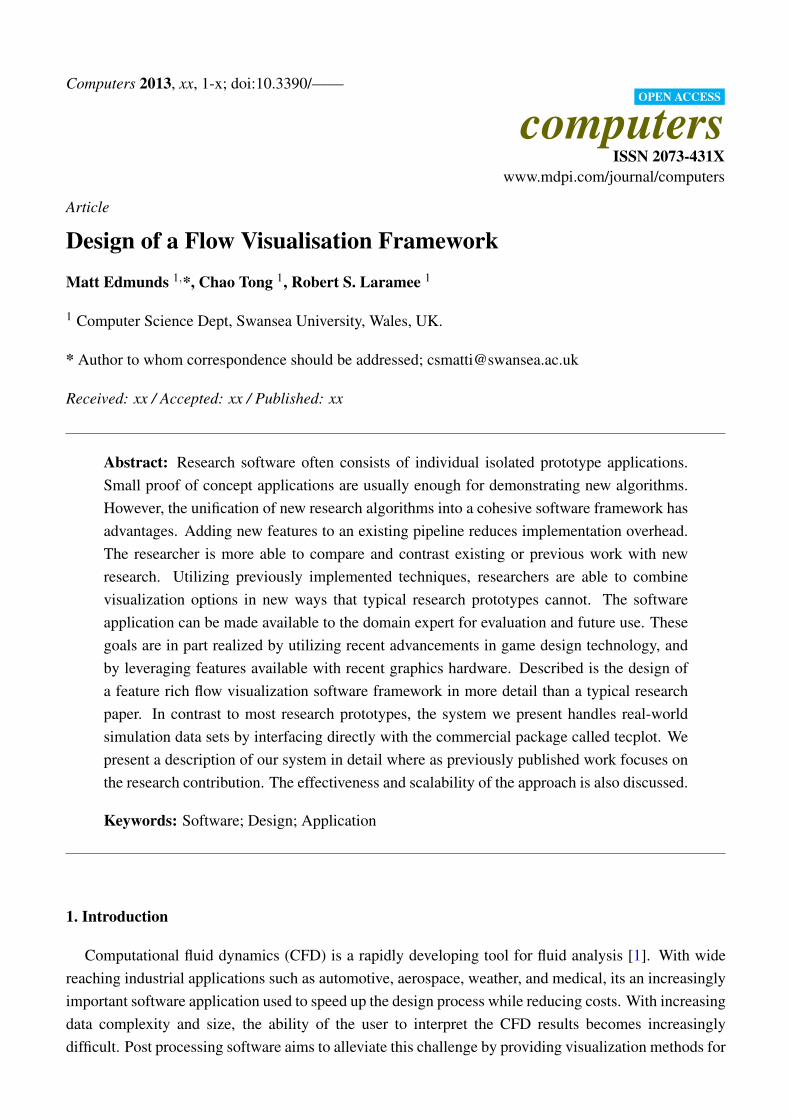
Figure 1. The CFD simulation pipeline is comprised of a preprocessing stage, the simulationstage, and the post processing stage. This illustration shows the inputs and outputs of eachstage, and highlights where the different tasks reside.
the evaluation and correlation of simulation results. Our visualizations include the latest state-of-the-artflow visualization techniques. Bridging the gap between current visualization software techniques andthe latest research techniques is an important goal of our work.
Illustrated in Figure 1 is the CFD simulation pipeline which highlights the inputs, outputs, andprocessing steps. This process is described in three stages:
1. Preprocessing: A surface and the volumetric mesh is generated to model a physical object. Thismesh is generated from computer aided design (CAD) geometry utilizing mesh generation andmanipulation tools. Boundary conditions and fluid properties are defined and specified.
2. Simulation: A computational simulation of the fluid is performed using numerical methods appliedto the mesh, with respect to the boundary conditions and fluid properties.
3. Post Processing: The simulation result is explored, analyzed, and visualized using a range oftechniques dependent on the requirements of the CFD engineer.
In order to present a visualization toolkit which is capable of dealing with large simulation dataand complex algorithms, a comprehensive and versatile visualization framework is needed. It is thefocus of this chapter to describe the design and implementation of a state-of-the-art flow visualizationframework which provides scientists and engineers with effective solutions for the visualization ofCFD simulation data. By drawing on recent developments in the game and graphics card hardwareindustry, and by combining several scientific visualization techniques our visualization framework yieldsfollowing benefits:
• A platform independent flexible framework which implements state of the art research algorithmsin flow visualization. In particular, stream surface seeding algorithms are incorporated which arenot available in previous systems such as the VTK or Visit [3].
• A framework specifically designed to enable quick integration of new algorithms for study, testing,and evaluation.
Computers 2013, xx 3
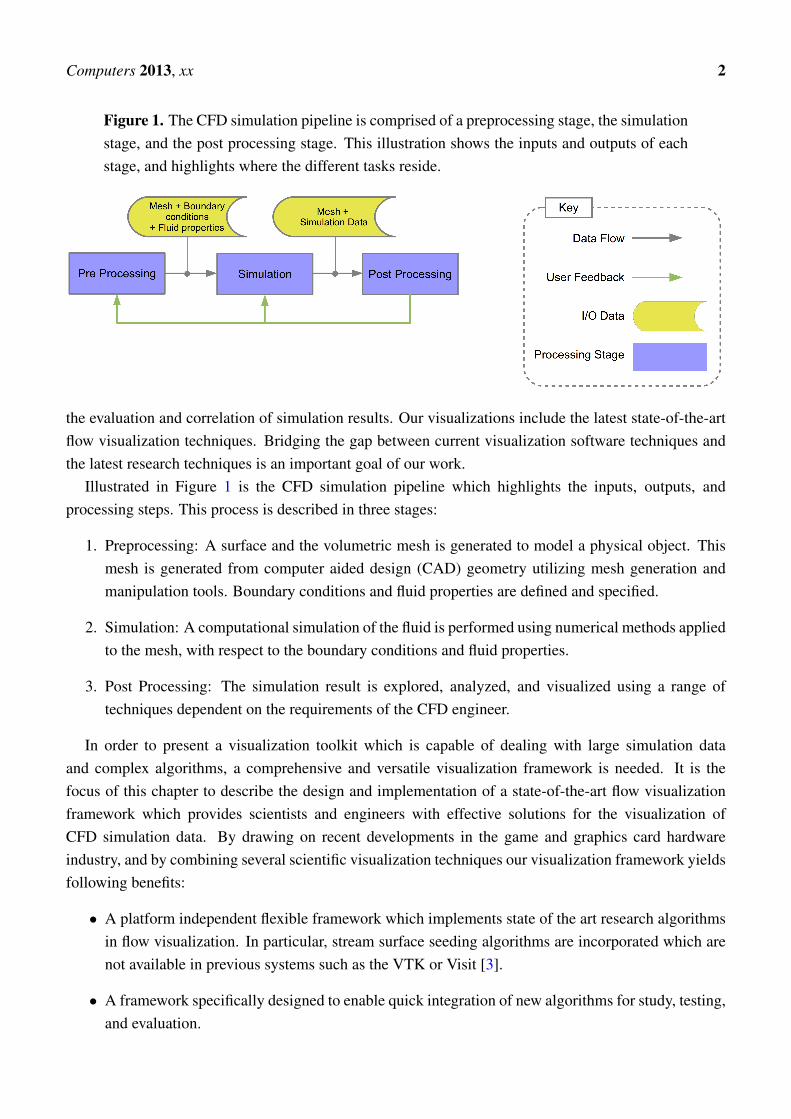
Figure 2. This top level overview of the system shows three main subsections of the softwareapplication framework. The GUI subsystem provides the user interface and all associateduser interaction and feedback. The logic subsystem encapsulates the processing aspects ofthe framework. The Services subsystem provides system wide services for use by the othersubsystems.
• A smooth and efficient threaded user interface, even when processing large data and complexalgorithms.
• Simultaneous comparisons of different techniques.
What we have developed is a novel research prototypes for flow visualization. However, unlike mostprototypes, it interfaces directly with commercial software. Thus it combines the best of both worlds:state-of-the-art flow visualization with commercial grade data sets. The visualizations are novel forflow and also offer fast performance. The flow visualization techniques are more current then previoussystems such as the VTK or Para-view [3]. What we present here are the design and implementationconsiderations for our software. The information necessary to implement these features is missing fromour previous papers [16][17] because of the strict focus on visualization and space limitations. Also, tosee performance details, for example how our software performs compared to previous systems, we referthe reader to Edmunds et al [16][17].
The remainder of this paper is organized as follows: Section 2 outlines the software applicationframework. Section 3 details the design of the GUI. Section 4 describes the services subsystem. Section5 details the logic sub system. Section 6 highlights our conclusions and proposed future work.
2. System Overview
In this section we start by discussing some design and implementation related work, we then providean overview of our application framework and related subsystems. Laramee et al. [2] describe the designand implementation of a flow visualization subsystem which utilizes the geometric and texture-basedflow visualization techniques.
Computers 2013, xx 4
In order to guarantee the quick responsiveness for user interaction even when dealing with large data,Piringer et al. [4] present a generic multi-threading architecture which enables early cancellation ofthe visualization thread due to user interaction without common pitfalls of multi-threading. They alsopresent an interactive visualization toolkit, HyperMoVal [5], as an implementation of this architecture inpractice.
McLoughlin and Laramee [6] describe a flow visualization software framework that offers a richset of features. Their application also serves as a basis for the implementation and evaluation of newalgorithms. The application is easily extendable and provides a clean interface for the addition of newmodules. Peng et al. [7] present a multi-linked framework which provides customized visualizationtechniques for engineers to gain a fast overview and intuitive insight into the flow past the marine turbine.
Our software application system is divided into three main subsystems; the GUI, the Logic, and theServices. See Figure 2. We divide the system into smaller easier to maintain subsystems using logicalgroupings of similar functionality. The GUI subsystem is responsible for capturing the user input forcomputing a visualization, displaying the resultant visualization, and supporting user interaction withthe visualization. The Logic subsystem encapsulates the algorithms used to compute the visualizations.This subsystem processes the input data as specified by the user and computes the visualization basedon the given user input parameters and selected algorithm. Providing a central point of storage for inputand derived data is the Service subsystem.
Another feature of our framework is the Visualization Object (VO). The VO is an encapsulatingaggregate of all the elements of an individual feature or individual algorithm. Some examples of featuresare: Interaction VO’s which encapsulate the interaction with the visualization e.g. panning, zooming,and rotating. Color map VO’s encapsulating color map functionality. Stream surface VO’s whichencapsulates the stream surface generation algorithms [8].
For each VO within our framework there is an associated Frame Object (FO); an interface forencapsulating the I/O with the VO. This design approach creates a simple interface for adding newfunctionality quickly and easily. We further discuss VO’s and FO’s within our application, along withthe detailed description of the structure of our framework in Sections 3, 4, and 5.
3. GUI Subsystem Design
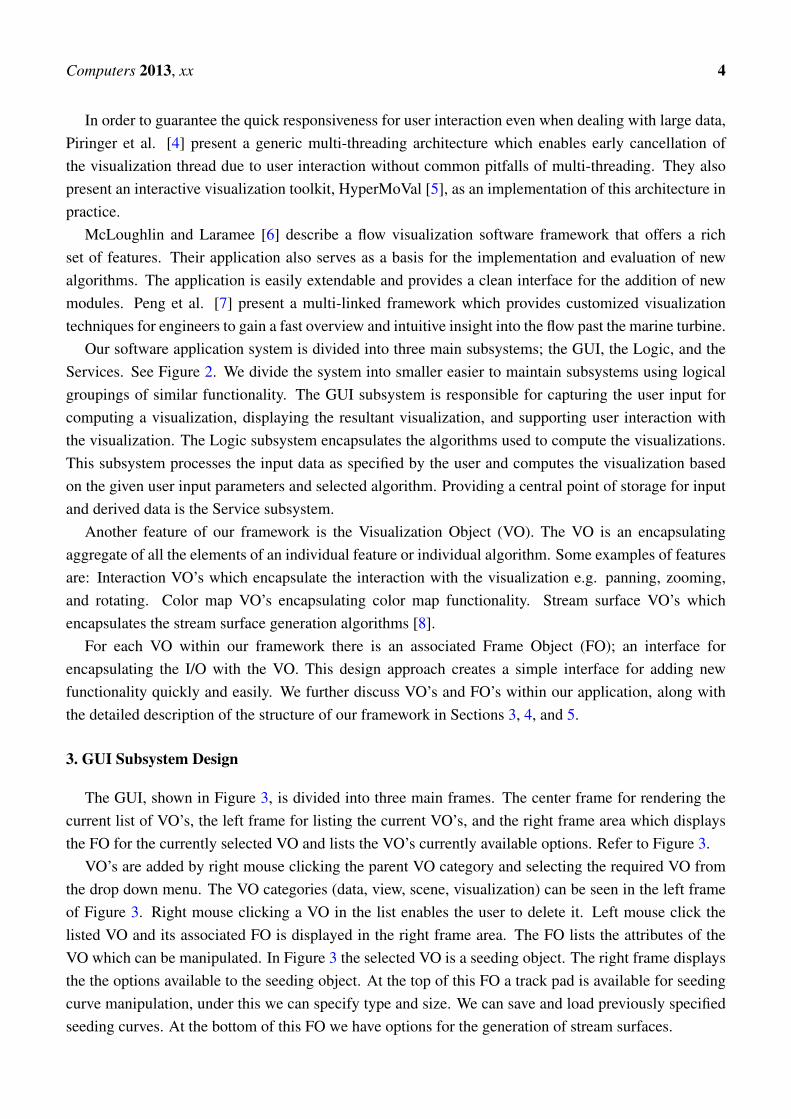
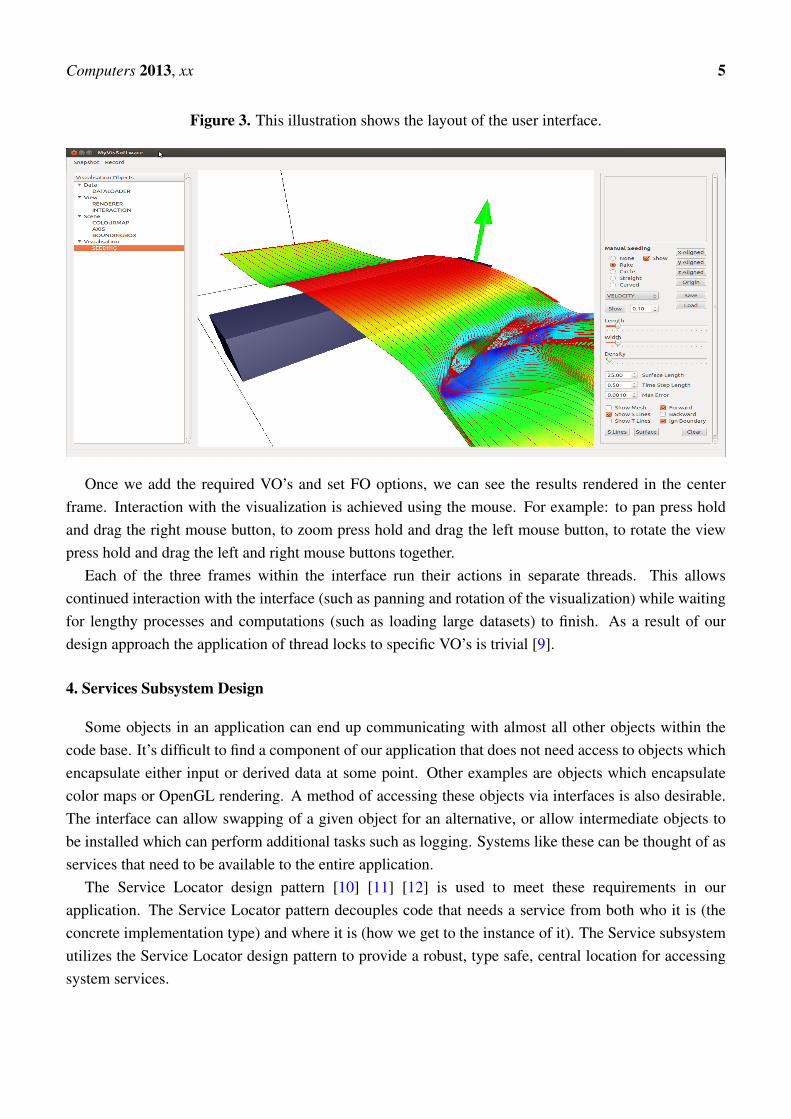
The GUI, shown in Figure 3, is divided into three main frames. The center frame for rendering thecurrent list of VO’s, the left frame for listing the current VO’s, and the right frame area which displaysthe FO for the currently selected VO and lists the VO’s currently available options. Refer to Figure 3.
VO’s are added by right mouse clicking the parent VO category and selecting the required VO fromthe drop down menu. The VO categories (data, view, scene, visualization) can be seen in the left frameof Figure 3. Right mouse clicking a VO in the list enables the user to delete it. Left mouse click thelisted VO and its associated FO is displayed in the right frame area. The FO lists the attributes of theVO which can be manipulated. In Figure 3 the selected VO is a seeding object. The right frame displaysthe the options available to the seeding object. At the top of this FO a track pad is available for seedingcurve manipulation, under this we can specify type and size. We can save and load previously specifiedseeding curves. At the bottom of this FO we have options for the generation of stream surfaces.
Computers 2013, xx 5
Figure 3. This illustration shows the layout of the user interface.
Once we add the required VO’s and set FO options, we can see the results rendered in the centerframe. Interaction with the visualization is achieved using the mouse. For example: to pan press holdand drag the right mouse button, to zoom press hold and drag the left mouse button, to rotate the viewpress hold and drag the left and right mouse buttons together.
Each of the three frames within the interface run their actions in separate threads. This allowscontinued interaction with the interface (such as panning and rotation of the visualization) while waitingfor lengthy processes and computations (such as loading large datasets) to finish. As a result of ourdesign approach the application of thread locks to specific VO’s is trivial [9].
4. Services Subsystem Design
Some objects in an application can end up communicating with almost all other objects within thecode base. It’s difficult to find a component of our application that does not need access to objects whichencapsulate either input or derived data at some point. Other examples are objects which encapsulatecolor maps or OpenGL rendering. A method of accessing these objects via interfaces is also desirable.The interface can allow swapping of a given object for an alternative, or allow intermediate objects tobe installed which can perform additional tasks such as logging. Systems like these can be thought of asservices that need to be available to the entire application.
The Service Locator design pattern [10] [11] [12] is used to meet these requirements in ourapplication. The Service Locator pattern decouples code that needs a service from both who it is (theconcrete implementation type) and where it is (how we get to the instance of it). The Service subsystemutilizes the Service Locator design pattern to provide a robust, type safe, central location for accessingsystem services.
Computers 2013, xx 6
In our services subsystem we focus on data storage and accessibility. The services we implementinclude; raw data storage, derived data storage, model data storage, render object storage, color mapstorage, interaction matrix storage, and a VO factory.
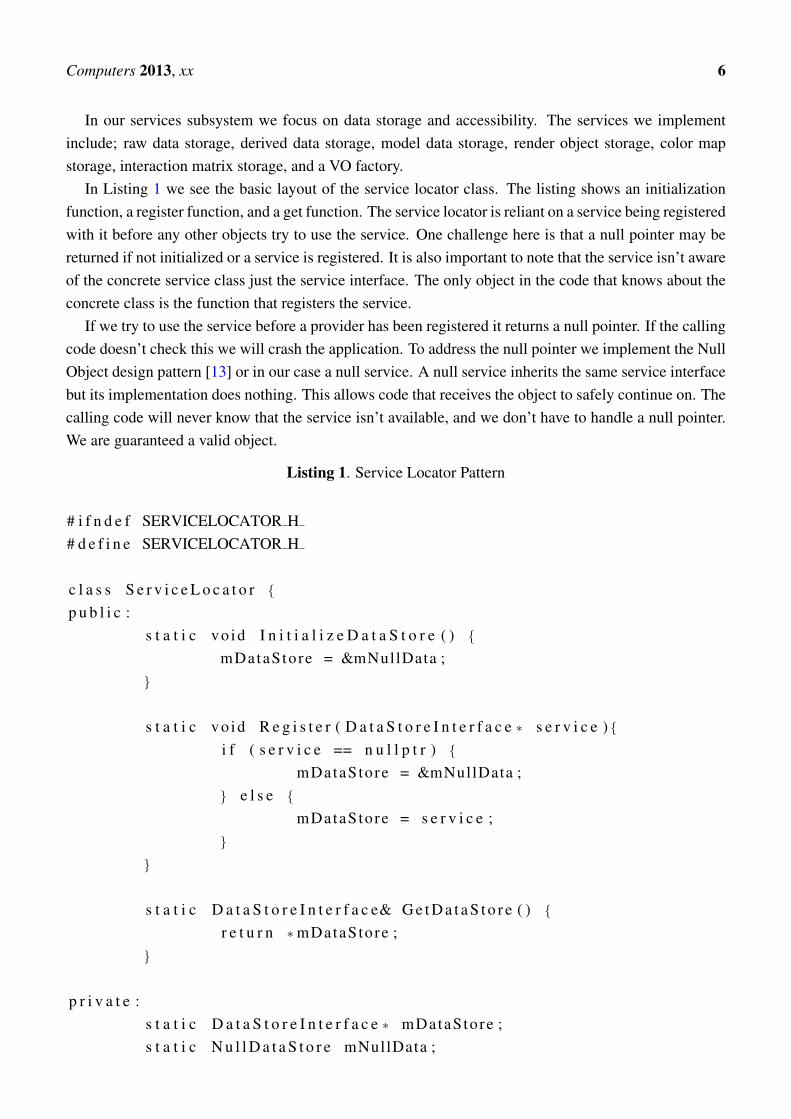
In Listing 1 we see the basic layout of the service locator class. The listing shows an initializationfunction, a register function, and a get function. The service locator is reliant on a service being registeredwith it before any other objects try to use the service. One challenge here is that a null pointer may bereturned if not initialized or a service is registered. It is also important to note that the service isn’t awareof the concrete service class just the service interface. The only object in the code that knows about theconcrete class is the function that registers the service.
If we try to use the service before a provider has been registered it returns a null pointer. If the callingcode doesn’t check this we will crash the application. To address the null pointer we implement the NullObject design pattern [13] or in our case a null service. A null service inherits the same service interfacebut its implementation does nothing. This allows code that receives the object to safely continue on. Thecalling code will never know that the service isn’t available, and we don’t have to handle a null pointer.We are guaranteed a valid object.
Listing 1. Service Locator Pattern
# i f n d e f SERVICELOCATOR H# d e f i n e SERVICELOCATOR H
c l a s s S e r v i c e L o c a t o r {
p u b l i c :s t a t i c vo id I n i t i a l i z e D a t a S t o r e ( ) {
mDataStore = &mNullData ;}
s t a t i c vo id R e g i s t e r ( D a t a S t o r e I n t e r f a c e ∗ s e r v i c e ) {i f ( s e r v i c e == n u l l p t r ) {
mDataStore = &mNullData ;} e l s e {
mDataStore = s e r v i c e ;}
}
s t a t i c D a t a S t o r e I n t e r f a c e& G e t D a t a S t o r e ( ) {
r e t u r n ∗mDataStore ;}
p r i v a t e :s t a t i c D a t a S t o r e I n t e r f a c e ∗ mDataStore ;s t a t i c N u l l D a t a S t o r e mNullData ;
Computers 2013, xx 7
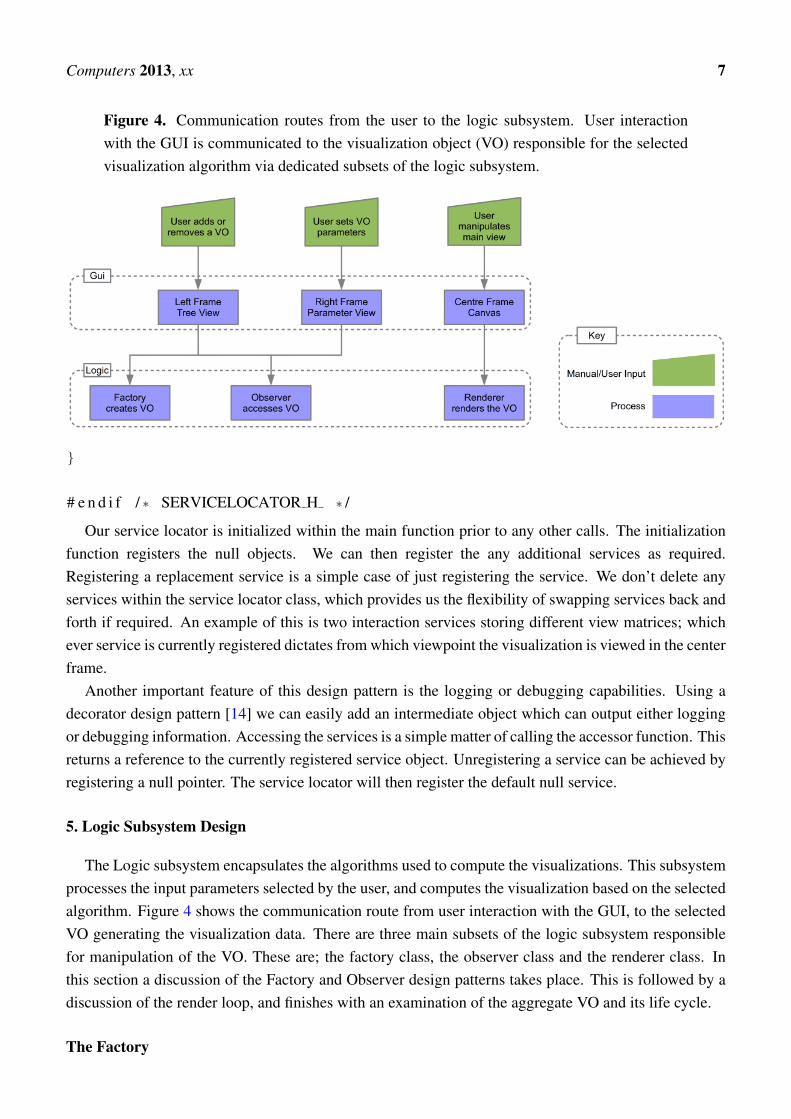
Figure 4. Communication routes from the user to the logic subsystem. User interactionwith the GUI is communicated to the visualization object (VO) responsible for the selectedvisualization algorithm via dedicated subsets of the logic subsystem.
}
# e n d i f / ∗ SERVICELOCATOR H ∗ /
Our service locator is initialized within the main function prior to any other calls. The initializationfunction registers the null objects. We can then register the any additional services as required.Registering a replacement service is a simple case of just registering the service. We don’t delete anyservices within the service locator class, which provides us the flexibility of swapping services back andforth if required. An example of this is two interaction services storing different view matrices; whichever service is currently registered dictates from which viewpoint the visualization is viewed in the centerframe.
Another important feature of this design pattern is the logging or debugging capabilities. Using adecorator design pattern [14] we can easily add an intermediate object which can output either loggingor debugging information. Accessing the services is a simple matter of calling the accessor function. Thisreturns a reference to the currently registered service object. Unregistering a service can be achieved byregistering a null pointer. The service locator will then register the default null service.
5. Logic Subsystem Design
The Logic subsystem encapsulates the algorithms used to compute the visualizations. This subsystemprocesses the input parameters selected by the user, and computes the visualization based on the selectedalgorithm. Figure 4 shows the communication route from user interaction with the GUI, to the selectedVO generating the visualization data. There are three main subsets of the logic subsystem responsiblefor manipulation of the VO. These are; the factory class, the observer class and the renderer class. Inthis section a discussion of the Factory and Observer design patterns takes place. This is followed by adiscussion of the render loop, and finishes with an examination of the aggregate VO and its life cycle.
The Factory

Computers 2013, xx 8
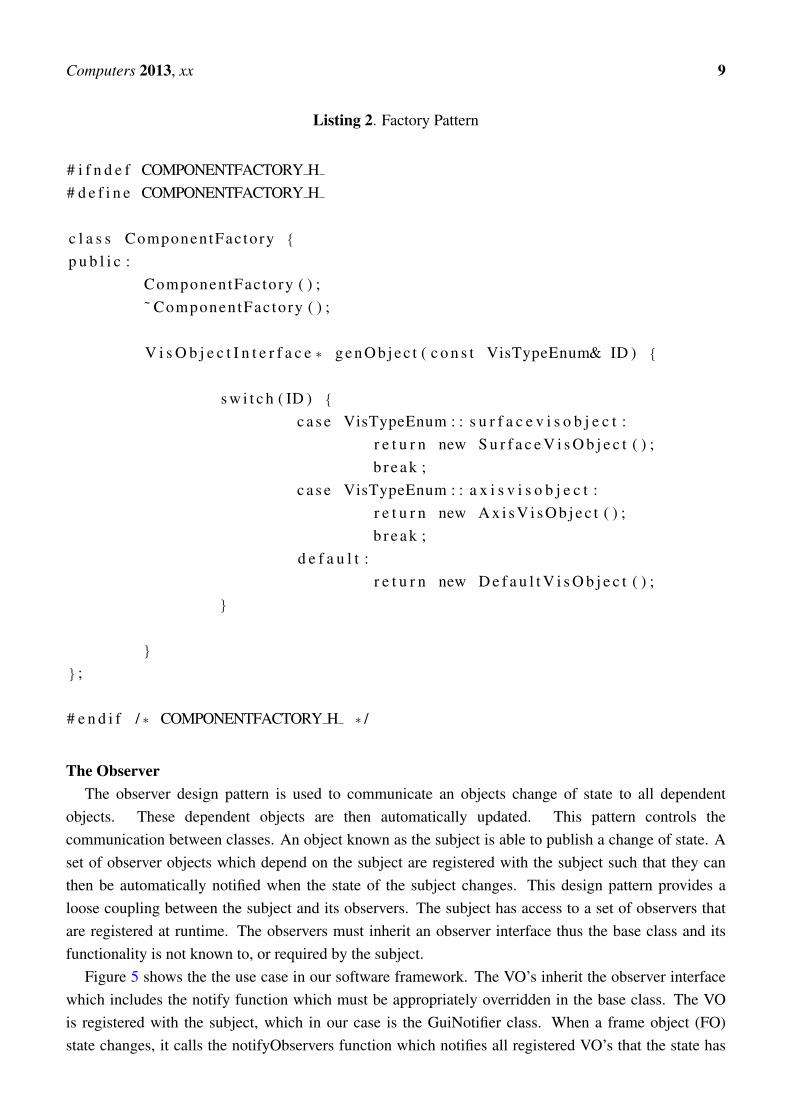
There are many cases when a class needs to create several types of object. This class can have thisresponsibility but it has to know about each and every object type. The possibility that the class cannotanticipate all the required objects in advance is clear. The idea of the factory pattern is to encapsulatethe creation of a multitude of different classes utilizing a common interface. A factory is the location ofa class in the code where multiple types of object are constructed. The purpose of utilizing this patternis to isolate the creation of objects from their usage, and to create groups of similar objects without theneed to depend on their concrete classes. This has the advantage of introducing new derived types withno change to the code that leverage the base class type. Using this pattern also introduces the possibilityof interchanging the concrete implementations without code modification. An example of the factorypattern can be seen in Listing 2. If the user chooses to add a new VO in the treeview, the GUI instructsthe factory to create a new VO of a type indicated by a type ID. A reference to the factory is stored in,and accessed from the Service Locator.
Computers 2013, xx 9
Listing 2. Factory Pattern
# i f n d e f COMPONENTFACTORY H# d e f i n e COMPONENTFACTORY H
c l a s s ComponentFac tory {
p u b l i c :ComponentFac tory ( ) ;˜ ComponentFac tory ( ) ;
V i s O b j e c t I n t e r f a c e ∗ g e n O b j e c t ( c o n s t VisTypeEnum& ID ) {
s w i t c h ( ID ) {
c a s e VisTypeEnum : : s u r f a c e v i s o b j e c t :r e t u r n new S u r f a c e V i s O b j e c t ( ) ;b r e a k ;
c a s e VisTypeEnum : : a x i s v i s o b j e c t :r e t u r n new A x i s V i s O b j e c t ( ) ;b r e a k ;
d e f a u l t :r e t u r n new D e f a u l t V i s O b j e c t ( ) ;
}
}
} ;
# e n d i f / ∗ COMPONENTFACTORY H ∗ /
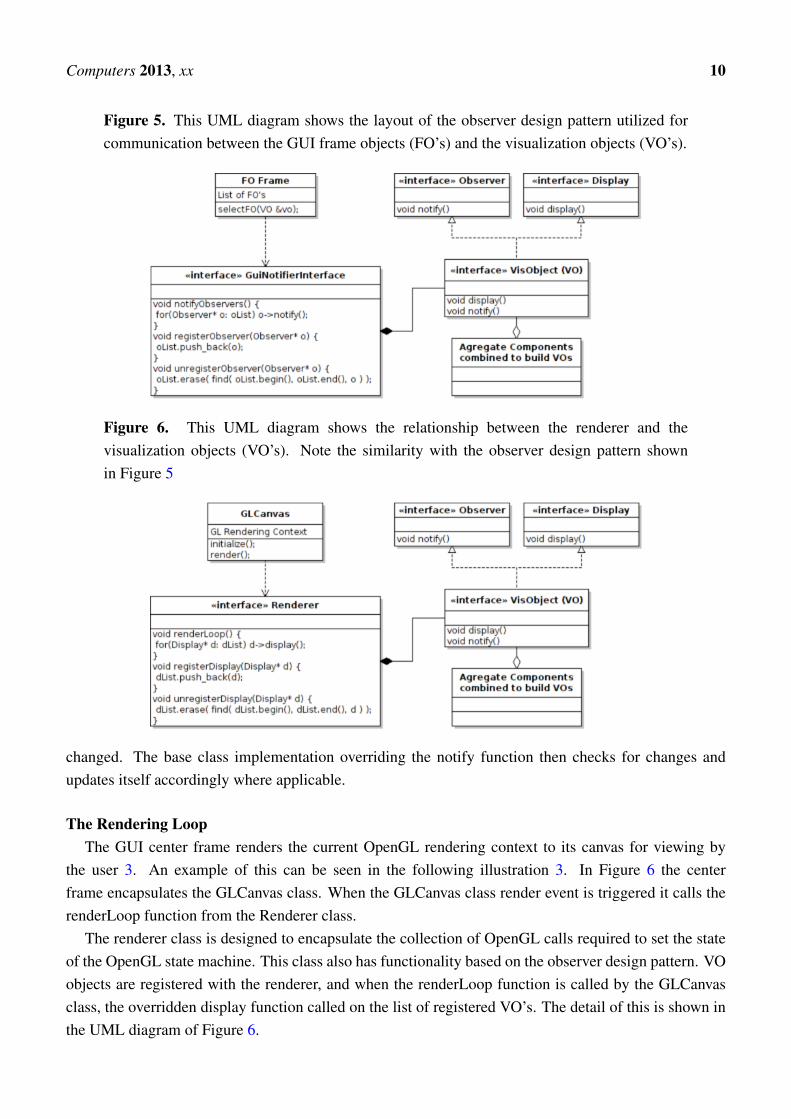
The ObserverThe observer design pattern is used to communicate an objects change of state to all dependent
objects. These dependent objects are then automatically updated. This pattern controls thecommunication between classes. An object known as the subject is able to publish a change of state. Aset of observer objects which depend on the subject are registered with the subject such that they canthen be automatically notified when the state of the subject changes. This design pattern provides aloose coupling between the subject and its observers. The subject has access to a set of observers thatare registered at runtime. The observers must inherit an observer interface thus the base class and itsfunctionality is not known to, or required by the subject.
Figure 5 shows the the use case in our software framework. The VO’s inherit the observer interfacewhich includes the notify function which must be appropriately overridden in the base class. The VOis registered with the subject, which in our case is the GuiNotifier class. When a frame object (FO)state changes, it calls the notifyObservers function which notifies all registered VO’s that the state has
Computers 2013, xx 10
Figure 5. This UML diagram shows the layout of the observer design pattern utilized forcommunication between the GUI frame objects (FO’s) and the visualization objects (VO’s).
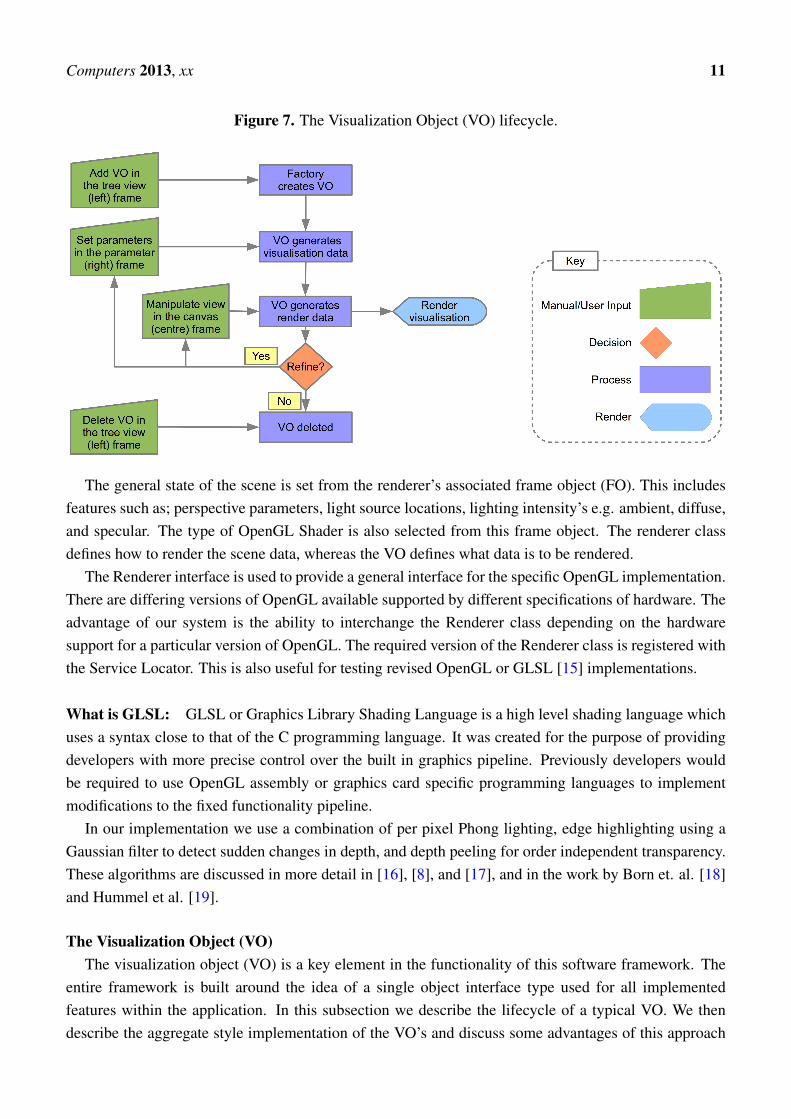
Figure 6. This UML diagram shows the relationship between the renderer and thevisualization objects (VO’s). Note the similarity with the observer design pattern shownin Figure 5
changed. The base class implementation overriding the notify function then checks for changes andupdates itself accordingly where applicable.
The Rendering LoopThe GUI center frame renders the current OpenGL rendering context to its canvas for viewing by
the user 3. An example of this can be seen in the following illustration 3. In Figure 6 the centerframe encapsulates the GLCanvas class. When the GLCanvas class render event is triggered it calls therenderLoop function from the Renderer class.
The renderer class is designed to encapsulate the collection of OpenGL calls required to set the stateof the OpenGL state machine. This class also has functionality based on the observer design pattern. VOobjects are registered with the renderer, and when the renderLoop function is called by the GLCanvasclass, the overridden display function called on the list of registered VO’s. The detail of this is shown inthe UML diagram of Figure 6.
Computers 2013, xx 11
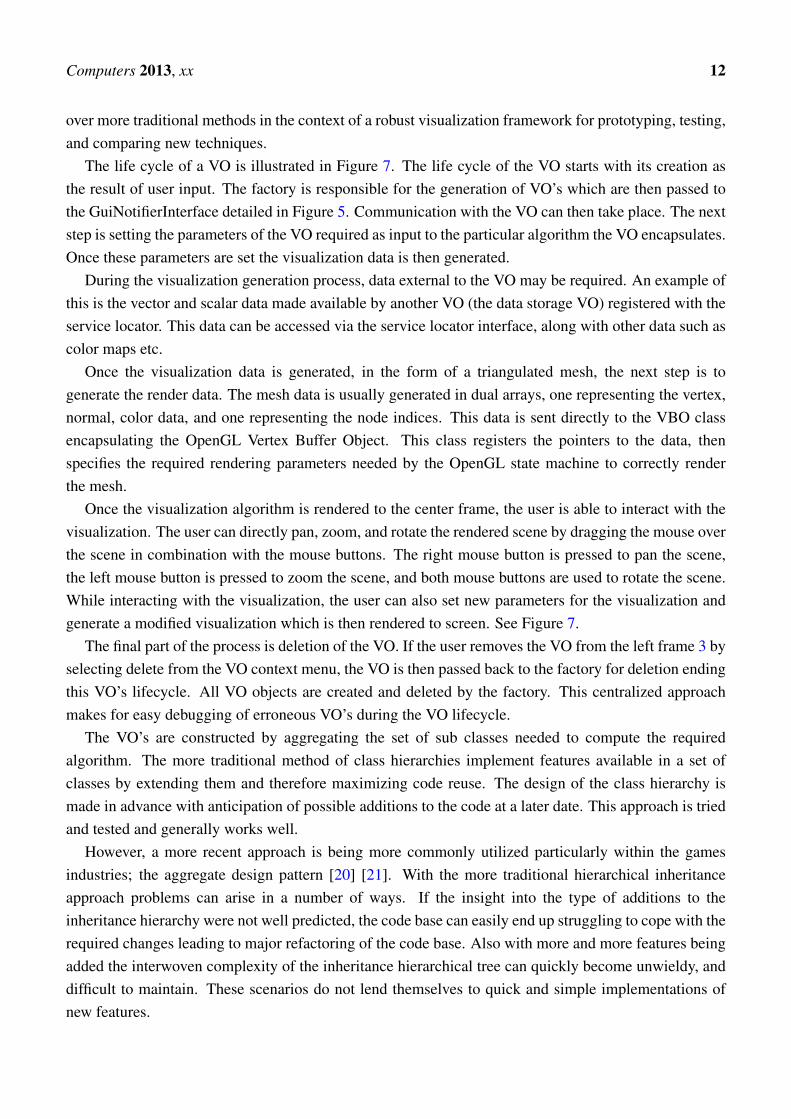
Figure 7. The Visualization Object (VO) lifecycle.
The general state of the scene is set from the renderer’s associated frame object (FO). This includesfeatures such as; perspective parameters, light source locations, lighting intensity’s e.g. ambient, diffuse,and specular. The type of OpenGL Shader is also selected from this frame object. The renderer classdefines how to render the scene data, whereas the VO defines what data is to be rendered.
The Renderer interface is used to provide a general interface for the specific OpenGL implementation.There are differing versions of OpenGL available supported by different specifications of hardware. Theadvantage of our system is the ability to interchange the Renderer class depending on the hardwaresupport for a particular version of OpenGL. The required version of the Renderer class is registered withthe Service Locator. This is also useful for testing revised OpenGL or GLSL [15] implementations.
What is GLSL: GLSL or Graphics Library Shading Language is a high level shading language whichuses a syntax close to that of the C programming language. It was created for the purpose of providingdevelopers with more precise control over the built in graphics pipeline. Previously developers wouldbe required to use OpenGL assembly or graphics card specific programming languages to implementmodifications to the fixed functionality pipeline.
In our implementation we use a combination of per pixel Phong lighting, edge highlighting using aGaussian filter to detect sudden changes in depth, and depth peeling for order independent transparency.These algorithms are discussed in more detail in [16], [8], and [17], and in the work by Born et. al. [18]and Hummel et al. [19].
The Visualization Object (VO)The visualization object (VO) is a key element in the functionality of this software framework. The
entire framework is built around the idea of a single object interface type used for all implementedfeatures within the application. In this subsection we describe the lifecycle of a typical VO. We thendescribe the aggregate style implementation of the VO’s and discuss some advantages of this approach
Computers 2013, xx 12
over more traditional methods in the context of a robust visualization framework for prototyping, testing,and comparing new techniques.
The life cycle of a VO is illustrated in Figure 7. The life cycle of the VO starts with its creation asthe result of user input. The factory is responsible for the generation of VO’s which are then passed tothe GuiNotifierInterface detailed in Figure 5. Communication with the VO can then take place. The nextstep is setting the parameters of the VO required as input to the particular algorithm the VO encapsulates.Once these parameters are set the visualization data is then generated.
During the visualization generation process, data external to the VO may be required. An example ofthis is the vector and scalar data made available by another VO (the data storage VO) registered with theservice locator. This data can be accessed via the service locator interface, along with other data such ascolor maps etc.
Once the visualization data is generated, in the form of a triangulated mesh, the next step is togenerate the render data. The mesh data is usually generated in dual arrays, one representing the vertex,normal, color data, and one representing the node indices. This data is sent directly to the VBO classencapsulating the OpenGL Vertex Buffer Object. This class registers the pointers to the data, thenspecifies the required rendering parameters needed by the OpenGL state machine to correctly renderthe mesh.
Once the visualization algorithm is rendered to the center frame, the user is able to interact with thevisualization. The user can directly pan, zoom, and rotate the rendered scene by dragging the mouse overthe scene in combination with the mouse buttons. The right mouse button is pressed to pan the scene,the left mouse button is pressed to zoom the scene, and both mouse buttons are used to rotate the scene.While interacting with the visualization, the user can also set new parameters for the visualization andgenerate a modified visualization which is then rendered to screen. See Figure 7.
The final part of the process is deletion of the VO. If the user removes the VO from the left frame 3 byselecting delete from the VO context menu, the VO is then passed back to the factory for deletion endingthis VO’s lifecycle. All VO objects are created and deleted by the factory. This centralized approachmakes for easy debugging of erroneous VO’s during the VO lifecycle.
The VO’s are constructed by aggregating the set of sub classes needed to compute the requiredalgorithm. The more traditional method of class hierarchies implement features available in a set ofclasses by extending them and therefore maximizing code reuse. The design of the class hierarchy ismade in advance with anticipation of possible additions to the code at a later date. This approach is triedand tested and generally works well.
However, a more recent approach is being more commonly utilized particularly within the gamesindustries; the aggregate design pattern [20] [21]. With the more traditional hierarchical inheritanceapproach problems can arise in a number of ways. If the insight into the type of additions to theinheritance hierarchy were not well predicted, the code base can easily end up struggling to cope with therequired changes leading to major refactoring of the code base. Also with more and more features beingadded the interwoven complexity of the inheritance hierarchical tree can quickly become unwieldy, anddifficult to maintain. These scenarios do not lend themselves to quick and simple implementations ofnew features.
Computers 2013, xx 13
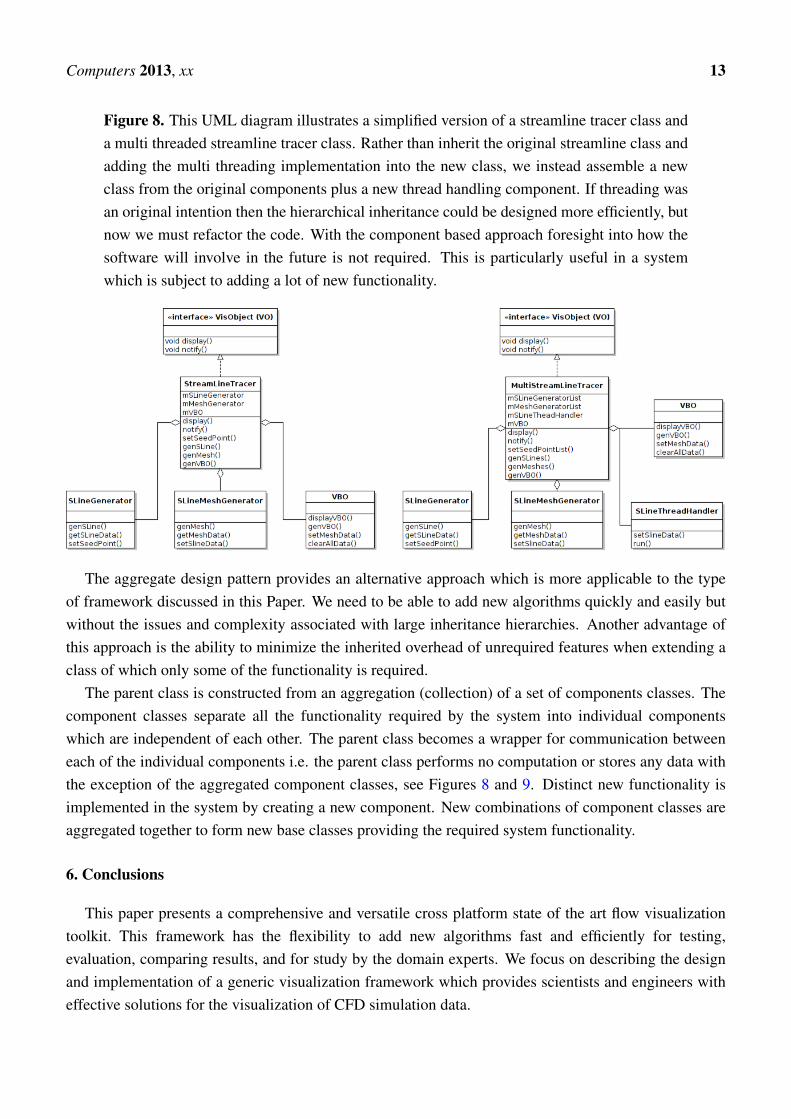
Figure 8. This UML diagram illustrates a simplified version of a streamline tracer class anda multi threaded streamline tracer class. Rather than inherit the original streamline class andadding the multi threading implementation into the new class, we instead assemble a newclass from the original components plus a new thread handling component. If threading wasan original intention then the hierarchical inheritance could be designed more efficiently, butnow we must refactor the code. With the component based approach foresight into how thesoftware will involve in the future is not required. This is particularly useful in a systemwhich is subject to adding a lot of new functionality.
The aggregate design pattern provides an alternative approach which is more applicable to the typeof framework discussed in this Paper. We need to be able to add new algorithms quickly and easily butwithout the issues and complexity associated with large inheritance hierarchies. Another advantage ofthis approach is the ability to minimize the inherited overhead of unrequired features when extending aclass of which only some of the functionality is required.
The parent class is constructed from an aggregation (collection) of a set of components classes. Thecomponent classes separate all the functionality required by the system into individual componentswhich are independent of each other. The parent class becomes a wrapper for communication betweeneach of the individual components i.e. the parent class performs no computation or stores any data withthe exception of the aggregated component classes, see Figures 8 and 9. Distinct new functionality isimplemented in the system by creating a new component. New combinations of component classes areaggregated together to form new base classes providing the required system functionality.
6. Conclusions
This paper presents a comprehensive and versatile cross platform state of the art flow visualizationtoolkit. This framework has the flexibility to add new algorithms fast and efficiently for testing,evaluation, comparing results, and for study by the domain experts. We focus on describing the designand implementation of a generic visualization framework which provides scientists and engineers witheffective solutions for the visualization of CFD simulation data.
Computers 2013, xx 14
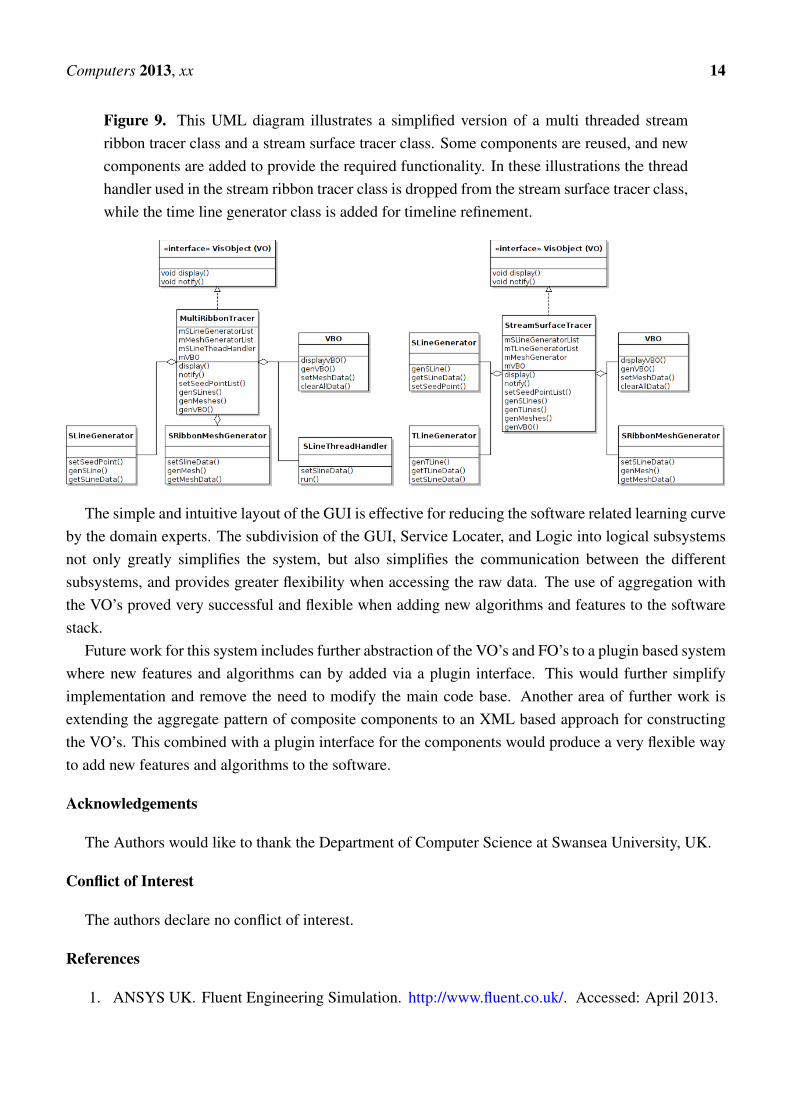
Figure 9. This UML diagram illustrates a simplified version of a multi threaded streamribbon tracer class and a stream surface tracer class. Some components are reused, and newcomponents are added to provide the required functionality. In these illustrations the threadhandler used in the stream ribbon tracer class is dropped from the stream surface tracer class,while the time line generator class is added for timeline refinement.
The simple and intuitive layout of the GUI is effective for reducing the software related learning curveby the domain experts. The subdivision of the GUI, Service Locater, and Logic into logical subsystemsnot only greatly simplifies the system, but also simplifies the communication between the differentsubsystems, and provides greater flexibility when accessing the raw data. The use of aggregation withthe VO’s proved very successful and flexible when adding new algorithms and features to the softwarestack.
Future work for this system includes further abstraction of the VO’s and FO’s to a plugin based systemwhere new features and algorithms can by added via a plugin interface. This would further simplifyimplementation and remove the need to modify the main code base. Another area of further work isextending the aggregate pattern of composite components to an XML based approach for constructingthe VO’s. This combined with a plugin interface for the components would produce a very flexible wayto add new features and algorithms to the software.
Acknowledgements
The Authors would like to thank the Department of Computer Science at Swansea University, UK.
Conflict of Interest
The authors declare no conflict of interest.
References
1. ANSYS UK. Fluent Engineering Simulation. http://www.fluent.co.uk/. Accessed: April 2013.
Computers 2013, xx 15
2. Laramee, R.S.; Hadwiger, M.; Hauser, H. Design and Implementation of Geometric and Texture-Based Flow Visualization Techniques. Proceedings of the 21st Spring Conference on ComputerGraphics, 2005, pp. 67–74.
3. Laramee, R.S. Comparing and evaluating computer graphics and visualization software.Software: Practice and Experience(SP&E), Vol 38, NO.7 June 2008 , pp. 735-760
4. Piringer, H.; Tominski, C.; Muigg, P.; Berger, W. A Multi-threading Architecture to SupportInteractive Visual Exploration. Visualization and Computer Graphics, IEEE Transactions on2009, 15, 1113–1120.
5. Piringer, H.; Berger, W.; Krasser, J. HyperMoVal: Interactive Visual Validation of RegressionModels for Real-Time Simulation. Computer Graphics Forum. Wiley Online Library, 2010,Vol. 29, pp. 983–992.
6. McLoughlin, T.; Laramee, R.S., Design and Implementation of Interactive Flow VisualizationTechniques. In Computer Graphics; InTech Publishers, 2012; chapter 6, pp. 87–110.
7. Peng, Z.; Geng, Z.; Laramee, R.S., Design and Implementation of a System for Interactive,High-Dimensional Vector Field Visualization. In Horizons in Computer Science Research; NovaScience Publishers, 2013; Vol. 8, pp. 175–200.
8. Edmunds, M.; Laramee, R.; Malki, R.; Masters, I.; Croft, T.; Chen, G.; Zhang, E. AutomaticStream Surface Seeding: A Feature Centered Approach. Computer Graphics Forum 2012,31, 1095–1104.
9. cppreference.com. std::lock. http://en.cppreference.com/w/cpp/thread/lock. Accessed: May2013.
10. BlackWasp. Service Locator Design Pattern. http://www.blackwasp.co.uk/ServiceLocator.aspx.Accessed: May 2013.
11. Code Project. A Basic Introduction On Service Locator Pattern. http://www.codeproject.com/Articles/18464/A-Basic-Introduction-On-Service-Locator-Pattern. Accessed: May 2013.
12. Martin Fowler. Inversion of Control Containers and the Dependency Injection pattern. http://martinfowler.com/articles/injection.html. Accessed: May 2013.
13. BlackWasp. Null Object Design Pattern. http://www.blackwasp.co.uk/NullObject.aspx.Accessed: May 2013.
14. BlackWasp. Decorator Design Pattern. http://www.blackwasp.co.uk/Decorator.aspx. Accessed:May 2013.
15. OpenGL.org. OpenGL GLSL. http://www.opengl.org/wiki/OpenGL Shading Language.Accessed: July 2013.
16. Edmunds, M.; Laramee, R.; Chen, G.; Zhang, E.; Max, N. Advanced, Automatic Stream SurfaceSeeding and Filtering. Theory and Practice of Computer Graphics, 2012, pp. 53–60.
17. Edmunds, M.; Laramee, R.S.; Evans, B.; Chen, G. Stream Surface Placement for a Land SpeedRecord Vehicle. Technical report, The Visual and Interactive Computing Group, ComputerScience Department, Swansea University, Wales, UK, 2013.
18. Born, S.; Wiebel, A.; Friedrich, J.; Scheuermann, G.; Bartz, D. Illustrative Stream Surfaces.IEEE Transactions on Visualization and Computer Graphics 2010, 16, 1329–1338.

Computers 2013, xx 16
19. Hummel, M.; Garth, C.; Hamann, B.; Hagen, H.; Joy, K. IRIS: Illustrative Rendering for IntegralSurfaces. IEEE Transactions on Visualization and Computer Graphics 2010, 16, 1319–1328.
20. Nystrom, R.. Game Programming Patterns. http://gameprogrammingpatterns.com/component.html. Accessed: July 2013.
21. West, M.. Refactoring Game Entities with Components. http://cowboyprogramming.com/2007/01/05/evolve-your-heirachy. Accessed: July 2013.
c© 2013 by the authors; licensee MDPI, Basel, Switzerland. This article is an open access articledistributed under the terms and conditions of the Creative Commons Attribution license(http://creativecommons.org/licenses/by/3.0/).