Embed Size (px)
Citation preview
Cronfa - Swansea University Open Access Repository
_____________________________________________________________
This is an author produced version of a paper published in :
Bioresource Technology
Cronfa URL for this paper:
http://cronfa.swan.ac.uk/Record/cronfa33250
_____________________________________________________________
Paper:
Jang, N., Yasin, M., Park, S., Lovitt, R. & Chang, I. (2017). Determination of volumetric gas–liquid mass transfer
coefficient of carbon monoxide in a batch cultivation system using kinetic simulations. Bioresource Technology
http://dx.doi.org/10.1016/j.biortech.2017.05.023
_____________________________________________________________ This article is brought to you by Swansea University. Any person downloading material is agreeing to abide by the
terms of the repository licence. Authors are personally responsible for adhering to publisher restrictions or conditions.
When uploading content they are required to comply with their publisher agreement and the SHERPA RoMEO
database to judge whether or not it is copyright safe to add this version of the paper to this repository.
http://www.swansea.ac.uk/iss/researchsupport/cronfa-support/

Accepted Manuscript
Determination of volumetric gas–liquid mass transfer coefficient of carbonmonoxide in a batch cultivation system using kinetic simulations
Nulee Jang, Muhammad Yasin, Shinyoung Park, Robert W. Lovitt, In SeopChang
PII: S0960-8524(17)30662-4DOI: http://dx.doi.org/10.1016/j.biortech.2017.05.023Reference: BITE 18049
To appear in: Bioresource Technology
Received Date: 21 February 2017Revised Date: 30 April 2017Accepted Date: 3 May 2017
Please cite this article as: Jang, N., Yasin, M., Park, S., Lovitt, R.W., Chang, I.S., Determination of volumetricgas–liquid mass transfer coefficient of carbon monoxide in a batch cultivation system using kinetic simulations,Bioresource Technology (2017), doi: http://dx.doi.org/10.1016/j.biortech.2017.05.023
This is a PDF file of an unedited manuscript that has been accepted for publication. As a service to our customerswe are providing this early version of the manuscript. The manuscript will undergo copyediting, typesetting, andreview of the resulting proof before it is published in its final form. Please note that during the production processerrors may be discovered which could affect the content, and all legal disclaimers that apply to the journal pertain.

Determination of volumetric gas–liquid mass transfer coefficient
of carbon monoxide in a batch cultivation system using kinetic
simulations
Nulee Jang1
, Muhammad Yasin2
, Shinyoung Park1, Robert W. Lovitt
3 and In Seop Chang
1*
1 School of Earth Sciences and Environmental Engineering, Gwangju Institute of Science and
Technology (GIST), Gwangju 61005, Korea 2
Department of Chemical Engineering, COMSATS Institute of Information Technology (CIIT), Lahore, Pakistan 3
College of Engineering, Center of Complex Fluids Processing, Multidisciplinary Nanotechnology Centre, Swansea University, Swansea, SA2 8PP, UK
¶ Equally contributed * Corresponding author. Tel.: +82 62 715 3278; Fax: +82 62 715 2434. E-mail address:
[email protected] (I.S. Chang).
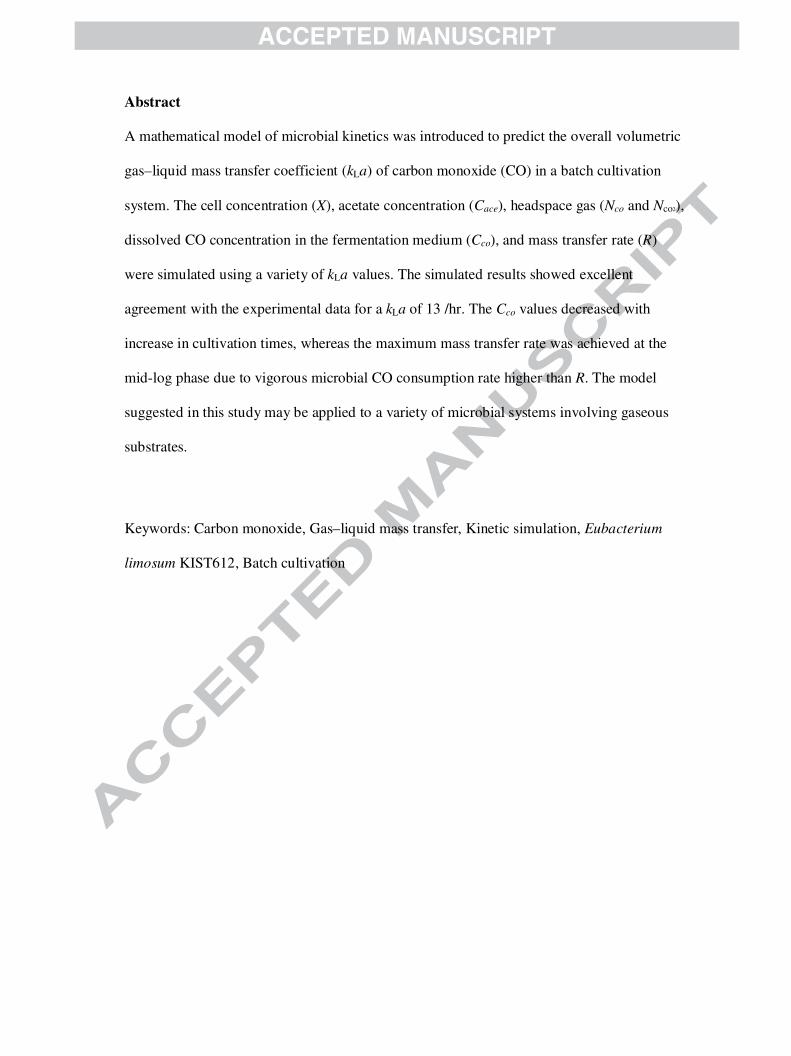
Abstract
A mathematical model of microbial kinetics was introduced to predict the overall volumetric
gas–liquid mass transfer coefficient (kLa) of carbon monoxide (CO) in a batch cultivation
system. The cell concentration (X), acetate concentration (Cace), headspace gas (Nco and Nco2),
dissolved CO concentration in the fermentation medium (Cco), and mass transfer rate (R)
were simulated using a variety of kLa values. The simulated results showed excellent
agreement with the experimental data for a kLa of 13 /hr. The Cco values decreased with
increase in cultivation times, whereas the maximum mass transfer rate was achieved at the
mid-log phase due to vigorous microbial CO consumption rate higher than R. The model
suggested in this study may be applied to a variety of microbial systems involving gaseous
substrates.
Keywords: Carbon monoxide, Gas–liquid mass transfer, Kinetic simulation, Eubacterium
limosum KIST612, Batch cultivation
1. Introduction
Fossil fuel refinery has been a major source for global energy production. The predicted
scarcity, uneven regional distribution, and greenhouse gas emissions have triggered the use of
clean technologies for fossil fuels, and to explore alternate energy resources (Verma et al.,
2016). Microbial synthesis gas (syngas) fermentation is a very promising technology in this
context; since, it employs biological catalysts to convert syngas into platform chemicals, and
clean energy biofuels (Munasinghe & Khanal, 2010). Syngas; a mixture of carbon monoxide
(CO), hydrogen (H2), carbon dioxide (CO2), can be produced by the gasification of fossil
(e.g., coal) and renewable energy resources (e.g., biomass). The versatility of feedstock for
syngas production, and its availability in waste streams from thermal power plants, iron
works and various chemical processes (Yasin et al., 2015) make it superior choice over
agroenergy crops for biorefinery (Ramachandriya et al., 2016).
Bioprocess scale-up for microbial syngas utilization relies on efficient gas-liquid mass
transfer of syngas (CO, in particular) in fermentation medium (Bredwell et al., 1999; Garcia-
Ochoa & Gomez, 2009; Yasin et al., 2015). Syngas-utilizing bacteria uptake the gaseous
substrates in the dissolved state. The dissolved gas concentrations in the fermentation
medium depend on the ability of the bioreactor to deliver gas to the reaction system (Doran,
1995; Garcia-Ochoa & Gomez, 2009). The mass transfer rate of bioreactor system dependent
on two important parameters: driving force (C*- CCO) and volumetric gas-liquid mass transfer
coefficient (kLa). The determination of aforementioned parameters is a prerequisite to devise
scale-up strategies for syngas fermentation (Jeong et al., 2016). This requires online
monitoring and measurement of dissolved CO (CCO) levels, which is not possible for
relatively small systems such as vial and tube culture owing to limited sample volume,
configurational limitations and unavailability of online monitoring equipment.
Kinetic modeling has been a valuable tool to predict the nature and control of gas

fermentation processes. A variety of kinetic and statistical models have been suggested for
predicting microbial growth, substrate consumption, metabolite formation, and other
parameters associated with the biological processes central to a variety industrial applications
(Mohammadi et al., 2014). Among the growth kinetic models, Monod model is widely
employed to a variety of microbial reaction systems; since, it reflects the most characteristic
features of microbial growth quite well particularly in exponential and stationary phases
(Allman, 2011). However, Monod model underestimates the growth rates at low substrate
concentrations, while maximum specific growth rates (����) are achieved too slowly at the
high substrate concentrations (Kovárová-Kovar & Egli, 1998). For these reasons, it is desired
to incorporate the most influential parameters in Monod model for true representation of
batch fermentation. Previously, the Monod equation has been modified to incorporate
parameters such as substrate and/or product inhibition (Han & Levenspiel, 1988). It can also
be applied from simple batch cultures to continuous systems similar to those examined in the
current study (Vega et al., 1989a; Vega et al., 1989b).The versatility of this model renders it
adaptable to a variety of biological systems and processes.
Conventional models for predicting dynamic behaviors of microbial systems rely on the
fully dissolved substrates (such as sugars and organic acids). These concentrations may be
readily quantified using instrumental analyzing techniques; however, simulating microbial
systems of gas-utilizing microorganisms, such as carboxydotrophs and methanotrophs
remains still challenging due to difficulty in measuring the CL values (Jeong et al., 2016;
Yasin et al., 2015). Researchers have estimated CL values, using Henry’s law to simulate CO
fermentation processes (Mohammadi et al., 2014; Younesi et al., 2005). However, the actual
dissolved gas concentrations do not fit well to the theoretically predicted values by Henry’s
law at all partial pressures due to the continuous consumption of dissolved gas by the
microorganisms (Jeong et al., 2016). Therefore, predictions of kinetic parameters using
saturated concentration (C*) from Henry’s law may result in inaccurate microbial activity
estimates. Notably, the dissolved gas concentrations are highly dependent on kLa and the gas
partial pressure (Doran, 1995; Garcia-Ochoa & Gomez, 2009; Yasin et al., 2014). The
potential factors that influence the mass transfer can be incorporated to develop analytical or
mathematical models that can be used for time-course estimation of CCO levels, and required
kLa to achieve those CCO levels during fermentation.
In previous studies, dimensional analysis was used to normalize the mass transfer data, and
to predict the kLa values (Ahmed & Semmens, 1992; Munasinghe & Khanal, 2012). No study
has yet been reported to predict the actual kLa that produces real time dissolved gas
concentration (CL) levels in the system. The actual CCO values are important for determining
precise microbial activity, in terms of microbial growth and product formation (Merchuk &
Asenjo, 1995). Thus, the microbial kinetic parameters are incorporated into the gas–liquid
mass transfer kinetics (Merkel & Krauth, 1999; Vega et al., 1989a; Vega et al., 1989b).
In this study, gas-liquid mass transfer parameters and modified Monod model were
employed to simulate the kinetics of batch microbial cultivation system fed with CO. Time
course microbial growth, product formations, and CO consumptions were simulated by
predicting the required kLa. Finally, saturated and dissolved CO concentrations; mass transfer
rate, and specific CO consumption rates were simulated to represent their variations during
batch fermentation.
2. Materials and methods
2.1. Strain and culture
Eubacterium limosum KIST612 was used as a model strain to simulate batch cultivation
using CO substrate (Chang et al., 1997). The composition of the fermentation medium, the
growth characteristics of the bacterium, and conditions for strain cultivation can be found
elsewhere (Chang et al., 1999).
2.2. Quantification of cell growth and products
The cell concentrations, and products (CO2, and acetic acid) data used in this study are
adopted from previous study (Chang et al., 1999). Standard methods were used for the
quantification of cell concentration, acetic acid and CO and CO2.
2.3. Product inhibition constant
The product inhibition constant of the undissociated acetic acid was determined using the
cultivation under different concentrations of sodium acetate (0–480 mM) and a fixed pressure
of 1 atm CO. The specific growth rate (�) for each acetate concentration was measured to
determine the effect of product inhibition on microbial growth.
2.4. Kinetic model
The mathematical model equations were developed to describe the batch system with gas
substrate. All numerical simulations and statistical analyses were performed using Microsoft
Excel 2016.
The Monod kinetic model may be used to describe microbial growth under significantly
substrate-limited conditions, such as in vial cultures that cannot maintain a high mechanical
agitation speed. In this study, the substrate inhibitory effect of CO was not considered.
Therefore, the model began as follows:
� = �� ∙� ����� � (1)
Where �� is the substrate saturation constant (mM)
Several organic acid products, such as acetic acid or butyric acid, were produced in the
liquid medium, and were present in undissociated forms that could easily pass through the
cellular membrane. The undissociated acids that diffused into the cells changes the
intracellular pH. Cell death during cultivations is accelerated by high product inhibition.
Because Eqn. 1 did not contain terms relating to the effects of cell death and product
inhibition, it was modified by introducing the product inhibition constant of acetate (KP) and
the endogenous cell death coefficient (Kd), as follows:
� = �� ∙� �,����� �� −�� ∙ �1 + � �
��� (2)
Product inhibition influences not only the cell death rate, but the growth rate of living cells;
therefore, the cell growth term was modified to include a non-competitive product inhibition
form as follows:
� = �� ∙� ������ ��∙���� �/��� −�� ∙ �1 + � �
��� (3)
The formation of the cell mass (!"/!#) was expressed as a function of the cell
concentration as follows:
�$�% = � ∙ " (4)
Under the experimental conditions, there is no need to use complex equation of state (EOS)
because the behavior of real gas molecules may be modeled as an ideal gas. The CO partial
pressure (&'() was predicted from the simulated CO ()�*) present in the headspace using the
ideal gas law to simplify the conversion:
&'( = )�* ∙ 0.082 ∙ �273.15 + 2�/34 (5)
Where 2 is the temperature (K), 34 is the headspace volume (L)
The gas–liquid mass transfer parameter was introduced to predict the dynamic behavior of
CO as a substrate. A saturated concentration of the dissolved CO (&'( ∙ 5'() was estimated
using Henry’ law. Finally, the change in dissolved CO concentration by time became:
�� ��% = 678 ∙ �&'( ∙ 5'( − 9'(� − � ∙ "/:$/'( (6)
Where 5'( is Henry’s constant of CO (mmol/L/atm), :$/'( is yield coefficient of cell
mass from CO (mg/mmol), &'( is CO partial pressure in headspace (atm)
)�* was simulated based on the dissolved CO consumed in the broth(37) as follows:
�; ��% = −37 ∙ � ∙ "/:$/'( (7)

CO2 in the headspace ()'(<) was simulated by combining the CO consumed in the medium
with the CO2 yield on CO (:�*</�*):
�; �<�% = :�*</'( ∙ 37 ∙ � ∙ "/: (8)
In the same way, acetate production was simply predicted from the microbial CO
consumption through the acetate yield coefficient on CO (:�'=/�*):
�� ��% = :�'=/'( ∙ � ∙ "/:$/'( (9)
The initial conditions used for each model are provided in Table 1.
3. Results and discussion
3.1. The effect of acetate on the specific growth rate of E. limosum KIST612
The accumulation of end products, such as organic acids and alcohols, can considerably
affect the specific growth rate of cells in a fermentation system (Lin et al., 2008; Wang &
Wang, 1984; Zhang et al., 2016). The growth inhibitory effect usually increases linearly in
proportion to the organic acid concentration. The cell growth of E. limosum KIST612 is also
inhibited by high acetate concentrations (Chang et al., 1998). In this study, acetate does not
appear to inhibit cell growth at low concentrations up to 120 mM. Beyond this limit, cells
grow more slowly. Inhibition of the specific growth rate was nearly linear up to 480 mM.
These data were used to extrapolate the cell growth inhibition beyond 120 mM to obtain a
maximum specific growth rate at 240, 360, and 480 mM to predict the product inhibition
constant (KP). The extrapolation suggested that E. limosum KIST612 could not grow at/above
744 mM sodium acetate in the medium. At this concentration, 4.2 mM of the total acetic acid
was present in an undissociated form. This concentration was considered to provide an
acetate inhibition constant of E. limosum KIST612 in the neutral pH range. Although the
batch culture investigated in this study did not achieve a high titer of acetic acid, this constant
was necessary for predicting the microbial kinetics and behaviors of gas molecules in batch
or CO fed-batch cultivation systems that can easily reach product quantities of several
hundred moles.
3.2. Simulation of the kinetic models
In order to simulate this system, Monod equation was first modified using the �� and KP.
Based on this model, the overall microbial kinetics were simulated using a variety of 6>8.
Although � appeared to be a major parameter, it was significantly affected by Cco,
determined by the gas–liquid mass transfer and microbial activity of the cultivation system.
Time course measurements for � were simulated using the maximum specific growth rate
(����) determined from the experimental data. �� of 0.002 /hr was selected by comparing
the experimental and simulated values. A kLa of 13 /hr was used based on the results
presented in Fig. 3 (A). The kinetic parameters, constants, and yield coefficients are
summarized in Table 2.
As shown in Fig. 2 graphs using (Cco≠0) condition , the overall simulated lines agreed
with the experimental data from 13 to 20 /hr kLa; however, the simulation slightly
underestimated the log phase growth at a kLa of 13 /hr because the yield coefficient
measurements were obtained using only log phase data and not end point. predicted and
measured overall X in Fig. 2 (A) were slightly inconsistent. As a result, a normalized root
mean square value (NRMSE) of 6.76 % was obtained. In case of a kLa of 20 /hr, overall trend
during log phase showed better fitting than that of a kLa of 13 /hr, but overestimation
occurred over 24 hr. Headspace CO2 showed a good agreement with experimental data at 20
/hr, resulting in 4.1 % NRMSE that is the second lowest value in NRMSE analysis of all the
results simulated in this study. The NRMSE values of the simulations using (Cco ≠ 0)
condition was summarized in Table 3. In the case of acetate in Fig. 2 (C), the final Cace of
19.83 mM was 10.7 % higher than the simulated value of 17.7 mM at a kLa of 13 /hr, leading
to a 5.60 % NRMSE. Cace was overestimated during late log to stationary phase over a kLa
of 20 /hr and reached to around 18.2 mM.
Fig. 2 (D), (E) and (F) are the simulated results using (Cco = 0) in Eqn. 6. The simulation
trend was almost similar with that of (Cco ≠ 0) condition up to a kLa of 3 /hr, however, the
simulated line has begun to be overestimated and show a sharp change from a kLa of 6 /hr. At
a kLa of 11.5 /hr, all the simulations reached to the maximum value in about 18 hr, leading to
significant inconsistency compared to experimental data. It would be due to the maximized
mass transfer (678 ∙ &'( ∙ 5'() without Cco assumption. These results actually showed higher
values of NRMSE than (Cco ≠ 0) condition at a similar kLa as shown in Table 4.
Fig. 2 indicated a need for appropriate assumption and accurate measurements of
coefficients used to mathematical models to achieve a more precise simulation result. In order
to simulate a gas cultivation system, delicate Cco will have to be introduced based on the mass
transfer for the prediction of more accurate simulation parameters as well as�.
3.3. Prediction of kLa of the system via the headspace CO simulation
Elaborated model is applicable under kinetically limited and non-limited condition. The
differences among the various simulation results of headspace CO are highlighted in Fig. 3.
Simulations were performed under two conditions (Cco = 0 and Cco ≠ 0). Eqn. 7 was used to
simulate the time courses of the headspace CO. In case of Fig. 3 (B), same assumption as
used in Fig. 2 (D), (E) and (F) was adopted, which overestimated the gas–liquid mass transfer
rate (678 ∙ &'( ∙ 5'(). This effect resulted in a mismatch between the simulation trend shown
in Fig. 3 (B) and the actual data, and smaller values than those plotted in Fig. 3 (A) were
obtained at similar kLa. The simulated headspace CO deviation from experimental data
increased, even with a slight increase in kLa. The headspace CO simulated in Fig. 3 (B) was
depleted within 20 hr at a kLa of only 11.5 /hr. Also, the dramatic change in the simulation
line reduced the reliability of this model. It was re-confirmed that no Cco assumption
produced a large error in the system performance estimates as well as in the simulation,
resulting in an incorrect prediction of kLa.

On the other hand, Fig. 3 (A) displayed a much more reasonable change in the headspace
CO in all time courses owing to the proper operation of the model described by Eqn. 6. The
Cco of the system simulated in Fig. 3 (A) changed over time, and the driving force (&'( ∙5'( − 9'() for mass transfer was not maximized. The predicted kLa was a significant
determinant of the overall volumetric gas–liquid mass transfer, as in the actual system. The
simulation presented in Fig. 3 (A) was carried out by predicting the value of kLa that causes
reduction of the headspace CO during the time course measurements. These results revealed
that a system with distinct values of kLa would be characterized by quite different headspace
CO decreases. The experimental time course measurements were in excellent agreement with
the simulated values at a kLa of 13 /hr (NRMSE = 2.37 %), suggesting that the kLa was
appropriate for conventional batch cultures used in lab-scale microbial cultivation. This
method was expected to be useful for predicting the kLa of small systems without directly
measuring Cco; however, accurate measurements of the microbial kinetic parameters would
be required.
The simulation results presented in Fig. 3 also support the experimental findings that batch
culture fermentation in small systems face substrate-limited conditions due to poor mass
transfer (Bredwell et al., 1999; Garcia-Ochoa & Gomez, 2009; Munasinghe & Khanal, 2012;
Yasin et al., 2014). In the whole reactions, the CO consumption rate achievable by
microorganism exceeds the mass transfer rate achievable by gas-liquid equilibrium, and the
poor mass transfer makes it impossible to maintain the dissolved CO concentration at a level
capable of maximizing the microbial activity. Enhancing kLa of the vial over 13 /hr increased
the overall CO consumption rate, as in the case of 50 /hr, shown in Fig. 3(A).
3.4. Simulation of the CO concentration and volumetric mass transfer rate
The headspace CO simulated at 13 /hr kLa, as shown in Fig. 3 (A), was converted to the
partial pressure using Eqn. 5. The corresponding saturated CO concentrations (C*) were
predicted using Henry’s law. Cco was simulated given continuous microbial CO consumption
(� ∙ "/:$/�*), as expressed in Eqn. 6.
Fig. 4, shows that Cco reached near-saturation levels at 0 hr. After inoculation with the
microbial source, the CO consumption induced the decline in Cco to a specific level such that
the net qco and R were nearly equal at 0 h. The net CO consumption gradually increased over
time due to cell growth. As a result, the gap between Cco and C* increased, thereby increasing
the driving force for mass transfer. qco was slightly larger than R. This trend continued to the
mid-log phase, and maximized values of R and qco were achieved at 16 hr, as indicated by the
dotted lines. After this stage, R and CO consumption began to decrease sharply by the
insufficient CO partial pressure. Keeping the mass transfer rate and cell growth rate high
required a large driving force; however, during the middle stage of cultivation, the CO partial
pressure remaining in the headspace dropped. Finally, C* could not be kept as high as the
early stages of the cultivation. Cco was maintained below 0.05 mM after 18 hr. Under these
conditions, serious cell growth and CO consumption limitation occurs. The gap between qco
and R was gradually decreased as shown in the ellipse directed by an arrow in Fig. 4,
indicating that the dependence of the cell growth on the gas–liquid mass transfer increased.
3.5. Significance of study and future research directions
Conventional methods for evaluating the kLa involves indirect measurement of Cco through
gas chromatography, and enzyme assay (Munasinghe & Khanal, 2014). Challenges for their
real applications are listed in table 6. This is the first study which proposed a way to predict
the kLa and Cco under biotic conditions for batch systems which can be modified for
continuous systems. Time course estimation of Cco levels during continuous fermentation
may help to maintain the optimum Cco levels for ideal bioreactor operation.
Summary of equations used to model mass transfer and microbial growth during gas-liquid
fermentation is listed in Table 5. All the previous studied are based on the saturated gas
concentrations with assumption of zero Cco levels during time course batch fermentation
(Hwang et al., 2007; Mohammadi et al., 2014; Phillips et al., 1993; Younesi et al., 2005).
However, continuous microbial substrate consumption during batch fermentations reduces
the head space partial pressure of the gas in the head space (Cgas) which in turn lead to
significant reduction of net Cco levels as depicted in Fig. 4. Since µ and @�* depends upon
the concentration of dissolved substrates (Jeong et al., 2016), evaluation of µ and @�* while
considering zero Cco levels (Younesi et al., 2005), would possibly result in an inaccurate
estimation of kinetic parameters. Also, the model in Muhammadi et al., 2014 didn’t reflect
the microbial CO consumption (� ∙ "/:$/�*). Kinetic model proposed in this study
incorporate potential influential parameters that significantly affect microbial growth and net
mass transfer during batch fermentation. Furthermore, models proposed in this study can be
applied to mass transfer limited to non-limited systems with actual Cco levels.
4. Conclusions
This study proposed a kinetic model of batch fermentation systems that utilized gaseous
substrates to predict the dynamic behavior of gas molecules. These results revealed that vial-
scale cultivation could be carried out at a kLa of about 13 /hr under given condition. The
predicted kLa was used to simulate CO2, acetate, and cell concentrations. The medium was
not serious substrate limited condition until mid-log phase. The model proposed in this study
may be used to simulate a variety of gas cultivation systems with kinetically limited and non-
limited mass transfer condition.
Acknowledgements
This research was supported by grant of Center for C1 Gas Refinery for National Research
Foundation (NRF-2015M3D3A1A01064883).
References
1. Ahmed, T., Semmens, M.J. 1992. The use of independently sealed microporous hollow

fiber membranes for oxygenation of water: model development. J. Membr. Sci. 69(1-2),
11-20.
2. Allman, A. 2011. Fermentation microbiology and biotechnology. CRC press.
3. Bredwell, M., Srivastava, P., Worden, R. 1999. Reactor design issues for synthesis-gas
fermentations. Biotechnol. Prog. 15(5), 834-844.
4. Chang, I.-S., Kim, B.-H., Kim, D.-H., Lovitt, R.W., Sung, H.-C. 1999. Formulation of
defined media for carbon monoxide fermentation by Eubacterium limosum KIST612 and
the growth characteristics of the bacterium. J. Biosci. Bioeng. 88(6), 682-685.
5. Chang, I.S., Kim, B.H., Lovitt, R.W., Bang, J.S. 2001. Effect of CO partial pressure on
cell-recycled continuous CO fermentation by Eubacterium limosum KIST612. Process
Biochem. 37(4), 411-421.
6. Chang, I.S., Kim, D.H., Kim, B.H., Shin, P.K., Sung, H., Lovitt, R.W. 1998. CO
fermentation of Eubacterium limosum KIST612. J. microbiol. Biotechnol. 8(2), 134-140.
7. Chang, I.S., Kim, D.H., Kim, B.H., Shin, P.K., Yoon, J.H., Lee, J.S., Park, Y.H. 1997.
Isolation and identification of carbon monoxide utilizing anaerobe. Eubacterium limosum
KIST612. Korean J. Appl. Microbiol. Biotechnol. 25(1), 1-8.
8. Doran, P.M. 1995. Bioprocess engineering principles. Academic press.
9. Garcia-Ochoa, F., Gomez, E. 2009. Bioreactor scale-up and oxygen transfer rate in
microbial processes: an overview. Biotechnol. Adv. 27(2), 153-76.
10. Han, K., Levenspiel, O. 1988. Extended Monod Kinetics for Substrate, Product, and Cell
inhibition. Biotechnol. Bioeng. 32, 430-437.
11. Hwang, J.W., Choi, Y.B., Park, S., Choi, C.Y., Lee, E.Y. 2007. Development and
mathematical modeling of a two-stage reactor system for trichloroethylene degradation
using Methylosinus trichosporium OB3b. Biodegradation, 18(1), 91-101.
12. Jeong, Y., Jang, N., Yasin, M., Park, S., Chang, I.S. 2016. Intrinsic kinetic parameters of
Thermococcus onnurineus NA1 strains and prediction of optimum carbon monoxide
level for ideal bioreactor operation. Bioresour. Technol. 201, 74-9.
13. Jones, S.T. 2007. Gas-liquid mass transfer in an external airlift loop reactor for syngas
fermentation. Iowa State University.
14. Kovárová-Kovar, K., Egli, T. 1998. Growth kinetics of suspended microbial cells: from
single-substrate-controlled growth to mixed-substrate kinetics. Microbiol. Mol. Biol. Rev.
62(3), 646-666.
15. Kundu, S., Premer, S.A., Hoy, J.A., Trent, J.T., Hargrove, M.S. 2003. Direct
measurement of equilibrium constants for high-affinity hemoglobins. Biophys. J. 84(6),
3931-3940.
16. Lin, S.K.C., Du, C., Koutinas, A., Wang, R., Webb, C. 2008. Substrate and product
inhibition kinetics in succinic acid production by Actinobacillus succinogenes. Biochem.
Eng. J. 41(2), 128-135.
17. Merchuk, J., Asenjo, J. 1995. The Monod equation and mass transfer. Biotechnol. Bioeng.
45(1), 91-94.
18. Merkel, W., Krauth, K. 1999. Mass transfer of carbon dioxide in anaerobic reactors under
dynamic substrate loading conditions. Water Res. 33(9), 2011-2020.
19. Mohammadi, M., Mohamed, A.R., Najafpour, G.D., Younesi, H., Uzir, M.H. 2014.
Kinetic studies on fermentative production of biofuel from synthesis gas using
Clostridium ljungdahlii. The Sci. World J. 2014.
20. Munasinghe, P.C., Khanal, S.K. 2010. Biomass-derived syngas fermentation into biofuels:
Opportunities and challenges. Bioresour. Technol.101(13), 5013-22.
21. Munasinghe, P.C., Khanal, S.K. 2014. Evaluation of hydrogen and carbon monoxide
mass transfer and a correlation between the myoglobin-protein bioassay and gas
chromatography method for carbon monoxide determination. RSC Adv. 4, 37575-81.
22. Munasinghe, P.C., Khanal, S.K. 2012. Syngas fermentation to biofuel: evaluation of
carbon monoxide mass transfer and analytical modeling using a composite hollow fiber
(CHF) membrane bioreactor. Bioresour. Technol. 122, 130-6.
23. Phillips, J., Klasson, K., Clausen, E., Gaddy, J. 1993. Biological production of ethanol
from coal synthesis gas. Appl. Biochem. Biotechnol. 39(1), 559-571.
24. Ramachandriya, K.D., Kundiyana, D.K., Sharma, A.M., Kumar, A., Atiyeh, H.K.,
Huhnke, R.L., Wilkins, M.R. 2016. Critical factors affecting the integration of biomass
gasification and syngas fermentation technology. AIMS Bioeng. 3(2), 188-210.
25. Riggs, S.S., Heindel, T.J. 2006. Measuring carbon monoxide gas—liquid mass transfer in
a stirred tank reactor for syngas fermentation. Biotechnol. Prog. 22(3), 903-906.
26. Vega, J., Antorrena, G., Clausen, E., Gaddy, J. 1989a. Study of gaseous substrate
fermentations: carbon monoxide conversion to acetate. 2. Continuous culture. Biotechnol.
Bioeng. 34(6), 785-793.
27. Vega, J.L., Clausen, E.C., Gaddy, J.L. 1989b. Study of gaseous substrate fermentations:
Carbon monoxide conversion to acetate. 1. Batch culture. Biotechnol. Bioeng. 34(6),
774-784.
28. Verma, D., Singla, A., Lal, B., Sarma, P.M. 2016. Conversion of biomass-generated
syngas into next-generation liquid transport fuels through microbial intervention:
potential and current status. Curr. Sci. 110(3), 329-336.
29. Wang, G., Wang, D.I. 1984. Elucidation of growth inhibition and acetic acid production
by Clostridium thermoaceticum. Appl. Environ. Microbiol. 47(2), 294-298.
30. Yasin, M. 2015. High Gas-Liquid Mass Transfer Bioreactor for Mirobial Syngas
Utilization, Ph. D Thesis, Gwangju Institute of Science and Technology.
31. Yasin, M., Jeong, Y., Park, S., Jeong, J., Lee, E.Y., Lovitt, R.W., Kim, B.H., Lee, J.,
Chang, I.S. 2015. Microbial synthesis gas utilization and ways to resolve kinetic and
mass-transfer limitations. Bioresour. Technol. 177, 361-74.
32. Yasin, M., Park, S., Jeong, Y., Lee, E.Y., Lee, J., Chang, I.S. 2014. Effect of internal
pressure and gas/liquid interface area on the CO mass transfer coefficient using hollow
fibre membranes as a high mass transfer gas diffusing system for microbial syngas
fermentation. Bioresour. Technol. 169, 637-43.
33. Younesi, H., Najafpour, G., Mohamed, A.R. 2005. Ethanol and acetate production from
synthesis gas via fermentation processes using anaerobic bacterium, Clostridium
ljungdahlii. Biochem. Eng. J. 27(2), 110-119.
34. Zhang, J., Taylor, S., Wang, Y. 2016. Effects of end products on fermentation profiles in
Clostridium carboxidivorans P7 for syngas fermentation. Bioresour. Technol. 218, 1055-
63.
35. Zhao, Y., Haddad, M., Cimpoia, R., Liu, Z., Guiot, S.R. 2013. Performance of a
Carboxydothermus hydrogenoformans-immobilizing membrane reactor for syngas
upgrading into hydrogen. Int. J. Hydrog. Energy 38(5), 2167-2175.
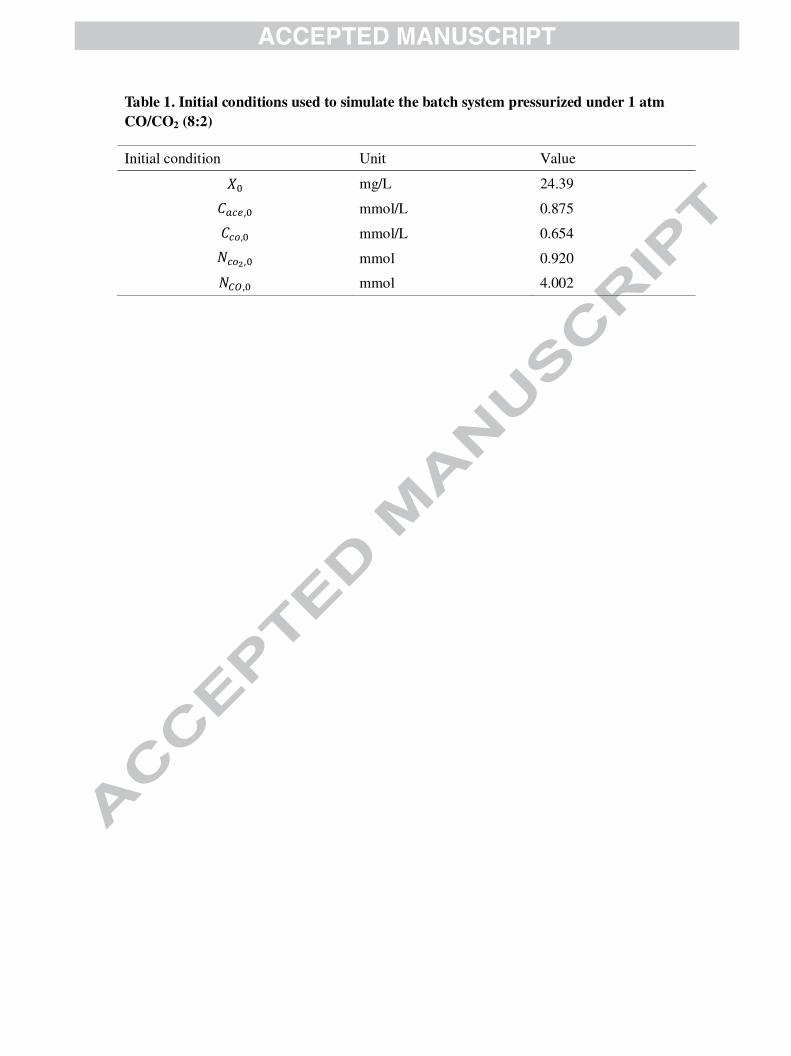
Table 1. Initial conditions used to simulate the batch system pressurized under 1 atm
CO/CO2 (8:2)
Initial condition Unit Value
"A mg/L 24.39
9�'=,A mmol/L 0.875
9'(,A mmol/L 0.654
)'(<,A mmol 0.920
)�*,A mmol 4.002

Table 2. Kinetic parameters, constants, yield coefficients describing E. limosum
KIST612 growth, and the simulated kLa value
Kinetic parameter
Unit Value Reference
���� /hr 0.165 Determined by batch test data from (Chang et
al., 1999)
�� /hr 0.002 Fitted to batch test data from (Chang et al.,
1999)
678 /hr 13 Fitted to experimental data
Constant
�� mmol/L 0.082 (Chang et al., 2001)
�B mmol/L 744.3 Determined by extrapolation of experimental
data
Yield coefficient
:�'=/�* - 0.173 Determined by batch test data from (Chang et
al., 1999)
:�*</�* - 0.504
Determined by batch test data from (Chang et
al., 1999)
:$/�* mg/mmol 4.752 Determined by batch test data from (Chang et
al., 1999)

Table 3. Normalized root mean square error (NRMSE) of simulated parameters using
various kLa values with (Cco ≠ 0) condition
678 (/hr) NRMSE (%)
" )'( )'(< 9'�=
1 53.9 47.75 50.42 47.38
3 33.46 28.59 31.83 29.92
6 18.47 14.06 17.76 16.69
9 11.12 6.54 10.44 9.9
13 6.76 2.37 5.44 5.6
20 6.23 5.69 4.1 5.07
30 8.3 9.12 6.44 7.21
50 10.77 12.04 9.07 9.57

Table 4. Normalized root mean square error (NRMSE) of simulated parameters using
various kLa values with (Cco = 0) assumption
678 (/hr) NRMSE (%)
" )'( )'(< 9'�=
1 52.76 46.73 49.42 46.45
3 27.75 23.67 26.93 25.45
6 5.87 6.21 8.39 8.75
9 10.54 13.5 10.35 10.98
11.5 18.87 20.94 17.16 17.17
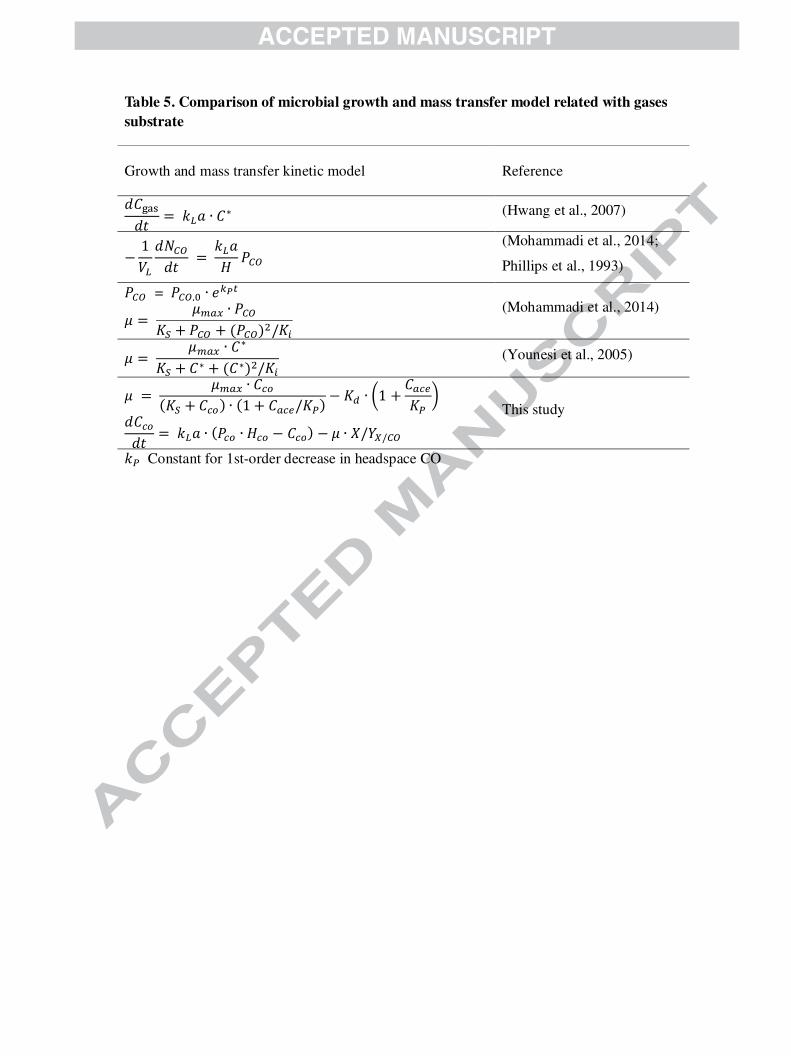
Table 5. Comparison of microbial growth and mass transfer model related with gases
substrate
Growth and mass transfer kinetic model Reference
!9CDE!# = 678 ∙ 9∗ (Hwang et al., 2007)
− 137
!)�*!# = 678
5 &�* (Mohammadi et al., 2014;
Phillips et al., 1993)
&�* = &�*,A ∙ GH�% (Mohammadi et al., 2014) � = ���� ∙ &�*
�� + &�* + �&�*�I/�J
� = ���� ∙ 9∗
�� + 9∗ + �9∗�I/�J (Younesi et al., 2005)
� = ���� ∙ 9'(��� + 9'(� ∙ �1 + 9�'=/�K� − �� ∙ L1 + 9�'=
�KM
This study !9'(!# = 678 ∙ �&'( ∙ 5'( − 9'(� − � ∙ "/:$/�*
6K Constant for 1st-order decrease in headspace CO
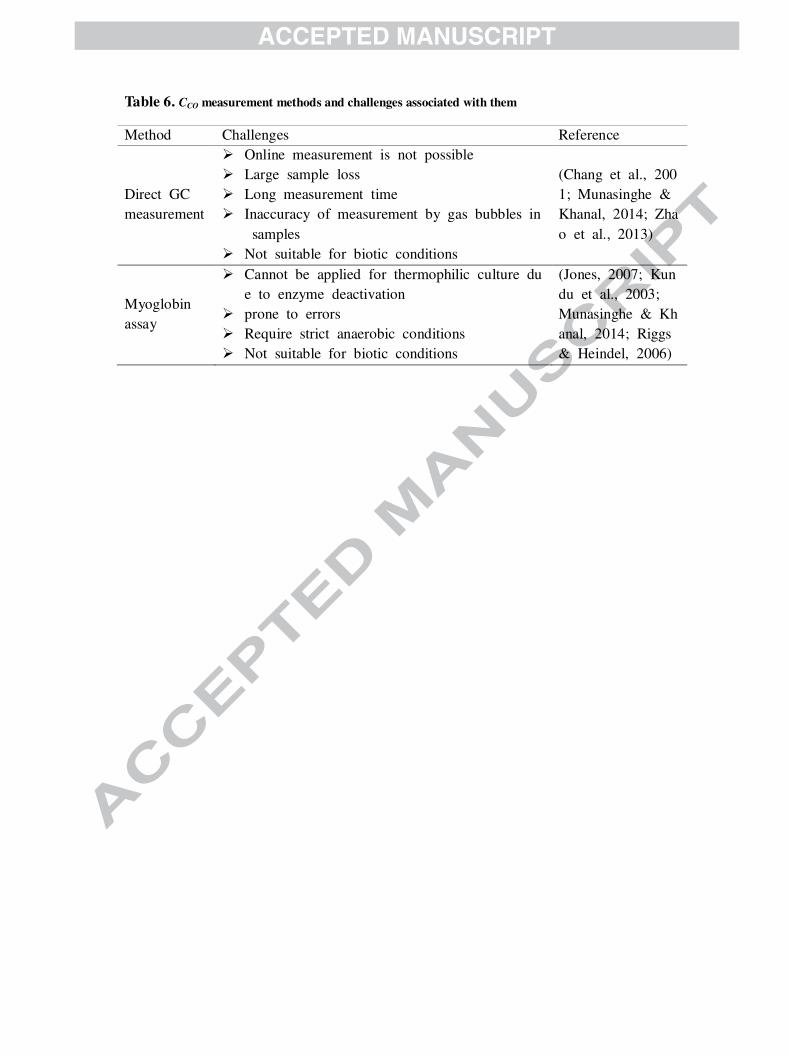
Table 6. CCO measurement methods and challenges associated with them
Method Challenges Reference
Direct GC
measurement
� Online measurement is not possible
� Large sample loss
� Long measurement time
� Inaccuracy of measurement by gas bubbles in
samples
� Not suitable for biotic conditions
(Chang et al., 200
1; Munasinghe &
Khanal, 2014; Zha
o et al., 2013)
Myoglobin
assay
� Cannot be applied for thermophilic culture du
e to enzyme deactivation
� prone to errors
� Require strict anaerobic conditions
� Not suitable for biotic conditions
(Jones, 2007; Kun
du et al., 2003;
Munasinghe & Kh
anal, 2014; Riggs
& Heindel, 2006)
Figure captions
Fig. 1. Specific growth rate profile of E. limosum KIST612 under different acetate
concentration ranges. The data obtained below 120 mM were extrapolated out to 480 mM to
calculate the acetate inhibition constant (�K). Data point that showed highest specific growth
rate was used in two or three sample sets.
Fig. 2. Comparison of the simulated model of the cell concentration, headspace CO2, and
acetate, with the actual experiment data using different kLa values. Simulations were
conducted under the assumption that (Cco ≠ 0) and (Cco = 0) respectively. Batch cultivation
data reported previously (Chang et al., 1999) were used for the simulation.
Fig. 3. Change in the headspace CO, simulated using different kLa values, and a comparison
with the experimental data points. (B) was simulated under the assumption that (Cco = 0) in
Eqn. 6. The headspace CO was analyzed in triplicate. Eqn. 7 was used to simulate the
headspace CO. The batch cultivation data previously reported in (Chang et al., 1999) were
used for the simulation.
Fig. 4. Change in the dissolved, saturated CO concentration, gas–liquid mass transfer, and
microbial CO consumption rate in the medium. Saturated CO was predicted using Henry’s
law and the ideal gas equation based on the simulated headspace CO.

Fig. 1
Fig. 2
The image cannot be display ed. Your computer may not hav e enough memory to open the image, or the image may hav e been corrupted. Restart y our computer, and then open the file again. If the red x still appears, y ou may hav e to delete the image and then insert it again.
Fig. 3
The image cannot be display ed. Your computer may not hav e enough memory to open the image, or the image may hav e been corrupted. Restart y our computer, and then open the file again. If the red x still appears, y ou may hav e to delete the image and then insert it again.
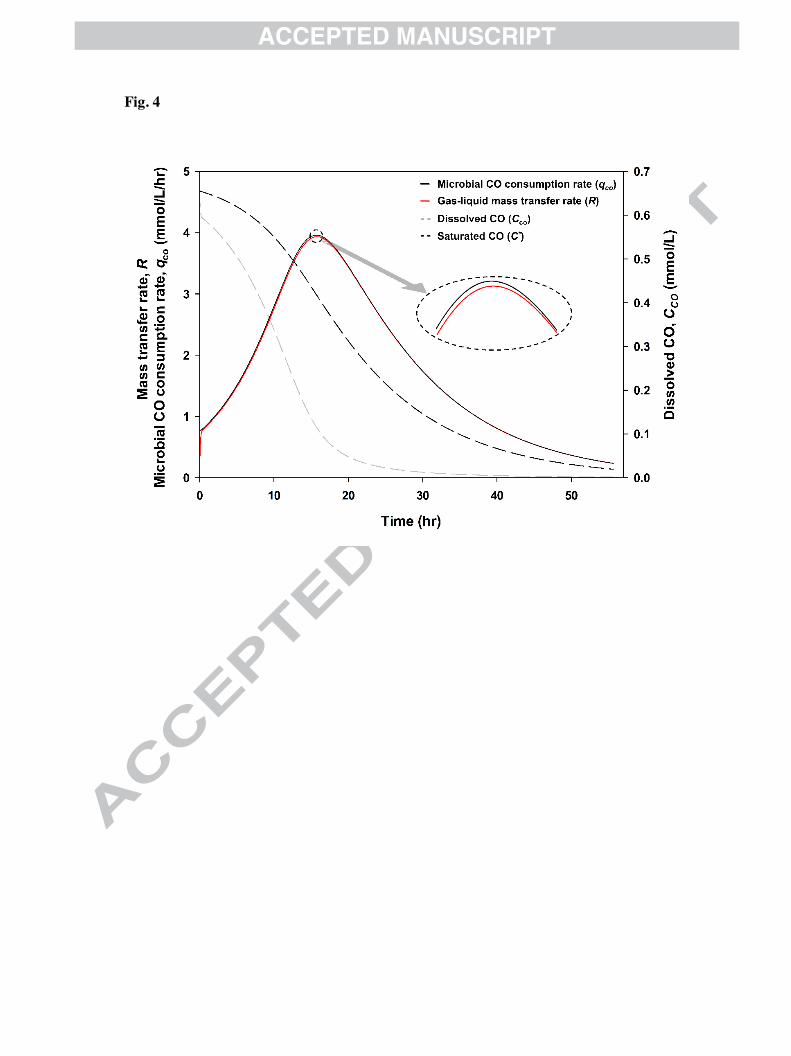
Fig. 4

Highlights
• First report of kLa for a batch cultivation system using kinetic simulation
• Combined microbial kinetics and gas–liquid mass transfer
• The dissolved CO concentration and mass transfer in a batch system were simulated
• No dissolved CO assumption leads to a large error in simulating gas cultivation