Embed Size (px)
Citation preview
Cronfa - Swansea University Open Access Repository
_____________________________________________________________
This is an author produced version of a paper published in :
Nanotechnology
Cronfa URL for this paper:
http://cronfa.swan.ac.uk/Record/cronfa20639
_____________________________________________________________
Paper:
Brown, M., Hondow, N., Brydson, R., Rees, P., Brown, A. & Summers, H. (2015). Statistical prediction of nanoparticle
delivery: from culture media to cell. Nanotechnology, 26(15), 155101
http://dx.doi.org/10.1088/0957-4484/26/15/155101
_____________________________________________________________ This article is brought to you by Swansea University. Any person downloading material is agreeing to abide by the
terms of the repository licence. Authors are personally responsible for adhering to publisher restrictions or conditions.
When uploading content they are required to comply with their publisher agreement and the SHERPA RoMEO
database to judge whether or not it is copyright safe to add this version of the paper to this repository.
http://www.swansea.ac.uk/iss/researchsupport/cronfa-support/
This content has been downloaded from IOPscience. Please scroll down to see the full text.
Download details:
IP Address: 137.44.164.78
This content was downloaded on 14/06/2016 at 13:59
Please note that terms and conditions apply.
Statistical prediction of nanoparticle delivery: from culture media to cell
View the table of contents for this issue, or go to the journal homepage for more
2015 Nanotechnology 26 155101
(http://iopscience.iop.org/0957-4484/26/15/155101)
Home Search Collections Journals About Contact us My IOPscience
Statistical prediction of nanoparticledelivery: from culture media to cell
M Rowan Brown1, Nicole Hondow2, Rik Brydson2, Paul Rees1,Andrew P Brown2 and Huw D Summers1
1College of Engineering, Swansea University, Swansea, SA2 8PP, UK2 Institute for Materials Research, University of Leeds, Leeds, LS2 9JT, UK
E-mail: [email protected]
Received 12 December 2014, revised 12 February 2015Accepted for publication 14 February 2015Published 23 March 2015
AbstractThe application of nanoparticles (NPs) within medicine is of great interest; their innatephysicochemical characteristics provide the potential to enhance current technology, diagnosticsand therapeutics. Recently a number of NP-based diagnostic and therapeutic agents have beendeveloped for treatment of various diseases, where judicious surface functionalization isexploited to increase efficacy of administered therapeutic dose. However, quantification ofheterogeneity associated with absolute dose of a nanotherapeutic (NP number), how this istrafficked across biological barriers has proven difficult to achieve. The main issue being thequantitative assessment of NP number at the spatial scale of the individual NP, data which isessential for the continued growth and development of the next generation of nanotherapeutics.Recent advances in sample preparation and the imaging fidelity of transmission electronmicroscopy (TEM) platforms provide information at the required spatial scale, where individualNPs can be individually identified. High spatial resolution however reduces the samplefrequency and as a result dynamic biological features or processes become opaque. However, thecombination of TEM data with appropriate probabilistic models provide a means to extractbiophysical information that imaging alone cannot. Previously, we demonstrated that limited cellsampling via TEM can be statistically coupled to large population flow cytometry measurementsto quantify exact NP dose. Here we extended this concept to link TEM measurements of NPagglomerates in cell culture media to that encapsulated within vesicles in human osteosarcomacells. By construction and validation of a data-driven transfer function, we are able to investigatethe dynamic properties of NP agglomeration through endocytosis. In particular, we statisticallypredict how NP agglomerates may traverse a biological barrier, detailing inter-agglomeratemerging events providing the basis for predictive modelling of nanopharmacology.
Keywords: nanoparticle, nonhomogeneous Poisson process, transmission electron microscopy,nanotherapeutic
(Some figures may appear in colour only in the online journal)
Introduction
The application of nanoparticles (NPs) within medicine is ofgreat interest; their innate physicochemical characteristics
provide the potential to enhance current technology, diag-nostics and therapeutics. In recent years a number of NP-based diagnostic and therapeutic agents have been developedfor treatment of various cancers, where surface functionalityhas been exploited to provide more effective routes toadministration of therapeutic dose [1, 2]. As delivery systemsNPs provide an improved means to detect abnormalities at themolecular scale; surface functionality providing increasedtargeting efficiency and controlled release of therapeutic dose
Nanotechnology
Nanotechnology 26 (2015) 155101 (9pp) doi:10.1088/0957-4484/26/15/155101
Content from this work may be used under the terms of theCreative Commons Attribution 3.0 licence. Any further
distribution of this work must maintain attribution to the author(s) and thetitle of the work, journal citation and DOI.
0957-4484/15/155101+09$33.00 © 2015 IOP Publishing Ltd Printed in the UK1
over a user-defined period; a thorough review is provided byZhang et al [3]. Additionally, NPs have improved the sensi-tivity and specificity of many imaging platforms. In parti-cular, superparamagnetic NPs now play a key role inmagnetic resonance imaging, providing enhanced imagecontrast and increased resolution to inform and quantify manytissue abnormalities (see Na et al [4] for examples).
Despite success in these areas, application of NP tech-nology or quantification of NP dose at the individual cellular-level is still at an infant stage. Specifically, detailing theinfluence that the myriad of biophysical processes have on NPagglomeration, transport within biological media, cellularuptake, internalization and redistribution has proven difficultto quantify. This shortcoming is directly related to theinability of high-throughput time-lapse systems to providerigorous cytometric measurement and analyses of the evolu-tion path of NPs on an appropriate spatial scale (i.e. theindividual NP (nm)). If NP-based medicine is to be trulyrealized in future years it is an absolute that the communityare able to accurately (i) quantify the internalized nanoma-terial dose as opposed to that simply applied [5, 6], (ii)determine the biological consequences associated with thisactual dose and (iii) predict how the dose evolves over time.
Electron microscopy, in particular transmission electronmicroscopy (TEM), is a technical platform that can deliverinformation at the required spatial scale, where individualNPs can be identified, in terms of both number and spatiallocation [7]. Recent in vitro studies have detailed the impactof gold NP agglomeration on several cell lines [8, 9], wherethis is important because comparisons of NP agglomerate sizemeasured in water and cell culture media report increases insize for the latter [10]. We have previously demonstrated amethod in which NP dispersion can be rapidly frozen andimaged in the TEM, with representative agglomerate dimen-sions measured [11]. This provides more precise imaging ofactual NP agglomerate state in which a NP agglomerate sizeand distribution is more accurately determined, a fundamentalcriterion for the continued development of a nanomedicine.TEM has also been applied to study the cellular uptake of NPsto human mammary cells by endocytosis, with outputs sug-gesting initial sequestration in early endosomes followed bytranslocation to late endosomes or lysosomes [12]. In addi-tion, Krpetic et al have previously used TEM to track theintracellular distribution of peptide modified gold NPs atseveral time points, covering initial membrane boundencapsulation and release, and through to clearing of theparticles from the analyzed cells [13].
Application of this technology however comes with anintrinsic compromise that limits temporal sampling whencompared to flow cytometry and current optical microscopyplatforms. Due to reduced temporal sampling many electronmicroscopy contributions to research in nanomedicine arepurely qualitative, however, there is a growing researchcommunity that are developing novel methodologies thatprovide quantitative biophysical insight of contiguous TEMmeasurements [14–16]. Specifically, utilizing TEM in con-junction with appropriate stochastic or statistical methods thatprovide a bridge between measurement points can be
exploited to provide unresolvable information of the under-lying biophysical processes in this interval.
In this work, we apply the concept of statistical analysisto link distinct spatiotemporal TEM measurements [15] toinvestigate the transport of NP agglomerates in cell culturemedia, to that within endosome compartments in humanosteosarcoma cells (U2-OS cell-line). The NPs employed areQTracker 705 nm CdTe/ZnS quantum dots at a 10 nM dose;we have significant experience incorporating these NPswithin U2-OS cellular systems and have demonstrated thatthey are toxicologically and pharmacodynamically inert atthis dosage [17, 18], and that they may be utilized to extractmeaningful biological parameters, see [15, 17, 19–24] forexamples. QTracker 705 nm quantum dots are specificallytargeted for endocytic uptake; the NPs have an organiccoating, composed of arginine-rich targeting peptides con-jugated to biotin bonded to streptavidin and the arginine-richpeptides can lead to cellular uptake via micropinocytosis [25].
We image and characterize 500 distinct NP agglomer-ates/aggregates in culture media and within endosome com-partment cells respectively, the latter following the 1 hexposure to the NP rich culture media. For clarity, we refer toNP clusters in culture media as agglomerates and those withinendosomes as aggregates. Each of the NP agglomerates/aggregates imaged via TEM is randomly selected, in the lattercase we first randomly select 100 distinct cells from a cellularpopulation comprising of >104 cells and subsequently selectstochastically 500 endosomes from within this cellular sub-population. In both spatiotemporal cases the number ofindividual NPs per agglomerate/aggregate is determined [11].Previously, we have shown stochastic sampling of high-resolution low frequency TEM images in this manner iscapable of capturing cellular heterogeneity in NP uptake andfurther redistribution within daughter cells through mitosis.Specifically, we demonstrated that stochastic sampling ofprobability mass functions (PMFs) that encapsulate NPnumber per endosome and NP aggregate number per cell canbe utilized to provide the total quantum dot fluorescentintensity per cell for 104 in-silico cells. It was established thatthe in-silico population accurately recreated and predictedcorresponding high-throughput flow cytometry measure-ments [15].
Analyzing the collected TEM images we construct thePMFs that encapsulate system heterogeneity associated withNP agglomerates/aggregates size (i.e. number of constituentNPs) in culture media and in endosome compartments fol-lowing 1 h NP exposure.
We demonstrate that transition of states between the twoPMFs can be achieved by considering the combined bio-physical processes of NP transport [26] and cellular uptake asa nonhomogeneous Poisson process (NHPP), where the rateparameter that describes NP agglomerate aggregation at thecellular surface or during endocytosis is driven by actualTEM measurements. Statistical sampling of the NHPP returnsthe number of NP agglomerates from within the culture mediathat have attached to an active endocytic domain on the cellsurface and have subsequently been encapsulated within an
2
Nanotechnology 26 (2015) 155101 M R Brown et al
endosome through one of the many endocytic pathways. ThePMF of the number of NPs per in-silico endosome is thendeduced and compared with the correspond PMF actuallymeasured via TEM; through difference minimization we areable to recover the average lifetime of an active endocyticevent and the mean area of the domain and show these arecommensurate with direct measurements of clathrin-coatedpits through high-resolution optical microscopy techniques[27, 28], validating the applicability of the methodology. Thisdata-driven methodology provides a means to intrinsicallyembed internalized nanomaterial dose within the in-silicoendosome population [5, 6] and statistically establish how thecell media NP dose has translated across the biologicalmembrane into endosome compartments in so doing addres-sing important unmet requirements of associated with quan-tification of nanotheraputics.
Materials and methods
TEM
TEM was conducted on an FEI Tecnai F20 FEG-TEMoperated at 200 kV and equipped with a Gatan Orius SC600ACCD camera. Commercially available targeted nanocrystals,QTracker705 quantum dots dispersed at 10 nM in McCoys5A cell culture media containing 10% fetal calf serum wereexamined using the plunge-freeze method previously reported[11]. Briefly, this involves rapidly freezing a blotted 3.5 μL
droplet of the suspension on a glow discharge treated carbonsupport film in to liquid ethane. Following this, the samplewas warmed to room temperature using a rotary pumpedvacuum desiccator. In cell uptake experiments, U2OS cellsmaintained in McCoys 5a media and 10% fetal calf serum at37 °C in an atmosphere of 5% CO2 were loaded with thecommercially available targeted nanocrystals, QTracker705 ata 10 nM concentration [15, 17]. Samples were prepared forTEM in a standard manner [11, 15] with no additional heavymetal stain added to the resulting 100 nm thick sections.
NP agglomerate—translation from cell culture media toendosome compartment
In the following we present an overview of NP particle tra-verse from media to endosome compartment. We describequalitatively the key biophysical states (i) NPs are loaded intoculture media (outside the cell) at the start of the experiment,(ii) during the experiment, NPs are transported through themedia to the cell surface and may be internalized through anactive endocytic pathway and (iii) 1 h post NP load, the cel-lular population are biologically fixed and no further NPparticle internalization by the cells takes place. Time points (i)and (iii) coincide with previously reported TEM measure-ments of NP agglomerates in media [11] and in cellularvesicles [15]; 500 agglomerates were imaged at random andthe number of individual NPs per agglomerate, x, wasdeduced via a bespoke image analysis routine [11]. The data
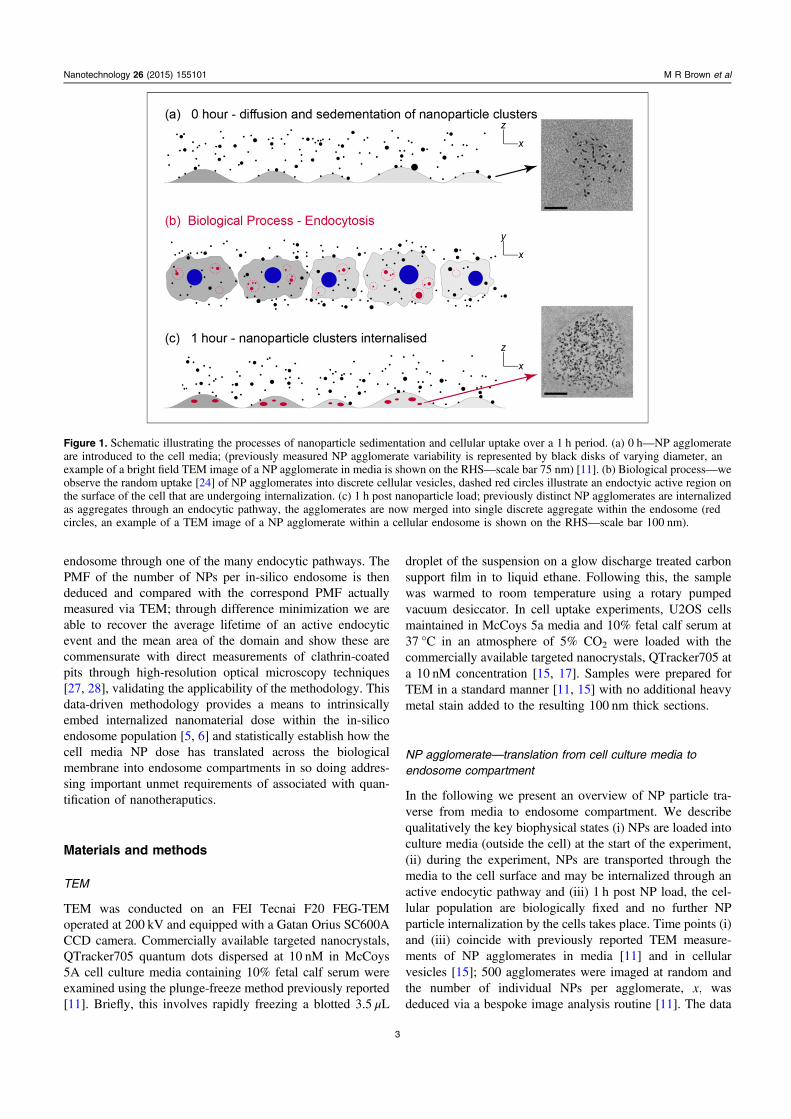
Figure 1. Schematic illustrating the processes of nanoparticle sedimentation and cellular uptake over a 1 h period. (a) 0 h—NP agglomerateare introduced to the cell media; (previously measured NP agglomerate variability is represented by black disks of varying diameter, anexample of a bright field TEM image of a NP agglomerate in media is shown on the RHS—scale bar 75 nm) [11]. (b) Biological process—weobserve the random uptake [24] of NP agglomerates into discrete cellular vesicles, dashed red circles illustrate an endoctyic active region onthe surface of the cell that are undergoing internalization. (c) 1 h post nanoparticle load; previously distinct NP agglomerates are internalizedas aggregates through an endocytic pathway, the agglomerates are now merged into single discrete aggregate within the endosome (redcircles, an example of a TEM image of a NP agglomerate within a cellular endosome is shown on the RHS—scale bar 100 nm).
3
Nanotechnology 26 (2015) 155101 M R Brown et al
measured at these distinct time points are embedded withinour model, intrinsically incorporating system heterogeneity.
Figure 1(a) is a schematic of the experimental set-up atthe beginning of the experiment (0–h) and illustrates a cellularpopulation (grey protuberances) in media subject to a NP doseof 10 nM [11, 15]. Hondow et al [11] previously reported thatQTracker 705 NPs agglomerate indiscriminately in culturemedia, (see results) the high heterogeneity of x is illustratedhere by the variance associated with the radii of the blackdisks. A TEM image of a NP agglomerate captured in media[11] is shown on the right-hand side of the figure (scale bar is75 nm). During the 1 h interval of the experiment NPagglomerates are transported to the cell surface via diffusionand sedimentation processes. The mean transport rates of thedifferently sized NP agglomerates, γ x( ), can be accuratelydetermined through application of the in vitro sedimentation,diffusion and dosimetry (ISDD) model [26] specific to the NPand experimental set-up considered.
At the cell surface NP agglomerates can be captured byone of the many endocytic pathways and subsequently beinternalized by the cell into discrete endosome compartments[29]. A simplified view of this complex biophysical process isshown in figure 1(b). The figure displays a plan view of thecellular population; cells are represented by the grey domains,blue circles are corresponding cell nuclei and the red-dashedcircles represent areas on the cell surface where an endocyticevent is taking place. We define such to areas to be endosomeactive domains (EADs). The red and black disks in the figurerepresent NP agglomerates inside or outside these domainsrespectively. For simplicity, we assume (i) that NP agglom-erate attachment to receptors within individual EAD areirreversible and all attached agglomerates are subsequentlyaggregated and internalized by the cell (red) and (ii) over theduration of the experiment EADs appear randomly (spatio-temporally) on the cell surface and persist for a mean lifetime,τ, where τ ≪ 1 h [27]. The latter criterion together with theapproximation that NP agglomerate transport to the cell isdeduced via a mean rate over the duration of the entireexperiment, suggests that the number of distinct NPagglomerates that impinge on a given EAD, N x( ), is intrin-sically variable. We postulate that the variability of N x( ) iswell described if we consider the combined biophysicalprocesses of NP agglomerate transport and EAD attachmentas an arrival event within a NHPP. The number of randomarrivals of agglomerate with x constituent NPs is then givenby:
λ=λ
N xx
x( )
( ) e
!, (1)
x x( )
where the magnitude of rate parameter λ x( ) comprises twoprinciple components:
λ α=x x E x( ) ( ) ( ). (2)
The first component α x( ) is driven by the experimentalsystem under investigation and is further split into the fol-lowing expression:
α γ τ=x N x( ) ( ) , (3)EAD
where NEAD is the mean number of NPs that settle on a EADover the period τ (see below for calculation of N ).EAD Asoutlined above γ x( ) is the deterministic rate at which a NPagglomerate is transported to the surface of the cell during thecourse of the experiment (see ISDD model below). The meanlifetime or turnover rate an endocytic event τ, is the implicitfitting parameter of this methodology; the consequences of τvariability is addressed and discussed in the results section ofthe manuscript. The second component E x( ) is a numericalweighting coefficient, it is the product of the PMF associatedwith the number of individual NPs per agglomerate measuredin media (P x( ),M see results) and the experimentallydetermined range of x itself:
=E x P x x( ) ( ). . (4)M
This parameter is paramount in our data-driven metho-dology, its magnitude is prescribed by previously measureddata, which both limits and biases the values of N x( )accordingly via application of equation (1) (random samplingof the NHPP). Together equations (1)–(4) provide a data-driven and biophysically viable methodology to estimate thenumber of NP agglomerates per EAD, N x( ), over the courseof its lifetime τ. Finally, figure 1(c) is a schematic of theexperimental set-up at the end of the experiment (1 h); thediagram indicates that previously distinct NP agglomerateswithin an individual EAD have been condensed into a singleaggregate through the internalization process (red ellipses);where total NP number is conserved. A TEM image of a NPaggregate within an endosome is shown on the right-handside of the figure (scale bar is 100 nm). The total number ofNPs per endosome is simply deduced via the summation:
∑=N N x x( ) . (5)E
x
Using equation (5) we can stochastically generate cor-responding data to that measured experimentally. Specifically,we can calculate NE for 500 simulated endosomes anddetermine their corresponding probability mass distribution tocompare with that deduced experimentally within endosomecompartments 1 h post NP load.
In vitro ISDD model
The ISDD model was used to calculate the transport rates ofQTracker 705 CdTe/ZnS quantum dot agglomerates in thecell culture media in [11]. A comprehensive review of theequations governing particle diffusion and sedimentation areprovided by Hinderliter et al [26], furthermore the paperprovides a MATLAB script to solve the various equations andnumerous applications of the model. We modified the ISDDmodel parameters to make the solution specific for QTracker705 (CdTe) quantum dots and the biological assay used; allparameters used are displayed in table 1.
The ISDD model provides an estimation of the diffusionand sedimentation rates as a function of number of NPs peragglomerate for a media depth of 287 μm over the 1 h periodof the experiment; these are displayed in figure 2, blue linewith ‘x’ markers and green line with circle markers
4
Nanotechnology 26 (2015) 155101 M R Brown et al
respectively. The solid black curve in figure 3 is the meanagglomerate transport rate as a function of the number of NPsper agglomerate, γ x( ), which is an average of these twoprocesses and is employed within equation (3) to estimate thenumber of NPs per agglomerate dependent, Poisson dis-tributed, integer multiplier in equations (1) and (5). The ISDDcalculation predicts that γ x( ) is a minimum for x ~ 100 NPsper agglomerate; that is agglomerates of this size are theslowest to reach the cell surface; above and below this valuetransport is dominated by sedimentation and diffusionrespectively.
Calculation of the mean number of NPs per endocytic activedomain NEAD
From the experimental parameters given in table 1 we canestimate NAER from the following expression:
= ×N NA
A, (6)f
fEAD
EAD
here Nf is the number of NPs in the culture flask, A f is thearea of the culture flask and AEAD is the mean area of anEAD. The magnitude of Nf is calculated via the expression:
= × ×N N N V ,f A c M where NA is Avogadro’s constant [22].The latter parameter is determined empirically; the major axislength of the 500 endosome sample was quantified throughimage based analysis, the mean, standard deviation and thelower and higher extremities were determined to be 213, 102,62 and 497 nm respectively. There magnitudes are congruentwith that measured through stochastic optical reconstructionmicroscopy [30]. We approximate the EAD capture area inour simulations to be circular given by π=A REEAD
2.
Results
Figure 3(a) plots the PMFs corresponding to the experimen-tally determined number of NPs per agglomerate, x [11, 15].The PMF of x measured at 0-h in media, P x( ),M is the blackcurve with circle markers, the PMF corresponding to thenumber NPs per endosome measured after 1 h, P x( ),E is thered curve with square markers. In both experimental cases,500 randomly selected NP agglomerates/aggregates wereselected and imaged via TEM, the number of distinct NPswithin each cluster was determined via image analysis rou-tines run on MATLAB [11].
To capture the observed variability associated with x,both curves in figure 3(a) are plotted on a semi-log x-axis. Inmedia, x varies over the interval 1 to ~800 NPs; TEM imagesin figures 2(b) and (c), show examples from within the range,where the centroid positions of each individual NP within theagglomerate (red dots) is also shown [11]. Similarly,figures 2(d) and (e) display TEM images of low and high NPaggregate densities (17 and 320 NPs respectively) withinendosome compartments, where x now spans the extendedinterval 1 to ~1500 NPs. Comparing P x( )M and P x( ),E it isevident that the most probable magnitude of x has increasedby two orders of magnitude (from 1 to 546 NPs), suggestingan accumulation of distinct NP agglomerates occurs duringthe endocytic process. Accumulation of NP agglomerates cantake place at the cell surface within the lifetime of the EAD ormay occur between early endosomes post internalization. Inour methodology the exact biophysical mechanism(s) cannotbe identified, but we have confidence that they have occurreddue to the observed positive shift shown by the respectivePMFs over the duration of the experiment.
The experimental data in figure 3 is recast to theequivalent cumulative distribution function (CDF) form infigure 4; classification of curve colours/markers is preserved,i.e. the CDFs in figure 4(a), F x( )M and F x( ),E correspond to
Table 1. Empirical values of experimental and ISDD parameters.
NP CdTe
NP Concentration (nMol), Nc 10Major Axis Length (nm)a 10Packing fraction ( −nm 2)a 0.02Fractal dimensionb 2.3Area of flask, A f (m2) × −75 10 4
Media volume (mL), V M 2Media depth μm( ) 287
a
Hondow et al [11].b
Estimated as +d 1f (see Falconer [31], chapter
6), where d f is the fractal dimension of the 2d
projection of the actual 3d NP aggregate, i.e.TEM image.
Figure 2. Simulated transport properties of CdTe NP agglomerategenerated by the ISDD model. The solid black line is the meantransport rate of agglomerate to the cell surface, γ x( ). The curvesassociated with the blue ‘x’ and green circle markers indicate theindividual diffusion and sedimentation rates respectively. Thedominant transport mechanism switches from diffusion to sedi-mentation for >x 100 NPs. The minimum of γ x( ) at x ~ 100 NPssuggests agglomerates around this size are transported least rapidlyto the cell surface.
5
Nanotechnology 26 (2015) 155101 M R Brown et al
that generated from experimental measurements of NPagglomerates in cell culture media and within endosomecompartments respectively. In alignment with that measuredexperimentally, we evaluate equation (5) for 500 trials andestimate the number of NPs per endosome NE for each trial.From this data we can calculate F x( ),E
NHPP an in silico pre-dicted CDF via the NHPP. F x( )E
NHPP is also displayed infigure 4(a) as the blue curve with ‘x’ markers. A statisticalassessment of F x( )E
NHPP and F x( )E through application of a
two-sample Kolmogorov–Smirnov test does not reject thenull hypothesis at a significance level of 1% (p-value of0.999 ), suggesting that both distributions are equivalent. Theaccuracy of fit between F x( )E
NHPP and F x( )E was iterativelyachieved through optimization of the magnitude of the meanlifetime of an EAD, τ, the models only fitting parameter.Throughout the optimization process the mean EAD radii RE
was fixed at 213 nm (sample mean of the 500 TEM images),this magnitude is comparable to that of clathrin-coated pits
Figure 3. (a) PMFs of the number of constituent nanoparticles measured per cluster in media and within endosome compartments 1 h postnanoparticle load, black and red curves (circle/square markers) respectively. 500 clusters for each situation were examined to generate thePDFs. (b) and (c) TEM images of two typical NP clusters containing 1 and 51 individual NPs respectively; both images were measured in themedia surrounding the cellular population. Figures (d) and (e) display TEM images of two endosomes containing NP clusters, the total NPload in the first is 17 NPs and 320 NPs in the second. Bright field TEM image contrast has been inverted such that NPs give white contrastand their identification by the image analysis script is shown as red dots. The scale bar for image (b) is 60 nm, for image (c) is 75 nm, forimage (d) and (e) is 100 nm.
Figure 4. Comparison of the CDFs associated with the number of NPs per agglomerate measured experimentally and that predicted via theNHPP. (a) The black curve with circle markers and the red curve with square markers are the CDFs of the measured data at 0 h in media and1 h post NP load within endosome compartments respectively (i.e. F x( )M and F x( ) ).E The blue curve with ‘x’ markers is the optimized CDFpredicted by the NHPP methodology, F x( );E
NHPP the mean lifetime of the EAD was determined to be τ = 63 s when =R 213 nm.E A two-sample Kolmogorov–Smirnov test on F x( )E and F x( )E
NHPP does not reject the null hypothesis at a significance level of 1% (p-value of 0.999 ).(b) The data points (circle markers) show the PMF associated with the predicted number NP agglomerates per EAD. The PMF is from 500simulated EADs using the optimized value of τ and the sample average endosome radii. The data is fitted by the Poisson distribution (blackdashed line) which predicts that a mean number of ~3 NP agglomerates in media combine to form larger aggregates measured within theendosome. (c) Here the data points (circle markers) indicate the PMF associated with the number of NPs per agglomerate that will mergeacross the endosome population.
6
Nanotechnology 26 (2015) 155101 M R Brown et al
measured through stochastic optical reconstruction micro-scopy [30]. Location of the optimized lifetime value τ wasestablished through numerical minimization of the L2-norm ofF x( )E
NHPP and F x( ).E Thus the optimized mean lifetime of anEAD was found to be 63 s, corresponding favourably to thelifetimes measured directly through high-resolution micro-scopy techniques [27, 28].
At the optimized value of τ and RE fixed at 213 nm, wecalculate the PMF associated with the number of constituentNP agglomerates per EAD, N x( ), over the 500 trials. ThePMF of N x( ), P N x( ( )), is displayed in figure 4(b) (circlemarkers) also shown by the black dashed line is a Poissondistribution fit to the calculated data (p-value—0.001). Themean rate λ =N x( ( ( )) 3.05) of the Poisson distributionindicates that ~3 distinct NP agglomerates merge within thelifetime of the EAD to form a larger internalized aggregate.Figure 4(c) is the PMF of the NP agglomerates that willundergo fusion in order to optimize best fit of the in-silicoendosome population.
The main features of figure 4(c) indicate that the mostprobable NP agglomerates that undergo a fusion event arethose containing 10–20 NPs, and those containing300–400 NPs, additionally there is a low probability thatagglomerates containing ~100 NPs will merge and zeroprobability of individual agglomerates >800 as they have notbeen detected experimentally, so are not sampled. Thesefeatures approximately reflect the mean rate of transport of theNP agglomerates to the EADs generated by the ISDD model(see materials and methods—ISDD figure 2). The ISDDpredicts high rates of transport to the cell surface for small(<10 NPs) and large (>300 NPs) agglomerates via diffusionand sedimentation respectively and a relatively slow transportof agglomerates that contain approximately 100 NPs. Thus,on average combinations of such NP agglomerates providesthe mechanism that translates P x( )M to P x( ).E The ISDDmodel also suggests relatively low numbers of 100 NP
agglomerates in the internalized dose, however, even thoughthere is a relative drop in probability at this size (seefigure 3(a)) it is not expected to be significant as there is astrong likelihood that agglomerates of this magnitude can becreated via the high probabilities associated with agglomer-ates of size 10–50 NPs combining.
Although the actual biological spatiotemporal location ofthe amalgamation events cannot be determined, the fact thatwe can statistically acknowledge their average occurrence anddispersion indicates specific properties of the cell-line/NPsystem. In particular, the PMF provides unresolved experi-mental information of how NP agglomerate dosage is trans-formed through endocytosis, one of the key factors limitingthe development of nanomedicine based therapeutics andtechnologies.
To test the sensitivity of our methodology we investi-gated how the solution, i.e. F x( ),E
NHPP varied if we (i) fixed themean lifetime of the EAD at its previously optimized value of63 s and varied the magnitude of RE contiguously from 62 to497 nm (the extremities of the experimentally measuredrange) and (ii) holding RE fixed at 213 nm and varying τ overthe interval [30, 300] seconds. For every iteration, 500 trialsof equation (5) (reflecting the 500 measured endosomes) andthe corresponding CDF (F x( ))E
NHPP is deduced. After each in-silico experiment the mean and standard deviations of therespective CDF series is calculated, additionally the meannumber of fusion events that have occurred for all iterationsof the CDFs series is calculated and found to be ~3 in bothcases. The means (dashed black lines) and standard deviations(grey areas) associated with the variation of RE and τ aredisplayed in figures 5(a) and (b) respectively. For referenceboth F x( )M and F x( )E are also indicated on both figures,black line circles markers and red line square markersrespectively.
The variation of RE corresponds physically to variationof the capture area associated with EADs; reduction of RE
Figure 5. Sensitivity analysis of model (a) the magnitude of grey shaded area is± one standard deviation of the mean value of F x( )ENHPP when
we let RE range over the interval [62, 497] nm whilst τ remains fixed at its optimum value (63 s). (b) The magnitude of grey shaded area is ±one standard deviation the mean value of F x( )E
NHPP when RE is fixed at the sample average (213 nm) and the magnitude of the lifetimeassociated with an EAD varies over the range [30, 240] seconds.
7
Nanotechnology 26 (2015) 155101 M R Brown et al
vastly increases the variability of predicted F x( ) especiallyfor aggregates having <x 100 corresponding to the diffusiondominated transport regime. For >x 100, F x( ) does notdeviate substantially from the optimum CDF shown infigure 4(a) suggesting that at least one of the three fusionevents likely to occur is between relatively large agglomer-ates. As the magnitude of RE increases in size past the samplemean the calculated CDFs are shifted positively in x. This isunsurprising as (i) equation (6) indicates that the number ofagglomerates at the EAD will increase proportionally to themagnitude of R ,E and (ii) a large proportion of theseagglomerates will be that driven by sedimentation as this onaverage is the dominant transport mechanism an is associatedwith the larger NP agglomerates. Figure 5(b) illustrates thevariability of F x( ) when the lifetime of the EAD is variedfrom half its optimized value to that five times greater than itsoptimized value and the capture area of the EAD is fixed at~0.014 μm2. The general features of the variability follow thatobserved for RE variation, i.e. larger fluctuation in F x( ) for
<x 100 for small EAD lifetimes, and a positive shift inmagnitude of F x( ) as the lifetime is increased well beyondthe optimized value of 63 s. In an analogous manner to thatpreviously described, this shift is not surprising as we areagain increasing the possibility of larger agglomerate fusionevents as they have the dominant transport mechanism inthese simulations.
The generally low dispersion observed for F x( ) (for>x 100 NPs) is interesting and suggests that the net NP
aggregation by endosomes is insensitive to both the magni-tude of the EAD and its mean lifetime. The former featurereflects TEM measurements that indicate small NP agglom-erates are found within much larger endosome compartmentsand equally many large NP agglomerates are found withinsimilar sized compartments (e.g. figures 3(d) and (e)).Ongoing and future experiments will quantify this featurefurther. The larger fluctuations of F x( ) for small x, in bothcases, is related to increased sampling variability and willhave a major impact on the predictability of dosage when noagglomeration is present, i.e. for monodispersions of NPs.
Discussion
This study directly addresses key factors limiting the devel-opment of nanomedicine based therapeutics; we preciselyquantify actual NP dosage as opposed to that perceived, indoing so we encapsulate the innate heterogeneity of thenanotheraputic state. We provide a robust methodology thatallows the trafficking of NP dosage across biological barriersto be understood quantitatively which provides the basis forpredictive modelling of nanopharmacology. In this study, wehave focused on quantifying biological barrier trafficking ofQtracker 705 quantum dots exposed to U-2 OS cells inMcCoy’s 5a medium media.
The methodology couples high spatial resolution TEMwith pertinent physical models that together are statisticallysampled to infer the dynamical properties of a NP dose.Specifically, through TEM measurements [11] we
characterize the aggregating properties associated with NPagglomerates at two distinct spatiotemporal biological posi-tions (i) in biological media and (ii) within cellular endosomecompartments in human osteosarcoma cells [15, 17, 19–21, 23, 24]. The statistical profile of NP dose at these distinctspatiotemporal positions was captured by PMFs that sum-marize the properties of 500 quantum dot NP agglomerates,which describe the heterogeneity of particle number withinmeasured agglomerates. We detailed and developed a sto-chastic transfer function (STF) that permits evolution of statesfrom P x( )M to P x( ).E The STF has two principal compo-nents, firstly the previously reported ISDD model [26] isembedded to provide a mean rate of NP agglomerate transportto the cell surface and (ii) system heterogeneity simulatedthrough application of a nonhomogeneous Poisson distribu-tion, which stochastically determines agglomerate arrival atthe cell surface where it may be part of and endocytic eventand subsequently internalized by a cell. The STF’s principalfitting parameter reflects the lifetime of an endocytic event, itsoptimized magnitude was found to be commensurate withdirect measurements of clathrin-coated pits through high-resolution microscopy techniques [27, 28]. Further analysis ofthe STF provides previously unresolved dynamics of the NPagglomerate traverse across the cell membrane, quantifyingstatistically agglomerates fusion as NP dose is translated fromcell-culture media to endosome vesicles. Through optimiza-tion and sampling of the statistical methodology we areconfident in stating that the heterogeneity of the internalizedNP dose (reported previously [15, 24]) is a result of the initial,inhomogeneous dispersion of the NPs in the cell culturemedia used for particle exposure.
This manuscript has developed a statistical frameworkfor the detection (by TEM), quantification and prediction ofquantum dots dispersed in media and following uptake by anycells all at the scale of the individual quantum dot. Futurework will examine and assess how specific variables of thesystem, e.g. cell/NP type, NP surface coating, concentrationor applied exposure dose of NPs have on the heterogeneitymeasured at both temporal locations and how these are sta-tistically translated across the biological membrane. Addi-tionally, we will combine the methods presented here withthat previously developed [15] to fundamentally link high-throughput flow cytometry measurements with TEM basedstatistics to provide accurate assessment of actual NP dosageand its evolution and redistribution across a large cellularpopulation over significant periods.
Acknowledgments
This work was supported by the Engineering and PhysicalSciences Research Council, U.K. under Grants EP/H008683/1 and EP/M000621/1 Swansea and EP/H008578/1 Leeds.Theauthors would like to thank A Warley, K Brady, and FWinning (Centre for Ultrastructural Imaging, King's College,London, U.K.) for pelleting and sectioning the cells for TEManalysis.
8
Nanotechnology 26 (2015) 155101 M R Brown et al
References
[1] Brannon-Peppas L and Blanchette J O 2004 Nanoparticle andtargeted systems for cancer therapy Adv. Drug Deliv. Rev.56 1649–59
[2] Kawasaki E S and Player A 2005 Nanotechnology,nanomedicine, and the development of new, effectivetherapies for cancer Nanomedicine 1 109
[3] Zhang L, Gu F X, Chan J M, Wang A Z, Langer R S andFarokhzad O C 2007 Nanoparticles in medicine: therapeuticapplications and developments Clin. Pharm. Theraputics83 769
[4] Na H B, Song I C and Hyeon T 2009 Inorganic nanoparticlesfor MRI contrast agents Adv. Mater. 21 2133–48
[5] Montes-Burgos I, Walczyk D, Hole P, Smith J, Lynch I andDawson K 2010 Characterisation of nanoparticle size andstate prior to nanotoxicological studies J. Nanoparticle Res.12 47–53
[6] Warheit D B 2008 How meaningful are the results ofnanotoxicity studies in the absence of adequate materialcharacterization? Toxicological Sci. 101 183–5
[7] Elsaesser A, Taylor A, Staats de Yanés G, McKerr G,Kim E-M, O'Hare E and Howard C V 2010 Quantification ofnanoparticle uptake by cells using microscopical andanalytical techniques Nanomedicine 5 1447–57
[8] Albanese A and Chan W C W 2011 Effect of gold nanoparticleaggregation on cell uptake and toxicity ACS Nano 5 5478–89
[9] Singh N, Jenkins G J S, Nelson B C, Marquis B J,Maffeis T G G, Brown A P, Williams P M, Wright C J andDoak S H 2012 The role of iron redox state in thegenotoxicity of ultrafine superparamagnetic iron oxidenanoparticles Biomaterials 33 163–70
[10] Gosens I, Post J A, de la Fonteyne L J J, Jansen E H J M,Gues J W, Cassee F R and de Jong W H 2010 Impact ofagglomeration state of nano- and submicron sized gold particleson pulmonary inflammation Part. Fibre Toxicology 7 37
[11] Hondow N, Brydson R, Wang P, Holton M D, Brown M R,Rees P, Summers H D and Brown A 2012 Quantitativecharacterization of nanoparticle agglomeration withinbiological media J. Nanoparticle Res. 14 977
[12] Xiao Y, Forry S P, Gao X, Holbrook R D, Telford W G andTona A 2010 Dynamics and mechanisms of quantum dotnanoparticle cellular uptake J. Nanobiotechnol. 8 13
[13] Krpetic Ž, Saleemi S, Prior I A, Sée V, Qureshi R and Brust M2011 Negotiation of intracellular membrane barriers byTAT-modified gold nanoparticles ACS Nano 5 5195–201
[14] Shapero K, Fenaroli F, Lynch I, Cottell D C, Salvati A andDawson K A 2011 Time and space resolved uptake study ofsilica nanoparticles by human cells Mol. BioSyst. 7 371–8
[15] Summers H D, Brown M R, Holton M D, Tonkin J A,Hondow N, Brown A P, Brydson R and Rees P 2013Quantification of nanoparticle dose and vesicular inheritancein proliferating cells ACS Nano 7 6129–37
[16] Rosman C, Pierrat S, Henkel A, Tarantola M, Schneider D,Sunnick E, Janshoff A, Sönnichsen C and New A 2012Approach to assess gold nanoparticle uptake by mammaliancells: combining optical dark-field and transmission electronmicroscopy Small 8 3683–90
[17] Errington R J, Brown M R, Silvestre O F, Njoh K L,Chappell S C, Khan I A, Rees P, Wilks S P, Smith P J andSummers H D 2010 Single cell nanoparticle tracking tomodel cell cycle dynamics and compartmental inheritanceCell Cycle 9 121–30
[18] Manshian B B, Soenen S J, Al-Ali A, Brown A, Hondow N,Wills J, Jenkins G J S and Doak S H 2015 Cell typedependent changes in CdSe/ZnS quantum dot uptake andtoxic endpoints Toxicological Sci. at press doi:10.1093/toxsci/kfv002
[19] Brown M R, Rees P, Wilks S, Summers H D, Errington R J,Njoh K L, Chappell S C, Smith P J and Leary J F 2007Computational simulation of optical tracking of cellpopulations using quantum dot fluorophores edM G S Calder Proc. Computational Methods in SystemsBiology pp 96–105
[20] Brown M R, Summers H D, Rees P, Chappell S C,Silvestre O F, Khan I A, Smith P J and Errington R J 2010Long-term time series analysis of quantum dot encoded cellsby deconvolution of the autofluorescence signal CytometryA 77A 925–32
[21] Brown M R, Summers H D, Rees P, Smith P J,Chappell S C and Errington R J 2010 Flow-based cytometricanalysis of cell cycle via simulated cell populations PLoSComput. Biol. 6 e1000741
[22] Summers H 2013 Frontiers of nanoscience Nanomedicine edH Summers pp 26
[23] Summers H D, Errington R J, Smith P J, Chappell S, Rees P,Brown M R and Leary J F 2008 Cell-population trackingusing quantum dots in flow cytometry Proc. Soc. Photo-Opt.Insrum. Eng. 6865 L8650–8650
[24] Summers H D, Rees P, Holton M D, Brown M R,Chappell S C, Smith P J and Errington R J 2011 Statisticalanalysis of nanoparticle dosing in a dynamic cellular systemNat. Nanotechnology 6 170–4
[25] Nakase I et al 2004 Cellular uptake of arginine-rich peptides:roles for macropinocytosis and actin rearrangement Mol.Ther. 10 1011–22
[26] Hinderliter P M, Minard K R, Orr G, Chrisler W B, Thrall B D,Pounds J G and Teeguarden J G 2010 ISDD: Acomputational model of particle sedimentation, diffusionand target cell dosimetry for in vitro toxicity studies Part.Fibre Toxicology 7 36
[27] Ehrlich M, Boll W, Van Oijen A, Hariharan R, Chandran K,Nibert M L and Kirchhausen T 2004 Endocytosis by randominitiation and stabilization of clathrin-coated pits Cell 118591–605
[28] Hansen S H, Sandvig K and Van Deurs B 1992 Internalizationefficiency of the transferrin receptor Exp. Cell Res.199 28
[29] Alberts B, Bray D, Hopkin K, Johnson A, Lewis J, Raff M,Roberts K and Walter P 2009 Essential Cell Biology (NewYork: Garland Science)
[30] Huang B, Wang W, Bates M and Zhuang X 2008 Three-dimensional super-resolution imaging by stochastic opticalreconstruction microscopy Science 319 810–3
[31] Falconer K J 2003 Fractal Geometry: MathematicalFoundations and Applications 2nd edn (Chichester: Wiley)
9
Nanotechnology 26 (2015) 155101 M R Brown et al


![Cronfa - Swansea University Open Access Repository · HQWRPRSDWKRJHQLFIXQJXV 0HWDUKL]LXPEUXQQHXP DQGWKHPRVTXLWRSUHGDWRU 7R[RUK\QFKLWHVEUHYLSDOSLV IRU FRQWURORIPRVTXLWRODUYDH ,VWKLVDULVN\ELRFRQWUROVWUDWHJ\"](https://img.pdfslide.us/doc/110x75/5f7facec7e11967ab1746190/cronfa-swansea-university-open-access-repository-hqwrprsdwkrjhqlfixqjxv-0hwdukllxpeuxqqhxp.jpg)


![Cronfa - Swansea University Open Access Repository · ô ½ ·W=m] Y](https://img.pdfslide.us/doc/110x75/5e086d1104eac94d302c30f1/cronfa-swansea-university-open-access-repository-wm-y.jpg)