Embed Size (px)
Citation preview

CROMWELLEUROPEAN REIT
INVESTOR PRESENTATION
September / October 2018

2
Disclaimer
This presentation shall be read in conjunction with Cromwell European REIT’s (“CEREIT”) financial results announcement dated 13 August 2018 published onSGX Net.
This presentation is for information purposes only and does not constitute or form part of an offer, invitation or solicitation of any offer to purchase or subscribefor any securities of CEREIT in Singapore or any other jurisdiction nor should it or any part of it form the basis of, or be relied upon in connection with, anycontract or commitment whatsoever. The value of units in CEREIT (“Units”) and the income derived from them may fall as well as rise. The Units are notobligations of, deposits in, or guaranteed by Cromwell EREIT Management Pte. Ltd, as manager of CEREIT (the “Manager”), Perpetual (Asia) Limited (astrustee of CEREIT) or any of their respective affiliates. The past performance of CEREIT is not necessarily indicative of the future performance of CEREIT.
This presentation may contain forward-looking statements that involve risks and uncertainties. Actual future performance, outcomes and results may differmaterially from those expressed in forward-looking statements as a result of a number of risks, uncertainties and assumptions. These forward-lookingstatements speak only as at the date of this presentation. No assurance can be given that future events will occur, that projections will be achieved, or thatassumptions are correct. Representative examples of these factors include (without limitation) general industry and economic conditions, interest rate trends,cost of capital and capital availability, competition from similar developments, shifts in expected levels of property rental income, changes in operatingexpenses, including employee wages benefits and training, property expenses, governmental and public policy changes and the continued availability offinancing in the amounts and the terms necessary to support future business.
Prospective investors and unitholders of CEREIT (“Unitholders”) are cautioned not to place undue reliance on these forward-looking statements, which arebased on current view of the Manager on future events. No representation or warranty, express or implied, is made as to, and no reliance should be placed on,the fairness, accuracy, completeness or correctness of the information, or opinions contained in this presentation. None of the Manager, the trustee of CEREITor any of their respective advisors, representatives or agents shall have any responsibility or liability whatsoever (for negligence of otherwise) for any losshowsoever arising from any use of this presentation or its contents or otherwise arising in connection with this presentation. The information set out herein maybe subject to updating, completion, revision, verification and amendment and such information may change materially. An investment in Units is subject toinvestment risks, including possible loss of principal amount invested.
Unitholders have no right to request that the Manager redeem or purchase their Units while the Units are listed. It is intended that Unitholders may only deal intheir Units through trading on Singapore Exchange Securities Trading Limited (the “SGX-ST”). Listing of the Units on the SGX-ST does not guarantee a liquidmarket for the Units.______________________
NOTES:
All figures in this presentation are as at 30 June 2018 and stated in Euro (“EUR” or “€”), unless otherwise statedReporting Period is defined as the period from the date of CEREIT’s listing on the SGX-ST (30 November 2017) to the last day of 2Q 2018 (30 June 2018)

3
2 Introduction to Cromwell European REIT
3 Financial Performance
5 Key Takeaways
6 Sponsor’s Strengths
Contents
4 Asset Management Update
1 Cromwell European REIT Investment Case and Strategic Objectives
7 Appendix

Investment Case and Strategic Objectives

5
Cromwell European REIT Investment Case – Focus on Yield and Growth
Effective 7.2% Annualised Distribution Yield (at current Unit price)1
Cromwell European REIT (“CEREIT”) successfully debuted on 30 November 2017 and has delivered above the IPO Forecast2
€ 1.4 billion Diversified and Balanced Pan-European Exposure 75 predominantly office and light industrial/logistics assets with significant scale
and diversification across approximately 1.2 million square metres lettable area with over 700 tenants
Portfolio Reversionary Yield (Cap rate) = 5.9%Internationally recognised Sponsor and Real Estate Manager Cromwell Property Group (CMW.ASX) operates in 12 European countries with
over 200 real estate and finance professionals and owns 35% of CEREIT unitsOpportunities for Income and Net Asset Value Growth European economic growth underpinning tenant demand and rental uplifts Active asset enhancement initiatives underway Prudent gearing of 33%, with Debt costs of 1.46% and Interest Cover 8.8x Access to the 2nd largest world-wide real estate market with 2017 transaction
volumes of € 293 billion as debt costs remain significantly lower than cap rates, driving higher return on equity (“ROE”) and distribution per unit (“DPU”) accretion5
Balanced Asset Class Exposure3
Diversified Geography Exposure3
43%
47%
10%
Light Industrial / LogisticsOfficeOthers
6%8%
23%
30%
33%
Denmark Germany France
Italy Netherlands
______________________
1. Based on € 0.60, the last traded price on Singapore Exchange Securities Trading Limited (“SGX-ST”) on 8 August 20182. The Prospectus of Cromwell European REIT dated 22 November 2017 (“Prospectus”) disclosed a 1-month profit forecast for the period from 1 December 2017 to 31 December 2017 (“December 2017 Forecast”), and a full-year profit projection from 1 January 2018 to 31 December 2018 (the “FY2018 Projection”). The FY2018 Projection disclosed in the Prospectus was derived from four separate quarterly projections which in aggregate formed the FY2018 Projection. The “IPO Forecast” figures referred to in this presentation were, where not expressly disclosed in the Prospectus, derived from the December 2017 Forecast and the first and second quarterly projections for the period from 1 January 2018 to 30 June 2018 which had been used by the Manager to form the FY2018 Projection. 3. Based on Valuations as at 31 March 20184. Others include three government-let campuses, one retail property and one hotel in Italy on master lease5. € 293 billion is sourced to RCA (Real Capital Analytics), as reported in IPE in an article titled “European mega deals boost 2017 real estate transaction volumes” from 31 January 2017
4
€ 0.40
€ 0.45
€ 0.50
€ 0.55
€ 0.60
€ 0.65
CEREIT FSTREI Index

6
Reiteration of Purpose and Strategic Objectives
Provide investors with regular and stable distributions in either Euro € or Singapore $ Achieve long-term growth in distribution yield and net asset value growth
Active asset management and enhancement strategy, leveraging Cromwell Property Group’s20 offices in 12 countries
Acquisition growth strategy with more than 20 dedicated transaction professionals Prudent capital management policies, with conservative SGX and MAS safeguards Best-Practice approach to Sustainability, Corporate Governance and Social Responsibility
Cromwell European REIT Investment Objectives
Cromwell European REIT Purpose
Cromwell European REIT Investment Characteristics Large, geographically diverse Pan European portfolio Balanced commercial property asset class exposure supported by a long lease profile and a
diversified, high quality tenant base

Introduction to Cromwell European REIT
8
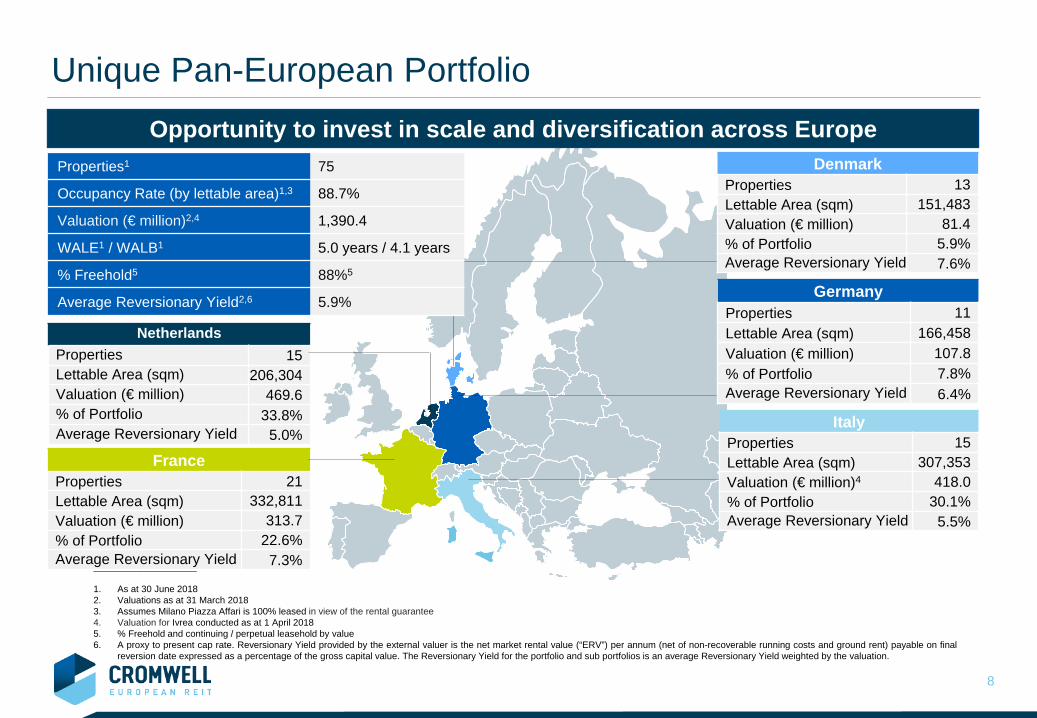
Unique Pan-European Portfolio
NetherlandsProperties 15Lettable Area (sqm) 206,304Valuation (€ million) 469.6% of Portfolio 33.8%Average Reversionary Yield 5.0%
FranceProperties 21Lettable Area (sqm) 332,811Valuation (€ million) 313.7% of Portfolio 22.6%Average Reversionary Yield 7.3%
Opportunity to invest in scale and diversification across EuropeDenmark
Properties 13Lettable Area (sqm) 151,483Valuation (€ million) 81.4% of Portfolio 5.9%Average Reversionary Yield 7.6%
Properties1 75
Occupancy Rate (by lettable area)1,3 88.7%
Valuation (€ million)2,4 1,390.4
WALE1 / WALB1 5.0 years / 4.1 years
% Freehold5 88%5
Average Reversionary Yield2,6 5.9%
____________________
1. As at 30 June 20182. Valuations as at 31 March 20183. Assumes Milano Piazza Affari is 100% leased in view of the rental guarantee4. Valuation for Ivrea conducted as at 1 April 20185. % Freehold and continuing / perpetual leasehold by value6. A proxy to present cap rate. Reversionary Yield provided by the external valuer is the net market rental value (“ERV”) per annum (net of non-recoverable running costs and ground rent) payable on final
reversion date expressed as a percentage of the gross capital value. The Reversionary Yield for the portfolio and sub portfolios is an average Reversionary Yield weighted by the valuation.
GermanyProperties 11Lettable Area (sqm) 166,458Valuation (€ million) 107.8% of Portfolio 7.8%Average Reversionary Yield 6.4%
ItalyProperties 15Lettable Area (sqm) 307,353Valuation (€ million)4 418.0% of Portfolio 30.1%Average Reversionary Yield 5.5%
9
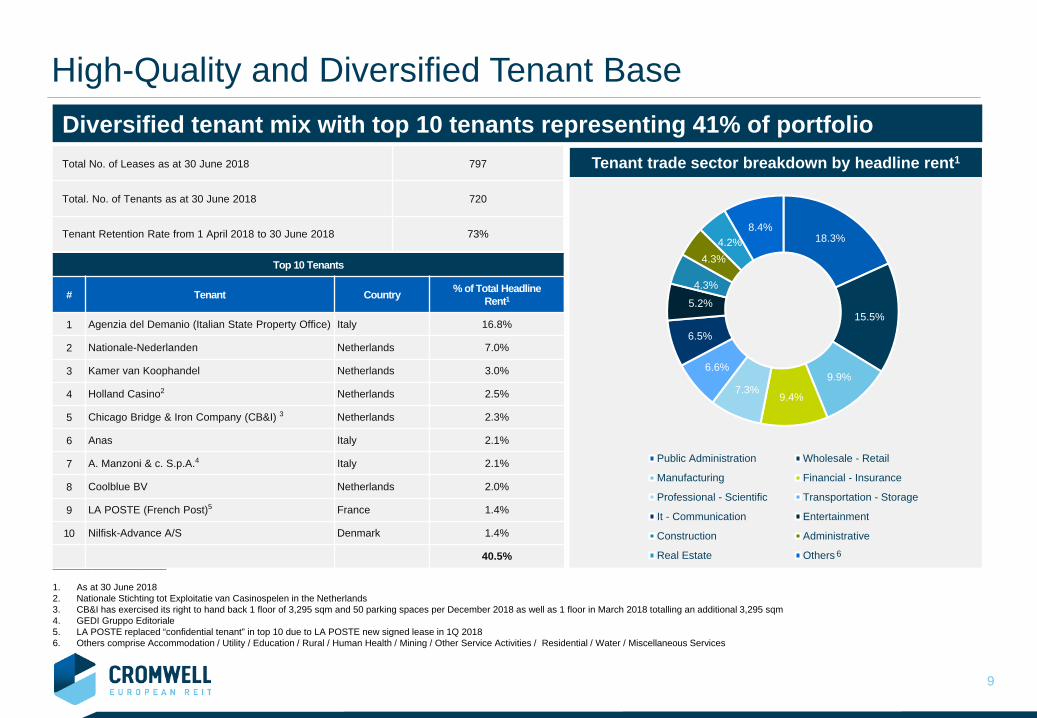
Total No. of Leases as at 30 June 2018 797
Total. No. of Tenants as at 30 June 2018 720
Tenant Retention Rate from 1 April 2018 to 30 June 2018 73%
High-Quality and Diversified Tenant Base Diversified tenant mix with top 10 tenants representing 41% of portfolio
Top 10 Tenants
# Tenant Country % of Total Headline Rent1
1 Agenzia del Demanio (Italian State Property Office) Italy 16.8%
2 Nationale-Nederlanden Netherlands 7.0%
3 Kamer van Koophandel Netherlands 3.0%
4 Holland Casino2 Netherlands 2.5%
5 Chicago Bridge & Iron Company (CB&I) 3 Netherlands 2.3%
6 Anas Italy 2.1%
7 A. Manzoni & c. S.p.A.4 Italy 2.1%
8 Coolblue BV Netherlands 2.0%
9 LA POSTE (French Post)5 France 1.4%
10 Nilfisk-Advance A/S Denmark 1.4%
40.5%
18.3%
15.5%
9.9%
9.4%7.3%
6.6%
6.5%
5.2%4.3%
4.3%4.2%
8.4%
Public Administration Wholesale - Retail
Manufacturing Financial - Insurance
Professional - Scientific Transportation - Storage
It - Communication Entertainment
Construction Administrative
Real Estate Others 6
Tenant trade sector breakdown by headline rent1
______________________
1. As at 30 June 20182. Nationale Stichting tot Exploitatie van Casinospelen in the Netherlands3. CB&I has exercised its right to hand back 1 floor of 3,295 sqm and 50 parking spaces per December 2018 as well as 1 floor in March 2018 totalling an additional 3,295 sqm4. GEDI Gruppo Editoriale5. LA POSTE replaced “confidential tenant” in top 10 due to LA POSTE new signed lease in 1Q 20186. Others comprise Accommodation / Utility / Education / Rural / Human Health / Mining / Other Service Activities / Residential / Water / Miscellaneous Services

10
Focused on European Office and Light Industrial / Logistics Sectors
Quality offices in major cities in the Netherlands and Italy Central business districts and city fringe locations Diverse tenant base New acquisition of Vodafone Italian HQ is typical of this strategy Market forecast to remain healthy, supported by growing demand
and limited new supply1
Light industrial and urban logistics distribution warehouses in 5 countries— Denmark, France, Germany, Italy, and the Netherlands
Located in industrial parks and / or close to key urban industrial locations
New supply expected to remain limited, driving upwards pressure on rents1
Expected to benefit from improving fundamentals and business sentiment in Europe
1 Based on the Independent European Property Market Research Report in Appendix F of the Prospectus
Italy and Netherlands Office Pan-European Light industrial / LogisticsPiazza Affari, Milan Central Plaza, Rotterdam Parc Des Docks, Paris Bischofscheim, Frankfurt

11
Completed Acquisition of Office Property in Ivrea, Italy
Property Type Office
Purchase Price € 16.90 million
Land Lease Tenure Freehold
Leasable Area 17,990 sqm
Purchase Price per sqm € 939
Occupancy (as at 31 March 2018) 100%
WALE (as at 30 June 2018) 11 years1
No. of Tenants (Key Tenant) 2 (Vodafone Italia S.p.A.)
Gross Rent p.a. € 1.42 million
Net Initial Yield (Gross Rent / Purchase Price) 8.4%
Via Jervis 9, Ivrea, Italy Demonstrates strength of pipeline sourcing capabilities Complements resilient Italian office portfolio and diversify tenant base
with Vodafone as blue-chip tenant Transaction completed on 27 June 2018
1. Vodafone has ability to break lease after 5 years

12
Settlement of Deferred Consideration for Parc Des DocksParc Des Docks, Paris, France Entered into a settlement agreement with respect to the deferred consideration for Parc Des Docks that
resulted in: Lump-sum payment of € 6 million to the sellers, representing 50% savings as compared to the
€ 12 million deferred consideration stated in Prospectus1
Portfolio valuation uplift of € 6 million Reduction in aggregate leverage by 1.0%
______________________
1. The total consideration paid for Parc Des Docks (on an asset basis) is therefore € 98 million, instead of the originally agreedpurchase price of € 104 million and a third party valuation of € 110.2 million as at 31 March 2018
Property Type Light Industrial / Logistics
Purchase Price € 98.00 million 1
Land Lease Tenure Freehold
Leasable Area 73,371 sqm
Purchase Price per sqm € 1,336
Occupancy (as at 30 June 2018) 87.4%
WALE (as at 30 June 2018) 3.0 years
No. of Tenants (Key Tenants) 35 (Leroy Merlin, Locapost, Fedex, UPS, Canon, Alstom)
Gross Rent p.a. € 7.2 million
Net Initial Yield (Gross Rent / Purchase Price) 7.3%

Financial Performance

14
Net Property Income2 (€ ‘000)
Income Available for Distribution2 (€ ‘000)
0.532
0.570
0.500
0.520
0.540
0.560
0.580
IPO Forecast Actual
46,303
47,743
41,500
42,500
43,500
44,500
45,500
46,500
47,500
IPO Forecast Actual
€ ‘000€ ‘000
38,914
40,062
35,000
37,000
39,000
IPO Forecast Actual
7.63%
7.90%
6.50%6.70%6.90%7.10%7.30%7.50%7.70%7.90%
IPO Forecast Actual
€ ‘000
______________________
1. Reporting Period refers to the financial period from 30 November 2017 to 30 June 20182. Actual refers to the actual figures for the Reporting Period3. IPO Forecast refers to the NTA per Unit as at the listing date and actual refers to the NTA per Unit as at 30 June 20184. The actual includes additional the units issuable to the Manager and the Property Manager as at 30 June 2018
NTA per Unit2,3,4 (€)
Annualised Distribution Yield (%)2,4
Key Reporting Period HighlightsExceeded IPO Forecast for all key performance metrics for Reporting Period1

15
Total Return and Distribution Exceed IPO ForecastAll key performance metrics exceed IPO Forecast for the Reporting Period
30-Nov-17 to 31-Mar-18
1-Apr-18 to 30-Jun-18
Total 30-Nov-17 to
30-Jun-18
IPO Forecast30-Nov-17
to 30-Jun-18Variance
Gross Revenue (€’000) 41,033 31,812 72,845 71,287 2.2%
Net Property Income (€’000) 27,004 20,739 47,743 46,303 3.1%
Net Income before tax and fair value changes (€’000) 21,014 16,103 37,117 37,056 0.2%
Total return for the period attributable to Unitholders (€’000) 30,660 18,700 49,360 27,529 79.3%
Income Available for Distribution to Unitholders (€’000) 22,797 17,265 40,062 38,914 3.0%
Gross revenue € 72.8 million since IPO, up 2.2% compared to IPO Forecast € 31.8 million for 2Q 2018, up 3.9% compared to IPO Forecast for the same period
Net property income € 47.7 million since IPO, up 3.1% compared to IPO Forecast € 20.7 million for 2Q 2018, up 3.5% compared to IPO Forecast for the same period
Distributable income € 40.1 million for the Reporting Period, equating to a DPU of 2.53 cents, 3.0% above IPO Forecast for the same period
and an annualised distribution yield of 7.9% (based on the IPO issue price). € 17.3 million for 2Q 2018 equating to DPU of 1.10 cents, 2.2% above the IPO Forecast for the same period

16
18,870 18,568
20,992 22,734
6,4416,441
0
5,000
10,000
15,000
20,000
25,000
30,000
35,000
40,000
45,000
50,000
IPO Forecast Actual
Others
Light Industrual
Office
14,579 14,414
13,988 14,348
10,827 11,987
3,5643,698
3,3453,296
0
5,000
10,000
15,000
20,000
25,000
30,000
35,000
40,000
45,000
50,000
IPO Forecast Actual
Denmark
Germany
France
Italy
Netherlands
Net Property Income Exceeded IPO Forecast by 3.1%1
Net Property income breakdown by asset class€ ‘000
TOTAL: 46,303
TOTAL: 47,743
Net property income breakdown by country€ ‘000
______________________
1. For the Reporting Period2. Others include three government-let campuses, one retail asset and one hotel in Italy on master leases
TOTAL: 46,303
TOTAL: 47,743
Well-diversified portfolio with balanced mix of asset classes
2
13.5%
47.6%
38.9%
6.9%
25.1%
30.2%
30.1%
7.7%
17
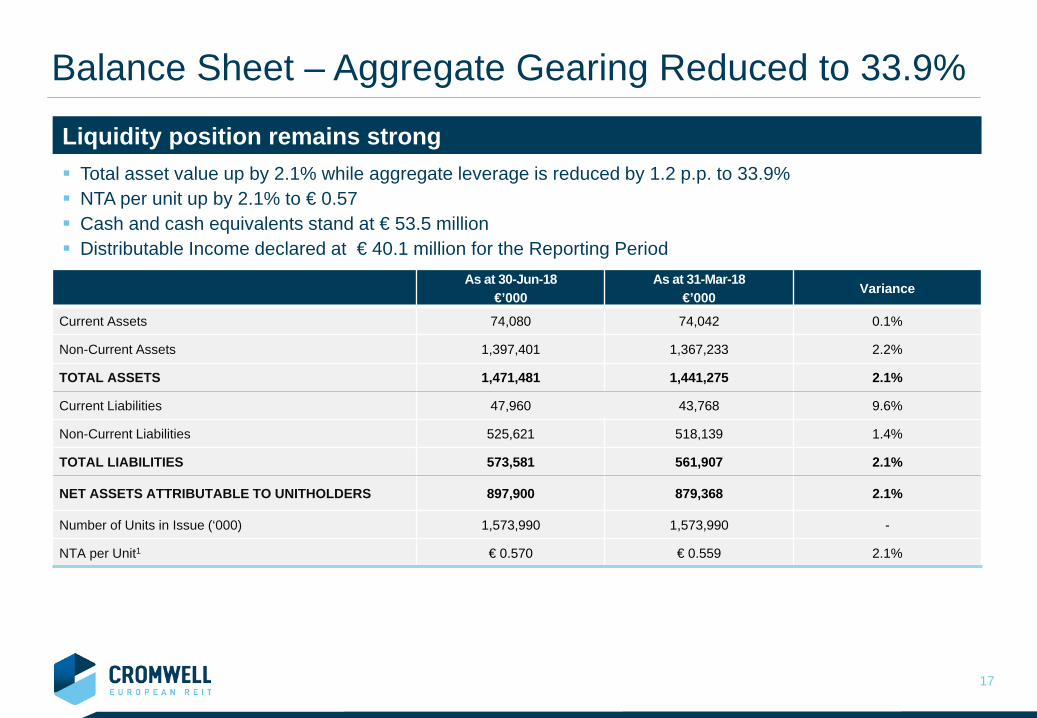
Balance Sheet – Aggregate Gearing Reduced to 33.9%
Liquidity position remains strong
As at 30-Jun-18€’000
As at 31-Mar-18€’000 Variance
Current Assets 74,080 74,042 0.1%
Non-Current Assets 1,397,401 1,367,233 2.2%
TOTAL ASSETS 1,471,481 1,441,275 2.1%
Current Liabilities 47,960 43,768 9.6%
Non-Current Liabilities 525,621 518,139 1.4%
TOTAL LIABILITIES 573,581 561,907 2.1%
NET ASSETS ATTRIBUTABLE TO UNITHOLDERS 897,900 879,368 2.1%
Number of Units in Issue (‘000) 1,573,990 1,573,990 -
NTA per Unit1 € 0.570 € 0.559 2.1%
Total asset value up by 2.1% while aggregate leverage is reduced by 1.2 p.p. to 33.9% NTA per unit up by 2.1% to € 0.57 Cash and cash equivalents stand at € 53.5 million Distributable Income declared at € 40.1 million for the Reporting Period

18
Responsible Capital Management
______________________
1. Refers to “aggregate leverage” defined under the Property Funds Appendix2. Aggregate leverage after deducting distribution (equal to 100% of distributable income at 30 June 2018) from deposited property amount3. Based on annualised 30-Jun 2018 Net Property Income (less PM fee payable in units) and net finance costs (excluding amortisation of debt issuance costs) over the annualised interest as at
30 June 2018. Projected ICR as per IPO based on Projection Year 2018 Net Property Income and net finance costs.
Well-managed debt book delivering low debt cost and significant interest cover
As at 30-Jun-18 As per Prospectus Variance
Total Gross Debt € 498.8 million € 494.4 million + 1.0%
Proportion of Hedged and Fixed Rate Debt 85.4% 85.5% - 10 bps
Aggregate Leverage1 33.9% 36.8% - 290 bps
Aggregate Leverage after Distribution2 34.8% 36.8% - 200 bps
Projected Interest Coverage Ratio (“ICR”) 8.8x3 9.6x3 - 80 bps
Weighted Average Term to Maturity 3.6 years 4.0 years - 0.4 years
Aggregate leverage stands at 33.9%, well below the regulatory requirements of 45%1
Annualised cost of debt (excluding any upfront fees) stands at ~ 1.46% p.a. (as at 30 June 2018) Interest coverage ratio is significant at 8.8x Embedded hedging arrangements allow CEREIT to take full advantage of negative interest rate environment
in the Eurozone, at the same time limiting hedge breakage costs in case of potential debt refinancing

19
Debt Maturity Profile
2842
95 8238
0
50
100
150
200
250
300
2018 2019 2020 2021 2022 2023 2024 2025 2026
€ million
Asset Financing FacilitiesTotal: € 461 million
Unsecured Revolving Credit Facility (Drawn)Total: € 38 million
% ofTotalDebt
8% 57% 19% 16%
Weighted average term to maturity is 3.6 years1
______________________
1. Weighted Average Term to Maturity is 3.1 years incl. the RCF2. Expiring by November 2020 and the potential refinancing of these facilities is part of the ongoing assessment of the future capital (debt) structure of CEREIT
• Italy - € 150.0m• France - € 50.0m• Netherlands - € 57.5m• Denmark - € 26.2m
Pan-European facility including Germany,
France and Netherlands
Fixed-rate loan against three core
assets in the Netherlands
Pan-European debt facilities are well-diversified across lenders and jurisdictions, allowing for full operationalflexibility
Weighted Average Debt Expiry (“WADE”) of 3.61 years as at 30 June 2018 reflects secured debtarrangements in the medium term

Asset Management Update

21
Stable Occupancy and Proactive LeasingPortfolio occupancy stable, moving by 1.0 p.p. to 88.7%1
Better leasing outcomes through “barbell approach” to portfolio management with growth provided by lightindustrial/logistics sector and stability provided by office sector
88.7% occupancy rate as at 30 June 2018, with committed leases spanning over 1 million sqmStable WALE2
5.0-year WALE profile on a total portfolio basis as at 30 June 2018, with Top 10 Tenants also having a 4.9-year WALE profile as at 30 June 2018
De-risking the portfolio 69.7 % of 2018 potential expiries and breaks have been extended
______________________
1. As compared to occupancy of 87.7% as stated in Prospectus. Occupancy was 89.6% as at 31 March 20182. WALE is defined as weighted average lease expiry by headline rent based on the final termination date of the agreement (assuming the tenant does not terminate the lease on any of the permissible break date(s), if
applicable)3. WALB is defined as the weighted average lease break by headline rent based on the earlier of the next permissible break date at the tenant’s election or the expiry of the lease
6.5% 10.1% 8.0% 8.4%
67.0%
11.6% 11.7% 12.0% 10.9%
53.7%
2018 2019 2020 2021 2022 andBeyond
% by WALE % by WALB
69.7% of expiries and breaks have been extended
Lease expiry profile
3
22
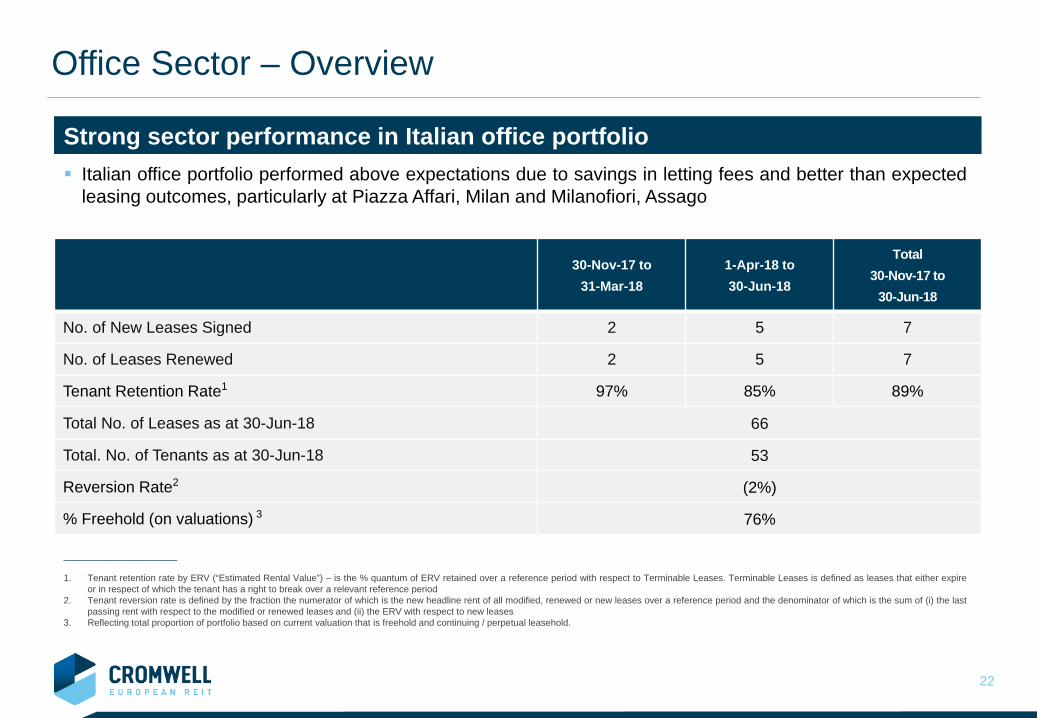
Strong sector performance in Italian office portfolio
Office Sector – Overview
______________________
1. Tenant retention rate by ERV (“Estimated Rental Value”) – is the % quantum of ERV retained over a reference period with respect to Terminable Leases. Terminable Leases is defined as leases that either expireor in respect of which the tenant has a right to break over a relevant reference period
2. Tenant reversion rate is defined by the fraction the numerator of which is the new headline rent of all modified, renewed or new leases over a reference period and the denominator of which is the sum of (i) the lastpassing rent with respect to the modified or renewed leases and (ii) the ERV with respect to new leases
3. Reflecting total proportion of portfolio based on current valuation that is freehold and continuing / perpetual leasehold.
30-Nov-17 to 31-Mar-18
1-Apr-18 to 30-Jun-18
Total 30-Nov-17 to
30-Jun-18
No. of New Leases Signed 2 5 7
No. of Leases Renewed 2 5 7
Tenant Retention Rate1 97% 85% 89%
Total No. of Leases as at 30-Jun-18 66
Total. No. of Tenants as at 30-Jun-18 53
Reversion Rate2 (2%)
% Freehold (on valuations) 3 76%
Italian office portfolio performed above expectations due to savings in letting fees and better than expectedleasing outcomes, particularly at Piazza Affari, Milan and Milanofiori, Assago

23
Occupancy WALE WALB2
31-Mar-18 30-Jun-18 Variance 31-Mar-18 30-Jun-18 Variance 31-Mar-18 30-Jun-18 Variance
Italy 97.2% 98.3% 1.1 p.p. 5.3 years 5.7 years 0.4 years 5.2 years 5.1 years (0.1) years
Netherlands 95.7% 94.3% (1.4) p.p. 6.4 years 6.3 years (0.2) years 6.4 years 6.3 years (0.2) years
TOTAL 96.3% 96.1% (0.2) p.p. 6.0 years 6.0 years 0.0 years 5.9 years 5.8 years (0.1) years
Office Sector – Occupancy and Leases
Lease Expiry Profile
______________________
1. The remaining 15% being the CB&I surrender above2. The area of the units on which a rental guarantee is in place is considered as let
Key focus on Haagse Poort, The Hague where CB&I exercised its right to surrender 3,295 sqm on 31 March2018 and a further 3,295 sqm on 31 December 2018. On-going discussions with Nationale-Nederlanden forexpansion plans
82% of the 6.4% office rent at risk in 2018, has been de-risked1
6.4% 0.2% 8.5% 11.9%
73.1%
6.4% 0.2% 9.1% 12.9%
71.4%
2018 2019 2020 2021 2022 andBeyond
% by WALE % by WALB
Strong sector performance in Italian office portfolio
82% of expiries and breaks have been extended

24
Office Sector – Leasing & Asset Enhancement InitiativesNetherlands Central Plaza, Rotterdam: Coolblue signed a new lease for existing 9,796
sqm at a headline rent of approximately € 2 million from 1 January 2019 for 7.5 years
Haagse Poort, The Hague: Upgrade of climate control to commence in July 2018 with completion in June 2019 at a total cost of € 6.1 million over the period
Haagse Poort, The Hague: Major tenant Nationale-Nederlanden renewed more than 2,700 sqm and additionally expanded with a new lease of more than 1,600 sqm at a total headline rent of approximately € 650,000 till 31 January 2020
Italy Piazza Affari, Milan: Fit-out works for the CBRE Italy head office completed
in April 2018 with the tenant announcing publicly their satisfaction with the works1
Piazza Affari, Milan: Existing tenant has expanded into the remaining vacant mezzanine floor (approximately 850 sqm), signifying the full occupancy of the building and the commitment of the tenant long term to the asset and its location
Milanofiori, Assago: Refurbishment works across the vacancy (c. 1100 sqm) on track with an expected completion in 3Q 2018
Via Jervis 9, Ivrea: Post the acquisition on 27 June 2018, the area where the asset is located has been designated as an UNESCO heritage area, further solidifying the attractiveness of the site over the long term
No. of Assets
Net Lettable Area Valuation Reversionary
Yield
Italy 9 102,550 sqm € 265,650,000 5.0%
Netherlands 5 123,990 sqm € 395,550,000 4.7%
TOTAL 14 226,540 sqm € 661,200,000 4.9%
Overview as at 30-Jun-18
______________________
1. As per CBRE press release dated 29th of May 2018

25
30-Nov-17 to 31-Mar-18
1-Apr-18 to 30-Jun-18
Total 30-Nov-17 to
30-Jun-18
No. of New Leases Signed 26 36 62
No. of Leases Renewed 13 27 40
Tenant Retention Rate1 39% 53% 47%
Total No. of Leases as at 30-Jun-18 720
Total. No. of Tenants as at 30-Jun-18 662
Reversion Rate2 1%
% Freehold (on valuations) 3 99%
Light industrial portfolios in France and the Netherlands outperform
Light Industrial / Logistics Sector – Overview
______________________
1. Tenant retention rate by Estimated Rental Value (“ERV”) – is the % quantum of ERV retained over a reference period with respect to Terminable Leases. Terminable Leases is defined as leases that either expire or inrespect of which the tenant has a right to break over a relevant reference period
2. Tenant reversion rate is defined by the fraction the numerator of which is the new headline rent of all modified, renewed or new leases over a reference period and the denominator of which is the sum of (i) the lastpassing rent with respect to the modified or renewed leases and (ii) the ERV with respect to new leases
3. Reflect total proportion of portfolio based on current valuation that is freehold and continuing / perpetual leasehold
France and the Netherlands light industrial portfolios delivered 2Q 2018 NPI performance of 7.4% above IPOForecast, with positive leasing activity resulting in an increase in occupancy of 0.8 p.p. and 1.3 p.p.,respectively

26
8.7%21.5%
10.0% 8.2%
51.6%
19.7% 25.2% 18.1% 12.6%24.4%
2018 2019 2020 2021 2022 andBeyond% by WALE % by WALB
Light Industrial / Logistics Sector – Occupancies and Leases
Occupancy WALE WALB
31-Mar-18 30-Jun-18 Variance 31-Mar-18 30-Jun-18 Variance 31-Mar-18 30-Jun-18 Variance
Denmark 76.1% 73.6% (2.5) p.p. 2.4 years 2.4 years - 2.2 years 2.1 years (0.1) years
France 85.5% 86.3% 0.8 p.p. 5.0 years 4.8 years (0.2) years 1.9 years 1.8 years (0.1) years
Germany 87.4% 80.7% (6.7) p.p. 5.1 years 5.4 years 0.3 years 4.8 years 5.1 years 0.3 years
Italy 100.0% 100.0% - 4.4 years 4.1 years (0.3) years 4.4 years 4.1 years (0.3) years
Netherlands 92.0% 93.3% 1.3 p.p. 2.7 years 2.6 years (0.1) years 2.7 years 2.6 years (0.1) years
TOTAL 85.3% 83.8% (1.5) p.p. 4.3 years 4.2 years (0.1) years 2.6 years 2.5 years (0.1) years
Lease Expiry Profile
Light industrial portfolio in France benefited from better-than-expected leasing outcomes and successfulleasing and tenant retention efforts
Expected departure of tenant in Germany led to significant drop in occupancy in the German portfolio 66% of 19.7% light industrial/logistic rent at risk in 2018 have been extended as at 30 June 2018
Light industrial portfolio in France outperforms
66% of expiries and breaks have been extended

27
Light Industrial / Logistics Properties Sector
No. of Assets
Net Lettable Area Valuation Reversionary
Yield
Denmark 13 151,483 sqm € 81,402,000 7.6%
France 21 332,811 sqm € 313,650,000 7.3%
Germany 11 166,458 sqm € 107,800,000 6.4%
Italy 1 29,638 sqm € 12,300,000 6.8%
Netherlands 10 82,314 sqm € 74,000,000 6.4%
TOTAL 56 762,703 sqm € 589,152,000 7.0%
Overview as at 30-Jun-18
France Parc du Bois du Tambour, Nancy Gondreville: enhancement works related to a
new major lease of c. € 1.5 million are continuing with an expected completion in 3Q 2018
A land tax review has been conducted which resulted in tax refund of land tax of € 318,000
Germany Gewerbepark Duisburg, Duisburg: enhancement works related to a new major
lease of c. € 1.0 million are continuing with an expected completion in 3Q 2018
Energy cost saving initiatives have been implemented at Gewerbepark Hamburg–Billstedt, Hamburg and Gewerbepark Duisburg, Duisburg: new LED lightening was installed, with the aim to save up to 35% of energy costs related to lighting. At Gewerbepark Hamburg-Billbrook Park, Hamburg and Gewerbe-und Logistikpark Stuttgart-Frickenhausen, Frickenhausen: more sustainable heating system components have been installed with the aim to reduce energy costs for tenants and also non recoverable costs
Denmark C.F. Tietgensvej, Kolding: signed a new lease for approximately 1,190 sqm at a
headline rent of approximately € 50,000 for 2.5 years
Naverland 7-11, Glostrup: existing lease renewed for five years across 940 sqm
Naverland 7-11, Glostrup: Heads of Terms agreed to renew and expand into previously vacant areas with a major tenant until 31 December 2022
Leasing & Asset Enhancement Initiatives
28
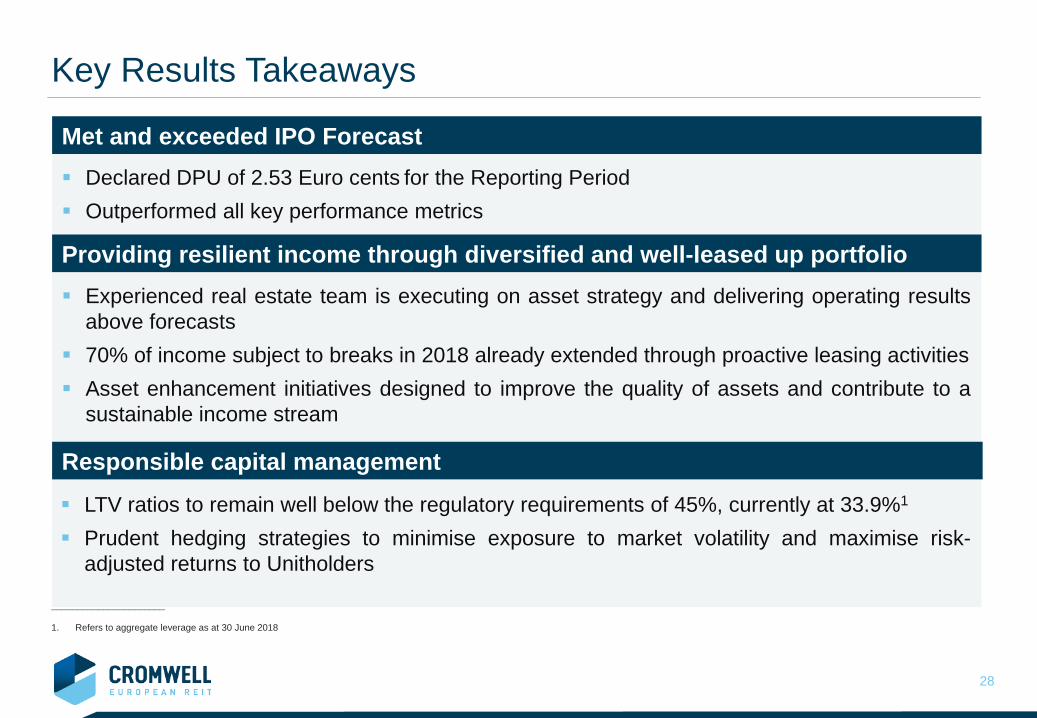
Key Results Takeaways
Experienced real estate team is executing on asset strategy and delivering operating resultsabove forecasts
70% of income subject to breaks in 2018 already extended through proactive leasing activities Asset enhancement initiatives designed to improve the quality of assets and contribute to a
sustainable income stream
______________________
1. Refers to aggregate leverage as at 30 June 2018
Met and exceeded IPO Forecast Declared DPU of 2.53 Euro cents for the Reporting Period Outperformed all key performance metrics
Providing resilient income through diversified and well-leased up portfolio
Responsible capital management LTV ratios to remain well below the regulatory requirements of 45%, currently at 33.9%1
Prudent hedging strategies to minimise exposure to market volatility and maximise risk-adjusted returns to Unitholders

29
Key Management Priorities for the Year Ahead
Active engagement with investors to further promote CEREIT’s performance Organic growth of the IPO Portfolio Inflation-linked leases provide built-in rental-growth mechanism Active leasing and asset enhancements to further improve portfolio occupancy
Increase occupancy in the IPO Portfolio Decrease of non-recoverables Increase of net property income margin
Inorganic growth for the future Deep pool of acquisition opportunities including those accessed through the Sponsor’s
extensive pan-European platform
Providing clear visibility for investors to our path to growth
Delivering on IPO Forecast through effective business strategy execution Meeting and exceeding IPO Forecast Unlocking asset value through proactive approach to acquisitions and divestments

30
Experienced Leadership TeamCromwell European REIT Board of Directors
Paul WeightmanNon-Independent
Non-Executive Director
Christian DelaireIndependent Non-Executive Director
Simon GaringNon-Independent Executive Director
Lim Swe Guan Chairman and
Independent Non-Executive Director
Fang Ai LianIndependent Non-Executive Director
Senior Management Team
Elena ArabadjievaChief Operating
Officer and Head of Investor Relations
Thierry LeleuChief Investment
Officer
Simon GaringChief Executive
Officer
Christina ThamHead of Legal,
Compliance and Corporate Secretariat
Daniel DonnerChief Financial
Officer

CEREIT’s Sponsor Strength

32
380+ people
15countries
30offices
€7.3bnAUM
320+ properties
3,800+tenants
Diverse Product Range Extensive and Broad Skill SetTrack Record of Successful Partnerships
Global Platform, Local Expertise
AUM by Geography4.0m sqm
54.4%
18.1%
12.6%
5.7%9.2% Office
Retail
Industrial /LogisticsPropertySecuritiesOther
Cromwell is a real estate investor and manager operating on three continents with a global investor base
53.1%41.0%
5.9%
EuropeAustraliaNZ
AUM by Sector

33
European Platform and Capability Unique platform of 20 regional offices providing on the ground local market knowledge and expertise
260+properties
3,100+tenants
€3.9 billion AUM^
^ excluding investment capacity. Figures as of 30 June 2018.
200+people
12countries
20offices
CredentialsTrack record of providing holistic asset management, development, corporate restructuring and equity capital investment solutions.
Diverse client base of global investors including sovereign wealth funds, pension funds, insurance companies, private equity and multi managers.
SpecialistsFocused on European Core+ and Value Add commercial real estate.
Partners

34
Cromwell property group – European platform
Track record of building strong working relationships with individual equity partners.
Strong Capital Partnerships Diverse Debt Relationships
Unique knowledge, broad debt capital markets relationships and European
platform enable us to arrange and execute the most complex financing transactions.
€1.40 billion of lending from domestic and international lenders across a variety of currencies and European jurisdictions.
Successful financings and re-financings totaling €1.40+ billion
over the last 24 months.
Diverse global capital partner base including sovereign wealth funds, pension funds, insurance companies, private equity and multi managers, high net worth individuals
Single country/sector or diversified portfolio strategies in single mandates, JVs and club deals.
Partners

Urbanisation
As urbanisation increases, real estate will need to meet additional demand for working and living in cities
TechnologyTechnology is changing the real estate landscape by improving production inefficiencies, reducing labour costs andmaximising income
DemographicsChanging consumer behaviour, supply chains should deliver on the omni-channel offering to consumers
Sustainability is increasingly influencing occupier demand, asset management strategies and investors appetite for real estate
Sustainability
Country level macro economic, political and real estate analysis
First cut of city selection
Target citiesranked
Comprehensive in-depth desktop appraisal: 200+ criteria
In-house local, on-the-ground market appraisal
Sector-level analysis & asset selection
Detailed and continuous research process• Target cities in each sector
identified for investment opportunity sourcing
• Process combines statistical and economic analysis, taking into account macro-trends and themes as well as geopolitical risks
• Top-down findings combined with bottom-up on-the-ground experience and expertise of local teams
Macro Trends
• Investment strategies are increasingly overlapping as investment returns continue to compress
• A thorough understanding of macro and local market dynamics, capital risk/return appetite, as well as occupier trends and requirements are all essential in formulating and implementing a successful strategy
Research Backed Investment Strategies
E-Commerce
Changes in demographics will drive demand and influence the type, functionality andlocation of assets
Rigorous selection process to ensure investments are focused on the right cities, sectors and trends
35

Cromwell has been reporting in accordance with the Global Report Initiative sustainability guidelines since 2009
Benchmarks property performance against Global Real Estate Sustainability Framework
Targeting inclusion into the Dow Jones Sustainability index
In 2016 Cromwell launched its global sustainability framework to introduce common benchmarks and consistent disclosure
Partnered with Qantas in 2017 to offset emissions resulting from corporate air travel globally
Appointed Chief Sustainability Officer in 2018, with a direct reporting line to Group CEO
Sponsor and Manager Dedicated to SustainabilityCromwell is committed to acting responsibly and proactively, to understand, measure, manage and communicate the impacts of our activities

Appendix

38
Portfolio Overview – The NetherlandsOccupancy %
(as at 30 June 2018) NPI1 (€ million) Last Valuation (as at 31 March 2018)
Weighted Reversionary Yield(as at 31 March 2018)
Number of Leases (as at 30 June 2018)
93.9% 14.4 469.6 5.0% 241

39
Indicator 2018 2019 2020 Outlook (vs
2019)GDP 2.6% 1.5% ↘
Industrial Production 3.1% 1.3% →
Consumer Prices, average 1.7% 1.7% ↗
Population (000s) 17,249 17,343 →
Population 0.6% 0.5% →
Unemployment Rate 4.8% 4.8% ↗
Annual % change unless specified
Netherlands – Office Market OutlookReal Estate Market Investment Volumes
GDP growth of 2.6% in 2018 linked to supportive fiscal policies – the Rutte III agreement will see the government invest more on infrastructure, education, defence and social security. PMI edged down as employment
growth softened, but remains very high at 60.1 and the pace of new order growth picked up. A question mark remains around sentiment linked to rising trade tensions.With unemployment at 4.8%, the
increasingly tight labour market should support further wage growth.
Available supply is falling sharply as active requirements translate into take-up and against low levels of completions the vacancy has fallen and is now at 12.1% nationwide – this does include some structural vacancy that still needs to be worked through. The decline in quality space is hindering higher levels of take-up with 1Q 2018 reporting a 34% drop in volumes compared to 1Q 2017, although take-up for 1H hit 767,500 sqm nationwide. The scarcity of supply is more prevalent in the larger cities of Amsterdam, Utrecht and
Eindhoven, and so companies with larger requirements, in particular, are encountering difficulties in finding suitable relocation options and so demand, to some extent, is being redirected to locations that can offer larger floorplates such as Amstelveen, Hoofddorp and Amersfoort. The situation in The Hague and Rotterdam is a little different, here the city centres specifically
are suffering from limited supply and for now there is more space available in the peripheral areas. However, as existing companies activate expansion plans vacancy will fall and rents will come under upward pressure with positive increases expected to materialise as a result. 1H saw € 3.08 billion invested into the Dutch office sector - of note was the € 616 million single
asset deal whereby Highbrook Investors acquired ‘The Various’ building. While the G5 markets continue to be popular and in 2017 accounted for 76% of deals, in 1Q 2018 this fell to 42% as product dries up in the better locations in the larger cities interest increases in alternative locations. Yields appeared to have stabilised over the last quarter but have tightened over the last 12 months.
Economic growth is supporting the expansion of small and medium sized firms who are looking for additional office space. Energy-efficient buildings are likely to fare better and tenants are coming round to the realisation that they will need to pay a premium for it, and are prepared to do so. Demand from occupiers looking to take additional space, particularly in Amsterdam,
Utrecht and Eindhoven, is being met by a dearth of quality space. As the market progressively becomes more landlord led, this is providing the right environment to support positive rental growth.With approximately 4 million sqm of office space removed and reconverted into
alternative uses there is a healthier balance between supply and demand. However, the balance has the potential to shift with more conversion projects planned and more restrictive government policies being rolled out. The effect should be that structural vacancy declines as well as the overall level. The shift in geographical allocation by investors to secondary cities such as Arnhem,
Breda, Den Bosch and Zwolle is expected to continue as, with more products available, they are viable investor alternatives. Secondary (fringe, Grade A) areas where yields are 5.00% and prime major provincial
towns (5.75%) still hold a premium over the prime CBD areas of key cities where yields are 3.75%.
Sources: Oxford Economics - Country Economic Forecast Netherlands 12 July 2018
CBRE – Netherlands Office Market Report 2Q 2018Colliers – Sector Update May 2018
Savills – Netherlands Market In Minutes June 2018
0
5,000
10,000
15,000
20,000
25,000Netherlands Investment Volumes (€ million)
OtherHotelIndustrialRetailOffice
OutlookEconomy

40
Netherlands – Logistics/Industrial Market Outlook
Economy
Real Estate Demand for logistics space across the Netherlands is robust with 1H seeing take-up of
915,300 sqm. Activity stems largely from the strong expansion of e-commerce and retailers looking to restructure their supply chains in preparation for the anticipated further growth, positioning themselves as truly omni-channel platforms to serve customers. In 2017, e-commerce in the Netherlands accounted for 9.7% of the total retail industry – almost twice as much as it was five years ago.
Tilburg, Venlo and Eindhoven, primary logistics hotspots, are suffering from a limited number of available plots for development and, with rising demand fast outweighing supply, the municipalities are giving consideration as to releasing further development options. Secondary logistics hubs are still seeing some speculative construction starts but as demand spills over this will change going forward.
While economic growth is evident, and there is on the whole, a well-performing industrial sector, declines in the volume of occupier activity were noted and higher levels of take-up are simply being hindered by the lack of suitable space. This is supporting the built-to-suit route to market as a way of accessing suitable units.
Trading volumes of € 978 million in 1H 2018 and despite historic lows in terms of yields there appears to be a healthy balance between quality and current pricing to attract buyers. Moreover, the Dutch industrial sector is an attractive proposition for both domestic and international capital supported by a stable political environment, good infrastructure and a favourable tax framework.
The nationwide vacancy rate is 3.8% and the limited supply of quality stock has been pushing up prime rents in hub logistics locations. However, while there is a lack of space meeting demand levels, both construction costs and land costs are rising and with more space coming to the market, developers must be careful not to price themselves out of the market as there is rising competition and interest to invest in new constructions.
At the moment demand is largely focused on XL warehouses, but over time this is expected to shift towards city distribution centres. An increase in building on active demand is also anticipated.
A notable shift in the investment market is the continued rise in cross-border capital -international money is and has been dominant in the Dutch real estate market, but the allocation is undergoing a shift. In 1Q 2018 87% of the industrial trading volume involved foreign capital, up from 80% in 2017 and 75% in 2016.
With the supply of product drying up and not yet being counterbalanced by new completions, yields for both distribution units and industrial estates have been under pressure for some time now although the rate of tightening has slowed. Alongside this, investors’ focus are likely to increasingly shift to core+ investment opportunities.
0
5,000
10,000
15,000
20,000
25,000Netherlands Investment Volumes (€ million)
OtherHotelIndustrialRetailOffice
GDP growth of 2.6% in 2018 linked to supportive fiscal policies – the Rutte III agreement will see the government invest more on infrastructure, education, defence and social security.
PMI edged down as employment growth softened, but remains very high at 60.1 and the pace of new order growth picked up. A question mark remains around sentiment linked to rising trade tensions.
With unemployment at 4.8%, the increasingly tight labour market should support further wage growth.
Indicator 2018 2019 2020 Outlook (vs
2019)GDP 2.6% 1.5% ↘
Industrial Production 3.1% 1.3% →
Consumer Prices, average 1.7% 1.7% ↗
Population (000s) 17,249 17,343 →
Population 0.6% 0.5% →
Unemployment Rate 4.8% 4.8% ↗
Annual % change unless specified
Sources: Oxford Economics - Country Economic Forecast Netherlands 12 July 2018
Colliers – Sector Update May 2018Savills – Netherlands Market In Minutes June 2018
Real Estate Market
Outlook

41
Portfolio Overview – ItalyOccupancy %
(as at 30 June 2018) NPI1 (€ million) Last Valuation1
(as at 31 March 2018)Weighted Reversionary Yield
(as at 31 March 2018)Number of Leases
(as at 30 June 2018)
99.4% 14.3 418.0 5.5% 40
1. Valuation for Ivrea conducted as at 1 April 2018

42
Italy – Office Market OutlookReal Estate Market Investment Volumes
Outlook Three months after the elections,
Lega and Five Star have formed a government - it remains to be seen how much of the coalition deal the new government will be able to implement and this is dampening growth prospects. Concerns remain around whether Italy has the fiscal capacity to honour all the spending pledges. The economy expanded by 0.3% in
1Q buoyed by positive new from the labour market but, job creation will ease back in the coming quarters as any recovery in the economy will be slow and uneven.
Indicator 2018 20192020
Outlook (vs 2019)
GDP 1.3% 1.3% ↘
Industrial Production 2.1% 1.4% ↘Consumer Prices, average 1.3% 1.7% →
Population (000s) 60,544 60,520 ↘
Population -0.4% -0.4% ↘
Unemployment Rate 10.8% 10.5% →
Annual % change unless specified
The first six months of 2018 has seen €1.17 billion flow into the Italian office sector. Milan remains the most liquid market with investors, both domestic and international, targeting the city. This is reflected in the 64% of 2Q office deals that took place in the city. Rome is attracting more interest but lags Milan, accounting for 26% of 2Q trading volumes. International investors are key to market activity and linked to 60% of capital invested with
French, US and Korean investors particularly active in 2Q. However, while deals are clearly closing the average lot size has shrunk from a reported € 74 million in 2017 to € 40 million in 2018. Occupier activity, which was markedly up in both Milan and Rome in 2Q, is helping to erode
availability. Take-up in Milan in 2Q was 125,000 sqm with the semi centre submarket the most active while in Rome recorded 64,000 sqm of take-up with a clear focus on the Centre and EUR submarkets. While vacancy is at 11.2% in Milan, the amount of Grade A is low where vacancy is reportedly
sub 4%. The situation is similar in Rome where overall vacancy is 12.5% with a proportion structural. For now, the tight supply of quality space is supporting the rental levels of € 585/sqm/year in Milan and € 440/sqm/year in Rome for prime space. Political instability seems not to have deterred investors for the time being but a heightened
level of caution is notable. More positively while the banking sector need to be continuously assessed, and bank balance sheets are weighed down by €160 billion of bad debt, it is at its lowest level in 4 years.
Despite recent growth in rental levels, reasonably strong demand levels and low amounts of Grade A space, there is limited room for further positive rental uplifts as the occupiers are using the perceived fragility of the government and weakened business sentiment to negotiate lower rent level and/or incentive packages. Developers need to heed the future market environment so as not to overload the market with
surplus stock. Milan, for example, with a development pipeline of over 300,000 sqm due to complete between now and the end of 2020, could easily see vacancy rise if construction continues apace and pre-lets are not secured. Geographically, Milan will retain its position as the most popular market for both leasing and
investment activity offering a diversity of tenants and a level of security that is not available in any other Italian city. Rome will continue to hold a solid second place. Activity in second-tier markets will need be assessed asset by asset and income streams will be king because the time needed to lease up any voids is expected to lengthen. However, opportunities exist from a value-add perspective for those investors willing to move up the risk curve. Prime yields have come under pressure but are expected to stabilise during the second half of
the year at the current levels of 3.60% in Milan 3.60% and 4.00% in Rome for prime product.
Sources: Oxford Economics – Country Economic Forecast Italy 13 July 2018
JLL – Pulse Italy 2Q 2018 Capital MarketsJLL – City Profile 2Q 2018 Milan & City Profile 2Q 2018 Rome
0
2,000
4,000
6,000
8,000
10,000
12,000Italy Investment Volumes (€ million)
OtherHotelIndustrialRetailOffice
Economy

43
Portfolio Overview – FranceOccupancy %
(as at 30 June 2018) NPI € million Last Valuation (as at 31 March 2018)
Weighted Reversionary Yield(as at 31 March 2018)
Number of Leases(as at 30 June 2018)
86.3% 12.0 313.7 7.3% 342
44
Occupier activity reached With 1H 2018 occupier activity reaching 1.36 million sqm, a 15% increase y-o-y, the office sector is off to its best start since 2007. In terms of trading volumes, following a flurry of activity at the end of 2017, 1Q was more measured with € 3.3 billion exchanging hands, although this did include some delayed deals rolled over from 2017. Activity picked up in 2Q with € 7 billion trading after the traditionally clam start to the year.While some large deals were reported in the regional cities, Paris dominates activity
capturing more than 50% of overall trading volumes. The office sector is the most sought after with a 75% share in 1H 2018. Refurbishment projects are proving popular too. The sheer volume of capital targeting core is outweighing available product, compressing
prime yields to historic lows. Investors with a typical 4-5 hold, who are not able to match the pricing of core investors but still seek minimised risk profiles will face challenges accessing product at the ‘right’ price and will need to look for alternatives. Robust demand and insufficient supply of quality, well-located assets have seen prime yields
in key regional cities at historic lows. However, they still offer a premium over the majority of Parisian submarkets. Investors chasing yield will therefore need to look to alternative locations and/or product. The dynamism of the rental market, the quality of the assets involved – core assets in central
areas or mixed-use projects to be developed – and the increasing trend of occupiers to favour the east of the capital, enabled investors to anticipate solid rental increases, supporting their decisions to expand their strategy outside of traditional business districts.
At 5.7%, vacancy is at its lowest since 2009 - the scarcity of immediately available new supply has spurred on pre-let deals which continue to gain momentum. While this is particularly the case in Greater Paris, it has also been noted in key regional cities where speculative development has often lagged. Of the 2.4 million sqm currently under construction in Greater Paris and due for completion
between now and 2021, only 49% is available and with a number of large deals due to complete soon. This will further absorb any overhang of supply and no dramatic movements in the overall vacancy rate are anticipated. There is room for further rental growth. Incentive packages have already seen a gradual
withdrawal and while this will be more intensified in central areas of key cities where supply typically dries up first, more peripheral markets and submarkets of key cities should not be overlooked as occupiers balance cost and efficiency. There are (re) development opportunities in peripheral areas and second-hand properties
as currently occupier requirements are not being met but those that upgrade will be able to leverage rental growth. The impact of technology should not be overlooked as new ways of working impacting the physical space and companies need to be agile and flexible to embrace employee demands.
France – Office Market OutlookReal Estate Market Investment Volumes
Outlook GDP slowed to 0.2% in 1Q in part
reflecting seasonal factors such as the cold weather.
Business sentiment and industrial production have been dented by the impact of US tariffs on steel and aluminium, and the potential for a wider trade war with the US.
Solid employment - 300,000 new jobs created in 2017 - saw unemployment drop in 1Q. Employers are beginning to report skill shortages as a factor limiting output.
Labour market improvements have not yet led to upward pressure on wages – wage growth of 1.7% y/y.
Indicator 2018 20192020
Outlook (vs 2019)
GDP 1.7% 1.6% →
Industrial Production 0.9% 1.4% →Consumer Prices, average 1.9% 1.6% →
Population (000s) 67,399 67,664 →
Population 0.4% 0.4% →
Unemployment Rate 8.5% 8.0% ↘
Annual % change unless specified
0
5,000
10,000
15,000
20,000
25,000
30,000France Investment Volumes (€ million)
OtherHotelIndustrialRetailOffice
Sources: Oxford Economics – Country Economic Forecast France 19 June 2018
Knight Frank – Ile-de-France Office Property Market 2Q 2018CBRE – France Investment, 2Q 2018
Economy

45
In-house logistics of large food retailers continue to play a leading role, confirming the trend seen in recent years. The share of large turn-key schemes has increased the take-up level of new property and explains the rise in take-up outside the four main logistics hubs of the North-South logistics backbone. With the national vacancy rate around 5.7%, there is strained supply in certain markets.
There is also restricted land supply in the Greater Paris region partly linked to major infrastructure projects such as the Grand Paris project and the 2024 Olympics. All this has led to some rental increases in the more sought-after logistics zones, and have also contributed to maintaining rents in secondary locations. Incentives are slowly being withdrawn – particularly for quality space. The continued rise of e-commerce is supporting the strong development potential for urban
logistics (2,000 sqm – 5,000 sqm) located around main consumers hubs. With inadequate supply, tenants are often forced to target second-hand obsolescent units. The segment is however, attracting new players given the land’s potential value in the medium to long-term and the strategic suburban location of these sites. Logistics supply (re) configuration has increased as retailer competition intensifies and
beyond redefining their range of services retailers must continue to embrace an omni-channel approach. Standard warehouses are adapting to serve ever more demanding consumers and adapting to automated processes for example.
France – Logistics/Industrial Market Outlook
Economy
Investment Volumes
0
5,000
10,000
15,000
20,000
25,000
30,000France Investment Volumes (€ million)
OtherHotelIndustrialRetailOffice
2017 broke records – occupier activity reached 4.1 million sqm across France – a level not seen before. Fundamentals are strong but 1Q 2018 saw a notable slow down due to a fall in large-scale deals despite a number being signed including LAPEYRE taking a 75,000 sqm warehouse construction project in Mer near Orléans and ITM (Intermarché) signing for 55,000 sqm in Neuilliac.
Specialised retailers and online pure players drove the market of XXL deals (+50,000 sqm), which accounted for 30% of all deals in 2017. Improved productivity and cost reductions have increased the appeal of XXL developments for mass-market retailers and other occupiers – key XXL deals in 2017 included 180,000 sqm for Conforama (Tournan-en-Brie) and 140,000 sqm for Amazon (Brétigny-sur-Orge) in the Greater Paris region.
Trading volumes reached € 225 million in 1Q 2018. Pressure is still high for core assets with newcomers intensifying the competition. Strong investment demand is facing very limited opportunities for core and core+ assets - a new benchmark yield is expected in the Ile-de-France region but several regional markets are already at historic lows.
The sheer volume of capital targeting core is outweighing available product, compressing prime yields to historic lows, evidenced by the continued compression (25 bps) of prime distribution yields to 4.50% over 2Q 2018. Solus and park yields were stable in 2Q at 5.75% but have also been on a downward trajectory over the last twelve months.
GDP slowed to 0.2% in 1Q in part reflecting seasonal factors such as the cold weather.
Business sentiment and industrial production have been dented by the impact of US tariffs on steel and aluminium, and the potential for a wider trade war with the US.
Solid employment - 300,000 new jobs created in 2017 - saw unemployment drop in 1Q. Employers are beginning to report skill shortages as a factor limiting output.
Labour market improvements have not yet led to upward pressure on wages – wage growth of 1.7% y/y.
Indicator 2018 20192020
Outlook (vs 2019)
GDP 1.7% 1.6% →
Industrial Production 0.9% 1.4% →Consumer Prices, average 1.9% 1.6% →
Population (000s) 67,399 67,664 →
Population 0.4% 0.4% →
Unemployment Rate 8.5% 8.0% ↘
Annual % change unless specified
Sources: Oxford Economics – Country Economic Forecast France 19 June 2018
Knight Frank – France Logistics Report 1H 2018CBRE – France Logistics, 1Q 2018
Real Estate Market
Overview

46
Portfolio Overview – GermanyOccupancy %
(as at 30 June 2018) NPI1 (€ million) Last Valuation (as at 31 March 2018)
Weighted Reversionary Yield(as at 31 March 2018)
Number of Leases (as at 30 June 2018)
80.7% 3.7 107.8 6.4% 55

47
Demand for office space is strong (take-up of 1.83 million sqm in 1H 2018 across the top 7 markets) but a lack of availability is becoming ever more apparent and restricting occupier movements. First mover advantage in the majority of key cities has expired, with companies looking to move and/or expand thwarted due to the lack of space and this has never been more evident than for top quality space. So, while overall take-up figures may show a fall, the reality is that lease renewals are an increasingly important element of the market as some companies have no choice but to stay put.With a legacy of relatively low speculative construction, buildings removed from stock and
converted into alternative uses, plus rising employment levels, vacancy has been declining nationwide and this is providing room for rental growth as the supply:demand imbalance intensifies. Renovation work has been started in many empty office buildings as developers try to ride the wave of demand. However, the construction industry has reached full capacity utilisation so progress will be slow and new space is commanding higher rents. A notable pick-up has been in the development of flexible office space with rising number of requirements from such operators. Current momentum should continue with 2018 volumes reaching € 55 billion. Long-term
investors will focus on rental growth, seemingly undeterred by the current tight pricing and weaker financing conditions. Geographically, the Big 7 cities continue to dominate showing a firm commitment of investors to risk aversion in terms of the potential for resale after the expiration of planned hold periods. More attractive returns can be found in the second- and even third-tier markets and those higher up the risk curve will be rewarded.
Germany – Office Market Outlook Investment Volumes
OutlookIndicator 2018 2019 2020
Outlook (vs 2019)
GDP 1.9% 1.7% ↘
Industrial Production 2.5% 2.0% ↘
Consumer Prices, average
2.0% 1.9% →
Population (000s) 83,042 83,263 ↗
Population 0.4% 0.3% ↗
Unemployment Rate 5.2% 4.9% →
Annual % change unless specified
0
10,000
20,000
30,000
40,000
50,000
60,000
70,000German Investment Volumes (€ million)
OtherHotelIndustrialRetailOffice
2017 was a stellar year for German real estate with € 57.5 billion traded - the best performing year since 2007. Offices were the most-targeted asset class with € 6.8 billion invested into the sector in 1Q 2018, almost € 1.3 billion more than in 1Q 2017. The Top 7 cities across Germany recorded the majority of activity (nearly 90%) while volumes declined in regional and B locations due to the lack of large-scale nationwide portfolios.
While domestic capital dominated activity in 1Q, international investors accounted for almost 40% (just under € 2.7 billion) which was skewed to the ‘safer-haven’ markets of Germany’s top locations. Despite the weight of capital looking for a home in German real estate and the lack of product coming to the market, yields held firm in 1Q 2018 but have declined over the past twelve months to historic lows in the majority of locations.
At the end of 1Q a mere 3,4 million sqm was available at short notice across the Top 5 cities with the most sought-after office markets, experiencing an acute shortage of modern office space with vacancy rates down to 3.4% in Munich and 2.2% in Berlin. The aggregated vacancy rate in the Top 5 declined to 4.6% at the end of March from 5.4% a year earlier.
Completions remained at a low level with approximately 129,500 sqm of new office space added to stock in the top five markets in 1Q. However, 54% more office space is under construction than one year ago. The squeeze on space has put upward pressure on rents which have risen in all Top 5 markets over the last year and the expectation is that further positive growth will push through, not just from Tier 1 cities, but Tier 2 as well.
Sources: Oxford Economics – Country Economic Forecast Germany 12 July 2018
JLL – Office Market Overview 2nd quarter 2018 July 2018CBRE – Real Estate Market Outlook Germany 2018
Real Estate Market
Economy GDP growth is under pressure as
confidence weakens due to escalating trade tensions and the expected imposition of tariffs by the US on car imports from the EU. Forecasts therefore have been nudged down to 1.9% for 2018.
Domestic demand drivers appear to be largely in tact although higher oil prices are set to be a temporary dampener for consumers.
The labour market is still sending our positive signals - unemployment fell and expected to continue to do so. However, the skills shortage in many industries and companies is slowing down planned business expansion.

48
The breadth of investors who have registered solid interest in the German logistics sector continues apace and with demand outweighing supply, competition strong for the limited number of core products, there is room for further yield compression at the prime end of the market. In addition, a rising number of investors will begin to look up the risk curve in search of yield, diversifying by investigating options in Tier II and III locations and value-add products as well. The positive investor appetite for logistic assets looks set to continue but the noted lack of
suitable product will hold the market back. Almost € 1.9 billion worth of industrial assets exchanged hands in 1Q. Occupiers are continuing to lean towards wanting to occupy new, efficient space. However,
one of the lingering challenges in the German industrial market is the lack of good quality space meeting the needs of today’s occupiers. This is true on a multiple levels including location, size and fit-out. Given robust demand, construction activity has picked up in the recent past and a slowdown is
not expected in the near term. While there has been an increase in the amount of owner occupier space and build-to-suit schemes, there has been a notable rise in the amount of speculative construction starts, but space is easily absorbed resulting in the rising dominance of pre-let completions. Developers are keen to acquire greenfield or brownfield sites in order to develop new supply, with speculative building activity focused on the main industrial areas. In total, more than 800,000 sqm of new development broke ground in 1Q 2018.
Germany – Industrial Market Outlook Real Estate Market
Economy
Investment Volumes
Outlook
0
10,000
20,000
30,000
40,000
50,000
60,000
70,000German Investment Volumes (€ million)
OtherHotelIndustrialRetailOffice
2H 2018 capital inflows into the German industrial sector reached approximately € 3 million. On paper this is a 42% fall in activity across the equivalent period, however it needs to be taken into account that 2017 was a record-breaking year due to a few extraordinary large portfolio transactions such as the sale of Logicor, the logistics platform of Blackstone.
International capital has traditionally been very comfortable with the German real estate market and the first six months of 2018 have not been an exception. Approximately 70% of activity this year is attributed to foreign investors with Asian and North American players particularly interested.
The weight of capital looking for a home in German real estate and the lack of product coming to the market have seen yields compress over the last twelve months and are now at historic lows in the majority of locations. The lowest prime yield is in Munich at 4.75%, with all the top locations across the country ranging from 4.75% to 5.35%.
Robust demand for industrial space has characterised 2018 and this follows the strong performance of the sector in 2017 where take-up reached 6.5 million sqm. A salient factor supporting the robust levels of occupier activity continues to be the transformation in the retail sector as the growth in e-commerce marches on, reflected in the corresponding rise in demand for logistics space.
GDP growth is under pressure as confidence weakens due to escalating trade tensions and the expected imposition of tariffs by the US on car imports from the EU. Forecasts therefore have been nudged down to 1.9% for 2018.
Domestic demand drivers appear to be largely in tact although higher oil prices are set to be a temporary dampener for consumers.
The labour market is still sending our positive signals -unemployment fell and expected to continue to do so. However, the skills shortage in many industries and companies is slowing down planned business expansion.
Indicator 2018 2019 2020 Outlook (vs 2019)
GDP 1.9% 1.7% ↘
Industrial Production 2.5% 2.0% ↘
Consumer Prices, average
2.0% 1.9% →
Population (000s) 83,042 83,263 ↗
Population 0.4% 0.3% ↗
Unemployment Rate 5.2% 4.9% →
Annual % change unless specified
Sources: Oxford Economics – Country Economic Forecast Germany 12 July 2018
BNP Paribas - Logistics Investment market Germany 2Q 2018CBRE – Real Estate Market Outlook Germany 2018
49
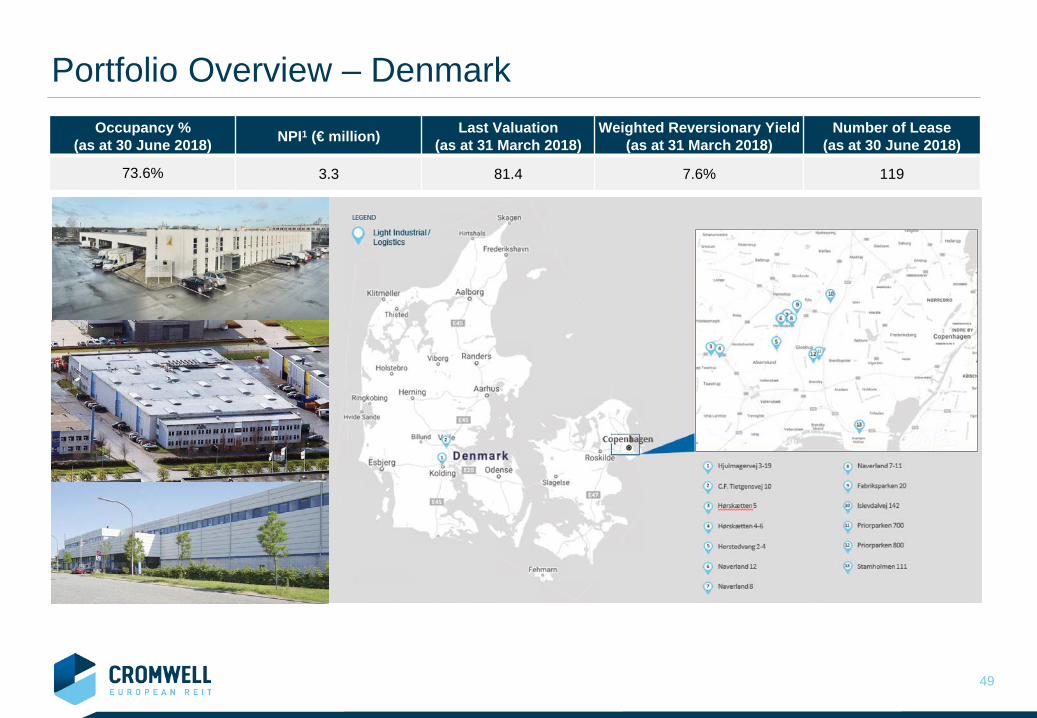
Portfolio Overview – DenmarkOccupancy %
(as at 30 June 2018) NPI1 (€ million) Last Valuation (as at 31 March 2018)
Weighted Reversionary Yield(as at 31 March 2018)
Number of Lease (as at 30 June 2018)
73.6% 3.3 81.4 7.6% 119

50
Denmark – Logistics/Industrial Market OutlookReal Estate Market
Economy
Real Estate
Outlook Households remain in a strong
position as unemployment continues to fall and employment has reached record levels which will help support wage growth. However, spare capacity will become
more scarce, potentially threatening the recovery and feeding into the GPD forecast being nudged downward from 1.8% in 2018 to 1.7%. Industrial production picked-up in
April from a flat previous two months. The outlook is mixed with the PMI falling into negative territory and orders shrinking while Statistics Denmark’s industrial confidence index has climbed above the 1Q average.
Indicator 2018 2019 2020 Outlook (vs 2019)
GDP 1.7% 1.9% →
Industrial Production 1.6% 2.1% ↘
Consumer Prices, average
1.1% 1.3% ↗
Population (000s) 5,787 5,812 →
Population 0.4% 0.4% →
Unemployment Rate 4.1% 4.1% →
Annual % change unless specified
Demand for logistics space is continuing apace in Denmark with e-commerce related activities in particular, being a demand accelerator. The integration of retail and logistics real estate solutions is evolving, with e-tailers looking for physical outlets and traditional retailers strengthening their online channels and restructuring their warehouse footprint, all of which is impacting occupier requirements for suitable space.
City logistics are coming to the fore as well, with retailers and logistics service providers looking for efficient ways to combine quick access to their customer base with warehouse networks, while protecting margins.
With the increase in capital flows into Danish industrial trading volumes in 1Q reached € 225 million, reflecting the increasingly positive view the investors have to the sector given the full-year 2017 volume was € 528 million.
While domestic capital is a significant element to investor activity, cross-border capital has become a major force in the European market, and these investors will continue to influence the investment market, not only in terms of buying activity but also by operating the substantial AUM they have amassed over the years. A source of equity that has been particularly active in Europe of late is Asian capital, most notably in exceptionally large logistics platform deals. These deals are part of a broader consolidation phase that is not confined to the real estate market but is illustrative of the maturing of the cycle.
With Danish prime yields hitting the lowest levels in the last 20 years and the expected increase in the long-term interest rates during 2018, the question of the current pricing is ever more present. The expectation is for prime yields to remain flat during 2018 and possibly come under upward pressure on yields in 2019. Further, rising interest rates will put upward pressure on property yields in 2019 although the historically high spread will cushion the scale of any potential increase. Supermarket chains have been active in modernising their warehouse networks and
exploring online channels. This has supported growth in occupier demand, a trend that is expected to continue as 2018 runs its course.With some logistics hubs near capacity, constraints will begin to play out and this will shift
occupier demand and development activity to established hubs that are still able to grow. New areas are likely to emerge as well and the successful ones will be those that have
considered accessibility to adequate labour pools and that are well connected from an infrastructure standpoint. The rise in population in some urban areas will be focal points for users and developers of
last mile logistics as online sales volumes continue to increase and consumer demand for shorter delivery times indicate that providers need efficient, lean operations.
Sources:Oxford Economics – Country Economic Forecast Denmark 18 June 2018
CBRE - Real Estate Market Outlook Denmark 2018C&W/RED – Market Report Issue I – Feb 2018
0
2,000
4,000
6,000
8,000
10,000
12,000
14,000Denmark Investment Volumes (€ million)
OtherHotelIndustrialRetailOffice

51
Commentary on the European Economy
Source: Oxford Economics
Growth in the Eurozone economy has eased over the first few months of the year due to a fallin exports. However, it is not expected to be a major slowdown with GDP growth still expectedto be a healthy 2.1% in 2018.
There is momentum in the European economy despite some recent slowing in activity –stronger labour markets and increasing capital investment boosting confidence and extendingthe cycle, pushing any bubble into 2019.
The PMIs rose in June, driven by stronger activity in services. Together with other surveys, thissuggests the Eurozone economy steadied towards the end of 2Q. But risks remain, especiallyfor the more externally oriented manufacturing sector.
There is relative political stability in the major countries of the Eurozone, albeit, although withsome exceptions, supported by a push from the European Union for further integration acrossall member states.
Structural shifts are here now; environmental, technological and demographic shifts areimpacting us now and not just in the future. Investors have to accept the threat and theopportunity, with a range of markets justifying risk-taking to create modern stock in the bestcities.

52
European Commercial Real Estate - Recent PerformanceOccupational Prime rental rates in some CBD and City Centre locations have come under sustained
upward pressure as occupiers look to trade up their accommodation. The desire forquality space has pushed up rents to the point that many occupiers are needing to look tonon-CBD and more peripheral locations where traditionally incentive packages have beenon offer and headline rents lower.
Robust demand overall but there has been some polarisation across European cities.Occupier activity has eroded availability and pushed down the overall vacancy rate andthe replacement of space is lagging. The average vacancy rate across the significantEuropean office markets is around 6.5% with few markets with available supply levelsthat would equate to more than 10% of stock.
Europe is suffering from a lack of quality supply, with speculative deliveries constrainedover the last few years, providing some room for rental growth, but notably the rate ofacceleration has slowed. Until construction catches up, tenants will need to be flexible intheir demands with some markets landlord controlled.
Serviced office providers will continue to cushion the blow of the lack of space andprovide short-term solutions for clients in need of space, typically in central locations.
Investment Europe’s property market paused for breath as 2018 began with € 56.5 billion transacted
in 1Q 2018. This comes of the back of the record breaking Q4 2017 where € 90.1 billionwas transacted, suggesting the market is in better health than the numbers mightsuggest.
Strong demand for offices is continuing to put downward pressure on yields, where inmany markets values are at or near historic lows. In addition, with pricing tight in centrallocations, the trickle over effect is that as more attention is given to secondary locationsthe yield gap between this and prime locations is narrowing.
Despite some uncertainty in the political arena, real estate is expected to remain apopular asset class with 2018 trading volumes expected to be on par with those of 2017. Sources:
Savills – Market report European Offices May 2018Savills – Market In Minutes European Investment June 2018
CBRE – Europe Investment Market Snapshot 1Q 2018

53
Cross-border activity: 1Q 2018
Global Capital Flows to Europe
Sources: Cushman & Wakefield, RCA, bespoke presentation to Cromwell by Cushman & Wakefield

54
5.1%
2.5%
7.2%
1.3%
2.9%2.4%
5.9%
CEREIT 2018E DPUYield
Europe 10-YearGovernment Bond
FTSE EPRAEurozone Index
US Government 10-Year Bond
Monetary Authority ofSingapore
10-Year Bond
Central ProvidentFund
FTSE Straits TimesREIT Index
Cromwell European REIT - Attractive Distribution Yield2018E DPU yield of 7.2%1 compares favourably to other global yield investment products
Source: Bloomberg, European Commission, data as at 24 July 20181 Based on € 0.60, the last traded price on Singapore Exchange Securities Trading Limited (“SGX-ST”) on 8 August 20182 Based on the monthly averages (non-seasonally adjusted data) of the yields of the 10-year government bonds of the countries in the Eurozone. They refer to central government bond yields on the secondary market, gross of tax, with a residual maturity of
around 10 years. The bond or the bonds of the basket have to be replaced regularly to avoid any maturity drift. This definition is used in the convergence criteria of the Economic and Monetary Union for long-term interest rates, as required under Article 121 of the Treaty of Amsterdam and the Protocol on the convergence criteria. Data are presented in raw form.
3 Based on Bloomberg’s estimated DPU yield for the year ended 31 December 2018 for FTSE EPRA Eurozone Index. FTSE EPRA Eurozone Index is a market capitalisation weighted index consisting of listed real estate companies and REITs in the Eurozone.4 Based on Bloomberg’s bid yield to maturity of bond.5 Based on Bloomberg’s bid yield to maturity of bond.6 Based on the legislated minimum interest of 2.5% per annum earned in Central Provident Fund (“CPF”) Ordinary Account. CPF is a mandatory social security savings scheme in Singapore. The interest rate on the CPF Ordinary Account is reviewed quarterly and
is the higher of the legislated minimum interest of 2.5% per annum or the 3-month average of major local banks’ interest rates.7 Based on Bloomberg’s estimated DPU yield for the year ended 31 December 2018 for FTSE Straits Times Real Estate Investment Trust Index. The FTSE Straits Times Real Estate Investment Trust Index is a market capitalisation weighted index consisting of
listed REITs in Singapore.
Europe Benchmarks US Benchmark
56 7
Yield Spread to Benchmarks
+5.8% +2.0% +4.7% +4.6% +1.2%
2 3
Singapore Benchmarks
4.2%
4

Thank You
If you have any queries, kindly contact:Cromwell EREIT Management head of investor relations Ms Elena Arabadjieva at [email protected], Tel: +65 6817 9589
or Newgate Communications at [email protected].