Embed Size (px)
Citation preview

HIGH EFFICIENT AND RELIABLE ARRANGEMENTS FOR
CROSSMODAL TRANSPORT
Project start Date: 01 January 2010 – Project Duration: 24 months
Contract Number: TCP8-GA-2009-234082
Collaborative project small of medium-scale focused research project
Priority: Horizontal Activities For Implementation of the Transport Programme (TPT.2008.13)
WP6
Handbook on Enhanced Business Models for Crossmodal
Transport Arrangements
Partner Responsible: IST
Date: 07 April 2012

This page is intentionally blank

Contract: TCP8-GA-2009-234082
Authors: Macário, Reis, Viegas,
Magalhães
Partner Responsible: IST
Dissemination Level: CO
Page: 3 of 181 Date: 07 April 2012
Document Id: HERMES_WP6_IST_D6_Final2
Document Title: Handbook on Enhanced Business Models for
Crossmodal Transport Arrangements
Version of the Document:
Final
Dissemination Level: Confidential
Work Package Allocation:
WP6
Due date of delivery: 07-04-2012 Actual Date of Submission: 07-04-2012
Main Authors: Rosário Macário (IST) Vasco Reis (IST)
José Viegas (IST) Liliana Magalhães (IST)
Other contributors:
TFK Partner Monica Lundin, Anna-Lena Elmquist, Amra Halilovic, Marie Magnusson, Yvonne Warnfeldt
UPM Partner Andrés Monzón, Andrea Alonso, Giulia Dell’ Asin, Luis Ángel Guzmán, María Eugenia López-Lamba, Cristina Valdés
KIT Partner Eckhard Szimba, Thomas Fluhrer, Aaron Scholz
UA Partner Thierry Vanelslander, Els Kusseneers
CERTH Partner Maria Morfoulaki , Anestis Papanikolaou
AEGEAN Partner Seraphim Kapros, Argyro Kostaki, Costas Panou, Amalia
Polydoropoulou, Athena Roumboutsos, Athena Tsirimpa
LET Partner Yves Crozet, Aurélie Mercier, Florent Laroche
STRATA Partner Jörg Last, Felicitas Sender, Anna Ivantosva
UNIGE Inés Cusano, Claudio Ferrari, Simona Sanguineti
UPa Alexander Chlan, Tatiana Molkova, Ivo Drahotsky
This document should be referenced as:
Macário, R., Reis, V., Viegas, J., Magalhães, L. (2012) “Handbook on Enhanced Business
Models for Crossmodal Transport Arrangements”, D6, HERMES High Efficient and
Reliable ArrangeMEnts for Cross-modal Transport, 7th Framework Program, DG
Research.

Doc. Id: HERMES_WP6_IST_D6_Final
Doc. Title: Handbook on Enhanced Business Models
Doc. Version: Final
Contract: TCP8-GA-2009-234082
Date: 07 April2011 Page: 4 of 181
Document History
# Date Version
1 31 Dec 2011 Final 1
2 07 Apr 2012 Final 2

Contract: TCP8-GA-2009-234082
Authors: Macário, Reis, Viegas,
Magalhães
Partner Responsible: IST
Dissemination Level: CO
Page: 5 of 181 Date: 07 April 2012
Table of Contents
Executive Summary 8
1 Introduction 12
1.1 Objectives of HERMES Project 12
1.2 Structure of the Handbook 15
2 Analytical framework for business models on intermodality 18
2.1 Components and working mechanisms of an intermodal transport service 18
2.2 Barriers impacting the integration process and the stakeholders 30
2.3 Analytical framework for business models 48
3 Business Models for Improved Intermodality 52
3.1 Location of the Barriers 52
3.2 Prototypes of Business Models 56
3.3 Building Blocks 59
4 Deployment of Prototypes of Business Models 107
4.1 Mobilize 107
4.2 Understand 109
4.3 Design 110
4.4 Implement 114
4.5 Manage 115
5 Conclusions on Intermodal Transport and Interconnectivity 117
6 Bibliography 124
7 Annex I –Segmenting passengers 128
8 Annex II – Case Studies Fact Sheets 136
8.1 HERMES Case Studies 136
8.2 Case Study 1 - Gothenburg Central Station 140
8.3 Case Study 2 - Arlanda International Airport 143
8.4 Case Study 3 - Avenida de America Interchange Madrid 146
8.5 Case Study 4 - Long distance bus services connected with high speed rail services, the case of Lerida and Zaragoza 148
8.6 Case Study 5 – Extension of the Adriatic-Ionian corridor from Peloponnese to Crete 152
8.7 Case Study 6 - Gare do Oriente Interchange, Lisbon 157
8.8 Case Study 7 - Faro International Airport: 160
8.9 Case Study 8 – Antwerp Airport 164
8.10 Case Study 9 – The Port of Patras 167
8.11 Case Study 10 – Intermodal Network of Lyon Metropolitan Area (REAL Project) 172
8.12 Case Study 11 – Regional Airport Frankfurt-Hahn 178

Doc. Id: HERMES_WP6_IST_D6_Final
Doc. Title: Handbook on Enhanced Business Models
Doc. Version: Final
Contract: TCP8-GA-2009-234082
Date: 07 April2011 Page: 6 of 181
Index of Figures
Figure 1.1 - Building blocks of a business model (source: Osterwalder 2004).....................12
Figure 1.2 – Structure of the Handbook..................................................................................................17
Figure 2.1 – Benefits of integration ..........................................................................................................20
Figure 2.2 – Mechanisms of integration in a co-modal transport service ...............................22
Figure 2.3 – Barriers addressed by the HERMES Cases...................................................................30
Figure 2.4 – Relation between barrier clusters and the domains of intermodality ............34
Figure 2.5 – Terminal Approach of Intermodality, Home and Destination Based Access and Egress Modes Schema (Source: Collet et al., 2008) .................................................................38
Figure 2.6 – Barriers by Intermodality Domains as perceived by stakeholder groups .....40
Figure 2.7 - Business Model Canvas (source: Osterwalder et al., 2010) ..................................50
Figure 3.1 – Barriers of the HERMES Case Studies ............................................................................54
Figure 7.2 – Prototype Business Model Gap 1......................................................................................58
Figure 7.3 – Prototype Business Model Gap 2......................................................................................58
Figure 3.6 - Rating of the Importance and Satisfaction respect to informational issues ..66
Figure 3.7 - Rating of the Importance and Satisfaction respect to physical issues.............66
Figure 3.8 - Factors influencing trip election. forTrain travellers...............................................68
Figure 3.9 - Factors influencing trip election. for Bus travellers. ................................................68
Figure 3.10 - Factors influencing trip election (for air travellers).............................................69
Figure 3.11 – Interdependencies between the building blocks ................................................ 105
Figure 3.12 – Business model for the Case Study – Airport of Faro ........................................ 106
Figure 3.13 – Business Model for the Case Study - Part Dieu Station ................................ 107
Figure 4.1 – 5-Step method for Business Model development .................................................. 108
Figure 4.2 –Contextual dimensions of analysis (source: Osterwalder, 2010) .................... 110
Figure 8.1 – HERMES Case Studies modal Coverage ...................................................................... 139
Figure 8.2 - Map displaying Gothenburg station’s area (left) and Stakeholders at Gothenburg (right)........................................................................................................................................ 140
Figure 8.3 - Current Business Model at Gothenburg ...................................................................... 141
Figure 8.4: Proposed Business Model for Gothenburg.................................................................. 142
Figure 8.5 - Map of Arlanda Airport (left) andAgents and their interaction at Arlanda airport (right) .................................................................................................................................................. 143
Figure 8.6 Current business model of Arlanda Airport................................................................. 144
Figure 8.7 Proposed Business Model for Arlanda Airport........................................................... 146
Figure 8.8 - Avenida de America Interchange ................................................................................... 146
Figure 8.9 - Current Business Model in Avenida de America ..................................................... 147
Figure 8.10 - Zaragoza & LLeida Stations............................................................................................ 149

Contract: TCP8-GA-2009-234082
Authors: Macário, Reis, Viegas,
Magalhães
Partner Responsible: IST
Dissemination Level: CO
Page: 7 of 181 Date: 07 April 2012
Figure 8.11 - Current Business Model in Zaragoza Station ......................................................... 150
Figure 8.12 - Current Business Model in Lleida Station ............................................................... 150
Figure 8.13 - Map of the corridor Patras- Piraeus- Crete............................................................. 152
Figure 8.14 - Current Business Model of Patras-Piraeus-Crete................................................. 153
Figure 8.15- Current Business Model at Gare do Oriente/Linha do Norte........................... 158
Figure 8.16 - Current Business Model of Faro Airport .................................................................. 162
Figure 8.17 – Proposed Business Model for Faro Airport ........................................................... 164
Figure 8.17 - Interactions between agents in Antwerp Airport ................................................ 165
Figure 8.19 - Current Business Model at Antwerp Airport ......................................................... 166
Figure 8.19 - Port of Patras international and national annual transport demand.......... 168
Figure 8.20 - Graphical representation f the interaction between the agents of Port of Patras .................................................................................................................................................................. 168
Figure 8.21 - Current Business Model of the Port of Patras........................................................ 169
Figure 8.22 - Proposed modifications in the Business Model of the Port of Patras ......... 171
Figure 8.24 - Part-Dieu station concourse .......................................................................................... 173
Figure 8.25 : Stairs to access to the tracks at Part-Dieu ............................................................... 173
Figure 8.26 - Current Bussiness Model of Part-Dieu Station ...................................................... 174
Figure 8.27 - Proposed Business Model for Part-Dieu Station .................................................. 177
Figure 8.28 - Interactions between agents at Frankfurt-Hahn Airport ................................. 178
Figure 8.29 - Current Business Model of Frankfurt-Hahn Airport........................................... 179
Figure 8.30 - Proposed Business Model for Frankfurt-Hahn Airport ..................................... 181
Index of Table
Table 2.1 – Overview of identified barrier clusters 31
Table 2.2 - HERMES Cases: Barriers, Measures and Value Propositions Summary 32
Table 2.3 – Objectives of the several stakeholders in an intermodal transportation system (source: meersman et al, 2000, adapted) 39
Table 3.1 - Main problem of each case study 53
Table 3.2 – Results for Passengers’ sensivity to travel factors (Source: Cokasova, 2003a) 79
Table 4.1 – Elements for the analysis of the business context 112
Table 5.1 – Strategies for improving the dimensions of intermodality 119
Doc. Id: HERMES_WP6_IST_D6_Final
Doc. Title: Handbook on Enhanced Business Models
Doc. Version: Final
Contract: TCP8-GA-2009-234082
Date: 07 April2011 Page: 8 of 181
Executive Summary
1. The objective of HERMES project was the development and analysis of
prototypes of business models for intermodal service between long- and short-distance transport networks. The underlying concept lies on the
rational that it is possible to improve the experience in the long-distance journeys by enhancing the integration with the short-distance transport
services. These services, despite representing a small portion of the
mobility chain, offer an upgraded fluidity in the whole door-to-door journey and, as such, have a considerable influence on the passenger’s
perception of the quality of service and of the expected difficulties of the local component of long distance transport.
2. Prototypes of business models for intermodal services are examples of new mobility schemes and related organizational patterns that describe
core aspects of the intermodal transport business, including: added value
to the passenger, offerings, strategies, infrastructure, organizational structures, trading practices, operational processes and policies.
3. Eleven case studies supported the design of the prototypes of business models, build on a specific business model analytical framework. Every
case study refers to long- and short-distance transport example. All modes of transport have been covered in different combinations. They
can be grouped in three categories according with the type of transfer
terminal, being: airports, sea terminals, and road terminals. The barriers for enhanced intermodality identified in the case studies either occurred
within the terminal or were related with the intermodal links. The following cases were addressed:
1. Case Study 1: Gothenburg Central Station (Sweden);
2. Case Study 2: Arlanda International Airport (Sweden);
3. Case Study 3: Avenida de América Interchange Madrid (Spain);
4. Case Study 4: Long distance bus services connected with high speed with high speed rail services (Spain);
5. Case Study 5: Extension of the Adriatic-Ionian ferry corridor from Peloponnese to Crete (Greece);
6. Case Study 6: Gare do Oriente Interchange Station and Connection with Linha do Norte Railways (Portugal);
7. Case Study 7: Faro International Airport (Portugal);
8. Case Study 8: Antwerp Airport (Belgium);

Contract: TCP8-GA-2009-234082
Authors: Macário, Reis, Viegas,
Magalhães
Partner Responsible: IST
Dissemination Level: CO
Page: 9 of 181 Date: 07 April 2012
9. Case Study 9: Port of Patras (Greece);
10. Case Study 10: Part-Dieu Station at Lyon (France);
11. Case Study 11: Frankfurt-Hahn Airport (Germany).
4. The key conclusion taken from the surveys and case studies analysis is
that intermodality between long distance and local transport services
does not happen except if it is of direct business interest of one of the agents involved.
5. In some cases – mostly when we are dealing with the intermodality at nodes – it is rather likely that there will be scope for the assumption of
the business of intermodality by the agent responsible for the management of that node (the “interchange manager”), as the provision
of better coordination between long distance and local transport services
could not only lead to higher satisfaction of those clients of the interchange, but also to a subsequent increase of the attractiveness /
competitiveness of that interchange with respect to others serving the same region, or even with respect to other regions to which people travel
for similar motives.
a. So, in such cases, promotion of intermodality could easily be
justified as an important part of the business interests of that
interchange or of that region
6. In other cases – typically associated with creation of what was described
as intermodality at links – it is generally less obvious what kind of business interests could be called upon to support that intermodality.
Only after that identification has been made will it be possible to assign the responsibility for managing the associated services. The cases of the
Arlanda airport and of the Patras to Kalamata link have some similarities
but also some differences:
a. in the former case, the intermodal services have only an indirect
economic value for the airport manager, but a very important one, as they are necessary to keep the total emissions associated under
the airport under the predefined threshold, and so to allow some growth of the main business interest of the airport, namely air
traffic. So, it is natural that the airport management takes on this
role of intermodality manager;
b. in the latter case, the intermodal services have limited business
interest for those directly engaged but a strong interest for the community at large, as they allow a reduction of traffic volumes on
the road between Patras – Athens – Piraeus and on the saturated

Doc. Id: HERMES_WP6_IST_D6_Final
Doc. Title: Handbook on Enhanced Business Models
Doc. Version: Final
Contract: TCP8-GA-2009-234082
Date: 07 April2011 Page: 10 of 181
ferry terminal at Piraeus. In the first dimension there are problems
of road safety and emissions from road vehicles, whereas in the
second dimension there are problems of poor service to the ferry clients travelling to Crete. So, in this case, the appointment of the
intermodality manager should be a matter for the national road authority, the regional (tourist) authorities of Crete island, and
also the port of Patras which can also increase the satisfaction of its clients (and possibly through this increase its market).
i. All cases in which three public authorities of different
institutional settings have their own interest in a specific solution but view it from a different angle (for Crete and
Patras an increase of quality of service and business volumes, for the road authority a reduction of problems),
the formulas for cooperation must also be selected depending on particular circumstances of the people
involved and the history of relations among those
institutions, but the most logical solution that can be induced from these cases is for the infrastructure manager
to appoint the intermodality manager and receive some financial contribution for the development of that mission
from the authorities engaged.
7. It should be noted that, even if in these more complicated cases the
rationale for intermodality has to be carefully investigated, this does not
imply that the added value of its realization is lower. On the contrary that added value might be higher, but distributed across multiple partners,
some of them with the location of their business in rather different geographical areas, and so more difficult to bring into the picture and
more difficult to mobilize into the coalition of actors for deployment of a solution.
8. Two prototypes of business models were developed, for tackling the
barriers and the added value factors at the terminal and at the intermodal links. The prototypes were developed from the perspective of the agent
that is interested in promoting the intermodal transport. They aim to improve the passenger’s quality of transport or reduce the price, and to
achieve benefits to the society, through a better intermodality promoted by intermediary agents (e.g.: private operators, public institutions, etc).
9. The prototypes are expected to be deployed by public decision makers
and private operators in the development of new transport services or in the improvement of existent ones.

Contract: TCP8-GA-2009-234082
Authors: Macário, Reis, Viegas,
Magalhães
Partner Responsible: IST
Dissemination Level: CO
Page: 11 of 181 Date: 07 April 2012
10. The present Handbook is meant to be a reference guide for the development or improvement of good intermodal transport services. The
target readers are therefore practitioners, including: public authorities, transport operators, or infrastructure managers.
11. The Handbook was prepared to offer a simple and easy reading. The
Handbook is structured in six main chapters, each one dedicated to a specific topic of intermodality. Together, they offer a comprehensive
understanding on intermodal transport. In specific, at the end of this handbook, the reader should be able to understand:
a. What are the dimensions of full intermodality (in Chapter 2); b. What is a business model and how it can help improving the
performance of the intermodal transport service (in Chapter 2);
c. What are the main barriers impacting the integration of an intermodal transport service;
d. How to structure the business model analysis of the current offer (in Chapter 3);
e. How to build a successful business model for the improved intermodal system (in chapter 3);
f. How develop a new business model in a real-world context.
(Chapter 4) 12. The reader will also obtain real world examples and practice, with the
eleven case studies developed in HERMES research project which synopsis in presented in the Annex of this Handbook. Further details on
surveys and case studies can be found in the specific reports available, namely:
a. Deliverable of WP1: State of the Art on Crossmodal Transport
Arrangements b. Deliverable of WP2: Cross Modal Transport Models
c. Deliverable of WP3: Regulatory and Legal Requirements:
identification of barriers and enhancement measures for
interconnectivity d. Deliverable of WP4: Interoperability Barriers to Intermodality and
Interconnectivity of Passenger Transport
e. Deliverable of WP5: Case Studies

Doc. Id: HERMES_WP6_IST_D6_Final
Doc. Title: Handbook on Enhanced Business Models
Doc. Version: Final
Contract: TCP8-GA-2009-234082
Date: 07 April2011 Page: 12 of 181
1 Introduction
1.1 Objectives of HERMES Project
HERMES explicitly focused on enhancing Crossmodal Transport Arrangements
with the purpose of exploring and thus developing prototypes of new
business models for interconnectivity. The project analysed the existing
connections and further evaluated the level of interconnectivity in the passenger
terminals where short and long-distance transport networks come together and
where fluidity between those networks should ensure the maintenance of the
level of service when the passenger is transferred from one to the other.
Prototypes of business models are examples that represent core aspects of a
business, including purpose, offerings, strategies, infrastructure, organizational
structures, trading practices, and operational processes and policies. The
conceptual Figure 1 below represents the building blocks of a business model
and provides and illustration of the concept and how it should be structured.
Using Rappa’s broad definition a business model is the method of doing business
by which a company can sustain itself - that is, generate revenue. The business
model spells-out how a company makes money by specifying where it is
positioned in the value chain. The figure below presents the generic schematic
structure of a business model highlighting its main building blocks
Figure 1.1 - Building blocks of a business model (source: Osterwalder 2004)

Contract: TCP8-GA-2009-234082
Authors: Macário, Reis, Viegas,
Magalhães
Partner Responsible: IST
Dissemination Level: CO
Page: 13 of 181 Date: 07 April 2012
The objective of HERMES, as defined in the European Commission in the 7FP
work program, is the development and analysis of new mobility schemes and
related organisational patterns at the interface and interconnection between
long distance transport networks and local/regional transport networks of all
modes. The aim of HERMES is to develop prototypes of suitable business models
for intermodal or interconnecting services that will contribute to build
sustainable mobility solutions.
The concept under focus lies on the rationale that it is possible to obtain better
market share in long distance passenger transport modes (e.g. rail, coach or air
transport) than if only the “long-distance” part of the trip was considered by
travellers for their modal choice. However, if the final destination is not easy to
reach any of these advantages would be easily cancelled. Time spent on board
the “long-distance” mode can be used to provide passengers with information
about the best path from the arrival station to their final destination, and
possibly also sell them valid tickets for that local transport, and to identify
groups of passengers going to destinations close-by to one-another and organise,
for example, a taxi or mini-van transport for them, selling the corresponding
voucher aboard the “long-distance” mode.
These are conceptually simple operations, often requiring only some real-time
telecommunication (such as the case of the train-taxi in the Netherlands) but
there are organizational and contractual difficulties in its service provision that
are invisible to the final customer. However, even if these services represent a
small portion of the mobility chain, they offer an upgraded fluidity in the whole
door to door trip and, as such, have a considerable influence on the public
perception of transport attention to their needs and of the expected costs and
difficulties of the local component of long distance transport. They represent the
missing link of transport networks.
Case studies illustrated the possible variants to these missing links. They
concentrated on the identification of key requirements of the travellers, the
corresponding services and necessary underlying company agreements to
provide them, followed by a business plan for the operation. Case studies should

Doc. Id: HERMES_WP6_IST_D6_Final
Doc. Title: Handbook on Enhanced Business Models
Doc. Version: Final
Contract: TCP8-GA-2009-234082
Date: 07 April2011 Page: 14 of 181
cover a wide diversity of situations of interconnectivity providing sound
examples.
The analyses embraced:
• interfaces and interconnections between different modes, such as long-
distance rail/urban transport or air/rail; and
• interfaces and interconnections between different types of services of the
same mode, such as long-distance rail services/ regional rail services or
urban bus / express coach; and
• interfaces and interconnections between high capacity mode and low
capacity, such as long-distance rail or coach / taxis, etc
In order to encompass the complex domain of interconnectivity in the passenger
terminals where different transport networks involving different transport
modes come together, the study of interconnectivity as a concept included the
following sub-domains:
• Physical (“time and space as well as interfaces”) interconnectivity;
• Logical (“Information”) Interconnectivity;
• Economical (“Fares”) Interconnectivity;
• Contractual Interconnectivity (“company agreements”);
• Institutional (“Regulators and Organizing agencies”) aspects;
• Legal and regulatory (“Market access, minimum operating and service
requirements and other relevant regulation”) conditions;
The analysis of these sub-domains provided background for the identification of
the good practices in interconnectivity. This strengthened our conclusions and
proposals of actions to improve the current level of interconnectivity in the
coming future. Finally, a plan of actions for future improvements of
interconnectivity in the passenger terminals was developed.

Contract: TCP8-GA-2009-234082
Authors: Macário, Reis, Viegas,
Magalhães
Partner Responsible: IST
Dissemination Level: CO
Page: 15 of 181 Date: 07 April 2012
1.2 Structure of the Handbook
The present Handbook presents the main outputs of HERMES project. It is meant
to be a reference guide for the development or improvement of good intermodal
transport services. The target readers are therefore the real world practitioners,
including: public authorities, transport operators, or infrastructure managers.
The Handbook was prepared to offer a simple and easy reading. It is structured
in four chapters (Figure 1.2), each one dedicated to a specific topic of
intermodality. In order to fulfil its function of handbook, each chapter was
prepared to be a standalone piece of text, containing all the relevant information.
Each chapter introduces new insights and teachings that although related with
the previous, does not require their reading to be understood. Therefore
depending on the specific need the reader only needs to read the respective
chapter(s) and may skip the others. In any case, the Handbook is single
document and, therefore, can be read on a sequential manner.
Chapter 2 is the theoretical chapter of the handbook. It presents the theoretical
foundations of intermodal transport, describing the concept, and the dimensions
and the mechanisms of integration. It also presents the main barriers impacting
the integration of the intermodal transport service and, consequently,
preventing stakeholders to fully exploit the benefits of integration. The chapter
ends with the presentation of the concept of business model and framework of
analysis.
Chapter 3 presents the prototypes of business models for enhanced
intermodality. The chapter starts with the sketch, but not explanation, of the
prototypes of business models so that the reader could have an immediate idea
and, if able, to deploy them. Finally, each building block (in a total of nine) is
discussed, following the same structure, compound of four steps, being:
• Definition of the building block;
• Analysis of the current status (of the business model);
• Prototypes for improving the performance of the intermodal transport
service;

Doc. Id: HERMES_WP6_IST_D6_Final
Doc. Title: Handbook on Enhanced Business Models
Doc. Version: Final
Contract: TCP8-GA-2009-234082
Date: 07 April2011 Page: 16 of 181
• Proposals for implementing the prototypes.
In this way, all the required information for analysing and changing any giving
building block is concentrated. This approach results in each building block
being independent from the others. As such, the reader only needs to read the
building block(s) of his interest. This design improves the usability and easiness
of the handbook.
Chapter 4 describes a 5-step approach for designing and deploying business
models in real world context. The chapter explains in a straightforward way how
a transportation practitioner can implement an improved business models.
The last chapter, Chapter 5, describes the overall conclusions and offers
important insights on how to develop business models in real-world context.
Together, they provide a comprehensive understanding on intermodal transport.
Specifically, at the end of this handbook, the reader should be able to
understand:
1. What are the dimensions of full intermodality; 2. How to recognize which of them are present in the current offer, even
if insufficiently developed; 3. How to recognize which components could present higher added
value for the travelers; 4. How to structure the business model analysis of the current offer;
5. How to build a successful business model for the improved intermodal
system.
The reader will also get real world examples and practice, with the eleven case
studies developed in HERMES project.

Contract: TCP8-GA-2009-234082
Authors: Macário, Reis, Viegas,
Magalhães
Partner Responsible: IST
Dissemination Level: CO
Page: 17 of 181 Date: 07 April 2012
Figure 1.2 – Structure of the Handbook
Chapter 3 Business Model
Chapter 2 Fundamental Concepts on
Intermodal Transport
Chapter 5 Conclusions and Recommendations
Annex Cases studies
synopsis
Chapter 4 Deploying the Prototypes
of Business Models

Doc. Id: HERMES_WP6_IST_D6_Final
Doc. Title: Handbook on Enhanced Business Models
Doc. Version: Final
Contract: TCP8-GA-2009-234082
Date: 07 April2011 Page: 18 of 181
2 Analytical framework for business models on intermodality
This chapter presents the key theoretical concepts to understand the current
handbook, being: intermodal transport, barriers impacting integration and
stakeholders, and business model.
Intermodal transport is more complex than single-modal transport service, for
the simple fact of participating diverse independent entities. As such, to achieve
higher levels of performance or to improve the current ones, it is necessary to
complex behaviour of intermodal transport. This chapter gives a brief overview
about the key dimensions of intermodal transport and underlying working
mechanisms.
The second part of this chapter is dedicated to the presentation of the barriers.
The location of the barriers is fundamental to determine the type of action to
overcome the barriers.Finally, the chapter introduces the notion of business
model and presents the framework used in this handbook to analyse the
business models of an intermodal transport service.
At the end of the chapter, the reader should be i) able to depict the behaviour of
an intermodal transport service into its constitutive components and to identify
the main interactions, ii) knowledgeable on the main barriers and iii) able to
know the concept and building blocks of business models.
2.1 Components and working mechanisms of an intermodal transport
service
2.1.1 Theoretical Foundation
The European Commission’s definition of intermodality was proposed, in 1997,
as being “a characteristic of a transport system that allows at least two different
modes to be used in an integrated manner in a door-to-door transport chain. In
addition, intermodal transport is a quality factor of the level of integration
between different transport modes. In that respect more intermodality means more
integration and complementarity between modes, which provides scope for a more
efficient use of the transport system” (EC, 1997). The concept of co-modality was

Contract: TCP8-GA-2009-234082
Authors: Macário, Reis, Viegas,
Magalhães
Partner Responsible: IST
Dissemination Level: CO
Page: 19 of 181 Date: 07 April 2012
introduced in 2006 in the mid-term review of the European Commission’s 2001
White Paper on Transport as being “the efficient use of different modes on their
own and in combination” (EC, 2006). The underlying rationale is that the
optimisation of the mode or modes of transport and the optimisation of the
organisation of the chain “will result in an optimal and sustainable utilisation of
resources” (EC, 2006). From these definitions we may conclude that intermodal
transport entails some level of integration between modes of transport; whereas
co-modal transport places the emphasis on the individual and combined
efficiency.
Bearing in mind that the level of the ‘combined efficiency’ of the transport
operators is function of their level of integration, that is, the higher is the
integration the higher will be the combined efficiency; then, the concept of co-
modality embraces and widens the concept of intermodality. Co-modality
implies integration, just as intermodality, but it removes the restriction on the
need of having different transport modes.
The bottom line is that intermodality requires integration between the transport
services. As such, if we envisage achieving full intermodality, we need to
understand its structure and dynamics. Figure 2.1 schematises the sources of
efficiency in intermodal transport (Reis, 2010). The right side bar presents the
individual efficiency of the various transport modes. This is the maximum
expected efficiency from a non-integrated transport service (that is: multimodal
transport). The middle bar presents the expected efficiency of an integrated
transport service – intermodal transport service. The transport services, when
jointly operated in an integrated transport service, will generate synergies
(green bar in Figure 2.1) that will add up to the individual ones, resulting in an
increase of the total efficiency. Sources of synergies include: coordination of
schedules, elimination of redundant services, enlargement of the hinterland.

Doc. Id: HERMES_WP6_IST_D6_Final
Doc. Title: Handbook on Enhanced Business Models
Doc. Version: Final
Contract: TCP8-GA-2009-234082
Date: 07 April2011 Page: 20 of 181
Figure 2.1 – Benefits of integration
In an integrated transport network, each mode of transport is expected to be
used at its best scale and operation. This will result in the specialisation of the
various modes of transport, accordingly with their operational characteristics,
that is: high-speed rail, air and sea for the long and medium distances, and
conventional rail, metro, bus and cars, for short and medium distances. As a
consequence, the transport network’s available capacity is used at maximum
efficiency, with a rationalisation of the energy consumption.
Yet, in real world operations, barriers and other problems may emerge
impacting the production of intermodal transport services. These barriers
generate friction that ultimately results in losses of efficiency. Eventually, the
frictions may be so significant that, in practical terms, prevent the
implementation of intermodality. There are two types of frictions:
• Internal sources or friction refer to internal factors to the transport service (i.e.: factors that are related with the transport operators and the production of the transport service).
Actual Efficiency
Potential Efficiency
Individual Modes’
efficiency
Mode 1’s efficiency
Mode 2’s efficiency
Integration’s surplus of efficiency
loss of efficiency due to internal friction
loss of efficiency due to external barriers
Efficiency
Max. gain in efficiency
Adapted from Reis (2010)
Non-integrated efficiency
Max. efficiency
Integrated
efficiency

Contract: TCP8-GA-2009-234082
Authors: Macário, Reis, Viegas,
Magalhães
Partner Responsible: IST
Dissemination Level: CO
Page: 21 of 181 Date: 07 April 2012
• External barriers refer to the external factors to the transport service system (i.e.: factors that are not related with the transport operators’ characteristics).
Figure 2.1 helps to understand the nature of the frictions and the barriers in the
production of a co-modal service. If no friction or barrier existed, we would get
the maximum synergies from the integration of the transport modes. This is
represented in left side bar (grey bar). The frictions and barriers will reduce the
maximum attainable synergies possible to reap from the integration of the
modes of transport (grey boxes in the middle bar). Although friction and barriers
act in a similar way: losses of efficiency, they differ in nature. Frictions are
originated within the transport service and thus can be overcome if the adequate
initiatives are taken by the transport operators, whereas barriers are external to
the transport service and thus cannot be overcome by the transport operators,
requiring external initiatives (such as: physical construction and new policies)
2.1.2 Integration of an intermodal transport services
The following Figure 2.2 depicts the mechanisms of integration in a co-modal
transport service and it can be used to better understand the nature of frictions
in the efficiency of the co-modal service. The mechanisms of integration1 occur
between five building blocks, all of them subject to barriers external to the
transportation system:
1. Passengers’ mobility requirements; 2. Transport service’s profile; 3. Types of Friction; 4. Dimensions of Integration 5. Co-modal arrangement’s efficiency and performance
1 A detailed presentation on the mechanisms of integration can be obtained in Reis (2010).

Doc. Id: HERMES_WP6_IST_D6_Final
Doc. Title: Handbook on Enhanced Business Models
Doc. Version: Final
Contract: TCP8-GA-2009-234082
Date: 07 April2011 Page: 22 of 181
Figure 2.2 – Mechanisms of integration in a co-modal transport service
The passenger requirements identify the merit elements valued by the system
users. The choice of the properties of the transport service’s profile is
determined by the passengers’ mobility requirements.. The transport service’s
profile refers to the set of operational and technological properties of the system:
transport operator and transport mode (such as: capacity, tariffs, schedules,
etc.).
At a nodal point two profiles interact, from each of the services that are coming
together at the nodal point. If they do no fit (that is; the properties are not
compatible, like for example different capacities, different time schedules,
different baggage regulations, etc.) losses of efficiency will occur. These losses or
types of friction exhibit different nature and occur in different moments, being:
• Type 1 - friction that provokes losses of efficiency during the production of the transport service, including the transfer between transport modes as is the case of an airport, and that undermines the efficiency (such as: delay in one segment resulting in losing the next one, lost baggage, etc.).
• Type 2 - friction that prevents the detection and recovery of a problem (for example: impossibility of fast transfer connection for delayed passengers) during the production of the transport service.
Source: Reis (2010)
Dimensions of Integration Frictions
Pass
enge
rs’
Curr
ent
& E
mer
gent
M
obil
ity
Req
uire
men
ts
Effi
cien
cy &
Perf
orm
ance
of t
he
Co-
mod
al A
rran
gem
ents
Tra
nspo
rt S
ervi
ce’s
P
rofi
les
Type 1
Type 2
Type 3
physical
logical
contractual
financial
relational
External Barriers

Contract: TCP8-GA-2009-234082
Authors: Macário, Reis, Viegas,
Magalhães
Partner Responsible: IST
Dissemination Level: CO
Page: 23 of 181 Date: 07 April 2012
• Type 3 – friction that prevents the customers to be compensated by the problems occurred during the transport service, typically this happens after the production of the transport service (e.g.: non agreement between stakeholders on the compensation to the customers).
The dimensions of integration refer to the nature of the interactions that occur
during the production of an intermodal or co-modal transport service. Along
each dimension, friction may occur and lead to losses in the efficiency of the
transport service. It is the existence of frictions in each of the dimensions of
integration that makes the intermodal or co-modal transport
arrangements unstable and prone to failure. Conversely, single modal
transport services do not exhibit such dimensions thus making them much more
stable. This is the reason for transport operators to either prefer operating on a
modal basis or, when operating more than one mode of transport, prefer
controlling the transport chain as a way to better control the sources of
instability.
There are five dimensions of integration, being:
• Physical Dimension: Aspects regarding the cooperation of the different
modes in respect of time (transfer time needed) and space (terminals design for easy access).
• Logical Dimension: Aspects regarding information systems and technologies that improve the connection between the long and short
distance travel providing all information the customer needs.
• Economical Dimension: Aspects regarding technologies and policies that allow the common fare between all the stages of an intermodal trip
(integrated ticket systems).
• Contractual Dimension: Aspects regarding the framework of
cooperation (company agreements) between different transport agencies in order to achieve a better level and quality of interconnectivity.
• Institutional Dimensions: Structural aspects of every entity involved in the passenger intermodal chain, concerning mainly organizational issues
to achieve interconnectivity.
In addition to the five dimensions, we also must consider the legal and
regulatory environment. This dimension is external to the intermodal transport,

Doc. Id: HERMES_WP6_IST_D6_Final
Doc. Title: Handbook on Enhanced Business Models
Doc. Version: Final
Contract: TCP8-GA-2009-234082
Date: 07 April2011 Page: 24 of 181
but it revealed to be an important barrier and source of frictions. Thus, a sixth
dimension of intermodality is also discussed.
• Legal and regulatory Interconnectivity. Legal and regulatory framework relative to the intermodality issues (integration of national
laws with the European regulations and policies concerning market access regulation, minimum operating and service requirements etc).
2.1.2.1 Physical Dimensions
The physical domain (as has already described previously) explores the service
quality of terminals interconnections in terms of ‘space’ (how close is the
distance between the different modes) and ‘time’ (how easy and ‘coordinated’ is
the access between the modes or networks).
Concerning these aspects, special attention is given to the transport modes’
cooperation, and in particular the optimal integration of public transport in the
transport terminal’s design. The integration of public transport in the terminal’s
design is aiming to improve the short-leg of the passenger’s trip, which is
believed to constitute the more complicated and inconvenient part (especially in
cases of unknown destination). The main problems in terms of physical
connection that cause the reduction of efficiency and quality of service are
located in the airports and in the connections between different levels of road
network (integration of TEN-Network to national road networks, national to
regional and regional to local). This fact is also proved by the specific policy
initiatives concerning the ‘integration of European and regional transport
networks’ and the ‘enhancing of airport accessibility’ as it has been already
described.
Other issues that are mainly discussed in relation to physical (“time and space”)
concepts are the development of high quality infrastructures concerning the area
of mode interchange. Specifically, the issues emphasized more are the creation of
organized parking areas for passengers and cyclists, the creation of Park and
Ride (P&R) and Kiss and Ride (K&R) facilities in respect to passenger’s

Contract: TCP8-GA-2009-234082
Authors: Macário, Reis, Viegas,
Magalhães
Partner Responsible: IST
Dissemination Level: CO
Page: 25 of 181 Date: 07 April 2012
convenience and the safety as well as the development of exclusive place for
different categories of flows (cyclists, cars and pedestrians).
2.1.2.2 Logical Dimension
The principal conclusion drawn from the theoretical analysis concerning the
Logical (‘information’) domain is that the provision of intermodal and
multimodal information is a very complex business since it covers a whole range
of infrastructure and institutions, and thus requires demanding multi-
stakeholder partnerships and fusing of diverse and often incompatible data
sources. The main issues of the ‘logical’ domain concern standardization
procedures of user interfaces for passenger information on an international
scale. In order to have an effective door-to-door service, the system should be
fully inclusive of all services of different modes and network hierarchy levels.
According to the review conducted, the main obstacles towards this direction
are:
• The private added-value for providing data in standard formats at the
operator’s own cost has not been proved adequately;
• Informational integration is still entailing certain cautiousness to private
operators concerning commercial risks;
• European intermodal information presents further complications of
language, and the institutional difficulties of international co-operation There
is still a lack of harmonized multimodal information architecture, which
makes high quality intermodal information expensive and difficult to
produce.
Conclusively, integrated and real-time door-to-door information systems (both
pre-trip and on-trip) are a key tool in developing workable and attractive long-
distance European passenger intermodality. Information is often available per
mode and per network hierarchy level but still much progress on integrated
information systems has to be made since there is no intermodal structure that
could promote integrated information connecting different scales of transport
networks.

Doc. Id: HERMES_WP6_IST_D6_Final
Doc. Title: Handbook on Enhanced Business Models
Doc. Version: Final
Contract: TCP8-GA-2009-234082
Date: 07 April2011 Page: 26 of 181
2.1.2.3 Economical Dimension
Considering the aspects of integrated ticketing it has to be stated that across
Europe a poor co-operation to achieve integration of tariffs exists, especially for
long-distance and border crossing journeys.
Questions that arise with the introduction of new tariff and ticketing structures
as well as electronic ticketing technologies are the interoperable fare
management along with the estimation of the costs-benefit ratio, the passenger
acceptance which often must be accompanied with special (integrated) tickets
and the problems of disabled or elderly people when are trying to use new
technologies (e.g. blind people, use of internet for booking).
It should be stated that technical solutions to the problem of integrated tariffs
and ticketing are already available. The main obstacle is currently the lack of co-
operation among stakeholders and the finalization and acceptance of common
standards, which is especially the case in cross border and long-distance travel
chains. Moreover, questions and issues concerning the financing initiative of new
technologies and innovative tariff structures constitute obstacles for integrated
ticketing.
But at least it should be possible to establish agreements so that information and
ticket sales for local transport should be systematically possible on board the
vehicles used for the long distance part of the journey. This would allow an
important reduction of anxiety about where to buy those tickets on arrival and
how much they will cost, and probably constitutes a more important aspect that
the availability of integrated tickets, which would anyway raise enormous
difficulties of contract negotiation (see next point) and management of a very
large set of ticket combinations – imagine a long distance train serving a dozen
urban agglomerations along its path, providing integrated tickets between
possibly almost one hundred long distance fares with typically some 3 to 5
different tariff levels in each of the agglomerations along the way.
And what should be expected in the inverse direction, when the journey starts at
a suburban location in one of those agglomerations and ends in another suburb

Contract: TCP8-GA-2009-234082
Authors: Macário, Reis, Viegas,
Magalhães
Partner Responsible: IST
Dissemination Level: CO
Page: 27 of 181 Date: 07 April 2012
of another agglomeration several hundred kilometres away? Should we expect
the local transport company on the suburb where the journey starts to have the
means to set the price and sell the integrated ticket for the complete journey?
2.1.2.4 Contractual Dimension
This domain probably conceals the greatest barriers for the development of
passenger intermodality. In order to achieve passenger interconnectivity, there
is a fundamental requirement for cooperation between all modes (e.g. road and
rail), between network levels (European, national, urban) and between different
operators (transport provider companies). The main problem is that each of the
aforementioned agents has his own single-mode planning perspective and
consequently his own priorities. The main barriers for the promotion of
‘company agreements’ serving interconnectivity purposes are the fare and
revenue setting in integrated systems as well as the joint management of
disruptions.
The fare setting constitutes a major problem for the feasibility of integrated
ticketing in many environments where for example air carriers, national
railways, regional and urban public transport operators have different fare
policies and models (e.g. time, zonal and distance related), making universal
tickets a difficult proposition. On the other hand, the revenue (and subsidy)
sharing in integrated ticketing systems entails the problem of fair income
division, which constitutes a major barrier to integrated ticketing systems as it is
difficult to practically monitor the complete movements of passengers within the
intermodal systems. Thus, it would be necessary to estimate which partner
should receive what proportion of income from common tickets, which leads to
difficulties of agreement.
So, as argued in the preceding point, the more important aspect is to relieve the
passenger of the anxiety related to the purchase of the ticket for the local trip at
the destination area. This should be possible and quite easy (in the logical
integration dimension) but not force the otherwise very complex agreements
required to have a really integrated fare for the complete journey.
Doc. Id: HERMES_WP6_IST_D6_Final
Doc. Title: Handbook on Enhanced Business Models
Doc. Version: Final
Contract: TCP8-GA-2009-234082
Date: 07 April2011 Page: 28 of 181
Furthermore, in case of disruptions in a multimodal system, there must be acute
intermodal passenger information requirements, real-time timetable
management and even strict emergency management procedures. These
prerequisites of common management of disruptions entail particular problems
of communication, management hierarchy, service planning and conflicting
priorities, especially where there is only horizontal co-operation of different
operators (between different modes).
In particular when the remuneration of operators is linked to the regularity of
their performance, any kind of operation integration is seen as internalization of
risks of underperformance by the partners for which there is generally no cover
in the contract between the local operator and the corresponding authority. So, if
this kind of cooperation is desirable (as we believe it is), this transfer of risks
must be recognized in the contracts for local transport and treated accordingly.
Concluding, the promotion of cooperation among operators in a competitive
environment requires intense public intervention, aiming at creating the
appropriate investment conditions for long-term flexible profit sharing
arrangements as well as encouraging special agreements have to been placed
between the different authorities (especially for cross-border operators).
2.1.2.5 Institutional Dimension
Institutional aspects are defined as the structural aspects of every entity
involved in the passenger intermodal chain, concerning mainly organizational
issues to achieve interconnectivity. Organizational and technical aspects are
strongly interrelated. While technical solutions to the problems of economical or
logical domain (e.g. integrated tariffs and ticketing) are already available and will
be further developed, the main obstacle is the existence of an institutional setting
promoting cooperative solutions, since one of the main obstacles identified is
the lack of co-operation-communication among stakeholders, especially for long-
distance and border crossing journeys, in order to establish common
organizational and interoperable procedures.

Contract: TCP8-GA-2009-234082
Authors: Macário, Reis, Viegas,
Magalhães
Partner Responsible: IST
Dissemination Level: CO
Page: 29 of 181 Date: 07 April 2012
The research has found that in spite of the importance of co-operation and
coordination of transport modes for the development of intermodality, the
general situation is that there are also no specific institutional guidelines to co-
ordinate intermodal planning and operations. Moreover, a major barrier
identified in many countries is the lack of interchange management as well as the
general perspective and ‘thinking’ of intermodality.
The institutional aspects of integration are clearly one of the areas still in need of
deeper research to overcome some of the “X-barriers” which existence is already
know but the cause and the antidote is still in need of further development.
2.1.2.6 Legal and Regulatory Dimensions
The literature review has shown that existing legal and regulatory frameworks
are generally not suited to enhance intermodality in the context of decentralized
transport markets that are increasingly opened to competition. Currently there
are no laws or regulations in place across Europe to treat intermodality as a
central issue. Neither the important aspect of co-operation for the optimal
development of long-distance passenger transport has been examined with the
proper attention, especially when many stakeholders are involved.
It has been concluded that in a number of countries and at the EU level, anti-
monopoly laws can prevent close co-operation of private sector activities, which
might lead to effective “cartel” status. Without suitable legal exceptions, this can
cause major problems for attempts to create seamless intermodal systems,
especially integrated products. Moreover in many cases, public transport
services subsidized by public money such as urban public transport and national
rail in many countries cannot in any way be allowed to “support” commercial
services such taxis or air carrier.
Another crucial issue with legal implications concerns data-sharing between
institutions and the private sector. Rather complete data provision to intermodal
information providers is needed for consistent and comprehensive services. Data
sharing is a problem when it relies on voluntary sharing between institutions.
The thinking of the operators as data generators is often proprietary and
Doc. Id: HERMES_WP6_IST_D6_Final
Doc. Title: Handbook on Enhanced Business Models
Doc. Version: Final
Contract: TCP8-GA-2009-234082
Date: 07 April2011 Page: 30 of 181
protective. When the private sector is involved in using public data, there are
difficulties with data quality, exclusivity agreements, unrealistic pricing and
cultural clashes between public service and profit motivations.
2.2 Barriers impacting the integration process and the stakeholders
2.2.1 Barriers impacting the integration
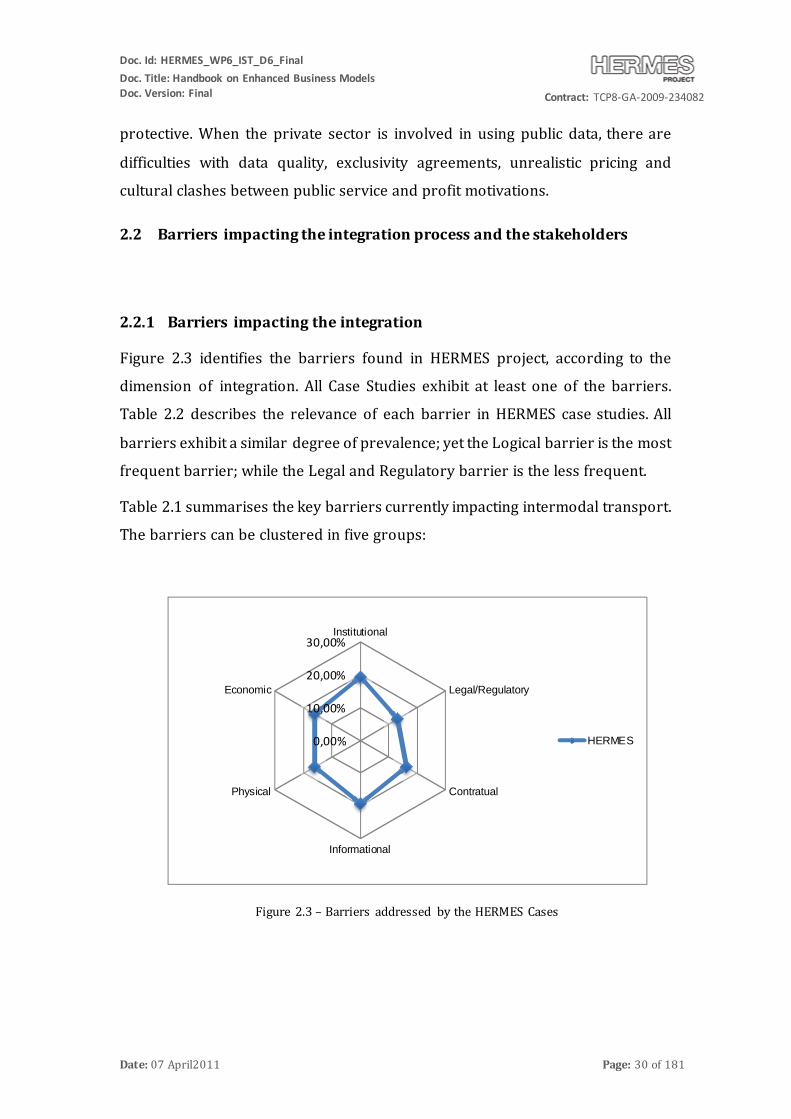
Figure 2.3 identifies the barriers found in HERMES project, according to the
dimension of integration. All Case Studies exhibit at least one of the barriers.
Table 2.2 describes the relevance of each barrier in HERMES case studies. All
barriers exhibit a similar degree of prevalence; yet the Logical barrier is the most
frequent barrier; while the Legal and Regulatory barrier is the less frequent.
Table 2.1 summarises the key barriers currently impacting intermodal transport.
The barriers can be clustered in five groups:
Figure 2.3 – Barriers addressed by the HERMES Cases
0,00%
10,00%
20,00%
30,00%Institutional
Legal/Regulatory
Contratual
Informational
Physical
Economic
HERMES

Contract: TCP8-GA-2009-234082
Authors: Macário, Reis, Viegas,
Magalhães
Partner Responsible: IST
Dissemination Level: CO
Page: 31 of 181 Date: 07 April 2012
Table 2.1 – Overview of identified barrier clusters
Cluster 1 Congested or inadequate infrastructure
Coordination of infrastructure management among involved stakeholdersDesign and financing of terminalsHigh costs and long-winded planning
Lack of an integrated terminal managementReluctance to open terminals for other modes
Cluster 2 Different ticketing systems, and timetablesDisintegrated ticketing and tariff systems
Lack of cooperation/ coordination among operatorsLack of incentives for operators
Cluster 3 Accessibility and price of intermodal ticketsInsufficient passenger information
Cluster 4 Conflicting interests of stakeholdersCoordination of operators with other stakeholders
Integration and coordination of actors with different responsibilitiesLack of a coordinating authority
Provision and exchange of information among actors
Cluster 5 Administrative and regulatory constraints
Different standards and regulationsLack of coordination among public authorities

Doc. Id: HERMES_WP6_IST_D6_Final
Doc. Title: Handbook on Enhanced Business Models
Doc. Version: Final
Contract: TCP8-GA-2009-234082
Date: 07 April2011 Page: 32 of 181
Table 2.2 - HERMES Cases: Barriers, Measures and Value Propositions Summary
Case Study Barriers Addressed Measures Proposed/Impacted
Central theme of Value Proposition
I LR C L P E I LR C L P E
CS1: Gothenburg Central Station
* * Increase information quality and standard in station.
CS2: Arlanda International Airport
* * * Cooperation between Terminal Manager & Transport Operator.
CS3: Avenida de America Interchange Madrid * * * * * *
Cooperation between Terminal Manager & Transport Operator (smoother integration of the transport services).
CS4: Long Distance Bus * * * * * * * * * * * * Improvement of terminal’s information to customers.
CS5: Peloponnese-Crete * * * * * * * New Intermodal Transport Service .
CS6: Gare de Oriente * * * * * * New Intermodal Transport Service.
CS7; Faro International Airport
* * * * * * * * New Transport Operator (FCTS).
CS8: Antwerp Airport * * * * * Enhance Public Transport Service.
CS9: Port of Patras * * * * * * * *
Improvement of terminal’s information and cooperation between terminal manager and transport operators.
CS10: Intermodal Network of Lyon Metropolitan Area
* * * * * * * * Improvement of passengers’ flow by rearrangement of terminals’ functions.
CS11: Frankfurt-Hahn Regional Airport
* * * * * * Enhance access and egress by Public Transport service. Revival of Train Service.
Key:Barriers/ Measures: I : Institutional; LR: Legal and regulatory; C: Contractual; L: Logical; P: Physical; E: Economic

Contract: TCP8-GA-2009-234082
Authors: Macário, Reis et al.
Partner Responsible: IST
Dissemination Level: CO
Page: 33 of 181 Date: 07 Apri l 2012
As shown in
Table 2.1, there are five clusters of barriers, which are referred to as challenges for
the improvement of intermodality/ interconnectivity of passenger transport.
These are summarised below:
The challenge of improving physical interfaces, referring to barriers, which are
related to physical elements of the intermodal transport chain. The issues that
arise are mainly related to the planning and design of terminals, the capacity of the
infrastructure, as well as the management of physical interfaces. Following the
outcomes of the HERMES Seminar in Berlin, this challenge should not only address
‘hard infrastructure measures’, but also ‘soft measures’, such as improving the
lightning in stations, optimising the visual orientation or the provision of elevators.
The challenge of cooperation among operators, representing barriers, which
are related to the cooperation and coordination among operators. The
corresponding issues comprise integrated planning of services, coordinated
schedules, integrated ticketing systems, the exchange and harmonisation of
information, as well as common operational standards.
The challenge of passenger information and ticketing integration, referring to
barriers, which are related to insufficient and non transparent information for
passengers and inconvenient or non-existing integrated ticketing systems. It
therefore particularly represents barriers for using intermodal transport services
from the perspective of passengers.
The challenge of coordinating different stakeholders, embracing barriers,
which are related to the cooperation and integration of the variety of
heterogeneous actors, their different interests and responsibilities and the
difficulties to coordinate their activities. Following the lessons learnt on the
HERMES Seminar, the scope of relevant stakeholders may not necessarily be
restricted to public decision makers, transport operators, terminal managers and
user associations. In several cases, the (rail) infrastructure manager needs to be
considered as an individual stakeholder, too.
The challenge of coordinating public activities, representing barriers, which are
related to public authorities and their influence on the provision and improvement

Doc. Id: HERMES_WP6_IST_D6_Final
Doc. Title: Handbook on Enhanced Business Models
Doc. Version: Final
Contract: TCP8-GA-2009-234082
Date: 07 April2011 Page: 34 of 181
of intermodal transport services. The integration of public planning on different
administrative levels and the homogenisation of regulations are core aspects of
this cluster. Outcomes of the HERMES Seminar emphasise the requirement that at
an early planning stage infrastructure planning needs to be integrated/vielleicht
aligned with the requirements of operators.
The identified clusters of intermodality and interconnectivity barriers have been
analysed with respect to the HERMES stakeholders (transport operators, terminal
managers, public decision makers and user associations) in a more detailed way by
Fluhrer, Szimba and Siegele (2011).
In the previous section, the cross-contextual clustering of barriers was described.
Figure 2.4 shows the thematic relations between clusters and domains, which
subsequently are further described for each cluster.
Figure 2.4 – Relation between barrier clusters and the domains of intermodality
Cluster 1 is mainly related to the physical domain, which comprises physical/
technical aspects at terminals and at the interconnection of infrastructures of
different modes. Relevant issues within this domain are the definition of safety and
Barrier clusters
Cluster 1- The challenge of improving physical interfaces
Cluster 2- The challenge of cooperation among operators
Cluster 3 - The challenge of passenger information and ticketing deficits
Cluster 4- The challenge of coordinating different stakeholders
Cluster 5- The challenge of coordinating public activities
HERMES_domains
Physical
Economic
Informational
Contractual
Legal/Regulatory
Institutional

Contract: TCP8-GA-2009-234082
Authors: Macário, Reis et al.
Partner Responsible: IST
Dissemination Level: CO
Page: 35 of 181 Date: 07 Apri l 2012
comfort standards, the extension and improvement of physical links at terminals
and in the network, as well as a coordinated management of operations at
terminals.
Cluster 2 covers issues of cooperation between transport operators and is
therefore related to the contractual domain. Economic and informational aspects
are also concerned in the way that operators need to coordinate the exchange of
information on transport services as well as ticketing systems in order to improve
intermodal transport services.
Cluster 3 is both related to the informational and the economic domain. While
issues of optimal provision of information are treated in the informational domain,
items like transparent, affordable integrated ticketing offers are the central topic of
the economic domain.
Cluster 4 has direct correlations to the institutional, contractual and informational
domain. Contractual aspects play a central role in the coordination of stakeholders
as binding agreements are an important instrument for the coordination of
activities between actors. Institutional aspects are important in so far as
independent bodies can promote the coordination of actors and supervise the
adherence to agreements. Since the exchange of information is of central
importance for the coordination of activities among stakeholders, informational
aspects are also particularly relevant for this cluster. Legal and regulatory aspects
play a role in the coordination between public authorities and other stakeholders
and are therefore also treated in this cluster.
Cluster 5 is related to the institutional domain since it covers barriers which have
their roots in the lack of coordination among public authorities and institutions.
Further, the cluster it is related to the legal/ regulatory domain in so far as barriers
like regulatory and administrative constraints can be traced back to public
activities.

Doc. Id: HERMES_WP6_IST_D6_Final
Doc. Title: Handbook on Enhanced Business Models
Doc. Version: Final
Contract: TCP8-GA-2009-234082
Date: 07 April2011 Page: 36 of 181
2.2.2 Barriers impacting the stakeholders
2.2.2.1 Stakeholders in the Transport Sector
A key aspect in the analysis of the barriers is the definition of the stakeholder,
which is identifying the barrier. Each stakeholder has a unique perspective,
objective and goals. Therefore, a given barrier will be certainly perceived
differently by different stakeholders.
We considered four groups of stakeholders:
• Public decision makers,
• Terminal managers,
• Transport operators,
• User’s associations.
Follows a brief explanation of each one.
G1: Public Decision Makers
This group comprises representatives from ministries as well as regional or local
transport authorities. Their tasks and responsibilities are among others related to
transport planning, passenger flow coordination, tendering of transport services,
supervision of services, regulation and standardisation of requirements, public
administration and traffic management. Representatives of the House of Commons
of the Czech Republic Parliament, of the Danish Transport Authority (DTA) or of
the Hamburg public transport association are examples for respondents contained
in this group.
G2: Terminal Managers
This group comprises interchange managers who are responsible for the
operational and performance management of specific intermodal stations and
terminals. The respective institutions or companies can be independent entities or
entities related to a public authority or private transport operator. Examples for
respondents contained in this group are the intermodality manager for the Air-Rail
interchange of Frankfurt-Main airport Fraport, the Head of Development and

Contract: TCP8-GA-2009-234082
Authors: Macário, Reis et al.
Partner Responsible: IST
Dissemination Level: CO
Page: 37 of 181 Date: 07 Apri l 2012
Regulation of Brussels Airport or the Corporate Affairs Manager of Budapest
Ferhegy International Airport.
G3: Transport Operators
This group comprises operators of the modes air, rail, bus and ferry dealing with
long- and short-distance transport services. Representatives of the German airline
Air Berlin, of the Czech Railways, of the European long-distance bus operator
Touring/ EUROLINES or of the Italian ferry operator SNAV (Societe Navigazione
Alta Velocita) are examples for respondents contained in this group.
G4: User Associations
This group comprises consumers associations and passenger representatives as
well as national, regional or local users organisations. Representatives of the rail
transport user association Lyon Métro Transports Publics - FNAUT (Fédération
Nationale des Associations d'Usagers des Transports) or of the German consumer
association vzbv (Verbraucherzentrale Bundesverband) are examples for
respondents contained in this group.
There are stakeholders that establish relations with almost all intermodal players
of the several transport means: they are the travel stakeholders. A travel
stakeholder is any individual or company that sells, resells, or offers to sell travel
tickets, makes or offers to make travel arrangements or advertises any of those
things. Many businesses are regarded as travel stakeholders, including retail and
corporate stakeholders, tour wholesalers, consolidators, inbound tour operators,
general sales stakeholders, some bus or coach operators and some airlines. In this
way, contracts and responsibilities must be set down between travel stakeholders
and providers of transport services and even authorities, so that the transport
activity can be performed in a legal way.
So, to think about intermodal passengers transport systems it is to think about a
system which main result is the transportation of passengers from an origin to a

Doc. Id: HERMES_WP6_IST_D6_Final
Doc. Title: Handbook on Enhanced Business Models
Doc. Version: Final
Contract: TCP8-GA-2009-234082
Date: 07 April2011 Page: 38 of 181
destination. In this process, given the integration of several transport means in the
same route, one must think about terminals. Indeed, intermodal terminals, as
airports, stations, or ports, congregate several transport modes. In a certain route,
a passenger can use one or more terminals to achieve the destination (Collet et al,
2008). In Figure 2.5 it is possible to see one example of a route and the several
terminals that can be used to make it.
Figure 2.5 – Terminal Approach of Intermodality, Home and Destination Based Access and Egress Modes Schema (Source: Collet et al., 2008)
Regarding it, one can understand the interdependencies of some of the
stakeholders previously described. For instance, if a traveler purpose is to leave
home and arrive to its destination at a specific time, then the several transport
operators must be integrated in a way that the end time of one leg happens before
the star time of another leg of the route. For this, there must be a terminal that
tries to coordinate schedules and provide up-to-date information to travelers.
However, the producers of transport means should develop vehicles and other
devices that meet travelers and transport operators’ needs. Above this level,
authorities should guarantee minimum services of level.
The existence of a great variety of stakeholders in an intermodal chain often
hinders the development of the transport activity. In fact, interests, roles and
objectives of the several intermodal stakeholders described in the past paragraphs
justify the difficulty inherent to an optimization of the transport network.
Meersman et al. (2000) states that the objectives of each transport player are not

Contract: TCP8-GA-2009-234082
Authors: Macário, Reis et al.
Partner Responsible: IST
Dissemination Level: CO
Page: 39 of 181 Date: 07 Apri l 2012
only different, as also change consonant one focus in the medium term or in the
long term.
Table 2.3 – Objectives of the several stakeholders in an intermodal transportation system (source: meersman et al, 2000, adapted)
Stakeholder / Period
Time Long term
Medium Term (help to realize the long term ones and
are more specific and easier to control)
Consumer / User of
passenger public
transport systems
Inter-temporal utility
maximization
Punctuality and reliability, good connections and an
optimal price/quality relation
Transport Operators
& Terminal
Managers
Profit maximization
Profit Maximization: the way in which is realized will
depend upon a number of intermediate targets such as the
generation of added value, the increase of the market share,
the improvement of safety and quality, etc. Which of those
objectives are actually emphasized, will depend upon a
number of factors such as the market structure, the mode
and type of transport, the capital and ownership structure,
etc
Public Authorities
Maximization of social
welfare. In general this
implies guaranteeing
economic efficiency and
fair competition, safety
and minimization of
negative external
effects
It will depend largely upon the mode of transport and the
actual legal and market structure of the type of transport.
To improve competition within and between modes, the
intermediate targets are amongst others: fair and efficient
pricing with internalization of external costs, transparency
of the market, facilitation of market access, harmonization
of competitive terms, etc. For the reduction of negative
external effects a number of medium targets such as
internalization of the external costs, the reduction of
accidents, the promotion of public transport, etc., can be
set.
Consequently, to assure that transportation of passengers is developed in an
integrated way, taking advantage of the best characteristics of each transport
mode, it is necessary to define minimum quality standards. In this way, the
different stakeholders must be interlinked in order to canalize their scarce

Doc. Id: HERMES_WP6_IST_D6_Final
Doc. Title: Handbook on Enhanced Business Models
Doc. Version: Final
Contract: TCP8-GA-2009-234082
Date: 07 April2011 Page: 40 of 181
resources to a shared objective: provide the best quality of transportation services
concerning its own resources.
2.2.2.2 Nature of the Barriers
Figure 2.6 presents the results of a major survey conducted in HERMES project to
the stakeholders. Among others, a purpose was to assess the relevancy of barriers
for each dimension of intermodality. Public decision makers are highly aware of
the challenge of coordination among different stakeholders, while user association
highlights the challenge of coordination of public activities. From the viewpoint of
transport operators, the coordination of services among transport operators
themselves and the improvement of physical interfaces play a main role. Terminal
managers regard the challenge of cooperation among transport operators the most
important barrier. Thus, stakeholders tend to assign the responsibility for certain
barriers to the field of duty of other actors.
Figure 2.6 – Barriers by Intermodality Domains as perceived by stakeholder groups
2.2.2.2.1 Group 1: Public Decision Makers
2.2.2.2.1.1 Interconnectivity Barriers
a) Legal/regulatory
• Complex legal framework
0,00%
10,00%
20,00%
30,00%Institutional
Legal/Regulatory
Contratual
Informational
Physical
EconomicGroup 1: Public DecisionMakers
Group 2: Terminal Managers
Group 3: Transport Operators
Group 4: Users' Associations

Contract: TCP8-GA-2009-234082
Authors: Macário, Reis et al.
Partner Responsible: IST
Dissemination Level: CO
Page: 41 of 181 Date: 07 Apri l 2012
• It’s hard to monitor a deregulated market
• Absence of implementation of existing intermodality policy by national governments
• Environmental rules curb the intermodality (e.g. standards on noise)
• Absence of planning
b) Institutional
• Lack of a coordinating authority
• Lack of cooperation between operators
• Lack of institutional cooperation between the central and the local level
• Several actors with different responsibility
• Too many different institutions to fulfill the same tasks
c) Contractual
• Absence of common standards in contracts
• Absence of incentives for intermodality (transport operators)
d) Informational
• Lack of a coordinating authority to define information standards
• It is necessary to create an integrated information system
e) Physical
• Absence of cooperation
• No right to change or extend the interchange
f) Economic
• Complex economic framework
• Other revenue should be charged to cross-subsidise other infrastructure facilities
2.2.2.2.1.2 Interconnectivity Measures
a) Legal/regulatory
• Integrated transport planning which requires legislative changes
• Create or improve regulation on intermodality and integrated tariff (ticketing)

Doc. Id: HERMES_WP6_IST_D6_Final
Doc. Title: Handbook on Enhanced Business Models
Doc. Version: Final
Contract: TCP8-GA-2009-234082
Date: 07 April2011 Page: 42 of 181
• Greater focus on intermodal transport network planning
• To improve passenger rights
b) Institutional
• Creation of a true transport authority with real powers regarding
planning, funding and regulation
• A coordination body should be create to improve intermodality
• Review of existing policy and implementation of policy with cooperation with all stakeholders
• Short-distance railway stations should be managed by local operators
c) Contractual
• To introduce incentives for operators
• To establish agreements with the responsibles of customers/passengers
g) Information
• Absence of common standards in contracts
• Absence of incentives for intermodality (transport operators)
h) Physical
• Absence of common standards in contracts
• Absence of incentives for intermodality (transport operators)
i) Economic
• Absence of common standards in contracts
• Apply new charging system to supply better services
2.2.2.2.2 Group 2: Terminal Managers
2.2.2.2.2.1 Interconnectivity Barriers
a) Legal/regulatory
• Intermodality has not been part of planning processes of existing infrastructure
• Different regulation in different countries or cities
• There are no homogeneous standards for information services and
safety aspects

Contract: TCP8-GA-2009-234082
Authors: Macário, Reis et al.
Partner Responsible: IST
Dissemination Level: CO
Page: 43 of 181 Date: 07 Apri l 2012
• The planning times in the political process (e.g. for an extension of the
airport) are too long
• There are lots of single (correcting) measures to improve
interconnections between modes but there is no central long term planning
b) Institutional
• Lack of cooperation among transport modes
• The market is very irregular: there are a lot of players, with different agreements
• Different authorities and directors lead to diffuse responsibilities
• There are often different own interests of politicians and transport
operators
c) Contractual
• Lack of temporal coordination among transport operators
• The economic aims of transport operators and terminal managers are different
• Conflict of interests (business vs. public interests)
d) Information
• Absence of common standards in contracts
• Absence of incentives for intermodality (transport operators)
e) Physical
• Absence of common standards in contracts
• Absence of incentives for intermodality (transport operators)
f) Economic
• Absence of common standards in contracts
• Absence of incentives for intermodality (transport operators)
2.2.2.2.2.2 Interconnectivity Measures
a) Legal/regulatory

Doc. Id: HERMES_WP6_IST_D6_Final
Doc. Title: Handbook on Enhanced Business Models
Doc. Version: Final
Contract: TCP8-GA-2009-234082
Date: 07 April2011 Page: 44 of 181
• More centralised and more long-term oriented planning of
infrastructure under consideration of all levels (modes) of the transport chain
• Adaptation to the growing market!
• Transport interchanges' planning
• Introducing planning systems promoting the use of different transport modes
b) Institutional
• Terminal Managers should get more decision power
• Development of a legal body which will be in charge of the intermodal chain (all intermodal agents should participate in it)
• Metropolitan authority should take a more active role
• The management should be external (not internal institutions)
c) Contractual
• Agreement on a common understanding of intermodality, its costs and benefits among transport operators
• To find the system how to motivate transport operators who provide services on their own risk to cooperation – for example some bonus
program
d) Information
• Absence of common standards in contracts
• Absence of incentives for intermodality (transport operators)
e) Physical
• Absence of common standards in contracts
• Absence of incentives for intermodality (transport operators)
f) Economic
• Absence of common standards in contracts
• Absence of incentives for intermodality (transport operators)
2.2.2.2.3 Group 3: Transport Operators

Contract: TCP8-GA-2009-234082
Authors: Macário, Reis et al.
Partner Responsible: IST
Dissemination Level: CO
Page: 45 of 181 Date: 07 Apri l 2012
The main findings concerning Transport Operators’ perspective are presented in
this section.
2.2.2.2.3.1 Interconnectivity Barriers
a) Legal/regulatory
• Long-winded planning and licensing processes before investments in
infrastructure can be made
• Lack of simple technical standards
• Too much regulation on the issue
b) Institutional
• Too many institutions that want to control and coordinate
• Cultural, political and institutional barriers that causes a lack of planning activities
• Absence of an entity / authority that coordinates the provision of operators
• Too much administrative constraints
c) Information
• Absence of common standards in contracts
• Absence of incentives for intermodality (transport operators)
d) Physical
• Absence of common standards in contracts
• Absence of incentives for intermodality (transport operators)
e) Economic
• Absence of common standards in contracts
• Absence of incentives for intermodality (transport operators)
2.2.2.2.3.2 Interconnectivity Measures
a) Legal/regulatory
• Facilitation of planning and licensing processes for infrastructure projects, particularly in terms of capacity and accessibility of airports
Doc. Id: HERMES_WP6_IST_D6_Final
Doc. Title: Handbook on Enhanced Business Models
Doc. Version: Final
Contract: TCP8-GA-2009-234082
Date: 07 April2011 Page: 46 of 181
• Raising the interest in intermodality from the demand side (higher
willingness to pay)
• Quality transport planning and realization of its outputs should be
enhanced
• To introduce common guidelines for information services
• Integrated planning of services and terminals
b) Institutional
• Need for an entity that undertakes / contracted with the operators and
pay the intermodality which is expected from a given region
• More attention to the intermodal passenger transport by the Public Administration
• Create an effective management of the terminals
c) Contractual
• To leave initiative to global operator to mix long and short distance
networks in a global contract with passenger
• To introduce specific budgets for long-/short distance intermodality
• To make contracts more transparent so that agents can learn from each other
d) Information
• Absence of common standards in contracts
• Absence of incentives for intermodality (transport operators)
e) Physical
• Absence of common standards in contracts
• Absence of incentives for intermodality (transport operators)
f) Economic
• Absence of common standards in contracts
• Absence of incentives for intermodality (transport operators)
2.2.2.2.4 Group 4: Users Associations
The main findings concerning Users Associations’ perspective are presented in this
section.

Contract: TCP8-GA-2009-234082
Authors: Macário, Reis et al.
Partner Responsible: IST
Dissemination Level: CO
Page: 47 of 181 Date: 07 Apri l 2012
2.2.2.2.4.1 Interconnectivity Barriers
a) Legal/regulatory
• Intermodality is not part of the planning process
• Lack of integration with soft modes, such as bicycles
• There are not enough intermodal offers or they are not noticed by customers, which leads to a low demand
b) Institutional
• Different companies/organisations are involved when transport nodes are concerned (transport operators, infrastructure managing company,
cities, provinces,…) and there is lack of coordination among them
• Lack of city or local participation in stations’ activities
• Transport Operators are very competitive
• Lack of willingness from the side of Transport Operators to cooperate
with each other
c) Information
• Absence of common standards in contracts
• Absence of incentives for intermodality (transport operators)
d) Physical
• Absence of common standards in contracts
• Absence of incentives for intermodality (transport operators)
e) Economic
• Absence of common standards in contracts
• Absence of incentives for intermodality (transport operators)
2.2.2.2.4.2 Interconnectivity Measures
a) Legal/regulatory
• To include the topic (i.e. intermodality) in the urban planning
• Legislative adjustment in the delay sanctions area
• Integration of no-motorised modes in the intermodal chain
• Development of strategies to promote and facilitate intermodality

Doc. Id: HERMES_WP6_IST_D6_Final
Doc. Title: Handbook on Enhanced Business Models
Doc. Version: Final
Contract: TCP8-GA-2009-234082
Date: 07 April2011 Page: 48 of 181
• Structured transport policy with regard to intermodality with the
participation of all stakeholders and especially the users' associations
b) Institutional
• Transport Operators should work together and look at the other as complementary
• The establishment of a central regulating and planning body
• Continuous communication between the different operators and authorities
• An integrated organization of railways (with private and public
companies) against motorways
c) Information
• Absence of common standards in contracts
• Absence of incentives for intermodality (transport operators)
d) Physical
• Absence of common standards in contracts
• Absence of incentives for intermodality (transport operators)
e) Economic
• Absence of common standards in contracts
• Absence of incentives for intermodality (transport operators)
2.3 Analytical framework for business models
Business Model is a buzz word concept in the business and scientific world. Indeed,
the literature is populated with multiple definitions and there is no generally
accepted definition of the term ‘‘business model’’. Diversity in the available
definitions poses substantive challenges for delimiting the nature and components
of a model and determining what constitutes a good model. Moreover, the business
model term has been referred to as architecture, design, pattern, plan, method,
assumption, and statement (Morris et al., 2003).
Business models describe or prescribe more specifically how resources are
combined and transformed in order to generate value for customers and other
stakeholders, and how a value generating company will be rewarded by its

Contract: TCP8-GA-2009-234082
Authors: Macário, Reis et al.
Partner Responsible: IST
Dissemination Level: CO
Page: 49 of 181 Date: 07 Apri l 2012
exchange partners that receive value from it (Magretta, 2002). Conceptualizations
of business models increasingly suggest that a firm can have several business
models. Whereas strategy emphasizes competition, business models build more on
the creation of value for customers (Morris et al., 2003). In that respect business
models are typically developed from a more narrow perspective that a strategy.
Business models relate to value chains (Porter, 1985), value streams (Davies,
2004), and value constellations (Normann and Ramirez, 1994) among multiple
business actors. However, how business models are configured and combined in
project business is largely unexplored territory (Wikström et al., 2009).
In other words, for business models, the quest is to identify the elements and
relationships that describe the business a company does. Thus, the business model
concept can best be understood as a conceptual view of a particular aspect of a
specific company. The meta-model then defines the words and sentences that we
use to describe this view (that consist of elements and relationships that reflect the
complex entities that they aim to describe) (Osterwalder et al., 2005).
In face of the multiple proposals, this handbook follows the proposal brought
forward by Alexander Osterwalder. This author defines business models as being
“the rationale of how an organization creates, delivers, and captures value”
(Osterwalder, 2004). Accordingly with this author a business model is the
description of the value that a company offers to one or several segments of
customers and of the architecture of the firm and its network of partners for
creating, marketing, and delivering this value and relationship capital, to generate
profitable and sustainable revenue streams (Osterwalder, Pigneur and Tucci,
2005). A prototype of business models is a “thinking tool” (Osterwalder, 2010, pp
162) to support and guide the actual development of the business model by the
interested stakeholders. As Osterwalder writes “prototypes of business models
may be thought-provoking – even a bit crazy – and thus help push out thinking.
When this happens, they become signposts pointing us in as-yet unimagined
directions rather than serving as mere representations of to-be-implemented
business models” Osterwalder, 2020). As such, a prototype does not intend to

Doc. Id: HERMES_WP6_IST_D6_Final
Doc. Title: Handbook on Enhanced Business Models
Doc. Version: Final
Contract: TCP8-GA-2009-234082
Date: 07 April2011 Page: 50 of 181
provide a rough or fixed picture of what the actual business models should be, but
simply to guide and present suggestion for the design of superior business model.
Consequently, the prototype must focus on key or fundamental aspects of the
business model and, thus, indicating directions and paths for exploring alternative
designs, which ultimately will lead to superior business models.
Figure 2.7 presents the framework – or canvas – as proposed by Osterwalder for
the analysis of business models. The author claims that any business model can be
fully characterized in nine dimensions – or building blocks, being: Customer
Segment; Value Propositions; Channels; Customer Relationships; Revenue Streams;
Key Resources; Key Activities; Key Partnerships; Cost Structure.
Figure 2.7 - Business Model Canvas (source: Osterwalder et al., 2010)
• Customer Segment – specifies for whom are the company creating value
since an organization serves one or several customer segments;
• Value Propositions – it seeks to solve customer problems and satisfy
customer needs with value propositions;

Contract: TCP8-GA-2009-234082
Authors: Macário, Reis et al.
Partner Responsible: IST
Dissemination Level: CO
Page: 51 of 181 Date: 07 Apri l 2012
• Channels – Value propositions are delivered to customers through
communication, distribution, and sales channels;
• Customer Relationships – are established and maintained with each
customer segment;
• Revenue Streams – result from value propositions successfully offered to
customers;
• Cost Structure – reflects the mix of activities performed to achieve the value
proposition;
• Key Resources – the assets required to offer and deliver the previously
described elements;
• Key Activities – activities, distribution channels, customer relationships and
revenue streams that the value proposition requires;
• Key Partnerships – some activities are outsourced and some resources are
acquired outside the enterprise;
Osterwalder’s canvas can be interpreted as follows. Any organization serves one or
more customer segments, by serving their problems and satisfying their needs
through value propositions. The value propositions are conveyed to customers via
multiple channels (including: communication, distribution or sales). Consequently,
customer relationships are established, nurtured and ideally reinforced over time
with each customer segment and through a continuous adjustment in the value
propositions. Indeed, successful value proposition will result in good customer
relationship and in a permanent revenue stream, which is the ultimate goal of any
company. Key activities are required to fulfil the value propositions. Some of these
key activities are produced by key resources while others are outsources and even
acquired outside the enterprise, through key partnerships. Naturally, the various
elements of the business model, in particular, the key activities, key resources and
key partnerships, results in the cost structure of the activity.

Doc. Id: HERMES_WP6_IST_D6_Final
Doc. Title: Handbook on Enhanced Business Models
Doc. Version: Final
Contract: TCP8-GA-2009-234082
Date: 07 April2011 Page: 52 of 181
3 Business Models for Improved Intermodality
This is the central chapter of the handbook. It explains how to improve the current
business model to achieve higher levels of performance. It starts with a brief
discussion about the location of the barriers. Knowledge on the location of the
barriers is important to determine which prototype of business model to deploy.
The prototypes are then sketched. Finally, each building block of the analytical
framework is then fully described in four steps, being:
• Definition of the building block;
• Analysis of the current status (of the business model);
• Prototypes for improving the performance of the intermodal transport service;
• Proposals for implementing the prototypes.
At the end of this chapter, the reader will be able to understand, choose and
implement measures to enhance the current business model of a given real-world
intermodal transport service.
3.1 Location of the Barriers
A total of eleven Case Studies2 have been developed in HERMES project. They are
now listed:
1. Case Study 1: Gothenburg Central Station (Sweden);
2. Case Study 2: Arlanda International Airport (Sweden);
3. Case Study 3: Avenida de América Interchange Madrid (Spain);
4. Case Study 4: Long distance bus services connected with high speed with
high speed rail services (Spain);
5. Case Study 5: Extension of the Adriatic-Ionian ferry corridor from
Peloponnese to Crete (Greece);
6. Case Study 6: Gare do Oriente Interchange Station and Connection with
Linha do Norte Railways (Portugal);
7. Case Study 7: Faro International Airport (Portugal);
2 The Case Studies are briefly described in Annex II. For a complete presentation of each Case Study, the interested reader is referred to Lundin et al. (2011).

Contract: TCP8-GA-2009-234082
Authors: Macário, Reis et al.
Partner Responsible: IST
Dissemination Level: CO
Page: 53 of 181 Date: 07 Apri l 2012
8. Case Study 8: Antwerp Airport (Belgium);
9. Case Study 9: Port of Patras (Greece);
10. Case Study 10: Part-Dieu Station at Lyon (France);
11. Case Study 11: Frankfurt-Hahn Airport (Germany).
For each case study, potential barriers for improved intermodality were located.
Table 3.1 summarises the results.
Table 3.1 - Main problem of each case study
Case Study Main Barrier at the site
Faro International Airport Lack of integration between the air and the land-based transport services
Antwerp Airport Absence of transport connections
Frankfurt-Hahn Regional Airport Lack of public transport modes
Stockholm-Arlanda International Airport
Poor public transport utilization
Gothenburg Central Station Non-coordinated information to passengers
Avenida de America Interchange Madrid
Poor signaling, lack of physical integration, inadequate relationships between agents
Long Distance Bus (Zaragoza + Lleida)
Low integration between transport services, bad information or signaling, lack of physical integration and non-adequate relationship between agents
Gare de Oriente Interchange Station and connection with Linha do Norte Railway
Low quality service link
Part-Dieu Station Lyon Absence of real-time information system to passengers/transport operators and terminal manager
on the station, un-coordinated timetable between transport modes, low quality passengers flows, poor conditions for disabled people
Corridor Peloponnese-Crete Alternative –optimised- network service solution for connecting the Adriatic corridor to Crete
Port of Patras Lack of information, bad transfers, absence of integrated tickets, un-coordinated timetables between transport modes.
The Case Studies differ substantially at several levels, such as: types of modes of
transport, element of analysis of the transport service (e,g,: terminal, corridor,
etc.), geographical location, or legal context. Nevertheless, similarities between the
problems affecting intermodal transport are visible and identifiable. . Indeed, we

Doc. Id: HERMES_WP6_IST_D6_Final
Doc. Title: Handbook on Enhanced Business Models
Doc. Version: Final
Contract: TCP8-GA-2009-234082
Date: 07 April2011 Page: 54 of 181
have concluded that the barriers can be clustered in two groups of fundamental
barriers or gaps. The gaps are:
• Type 1: Barriers related with the Intermodal links – the barriers are related with lack or poor integration of the transport services that,
consequently, undermine the performance of the intermodal transport. In this type, problems reach farther than just at the point of connection
of services.
• Type 2: Barriers related with the transfer node – the barriers are
related with the inadequate characteristic of the intermodal transfer point, the make difficult the transfer process between the modes of
transport.
The following picture distributes the Case Studies for the two types of barriers.
Figure 3.1 – Barriers of the HERMES Case Studies
In what concerns barriers of Type 1 (link), they may arise due to either a
missing link or a low quality link. In the former case (missing link), there is no
short distance transport service to integrate with the long distance. Passengers
travelling in the long distance service, when arriving to destination, have no
integrated service for the short distance. Instead, they have to build their
transport chain, leg by leg. Case studies in this situation include CS4, CS5, CS7,
Gothenburg Station (SE)
Av América Station (SP)
Part-Dieu (FR)
Stockholm Arlanda Airport (SE)
Port of Patras (EL)
Zaragoza-Lleida Corridor (SP)
Adriatic-Ionian corridor (EL)
Oriente Interchange (PT)
Faro Airport (PT)
Antwerp Airport (BE)
Frankfurt Hahn Airport (GE)
Ty
pe
2 B
arr
iers
-N
od
es
Ty
pe
1 B
arr
iers
-Li
nk
s

Contract: TCP8-GA-2009-234082
Authors: Macário, Reis et al.
Partner Responsible: IST
Dissemination Level: CO
Page: 55 of 181 Date: 07 Apri l 2012
CS8 and CS11. In the latter case (low quality link), there are short distance
transport services, but the integration level is so poor and low quality that, in
practical terms, the passengers have to build their transport chain leg by leg.
Case studies in this situation include CS6.
Practical examples of these barriers found in the case studies include the
following list:
• Non-coordination of schedules (e.g.: CS7);
• Absence of (short distance) service (e.g.: CS5 and CS11);
• Non-tariff integration (e.g.: CS4);
• No joint marketing initiatives (e.g.: CS8);
• Incomplete information (e.g.: CS11);
• Lack of strategic alignment between agents (e.g.: CS5)
• Low level of service (e.g. CS6)
Looking now to barriers of Type 2 (Node), three types have been identified,
namely:
• Logical barriers (Case Studies: 1, 3, 4, 9, 10)
• Physical barriers (Case Studies: 3, 4, 9, 10)
• Institutional barriers (Case Studies: 1, 2, 3, 9, 10)
Each type of barrier presents specific characteristics and properties. In what
concerns the logical barriers, examples include lack of or unclear information
to passengers, on either the transport services (routes, frequencies, tariffs or
schedules) or on the layout of the terminal (location of quays or ticket
machines). The physical barriers are those that appear in a wider array of
forms and aspects, in overall terms they are all related with the inadequate
architectonical and functional design of the terminal. Such inadequacy induces
multiple problems, such as: lack of or low legibility (difficult to understand on
how to move between places); long walking distances, location of related
functional areas in different floors, etc.) or, even, lack or insufficient equipment
to easy movement within the terminal (lack of elevators, escalators, etc.). Some
case studies also identified as a barrier for intermodality, the low comfort of

Doc. Id: HERMES_WP6_IST_D6_Final
Doc. Title: Handbook on Enhanced Business Models
Doc. Version: Final
Contract: TCP8-GA-2009-234082
Date: 07 April2011 Page: 56 of 181
the stations. Comfort is related with the adequate illumination, perception of
safety, or temperature, as well as properly dimensioned seating areas when
there are services with low frequency of departure.
Finally, in what concerns the institutional barriers, the typical one was related
with an inadequate governance structure of the transfer point. Indeed, multiple
stakeholders operate within a transfer point. However, often their roles are not
clear or are incorrectly assigned, resulting in a highly bureaucratic and
inefficient system. In Case Study 4, the transport operators can only formally
communicate with each other through a ladder in the respective hierarchies,
which in practical terms prevents any communication.
3.2 Prototypes of Business Models
As detailed in the previous chapter, two fundamental barriers or gaps for
improved intermodal can be identified, being:
• Gap 1 - Low integration between transport services.
• Gap 2 – Inadequate intermodal transfer conditions.
Gap 1 refers to the cases with no or poor integration between transport services. In
these cases the transport operators operate largely in an isolated way with no or
low interaction with each other. Gap 2 refers to the cases with a poor or
inadequate intermodal transfer conditions. In these cases the passengers feel more
or less difficulties to transfer in an easy and efficient way between transport
modes. Each gap was then thoroughly analysed and decoupled into its fundamental
components.
Consequently, in this Handbook we propose two prototypes of business models.
Each one is meant to provide guidance and point paths for overcoming a specific
gap for improved intermodality. The presentation of the prototypes of business
models will follow the framework of Osterwalder for an easy interpretation.
As already discussed, a prototype of business model is not expected to be either, a
blue-print for, nor a one-fit-all solution of a business model. Instead the prototype
provides guidance and show possible paths, so that, in the actual moment of

Contract: TCP8-GA-2009-234082
Authors: Macário, Reis et al.
Partner Responsible: IST
Dissemination Level: CO
Page: 57 of 181 Date: 07 Apri l 2012
construction and based on real and accurate figures and constrains, a superior
business model could be achieved.
Business model are commonly utilized to describe the activity of a given company
or organization. In the case of an intermodal transport service, we have multiple
stakeholders with different perspectives and objectives. As such, there is the need
to define the perspective from which the prototype is designed. In this handbook
the perspective is from the agent responsible for promoting quality in
intermodality. This agent varies from case to case being necessary to identify it in
each application. For example, in case of HERMES project, the agent responsible
can be the:
• terminal manager (e.g.: Faro, Arlanda Stockholm)
• public institution or regulator (e.g.: Frankfurt Hahn)
• transport operator (e.g.: Ferry Operator to Kalamata)
Prototypes of Business Models are sketched in the next two diagrams. Both
prototypes are presented in simultaneous as we believe that in this way the
presentation gets clear and simple. This also allows identifying the common
aspects and the main differences between the two prototypes.
The two prototypes of business models are presented in Figure 3.2 and Figure 3.3
in the framework proposed by Osterwalder3.
3 Owing to space restriction in some building blocks, the contents in some are simplified. The actual contents are fully described in Chapter 7.1.1 to Chapter 7.2.9-

Doc. Id: HERMES_WP6_IST_D6_Final
Doc. Title: Handbook on Enhanced Business Models
Doc. Version: Final
Contract: TCP8-GA-2009-234082
Date: 07 April2011 Page: 58 of 181
- to improve the passenger’s quality of transport or reduce price and to achieve benefits to the society, through a better intermodality promoted by intermediary agents
Figure 3.2 – Prototype Business Model Gap 1
- Commercial Agreements, Joint Venture, or Acquisition.
- Btw Transport Operators, Transport Operator & Terminal Manager, or Terminal Manager & Local Authorities.
- Coordination of schedules, harmonization of transport capacities.
- Tariff integration,
- Integrated information system.
- knowledge of the local market,
- brand of the long distance transport operator
- Web based communication channels, - Information and sale desks at terminals
- All - Discount and bundle services, - Discounts, - Rewarding systems.
- Tickets - Advertisements - Subsidies
- Related with the provision of transport services, - Related with the integration of transport services.
- to improve the passenger’s quality of transfer service through an integrated approach to the transfer process.
Figure 3.3 – Prototype Business Model Gap 2
- Commercial Agreements, Joint Venture, or Acquisition.
- Transport Operator & Terminal Manager
- Terminal Manager & Local Authorities
- Information to passenger, - Reduction of transfer distance, - Improve the comfort level of the terminal
- Terminal infrastructure, - The information system, - Knowledge on the market split
- Web based communication channels, - Information and sale desks at terminals
- All - Discounts, - Customisation of spaces, - Rewarding systems (retail).
- Advertisements - Renting, leasing and selling facilities - Fees with parking lot and similar
- Related with operation of terminal

Contract: TCP8-GA-2009-234082
Authors: Macário, Reis et al.
Partner Responsible: IST
Dissemination Level: CO
Page: 59 of 181 Date: 07 Apri l 2012
3.3 Building Blocks
We now briefly discuss the building blocks of the business model framework
proposed by Osterwalder.
3.3.1 Value Proposition (VP)
3.3.1.1 Definition
Value Proposition is the reason why customers turn to one company over another.
It solves a customer problem or satisfies a customer need. Each Value Propositions
consists of a selected bundle of products and/or services that caters to the
requirements of a specific Customer Segment.
Value Proposition creates value for a Customer Segment through a distinct mix of
elements catering to that segment’s needs that may be quantitative (e.g. price) or
qualitative (e.g. design).
The questions that a company should make are: What value do we deliver to the
customer? Which one of our customer’s problems are we helping to solve? Which
customer needs are we satisfying?
3.3.1.2 Analysis
Looking for the current transport services provided to and from the airport of
Faro, we may conclude that, in practical terms, no intermodal transport services
are offered at the airport of Faro (CS7). Instead, there is a set of independent
services connected at the same location - the airport. Public transport is limited to
buses since the other available modes are taxi and rent-a-car.
This is similar to the current situation described for the Peloponnese/Crete case
study (CS5). Transport services of various modes -not integrated- are offered along
the examined corridor. The customers themselves proceed to various modal
combinations in order to reach the final destination, but the transport service on
each leg of the chain is fully independent from those of the adjacent legs. Rail, bus
and car services are offered on short distance as well as on long distance,
depending on the leg of the chain.

Doc. Id: HERMES_WP6_IST_D6_Final
Doc. Title: Handbook on Enhanced Business Models
Doc. Version: Final
Contract: TCP8-GA-2009-234082
Date: 07 April2011 Page: 60 of 181
Antwerp Airport Case Study (CS7) reported a low level of satisfaction among
passengers in relation to the public transport services such as bus and taxi.
Antwerp Airport is well accessible by car since there is a large parking lot in front
of the airport building. However, as on most roads in Belgium, there are traffic
jams on the roads leading to the airport, so public transport needs to be improved.
So we can conclude that like in the case of Faro Airport (CS7) and
Peloponnese/Crete case (CS5), there is a missing link.
Frankfurt Hahn (CS11) airport is another example, since it currently depends on
an effective operating road infrastructure as there are no railway services to Hahn
airport. Therefore, accessibility to the airport is limited to private transport modes
where car is the predominant transport mode or to public transport services that
are currently limited to buses. In terms of intermodality and interconnectivity the
business model was so far focused exclusively on road transport. The strategy has
been to use the benefits of the small size of the airport, which assures short
distances in and around the terminal and the extensive space of the former
military ground, which can be used for parking facilities. Since a high percentage of
a passengers use private cars, the airports interconnectivity strategy particularly
targeted car users by providing cheap parking and free shuttle buses from the
more distant parking facilities.
Regarding Long Distance Bus (CS4), we can notice that there is also a missing link
which is the integration between short and long distance services, especially
between rail and bus services in Zaragoza.
In Avenida de America case study (CS3) we can notice that the current value
proposition is mostly lacking on information provision. Information at the site is
not clear or sufficient. There is also a lack of physical integration at the terminal.
For the Long Distance Bus Service case study (CS4) we can notice that information
about all transport is a weakness too, but here there is no integration of
information between transport services at all. Apparently, all that is shared by long
distance and local transport operators is a location..
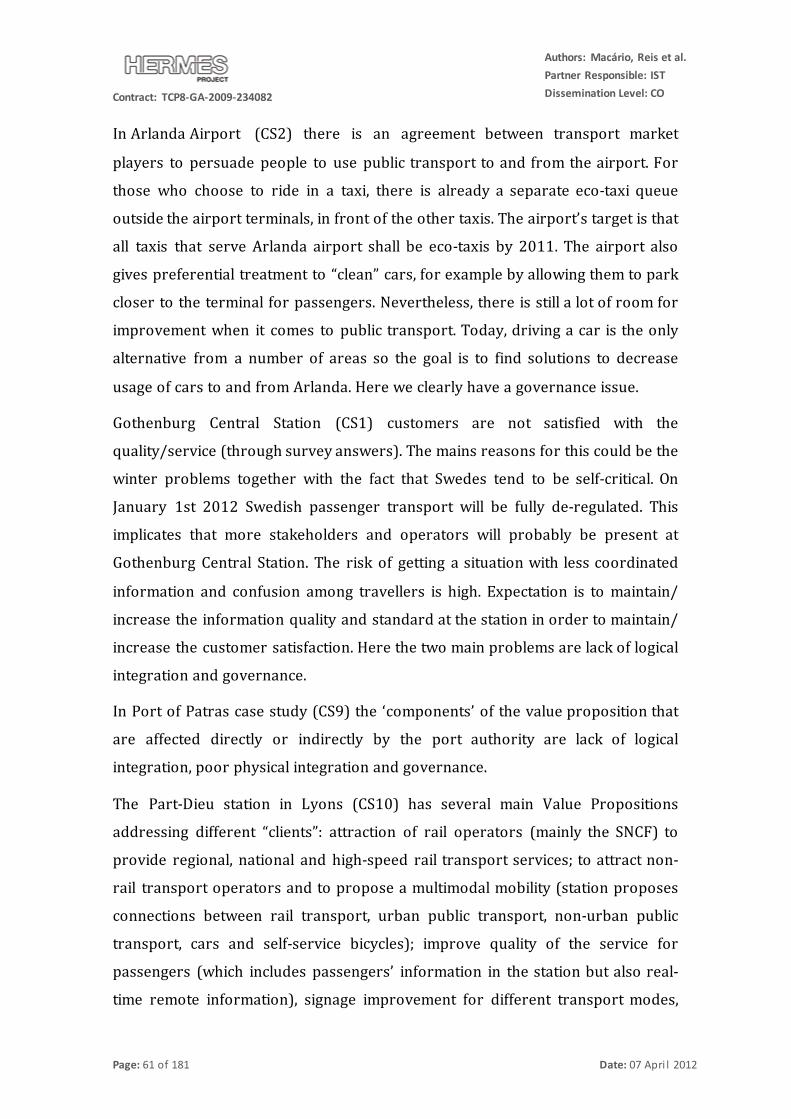
Contract: TCP8-GA-2009-234082
Authors: Macário, Reis et al.
Partner Responsible: IST
Dissemination Level: CO
Page: 61 of 181 Date: 07 Apri l 2012
In Arlanda Airport (CS2) there is an agreement between transport market
players to persuade people to use public transport to and from the airport. For
those who choose to ride in a taxi, there is already a separate eco-taxi queue
outside the airport terminals, in front of the other taxis. The airport’s target is that
all taxis that serve Arlanda airport shall be eco-taxis by 2011. The airport also
gives preferential treatment to “clean” cars, for example by allowing them to park
closer to the terminal for passengers. Nevertheless, there is still a lot of room for
improvement when it comes to public transport. Today, driving a car is the only
alternative from a number of areas so the goal is to find solutions to decrease
usage of cars to and from Arlanda. Here we clearly have a governance issue.
Gothenburg Central Station (CS1) customers are not satisfied with the
quality/service (through survey answers). The mains reasons for this could be the
winter problems together with the fact that Swedes tend to be self-critical. On
January 1st 2012 Swedish passenger transport will be fully de-regulated. This
implicates that more stakeholders and operators will probably be present at
Gothenburg Central Station. The risk of getting a situation with less coordinated
information and confusion among travellers is high. Expectation is to maintain/
increase the information quality and standard at the station in order to maintain/
increase the customer satisfaction. Here the two main problems are lack of logical
integration and governance.
In Port of Patras case study (CS9) the ‘components’ of the value proposition that
are affected directly or indirectly by the port authority are lack of logical
integration, poor physical integration and governance.
The Part-Dieu station in Lyons (CS10) has several main Value Propositions
addressing different “clients”: attraction of rail operators (mainly the SNCF) to
provide regional, national and high-speed rail transport services; to attract non-
rail transport operators and to propose a multimodal mobility (station proposes
connections between rail transport, urban public transport, non-urban public
transport, cars and self-service bicycles); improve quality of the service for
passengers (which includes passengers’ information in the station but also real-
time remote information), signage improvement for different transport modes,

Doc. Id: HERMES_WP6_IST_D6_Final
Doc. Title: Handbook on Enhanced Business Models
Doc. Version: Final
Contract: TCP8-GA-2009-234082
Date: 07 April2011 Page: 62 of 181
shops and other services, offers different types of in-station services and shops.
The three main problems identified are: poor physical integration, logical
integration and governance.
3.3.1.3 Prototypes
The fundamental building block of a business model is the value proposition.
Value Proposition creates value for customers through a distinct mix of elements
catering to that segment’s needs that may be quantitative (e.g. price) or qualitative
(e.g. design).
In the case of Prototype for Gap 1 the value proposition can be described as: to
improve the passenger’s quality of transport or reduce price and to achieve benefits
to the society, through a better intermodality promoted by intermediary agents.
This value proposition aims to bridge the lack of adequate integration between the
transport agents and stakeholders. As evidenced by the case studies, the reasons
for such lack of integration can be diverse, including: non-coordination of
schedules, lack of tariff integration, or absence of willingness of stakeholders to
integrate. Often, each transport operator is focussed on its own operations, aiming
to increase and maximise its own profits and revenues without taking into
consideration the best for the passenger. Regardless the case, this value
proposition aims to re-centre the intermodal transport activity in the passenger, as
often this is not the case. In this prototype, the transport agents and stakeholders
are required to think the entire intermodal transport services in function of the
passengers’ requirements and needs. Also, the prototypes point out two possible
manifestations of the integration of the transport services, that is, the integration
must yield reduced tariff prices for passengers or bring benefits to the society. It
may occur that prices cannot be reduced but the integration does generate benefits
to the society as a whole.
In case of Prototype for Gap 2 the value proposition can be described as: to
improve the passenger’s quality of transfer service through an integrated approach
to the transfer process.

Contract: TCP8-GA-2009-234082
Authors: Macário, Reis et al.
Partner Responsible: IST
Dissemination Level: CO
Page: 63 of 181 Date: 07 Apri l 2012
This value proposition goes in a different direction than the previous one,
reflecting the different nature of both gaps. In this case, the value proposition aims
to bridge the recurrent problem, found in many intermodal terminals, of poor or
inexistent integration. The value proposition points out the need to take a holistic
approach in the implementation process of the transfer of passenger between
modes of transport. Indeed, the transfer process is inherently multidimensional,
embracing multiple factors and variables, such as: physical transfer (passenger
moving between modes of transport), logical (information to passenger), financial
(payment and financing of the terminal), strategic (alignment between transport
operators). Naturally, depending on the specific nature of the case, variations in
the business model may be required. The relevant aspect is to improve the
passengers’ quality of service, through an adequate transfer process.
3.3.1.4 Proposals
Regarding the value proposition for a situation with barriers on the links we can
observe that besides the specification of each one of them, they all propose a new
connection or transport service to improve interconnectivity.
In the other situations the most referred changes in the value proposition are
related with integration of information, governance and physical integration.
Information and signalling improvement through real-time information displays
are mentioned in all case studies with issues on the nodes: Avenida de America
(CS3), Long Distance Bus Service (CS4), Port of Patras (CS9), Gothenburg Central
Station (CS1) and Part-Dieu station (CS10). As we can notice, this is most
important action in the value proposition to improve interconnectivity. It is
important to highlight that information improvement is the pillar of the new
proposal for Gothenburg Central Station.
Interchange websites with schedules information and schedule coordination
between transport modes operating in interchange are also two important
referred measures, especially in Avenida de America (CS3) and Long Distance Bus
Service (CS4) case studies.

Doc. Id: HERMES_WP6_IST_D6_Final
Doc. Title: Handbook on Enhanced Business Models
Doc. Version: Final
Contract: TCP8-GA-2009-234082
Date: 07 April2011 Page: 64 of 181
Governance improvements are also pointed out in the case studies but details are
specific for each one. Cooperation between transport operators and among them
and the terminal manager are also mentioned on these six case studies.
Cooperation between transport operators is important to achieve schedule
coordination and integrated tickets. As it is mentioned in Long Distance Bus
Service case study (CS4), local transport authorities should be more involved with
terminal managers. This entity could manage and checked cooperation between
transport operators.
Apart from Gothenburg (CS1) and Port of Patras (CS9) case studies, physical
integration is pointed out as an issue to mitigate with the new value proposition.
3.3.2 Customer Segments (CS)
3.3.2.1 Definition
Customers comprise the heart of any business model. Without (profitable)
customers, no company can survive for long. In order to better satisfy customers, a
company may group them into distinct segments with common needs, common
behaviours or other attributes.
An organization serves one or several Customer Segments and there are different
types. Here are some examples: mass market, niche market, segmented, diversified
and multi-sided markets.
The questions that a company should make are: For whom are we creating value?
Who are our most important customers?
Figure 3.4 and Figure 3.5 were developed upon the results collected in HERMES
surveys. In the surveys for user associations on intermodality, the stakeholders
have been asked to rate the importance and satisfaction level regarding several
issues of interchanges. The very high and high rating of these issues were collected
and compared. Then, the main factors to improve interchanges were obtained
based on these questions.
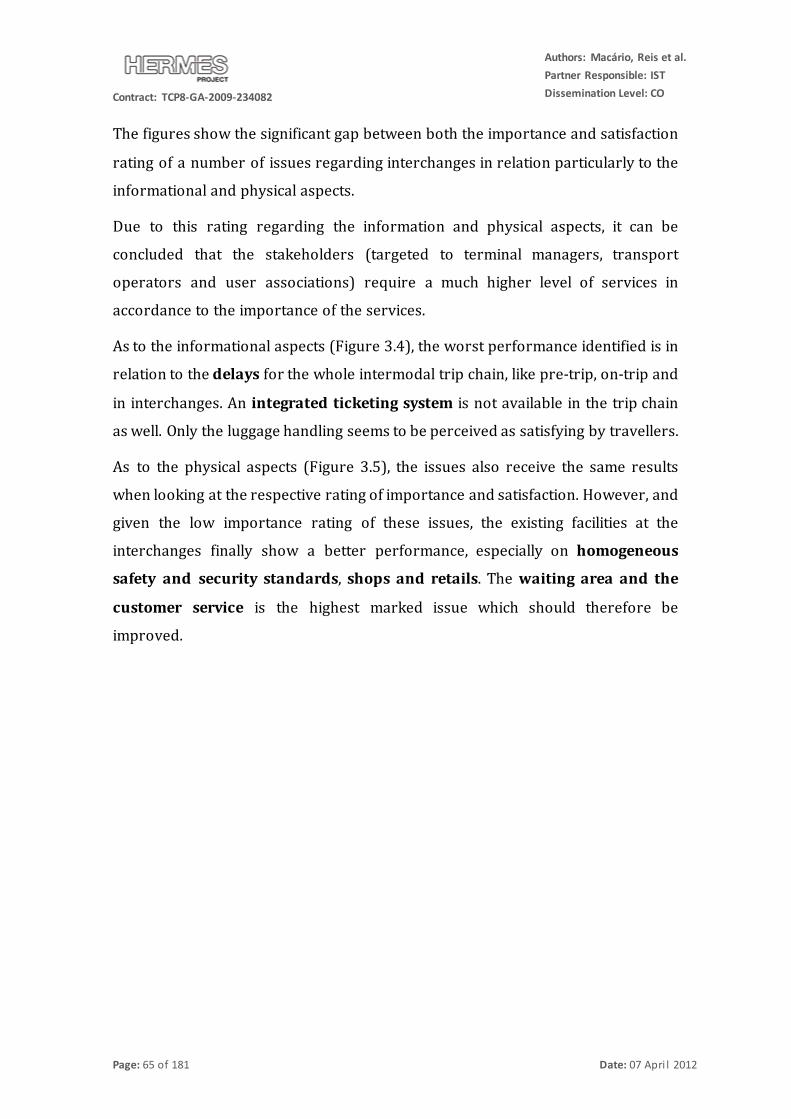
Contract: TCP8-GA-2009-234082
Authors: Macário, Reis et al.
Partner Responsible: IST
Dissemination Level: CO
Page: 65 of 181 Date: 07 Apri l 2012
The figures show the significant gap between both the importance and satisfaction
rating of a number of issues regarding interchanges in relation particularly to the
informational and physical aspects.
Due to this rating regarding the information and physical aspects, it can be
concluded that the stakeholders (targeted to terminal managers, transport
operators and user associations) require a much higher level of services in
accordance to the importance of the services.
As to the informational aspects (Figure 3.4), the worst performance identified is in
relation to the delays for the whole intermodal trip chain, like pre-trip, on-trip and
in interchanges. An integrated ticketing system is not available in the trip chain
as well. Only the luggage handling seems to be perceived as satisfying by travellers.
As to the physical aspects (Figure 3.5), the issues also receive the same results
when looking at the respective rating of importance and satisfaction. However, and
given the low importance rating of these issues, the existing facilities at the
interchanges finally show a better performance, especially on homogeneous
safety and security standards, shops and retails. The waiting area and the
customer service is the highest marked issue which should therefore be
improved.

Doc. Id: HERMES_WP6_IST_D6_Final
Doc. Title: Handbook on Enhanced Business Models
Doc. Version: Final
Contract: TCP8-GA-2009-234082
Date: 07 April2011 Page: 66 of 181
Figure 3.4 - Rating of the Importance and Satisfaction respect to informational issues
Figure 3.5 - Rating of the Importance and Satisfaction respect to physical issues

Contract: TCP8-GA-2009-234082
Authors: Macário, Reis et al.
Partner Responsible: IST
Dissemination Level: CO
Page: 67 of 181 Date: 07 Apri l 2012
From the customers’ perspective, the most important step of an intermodal long-
short distance journey is the long distance trip, in which they spend both the most
money and time.
This means that travellers will probably choose first the long distance mode and
then, depending on the short distance mode connections and facilities, the transfer
node. Therefore it is crucial to know which aspects they weight up in their choices
since any improvement will determine the success of the Airport, Port, Station or
Interchange involved.
To get this information, about 300 surveys per Case Study were carried out. Among
other questions, the respondents were asked about the main factors influencing
their trip elections.
Passengers were classified depending on the long distance mode they choose, since
this seems to be the most important step of the journey. The figure below shows
the main factors influencing trip decisions for airplane, train and bus travellers.

Doc. Id: HERMES_WP6_IST_D6_Final
Doc. Title: Handbook on Enhanced Business Models
Doc. Version: Final
Contract: TCP8-GA-2009-234082
Date: 07 April2011 Page: 68 of 181
Figure 3.6 - Factors influencing trip election. forTrain travellers.
Figure 3.7 - Factors influencing trip election. for Bus travellers.
0
5
10
15
20
25
30
35
40
45
50
Factors influencing your trip election (%)
Train travellers
Gothemburg Station
Zaragoza-Lleida Train
Part Dieu Station
Key factors:
-TRAVEL TIME
-Comfort
-Puntctuality
0
10
20
30
40
50
Factors influencing your trip election (%)
Bus travellers
Avenida América Interchange
Zaragoza Bus
Key factors:
-PRICE
-Comfort
-Puntctuality

Contract: TCP8-GA-2009-234082
Authors: Macário, Reis et al.
Partner Responsible: IST
Dissemination Level: CO
Page: 69 of 181 Date: 07 Apri l 2012
Figure 3.8 - Factors influencing trip election (for air travellers).
The analyses of these results provide some interesting insights:
• There is usually one factor that appears by far as the most important (with the exception of Gothenburg, probably due to the fact that a 30 % of
respondents were not train users). So it is likely that many passengers just take into consideration one factor.
• According to the results there are two kind of passengers:
o Those influenced mainly by the time spent in the whole journey; like
train travelers at Gothenburg Station, Lyon Station, Zaragoza and Lleida; or airplane travelers from Arlanda Airport and Antwerp
Airport. Note that most of these passengers do not mention Ticket
prices as an important factor.
o Those influenced by Ticket Prices, such as bus travelers of Zaragoza
and Lleida; who on the opposite do not mention travel time as important in their trip election.
0
5
10
15
20
25
30
35
40
Factors influencing your trip election (%)
Airplane travellers
Arlanda Airport
Antwerp Airport
Key factors:
-TRAVEL
TIME
-Comfort
-Puntctuality

Doc. Id: HERMES_WP6_IST_D6_Final
Doc. Title: Handbook on Enhanced Business Models
Doc. Version: Final
Contract: TCP8-GA-2009-234082
Date: 07 April2011 Page: 70 of 181
o Therefore, it could be stated that both price and time are
fundamental variables for passengers’ choices, but only one of them
is taken into consideration by each market segment when making the decision.
Both kinds of passengers state that comfort and punctuality are also important, but
much more important for train and airplane users, who are willing to pay more for
a better service in general, as for example
• At Gothenburg Station and Arlanda Airport respondents showed a high
level of satisfaction regarding time issues: less than 15 % were not satisfied with waiting time or punctuality, and less than 10 % with transfer time.
• At Part Dieu Station (Lyon) a 55 % of respondents were going to stay less than 15 minutes at Station, and only a 10 % stayed at the station due to a
delay.
• At Antwerp Airport, passengers can check in until 20 minutes before
departure, which is very useful specially taking into account that most of them are business travellers. In addition, the walking distances around and
with the Antwerp Airport building are relatively small; which reduces the time that the traveler needs to move by around 10 minutes. These result
show satisfaction regarding the time spent.
• According to the analysis done in the Port of Patras, 46 % of the participants stated that the acceptable time to spend at the Terminal is up
to 30 minutes. Comparing the results with the real time that they spent, only a small percentage (16 %) should be disappointed.
• One of the reasons for success of Avenida de America Interchange (Madrid) is the metro connections: four Metro lines stop there, with a really good
geographical coverage. Metro services are cheap, and trains have a frequency of 3-5 minutes; so they fit well to the Avenida de America users’
profile. In fact a 74 % of the users access to the Interchange by Metro.
Looking with more detail into the customers’ needs, we may identify five main
areas of needs, concerned with:
- Security;
- Ticketing;
- Information;
- Baggage Handling;

Contract: TCP8-GA-2009-234082
Authors: Macário, Reis et al.
Partner Responsible: IST
Dissemination Level: CO
Page: 71 of 181 Date: 07 Apri l 2012
- Interchanges (Infrastructure design and connections).
Each of these areas will have a more detailed description on the next sections.
Security
The White Paper (2001) says that the first transport user concern is security, and
the intermodal traveler is no exception. Therefore, all the transport modes must
guarantee a certain degree of security in order to not be excluded of the
intermodal passengers’ options.
Security is transversal to other areas of passenger needs, like Ticketing, Baggage
Handling or Interchanges. On the ticketing area, for example, it is important that
possible online transactions for the acquisition of intermodal tickets are secure. A
secure baggage handling along the intermodal journey is also important to avoid
baggage losses or damaging. Interchanges should be safe places and protected with
security guards and CCTV systems, when possible.
On the MIMIC project, the fear of crime was presented as a serious deterrent to
using public transport for most people. It was said that fear of physical attack and
violence and the danger of bicycle and car thefts are problems experienced at most
interchange sites. Fear is often greater in the area near the interchange than within
the interchange itself, where there are generally enough people present to provide
a feeling of security (MIMIC, 1999). For an improving on intermodality at these
sites, an effective security must be granted. MIMIC also presented some advices in
terms of security at interchanges: “good surveillance both inside and outside the
interchange site; programs to train all staff employed in the interchange in personal
care and assistance, and being approachable about fears for personal security; the
use of CCTV (though passengers generally do not consider it a solution on its own);
good lighting, both inside and outside the interchange; opening of shops and business
activities in the interchange to make it a livelier and safer place”.
Ticketing
As it was said before, integrated ticketing is one of the purposed measures for
improving customers’ intermodality on the White Paper (2001) and therefore it
has to be faced as one of their main needs.
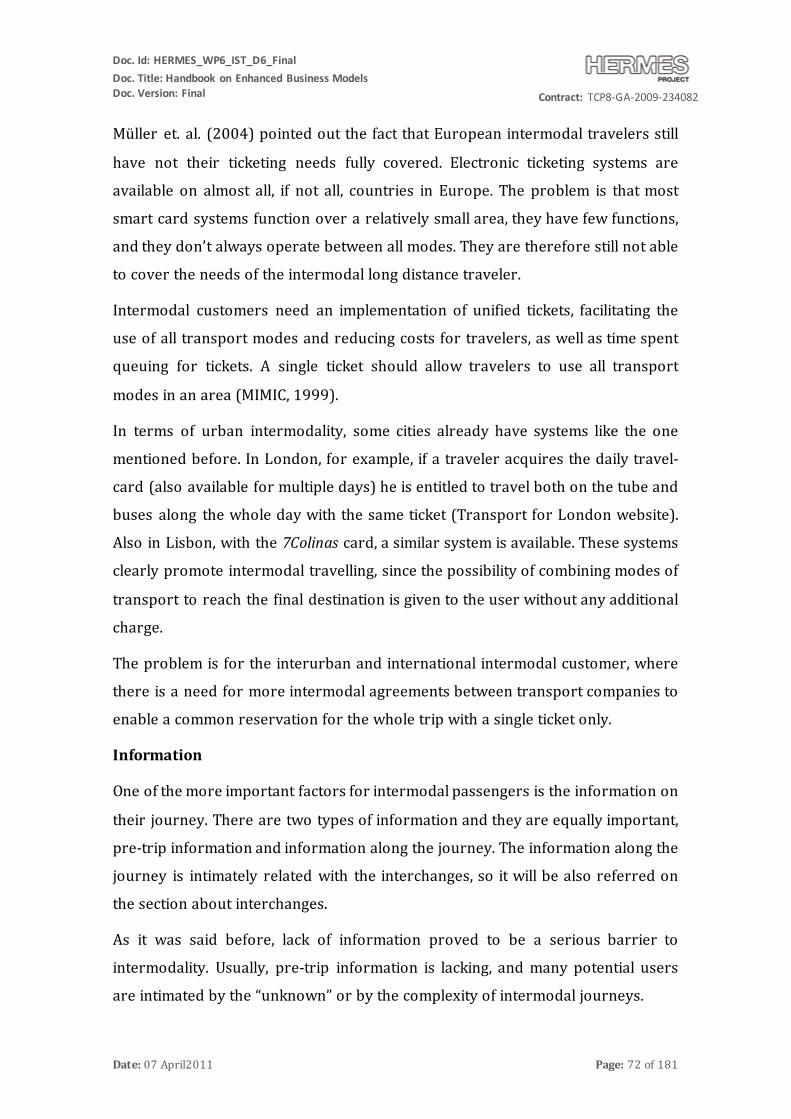
Doc. Id: HERMES_WP6_IST_D6_Final
Doc. Title: Handbook on Enhanced Business Models
Doc. Version: Final
Contract: TCP8-GA-2009-234082
Date: 07 April2011 Page: 72 of 181
Müller et. al. (2004) pointed out the fact that European intermodal travelers still
have not their ticketing needs fully covered. Electronic ticketing systems are
available on almost all, if not all, countries in Europe. The problem is that most
smart card systems function over a relatively small area, they have few functions,
and they don’t always operate between all modes. They are therefore still not able
to cover the needs of the intermodal long distance traveler.
Intermodal customers need an implementation of unified tickets, facilitating the
use of all transport modes and reducing costs for travelers, as well as time spent
queuing for tickets. A single ticket should allow travelers to use all transport
modes in an area (MIMIC, 1999).
In terms of urban intermodality, some cities already have systems like the one
mentioned before. In London, for example, if a traveler acquires the daily travel-
card (also available for multiple days) he is entitled to travel both on the tube and
buses along the whole day with the same ticket (Transport for London website).
Also in Lisbon, with the 7Colinas card, a similar system is available. These systems
clearly promote intermodal travelling, since the possibility of combining modes of
transport to reach the final destination is given to the user without any additional
charge.
The problem is for the interurban and international intermodal customer, where
there is a need for more intermodal agreements between transport companies to
enable a common reservation for the whole trip with a single ticket only.
Information
One of the more important factors for intermodal passengers is the information on
their journey. There are two types of information and they are equally important,
pre-trip information and information along the journey. The information along the
journey is intimately related with the interchanges, so it will be also referred on
the section about interchanges.
As it was said before, lack of information proved to be a serious barrier to
intermodality. Usually, pre-trip information is lacking, and many potential users
are intimated by the “unknown” or by the complexity of intermodal journeys.

Contract: TCP8-GA-2009-234082
Authors: Macário, Reis et al.
Partner Responsible: IST
Dissemination Level: CO
Page: 73 of 181 Date: 07 Apri l 2012
Barros et al., on their paper on level of service evaluation for transfer passengers at
airports (2007), pointed out some important information issues for this kind of
passengers that is easily transferable for the intermodal traveler. According to a
survey took while developing the paper, he concluded that the second most
important factor to transfer passengers at BIA airport (the airport where the study
took place) was the quality of the Flight Information Displays (FIDs). This also
happens with the intermodal travelers, since they frequently search for
information on the status of their trip in what concerns to the departure of the
subsequent mode of transport. Especially on long distance intermodal trips,
missing one of the modes of transport will have undesirable consequences, since
the frequency of long distance travels is not always as high as the passenger would
want. If the traveler has information systems available along the trip these
situations may be avoided, or at least predicted on time to change for a different
mode of transport that better serves customer needs.
Information that is easy to find and provides accurate and up-to-the-minute
updates on their intermodal journey will be highly valued by the intermodal
traveler. The same conclusion applies to the quality of information at interchanges
(guidance, signage, directions), which will be referred on the section about them.
MIMIC Project provided a series of recommendations in terms of intermodal
information, both for pre-trip information, real-time information and information
at interchanges. Information on expected duration of journey and frequency of
connecting services at the interchanges are very important. This can be done with
electronics or announcements, and with timetables clearly visible on board
vehicles. Another important issue is that this information is provided in more than
only local language, so that it can also serve foreign people that might use that
mode of transport. Customers need personalized pre-trip information, telling them
exactly where to start, the times of each link, and such useful information as
platform or bus-stop numbers. Pre-trip information should be available as widely
as possible (telephone, internet, televideo, radio bulletins, kiosks, etc.).

Doc. Id: HERMES_WP6_IST_D6_Final
Doc. Title: Handbook on Enhanced Business Models
Doc. Version: Final
Contract: TCP8-GA-2009-234082
Date: 07 April2011 Page: 74 of 181
As for the information during the trip in urban journeys, vehicles should be
equipped with information systems regarding intermodal changes, when their
route serves important nodes of the transport network.
Baggage Handling
Another issue covered by the White Paper (2001) in terms of intermodal
customers’ needs is the question of baggage handling systems. Whether referring
to private or business travels, the customers’ first associations with baggage
transport show that they are emotionally highly involved. Baggage seems to be a
second identity and a part of their personality, which is at the same time felt to be a
heavy weight. At a study about the importance of baggage, questioned people
recalled situations where they felt handicapped owing to their baggage, including
situations where business trips had become pointless because of lost baggage
(EuroTraCS D41, 1997).
This is of major importance for the interurban and international intermodal
customer, since the baggage carried on urban intermodal journeys is lighter or
inexistent. The only component of urban transport that should be considered for
this issue is the case of urban transport offering connections to large transport
hubs (airports or HST train stations). On this case, urban transport vehicles should
offer enough space for the carrying of possible baggage that intermodal customers
carry.
The case of baggage handling on intermodal journeys using Air and Rail modes of
transport, in what concerns the customers’ needs, has been widely studied on the
EuroTraCS Project (EuroTraCS D41, 1997 and EuroTraCS D42, 1998). On this
project, market and user needs were investigates at three levels:
- In creative workshops with intermodal passengers and experts;
- Telephone surveys of air passengers with check-in baggage;
- Conjoint studies in Germany and France to quantify the importance of
components in baggage services and the benefits of individual components
from the viewpoint to intermodal passengers with baggage and the
willingness of potential user groups to pay for them.

Contract: TCP8-GA-2009-234082
Authors: Macário, Reis et al.
Partner Responsible: IST
Dissemination Level: CO
Page: 75 of 181 Date: 07 Apri l 2012
From these investigations, it was concluded that the needs of travelers with
respect to their baggage can be divided in four areas:
- Security for their baggage and guaranteed arrival;
- Freedom, convenience, relaxation for themselves;
- Lightness, freedom from worry, confidence;
- Indemnification for loss or damages.
Baggage and its transport is considered the negative dimension of travelling and is
connected with a physic and psychic burden during the whole travel chain. On an
air-rail intermodal journey, the part when the user is travelling by rail is
considered to be the one that causes most baggage problems. This is extendable to
all the modes of transport that access the airport, presenting problems such as lack
of space in the vehicle, fear of theft, or handling problems while changing mode of
transport.
On the EuroTraCS project some ideas for innovative baggage transport systems
were given by the experts for multimodal passenger transport, matching very well
the user needs formulated by the travelers at the workshops undertaken by the
same project. These ideas were:
- Door-to-door baggage service (the drawback of this system is that travelers
have to be at home at the time of collection and pack suitcases in time,
earlier than before);
- Shift the point of check-in to an earlier interface in the journey;
- Information and control of location of baggage (intended to satisfy the
security need of travelers and increase confidence in the system)
(EuroTraCS D42, 1998).
Some examples of services that travelers are offered to make baggage transport to
the airport easier and to avoid some (or even all) difficult interfaces were given on
EuroTraCS. For example, in New York, Lufthansa customers can check in baggage
at the city office, avoiding the inconvenient of having to carry the baggage to the
airport on the day of the travel. A similar service is provided at Victoria Station, in

Doc. Id: HERMES_WP6_IST_D6_Final
Doc. Title: Handbook on Enhanced Business Models
Doc. Version: Final
Contract: TCP8-GA-2009-234082
Date: 07 April2011 Page: 76 of 181
London, where passengers can check in their luggage before the train journey and
only have to worry about it when arriving the destination airport, after the flight.
Laplace et. al. (2005) also mentioned that the strong investments on rail access to
main airports, especially in dedicated airport trains, favor the existence of
intermodal agreements between air and rail operators allowing passengers to
check-in for their flight at the rail station. However, some important conclusions
regarding this issue were presented by Cokosova (2003b). On a study analyzing
passengers’ preferences in air-rail intermodal transport, the author concluded that
34% of the passengers inquired strongly deny willingness to spend money for
luggage check-in at a railway station, 21% of respondents would pay extra charge
for luggage to be delivered to their domicile, after they conducted their intermodal
journey.
Interchanges
The quality of interchanges is probably the major need of the intermodal customer,
because these have to gather conditions for almost all the other needs (security,
baggage handling, or information needs, for example).
The EuroTraCS project (EuroTraCS D41, 1997) identified some of the problems
related with baggage at airports that are likely to be extrapolated for the general
interchange functioning. Among others, mobility problems were identified
regarding long walking distances and insufficient direction signs. As it will be seen
next, the intermodal travelers need an appropriate interchange design and
configuration in order to perform a seamless transfer between modes of transport.
Müller et. al. (2004) identified that deficiencies in the design, layout and
functionality of interchanges may act as a barrier to intermodality. Customer needs
are well known but often there are not accounted for properly. The connection
between different modes of transport must permit short transfer times and serious
hurdles are put up if the interchange does not meet the standards with regard to
accessibility. The project also alerted for the need of personal security and comfort
needs at the interchange being met.

Contract: TCP8-GA-2009-234082
Authors: Macário, Reis et al.
Partner Responsible: IST
Dissemination Level: CO
Page: 77 of 181 Date: 07 Apri l 2012
On a survey undertaken on CARISMA project (2000), it was concluded that users
judge transfer paths at interchanges in terms of:
- Length and walking time required to perform the transfer between modes
of transport;
- Facilities offered for this purpose (escalators, lifts, etc.);
- Obstacles or unpleasant conditions encountered along the way.
On the same project it was also concluded that as far as the appearance and
general characteristics of the interchanges are concerned, travelers were found to
be indifferent to “aesthetics” while very sensitive to issues related to security and
the activities existing within the places. Customers’ requirements for interchanges
are still primarily or almost exclusively travel related, i.e. speed and simplicity of
transfer. Optimizing intermodal transfer nodes would therefore have to involve
mainly reduction of transfer time and only secondary an increased provision of
activities and services such as shops and restaurants. Moreover the use of non-
travel related services is suggested to be continued by the waiting time and
consequently the mode of transport used. Thus users waiting for travel modes
with lower frequencies of arrival and departure are more prone to use shops and
other services than travelers using transport modes with higher frequencies
(CARISMA, 2000).
Another project that addressed the physic design of infrastructures as a barrier to
intermodality was the MIMIC Project (1999), where it is said that interchanges are
often not designed in a functionally optimal manner. In many cases the chosen
design is the result of an “architectural competition”, with the emphasis on the
visual architecture of the building, the functionality taking a secondary role (e.g.
poorly situated ticket offices, lack of lifts and ramps, lack of waiting areas).
Sometimes distances to walk are not protected from rain or sun and exceed the
walking distance which is considered to be acceptable. Level changes are not
always provided with ramps, escalators or lifts, affecting on a high degree the
mobility of passengers with special needs.
MIMIC also provided a set of recommendations to improve the physic design of
interchanges for the use of intermodal customers, some of them being:

Doc. Id: HERMES_WP6_IST_D6_Final
Doc. Title: Handbook on Enhanced Business Models
Doc. Version: Final
Contract: TCP8-GA-2009-234082
Date: 07 April2011 Page: 78 of 181
- When distances to be walked between modes exceed 200m, short-distance
transport systems can be a solution;
- Protection from rain and sun should be provided along all walking links;
- Level changes should be avoided, but the installation of ramps, spacious lifts
and escalators should be considered when these are necessary;
- Alternative secondary, “stair-free routes, with lifts or escalators, need to be
signed;
- Comfortable and safe waiting areas are always needed, with good access to
real-time information and such amenities as toilets and shops.
In what concerns information on the interchanges, these should be available on
abundance and on different languages in order to serve the foreign intermodal
travelers. Real-time information on delays, as well as on means’ arrivals and
departures, should be provided at any interchange site. Clear maps detailing
transport routes/services are needed and should be available at stations and bus
stops and visitor information centers. Staff at the interchange should be well-
trained in providing information about all modes in the transport system and
should be kept up to date with the current situation. Signalization needs to be
clear, simple and color coded for an easy identification.
The referred customer needs have different magnitudes according to numerous
factors, namely purpose of the trip (passenger type), geographical environment
and climate, living standard, cultural differences and others. Preferences and needs
of passengers may also vary according to the hour of the day and according to the
frequency of travels.
Cokasova (2003a) presented the results of a questionnaire undertaken in order to
study the sensitivity of passengers to eight different travel factors (ticket price,
price to/from airport/train station, travel time, time to/from airport/station,
walking/waiting time, frequency, competition, on-board services), according to
their travel purpose: business or leisure (economy). Participants were asked to

Contract: TCP8-GA-2009-234082
Authors: Macário, Reis et al.
Partner Responsible: IST
Dissemination Level: CO
Page: 79 of 181 Date: 07 Apri l 2012
assign the importance to each travel attribute on a 10-point scale and the results
are shown on the next table (the higher the number the more sensitive passengers
are to certain factor).
Table 3.2 – Results for Passengers’ sensivity to travel factors (Source: Cokasova, 2003a)
Travel attributes Economy Business
Journey Time 5.81 7.73
Ticket Price 7.53 3.56
Time to/from
A/P or S 6.92 7.21
Price to/from
A/P or S 4.92 3.13
Frequency 5.54 6.36
Walk/wait time 6.34 7.02
Competitiveness 5.20 4.08
On-board
services 4.54 5.98
According to the results shown, passengers travelling for leisure purposes are
most sensitive to the ticket price and the least sensitive to on-board services. On
the other hand, business travellers give a higher value to journey time and are least
sensitive to price to and from the airport or station. However, the author points out
that this questionnaire covers a very specific group of people, with a high
geographical sensitivity.
This difference between Private Travellers and Business Travellers was also
studied on the EuroTraCS project (EuroTraCS D41, 1997) in what concerns
baggage handling issues on intermodal journeys. In this respect, there are
differences depending on the travel reason:
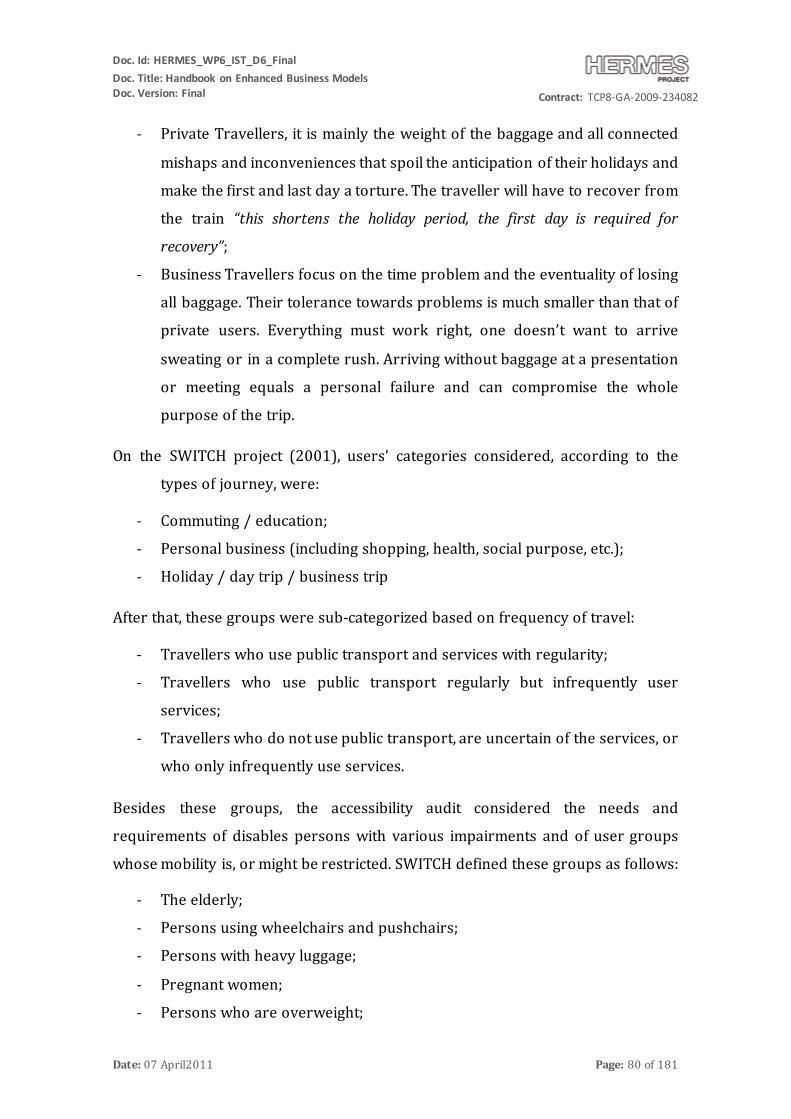
Doc. Id: HERMES_WP6_IST_D6_Final
Doc. Title: Handbook on Enhanced Business Models
Doc. Version: Final
Contract: TCP8-GA-2009-234082
Date: 07 April2011 Page: 80 of 181
- Private Travellers, it is mainly the weight of the baggage and all connected
mishaps and inconveniences that spoil the anticipation of their holidays and
make the first and last day a torture. The traveller will have to recover from
the train “this shortens the holiday period, the first day is required for
recovery”;
- Business Travellers focus on the time problem and the eventuality of losing
all baggage. Their tolerance towards problems is much smaller than that of
private users. Everything must work right, one doesn’t want to arrive
sweating or in a complete rush. Arriving without baggage at a presentation
or meeting equals a personal failure and can compromise the whole
purpose of the trip.
On the SWITCH project (2001), users’ categories considered, according to the
types of journey, were:
- Commuting / education;
- Personal business (including shopping, health, social purpose, etc.);
- Holiday / day trip / business trip
After that, these groups were sub-categorized based on frequency of travel:
- Travellers who use public transport and services with regularity;
- Travellers who use public transport regularly but infrequently user
services;
- Travellers who do not use public transport, are uncertain of the services, or
who only infrequently use services.
Besides these groups, the accessibility audit considered the needs and
requirements of disables persons with various impairments and of user groups
whose mobility is, or might be restricted. SWITCH defined these groups as follows:
- The elderly;
- Persons using wheelchairs and pushchairs;
- Persons with heavy luggage;
- Pregnant women;
- Persons who are overweight;

Contract: TCP8-GA-2009-234082
Authors: Macário, Reis et al.
Partner Responsible: IST
Dissemination Level: CO
Page: 81 of 181 Date: 07 Apri l 2012
- Persons who are particularly tall or short;
- Persons with visual and hearing impairments;
- Persons with learning difficulties.
The needs for elderly people were studied and defined by Müller et al. (2004). It is
a fact that this target group has several special needs and requirements that have
to be taken in account when investing in future passenger intermodality. In the UK,
a qualitative DfT-funded research programme based on focus group conversations
is a good example of the way the needs and requirements of this target group have
been gathered. The following issues were revealed:
- The importance of accessibility at interchanges (more specifically the
accessibility on foot is important due to problems with steps and limited
access for wheelchair users);
- The lack of staff that can help elderly people at an interchange is seen as a
weakness;
- Security and safety issues are getting more importance (e.g. the train is not
favoured by elderly people due to overcrowded stations);
- The need of better information systems.
Travellers with special needs may be considered as one of the travel profiles to
consider when planning intermodal arrangements. CEN Workgroup (2003) goes
further and affirms that user needs should be defined taking into account needs of
impaired people as a basis for standard requirements.
MIMIC (1999) also contains information on intermodal needs for the special users:
“Certain categories of passengers need special information (people with hearing or
sight problems, people with learning difficulties). Acoustic signals and Braille maps
can significantly help blind passengers. Good practice is given by the new
underground stations on line A, recently opened in Rome (e.g. Musei Vaticani, Valle
Aurelia), where Braille maps of the site and guided routes for blind people are
available. Acoustic information for blind people can be found at most bus stops in
Manchester”.
Doc. Id: HERMES_WP6_IST_D6_Final
Doc. Title: Handbook on Enhanced Business Models
Doc. Version: Final
Contract: TCP8-GA-2009-234082
Date: 07 April2011 Page: 82 of 181
Probably, the most complete characterization of intermodal users’ profiles was
found on the deliverable D61 of the EuroTraCS project (1997). This project divided
intermodal travelers in seven categories compiling information like purpose of
trips, frequency of intermodal traveling and personal characteristics. The
categories defined were:
- The Experts;
- The Falsely-Experienced (Rebels);
- The Obsessed;
- The Investigators;
- The Intimidated;
- The Followers;
- The Calm and Collected.
A definition of the characteristics, strategies in dealing with multimodal journeys,
spatial conduct, and specific needs for each of these profiles is given on the project
report. Due to the length of this information, a table with all the relevant
information was created and can be found on Annex I.
3.3.2.2 Analysis
Since all these case studies are related with transport terminals or transport
connections, passengers are diversified. Nevertheless, for some case studies the
main customers’ group are travelling for tourism or leisure and in others for
business purposes.
Faro Airport (CS7), for example presents more than 80% of customers travelling
for tourism in 2010, and more than 53% with family. The most common choice of
land transport to leave the airport is rent-a-car (33%). This airport has more than
5 million passengers per year. On the contrary, Antwerp Airport mainly serves
business people.
Young passengers use Frankfurt-Hahn (CS11) as airport for leisure trips (e.g.
vacation or family visit). Business customers which are a primary segment of other
airports only play a minor role at Hahn airport. The self-image of Hahn is a low

Contract: TCP8-GA-2009-234082
Authors: Macário, Reis et al.
Partner Responsible: IST
Dissemination Level: CO
Page: 83 of 181 Date: 07 Apri l 2012
cost airport which mainly serves price sensitive customers which is underlined by
the trip purpose distribution.
In Long Distance Bus Service case study (CS4) we can notice the two types of
passengers with the same weight depending on the transport mode. For example,
the main passengers’ travel purpose for high speed railway is business.
Nevertheless, for bus trips the main travel purpose is “private reasons” where we
can include leisure and tourism. This is consistent with the principle that tourism
passengers are more price sensitive that business passengers, so they choose a
cheaper transport mode.
3.3.2.3 Prototypes
The Key Partnerships refer to the relationships and agreements established
between companies. Along with the value proposition, the Key Partnership is
another fundamental building block. The concept of integration entails the
establishment of a relationship between different parties – partners, without
adequate partnerships we cannot expect high quality intermodal services.
Therefore, this building block is fundamental in the context of intermodal
transport, and it should be carefully thought and structured in the design phase of
any business modal. There are multiple partnerships, ranging from simple
informal agreements until fusions or joint ventures. The specific degree of
partnership depends on the conditions of the case.
The partnerships may include a variety of possibilities, ranging from simple
commercial agreements to partial or full ownership. Naturally, the latter case
provides a more stable and robust partnership than the former case. The actual
configuration of the partnership would depend on the legal framework and
financial capacity of the various stakeholders. For example, anti-trust regulation
may prevent a transport company to acquire another. In any case, the most
common key partnership is through a commercial agreement, by which the parties
agree on a set of operational and financial aspects, aiming to provide a seamless
travel to passengers. The partnership may include coordination of schedules,
location of stops, tariff integration or single ticketing.

Doc. Id: HERMES_WP6_IST_D6_Final
Doc. Title: Handbook on Enhanced Business Models
Doc. Version: Final
Contract: TCP8-GA-2009-234082
Date: 07 April2011 Page: 84 of 181
The nature of the key partnerships depends on the gap of intermodality. In case of
Gap 1, where the problem is the lack of integration between transport agents, the
following key partnerships are recommended: between the transport operators, or
between the transport operators and terminal manager. The former one refers to
the stakeholders that are directly involved in the transport operation and
therefore are the most influential in the quality of integration of the intermodal
transport service. The latter case occurs when for some reason is preferable to
establish agreement between the transport operator and the terminal manager. In
the case, the partnership between the transport operators is established in an
indirect way through the terminal manager. This could be necessary in situation
when the direct partnership between transport operators is not possible or
feasible.
In what concerns the Gap 2, although the required key partnerships are similar to
the previous Gap, now the most important one is between the terminal operator
and the transport operators, since the transfer process occurs within the terminal.
Nevertheless, direct partnerships between the transport operators may be
necessary. A third partnership may be established between the terminal manager
and the local authorities, when this stakeholder has statutory or legal power over
operations of the terminal or transport operators.
3.3.2.4 Proposals
No changes are expected in the building block Customer Segment vis-à-vis the
current situation. However, since Corridor Peloponnese to Crete is related with a
connection that currently does not exist, potential customer segments were taken
into consideration.
3.3.3 Channels (CH)
3.3.3.1 Definition
Communication, distribution, and sales Channels comprise a company’s interface
with customers. Channels are customer touch points that play an important role in
the customer experience.
Contract: TCP8-GA-2009-234082
Authors: Macário, Reis et al.
Partner Responsible: IST
Dissemination Level: CO
Page: 85 of 181 Date: 07 Apri l 2012
Channels have five distinct phases and each channel can cover some or all of these
phases. We can distinguish between direct and indirect Channels, as well as
between owned and partner Channels. The Channel phases are: awareness,
evaluation, purchase, delivery and after sales
The questions that a company should make are: How are we reaching our Customer
Segments? How are our Channels integrated? Which ones work best
3.3.3.2 Analysis
Multiple channels are used by transport providers and other stakeholders of
transport services to communicate with customers. However, channels to
communicate with their passengers are similar. In many case studies we notice
that all channels are proprietary and transport provider based. This means that
passengers need to use several channels to get information on (and eventually buy
the tickets from) the diverse transport providers.
Websites on the internet are the most common channels mentioned in the case
studies. Airports, Central Stations and transport operators have websites with
information about their services. Faro Airport (CS7), Antwerp Airport (CS8),
Frankfurt-Hahn Airport (CS11), Arlanda Airport (CS2), Part-Dieu Station (CS10),
Gothenburgh Central Station (CS1) are good examples of this.
Terminals (or interchanges) where multiple transport providers operate
sometimes use a common instrument to spread information, namely through audio
or posters. This is the case, for example, of Avenida de America (CS3) and Long
Distance Bus Service (CS4) case studies.
Information desks are also a common channel. All airports have this service and
information desks are managed by airlines and land transport operators.
Moreover, terminals like Long Distance Bus Service (CS4), Gothenburg Central
Station (CS1) and Part-Dieu (CS10) for instance, also present these information
desks.
Information displays about transport schedules are present at all airports.
Moreover, stations like Part-Dieu (CS10) or Gothenburg (CS1) for instance, also
have these displays to spread information about railway schedules. The main

Doc. Id: HERMES_WP6_IST_D6_Final
Doc. Title: Handbook on Enhanced Business Models
Doc. Version: Final
Contract: TCP8-GA-2009-234082
Date: 07 April2011 Page: 86 of 181
difficulty identified is the integration of the information of different transport
operators.
In the case of Port of Patras (CS9) for instance, advertising through media
represents another mentioned channel to spread information and raise awareness
of transport service.
3.3.3.3 Prototypes
The Channels establish bridges of interaction between the stakeholders and
between these and the passengers. Important to refer that these interactions
generate bi-directional communication flows. As such, channels create the
conditions for stakeholders to convey information on transport services to their
passengers and to obtain feedback and reactions from their passengers.
Increasingly, channels are the cornerstone of business models, as they allow
companies to tailor and customise their services to the customers’ needs and
preferences, as well as, to provide customers the opportunity to interact and bring
forward their point of view. Therefore, if adequately deployed the channels are
powerful options for competitive enhancement.
The traditional communications channels (such as: telephone, post or fax) are
being rapidly replaced by others (such as: mails, social networks or mobile
applications) as Internet and other communication technologies spread and get
wide acceptance by customers of all ages. Naturally youngsters are more prone to
use the new technologies, adults and elderly remain faithful to the traditional
channels. Therefore, companies must master and invest in a wide range of
channels.
Similar channels are proposed for both prototypes of business models, although
they will be used in different ways to achieve different activities and value
proposition. The choice of the channels depends on the actual case. It is not our
purpose to do an exhaustive identification of all channels but just to point out for
the key ones.
Despite the relevance of Internet, face to face (or voice to voice) channels remain
fundamental in most situations. Passengers like (and feel more comfortable) to
Contract: TCP8-GA-2009-234082
Authors: Macário, Reis et al.
Partner Responsible: IST
Dissemination Level: CO
Page: 87 of 181 Date: 07 Apri l 2012
have someone to speak with and present their doubts. As such, reception desks
should not be eliminated nor telephone numbers.
Other relevant category of channels (and often neglected) are the paper-based,
such as: leaflets, maps, brochures and posters. Despite being static they remain
important communication channels, in particular, because customers may carry
them. Increasingly, these channels are being replaced by technological devices,
such as: handhelds, smartphones, tablets and even digital boards. As a
consequence, information is no longer static but rather dynamical, enabling
companies to offer real time information and providing customers an improved
transport experience.
Recent channels include the websites, e-mail contacts and other social network
contacts (such as: Facebook). Web based channels have major advantages
including the possibility of offering real time information and interaction with the
passengers. Also, owing to increasing popularity of social networks, these are
becoming fundamental channels for advertising and capturing the passengers.
3.3.3.4 Proposals
No relevant changes are expected at the channels. New transport connections will
be provided by a new transport operator or by an existing one. Nevertheless,
common channels mentioned to sell tickets, provide information, etc., will remain
the same.
Integration of tickets may be a concern of the new proposals since it is our
understanding that this option improves interconnectivity.
For Faro Airport case study it is pointed out that besides the basic sales channel
another foreseen channel is selling tickets for the new transport service on board
aircrafts. This will imply the establishment of a commercial agreement with the air
transport companies.
Improvements on logical integration of information is also an option, channels will
be subject of change. Information displays with real-time integrated information,
suggested for instance in Avenida de America (CS3) and Long Distance Bus Service
(CS4) case studies, represent a new channel that currently do not exist.

Doc. Id: HERMES_WP6_IST_D6_Final
Doc. Title: Handbook on Enhanced Business Models
Doc. Version: Final
Contract: TCP8-GA-2009-234082
Date: 07 April2011 Page: 88 of 181
Despite website is mentioned in all case studies as a channel of information, only in
the case study of Port of Patras (CS9) and Airport of Faro (CS7) it is suggested
ticket sell through it.
Besides these changes, no other significant alterations are expected on channels
building block comparing with the current situation.
3.3.4 Customer Relationships (CR)
3.3.4.1 Definition
A company should clarify the type of relationship it wants to establish with each
Customer Segment which can range from personal to automated and may be
driven by the following motivations: customer acquisition, customer retention and
boosting sales.
We can distinguish between several categories of Customer Relationships, which
may co-exist in a company’s relationship with a particular Customer Segment:
personal assistance, dedicated personal assistance, self-service, automated
services, communities and co-creation.
The questions that a company should make are: What type of relationship does each
of our Customer Segments expect us to establish and maintain with them?
3.3.4.2 Analysis
We did not identify strong relationships between stakeholders and their customers
besides the actual delivery of the service in general. Several cases were found in
which different stakeholders in the same case do not have any kind of relationship.
Those who have invested in building some sort of relationship with their
customers use the typical loyalty programs or offer cheaper bundled services.
Nevertheless, there are few examples of customer relationship worth of being
mentioned.
For instance, in the Corridor Peloponnese to Crete (CS5) ferry services have
rewards programs for frequent travellers which offer benefits in the form of
discounts, participation in promotions and special offers.

Contract: TCP8-GA-2009-234082
Authors: Macário, Reis et al.
Partner Responsible: IST
Dissemination Level: CO
Page: 89 of 181 Date: 07 Apri l 2012
In Port of Patras case study (CS9) it was noticed that major customer relationship
is assured by desk information and ticket-selling desks. This is also the case at
Gothenburg and Part-Dieu stations (CS10), where besides that automated services
there are also personnel available at the sites to sell tickets and give information.
Studied airports (Faro (CS7), Arlanda (CS2), Antwerp (CS8) and Frankfurt-Hahn
(CS11)) also present this kind of desks that are managed by airlines. Nevertheless,
Antwerp Airport (CS8) as well as Faro Airport (CS7) has little interaction with
customers. This is also true for Frankfurt-Hahn Airport (CS11) since the demand is
represented by highly price-sensitive customers so customer relationship
programs do not play a role and are not offered by the air transport operators
(since they are LCCs). Arlanda Airport (CS2) presents more interaction with
customers since it has a large desk to provide assistance and information to
passengers concerning land transport modes.
Some transport operators offers cards and discounts for frequent customers. For
instance, in Avenida de America case study (CS3) it was noticed that bus company
“Alsa” offers a card that supports schemes for discounts in tickets and other
advantages to its customers. Spanish railway operator, RENFE, presents discounts
for frequent users and young or elderly customers as it was noticed in Long
Distance Bus Service case study (CS3).
3.3.4.3 Prototypes
Customer relationships are the foundation for any successful activity in a
competitive environment. Without an adequate relationship, the customers will
likely move to other competitors. Therefore any company must deploy significant
efforts to build a strong and perennial relationship with the customers. This is
even truer in public transport that faces a chronic negative image and needs to
establish strong relationships with passengers.
The prototypes of business models differ in terms of the nature of the customer
relationships. Such difference results from the positioning and power of the target
stakeholder. Prototype of Gap 1 deals with transport operators, whereas Prototype
of Gap 2 deals with the terminal manager. The transport operators have a strong, if
not fundamental, influence in attracting and capturing passengers. As it is obvious

Doc. Id: HERMES_WP6_IST_D6_Final
Doc. Title: Handbook on Enhanced Business Models
Doc. Version: Final
Contract: TCP8-GA-2009-234082
Date: 07 April2011 Page: 90 of 181
an adequate transport service (in terms of destinations, schedules, tariffs, etc.) may
bring more people into the transport system. In addition, if they provide a good
travel experience, passengers will be more willing to return.
Conversely, the terminal manager has little influence in attracting passengers. The
passengers results from the existence of transport services, if not transport
operators serves a terminal than hardly it will have passengers. Instead, the
terminal manager can play a decisive role in contributing to a good travel
experience. Indeed, many passengers see the terminal as an extension of the
transport service.
In summary, transport providers are fundamental to attract passenger and provide
good travel experience, while the terminal manager can contribute to a good travel
experience. As a consequence, the customer relationships in both prototypes are
fundamentally different, and much more relevant in Gap 1 than Gap 2.
In what concerns Prototype of Gap 1, the customer relationship must thus target
both attraction and retaining of passengers. There are several solutions to achieve
these goals. The former purpose may be achieved through the discounts or bundles
of services. The bundles of services refer for example to the tariff integration
between transport services. In addition, discounts may be offered for certain
destination, on certain period of the day or for certain type of passengers (e.g.:
youngsters). The latter purpose may be achieved through the well-known
rewarding systems, in which the passenger received bonus by travelling on a
certain transport operator or operators. Also, passenger may receive discounts in
third party partners (for example: discount vouchers in stores at the terminal).
Looking now into Prototype of Gap 2, the customer relationship has a different
nature, as explained above. The terminal is often seen as an extension of the
transport service. As such the terminal operator may collaborate with transport
operator to offer added value services, such as: lounges for customers or discount
on parking and other services (as part of transport operators’ rewarding system).
In addition, terminal operators may create thematic areas for different passengers
(e.g.: playground for youngsters, entertainment areas, or commercial and retail
areas). Other potential customer relationship arises from the utilisation of retail

Contract: TCP8-GA-2009-234082
Authors: Macário, Reis et al.
Partner Responsible: IST
Dissemination Level: CO
Page: 91 of 181 Date: 07 Apri l 2012
and business areas. Terminal manager may implement a rewarding system in
retail areas (in which customers get discounts in function of the amount of shops)
and bundle services in the business areas (for example: discount in hotel
accommodation is a meeting room is booked). Eventually, customers may prefer to
go through the terminal, which may influence the choice of the transport operator.
3.3.4.4 Proposals
If a new transport provider will operate the proposed services, then a system for
customer relationships must be established, namely for claims, and particularly for
objects forgotten aboard the bus, both on the arriving and on the departing bit of
their trips. Sales and information could also be provided through desks to increase
customer relationships as it was mentioned on the case studies.
However, no significant changes are expected in the building block Customer
Relationships vis-à-vis the current situation.
Customer relationship is service-based. Customers can interact at the sites with
transport providers or terminals managers as it was described for the current
situation. The channels, especially the website will improve customer relationship
but no significant changes are expected.
3.3.5 Revenue Streams (R$)
3.3.5.1 Definition
If customers comprise the heart of a business model, Revenue Streams are its
arteries. A company must ask itself, For what value is each Customer Segment truly
willing to pay? Successfully answering that question allows the firm to generate
one or more Revenue Streams form each Customer Segment.
There are several ways to generate Revenue Streams: asset sale, usage free,
subscription fees, lending/renting/leasing, licensing, brokerage fees and
advertising.
The questions that a company should make are: For what do our customers
currently pay? How much does each RS contribute to overall revenues?

Doc. Id: HERMES_WP6_IST_D6_Final
Doc. Title: Handbook on Enhanced Business Models
Doc. Version: Final
Contract: TCP8-GA-2009-234082
Date: 07 April2011 Page: 92 of 181
3.3.5.2 Analysis
The main revenue stream of transport providers operating at the studied sites is
ticket sales. Transport operators feed the revenue streams of the terminal since
they pay for using the interchange as it is noticed, for example in Long Distance
Bus Service (CS4) and Avenida de America (CS3) case studies. In the latter case
study it is also highlighted that the rental of commercial premises and the parking
revenues are other revenue streams. This also happens in other case studies such
as Gothenburg Central Station, but in this case municipalities contribute with more
than 40% of the revenues.
Government participation is also mentioned in Antwerp Airport (CS8), since the
Flemish Government contributes with subsidies. Advertising revenue is relatively
low for all case studies where this revenue is mentioned for example Gothenburg
Central Station (CS1), Faro Airport (CS7) and Avenida de America (CS3).
The main revenue streams for the airports are fees paid by airlines to operate.
This is the case of Faro (CS7), Arlanda (CS2), Frankfurt-Hahn (CS11) and Antwerp
airports (CS8). Aviation revenues include landing fees, passenger charges, etc. As it
is noticed on Arlanda case study, other important revenues come from non-
aviation revenues such as parking fees, commercial site rentals, office rentals,
advertising spaces and commercial services. Stakeholders who want to operate at
the interchange have to accept both conditions and fees set up by the terminal
manager.
3.3.5.3 Prototypes
The Revenues Streams refers to the sources of revenues (or income) resulting
from the provision of the services. Revenues may have multiple sources, some of
which may not be related with the actual service but resulting from its provision
(for example: revenues with publicity). Revenue is the ultimate reason for a
company, in a competitive and open market. As such, the identification of the
revenues streams is fundamental to ensure the sustainability of the business. In
the particular case of public transport this is not necessarily true, since other goals
could play a more important role. The revenues streams steam from the
Contract: TCP8-GA-2009-234082
Authors: Macário, Reis et al.
Partner Responsible: IST
Dissemination Level: CO
Page: 93 of 181 Date: 07 Apri l 2012
achievement of the value proposition. A sound robust value proposition will result
in growing revenues.
Few revenue streams have been identified in the prototypes. In what concerns the
Prototype of Gap 1, the main revenue streams are related with the provision of
transport services. Consequently, the main transport-related revenue stream is
related with the selling of tickets. Another transport-related revenue stream is the
public subsidies. This stream can be particularly relevant in the case of public
transportation. Non-transport-related streams include the advertising on board or
through the communication channels.
Concerning the Prototype of Gap 2, the revenue streams are somewhat different. A
key factor is related with the fact that the terminal manager does not sell tickets. In
this sense, transport-related revenues include fees paid by the transport operators
to use the terminal or public subsidies. Non-transport-related revenues stream
include: advertisement within the terminal station, renting (or selling) of
commercial spaces (such as: retail or other business activities), or parking
revenues.
3.3.5.4 Proposals
General consideration regarding this building block for case with issues on the
links are that the transport provider which will operate the new proposed services
(when they are introduced), would collect all the direct revenues from the various
sales channels. Additional sources may include advertisement on board the
vehicles or on the internet website. No significant changes are expected for
RevenueStreams vis-à-vis the current situation.
Revenue streams of transport operators are expected to increase in the case of
situation with issues on the links, due to a rise of customer demand as it is pointed
out on Port of Patras case study (CS9). If integrated tickets are implemented,
revenue streams should not decrease but origin should change since customers
will not be the direct source (another entity will manage the shares). Besides this,
no other significant changes are expected on revenues streams building block
when comparing to the current one.

Doc. Id: HERMES_WP6_IST_D6_Final
Doc. Title: Handbook on Enhanced Business Models
Doc. Version: Final
Contract: TCP8-GA-2009-234082
Date: 07 April2011 Page: 94 of 181
3.3.6 Key Resources (KS)
3.3.6.1 Definition
Every business model requires Key Resources which allow an enterprise to create
and offer a Value Proposition, reach markets, maintain relationships with
Customer Segments, and earn revenues. Different Key Resources are needed
depending on the type of business model.
Key Resources can be physical, financial, intellectual or human.
The questions that a company should make are: What Key Resources do our Value
Propositions require?
3.3.6.2 Analysis
On each case study there are several stakeholders and each one of them has its
own set of key resources depending on its business and positioning in the
transport chain. In general terms the resources can be divided into the following
types in the case studies:
• Vehicles;
• Infrastructure
o Physical infrastructure (includes: airport terminal, parking lots,
parking stands, front desks, etc);
o Technological infrastructure (includes: websites, communication
systems, etc);
• Human Resources.
3.3.6.3 Prototypes
The Key Resources refer to a stakeholder’s assets and capabilities that enables
the production and fulfilment of the key activities and thus to contribute to the
fulfilment of the Value Propositions reach markets, maintain relationships with
Customer Segments and earn revenues. In this sense, a resource can be tangible or
intangible in nature, if it has or not a physical property. The tangible resources can
be denominated as assets, while the intangible ones can be denominated as
capabilities.

Contract: TCP8-GA-2009-234082
Authors: Macário, Reis et al.
Partner Responsible: IST
Dissemination Level: CO
Page: 95 of 181 Date: 07 Apri l 2012
As such, the assets refer to the physical objects that a stakeholder has to perform
the key activities. These may include the fleet of vehicles, the terminals, or the
computational and information systems. The capabilities refer to the nonphysical
factors such as knowledge of the market, know-how or even market reputation.
The intangible resources can be as much or more relevant as the tangible ones,
since without adequate capabilities the assets may be useless and underutilised
(for example: it is irrelevant to have a brand new fleet of buses, if the schedules are
poorly designed; likewise, a good market reputation may be destroyed if vehicles’
maintenance is not adequate). Therefore, the right set of resources results from a
delicate balance between the assets and the capabilities to exploit them.
Furthermore, the set of resources (assets and capabilities) must be chosen to fulfil
the activities.
In the case of Prototype for Gap 1 the resources are diverse and include both assets
and capabilities. The main assets are the fleet of vehicles and the information
system. Yet, the key resources are related with the capabilities. The first capability
is related with the knowledge of the local market by the short distance transport
operator. Indeed, this operator typically has a better knowledge of the local market
than the long distance transport operator, simply because all of its attention and
efforts are dedicated on this market. A second capability is related with the market
brand of the long distance transport operator. Usually, the long distance transport
operator has a better market image (being more known that the local operator)
and reputation. Therefore, by mixing these resources the transport operations may
achieve the abovementioned activities.
Prototype for Gap 2 has a rather different nature being focus on the terminal,
nevertheless, the resources include again both assets and capabilities. The assets
include the physical terminal, all of its equipment (such as: elevators or escalators)
and the information and telematics systems, in practical terms, the physical objects
that are inside the terminal. The capabilities are again very valuable including
knowledge about the passengers’ needs and preferences, or knowledge on the
market split and origin and destination (for example: knowing the origin and
Doc. Id: HERMES_WP6_IST_D6_Final
Doc. Title: Handbook on Enhanced Business Models
Doc. Version: Final
Contract: TCP8-GA-2009-234082
Date: 07 April2011 Page: 96 of 181
destination of passengers is necessary to decide which services are closer and
those than can be apart).
3.3.6.4 Proposals
The services proposed will entail a new set of resources, including: fleet of vehicles
(such as: road vehicles or trains), human resources (such as: drivers or other
administrative staff), infrastructure (such as: administrative buildings, parking
lots, railways tracks or terminal) or technological infrastructure (such as: IT
infrastructure, signalling posts and panels, or escalators). Case studies that present
as a solution to the current interconnectivity problems a new transport connection
mentioned these resources.
If a current transport provider decides to operate this service, we can observe that
despite the fact that some resources are already available it will be necessary to
invest in the fleet or employees (for instance, drivers).
As it is mentioned in Gothenburg Central Station case study (CS1), information is
going to be the key resource. Human resources can include IT-technicians,
marketing managers, staff at the site and office. Most of these resources are
already available at the site (for example, offices, marketing managers)
No significant changes are expected for Key resources vis-à-vis the current
situation.
3.3.7 Key Activities (KA)
3.3.7.1 Definition
Every business model calls for a number of Key Activities and these are the most
important actions a company must take to operate successfully. Like Key
Resources, they are required to create and offer a Value Proposition, reach
markets, maintain Customer Relationships, and earn revenues.
Key Activities differ depending on business model type and can be categorized as
follows: production, problem solving and platform/network.
The questions that a company should make are: What Key Activities do our Value
Propositions require?

Contract: TCP8-GA-2009-234082
Authors: Macário, Reis et al.
Partner Responsible: IST
Dissemination Level: CO
Page: 97 of 181 Date: 07 Apri l 2012
3.3.7.2 Analysis
The key activities are related with the provision of transport services. Like the
previous building block, the activities are function of the stakeholder’s positioning
in the transport chain for each case study.
In general terms, key activities described for all case studies can be divided in the
following ones: customer oriented activities or stakeholder (or company) oriented
activities. Customer oriented activities are pointed out as being information and
marketing, tickets selling, transferring (resting and foods areas), transport service,
parking. Company oriented activities are mainly financing and economics (related
with the assessment of costs, revenues, financing and similar activities), planning
and management operations (schedule, services), monitoring, maintenance and
security.
3.3.7.3 Prototypes
The Key Activities refer to the most important actions a company must take to
operate successfully. The activities are identified in function of the need to achieve
the proposed value propositions and, often, due to the establishment of certain
partnerships. Therefore, they have to be decided and implemented in function of
the actual conditions. As such, in the prototypes we included a set of activities that
should be deployed in order to ensure an adequate fulfilment of the value
propositions. The activities can also be divided accordingly with the visibility
towards the passenger. The point is that not all activities need to be passenger
oriented and, indeed, some activities although not being visible to the passenger,
are necessary for an improved intermodality.
Prototype of Gap 1 aims to bridge the lack of intermodality owing an inadequate
integration of the transport services. In these situations, the activities should be
focussed on streamlining and aligning the various transport legs into a single
transport experience. As such, the prototype identified three types of activities,
being: of operational nature, of financial nature, and of organizational nature. The
first two are eminently passenger-oriented while the latter one is internal to the
transport companies. The activities related with the operations should result in a

Doc. Id: HERMES_WP6_IST_D6_Final
Doc. Title: Handbook on Enhanced Business Models
Doc. Version: Final
Contract: TCP8-GA-2009-234082
Date: 07 April2011 Page: 98 of 181
seamless transport experience to the passengers. The awaiting time should be
minimised, as well as, the distances between modes of transport. Also, in the case
of luggage, it should be conveyed to the final destination without the passengers
having to handle it at the transfer points.
Activities of operational nature include the coordination of schedules of the
transport services, the harmonisation of the transport capacities in the various
transport legs (in order to avoid queues), or offering a single ticket (or at least the
possibility of acquire on board the ticket for the next leg). The activities of financial
nature are essentially related with tariff integration. Indeed, a key activity is
related with the agreement on the tariff and the consequence split of revenues.
Finally, the activities related with the organisation of the transport service refer to
those activities that allow the transport operators to control and monitor the
transport services (including the other transport operators’ services), such as:
integration of the information systems.
Prototype of Gap 2 aims to improve the quality of the transfer process within a
terminal. In this case, most of the activities are to be implemented by the terminal
manager, although some are under the responsibility of the transport operators.
Also, activities will essentially aim to offer passengers a confortable, easy and
simple way to transfer between modes of transport, as such many activities will be
passenger-oriented. Again three types of activities are herein proposed, including:
information to passenger, reduction of transfer distance, and improve the comfort
level of the terminal.
In what concerns the first type of activities, the purpose is to implement a set of
activities to improve the quality and amount of information provided to the
passenger. The passenger must at any moment easily to understand where they
are. Activities include static and dynamic information (such as: applications for
smart phones). The success of this type of activities is often based on an adequate
integration with the transport operators. Indeed, if the terminal manager aims to
provide accurate information about the transport services that entails to known
their location and expected arrival and departure times, which naturally implies an
integration and communication with the transport operators.

Contract: TCP8-GA-2009-234082
Authors: Macário, Reis et al.
Partner Responsible: IST
Dissemination Level: CO
Page: 99 of 181 Date: 07 Apri l 2012
Looking now to the second type of activities, the concept of transfer distance
should be understood in a more broad sense also embracing a time component,
besides the physical component. Therefore, if fast transfer processes are deployed
(such as: people’s movers), even in cases of considerable physical distance the
transfer time may be reduced. Activities include the introduction of elevators or
escalators to help passenger move between different levels, or the organisation of
the transport services so that those with high level of transfer are closer (or in
adjacent quays). Finally, the third type of activities includes a wide range of
activities aiming to make passengers’ experience within the terminal as
confortable and enjoyable as possible. This include: adequate illumination of the
spaces, heating or cooling the air, cleaning and maintaining the facilities, or having
a high level of security and safety.
3.3.7.4 Proposals
The introduction of a new transport connection generates a new key activity at the
sites for all case studies. This new activity will be similar to other activities related
with transport operators and their positioning in the market.
We expect in all cases a change in transport structure (that we can observe on the
agents graphical representation of the case studies) and an improvement on
interconnectivity at the sites.
In the situation with problems in the nodes, the results are case specific although
some similarities may be identified. Major activities will be: gather information,
integrate information from different transport operators and to distribute
integrated information to the customers. This is valid for each one of the six case
studies, since all of them mentioned information improvements. Besides this, no
significant changes are expected for Key Activities vis-à-vis the current situation.

Doc. Id: HERMES_WP6_IST_D6_Final
Doc. Title: Handbook on Enhanced Business Models
Doc. Version: Final
Contract: TCP8-GA-2009-234082
Date: 07 April2011 Page: 100 of 181
3.3.8 Key Partnerships (KP)
3.3.8.1 Definition
Companies forge partnerships for many reasons, and partnerships are becoming a
cornerstone of many business models. Companies create alliances to optimize their
business models, reduce risk, or acquire resources.
We can distinguish between four different types of partnerships: strategic alliances
between non-competitors, strategic partnerships between competitors
(coopetition), joint ventures to develop new business and buyer-supplier
relationships to assure reliable supplies.
The questions that a company should make are: Who are our Key Partners? Who
are our key suppliers? Which Key Resources are we acquiring from partners?
3.3.8.2 Analysis
Few relevant partnerships have been identified in the case studies. Nevertheless,
some case studies are richer than others in this aspect.
Airport case studies (Arlanda (CS2), Faro (CS7), Frankfurt-Hahn (CS11) and
Antwerp (CS8)) present only partnerships between airlines and the airport
manager. In Avenida de America (CS3) and Long Distance Bus Service (CS4) no
partnerships were pointed out. Public companies are responsible for managing the
terminals and they do not have any partnerships with other companies. However,
we can notice that transport providers that operate at the site do have contractual
agreements with the terminal managers.
Frankfurt-Hahn (CS11) and Arlanda (CS2) present evidence of schedule
integration between airlines and land transport and in the latter case, it is also
noticed that there are several transport operators providing similar services which
increases competition but not partnerships.
3.3.8.3 Prototypes
The Key Partnerships refer to the relationships and agreements established
between companies. Along with the value proposition, the Key Partnership is
another fundamental building block. The concept of integration entails the

Contract: TCP8-GA-2009-234082
Authors: Macário, Reis et al.
Partner Responsible: IST
Dissemination Level: CO
Page: 101 of 181 Date: 07 Apri l 2012
establishment of a relationship between different parties – partners, without
adequate partnerships we cannot expect high quality intermodal services.
Therefore, this building block is fundamental in the context of intermodal
transport, and it should be carefully thought and structured in the design phase of
any business modal. There are multiple partnerships, ranging from simple
informal agreements until fusions or joint ventures. The specific degree of
partnership depends on the conditions of the case.
The partnerships may include a variety of possibilities, ranging from simple
commercial agreements to partial or full ownership. Naturally, the latter case
provides a more stable and robust partnership than the former case. The actual
configuration of the partnership would depend on the legal framework and
financial capacity of the various stakeholders. For example, anti-trust regulation
may prevent a transport company to acquire another. In any case, the most
common key partnership is through a commercial agreement, by which the parties
agree on a set of operational and financial aspects, aiming to provide a seamless
travel to passengers. The partnership may include coordination of schedules,
location of stops, tariff integration or single ticketing.
The nature of the key partnerships depends on the gap of intermodality. In case of
Gap 1, where the problem is the lack of integration between transport agents, the
following key partnerships are recommended: between the transport operators, or
between the transport operators and terminal manager. The former one refers to
the stakeholders that are directly involved in the transport operation and
therefore are the most influential in the quality of integration of the intermodal
transport service. The latter case occurs when for some reason is preferable to
establish agreement between the transport operator and the terminal manager. In
the case, the partnership between the transport operators is established in an
indirect way through the terminal manager. This could be necessary in situation
when the direct partnership between transport operators is not possible or
feasible.
In what concerns the Gap 2, although the required key partnerships are similar to
the previous Gap, now the most important one is between the terminal operator

Doc. Id: HERMES_WP6_IST_D6_Final
Doc. Title: Handbook on Enhanced Business Models
Doc. Version: Final
Contract: TCP8-GA-2009-234082
Date: 07 April2011 Page: 102 of 181
and the transport operators, since the transfer process occurs within the terminal.
Nevertheless, direct partnerships between the transport operators may be
necessary. A third partnership may be established between the terminal manager
and the local authorities, when this stakeholder has statutory or legal power over
operations of the terminal or transport operators.
3.3.8.4 Proposals
In situation with gap on the links, we can notice that transport operators have to
fulfil certain requirements of transport regulation and also to accept some aspects
in order to operate at the terminals. Some new partnerships are suggested in the
case studies, for example in Faro Airport with hotels and other transport
operators. But once again, those are specific of each case study.
In the situation with gaps on the node the most common partnerships among the
six case studies are related with transport operators, terminal managers and
public decision makers. But they are specific of each case study, so there are no
relevant similarities to point out.
3.3.9 Cost Structure (C$)
3.3.9.1 Definition
This building block describes the most important costs incurred while operating
under a particular business model. Creating and delivering value, maintaining
Customer Relationships, and generating revenue all incur costs. Such costs can be
calculated relatively easily after defining Key Resources, Key Activities, and Key
Partnerships.
There are two broad classes: cost-driven (minimizing costs) and value-driven
(focus on value creation). Cost Structures can have the following characteristics:
fixed costs, variable costs, economies of scale and economies of scope.
The questions that a company should make are: What are the most important costs
inherent in our business model? Which Key Resources and Key Activities are most
expensive?

Contract: TCP8-GA-2009-234082
Authors: Macário, Reis et al.
Partner Responsible: IST
Dissemination Level: CO
Page: 103 of 181 Date: 07 Apri l 2012
3.3.9.2 Analysis
It is possible to observe in all case studies that the cost structure is specific of each
stakeholder. Yet, the main items of the cost structure for all case studies include:
human resources, vehicle and fleet (acquisition, rental and maintenance),
infrastructure (planning, building and maintenance), fuel, debt, amortization and
other taxes.
Transport operators are described in the case studies as interested in minimising
costs with the four main items mentioned above and indirectly in increasing
revenues.
3.3.9.3 Prototypes
The Cost Structure refers to the various cost incurred in the provision of the
service. In a competitive environment, companies keep a good track of their costs,
as it is fundamental to ensure the profitability and survivability. The same is not
necessarily true in some public companies. In such eventual case an analysis to the
cost structure is required. The actual costs structure will be the consequence of the
type of resources and set of activities necessary to achieve the value proposition.
As such, the cost structure may be only defined after the definition of these and
other building blocks. In any case, the main cost item can be identified.
In what concerns the Prototype for Gap 1, the main cost items are related with the
provision of transport services and with the integration between transport
services. The former includes cost items such as: acquisition and maintenance of
vehicles, fuel, tolls, amortization, insurance, taxes, communication costs, physical
and technological infrastructure, or human resources. The latter costs are not so
evident or easy to calculate but nevertheless should not be ignored. They include
for example, the costs resultant from a change in schedule (this change may lead to
the loss of passenger or the need to add new services), the costs owing to the tariff
integration (tariff integration is not always fair and the transport operator may
incur in losses for some origins and destination), the cost resultant from the
integration of the information systems (often information systems are not
interoperable and investments are need to achieve it), or even the costs in human

Doc. Id: HERMES_WP6_IST_D6_Final
Doc. Title: Handbook on Enhanced Business Models
Doc. Version: Final
Contract: TCP8-GA-2009-234082
Date: 07 April2011 Page: 104 of 181
resources related with the need of employees to communicate and interact with
other transport operators.
In what concerns the Prototype for Gap 2, the cost items are essentially related
with the operation of an intermodal terminal. These include, for example:
construction and maintenance of infrastructure and equipment, utilities (water,
electricity, gas, etc.), human resources or communications. Also, costs of
integration may occur and therefore should be taken into consideration. These are
similar to the ones described for Gap 1.
3.3.9.4 Proposals
In the case of situation with gaps on the links no significant changes are expected
for Cost Structure vis-à-vis the current situation. However, if a new transport
operator is required than it will represent a new player at the transport operators’
stakeholder group that will contribute the cost structure of terminals, for example.
In the cases with gaps on the nodes the cost structure might be a challenge. One
important cost structure is the share of revenues as it mentioned on Gothenburg
Central Station case study. Probably, the new agents (Traffic Information Brokers)
are going to be private companies and these are going to charge for integrating the
information. Information management is a large cost for many companies and it is
necessary to find solid financial solutions. This is also important for Long Distance
Bus Service (CS4), and Avenida de America (CS3) case studies.
3.3.10 Conclusions
The next diagram (Figure 3.9) presents the chain of relationships between the
various building blocks.
Value Proposition is the cornerstone of a business model, as it defines what the
company envisages offering to its clients, determining the company’s market
positioning. Therefore, it determines the company’s market positioning. As such,
the design of a business model should start with this building block. The Value
Proposition then through a chain reaction will influence all the remaining building
blocks.

Contract: TCP8-GA-2009-234082
Authors: Macário, Reis et al.
Partner Responsible: IST
Dissemination Level: CO
Page: 105 of 181 Date: 07 Apri l 2012
Based on the Value Proposition, the Customer Segment and the Key Activities can be
identified. Indeed, the Value Proposition by determining the company’s positioning
naturally defined the target customers segments.
Figure 3.9 – Interdependencies between the building blocks
As already explained, each Customer Segment has a specific needs and demands,
requiring tailored Customer Relationships and special communication Channels.
Furthermore, the nature Customer Relationships will also influence the type of
Channels to deploy. The relationships with the customers will generate revenue
streams.
The amount and type of Key Activities are those necessary to satisfy the value
proposition. In turn, the Key Activities influence three other building blocks: being:
Customer Relationships, Key Resources and Key Partnerships. The Key Resources
and Key Partnerships are defined in simultaneously. The final set of Key
Partnerships (in practical terms meaning the outsourcing of some activities) is
function, amongst other factors, of the available resources.
The Key Partnerships and the Key Resources represent costs and therefore
contribute to the Cost Structure of the company. Ultimately, the interplay between
Customers Relationships Value
Proposition Key Activities
Key Resources
Key Partners Cost
Structure
Customers Segments
Revenue Streams
Channels
\

Doc. Id: HERMES_WP6_IST_D6_Final
Doc. Title: Handbook on Enhanced Business Models
Doc. Version: Final
Contract: TCP8-GA-2009-234082
Date: 07 April2011 Page: 106 of 181
the Revenues Streams and the Cost Structure will determine the potential success
of the Value Proposition and the Business Model.
Multiple combinations of the building blocks should be tested and analysed in
order to identify the most potentially successfully business models. In all cases,
these interdependences should be taken into consideration during this stage.
Figure 3.10 and Figure 3.11 present the business model for two case studies
(Airport of Faro and Part Dieu Station), built upon the prototypes of business
models, along the chain of interactions.
The first building block to be defined is the Value Proposition and then the others
follow accordingly with the previous explanation. Further explanation on both
business models can be found in the Deliverable of WP5.
Figure 3.10 – Business model for the Case Study – Airport of Faro

Contract: TCP8-GA-2009-234082
Authors: Macário, Reis et al.
Partner Responsible: IST
Dissemination Level: CO
Page: 107 of 181 Date: 07 Apri l 2012
Figure 3.11 – Business Model for the Case Study - Part Dieu Station
4 Deployment of Prototypes of Business Models
As already explained a prototype is not by itself a business model but a guide in the
development process of a business model in a real world context. It is therefore
important to discuss how to use the prototypes. A key aspect to emphasise is the
absence of a single process to developing business models. Indeed, different ways
and method can be deployed to do it. The presentation of concept of business
model and the prototypes and the HERMES Deliverable on the Case Studies
(Deliverable of WP5) already shed some light on this topic. Yet, a systematic
method is herein described. A method based Osterwalder’s (2010) proposal was
adapted to fit into the vast majority of the real world cases in the transportation
sector. The 5-step method is now presented in detail (Figure 4.1).
4.1 Mobilize
In this first phase the main objectives are to frame the objectives, test some
preliminary ideas, planning the design process, and assembling the team.
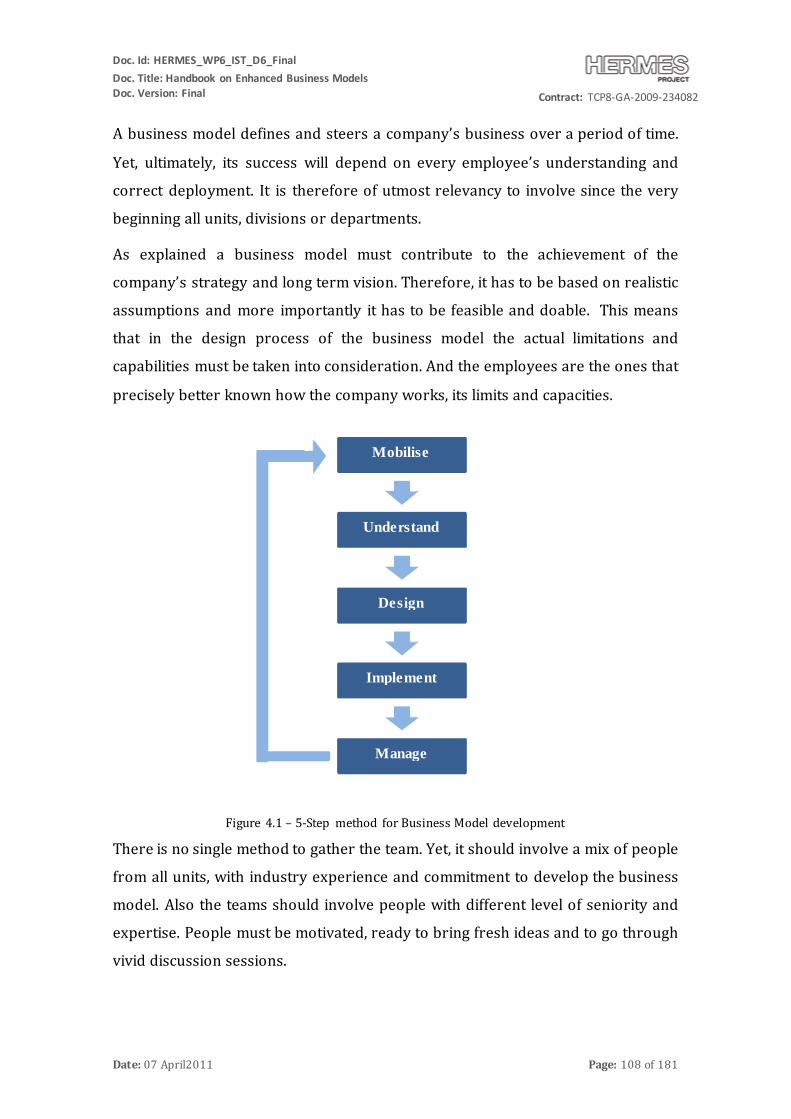
Doc. Id: HERMES_WP6_IST_D6_Final
Doc. Title: Handbook on Enhanced Business Models
Doc. Version: Final
Contract: TCP8-GA-2009-234082
Date: 07 April2011 Page: 108 of 181
A business model defines and steers a company’s business over a period of time.
Yet, ultimately, its success will depend on every employee’s understanding and
correct deployment. It is therefore of utmost relevancy to involve since the very
beginning all units, divisions or departments.
As explained a business model must contribute to the achievement of the
company’s strategy and long term vision. Therefore, it has to be based on realistic
assumptions and more importantly it has to be feasible and doable. This means
that in the design process of the business model the actual limitations and
capabilities must be taken into consideration. And the employees are the ones that
precisely better known how the company works, its limits and capacities.
Figure 4.1 – 5-Step method for Business Model development
There is no single method to gather the team. Yet, it should involve a mix of people
from all units, with industry experience and commitment to develop the business
model. Also the teams should involve people with different level of seniority and
expertise. People must be motivated, ready to bring fresh ideas and to go through
vivid discussion sessions.
Mobilise
Understand
Design
Implement
Manage

Contract: TCP8-GA-2009-234082
Authors: Macário, Reis et al.
Partner Responsible: IST
Dissemination Level: CO
Page: 109 of 181 Date: 07 Apri l 2012
In this phase it is also relevant to ensure the legitimacy of the project, that is, the
cooperation and mobilisation of the employees. Without their participation and
acceptance, the business model is likely to fail. Legitimacy is achieved through a
deep and early commitment and participation of the administration board and top
management in the process. This way, employees will perceive the process of
important and necessary for the company’s development.
Also relevant is to manage the blocking or opposing forces within the company.
Not everyone is necessarily interested in changing the status quo or in a new
business models. These employees may undermine the development of the
business model. Such forces must be balanced by calling all employees to
participate in the process and making them confortable with the change.
4.2 Understand
After defined the team that will develop the business model, it is time to pass to the
second step. The main purpose of this phase is to build a strong and robust
understanding about the context in which the company operates. The business
model must prepare the company to face and succeed the competitors and other
constrains.
This step requires in practical terms a mix of activities, such as: market research,
economical studies, customers’ characterisation, or sketching competitors’
business model. This can be done by the team, but ideally should involve third
specialised parties.
The main danger is the risk of conducting research or studies without a real benefit
to the design process. Other potential risk is over researching and the production
of research and analysis that will never be taken into consideration because there
is no time or are so detached from real world that are not applicable. This can be
avoided by defining at the outset the limits and boundaries for the research and to
make everyone aware of such limits.

Doc. Id: HERMES_WP6_IST_D6_Final
Doc. Title: Handbook on Enhanced Business Models
Doc. Version: Final
Contract: TCP8-GA-2009-234082
Date: 07 April2011 Page: 110 of 181
The next diagram offers an interesting and straightforward template for
conducting an analysis to the company’s context. The context is characterised
along four dimensions, being: key trends, industry forces, market forces, and
macro-economic forces. Each dimension is then decoupled into its constitutive
parts in the following tables. The tables also offer additional description about
each part and a set of guiding questions, so that, the reader could have an idea
about what is requested each dimension.
4.3 Design
This step corresponds to the actual design of the business model. At this stage a
multidisciplinary, highly motivated and knowledgeable team on the various
dimensions of the company has been assembled. Also, this team has been engaged
in studying the contextual dimensions of the company. It is now time to start
designing the business model.
Figure 4.2 –Contextual dimensions of analysis (source: Osterwalder, 2010)

Contract: TCP8-GA-2009-234082
Authors: Macário, Reis et al.
Partner Responsible: IST
Dissemination Level: CO
Page: 111 of 181 Date: 07 Apri l 2012
It is important to take into consideration the following critical success factors for a
successful design of a business model. Firstly, it is relevant to stimulate discussion
and generation of breakthrough ideas. To think out of the box is fundamental
request to achieve successful business models. Also, people should be lead to think
in the long term, aligned with the company’s strategy. A business model will
influence a company over a long period of time. Also the business model must
provide the necessary resilience so that the company could survive over time. For
these reasons the time horizon should embrace several years.

Doc. Id: HERMES_WP6_IST_D6_Final
Doc. Title: Handbook on Enhanced Business Models
Doc. Version: Final
Contract: TCP8-GA-2009-234082
Date: 07 April2011 Page: 112 of 181
Table 4.1 – Elements for the analysis of the business context
Market Forces
Market Issues Identifies key issues driving and transforming your market from Customer and Offer perspectives
What are the crucial issues affecting the passengers’ landscape? Which shifts are underway? Where is the market heading?
Market Segments Identifies the major market segments, describes their attractiveness, and seeks to spot new segments
What are the most important Customer Segments? Where is the biggest growth potential? Which segments are declining? Which peripheral segments deserve attention?
Needs and Demands Outlines market needs and analyses how well they are served
What do passengers need? Where are the biggest unsatisfied passengers’ needs? What do passengers really want to get done? Where is demand increasing? Declining?
Switching Costs Describes elements related to customers switching business to competitors
What binds passengers to a transport operator and its offer? What switching costs prevent passengers from defecting to competitors? Is it easy for passengers to find and purchase similar offers? How important is brand?
Revenue Attractiveness
Identifies elements related to revenue attractiveness and pricing power
What are passengers really willing to pay for? Where can the largest margins be achieved? Can passengers easily find and purchase cheaper products and services?
Industry Forces
Competitors (Incumbents)
Identifies incumbent competitors and their relative strengths
Who are our competitors? Who are the dominant players in our particular sector? What are their competitive advantages and disadvantages? Describe their main offers. Which Customer Segments are they focusing on? What is their Cost Structure? How much influence do they exert on our Customer Segments, Revenue Streams, and margins?
New entrants (Insurgents)
Identifies new, insurgent players and determines whether they compete with a business model different from yours
Who are the new entrants in our market? How are they different? What competitive advantages or disadvantages do they have? Which barriers must they overcome? What are their Value Propositions? Which Customer Segments are they focused on? What is their Cost Structure? To what extend do they influence your Customer Segments, Revenue Streams, and margins?
Substitute Products and Services
Describes potential substitutes for your offers – including those from other markets and industries
Which products or services could replace ours? How much do they cost compared to ours? How easy it is for passengers to switch to these substitutes? What business model traditions do these substitute products stem from (e.g. high-speed trains versus airplanes)?
Suppliers and other Value Chain Actors
Describes the key value chain incumbents in your market and spots new, emerging players
Who are the key players in our industry value chain? To what extent does your business model depend on other players? Are peripheral players

Contract: TCP8-GA-2009-234082
Authors: Macário, Reis et al.
Partner Responsible: IST
Dissemination Level: CO
Page: 113 of 181 Date: 07 Apri l 2012
emerging? Which are most profitable? Stakeholders Specifies which actors may influence your
organizations and business model Which stakeholders might influence your business model? How influential are stakeholders? Workers? The government? Lobbyists?
Key Trends
Technology Trends Identifies technology trends that could threaten your business model – or enable it to evolve or improve
What are the major technology trends both inside and outside your market? Which technologies represent important opportunities or disruptive threats? Which emerging technologies are peripheral customers adopting?
Regulatory Trends Describes regulations and regulatory trends that may influence your business model
Which regulatory trends influence your market? What rules may affect your business model? Which regulations and taxes affect the demand?
Societal and Cultural Trends
Identifies major societal trends that may influence your business model
Describe key societal trends. Which shifts in cultural or societal values affect your business model? Which trends might influence buyer behaviour?
Socioeconomic Trends
Outlines major socioeconomic trends relevant to your business model
What are the key demographic trends? How would you characterize income and wealth distribution in your market? How high are disposable incomes? Describe spending patterns in your market (e.g. terminals, fleet, etc.) What portion of the population lives in urban areas as opposed to rural settings?
Macroeconomic
Forces
Global Market Conditions
Outlines current overall conditions from a macroeconomic perspective
Is the economy in a boom or bust phase? Describe general market sentiment. What is the GDP growth rate? How high is the unemployment rate?
Capital markets Describes current capital market conditions as they relate to your capital needs
What is the state of the capital markets? How easy is it to obtain funding in your particular market? Is seed capital, venture capital, public funding, market capital, or credit readily available? How costly is it to procure funds?
Commodities and Other Resources
Highlights current prices and price trends for resources required for your business model
Describe the current status of markets for commodities and other resources essential to your business (e.g. oil prices and labor costs). How easy is it to obtain the resources needed to execute your business model? How costly are they? Where are prices headed?
Economic Infrastructure
Describes the economic infrastructure of the market in which your business operate
How good is the (public) infrastructure in your market? How high are individual and corporate taxes? How good are public services for organizations? How would you rate the quality of life?
Source: Osterwalder (2010)

Doc. Id: HERMES_WP6_IST_D6_Final
Doc. Title: Handbook on Enhanced Business Models
Doc. Version: Final
Contract: TCP8-GA-2009-234082
Date: 07 April2011 Page: 114 of 181
Thirdly, design a business model is time consuming: not only developing good ideas
but also designing a coherent and robust business model. Indeed, the design stage is
not linear there is a lot of back and forth in the various dimensions until a consensual
and successful business model eventually emerges. As such, this phase must be
completed without time or other pressure.This is a phase of vivid discussion, where
many ideas are brought forward (and many are discarded) until a consensus is built.
There are some dangers to avoid. Firstly, people should avoid sticking to the first
ideas. Good ideas take time to mature and develop. As such, the first ideas should be
challenged, alternative ones should be generated and confronted with the first ones.
Also, ideas should be put to test, by analysing it in different contexts. Secondly, to kill
the good ideas. Often good ideas break with the status quo and require deep changes
in the process and way to do business. As such, good ideas require open minds and
people willing to embrace different ideas. Therefore, new ideas, no matter different or
strange, should be put to discussion and test, under different condition and contexts.
The design of the business model entails in practical terms the definition of the nine
dimensions. At this stage, the prototypes of business models play a key role, by
steering and guiding the generation of ideas and the discussion. Although the design
of the business model is not linear, there is actually an interdependence between the
various building blocks, as the fulfilment of ones require some properties or outputs
from the others.
4.4 Implement
The implementation of the business model may start after its design. Yet, this phase
may bring some turmoil to the company, in particular to the established ones. The
point is that any establish company already follows a specific business model. The
employees are framed to work within that business model and all process are
planned accordingly.
The new business model may bring disruption with the previous one. Furthermore,
there will be a period of time in which the two business model will co-exist. Unknown
about the new business models, the co-existence of two and some resistance to
change may cast down employees and bring some friction and noise in the productive
process. It may therefore be a difficult and risky moment for the company that

Contract: TCP8-GA-2009-234082
Authors: Macário, Reis et al.
Partner Responsible: IST
Dissemination Level: CO
Page: 115 of 181 Date: 07 Apri l 2012
requires the full attention and dedication of all, particularly, from the administration
board and managers.
A successful implementation of a new business model relies on three main pillars,
being: effective communication and commitment by the administration board and top
managers, definition of a project road map (with indication of all tasks, actions and
milestones) and a budget. Other relevant aspect is related with the unforeseen events.
As already mentioned, the implementation period is a risky phase. As such,
monitoring actions should be put into practice.
In addition, despite all efforts to develop a robust business models, it may turn out to
be flawed or need some adjustment. Therefore, the company should also closely
monitor the market’s reaction (e.g.: sales, costs, competitors’ reaction, etc.) to early
identify the maladjustments and react accordingly.
Ultimately, the success of this stage depends on an effective engagement of all
company in the previous phases, on a strong and effective communication and
engagement from the administration board and top managements.
4.5 Manage
The final stage starts when the turmoil due to the implementation phase starts to fade
out and the company adapts to the new business model. Although this could be
considered a stable phase, owing to the market dynamics, no company should avoid
challenging or changing its business model (even a successful one) as new entrants
may easily overcome it.
In this phase, the company must monitor the market to identify potential treats to its
business model and opportunities for improvement. As Figure 4.1 shows there is a
feedback loop going from this phase to the mobilisation one, meaning that designing
business models is a never ending task.
Likewise, the regular management operations should be permanently aware to
eventual misalignments or other problems in the execution of the various building
blocks. After all not all treats are external, if not correctly address internal problems
and resistance may undermine a business model.

Doc. Id: HERMES_WP6_IST_D6_Final
Doc. Title: Handbook on Enhanced Business Models
Doc. Version: Final
Contract: TCP8-GA-2009-234082
Date: 07 April2011 Page: 116 of 181
Finally, even a in successful business operation, the business model should be
rethought from time to time, at least, once in every master planning timeframe.
Contract: TCP8-GA-2009-234082
Authors: Macário, Reis et al.
Partner Responsible: IST
Dissemination Level: CO
Page: 117 of 181 Date: 07 Apri l 2012
5 Conclusions on Intermodal Transport and Interconnectivity
The HERMES project developed eleven case studies. The case studies offer a valuable
and reliable source of information on the current level of intermodality and
interconnectivity within the European Union.
The analysis to the current business model offers some interesting conclusions.
Firstly, the value proposition is the building block that differs the most between the
case studies, which reflects the diversity of the case studies, and in them the natural
differences between the strategies of the transport operators and local authorities.
Secondly, no significant differences have been recorded between at the levl of the
remaining building blocks of the business model canvas. This shows a similarity of
the operation and management across case studies (after all, we should keep in mind
that we are always dealing with intermodal transport). The Customers Segments
building block is essentially the same, since in local public transport there tends to be
no customer segmentation. The communication channels and customer relationships
are also rather similar, with only a few cases showing special features such as
frequent passenger programmes. Thirdly, few partnerships have been identified.
Taken into consideration that intermodal transport is based on integration between
transport operators, terminal operators and other stakeholders, the few partnerships
demonstrate a lack of integration between stakeholders. Naturally, the lack of stable
partnerships is a factor precluding the implementation of intermodal or co-modal
services.
The analysis of the Case Studies allowed the identification of two primary locations
for the barriers and the missing links: in the intermodal links or in the transfer points.
The former location refers to problems of integration between the transport services;
while the latter location refers to problems inherent with the transfer point that
precludes a seamless modal transfer between the long and short distance services.
Proposals have been brought forward for overcoming the existent barriers and to
establish the missing links. Changes in the current business models are certainly
associated with the possible implementation of these proposals. An assessment to the
changes in the building blocks was undertaken. The analyses of the changes provide

Doc. Id: HERMES_WP6_IST_D6_Final
Doc. Title: Handbook on Enhanced Business Models
Doc. Version: Final
Contract: TCP8-GA-2009-234082
Date: 07 April2011 Page: 118 of 181
information about which aspects of the transport services are required for obtaining
an improvement in the quality of the intermodality.
The analysis of the improved business models considered the existence of
fundamental barriers to intermodality, concerning the links and concerning the
nodes. The case studies concerning the issues on the links are Long Distance Bus
(CS4), Corridor Peloponnese to Crete (CS5), Oriente Central Station (CS6), Airport of
Faro (CS7), Airport of Antwerp (CS8), and Airport of Frankfurt Hahn (CS11). The case
studies concerning the issues on the nodes are: Gothenburg Central Station (CS1),
Airport of Arlanda (CS2), Avenida da América Interchange (CS3), Long Distance Bus
(CS4), Lyon Part-Dieu Station (CS10) and Port of Patras (CS9).
The main conclusion from the analysis to the improved business model focused on
the links is a similitude in the improved value propositions for overcoming the
current barriers to intermodality, that is: implementation of a new service to improve
interconnectivity. In addition, the proposed business models do not imply significant
changes in the remaining building blocks, with the exception of the cost structure that
is affected with the introduction of the new service. No changes in the customer
segments are expected which denotes that the proposal of business model is not
expected to attract different types of passengers, while it should attract more
passengers besides improving the quality for the existent ones, which by itself is very
positive. The implementation of a new service will have some impact in the key
resources and possibly in the key activities, but no major changes have been
identified. Likewise, the channels and customer relationships would not be
significantly affected. The key activities will remain essentially the same, as the new
service is also a transport service.
In order to shed some light on the relative importance of the priority issues that must
be addressed for the promotion and achievement of passenger intermodality, we
summarise in Table 5.1 some of the proposals, that over time have been brought
forward, for improving the efficiency along each dimension of intermodality. These
proposals have been chosen taking into consideration the EU policy and context,
aiming to increase their relevancy and applicability.

Contract: TCP8-GA-2009-234082
Authors: Macário, Reis et al.
Partner Responsible: IST
Dissemination Level: CO
Page: 119 of 181 Date: 07 Apri l 2012
Table 5.1 – Strategies for improving the dimensions of intermodality
DOMAIN STRATEGIES / SOLUTIONS
Contractual
Establish regulatory and legal frameworks to give incentives for co-operation or to force it where necessary, mainly by providing a safe legal net concerning the protection of sensitive data and non-disclosure issues
Economical
Harmonization and integration of existing standards on law and regulation issues concerning real-time information services
Introduction of a common European system for electronic ticketing (smart card system), along with the exploitation of mobile phone technology for providing attractive solutions Establish long-term multi-party risk and benefit share arrangements (“win-win”), revising the contracts with local authorities to match these arrangements and maintaining a certain flexibility to renegotiate as investment develop Develop and agree on methodologies for quantification and monetary assessment of impacts (incl. strategic and political effects). Cost-benefit studies and willingness of users to pay for certain intermodal products and services and other ways of ongoing financing have to be better evaluated (e.g. in the field of information systems)
Institutional
Establish long-term multi-party risk and benefit share arrangements (“win-win”), maintaining certain flexibility to renegotiate as investments develop
General campaigns for raising public awareness (marketing tools)
Promotion of passenger rights (as a lever for pushing integrated and interoperable solutions).
Include quantified strategic and political benefits in business plans (as obligations).
Legal
Establish regulatory and legal frameworks to give incentives for co-operation or to force it where necessary, mainly by providing a safe legal net concerning the protection of sensitive data and non-disclosure issues
General campaigns for raising public awareness (marketing tools)
Promotion of suitable regulatory and legal frameworks dealing with problems related to the opening of transport market
Establish regulatory and legal frameworks to give incentives for co-operation or to force it where necessary, mainly by providing a safe legal net concerning the protection of sensitive data and non-disclosure issues

Doc. Id: HERMES_WP6_IST_D6_Final
Doc. Title: Handbook on Enhanced Business Models
Doc. Version: Final
Contract: TCP8-GA-2009-234082
Date: 07 April2011 Page: 120 of 181
Promotion of passenger rights (as a lever for pushing integrated and interoperable solutions).
Standardization activities related to the design and layout of interchanges
Harmonization and integration of existing standards on law and regulation issues concerning real-time information services
Logical
Routing information and cross-selling of tickets for local transport at destination on board the long transport vehicles Include quantified strategic and political benefits in business plans (as obligations).
Physical Standardization activities related to the design and layout of interchanges
Finally, a list with the key measures for enhancing intermodality and
interconnectivity:
• Homogenize the regulation on physical and informational standards.
• Introduce a central (external) institutional body to coordinate and promoting all agents of the system in the planning and management of transport nodes
• Strengthen quality standards and indicators in contracts and homogenize the structure of contracts with other transport operators
• Improve the provision of real-time information covering pre-trip planning and
trip assistance. • Promote the services in terms of physical in interchanges to fulfill customers´
requirements in relation to waiting areas and customer services, desk information, accessibility facilities, etc.
• Reconsider the distribution of the costs for safety/ security among administrations, authorities and operators according to pre-defined criteria.
Looking now into the analysis of the business models focussed on the nodes, the main
conclusion is a lack of a unique suggestion for improved value proposition (as
occurred with the other group of cases). Indeed, several value propositions have been

Contract: TCP8-GA-2009-234082
Authors: Macário, Reis et al.
Partner Responsible: IST
Dissemination Level: CO
Page: 121 of 181 Date: 07 Apri l 2012
suggested related with integration of information, governance, and physical
integration. Integration of information is related with improving the readability of the
terminal stations (in particular, directions and information on arrivals and
departures), the physical integration is related with improving the accessibility to the
passengers, in particular to those with reduced mobility. The integration governance
is related with the need to improve the relationships between transport operators,
terminal managers and local authorities in order to provide a better quality services
to passengers. Secondly, another building block that presented considerable
evolutions vis-à-vis the current situation is the channels. In all case studies
substantial improvements have been denoted. Likewise, the case studies, whose
problems are related with the governance, also exhibit evolutions in the building
block key partnerships. Thirdly, no relevant changes were identified in the remaining
building blocks.
Comparing the results of the two analyses we may reach several conclusions.
Foremost, in the set of cases with issues on links the proposed value proposition is
rather similar across case studies. This may indicate a similarity of the barriers
causing problems in the links and, therefore, the likely existence of a solution to
overcome it. Conversely, in the cases with issues on the nodes a multiplicity of
improved value propositions were suggested. This shows that the barriers causing
problems on the nodes are multiple and more complex than those causing problems
in the links. Also, it highlights that a generalisation of the solutions is not likely
possible for this type of cases. Consequently, it should also be expected that solving
the problems in nodes is more difficult than solving problems with links.
Another conclusion is that the proposed business models do not require major
changes in the remaining building blocks (the changes result from the new value
proposition), suggesting that improvements in the intermodality level may be
possible to achieve with well-defined and precise changes in the business model.
The purpose of the Handbook is to provide the reader with the necessary knowledge
and tools for developing new business models for an improved intermodality. The
Handbook blends theory with practice offering a balanced piece of text that any

Doc. Id: HERMES_WP6_IST_D6_Final
Doc. Title: Handbook on Enhanced Business Models
Doc. Version: Final
Contract: TCP8-GA-2009-234082
Date: 07 April2011 Page: 122 of 181
practitioner could use in their daily operations. A general framework for the
dynamics of intermodal transport and business models is presented. Practical and
real world application includes the presentation of the eleven Case Studies, developed
in HERMES project. The Case Studies offer a unique opportunity for understanding
how to assess the current level of intermodality and the business model, to identify
the barriers, and to design and testing new business models. In addition, the
Handbook offer indications for the identification of the barriers and missing links,
and examples of good practices. Finally, ready-to-use prototypes of business models
are given for deployment in real world cases.
The main result of the HERMES Project – based on the surveys made in the initial
workpackages and strongly corroborated by the 11 case studies – is that
intermodality between long distance and local transport services does not happen
except if it is of direct business interest of one of the agents involved.
In some cases – mostly when we are dealing with the intermodality at nodes – it is
rather likely that there will be scope for the assumption of the business of
intermodality by the agent responsible for the management of that node (the
“interchange manager”), as the provision of better coordination between long
distance and local transport services could not only lead to higher satisfaction of
those clients of the interchange, but also to a subsequent increase of the
attractiveness / competitiveness of that interchange with respect to others serving
the same region, or even with respect to other regions to which people travel for
similar motives.
So, in such cases, promotion of intermodality could easily be justified as an important
part of the business interests of that interchange or of that region
In other cases – typically associated with creation of what was described as
intermodality at links – it is generally less obvious what kind of business interests
could be called upon to support that intermodality. Only after that identification has
been made will it be possible to assign the responsibility for managing the associated
services. The cases of the Arlanda airport and of the Patras to Kalamata link have
some similarities but also some differences:
Contract: TCP8-GA-2009-234082
Authors: Macário, Reis et al.
Partner Responsible: IST
Dissemination Level: CO
Page: 123 of 181 Date: 07 Apri l 2012
• in the former case, the intermodal services have only an indirect
economic value for the airport manager, but a very important one, as they are necessary to keep the total emissions associated under the
airport under the predefined threshold, and so to allow some growth of
the main business interest of the airport, namely air traffic. So, it is natural that the airport management takes on this role of intermodality
manager;
• in the latter case, the intermodal services have limited business interest
for those directly engaged but a strong interest for the community at large, as they allow a reduction of traffic volumes on the road between
Patras – Athens – Piraeus and on the saturated ferry terminal at Piraeus. In the first dimension there are problems of road safety and
emissions from road vehicles, whereas in the second dimension there
are problems of poor service to the ferry clients travelling to Crete. So, in this case, the appointment of the intermodality manager should be a
matter for the national road authority, the regional (tourist) authorities of Crete island, and also the port of Patras which can also increase the
satisfaction of its clients (and possibly through this increase its market).
All cases in which three public authorities of different institutional settings have their
own interest in a specific solution but view it from a different angle (for Crete and
Patras an increase of quality of service and business volumes, for the road authority a
reduction of problems), the formulas for cooperation must also be selected depending
on particular circumstances of the people involved and the history of relations among
those institutions, but the most logical solution that can be induced from these cases
is for the infrastructure manager to appoint the intermodality manager and receive
some financial contribution for the development of that mission from the authorities
engaged.
It should be noted that, even if in these more complicated cases the rationale for
intermodality has to be carefully investigated, this does not imply that the added
value of its realization is lower. On the contrary that added value might be higher, but
distributed across multiple partners, some of them with the location of their business
in rather different geographical areas, and so more difficult to bring into the picture
and more difficult to mobilize into the coalition of actors for deployment of a solution.

Doc. Id: HERMES_WP6_IST_D6_Final
Doc. Title: Handbook on Enhanced Business Models
Doc. Version: Final
Contract: TCP8-GA-2009-234082
Date: 07 April2011 Page: 124 of 181
6 Bibliography
Afuah, A. (2004). Business Models: a Strategic Management Approach. McGraw-Hill Irwin. New York, USA.
Afuah, A. and C. Tucci (2001). Internet Business Models and Strategies. Boston, McGraw Hill.
Amit, R.; Zott, C. (2001). Value creation in e-business. Strategic Management Journal 22(6-7): 493-520.
Applegate, L. M. (2001). E-business Models: Making sense of the Internet business landscape. Information Technology and the Future Enterprise: New Models for Managers. G. Dickson, W. Gary and G. DeSanctis. Upper Saddle River, N.J., Prentice Hall.
Bartheldi, A. (2011) “Barriers to interconnectivity and intermodality of passenger transport from the viewpoint of an operator”, Presentation held on the HERMES Seminar ‘Interconnectivity and Intermodality Barriers of Passenger Transport’ February 2011, Berlin.
CARISMA CONSORTIUM (2000) “Interconnection of Trans-European Networks (Long Distance) and Regional / Local Networks of Cities and Regions”
Chesbrough, H. (2007). Business model innovation: It’s not just about technology anymore. Strategy and Leadership 35(6), 12–17.
Chesbrough, H. Rosenbloom, R. S. (2002). The Role of the Business Model in Capturing Value from Innovation: Evidence from Xerox Corporation's Technology Spin-Off Companies. Industrial and Corporate Change 11(3): 529-555.
COMPASS CONSORTIUM (2002) “Final Report for Publication”
DATELINE CONSORTIUM (2003) “Dateline ‘Design and Application of a Travel Survey for European Long-distance Trips Based on an International Network of Expertise’. Deliverables 1-6.”
Davies, A. (2004). Moving base into high-value integrated solutions: a value stream approach. Ind. Corp. Change 13, 727–756.
Dell’Asin, G., Guzman, L., López-Lambas, M., Monzón, A., Yang, W. (2011) “Requirements and Barriers for Interconnectivity: Identification of Barriers and Enhancement Measures”, Deliverable of WP3, HERMES High Efficient and Reliable ArrangeMEnts for Cross-modal Transport, 7th Framework Program, DG Research.
Eisenmann, T. R. (2002); Internet Business Models: text and cases. International Edition. New York. McGraw-Hill.
eMOTION CONSORTIUM (2008) “Europe-wide Multi-modal On-trip Traffic Information”, EU Project Deliverables
European Commission (1997a) “COM(1997)243 - Intermodality and intermodal freight transport in the European Union - A system's approach to freight transport - Strategies and actions to enhance efficiency, services and sustainability”, Brussels (Belgium)
European Commsission (2001) “EU Directive on the interoperability of the trans-European conventional rail system”, EU-Parliamant and Council
European Commission (2004) ‘‘Towards Passenger Intermodality in the EU” European Commission (EC), Final reports 1-3

Contract: TCP8-GA-2009-234082
Authors: Macário, Reis et al.
Partner Responsible: IST
Dissemination Level: CO
Page: 125 of 181 Date: 07 Apri l 2012
European Commission (2006) “COM(2006) 314 - Keep Europe moving - Sustainable mobility for our continent - Mid-term review of the European Commission’s 2001 Transport White paper”
European Commission (2007) “EC regulation on rail passengers’ rights and obligations”
EUROSIL CONSORTIUM (1999) “European Strategic Intermodal Links”, EU Project Deliverables
Fakiner, H. (2011): Barriers to interconnectivity and intermodality of passenger transport from the viewpoint of an air terminal manager, Presentation held on the HERMES Seminar ‘Interconnectivity and Intermodality Barriers of Passenger Transport’ February 2011, Berlin.
Fluhrer, T., Szimba, E., Siegele, J. (2011), Barriers to Intermodality and Interconnectivity of Passenger Transport, Deliverable of WP4, HERMES High Efficient and Reliable ArrangeMEnts for Cross-modal Transport, 7th Framework Program, DG Research.
Gleave, S (2006) “Study ‘Air and Rail Competition and Complementarity’”, Prepared for DG TREN
Grandjot, H. H. (2002): Verkehrspolitik. Grundlagen, Funktionen und Perspektiven für Wissenschaft und Praxis, Hamburg, 2002.
Headicar, P. (2009): Transport Policy and Planning in Britain, Routledge, Abingdon, New York.
Hultgren, K. (2011): Barriers to interconnectivity and intermodality of passenger transport from the viewpoint of a public transport user association, Presentation held on the HERMES Seminar ‘Interconnectivity and Intermodality Barriers of Passenger Transport’ February 2011, Berlin.
i-TRAVEL CONSORTIUM (2008) “i-Travel - service platform for the connected traveller”, EU Project Deliverables
INTERCEPT CONSORTIUM (2000) “Intermodal Concepts in European Passenger Transport”, EU Project Deliverables
Janssen, M.; Kuk, G.; Wagenaar, R. (2007). A survey of Web-based business models for e-government in the Netherlands. Government Information Quarterly 25 (2008) 202–220.
Jones, G. M. (1960). Educators, Electrons, and Business Models: A Problem in Synthesis. Accounting Review 35(4): 619-626. Jones, G. M; 1960. Educators, Electrons, and Business Models: A Problem in Synthesis. Accounting Review 35(4): 619-626.
Kaplan, R. S. and D. P. Norton (1992). "The balanced scorecard--measures that drive performance." Harvard Business Review 70(1).
Keen, P. W. G., Qureshi, S. (2006). Organizational transformation through business models. A framework for business model design. Paper presented at the Proceedings of the 39th Hawaii International Conference on Information Systems, Hawaii, USA.
Kindström, D. (2010). Towards a service-based business model – Key aspects for future competitive advantage. European Management Journal.
KITE CONSORTIUM (2009) “A Knowledge Base for Intermodal Passenger Travel in Europe”
Linder, J.; Cantrell, S. (2000). Changing Business Models: Surveying the Landscape. Accenture Institute for Strategic Change.
Doc. Id: HERMES_WP6_IST_D6_Final
Doc. Title: Handbook on Enhanced Business Models
Doc. Version: Final
Contract: TCP8-GA-2009-234082
Date: 07 April2011 Page: 126 of 181
LINK CONSORTIUM (2010) “‘The European Forum on Intermodal Passenger Travel”
Lundin, M. (2011) “Case Studies”, Delivearable of WP5, HERMES High Efficient and Reliable ArrangeMEnts for Cross-modal Transport, 7th Framework Program, DG Research.
Macário, R., Viegas, J., Reis, V., Magalhães, L. (2011) “Cross Modal Transport Models (Prototypes)” Deliverable of WP2, HERMES High Efficient and Reliable ArrangeMEnts for Cross-modal Transport, 7th Framework Program, DG Research.
Magretta, J. (2002). Why Business Models Matter. Harvard Business Review 80(5): 86-92.
Mahadevan, B. (2000). Business Models for Internet-based e-Commerce: An anatomy. California Management Review 42(4): 55-69.
Mansfield, G. M.; Fourie, L. C. H. (2004); Strategy and business models – strange bedfellows? A case for convergence and its evolution into strategic architecture. South African Journal of Business Management. 35 (1).
Markides, C. (1999). All the Right Moves. Boston, Harvard Business School Press.
MEST CONSORTIUM (1999) “Methods for European Surveys of Travel Behaviour”, EU Project Deliverables
MIMIC CONSORTIUM (1999) “Mobility Intermodality and Interchanges’, Final Report for Publication”.
Morfoulaki, M., Papanikolaou, A. (2010) “State of the Art on Crossmodal Transport Arrangements”, Deliverable of WP1, HERMES High Efficient and Reliable ArrangeMEnts for Cross-modal Transport, 7th Framework Program, DG Research.
Morris, M.; Schindehutte, M.; Allen, J; 2003. The entrepreneur’s business model: toward a unified perspective. Journal of Business Research.
Musso, A. (2011): Networks interconnectivity and intermodality as drivers for improving passenger transport, Presentation held on the HERMES Seminar ‘Interconnectivity and Intermodality Barriers of Passenger Transport’ February 2011, Berlin.
Normann, R.; Ramirez, R. (1994). Designing Interactive Strategy: from Value Chain to Value Constellation. John Wiley and Sons, Chichester.
Osterwalder, A. (2004). The Business Model Ontology A Proposition In A Design Science Approach – These pour l’obtention du grade de Docteur en Informatique de Gestion. Ecole des Hautes Etudes Commerciales de l’Université de Lausanne.
Osterwalder, A.; Pigneur, Y.; Lucci, C. (2005). Clarifying Business Models: Origins, Present, and Future of the Concept. Communications of the Association for Information Systems.
Osterwalder, Alexander (2010). Business Model Generation. John Wiley & Sons, New Jersey.
Osterwalder, A., Pigneur, Y. (2010). Business Model Generation. USA. John Wiley and Sons, Inc.
Pateli, A. ; Giaglis, G. (2003). A Framework For Understanding and Analysing e-Business Models. Proceedings of the Bled Electronic Commerce Conference.
Porter, M. E. (1985). How information gives you competitive advantage. Harvard Business Review 63(4): 149-160.

Contract: TCP8-GA-2009-234082
Authors: Macário, Reis et al.
Partner Responsible: IST
Dissemination Level: CO
Page: 127 of 181 Date: 07 Apri l 2012
Rappa, M. (2001). Managing the digital enterprise - Business models on the Web. North Carolina State University.
Seddon, Peter B., Lewis, Geoffrey P.; Freeman, Phil; Shanks, Graeme (2004); The Case for Viewing Business Models as Abstractions of Strategy. Communications of the Association for Information Systems. 13, 427-442.
Shafer, S.M.; Smith, H.J.; Linder, J.C. (2005). The power of business models. Business Horizons 48, 199–207.
Spiegel, T. (2011): Barriers to interconnectivity and intermodality of passenger transport from the viewpoint of a policy-maker, Presentation held on the HERMES Seminar ‘Interconnectivity and Intermodality Barriers of Passenger Transport’ February 2011, Berlin.
Stähler, P. (2002). Business Models as an Unit of Analysis for Strategizing. International Workshop on Business Models, Lausanne, Switzerland.
Svensson, G.; Wood, G.; Callaghan, M. (2009). A corporate model of sustainable business practices: An ethical perspective. Journal of World Business 45 (2010) 336–345.
SWITCH CONSORTIUM (2000) “Sustainable, workable intermodal transport choices”, EU Project Deliverables
Teece, D. (2010). Business Models, Business Strategy and Innovation. Long Range Planning 43 (2010) 172 – 194.
Timmers, P. (1998). Business Models for Electronic Markets. Journal on Electronic Markets 8(2): 3-8.
TOOLQIT CONSORTIUM (2009) ‘Tools for the Assessment of Level and Quality of Service Across Different Transport Market Segments’, EU Project Deliverables
Viegas, J.M. (2003): Transport policy development in Europe 1950–2020. In: Fifty Years of Transport Policy. European Conference of Ministers of Transport. OECD Publication Services, Paris: 105–115.
Voelpel, S.¸ Leibold, M.; Tekie, E., Von Krogh, G. (2005). Escaping the Red Queen Effect in Competitive Strategy: Sense-testing Business Models. European Management Journal Vol. 23, No. 1, pp. 37–49.
Weill, P.; Vitale, M. R. (2001). Place to space: Migrating to eBusiness Models. Boston, Harvard Business School Press.
Wikström, K.; Artt, K.; Kujala, J.; Söderlund, J. (2010). Business models in project business.
International Journal of Project Management 28 (2010) 832–841.

Doc. Id: HERMES_WP6_IST_D6_Final
Doc. Title: Handbook on Enhanced Business Models
Doc. Version: Final
Contract: TCP8-GA-2009-234082
Date: 07 April2011 Page: 128 of 181
7 Annex I –Segmenting passengers
The Experts Characteristics Mostly business travelers, who are experienced,
usually in a hurry, functional and well-organized
Strategy in
dealing with a
multimodal
journey
- The journey is planned and timed;
- It is mapped out in a travel plan
- There is attempt at maximal energy saving
Spatial
Conduct
- Few orientation problems;
- Prefer to ask the “first member of staff encountered”
rather than use the information terminals, which are
considered too slow;
- Hardly any cases of verification or “going back to
check”;
- Prefer carry-on to check-in luggage.
Specific needs “Time is money”
- Real-time information concerning problem
situations;
- Information concerning the time required to
complete various stages of the journey;
- Times of departure and frequency of various forms
of public transport
from multimodal site to town centre;
- Access to this information before the journey for
maximum efficiency during preparation stage
(receptive to multimedia);
- Information counters providing general information
about the town, upon arrival at airport in a foreign

Contract: TCP8-GA-2009-234082
Authors: Macário, Reis et al.
Partner Responsible: IST
Dissemination Level: CO
Page: 129 of 181 Date: 07 Apri l 2012
country;
- Grouped ticket plane/public transport - the latter
being a multimodal open ticket.
The Falsely-
Experienced
(Rebels)
Characteristics Frequent travelers, mostly private individuals (not
excluding professionals), who tend to resist the rules
and regulations of the multimodal universe, and
consider themselves already experienced travelers.
Their relationship with travel companies/authorities
is one of mistrust.
Strategy in
dealing with a
multimodal
journey
- Seem not to be able to build up on their previous
experiences, each new journey puts them in the
position of a novice traveler;
- Instinctively look for personal solutions;
- Are usually disorganized, act on instinct, sometimes
spending considerable energy in order to just assert
themselves and to find themselves back in a position
of an independent traveler.
Spatial
Conduct
- These travelers tend not to see what they are
supposed to, and to exclude perfectly clear
information sequences from their field of vision;
- Make incessant attempts at developing micro-skills
or personal tactics: parallel routes, questioning of
intuitive informants, observation of other
passengers;
Specific needs - Multiple and diversified information sources in
order to avoid a feeling of “ dragooning”;
- Sufficient repetition of information - reassurance of
having made the correct choice;
- A human presence which has a “ taming ” effect and

Doc. Id: HERMES_WP6_IST_D6_Final
Doc. Title: Handbook on Enhanced Business Models
Doc. Version: Final
Contract: TCP8-GA-2009-234082
Date: 07 April2011 Page: 130 of 181
facilitates the relationship with the authorities,
calming the spontaneous tendency towards
recrimination, providing an impression of being
looked after personally, a sign of consideration and
attention to each traveler as a person;
- Indication that the company/authorities are
anticipating their needs and going out to meet them,
particularly in the initiation of the use of automatic
information systems (which are regarded as a sign of
being abandoned).
The
Obsessed
Characteristics Whether they travel for pleasure or business, these
travelers always expect the worst and exaggerate the
preparation stage of a journey in an attempt to ward
off ill fortune. For them, there is never enough pre-
travel information, and the slightest detail is an
object of precaution.
Strategy in
dealing with a
multimodal
journey
Anxious to do everything themselves, they buy the
tickets themselves and integrate into the course of
the journey the possibility of dysfunctions. Their
requirements, and in particular previous negative
travel experiences, leave traces which teach them a
lesson, “ once bitten, twice shy ” ... They tend to “
ritualize ” their journeys around a certain number of
habits : if I haven’t managed to do such and such a
thing, the journey won’t be a success. This is
therefore a type of customer whose loyalty is
particularly difficult to establish.
Spatial
Conduct
Usually early arrivers, they pay particular attention
to written information and notice whenever there is a
missing link in the information chain. They prefer
visual aids to audio, and pay attention to every

Contract: TCP8-GA-2009-234082
Authors: Macário, Reis et al.
Partner Responsible: IST
Dissemination Level: CO
Page: 131 of 181 Date: 07 Apri l 2012
information “signal” emitted by the authorities,
reading everything available.
Specific needs - Very evident search for reassurance throughout the
journey, so that the actual experience corresponds
exactly to the intermodal journey originally planned.
- Effectiveness of a European marking system which
would allow the marking-out of a journey from door
to door.
- Vital importance of certain services (which it is
necessary to be able to locate immediately) without
which the journey will be experienced in an anxious
and frustrated frame of mind : chemist, post office,
toilets, press, etc. (the services correspond to the
demands of ritualized behavior patterns).
The
Investigators
Characteristics Curious, and aware of their deficiencies, they are
ready to learn and are receptive to information in
order to be able to organize themselves. Each
experience is methodically and logically built on.
Strategy in
dealing with a
multimodal
journey
Anxious to learn, they look less for precise answers
than for the aids with which they can find the
answers themselves: maps, timetables, connections,
etc. They plan their journey with the knowledge that
they can always rely on the authorities to provide
answers to their questions if necessary.
Spatial
Conduct
- Take the journey step by step, checking at each
stage that they have made the correct choice.
- In order to be able to relax physically and mentally,
they locate places in advance and calculate the exact
amount of time available to them.
- Regularly seek to situate themselves in terms of

Doc. Id: HERMES_WP6_IST_D6_Final
Doc. Title: Handbook on Enhanced Business Models
Doc. Version: Final
Contract: TCP8-GA-2009-234082
Date: 07 April2011 Page: 132 of 181
both time and place
- Look for isolated corners away from noise, hustle
and bustle, in order to reorientate, to take their
bearings, to make choices, etc.
Specific needs - Aids providing them with the possibility of selecting
their own multimodal combination.
- Comprehensive tourist information desks with all
the necessary documentation, justifying the
instinctive trust they have in the authorities.
- Markers along the journey allowing deduction and
extrapolation.
- Explicit maps, to scale, with indications of
orientation and length of time necessary to go from A
to B.
The
Intimidated
Characteristics Usually private individuals travelling for pleasure
rather than business, they are inexperienced, very
anxious, particularly worried about their luggage,
confused when a problem occurs. Often older than
the average traveler, they require direction and
assistance.
This requirement is often justified by the following
situations, implying varying degrees of disability:
Elderly; Many pieces of luggage; Complete
inexperience; No command of the language; Mobility
difficulties; etc.
Strategy in
dealing with a
multimodal
journey
Essentially passive strategy, where any initiative is
left to the authorities, to the airport/station
management and to the airline/rail company, via
frequent requests for psychological and material
assistance. Anxiety can lead to panic and irrational

Contract: TCP8-GA-2009-234082
Authors: Macário, Reis et al.
Partner Responsible: IST
Dissemination Level: CO
Page: 133 of 181 Date: 07 Apri l 2012
behavior resulting in a misjudgment of the situations
to be dealt with.
Spatial
Conduct
- Very mediocre ability to locate, many mistakes.
- Request for human assistance (porters, other
travelers) even when the information is clearly
visible (scotomisation).
- Search for official (institutional) sources of
information and signs leading to them.
- Distressed obsession about certain aspects of the
journey : escalators, lifts, stairs, customs, etc.
Specific needs -Personalized assistance with the reassurance of
knowing how and where to find it, even before
leaving home.
-Clear indication of official services.
-Advance warning of approaching bus/train stops to
allow time to get ready to alight, to collect luggage
together and to move towards the exit.
-Assistance with the use of automatic machines,
which they are reluctant to try, (they automatically
prefer the telephone or written information).
-Usefulness of a detailed door to door travel plan.
The
Followers
Characteristics Cannot stand the solitude of a journey and the idea of
their only relationship being with the airline or rail
company.
Even when alone, they travel in a group ... and need
the support of “what the others do” (the flock).
For essentially personal reasons, these travelers have
got into the habit of joining organized trips and are in
need of a social link; they feel uneasy due to the

Doc. Id: HERMES_WP6_IST_D6_Final
Doc. Title: Handbook on Enhanced Business Models
Doc. Version: Final
Contract: TCP8-GA-2009-234082
Date: 07 April2011 Page: 134 of 181
“inhumanity” of busy connecting places.
Strategy in
dealing with a
multimodal
journey
Do not make any specific plans because they “ rely on
the others ” to get along, preferably on the authorities
which is considered as distant and coercive.
This search to be part of a group constitutes a way of
contesting authority.
Spatial
Conduct
- Are not globally receptive to the signals put out by
the authorities.
- The other travelers, forming an “ ephemeral tribe ”,
are preferred as sources of information : there are
those who speak the same language, those who were
in the same plane, etc.
- Even if it means getting lost, the “follower” prefers
to follow the advice of another traveler rather than to
ask an official employee.
- Are particularly sensitive to public announcements
which are seen as an “assembly sign” for all those
who are like me.
Specific needs - The assertion of the relevant authority in its role of
dealing with crowd movements, particularly in the
use of public announcements which travelers are
forced to hear.
- Much repetition, in order to avoid losing the way.
- Badges worn by all passengers booked onto the
same flight (sign of recognition leading to a
relationship of mutual support).
The Calm
and
Characteristics Be they experienced or not, journeys do not affect
their calm, they look for just the necessary amount of
information and trust the authorities to inform them.

Contract: TCP8-GA-2009-234082
Authors: Macário, Reis et al.
Partner Responsible: IST
Dissemination Level: CO
Page: 135 of 181 Date: 07 Apri l 2012
Collected They are quiet and methodical.
Strategy in
dealing with a
multimodal
journey
Active strategy of taking the situation into their stride
with a minimum of planning in advance and a few
personal tricks. A number of stages in a journey,
following on from each other, does not create any
anxiety.
Spatial
Conduct
- Their relationship with the authorities (and with
themselves) is one of trust. They pay great attention
to the signs made available to them, and to their logic.
Very visual, they take the necessary time to read the
messages.
- Occasionally check, without being obsessed by the
idea, that they have made the correct choice.
- Are able to situate themselves well geographically
because they create a mental image of the space in
which they are moving (visualization).
- Occasionally ask other travelers for information.
Specific needs - Notice boards with easily legible messages, due to
the size of the lettering and that of the boards
themselves.
- A minimum amount of purely essential pre-travel
information, integrated if possible into the travel
documents/ticket.
- Confirmation of having made the correct choice at
key points.

Doc. Id: HERMES_WP6_IST_D6_Final
Doc. Title: Handbook on Enhanced Business Models
Doc. Version: Final
Contract: TCP8-GA-2009-234082
Date: 07 April2011 Page: 136 of 181
8 Annex II – Case Studies Fact Sheets
8.1 HERMES Case Studies
A total of eleven Case Studies have been developed in HERMES project. They are now
listed:
12. Case Study 1: Gothenburg Central Station (Sweden);
13. Case Study 2: Arlanda International Airport (Sweden);
14. Case Study 3: Avenida de América Interchange Madrid (Spain);
15. Case Study 4: Long distance bus services connected with high speed with high
speed rail services (Spain);
16. Case Study 5: Extension of the Adriatic-Ionian ferry corridor from Peloponnese to Crete (Greece);
17. Case Study 6: Gare do Oriente Interchange Station and Connection with Linha do Norte Railways (Portugal);
18. Case Study 7: Faro International Airport (Portugal);
19. Case Study 8: Antwerp Airport (Belgium);
20. Case Study 9: Port of Patras (Greece);
21. Case Study 10: Part-Dieu Station at Lyon (France);
22. Case Study 11: Frankfurt-Hahn Airport (Germany).
For a complete presentation of each Case Study, the interested reader is referred to
Lundin et al. (2011).
The information collected with the case studies provides a valuable and reliable
source for a better understanding intermodal transport and interconnectivity at
several levels, including:
• Barriers and missing links (regulatory, legal, physical, market-related, etc.) for an improved intermodality,
• Good practices and success cases of interconnectivity,
• Current business models in operation,
In addition, the case studies covered a wide diversity of cases across the European
Union, therefore they offer a comprehensive picture of the current level of

Contract: TCP8-GA-2009-234082
Authors: Macário, Reis et al.
Partner Responsible: IST
Dissemination Level: CO
Page: 137 of 181 Date: 07 Apri l 2012
development of the intermodal transport and interconnectivity in the European
Union.
In what concerns HERMES project, the Case Studies provided information for the
design and validation of the prototypes of Business Models for improved
intermodality.
The Case Studies were chosen to provide an accurate and reliable picture of the
current state of intermodality and interconnectivity across the European Union.
Factors taken into consideration in this process included:
• Geographical Coverage,
• Intermodal Transfer Point,
• Modes of transport involved,
• Potential barriers and missing links.
Although the multiplicity of countries, with different culture and backgrounds, is one
of the main sources of the European Union’s richness and diversity, it is also a root for
the problems affecting intermodal transport. For example: the legal frameworks, the
institutional arrangements or the business environment still remains different
between the member states. Also, the language barrier or the diversity of the
ticketing systems are still an important factor undermining the performance of
intermodal transport. HERMES case studies were developed in seven European Union
member states, including:
• Belgium (Case Study 8),
• France (Case Study 10),
• Germany (Case Study 11),
• Greece (Case Studies 5 and 9),
• Portugal (Case Studies 6 and 7),
• Spain (Case Studies 3 and 4) and
• Sweden (Case Studies 1 and 2).

Doc. Id: HERMES_WP6_IST_D6_Final
Doc. Title: Handbook on Enhanced Business Models
Doc. Version: Final
Contract: TCP8-GA-2009-234082
Date: 07 April2011 Page: 138 of 181
The case studies provide good coverage of the central and western European Union
reality, as well as, northern and southern member states.
The intermodal transfer points are key in the production of intermodal transport
services, since they provide the opportunity for the passengers to change between
modes of transport. Inadequate transfer points will reduce the level of
interconnectivity and, consequently, the efficiency of the intermodal transport
service. On the other hand, these points are designed according to the properties of
the modes of transport that will operate. Naturally, different modes of transport will
imply different designs and functionalities. Therefore, the requirements for an
adequate interconnectivity depend on the type of the transfer point. Looking now to
HERMES case studies, we have three types of intermodal transfer points, being:
• Airports (Case Studies 2, 7 and 11);
• Maritime Ports (Case Studies 5 and 9);
• Terminal Stations (both bus and rail terminals) (Case Studies 1, 3, 4, 6, 8 and 10).
These represent the vast majority of the intermodal transfer points within the
European Union.
Recalling the scope of HERMES project as being the issues involving intermodal
transport at the connection between long and short distance transport services, we
can that the case studies embrace most of the possible combinations available and all
the typical ones. The next scheme (Figure 8.1) presents the coverage of the modes of
transports by each case study.
The Case Studies cover the majority of the possible intermodal combinations. In
practical terms, some of the combinations (such as: sea and air) are practically non-
existent in the European Union and therefore of little relevance.
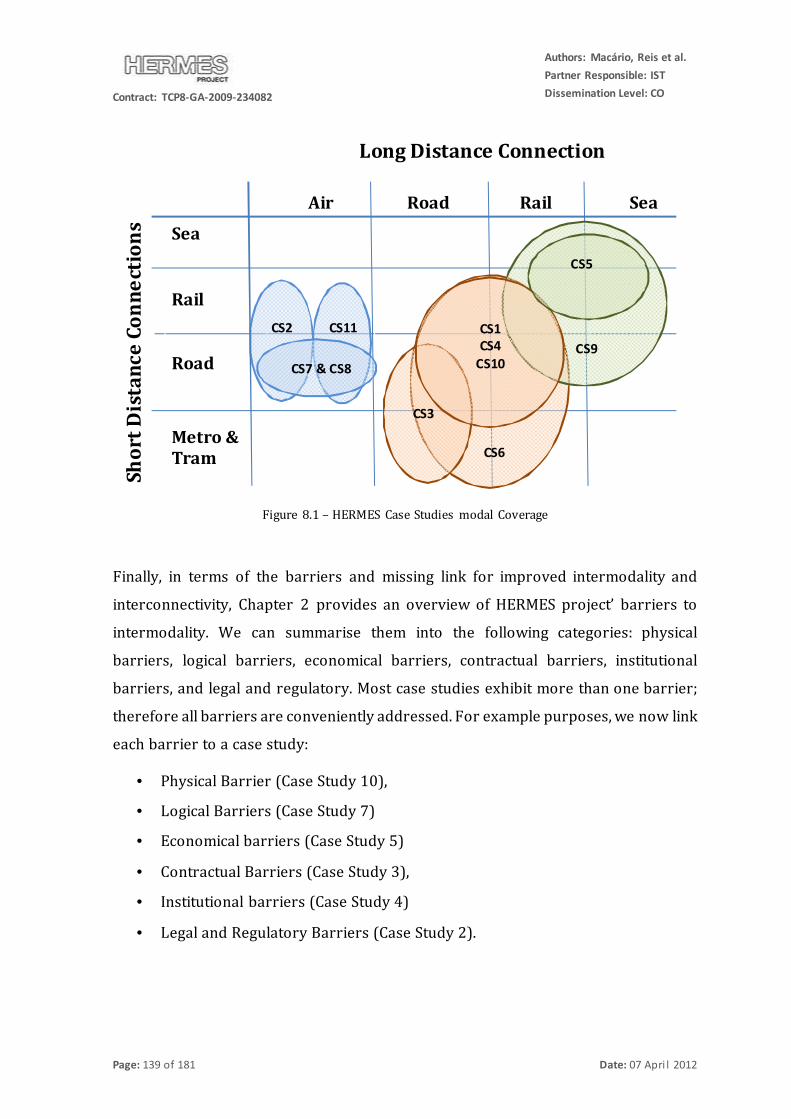
Contract: TCP8-GA-2009-234082
Authors: Macário, Reis et al.
Partner Responsible: IST
Dissemination Level: CO
Page: 139 of 181 Date: 07 Apri l 2012
Figure 8.1 – HERMES Case Studies modal Coverage
Finally, in terms of the barriers and missing link for improved intermodality and
interconnectivity, Chapter 2 provides an overview of HERMES project’ barriers to
intermodality. We can summarise them into the following categories: physical
barriers, logical barriers, economical barriers, contractual barriers, institutional
barriers, and legal and regulatory. Most case studies exhibit more than one barrier;
therefore all barriers are conveniently addressed. For example purposes, we now link
each barrier to a case study:
• Physical Barrier (Case Study 10),
• Logical Barriers (Case Study 7)
• Economical barriers (Case Study 5)
• Contractual Barriers (Case Study 3),
• Institutional barriers (Case Study 4)
• Legal and Regulatory Barriers (Case Study 2).
Long Distance Connection
Air Road Rail Sea
Sho
rt D
ista
nce
Co
nn
ect
ion
s Sea
Rail
Road
Metro & Tram
CS2 CS11
CS9
CS1
CS4
CS10
CS6
CS7 & CS8
CS5
CS3

Doc. Id: HERMES_WP6_IST_D6_Final
Doc. Title: Handbook on Enhanced Business Models
Doc. Version: Final
Contract: TCP8-GA-2009-234082
Date: 07 April2011 Page: 140 of 181
8.2 Case Study 1 - Gothenburg Central Station
8.2.1 Brief characterisation of the Case Study
Gothenburg Central Station is the major national, as well as the regional, transport
hub for passenger transportation in the south west of Sweden. The station is an
interchange of great importance with about 100 000 passengers per weekday,
furthermore the travelling to and from the Central Station is increasing continuously.
The following public transport services are offered at Gothenburg Central: 13 lines
for long-distance rail services, 6 lines for short-distance rail services, 13 lines for
long-distance bus services and 25 lines for short-distance bus services.
Co
ntr
act
ual
re
altio
nss
hip
SJ Arriva Sverige AB
Göteborgs Spårvägar
STATE/PUBL ICLY-OWNED TRANSPORT OPERATORS
Tram & bus
R ail R ail
RentalCar
compani es
Taxicompanies
TRANSPORT OPERATORS
C ars Cars
SERVICE PROVIDERS
- hotel- restaurant- shops- et c.
Dif ferentService
providers
Co
ntr
act
ual
re
latio
nss
hip
Väst trafik AB
TrafikverketGothenburg Ci ty
PUBLIC DECISION MAKER
principal
princip
a l
owne
r
Jernhusen
TERM INAL MANAGER
Cont ractual relat ionship
anual fee
fee
Shutt lebuses
DSBFIRSTVÄST
PRIVATE-OWNED BUS TRANSPORT OPERATORS
R ailBus
Bus
10 bus T ransportoperators
fee
Figure 8.2 - Map displaying Gothenburg station’s area (left) and Stakeholders at Gothenburg (right)
The case study of Gothenburg Central Station covers all three levels of
interconnectivity which are addressed in the HERMES project:
• Interfaces between different modes: rail – road
• Interfaces between different type of service of the same mode: rail-rail, road-road
• Interfaces between high capacity and low capacity mode: bus and taxi etc.
8.2.2 Current Business Model
Gothenburg Central Station has many transport services as well as other functions
and a good overall passenger approach. Shuttle services from the central station to

Contract: TCP8-GA-2009-234082
Authors: Macário, Reis et al.
Partner Responsible: IST
Dissemination Level: CO
Page: 141 of 181 Date: 07 Apri l 2012
the airports and the port gives additional opportunities to travel further. Västtrafik as
well as the train operator SJ has in general a good reliability and punctuality.
However there have been some problems with the infrastructure and also with the
trainmaterial during the last two winters, which has resulted in a large number of
delays and a decreasing reliability. This together with bad systems for delivering
information about disturbances and delays in the time schedules has contributed to a
decreasing reliability. SJ had an overall punctuality at 85 % during 2010 but still a low
customer satisfaction. The reliability for SJ has decreased during the later years due
to delays. Therefore the current business model is focused on maintaining and
increasing transport quality and the quality of information in order to maintain and
increase customer satisfaction.
Figure 8.3 - Current Business Model at Gothenburg
8.2.3 Current Level of Quality and Missing Links
According to the customer survey and interviews with the stakeholders the current
level of quality at Gothenburg Central Station is very high. Customer’s satisfaction is
very high with coordinated timetables, possibilities to combine transport modes and
walking distance to transfer services. Customers are overall satisfied with facilities at
the site. It should be noted that the customer survey was not carried out during
winter times. According to the customer survey several possible improvements can
be highlighted. When it comes to Facilities, the customers would like to see

Doc. Id: HERMES_WP6_IST_D6_Final
Doc. Title: Handbook on Enhanced Business Models
Doc. Version: Final
Contract: TCP8-GA-2009-234082
Date: 07 April2011 Page: 142 of 181
improvements regarding total seating capacity, toilet capacity and toilet cleaning,
better access to the WiFi/Internet and improved security on the site. The missing link
that has been identified at the station concerns information. The customers demand
better integrated ticket systems, integrated departure/transfer information,
integrated time-tables for different transport operators and accurate information
why there are delays and by how much, especially during winter season. It will be
crucial to have well-functioned information services in the future as Sweden also will
deregulate all passenger transport from January 1st 2012. This implies that there will
be more transport operators at the station and the passenger needs co-ordinated
information.
8.2.4 Changes for improved Interconnectivity
The main concept of our proposal is to: “Integrate traffic information on various
transport services provided by different transport operators and make this
information available to customers”. This can be achieved by introducing a new agent
at Gothenburg Central Station. This/these new agents are here called “Traffic
Information Brokers” and their task should be to create a new and innovative way to
integrate and distribute traffic information. They can also have traffic information
centres at the Site. The most critical service level for this information is information
reliability.
Transport Operators Integrated
Traffic Information
Passengers to and from
Gothenburg Central Station
- Website- Phone- Personal contact- New Innovativ channels
Service-based
- Fees- Integrated Traffic Information
- Transport operator’s information- HR
- gather information- integrate information- ditribute information
Share of revenues
Figure 8.4: Proposed Business Model for Gothenburg

Contract: TCP8-GA-2009-234082
Authors: Macário, Reis et al.
Partner Responsible: IST
Dissemination Level: CO
Page: 143 of 181 Date: 07 Apri l 2012
8.3 Case Study 2 - Arlanda International Airport
8.3.1 Brief characterisation of the Case
Stockholm-Arlanda Airport is Sweden’s largest international/domestic airport
located 37 km north of Stockholm, with about 17 millions of passengers per year; 13
million international passengers and 4 million domestic passengers. The map below
shows the four aviation terminals as well as interchanges for ground transport
services such as bus, car and rail services at Arlanda Airport. When it comes to
parking facilities there are about 25 000 parking spaces nearby the terminals, in p-
houses, in long-term parking and in private parking just outside Arlanda with free bus
transport to the terminals. The case study of Arlanda-Airport covers all three levels of
interconnectivity which are addressed in the HERMES project: Interfaces between
different modes: air-rail, air-road, Intefaces between different type of service of the
same mode: air-air and Interfaces between high capacity and low capacity mode: air
vs taxi etc.
CU STOMER S
TR A NSPOR T RA IL OPER ATORS
Dif ferentRail Operators
TR AN SPORT BU S OP ERA TOR S
Dif ferentB us Operat ors
TRA NSP OR T CA R OPER ATOR S
Dif ferentCar Operators
Pass angers
Commerc ial int erac tion: C ompetit ion
Sy nc hronis at ion
Servic e-bas ed
W eb bas ed
Face-t o-f ace
TRA NSP OR T A IR OPER ATOR S
Dif ferent Air Operat ors
S wedavia
TE RMIN A L MA N AGER
Figure 8.5 - Map of Arlanda Airport (left) andAgents and their interaction at Arlanda airport (right)
There is a large network of actors linked to Arlanda Airport, see figure above.
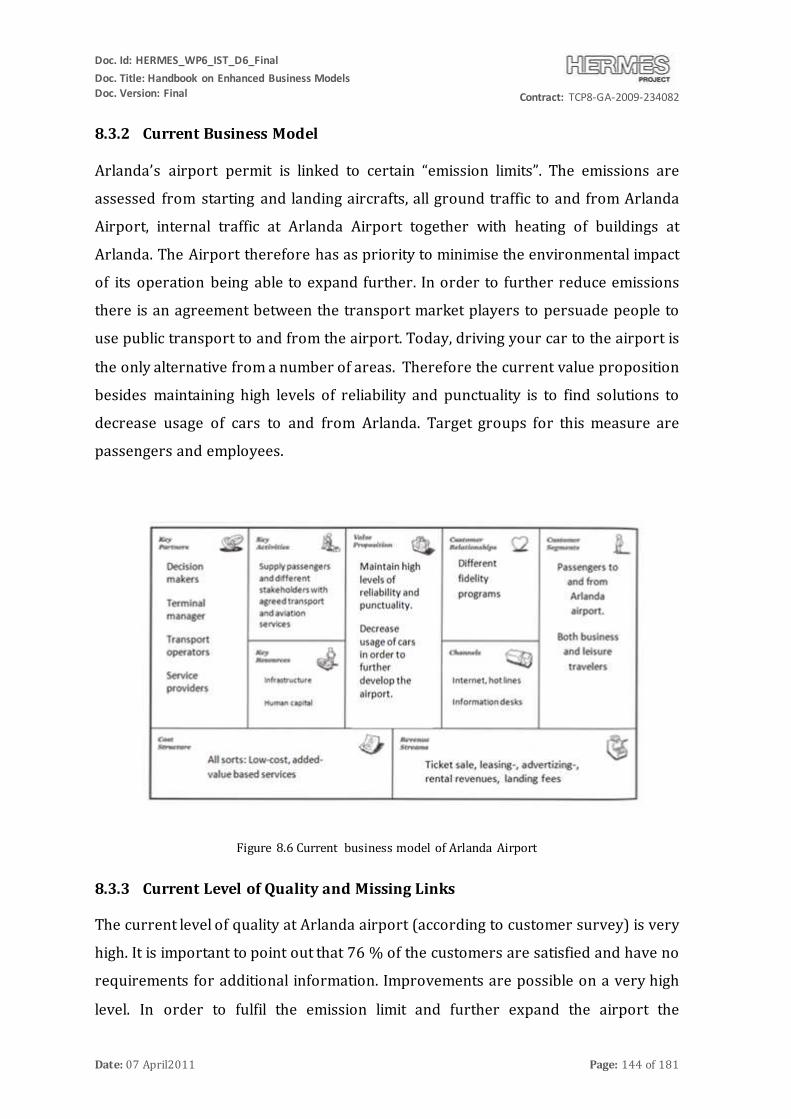
Doc. Id: HERMES_WP6_IST_D6_Final
Doc. Title: Handbook on Enhanced Business Models
Doc. Version: Final
Contract: TCP8-GA-2009-234082
Date: 07 April2011 Page: 144 of 181
8.3.2 Current Business Model
Arlanda’s airport permit is linked to certain “emission limits”. The emissions are
assessed from starting and landing aircrafts, all ground traffic to and from Arlanda
Airport, internal traffic at Arlanda Airport together with heating of buildings at
Arlanda. The Airport therefore has as priority to minimise the environmental impact
of its operation being able to expand further. In order to further reduce emissions
there is an agreement between the transport market players to persuade people to
use public transport to and from the airport. Today, driving your car to the airport is
the only alternative from a number of areas. Therefore the current value proposition
besides maintaining high levels of reliability and punctuality is to find solutions to
decrease usage of cars to and from Arlanda. Target groups for this measure are
passengers and employees.
Figure 8.6 Current business model of Arlanda Airport
8.3.3 Current Level of Quality and Missing Links
The current level of quality at Arlanda airport (according to customer survey) is very
high. It is important to point out that 76 % of the customers are satisfied and have no
requirements for additional information. Improvements are possible on a very high
level. In order to fulfil the emission limit and further expand the airport the

Contract: TCP8-GA-2009-234082
Authors: Macário, Reis et al.
Partner Responsible: IST
Dissemination Level: CO
Page: 145 of 181 Date: 07 Apri l 2012
stakeholders at Arlanda Airport want to increase the number of passengers who are
using public transport (bus and rail modes) to and from Arlanda. Arlanda Airport has
already implemented several measures. For passengers who choose to travel by taxi,
there is already a separate eco-taxi queue outside the airport terminals, in front of the
other taxis. The airport’s target is that all taxis that serve Arlanda Airport shall be
eco-taxis by 2011. The airport also gives preferential treatment to “clean” cars, for
example by allowing them to park as close as possible to the terminal for passengers.
A total of 190 parking spaces were 2007 reserved for clean cars at Swedavia’s parking
facilities at Arlanda.
Still, there are some issues which have to be solved:
1. How to decrease emissions from passengers’ cars (parking and picking-up/leaving someone at the Arlanda)
2. How to decrease emissions from employees’ cars (parking)
8.3.4 Changes for improved Interconnectivity
In order to decrease carbon emissions it is important to increase usage of public
transport. Our value proposition is: to provide integrated and qualitative transport
services for passengers and employees and thereby offer integrated information and
ticket-selling. The target is to enable passengers and employees to use bus and rail
transport services to and from Arlanda Airport.
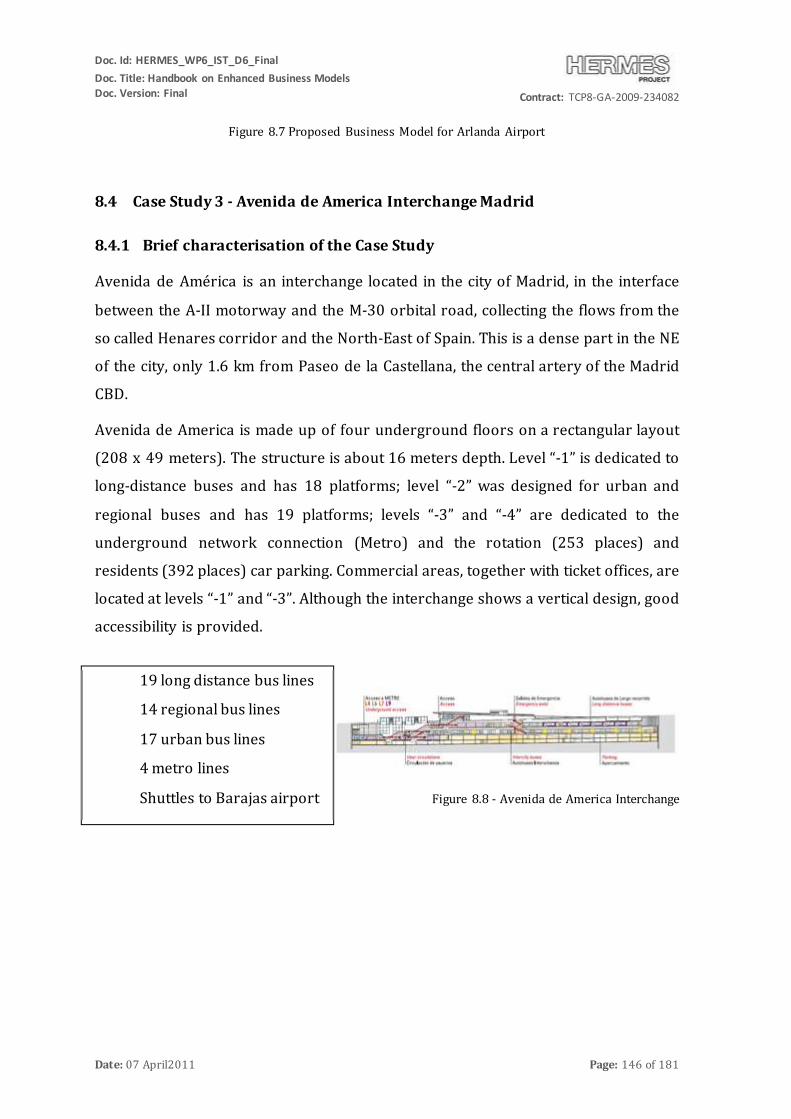
Doc. Id: HERMES_WP6_IST_D6_Final
Doc. Title: Handbook on Enhanced Business Models
Doc. Version: Final
Contract: TCP8-GA-2009-234082
Date: 07 April2011 Page: 146 of 181
Figure 8.7 Proposed Business Model for Arlanda Airport
8.4 Case Study 3 - Avenida de America Interchange Madrid
8.4.1 Brief characterisation of the Case Study
Avenida de América is an interchange located in the city of Madrid, in the interface
between the A-II motorway and the M-30 orbital road, collecting the flows from the
so called Henares corridor and the North-East of Spain. This is a dense part in the NE
of the city, only 1.6 km from Paseo de la Castellana, the central artery of the Madrid
CBD.
Avenida de America is made up of four underground floors on a rectangular layout
(208 x 49 meters). The structure is about 16 meters depth. Level “-1” is dedicated to
long-distance buses and has 18 platforms; level “-2” was designed for urban and
regional buses and has 19 platforms; levels “-3” and “-4” are dedicated to the
underground network connection (Metro) and the rotation (253 places) and
residents (392 places) car parking. Commercial areas, together with ticket offices, are
located at levels “-1” and “-3”. Although the interchange shows a vertical design, good
accessibility is provided.
Figure 8.8 - Avenida de America Interchange
19 long distance bus lines
14 regional bus lines
17 urban bus lines
4 metro lines
Shuttles to Barajas airport
Taxi services
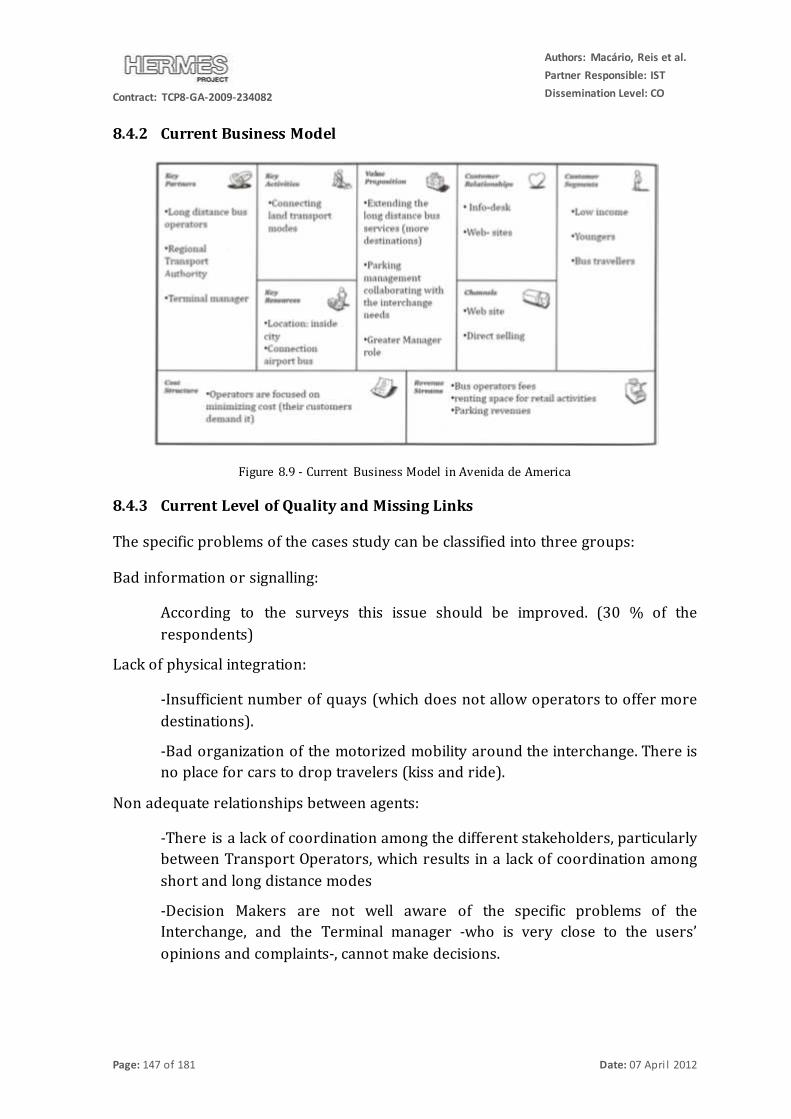
Contract: TCP8-GA-2009-234082
Authors: Macário, Reis et al.
Partner Responsible: IST
Dissemination Level: CO
Page: 147 of 181 Date: 07 Apri l 2012
8.4.2 Current Business Model
Figure 8.9 - Current Business Model in Avenida de America
8.4.3 Current Level of Quality and Missing Links
The specific problems of the cases study can be classified into three groups:
Bad information or signalling:
According to the surveys this issue should be improved. (30 % of the
respondents)
Lack of physical integration:
-Insufficient number of quays (which does not allow operators to offer more
destinations).
-Bad organization of the motorized mobility around the interchange. There is no place for cars to drop travelers (kiss and ride).
Non adequate relationships between agents:
-There is a lack of coordination among the different stakeholders, particularly between Transport Operators, which results in a lack of coordination among
short and long distance modes
-Decision Makers are not well aware of the specific problems of the Interchange, and the Terminal manager -who is very close to the users’
opinions and complaints-, cannot make decisions.
Doc. Id: HERMES_WP6_IST_D6_Final
Doc. Title: Handbook on Enhanced Business Models
Doc. Version: Final
Contract: TCP8-GA-2009-234082
Date: 07 April2011 Page: 148 of 181
8.4.4 Changes for improved Interconnectivity
In this paragraph feasible actions to overcome the above mentioned barriers are
described:
Information and signalling
There should be integrated information systems for all modes, regardless
long or short distance.
Physical Integration
-We propose an extension of the geographical coverage: if operators should
increase the long distance supply more passengers should use the Interchange.
-There should be Joint parking management according to the interchange
needs (space for bus parking or drop off parking).
Relationships between agents
We propose the following relationships between stakeholders: a Terminal
manager acting independently from Transport Operators, Decision
Makers delegating some decisions to the Terminal Manager (those affecting
transfers into the interchange or station). In addition, not only Transport
Operators should be responsible for the service provided to users, but also the Terminal Manager, since users highly value the whole journey
where the transfer is very relevant; and all of them should work coordinated.
A better management of the existing resources will benefit all agents.
8.5 Case Study 4 - Long distance bus services connected with high speed rail
services, the case of Lerida and Zaragoza
8.5.1 Brief characterisation of the Case Study
Zaragoza and Lleida are two Spanish cities located in the North, 150 km distance one
from the other but very well connected, especially by High Speed Railway
connections. With this Case Study Lleida Train Station and Zaragoza Train-Bus
Station have been analysed in parallel, to find out similarities in their business models
and key barriers.
Zaragoza

Contract: TCP8-GA-2009-234082
Authors: Macário, Reis et al.
Partner Responsible: IST
Dissemination Level: CO
Page: 149 of 181 Date: 07 Apri l 2012
The building of the Zaragoza Interchange (opened in 2003) covers an area of 190.000
m2. It consists of 8 rail platforms about 400 meters long, for high-speed and
conventional rail passenger service lines. As regards parking facilities, there are two
external areas with 1800 places available as well as underground parking lots. To
improve intermodality with soft modes a bicycle storage outside the interchange is
provided. Inside the station a travel agency, one hotel, a Police Station, and several
waiting areas, restaurants, shops and car rental services are located.
The central bus station is physically integrated in the building, but only interurban
and long distance bus services are available. There are 46 bus platforms.
Lleida
Lleida railway station underwent an important refurbishment and expansion to fit
high speed requirements (1999-2001).
However, only urban bus services and taxis are provided. Some regional buses at the
station provide a second stop near the train station. In addition, a new bus station will
be constructed next to the railway station, together with other 600 parking places.
Figure 8.10 - Zaragoza & LLeida Stations
8.5.2 Current Business Model
Zaragoza
Zaragoza Services:
-High Speed Rail Services
-Long Distance Rail
Service
-11 long Distance Bus
Services
-Regional rail services
Lleida Services:
-High Speed Rail Services
-Long Distance Rail
-Regional Rail Services
-4 Urban Bus line (not
integrated)

Doc. Id: HERMES_WP6_IST_D6_Final
Doc. Title: Handbook on Enhanced Business Models
Doc. Version: Final
Contract: TCP8-GA-2009-234082
Date: 07 April2011 Page: 150 of 181
Figure 8.11 - Current Business Model in Zaragoza Station
Lleida
Figure 8.12 - Current Business Model in Lleida Station
8.5.3 Current Level of Quality and Missing Links
The specific problems of the cases study can be classified into three groups:
Bad information and signalling:
No integrated information provided for all existing modes at the Stations, but
separated information systems for bus and train services.
Physical Integration:

Contract: TCP8-GA-2009-234082
Authors: Macário, Reis et al.
Partner Responsible: IST
Dissemination Level: CO
Page: 151 of 181 Date: 07 Apri l 2012
At Zaragoza Station there is a physical barrier (a fence) between the railway
and the bus station; therefore despite the fact that both stations are adjacent,
passengers have to walk a long distance to get one or another; which affects intermodality between long distance bus and train very negatively. In addition,
there are parking places at the train station side, and as a consequence of this physical barrier the street facing the bus station side is permanently
congested, with cars illegally parked to the detriment of local buses and taxi services performance.
At Lleida Station, despite the fact that most passengers arrive by car, there is
no parking at the station. However, a 600 car places parking will be constructed in the near future.
Relationships between agents:
- Both the Terminal Manager and the Decision makers are appointed by Adif, the owner of the railway infrastructure, both too focused into railway services,
not in intermodality; which results in a lack of collaboration.
-Local Transport Authorities are not involved nor in the management of the station neither in the decision making process.
-There is no collaboration between bus and train Operators.
8.5.4 Changes for improved Interconnectivity
In this paragraph feasible actions to overcome the above mentioned barriers are
described:
Information and signalling:
Integrated information systems for all modes should be provided, regardless long or short distance.
Physical integration:
-At Zaragoza Station, accessibility between bus and train stations should be
improved
-At LLeida Station, the lack of car places and the high number of passengers
arriving by car make the construction of new parking lots .a top priority
Frequencies and services of local buses stopping in front of the station
should be improved as well.
Relationships between stakeholders:
Local Transport Authorities should be more involved in Terminal
Manager and Decision Makers (both appointed by Adif) activities. All

Doc. Id: HERMES_WP6_IST_D6_Final
Doc. Title: Handbook on Enhanced Business Models
Doc. Version: Final
Contract: TCP8-GA-2009-234082
Date: 07 April2011 Page: 152 of 181
stakeholders should collaborate and coordinate their activities in order to
foster transfers.
8.6 Case Study 5 – Extension of the Adriatic-Ionian corridor from Peloponnese
to Crete
8.6.1 Brief characterisation of the Case Study
In the current situation, the maritime transport (ferry) services linking continental Greece -
including the Peloponnese- to Crete are mainly based on the Piraeus hub port; passenger
flows coming from Western and Central Europe through the Adriatic corridor and having
Crete as final destination, are oriented from the port of Patras to the port of Piraeus,
primarily, through the road transport network (private cars or bus services) and then ferry
services to Crete. Instead of a nodal interchange, the “area” of reference for Case Study 5 is
the corridor Patras- Piraeus- Crete. The examined corridor consists of two legs: a) Patras-
Piraeus and b) Piraeus- Crete. Concerning the first leg (215 km) the connection is realized by
bus, Car or rail. Concerning the second leg a port to port Ferry service is offered. In the port of
Piraeus three (3) private operators are activated realizing the route Piraeus – Crete. The
existing connections from the port of Piraeus are to Iraklio and Chania.
The proposed case study examines the conditions for the successful creation of an
alternative integrated intermodal passenger service from Adriatic- Ionian corridor to
Crete through the Peloponnese, avoiding deviation through Piraeus. In addition, the
future business model includes a second –enlarged- alternative, including new
touristic services.
Figure 8.13 - Map of the corridor Patras- Piraeus- Crete

Contract: TCP8-GA-2009-234082
Authors: Macário, Reis et al.
Partner Responsible: IST
Dissemination Level: CO
Page: 153 of 181 Date: 07 Apri l 2012
8.6.2 Current Business Model
Figure 8.14 - Current Business Model of Patras-Piraeus-Crete
8.6.3 Current Level of Quality and Missing Links
The passenger flows from the Adriatic corridor to Crete reach the final destination via
the hub port of Piraeus. The identified barriers are mainly of functional and
operational “service” character, since from the physical viewpoint infrastructural
connections exist and, therefore, the necessary conditions are fulfilled. The port of
Patras, offers direct access to the entire Peloponnese Region. On the contrary, the
maritime transport (ferry) services linking continental Greece (including the
Peloponnese) to Crete are mainly based on the Piraeus hub port. There are already
some established ferry lines between southern the Peloponnese and northern Crete
but the service frequencies and quality are not satisfactory while the seasonal
character of these flows creates wider problems of fleet optimization. Resulting from
this “missing link”, the majority of passengers use the Piraeus port thus creating
important trip deviations.
In the current situation, ferry operations in the Adriatic–Ionian corridor are fully
independent from the other legs of the chain. Ferry services from the Peloponnese to
Crete are neither completely regular nor coordinated with Patras’ ferry services. In
59% male and
41% female
47% between 36-
55, 35% above 65
and the 12%
between 21-35
The most
common
destination to
Crete i s the city
of Chania; s tart
origin of the
passengers is
36% from Ita ly
Internet services
through a safe
on – l ine booking
system and
advertis ing
through media .
Each transport
service has its
own customer
service
relationship plan.
Tickets
Advertisement on the means of each transport
operator
Analysis of typical “monomodal publ ic transport
service (ei ther urban or inter-urban).
The topic fa l l s
into the analysis
of typica l
“monomodal”
public transport
service.
Analysis of typical
“monomodal”
public transport
service.
The topic fa l l s
into the analys is
of typica l
“monomodal”
public transport
service (ei ther
urban or inter-
urban).
Transport services
of various modes
-not integrated-
are offered along
the examined
corridor.

Doc. Id: HERMES_WP6_IST_D6_Final
Doc. Title: Handbook on Enhanced Business Models
Doc. Version: Final
Contract: TCP8-GA-2009-234082
Date: 07 April2011 Page: 154 of 181
addition, any inland (bus or train) transport service from the port of Patras to the
port of Kalamata is missing. Significant opportunities exist for the improvement and
coordination of these connections. Ferry services in the Adriatic–Ionian corridor
steadily present a high level of service; this is not the case for ferry operations
between southern Peloponnese and Crete. There is considerable space for
improvement of the latter, as well as to inland connections between the ports of
Patras and Kalamata.
It is revealed that the main Gap for Case 5 is the “Low level of service of current
intermodal transport service”, according to WP2 classification and typology.
Moreover, this corresponds to an extreme gap case since the current situation is
based on successive independent mono-modal services on various legs of the
corridor, neither coordinated to each other nor integrated. The main focus of the
proposed model is on the current “missing link” i.e. the inland leg between Patras and
Southern Peloponnese, which needs to be integrated into the network.
8.6.4 Changes for improved Interconnectivity
The proposal of Case Study 5 deals with the development of an alternative, fully
integrated intermodal transport service for passengers between Western/Central
Europe through Italy and the Adriatic–Ionian corridor and Crete, avoiding deviation
through Piraeus. The study examines the entire network configuration of such an
integrated service, including: a) the long distance ferry transport between Italy and
the port of Patras; b) the inland leg connecting the port of Patras to the southern
Peloponnese and c) the medium distance ferry transport from southern Peloponnese
to Crete. The proposed business model activates the “missing link” i.e. the inland leg
between Patras and Southern Peloponnese.
In addition, the proposed business model is related to new touristic services. The
Service Offering consist of two packages: the “direct transport to Crete” (for Non-
Stop Travellers) and the “Transport and Tourism” package. The package for the Non-
Stop Travellers offers the direct access from an Italian Adriatic port to Crete through
the ports of Patra and Kalamata. This service will cover the missing link that exists
today, minimizing the trip deviations. The “Transport and Tourism” package
combines the transfer from an Italian port to Crete with a two days sightseeing tour

Contract: TCP8-GA-2009-234082
Authors: Macário, Reis et al.
Partner Responsible: IST
Dissemination Level: CO
Page: 155 of 181 Date: 07 Apri l 2012
in the Peloponnese. This package includes transportation, accommodation and
sightseeing tour with one ticket for the whole chain.
Description of the future Business Model
Value proposition
• Service improvement: travel time reduction, transport cost reduction
• Service enlargement and additional benefits for users: integrated package
including transport and touristic services (accommodation, cultural activities etc.)
• Additionally, the bundle of new products and transport services relates to “newness”, “performance” of the transport system, “accessibility”
Channels
A 3rd Party Provider (the entity) assumed to operate the proposed business model
will have two main channel categories for reaching its customer segments:
• The “direct” -mainly electronic- channel, through the use of the Internet websites of stakeholders directly involved in the proposed business model
• The indirect channels, notably travel agents or tour operators involved as “intermediary” customers
Customer Relationship
Using the mentioned channels, the customer relationships will be leaded in a more
personalized and reliable frame.
Customer segments
• Non-Stop Travellers (64% of the target population) • Travellers with Stops (travellers’ that want to use their car, such as those that
travel with children and/or have high incomes- 36% of the target population)
Revenue Streams
Tickets per destination, services related to touristic activities (museums,
archaeological areas, other touristic sights etc) and provided services at the level of
interchange.
Key Resources
Resources to be committed by the transport operators include: • Physical (vehicles, vessels, customer support centers, terminals) • Human

Doc. Id: HERMES_WP6_IST_D6_Final
Doc. Title: Handbook on Enhanced Business Models
Doc. Version: Final
Contract: TCP8-GA-2009-234082
Date: 07 April2011 Page: 156 of 181
• Financial (investment for upgrading transport means and infrastructure) Assets required by the 3rd party provider include:
• The Human resources of the 3rd party provider will include the following critical posts (manager, admnistrator, technical support, helpdesk, operators)
• Financial (investment for the development of upstream interfaces and, if necessary, for increasing platform capacity)
Key Activities
The required Key Activities can be separated in two sectors. The Key activities
realized by a 3rd Party Provider and the ones realized by the transport operators.
Concerning the 3rd Party Provider, the Key activities are related to the management
and the monitoring of the service offering (Implementation of a Platform,
Implementation of a system of repair services). Concerning the transport operators,
key activities are related to the the provision of transport and the high level of
handling services with integrated schedules, to an upgraded booking system which
will provide real time online reservations, to customer support before during and
after the trip, to implementation of software and support technology.
Key Partnerships
The business model is based on partnerships between the transport operators, the
travel agencies, the port authorities, local authorities, Chambers of Commerce.
Cost Structure
The suggested business model is clearly cost-value driven. From a management
accounting standpoint there are two types of costs in delivering the planned service
bundle:
• Fixed Costs
• Variable Costs
• Total Costs – the sum of fixed and variable costs.
From a decision-making standpoint, a price must be selected so that the contribution
margin is positive. A simple and workable way to calculate the (minimum) price
required for the service bundle to breakeven is by setting the contribution margin to
zero.
Contract: TCP8-GA-2009-234082
Authors: Macário, Reis et al.
Partner Responsible: IST
Dissemination Level: CO
Page: 157 of 181 Date: 07 Apri l 2012
8.7 Case Study 6 - Gare do Oriente Interchange, Lisbon
8.7.1 Brief characterisation of the Case Study
This case study refers to the connections from the Portuguese north rail-line (Linha
do Norte) to small cities nearby, in the Greater Lisbon area. Nowadays, connections to
these small cities are provided by bus from Lisbon (Gare do Oriente) although rail
stations in north rail-line could represent a closer starting point for these cities. It
was our belief that there could be enough passengers whose final destination is a city
geographically near from a rail station in the north rail-line that could justify the
creation of new transport connections from those railway stations, instead of having
to travel (southward) by rail till Lisbon and take the bus there (northward) to those
small cities. Our motivation was to check whether it would be possible to provide
better transport service to those rail passengers in the final link to their destinations,
without affecting the railway service on a negative way.
Linha do Norte (North rail-line in English) is the main railway line in Portugal. This
line connects the two main Portuguese cities: Lisbon and Oporto. The most
emblematic and important railway station in the north rail-line is Gare do Oriente
Intermodal Terminal, in Lisbon. This terminal is located some 10 km away from the
city center. It gathers subway, short and long distance rail, taxis and local, suburban
and long-distance bus transport services. There are also rent-a-car services at the site
and an underground parking lot.
Another relevant station in the north rail-line is Vila Franca de Xira. In this station
circulates inter-urban, inter-cities and regional trains. Vila Franca de Xira station is 20
km away from Gare do Oriente. In the cities surrounding the Vila de Franca de Xira
there is a significant population concentration within a 10 km radius from the station
(92,656 inhabitants). This population concentration might justify the creation of
dedicated feeder services from these locations to the Vila Franca de Xira station.
Linha do Norte stakeholders are:
• CP – responsible for the railway operations;
• REFER – responsible for the railway infrastructure management.
Vila Franca de Xira train station stakeholders are:

Doc. Id: HERMES_WP6_IST_D6_Final
Doc. Title: Handbook on Enhanced Business Models
Doc. Version: Final
Contract: TCP8-GA-2009-234082
Date: 07 April2011 Page: 158 of 181
• Public Decision Makers: REFER (owner of the railway stations) and the municipality
of Vila Franca de Xira;
• Transport Operators: short distance bus operator (BoaViagem) and taxis;
• Consumers’ Association: DECO.
8.7.2 Current Business Model
According to Osterwalder (2004) there are nine building blocks Customer Segments
(CS), Value Propositions (VP), Channels (CH), Customer Relationships (CR), Revenue
Streams (R$), Key Resources (KR), Key Activities (KA), Key Partnerships (KP) and
Cost Structure (C$).
Figure 8.15- Current Business Model at Gare do Oriente/Linha do Norte
8.7.3 Current Level of Quality and Missing Links
The main problems identified along the north rail line are:
• Poor connections to small-sized cities from train stations in the greater Lisbon
area (most connections are only provided from Gare do Oriente);
• Poor or inexistent information about further connections (besides train) or
adjustments of connections;

Contract: TCP8-GA-2009-234082
Authors: Macário, Reis et al.
Partner Responsible: IST
Dissemination Level: CO
Page: 159 of 181 Date: 07 Apri l 2012
• Poor information signaling in the stations;
We had also identified the opportunities at the site:
• Good road connections from other train stations besides Gare do Oriente to
small-sized cities;
• Space for information desks at train stations or information displays;
• Good access for people with special mobility needs.
Current value proposition is characterized by good railway service in the Linha do
Norte rail link, with good integration to bus services from Lisbon Oriente to small-
cities . Passengers with destinations in the greater Lisbon area always have to use
Lisbon as an origin point despite other rail stations being geographically closer to
serve these small-cities. Vila Franca de Xira, for instance is closer to Coruche than
Lisbon but there are no bus connections nowadays from there. Other example is
Santarém which is closer to Peniche than Lisbon but once again there are no bus
connections to Peniche except from Lisbon. Vila Franca de Xira is the city that we
choose to analyse.
Our expectation is that there could be an interesting number of passengers whose
final destination is a city geographically near from a rail station in the north rail-line
that have to departure from Lisbon since there are no transport connections from the
other rail stations. This is the case of Vila Franca de Xira rail station, which is closer to
some of those small-cities than the Oriente station in Lisbon, but does not offer
adequate bus transport connections.
Our intention is to provide better transport service to rail passengers without
affecting the quality of the rail services.
8.7.4 Changes for improved Interconnectivity
The analysis of the survey results clearly shows that our initial hypothesis was not
confirmed, thus leading to the conclusion that it does not make sense to develop new
direct bus services from Vila Franca de Xira rail station to small-cities nearby. With
such a small market potential the new transport service is not feasible.
The analysis of the measured demand patterns shows that the market to feed railway
service is already balanced, and passengers are already well served in terms of public
Doc. Id: HERMES_WP6_IST_D6_Final
Doc. Title: Handbook on Enhanced Business Models
Doc. Version: Final
Contract: TCP8-GA-2009-234082
Date: 07 April2011 Page: 160 of 181
transport accessibility by the large amount of urban and suburban services available
at the Gare do Oriente station.
Since the initial hypothesis was not confirmed, no new services are needed and no
change in the prevailing business models is necessary. As it was mentioned above,
transport market regulated and balanced, so, passengers that need to travel to the
small-city are using other transport (i.e. private car) and not train plus other mode.
In theory, because surveys were only done at the railway station, it is possible that
there are several potential customers for those bus services feeding the intermediate
railway stations that currently use another transport mode for their long distance
trip, for example, private car. We believe this is not the case, because in any case the
travel time by car or bus from those small cities to the Oriente station is rather short
(always below 30 minutes) and so the advantages of using the rail for the long
distance trip are already within reach.
8.8 Case Study 7 - Faro International Airport:
8.8.1 Brief characterisation of the Case Study
The airport of Faro is the main gateway for accessing the touristic region of Algarve,
in the south of Portugal. The airport is located 5 km away from the main city in the
region: Faro. The airport of Faro presents a high seasonality since it fundamentally
serves the tourist activity of Algarve region which attraction lies in natural conditions
such as sun and sea during the summer. Therefore, there is a structural imbalance
between the IATA Summer and Winter demand.
Only road based connections are offered at the airport. The nearest train station is
located in the city centre of Faro. The available transport services are: public bus,
private bus (shuttle), taxi, rented-cars, or private cars.
In terms of public bus, there is one transport operator serving the airport: EVA –
Transportes. This operator links the airport with the main bus terminal in the city
centre. From this terminal there is a large variety of routes to the main cities of
Algarve region and to the main cities in Portugal. Bus terminal is located near the
train station of Faro, which offers the possibilities of regional and a long distance

Contract: TCP8-GA-2009-234082
Authors: Macário, Reis et al.
Partner Responsible: IST
Dissemination Level: CO
Page: 161 of 181 Date: 07 Apri l 2012
lines. The offered bus service between airport and the city centre starts at 5 a.m. and
ends at 11 p.m. more or less during the summer.
Private bus (shuttle) services are also available at the airport. These services can
either be booked on-line directly to the transport providers, or as a transfer service in
a hotel package. The private bus operators cannot directly sell tickets to the
passengers at the airport.
There is a wide and permanent offer of taxi services. Besides normal taxi services
there is a special taxi for tourist passengers that is more expensive. Taxis are one of
the most common options to leave Faro Airport.
The agents with relevancy for the definition of the business models are:
• Passengers; • Airport of Faro Manager (ANA);
• Rent-a-Car companies; • Taxis;
• Public Transport; • Private Shuttle Companies;
• Hotels.
8.8.2 Current Business Model
According to Osterwalder (2004) there are nine building blocks Customer Segments
(CS), Value Propositions (VP), Channels (CH), Customer Relationships (CR), Revenue
Streams (R$), Key Resources (KR), Key Activities (KA), Key Partnerships (KP) and
Cost Structure (C$).

Doc. Id: HERMES_WP6_IST_D6_Final
Doc. Title: Handbook on Enhanced Business Models
Doc. Version: Final
Contract: TCP8-GA-2009-234082
Date: 07 April2011 Page: 162 of 181
Figure 8.16 - Current Business Model of Faro Airport
The business model is defined from the perspective of the airport manager. In this
sense, we may say that intermodal transport is not included in the current value
proposition of the airport.
8.8.3 Current Level of Quality and Missing Links
There are several problems affecting the interconnectivity at the Airport of Faro.
These problems are visible at the various levels of decision. At strategic level, we
could identify a lack of strategic alignment between stakeholders. Indeed, intermodal
transport is not a priority for any of the stakeholders. They are only interested in
providing their own transport service, and essentially consider all the others as
competitors, in particular, in the land based transport providers.
At tactical and operational levels, we could identify the following barriers, such as:
- Information - there is no available aggregated information concerning the
several transport solutions. Each mode of transport only offers information
about its own services;
- Ticketing - there is no integrated fare system. The passenger needs to buy a
ticket for each leg;

Contract: TCP8-GA-2009-234082
Authors: Macário, Reis et al.
Partner Responsible: IST
Dissemination Level: CO
Page: 163 of 181 Date: 07 Apri l 2012
- Scheduling - there is no integration of schedules. This problem is somewhat
reduced since the majority of the passenger use flexible land based transport
services, such as: taxi, rented cars or private shuttle.
The airport is being negatively affected by the lack of intermodality, which is
evidenced in the growing amount of negative reviews and references posted by the
passengers on some major international travel websites. Therefore, the airport is in a
key position to perform the role of facilitator and negotiator, between all transport
providers. Finally, the airport plays a key role in the economical development of the
region. It has therefore some degree of influence in many other agents, such as:
municipalities, hotels and similar, which can be fundamental for the viability of the
proposed business model.
8.8.4 Changes for improved Interconnectivity
In order to overcome the current problem and to implement a truly intermodal
service between the air and the land based transport services, we propose to include
air-land intermodality into the value proposition of the airport. We propose to
implement a flexible small-scale collective transport service integrated with the air
transport, in terms of tariffs, scheduling and information. The collective transport
service will provide transport to some destinations in the region of Algarve.
Passengers would be offered a seamless transport journey, since their airport of
origin until their final destination in Algarve. By seamless we understand no (or
short) waiting time at the airport and direct transport to final destination. In Figure
8.17 we present the canvas according to Osterwalder for the new business model.

Doc. Id: HERMES_WP6_IST_D6_Final
Doc. Title: Handbook on Enhanced Business Models
Doc. Version: Final
Contract: TCP8-GA-2009-234082
Date: 07 April2011 Page: 164 of 181
Figure 8.17 – Proposed Business Model for Faro Airport
The FCTS operator will concentrate all the information about the new service,
including schedules and tariffs. The basic sales channel must be a clearly marked
counter on the arrivals hall, although it is possibly useful to consider from the
beginning a web-based sales channel. Another channel is foreseen, which consists in
selling tickets on board aircrafts. This will imply the establishment of a commercial
agreement with the air transport companies.
8.9 Case Study 8 – Antwerp Airport
8.9.1 Brief characterisation of the Case Study
Antwerp Airport4 is a small regional, slots free airport which mainly focuses on
business travellers, but a market opportunity can be found in offering leisure flights.
To respond to the needs of the time sensitive business traveller, check-in counters
open one hour before and close only twenty minutes before departure of the flight.
Given the size of the airport, walking distances around and within the airport building
are relatively small. Furthermore, Antwerp Airport is a site where short distance air
4 When comparing Antwerp Airport to the other Belgian regional airports (Charleroi, Kortrijk, Liège and Ostend) one can see that Antwerp Airport represents a rather low number of passengers and tonnage.

Contract: TCP8-GA-2009-234082
Authors: Macário, Reis et al.
Partner Responsible: IST
Dissemination Level: CO
Page: 165 of 181 Date: 07 Apri l 2012
transport meets up with short distance land transport (car/taxi and bus). Currently,
there are about 5 flights a day scheduled to London City Airport and 2 flights to
Manchester, which are performed with small airplanes (Fokker 50). In the airport
building there are offices of car rental companies and several taxis available. Next to
the airport building, there are 500 free parking spaces and a bus stop where about
every fifteen minutes there is a bus that brings the travellers to the two nearest train
stations (15 min. ride).
The airport management and the
carrier, CityJet, co-operate to offer an
air transport connection. The other
modes available do not co-operate
whatsoever and offer their services
independently from each other, in
order to maximise their revenue and
thus profit.
Figure 8.18 - Interactions between agents in Antwerp Airport

Doc. Id: HERMES_WP6_IST_D6_Final
Doc. Title: Handbook on Enhanced Business Models
Doc. Version: Final
Contract: TCP8-GA-2009-234082
Date: 07 April2011 Page: 166 of 181
8.9.2 Current Business Model
Key partners
• The airport is part of the Flemish Government
• Concessions from the businesses on the site
Key Activities
Providing short distance air transport services
Value Proposition
• 2 destinations: London (City) & Manchester
• The services are adapted to the demand of the main customers: - Quick (20
minutes concept, large parking close by, small building with short walking distances)
- Not much additional services (such as retail needed)
Customer
Relationships
• Personal service (thanks to the relatively small airport)
• Fidelity programs (thanks to the merger with KLM/Air France)
Customer
Segments
Business traveller, majority is male and between 36 and 55
Key Resources
• Personnel • Infrastructure • Fleet of small
airplanes
• No slots
Channels
• Pre-trip information • Website,
brochures,… • On-trip
information • Not needed
thanks to frequent visits
• Ticket sales
• Internet, travel agencies, ticket desks
Cost Structure
• Exploitation and investments (partly paid by money from endowments): maintenance of airport building, salaries, …
• Safety and security costs are the main costs
Revenue streams
• Airport has some endowment from the Flemish Government
• Concessions from the businesses on the site
• Ticket sale
Figure 8.19 - Current Business Model at Antwerp Airport
8.9.3 Current Level of Quality and Missing Links
Currently, 75% of the passengers access the airport by car. However, the roads
surrounding the airport are congested. To improve the accessibility of the airport, the
use of the car has to be discouraged and the passengers have to be convinced to use
the public transport more often. However, there is no direct train connection at
Antwerp Airport and the other modes (bus/taxi) are underused because the services
are rather poor (unreliable and expensive). Furthermore, if Antwerp Airport wants to
try and attract also leisure passengers, a good accessibility is important. Improving
the current public transport services and providing direct rail access would probably
imply a mode shift for some of the existing customers.

Contract: TCP8-GA-2009-234082
Authors: Macário, Reis et al.
Partner Responsible: IST
Dissemination Level: CO
Page: 167 of 181 Date: 07 Apri l 2012
8.9.4 Changes for improved Interconnectivity
Nowadays, some complaints are raised about the unreliable bus services and the
expensive taxi rides. These services can be improved if the transport operators and
the airport management come to an agreement concerning services levels. For
example, the bus and taxi companies commit to improving their services and, in
return, the airport management promotes the public transport services. Integrated
ticketing, where passengers take the bus by using their boarding pass, would also
stimulate the use of public transport.
On a longer term, the airport can come to an agreement with the rail services
provider and a train station could be installed at the airport site. Physically this is
possible, since rail tracks are running next to the airport site. Service level
agreements and ticket integration are also needed here.
Note: Besides poor services delivered by their drivers, bus and taxi companies also
have to deal with congestion around the airport. These problems cannot be solved
easily. Furthermore, although installing a train station is physically possible and
useful, economically it is not viable due to the fact that too little passengers would
take the train to access the airport. Therefore, one can conclude that improving
intermodality is not easy at Antwerp Airport and thus not possible everywhere.
8.10 Case Study 9 – The Port of Patras
8.10.1 Brief characterisation of the Case Study
The Patras Port consists of a Passengers Port which handles an important part of the
total passenger’s sea traffic between Greece and other countries and also of a
Commercial Port. The overall international flows of Passengers for the period 1999 –
2010 reach the 1milion regarding mainly the Greece-Italy connections while the
national flows are almost the half of it mainly from/to the Ionian islands.

Doc. Id: HERMES_WP6_IST_D6_Final
Doc. Title: Handbook on Enhanced Business Models
Doc. Version: Final
Contract: TCP8-GA-2009-234082
Date: 07 April2011 Page: 168 of 181
According to the figures above regarding the annual passenger demand, there is a
small decrease during the last eight years. The limited accommodation capability of
the current Port and the construction of the Egnatia Motorway which improved the
accessibility of other competitive ports, may constitute some reasons for this
decrease.
The port of Patras constitutes an intermodal hab. The main intermodal connections
of the port are between long and short distance ferries with long and short distance
rail, air, bus and road services. The different agents involved in this intermodal
operation of the port are the Port Authority, the interurban and urban Bus Authority,
the Municipality of Patras, the Shipping companies, the Passengers and the Taxi
drivers. The interaction between them is presented in the following diagram.
The case study aimed at identifying the gaps of the current business model of Patras
port regarding mainly the factors that influence the passenger behavior and choice in
order to propose a new business model and a value proposition capable of attracting
additional passenger demand in relation to the additional cost.
Figure 8.20 - Port of Patras international and national annual transport demand
Figure 8.21 - Graphical representation f the interaction between the agents of Port of Patras

Contract: TCP8-GA-2009-234082
Authors: Macário, Reis et al.
Partner Responsible: IST
Dissemination Level: CO
Page: 169 of 181 Date: 07 Apri l 2012
8.10.2 Current Business Model
The description of the current Business Model of the Port of Patras is presented in the
following Table.
8.10.3 Current Level of Quality and Missing Links
According to the results of the passenger survey that took place in the port during the
summer period, the overall satisfaction with the current level of quality of the offered
services was high. The main problems and opportunities for the port of Patras
• Two main customer segments the national and international passenger flows.
• Seasonality of the demand with peak period between July and October.
• The passenger ages varies mostly between 21-55 years old while there are almost equal male and female users of the
port.
• Financial
resources of the
Port
• Human resources
• Physical resources
(technical
equipment)
• The geographical
characteristics of
the port.
• The quality of the
port’s services as
an interchange
node in the
whole intermodal
passenger
transport chain.
• The quality of
passenger
interconnectivity.
• Internet services • Information to
mobile phones
• Informational material of the port (newsletters,
flyers).
• Information desks inside the passenger terminal
• special discount card to the port users for shopping in Patras
• always available personnel in the port in order to hear the problems or complaints that the passengers
• Revenues from general charges for using the port facilities
• •Revenues from renting port facilities •Revenues from mooring rates •Revenues from other port services (maintenance, cleaning etc)
• General charges
for using the port
facilities
• Revenues from
renting port
facilities (rooms,
warehouses etc)
• Mooring rates
• Other port
services
(maintenance,
cleaning etc)
• Shipping lines • Shipping
Companies • External firm
for transferring the luggage of passengers
• Lack of cooperation in a multimodal level
• Private company that operates the terminal like a land (facility) owner.
• Seeks to minimize the operating costs and in the same time tries to identify the services or the attributes in the port area for maximizing the value for the users.
Figure 8.22 - Current Business Model of the Port of Patras

Doc. Id: HERMES_WP6_IST_D6_Final
Doc. Title: Handbook on Enhanced Business Models
Doc. Version: Final
Contract: TCP8-GA-2009-234082
Date: 07 April2011 Page: 170 of 181
identified concerned the physical dimension of interconnectivity, the logical
(information display) and economical (integrating ticketing) as well as the different
organization of some existing services (luggage handling).
Specifically a main (connectivity) problem of the port constitutes the long distance
between the main port area (passengers’ waiting area) and the platforms, for which
the passengers are compelled to traverse carrying their luggage. This issue becomes
even more critical as far as people with disabilities and elderly people are concerned.
The port authority could overcome this interconnectivity barrier by putting small
buses for transferring the passengers from the main port area to the platforms.
Another major issue the passengers’ survey has emerged concerns the information
displays and the signposting of the port. All passengers identified this issue as highly
important and at the same time not sufficiently covered by the port. Low cost
investments in signs and info displays could resolve this issue and constitute an
opportunity for attracting additional passenger demand in the port.
Finally, a main (institutional) problem that was identified by the passengers’ as well
as the stakeholders’ surveys is the lack of cooperation among the transport (and the
other) stakeholders of the port. This fact affects the quality of service of the port since
it leads to the lack of timetables’ coordination as well as integrated ticketing. The
particularity of the last interconnectivity problems is that the cooperation of all
involved stakeholders is a prerequisite in order to resolve them. On the contrary the
previous barriers could be arranged by the terminal operator (port authority) alone.
8.10.4 Changes for improved Interconnectivity
The first two measures that must be taken in order to improve interconnectivity are
the improvement of signposting and the free transfer of passengers and luggage and
are strictly related to the port authority. The other two measures are integrated
ticketing and coordinated timetables presuppose the close collaboration between all
different agents involved. The first group of measures addresses the problem
(barrier) of increased waiting times and low passenger comfort while the second
group promotes interconnectivity as a whole, resulting in the enhancement of the
quality of services.

Contract: TCP8-GA-2009-234082
Authors: Macário, Reis et al.
Partner Responsible: IST
Dissemination Level: CO
Page: 171 of 181 Date: 07 Apri l 2012
The combination of the proposed measures tackle all the major barriers for the
promotion of passenger intermodality in the port of Patras which are mainly related
to the lack of sufficient info provision and lack of cooperation between the
stakeholders (which both lead to increased transfer times).
The modifications of the business Model in relation to the aforementioned
suggestions are described in detail in the next figure.
• The port authority should approach the involved transport stakeholders as well as the Municipality of Patras in order to examine the possibility of providing integrated ticketing services through the port’s website as well as coordinated timetables.
• The key
activities of the
port are not
differentiated
except for the
addition of the
integrated tick-
eting service
which is
currently
offered only by
the private
• Remaining
the Same
• Achievement of ‘Seamless transfer’ through: - adequate signposting and info displays -Transfer to the platforms of the passengers and the luggage
• Achievement of ‘Integration of transport legs’ through: -Integrated ticketing via the port’s webpage (one shop stop)
-Coordinated
• The customer relationship will be improved due to the upgraded commercial transactions via the port’s webpage.
• An additional channel will be added for allowing passengers to purchase tickets through the
• Special attention must be given to the “international and national tourists” segmentation.
• The cost structure remains the same. Some investments costs are proposed namely the addition of signposting and the transfer to the platforms of the passengers and the luggage.
• Expected to increase in the medium to long term time horizon through the increase of passenger demand which will lead to higher revenues for the shipping companies.
Figure 8.23 - Proposed modifications in the Business Model of the Port of Patras
Doc. Id: HERMES_WP6_IST_D6_Final
Doc. Title: Handbook on Enhanced Business Models
Doc. Version: Final
Contract: TCP8-GA-2009-234082
Date: 07 April2011 Page: 172 of 181
8.11 Case Study 10 – Intermodal Network of Lyon Metropolitan Area (REAL
Project)
8.11.1 Brief characterisation of the Case Study
The REAL project (REAL is a French acronym for Express Network for the Lyon
Metropolitan Area) aims to develop intermodality at the Lyon metropolitan Area. To
achieve this goal, involved partners reinforce public transport networks integration
and coordination.
Many institutional actors are involved in this project with local governments, public
transport organizing authorities, the French rail transport company (SNCF) and the
owner and manager of the French rail network (RFF).
The REAL project is a huge and very ambitious project not only focusing on a station
or a transport mode but referring to interconnection between every public transport
modes at short (local or regional by urban public transports or regional trains and
bus) and long distance (national or international by train or plane). To bring out some
lessons for intermodality coordination and integration, the contribution to the project
will focus on the specific case of the Part-Dieu intermodal station.
The Part-Dieu station is today one of the most important station in Europe for transit
passenger traffic. It proposes and connects different transport modes (rail, bus, car
and two-wheel modes) at long and short distances. The station has been planned in
1983 for a daily traffic of 35.000 passengers. In 2001 its traffic hit 80.000 daily users.
The number of persons using the Part-Dieu station at the end of 2008 is estimated to
135.000 per day (22,8 million per year) with among them 105.000 rail passengers
(see RFF, 2011). More than one user in five crossing or spending time on the Part-
Dieu station is not a rail passenger.

Contract: TCP8-GA-2009-234082
Authors: Macário, Reis et al.
Partner Responsible: IST
Dissemination Level: CO
Page: 173 of 181 Date: 07 Apri l 2012
Figure 8.24 - Part-Dieu station concourse
Figure 8.25 : Stairs to access to the tracks at Part-Dieu
Three main categories of agents have been identified in the Part-Dieu case study: the
terminal manager, public decision makers, users (with users’ associations). Transport
operators, also using the Part-Dieu station are not really involved in the inter-modal
transfer issue.
To achieve transfer time minimization and in-station passenger flow improvement,
terminal managers can implement passenger traffic lanes. These traffic lanes should
be clearly delimited with stopping areas. Visual signs and/or personnel should be
used to inform the Part-Dieu station user.
Part-Dieu station user could adopt a new strategy changing departure and/or arrival
time in the Part-Dieu station for non-constrained trips. First, they don’t suffer any
more from passenger traffic congestion and then, they limit congestion in peak-hour.
Another strategy, more radical than previously, consists in changing the
departure/arrival station. Indeed, most of short and long distance trains serve both
the Part-Dieu station and the Perrache station. The last station is not congested and is
also linked to metro, tram and bus network.
The strategy of public makers is more complex. It consists mainly in coordination
between urban, departmental, regional and national transport policy makers to limit
transport network development around the Part-Dieu station and therefore the
station-crossing by public transport users. Another strategy, not really feasible today,
is to extend the station with an underground level.
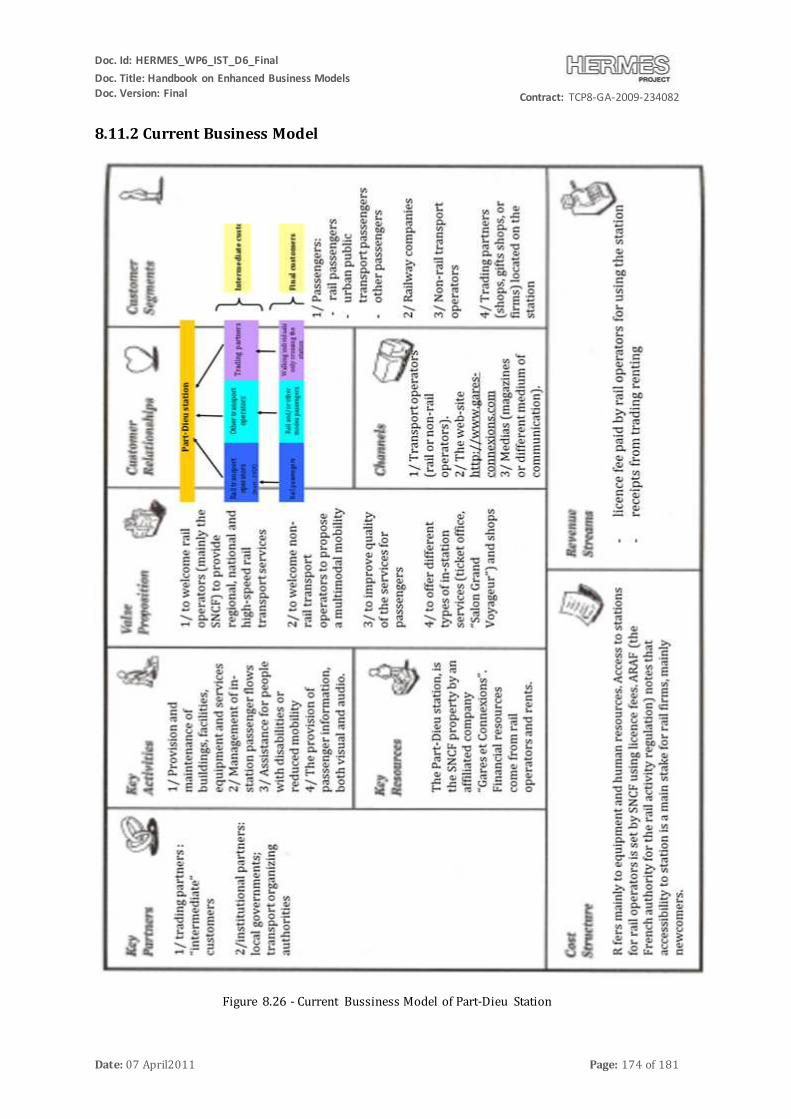
Doc. Id: HERMES_WP6_IST_D6_Final
Doc. Title: Handbook on Enhanced Business Models
Doc. Version: Final
Contract: TCP8-GA-2009-234082
Date: 07 April2011 Page: 174 of 181
8.11.2 Current Business Model
Figure 8.26 - Current Bussiness Model of Part-Dieu Station

Contract: TCP8-GA-2009-234082
Authors: Macário, Reis et al.
Partner Responsible: IST
Dissemination Level: CO
Page: 175 of 181 Date: 07 Apri l 2012
8.11.3 Current Level of Quality and Missing Links
The Part-Dieu station has been planned in 1983 for a daily traffic of 35.000
passengers. In 2001 its traffic hit 80.000 daily users. In this context, the crucial point
for the Part-Dieu station managers is to improve passenger quality of services and
more precisely the following items:
- Passengers information (on delays, train track...);
- Signage improvement;
- Modal and intermodal transfer time improvement;
- Facilities development : shops and other services;
- Safety, comfort improvement in waiting areas;
- Cleaning and hygiene.
According to forecasts, the number of daily passengers should increase to 130,000 in
2013 and 156, 000 in 2020. Such an increase can be explained first by a higher
demand for short rail trips from or to Lyon, mainly for home to work trips. Between
2004 and 2009, short rail trip demand has increased by 7% per year and the
tendency should continue (an increase hypothesis of 4.8% until 2030 is announced
by RFF). The second main factor explaining an increase of the Part-Dieu station daily
passengers is the long distance rail network improvement.
To prevent from a saturation increase and to renovate the station, a multi-phased
improvement program is planned with a new platform access and signage
improvement scheme and a new passenger rail track (in 2010), a central walking lane
widening and an east entrance improvement, a new track development, a plan to
improve intermodality on the station neighbourhoods (in 2013).
Missing links can be summarized within the 6 following items:
- Real-time information system to passengers/transport operators and terminal
manager on the station
- Timetable synchronization for interconnected modes
- Signage improvement to access to facilities (other than shops) and linked
sound signposting
- Passengers corridors inside the station to regulate traffic flow

Doc. Id: HERMES_WP6_IST_D6_Final
Doc. Title: Handbook on Enhanced Business Models
Doc. Version: Final
Contract: TCP8-GA-2009-234082
Date: 07 April2011 Page: 176 of 181
- Accessibility facilities – mainly for disabled persons
- Waiting time areas with seats and facilities to occupy waiting time
8.11.4 Changes for improved Interconnectivity
The proposal developed in this sub- section aims to overcome the current barriers
using a three-type improvement scheme. In a first time, improvement need is
“physical”. It doesn’t need to high financial resources and refers first to passengers
corridors implementation coupled to signage improvement and then to a waiting
time areas capacities increase.
The second improvement is technological and/or technical. It is composed central by
a real-time information system for passengers, transport operators and terminal
manager. Its aims also to reduce differences on accessibility to facilities between
disabled and non-disabled persons, with adapted equipment. Technical
improvements need high financial resources.
The third improvement refers to transport system organization with a timetable for
interconnected modes, mainly for short and long distances rail modes.
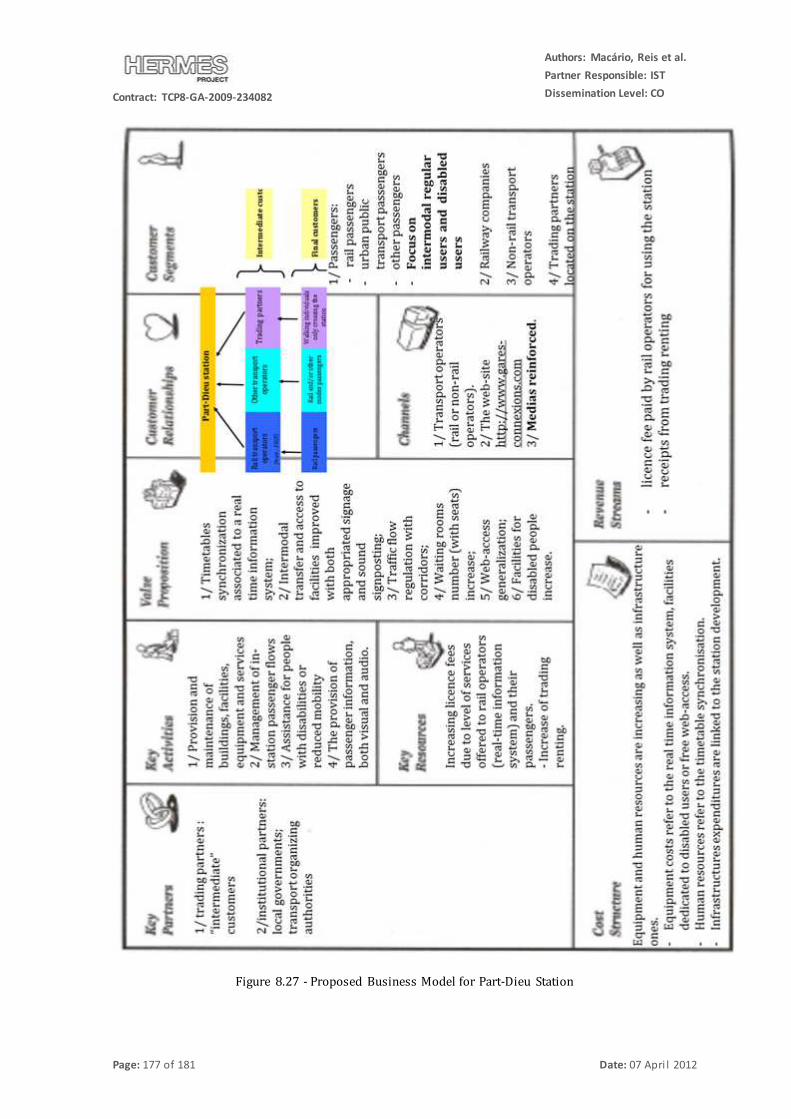
Contract: TCP8-GA-2009-234082
Authors: Macário, Reis et al.
Partner Responsible: IST
Dissemination Level: CO
Page: 177 of 181 Date: 07 Apri l 2012
Figure 8.27 - Proposed Business Model for Part-Dieu Station

Doc. Id: HERMES_WP6_IST_D6_Final
Doc. Title: Handbook on Enhanced Business Models
Doc. Version: Final
Contract: TCP8-GA-2009-234082
Date: 07 April2011 Page: 178 of 181
8.12 Case Study 11 – Regional Airport Frankfurt-Hahn
8.12.1 Brief characterisation of the Case Study
Frankfurt-Hahn Airport (IATA Code: HHN) is a commercial airport located in
Rhineland-Palatinate to the west of central Germany. The former military airport was
opened for civil flights in 1993. Since then the airport has become one of Germany’s
fastest growing airports especially since 1999 when the Irish low cost carrier Ryanair
settled on Frankfurt-Hahn and developed the airport to one of its major airport bases.
In 2010 around 3.5 million passengers and 228.000 tonnes of freight was handled at
Hahn airport. Since January 2009 Frankfurt Hahn airport is owned by the federal
states of Rhineland-Palatinate (82.5%) and Hessia (17.5%) but the airport
management is currently searching for private investors. At Frankfurt-Hahn airport
all three levels of interconnectivity which are addressed by the HERMES project are
covered, namely different transport modes (air to road), public (bus) versus private
transport modes (car) as well as high (air) versus low capacity transport modes
(car/taxi). Different stakeholders are therefore operating at the airport as illustrated
in the following.
Figure 8.28 - Interactions between agents at Frankfurt-Hahn Airport
8.12.2 Current Business Model
Frankfurt Hahn airport is depending on an effective operating road infrastructure as
railway is currently not operating to Hahn airport. Therefore, accessibility to the
airport is limited to private transport modes where car is the predominant transport

Contract: TCP8-GA-2009-234082
Authors: Macário, Reis et al.
Partner Responsible: IST
Dissemination Level: CO
Page: 179 of 181 Date: 07 Apri l 2012
mode or to public transport services that are currently limited to buses. In terms of
intermodality and interconnectivity the current business model is focused on road
transport exclusively. The strategy has been to use the benefits of the small size of the
airport, which assures short distances in and around the terminal and the extensive
space of the former military ground, which can be used for parking facilities. Since a
high percentage of a passengers used private cars, the airports interconnectivity
strategy particularly targeted car users by providing cheap parking and free shuttle
buses from the more distant parking facilities. According to Osterwalder (2004) the
following characteristics of Hahn airport’s business model can be deduced.
Figure 8.29 - Current Business Model of Frankfurt-Hahn Airport
8.12.3 Current Level of Quality and Missing Links
The current level of quality at Hahn airport and especially the customers’ satisfaction
with space, signposting, added values, friendliness of staff, waiting times, direct
services etc. is already on a very high level. Still on an acceptable satisfactory level but
with much lower absolute values is the accessibility situation of Hahn airport.
Customers perceive the access / egress situation as time consuming and not very
satisfactory which is due to the geographical location of the airport. A rail connection
is planned but still has to pass through the process of financial planning and public
approval. Thus, a completion of the rail connection is not expected for the near future.

Doc. Id: HERMES_WP6_IST_D6_Final
Doc. Title: Handbook on Enhanced Business Models
Doc. Version: Final
Contract: TCP8-GA-2009-234082
Date: 07 April2011 Page: 180 of 181
The intermodality and interconnectivity gaps identified for Frankfurt Hahn airport
are therefore related to HERMES Cluster 1 interconnectivity barriers which relates to
improving physical interfaces.
8.12.4 Changes for improved Interconnectivity
In 2011 the existing federal road which passes by the airport has been upgraded and
extended that now new and comfortable capacities for access/egress exist. Therefore,
improvements for road infrastructures are not required. Contrarily, accessibility
opportunities for railway are still discussed because a former railway line passes
close to the airport which is currently not in operation. A reactivation of approx. 60
km of tracks, which are single-tracked and currently inoperative, is planned
(including approx. 10 km of tracks which need to be double-tracked and an airport
station at Hahn). Approx. 95 Mio Euro is necessary for the connection of Hahn airport
to the German railway network. Travel times between Hahn airport and connection
stations to the German railway network are predicted to 90 minutes between Hahn
airport and Mainz Central Station and around 125 minutes for the distance Hahn
Airport – Mainz – Frankfurt Central Station which is longer than average travel times
by car (around 60 minutes to the centre of Mainz and 90 minutes to the centre of
Frankfurt). Therefore, travel time savings are not the driving force behind the
investment plans. The main value of the proposition stems from a number of
improvements, such as reduced waiting times, higher flexibility, higher reliability,
lower necessity to transfer between different modes and higher comfort, which may
lead to improved accessibility of the airport via public transport modes. Changes in
the business model (including rail access) are illustrated in Osterwalder’s scheme
hereafter.

Contract: TCP8-GA-2009-234082
Authors: Macário, Reis et al.
Partner Responsible: IST
Dissemination Level: CO
Page: 181 of 181 Date: 07 Apri l 2012
Figure 8.30 - Proposed Business Model for Frankfurt-Hahn Airport


![[Hermes] Corpus Hermeticum](https://img.pdfslide.us/doc/110x75/55cf993f550346d0339c5f29/hermes-corpus-hermeticum.jpg)