Embed Size (px)
Citation preview
© 2018. Published by The Company of Biologists Ltd.
Critical thermal limits of bumble bees (Bombus impatiens) are marked by stereotypical
behaviors and are unchanged by acclimation, age, or feeding status.
K. Jeannet Oyen* & Michael E. Dillon
Department of Zoology and Physiology & Program in Ecology, University of Wyoming,
Laramie, WY, 82071 USA
*Address for correspondence:
Dept. Zoology and Physiology, University of Wyoming
1000 East University Avenue - Dept 3166, Laramie, WY 82071 USA
Email: [email protected]
Jour
nal o
f Exp
erim
enta
l Bio
logy
• A
ccep
ted
man
uscr
ipt
http://jeb.biologists.org/lookup/doi/10.1242/jeb.165589Access the most recent version at First posted online on 12 March 2018 as 10.1242/jeb.165589
SUMMARY: Stereotypical behaviors at extreme temperatures correspond to loss of muscular
function and yield repeatable estimates of CTmin and CTmax for bumble bees.
ABSTRACT
Critical thermal limits often determine species distributions for diverse ectotherms and have
become a useful tool for understanding past and predicting future range shifts in response to
changing climates. Despite recently documented population declines and range shifts of bumble
bees (genus Bombus), the few measurements of thermal tolerance available for the group have
relied on disparate measurement approaches. We describe a novel stereotypical behavior expressed
by bumble bee individuals during entry into chill coma. This behavioral indicator of CTmin
occurred at ambient temperatures of 3-5 °C (~7-9 °C core temperatures) and was accompanied by
a pronounced CO2 pulse, indicative of loss of spiracle function. CTmax was indicated by the onset
of muscular spasms prior to entering an unresponsive state and occurred at ambient temperatures
of ~52-55 °C (42-44 °C core temperatures). Measurements of CTmin and CTmax were largely
unaffected by acclimation, age, or feeding status, but faster ramping rates significantly increased
CTmax and decreased CTmin. This high-throughput approach allows rapid measurement of critical
thermal limits for large numbers of bees, facilitating large-scale comparisons among bumble bee
populations and species – a key step in determining current and future effects of climate on these
critical pollinators.
KEYWORDS: thermal tolerance, ramping rate, chill coma, metabolism, CTmin, CTmax
Jour
nal o
f Exp
erim
enta
l Bio
logy
• A
ccep
ted
man
uscr
ipt
INTRODUCTION
At extreme cold and hot temperatures organisms lose neuromuscular function (Robertson et al.,
2017) making them unable to feed or escape from predators (Cowles and Bogert, 1944; Huey and
Kingsolver, 1989). The coldest and hottest temperatures at which organisms can maintain muscle
control (CTmin and CTmax, respectively) can therefore delineate climates where populations can
persist (Ayrinhac et al., 2004; Calosi et al., 2010; Overgaard et al., 2014) and vary predictably
across latitude and altitude for diverse ectotherms (Gaston and Chown, 1999; Addo-Bediako et al.,
2000; Sheldon and Tewksbury, 2014; Oyen et al., 2016). Further, thermal tolerance and its
plasticity are key traits for predicting distributions of diverse organisms in response to changing
climates (Ayrinhac et al., 2004; Kellermann et al., 2009; Rezende et al., 2011).
Shifts in elevational and latitudinal ranges have been recently documented for bumble bees across
Europe and North America (Kerr et al., 2015). Shifts to higher elevations and range compressions
among southern bumble bee species appear unrelated to changes in land or pesticide use, and are
unlikely to reflect shifts in resources, but strongly correlate with changes in climate (Kerr et al.,
2015). Differences among bumble bee populations and species in tolerance of temperature
extremes may in part underlie these recently observed responses to climate warming (Hamblin et
al., 2017). However, despite their ecological (Goulson et al., 2008) and economic (Morandin et
al., 2001; Velthuis and Doorn, 2006) importance and broad geographic distributions (Goulson,
2010), thermal tolerance of bumble bees (genus Bombus) has rarely been measured (but see Goller
and Esch, 1990; Owen et al., 2013; Martinet et al., 2015; Oyen et al., 2016; Hamblin et al., 2017),
a surprising gap given a long history of study of bumble bee thermal biology (Heinrich, 1975).
Bumble bees are heterothermic, capable of regulating body temperatures across a large range of
Jour
nal o
f Exp
erim
enta
l Bio
logy
• A
ccep
ted
man
uscr
ipt
ambient temperatures (Heinrich, 1976). Nevertheless, like other organisms, they lose physiological
function at extreme low and high temperatures. By directly measuring muscle potentials, Goller
and Esch (1990) found that three bumble bee species lost flight muscle activity (i.e., entered into
chill coma; MacMillan and Sinclair, 2011) when thorax temperatures were below ~7-8 ºC. More
recently, Oyen et al. (2016) used a righting response assay to measure CTmin and CTmax of three
bumble bee species. Both CTmin (~9-10 ºC) and CTmax (40-45 ºC) declined with altitude, suggesting
that alpine bumble bees are more tolerant of cold extremes and less tolerant of extreme heat. CTmax
of three urban bumble bee species was measured as the temperature (44-46 ºC) at which they lost
postural control, and was correlated with population responses to urban warming (Hamblin et al.,
2017).
These limited estimates of bumble bee thermal tolerance have been measured by different
approaches, potentially limiting their utility in broader-scale comparative work, which requires
standardized, repeatable methods (Terblanche et al., 2007; Sinclair et al., 2015). Although changes
in muscle potentials (Goller and Esch, 1990; Findsen et al., 2014; Andersen et al., 2015) and in
nervous system function (Anderson and Mutchmor, 1968; Bradfisch et al., 1982; Robertson, 2004;
Robertson et al., 2017) can provide direct physiological evidence of thermal limits, the difficulty
of these experimental approaches make them less attractive for large-scale comparative studies.
Conversely, the simplicity of measuring righting response (Fry, 1967) has led to its prodigious use
as a metric of thermal tolerance, but righting response may be affected by differences in motivation
(bees may choose not to right even when they are able to; Hazell and Bale, 2011), so it is unclear
if these behavioral differences represent physiological thresholds (Lutterschmidt and Hutchison,
1997a; Sinclair et al., 2015). Bumble bees may fail to right at non-stressful room temperatures
Jour
nal o
f Exp
erim
enta
l Bio
logy
• A
ccep
ted
man
uscr
ipt
and remain on their backs for minutes to hours, occasionally righting at much lower temperatures
(Oyen et al., 2016).
Additionally, thermal tolerance may vary in response to many intrinsic factors including nutritional
status, age, and previous temperature exposure. Cold tolerance depends strongly on maintenance
of ion homeostasis for chill-susceptible insects (Coello Alvarado et al., 2015; MacMillan et al.,
2015). Hemolymph ion balance can be altered by food intake (Shreve et al., 2007; Coleman et al.,
2015; Koštál et al., 2016), so cold tolerance can change in response to uptake of dietary salts and
sugars. For example, in Drosophila, increased dietary salts such as KCI and NaCI led to faster
recovery from chill coma (Yerushalmi et al., 2016), whereas increased dietary sugars reduced cold
tolerance (Colinet et al., 2013b). Whether dietary sugars alter thermal tolerance of bumble bees,
which feed primarily on floral nectar, is unknown.
Thermal tolerance can also vary with age (Bowler and Terblanche, 2008). Many studies have
shown thermal tolerance traits vary between and within life stages (Davison, 1969; Crill et al.,
1996; Bale et al., 1989; Nyamukondiwa and Terblanche, 2009; Chidawanyika et al., 2017).
Variation in thermal tolerance within life stages (e.g. larvae or adults) may be due to age-related
morphological and physiological reorganization or to senescence (Bowler, 1967; Bowler and
Hollingsworth, 1966; Bowler and Terblanche, 2008; Colinet et al., 2013a). High thermal tolerance
in pre-adult stages is often followed by marked declines in thermal tolerance after eclosion to the
adult stage (Bowler, 1967; Pappas et al., 2007; Colinet et al., 2013a). To our knowledge, thermal
tolerance of larval and pupal bumble bees has not been measured; for adult bumble bees, muscle
Jour
nal o
f Exp
erim
enta
l Bio
logy
• A
ccep
ted
man
uscr
ipt
physiology and metabolism can change markedly with age, (Skandalis et al., 2011) so bumble bees
may show age-related shifts in thermal tolerance.
Previous temperature exposure can also alter thermal tolerance in insects. Over short time scales,
differences in ramping rates often alter thermal tolerance (Overgaard et al., 2006; Terblanche et
al., 2007). For example, Drosophila up-regulate heat-shock protein (HSP) expression more at
slower ramping rates such that they can tolerate hotter temperatures (higher CTmax) and suffer less
cellular damage after heat exposure (Sørensen et al., 2013). Conversely, slower ramping rates may
allow core temperatures to more closely track external temperatures, potentially resulting in more
conservative estimates of thermal limits than suggested by faster ramping rates. Compared to other
insects, bumble bees are large heterotherms (Heinrich, 1976), and generally can maintain high
thoracic temperatures at ambient temperatures between ~ 9 and 30 °C (Heinrich, 1972). Therefore,
even at more extreme temperatures associated with CTmin and CTmax, thoracic temperatures may
be offset from ambient temperatures, potentially with a lag dependent on body size and ramping
rate (Gates, 1980).
The ability to quickly mount a physiological or biochemical response to stressful environmental
temperatures may facilitate persistence in changing climates (Somero, 2010). Therefore,
acclimation capacity is a potentially important factor not only for determining plasticity in thermal
tolerance traits but also persistence under current and future climate change (Stillman, 2003;
Gunderson et al., 2017). The mechanisms allowing insects to increase thermal tolerance in
response to stressful temperatures include changes in membrane composition (Overgaard et al.,
2008), upregulation of HSPs (Joplin et al., 1990; Colinet et al., 2010) and extensive changes in the
Jour
nal o
f Exp
erim
enta
l Bio
logy
• A
ccep
ted
man
uscr
ipt
transcriptome and metabolome (Teets et al., 2012). Little is known about the response of bumble
bee thermal tolerance to acclimation. Queen bumble bees show tissue-specific changes in HSPs
during diapause (Kim et al., 2008) and both queens and workers have increased survival at low
temperatures following a cold exposure (Owen et al., 2013). These limited lines of evidence
suggest that bumble bee critical thermal limits could also change in response to thermal history.
A better understanding of the potential role of thermal tolerance in past and future responses of
bumble bees to changing climates requires an easily implemented approach to measuring thermal
tolerance that is also clearly tied to organism physiology and knowledge of plasticity of thermal
tolerance over short time scales (Allen et al., 2016). Here, we validate a new high-throughput
method for measurement of CTmin and CTmax in bumble bees. We show that stereotypical behaviors
(previously undescribed in bumble bees) are tightly linked to a final release of CO2 due to loss of
spiracle control, clearly marking entry into chill coma (CTmin) (MacMillan et al., 2012; Lighton
and Turner, 2004; Sinclair et al., 2004) and likely indicative of loss of neuromuscular function
(Robertson and Money, 2012; Robertson et al., 2017). We further show that bumble bee CTmax is
indicated by the onset of muscular spasms and measurement of CTmax is not influenced by previous
measurement of CTmin. Using this high-throughput method, we find that estimates of CTmin and,
to a lesser extent, CTmax are generally consistent among individuals within a nest. Thermal limits
are largely unaffected by acclimation temperature, feeding status, age, or body mass, but are
influenced by temperature ramping rate.
Jour
nal o
f Exp
erim
enta
l Bio
logy
• A
ccep
ted
man
uscr
ipt
MATERIALS AND METHODS
Animal rearing
All experimental animals came from three commercially-reared B. impatiens colonies (Koppert
Biological Systems, Howell, MI, USA), which each contained ~250 female workers, the natal
queen, and a bag of proprietary sucrose solution. One colony was used for initial measurements of
critical thermal limits, for determining the effect of CTmin on CTmax, and also for respirometry and
core temperature measurements. A second colony was used for acclimation treatments, and a third
colony was used to determine the effects of ramping rate, age, and feeding status on critical thermal
limits. All colonies were kept in the lab at ~22 °C under a 12 h day/night cycle. Colonies were
provided with ~10 g of ground fresh-frozen pollen (Brushy Mountain Bee Farm, Moravian Falls,
NC, USA) every other day. Female workers were taken directly from colonies immediately prior
to experiments, except where otherwise noted.
Determination of CTmin and CTmax
After removing pollen loads, bees were weighed to the nearest mg (Acculab ALC 210.4, Sartorius,
NY, USA) and then placed in individual 2-dram clear glass vials (2 cm width x 5 cm height) with
acrylic lids and two ~2 mm air holes. The inside of vials was first coated with INSECT-a-SLIP
(BioQuip, Rancho Dominguez, CA, USA) to prevent bees from climbing the walls and then placed
in wells (16 total, 20 mm diameter, 3 mm deep) milled in a solid aluminum block. A slot within
each well housed a T-type thermocouple (30 gauge) in contact with both the aluminum well and
the sidewall of each vial. These “vial” temperatures were individually tracked using two TC-08
thermocouple data loggers (PICO Technology, Tyler, TX, USA). The aluminum block was
mounted on two thermoelectric plates (TEC1-12706, 40 x 40 cm, 12V, 92W, ΔT=63 °C), with the
Jour
nal o
f Exp
erim
enta
l Bio
logy
• A
ccep
ted
man
uscr
ipt
active side of the TEC and the block insulated from room air within a foam cooler (40 X 30 X 15
cm and 5 cm thick, rigid foam insulation). A K-type thermocouple mounted on the block as
described above measured vial and block temperatures used by a proportional integral derivative
controller (Auber Instruments, GA, USA) to regulate temperature.
For each experimental run, 16 bees were placed in individual vials on the block and held at 22 °C
for 10 minutes before vial temperature was ramped to -5 °C at a rate of ~0.25 °Cmin-1 (realized
ramping rates were within 0.02 °Cmin-1 across runs). As temperature decreased, bees were
continuously monitored for signs of curling (see supplemental video and results section for a full
description of CTmin behavior). Bees were immediately removed from the block following CTmin
and allowed to warm to room temperature (~20-22 °C) on the bench top at a rate of ~0.15 °Cmin-
1. After the aluminum block equilibrated with room temperature (~20 min), we immediately started
CTmax trials. Bees were returned to the block and held at 22 °C for 10 minutes followed by ramping
vial temperature to 65°C at a rate of 0.25±0.02 °Cmin-1. As temperatures rose, bees became
agitated, lost muscular coordination, and began to spasm, at which point CTmax was recorded (see
supplemental video and results section for full description of CTmax behavior).
Determination of bumble bee core thoracic temperatures
Tracking of vial temperatures allows for high-throughput measurement of bee responses to
ambient temperatures, facilitating characterization of ecologically-relevant thermal limits for
populations of bees (Table 1). However, both to confirm that core temperatures track vial
temperatures and to estimate core temperatures associated with CTmin and CTmax, we measured
core temperatures in a second set of ramping experiments. Fine 37-gauge thermocouple wire
Jour
nal o
f Exp
erim
enta
l Bio
logy
• A
ccep
ted
man
uscr
ipt
(Omega® Engineering, Stamford, CT, USA) was implanted at 3 mm depth (typical thorax depth
is ~7 mm) into a small hole near the midline of the thorax between the wing bases created with an
insect pin and subsequently sealed with beeswax (bees lived up to 2 weeks after the implant was
removed, suggesting limited long-term effects of the approach). Bees with implanted
thermocouples were placed in vials on the aluminum block (as described above) and cooled or
heated to CTmin or CTmax, respectively, at nominal rates of 0.1 ºCmin-1, 0.25 ºCmin-1, and 1 ºCmin-
1 (vial temperatures were simultaneously monitored as described above). Realized rates of heating
and cooling for both core thoracic and vial temperatures are reported in Table 2. For clarity, we
have used the labels 0.1, 0.25, and 1 ºCmin-1 throughout. Unless otherwise noted, we report vial
temperatures throughout the manuscript; however, the summary values in Table 2 allow estimation
of associated core temperatures.
Respirometry
We measured CO2 production of bumble bees during cold ramps using a flow-through
respirometry system with data acquisition software (ExpeData, Sable Systems International [SSI],
Las Vegas, NV). For each experimental run, a single bee was placed in a glass chamber (75 mm L
x 20 mm diameter, 5.3 mL volume) with aluminum end caps sealed with rubber O-rings. Dry,
CO2-free air was pumped at a flow rate of 100±2 mLmin-1 through the chamber containing the bee
as well through an identical but empty “baseline” chamber using regulated pumps (SS4, SSI). The
respirometry chambers rested on a temperature-controlled aluminum block, attached to a
thermoelectric cooler and controlled using a proportional integral derivative controller (see above)
to ramp at 0.25 °Cmin-1. A 36 gauge (~0.5 mm diameter, 2 mm long) T-type thermocouple inserted
through one end of the baseline chamber was attached to a digital thermocouple reader (Omega®
Jour
nal o
f Exp
erim
enta
l Bio
logy
• A
ccep
ted
man
uscr
ipt
HH23A, Stamford, Connecticut, USA), to monitor air temperature throughout experiments
(recorded approximately every 4 min or ~1 ºC, with intervening temperatures linearly
interpolated). A BL-2 baselining unit (SSI) controlled by the data acquisition software allowed for
automatic switching between the baseline and experimental (with bee) chambers. Excurrent air
was subsampled at a rate of 50 ± 3 mL/min (SS4, SSI) through a Licor LI-7000 (LI-COR®,
Lincoln, NE, USA) which measured CO2 (ppm) and water vapor pressure (kPa). The LI-7000 was
zeroed and spanned daily, using a column of magnesium perchlorate and ascarite and primary
standard 1020 ppm CO2, respectively. Both the BL-2 and LI-7000 were connected to a desktop
computer via a 16-bit data acquisition interface (SSI UI2, basic accuracy 0.03%). The temperature
profile during metabolic experiments mirrored the steps described above for CTmin: 22 ºC to -5 ºC
at 0.25 ºCmin-1. CO2 measurements continued for 10 min after observation of curling behavior to
verify the lack of subsequent CO2 pulses. A minimum of 60 seconds of baseline data at the
beginning and end of each experiment allowed for lag and drift correction of traces prior to
analyses.
Acclimation
To test for effects of acclimation on CTmin and CTmax, worker bees were removed from a single
nest and placed in separate feeding containers (19 cm x 14 cm x 9 cm, with 15 2 mm air holes) for
12 h at 4ºC, or 72 h at each of 15 and 32ºC. Pilot experiments demonstrated that bees were unable
to feed below 13ºC and therefore could not be held below this threshold for longer than 12h
(normal day-night cycle), and that bees held above 34ºC for any length of time suffered high
mortality. We therefore selected 15ºC as an intermediate cool temperature at which bees foraged
normally and could therefore be held for up to 72h without high mortality and 32ºC as the highest
Jour
nal o
f Exp
erim
enta
l Bio
logy
• A
ccep
ted
man
uscr
ipt
temperature at which bees survived and maintained normal feeding behaviors. The feeding
containers were placed in 1280-oz PowerChill Thermoelectric Cooler (Coleman Outdoor
Company, Golden CO, USA) modified with heat lamps and timed lights (12:12 LD). A K-type
thermocouple mounted within the cooler measured air temperatures used by a PID controller
(Auber Instruments, GA, USA) to regulate temperature. Air temperatures were verified using
HOBO® Pendant Loggers (Onset Computer Corporation, Pocasset, MA, USA). Bees were fed
nectar (50% sucrose/water solution) ad libitum (for those kept at 32 or 15ºC) or only once (for
those held for 12 h at 4ºC). Following acclimation, bees were weighed and then tested for CTmin
and CTmax as described above. To control for run effects and for direct comparison with acclimated
bees, eight additional bees were taken directly from the hive and tested with acclimated bees.
Temperature ramping rate
Because ramping rates may alter estimates of thermal limits (Terblanche et al., 2007), we
additionally measured critical thermal limits with temperatures ramped at nominal rates of 1ºC
min-1 and 0.1ºC min-1. Realized cooling rates were 0.90 ± 0.03ºC min-1 and 0.095 ± 0.004ºC min-
1 and realized heating rates were 0.99 ± 0.13ºC min-1 and 0.10 ± 0.01ºC min-1. For clarity, we have
used the labels 1ºC min-1 and 0.1ºC min-1 throughout.
Jour
nal o
f Exp
erim
enta
l Bio
logy
• A
ccep
ted
man
uscr
ipt
Age
To determine whether critical thermal limits change with age (bumble bee physiology can vary
with age; Skandalis et al., 2011), newly emerged individuals from a single nest (clearly indicated
by gray pile and curled wings) were marked with unique colors indicating emergence date. We
measured CTmin and CTmax for three, four, and seven day old bees to span the range of ages
included in previous experiments.
Feeding
Feeding status may affect critical thermal limits due to resource availability or mass differences.
We therefore measured CTmin and CTmax of bees removed from a single nest, placed in separate
containers and provided either water or nectar for five hours immediately following the 12 hour
night cycle. Pilot experiments revealed that bees did not survive the 4-5 h experiment if previously
deprived of nectar for more than five hours.
Analyses
We used ANOVA to compare thermal tolerance metrics among treatment groups with mass as a
covariate and post-hoc comparisons by Tukey’s HSD. We compared variance in thermal tolerance
using F tests. We used Pearson’s r to evaluate correlations between core and vial temperatures.
Unless otherwise noted means are reported with standard deviations.
Jour
nal o
f Exp
erim
enta
l Bio
logy
• A
ccep
ted
man
uscr
ipt
RESULTS
Measurements of CTmin and CTmax in bumble bees
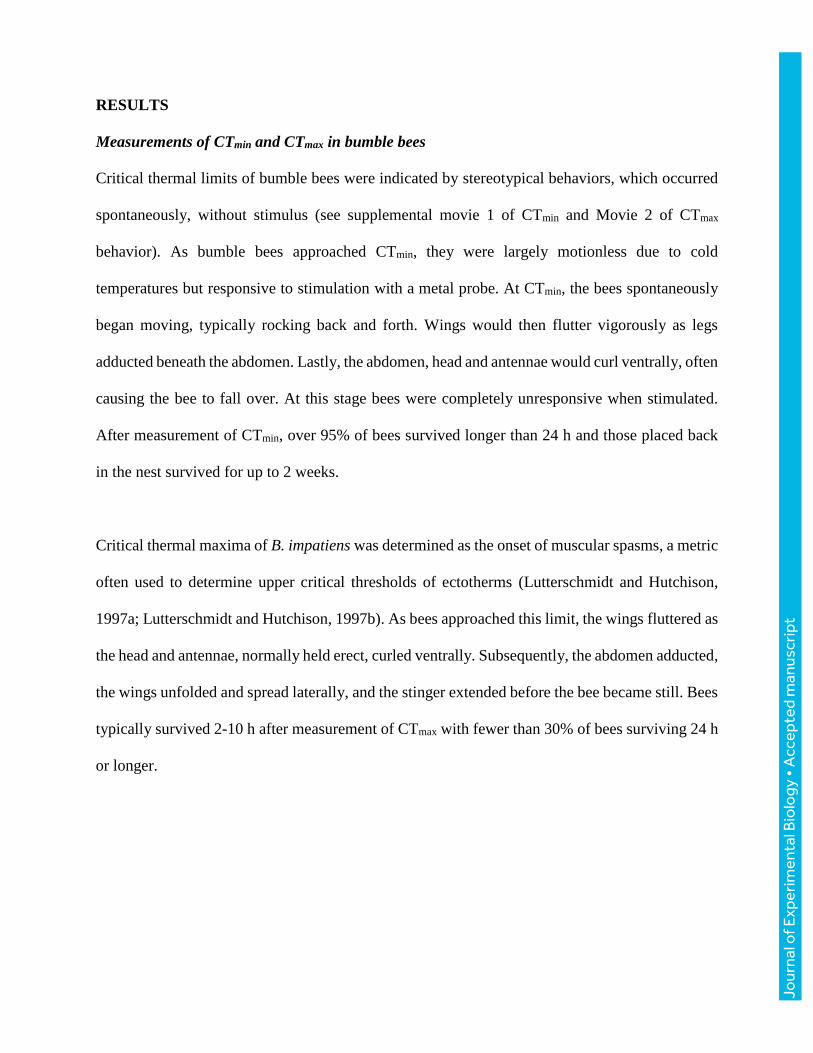
Critical thermal limits of bumble bees were indicated by stereotypical behaviors, which occurred
spontaneously, without stimulus (see supplemental movie 1 of CTmin and Movie 2 of CTmax
behavior). As bumble bees approached CTmin, they were largely motionless due to cold
temperatures but responsive to stimulation with a metal probe. At CTmin, the bees spontaneously
began moving, typically rocking back and forth. Wings would then flutter vigorously as legs
adducted beneath the abdomen. Lastly, the abdomen, head and antennae would curl ventrally, often
causing the bee to fall over. At this stage bees were completely unresponsive when stimulated.
After measurement of CTmin, over 95% of bees survived longer than 24 h and those placed back
in the nest survived for up to 2 weeks.
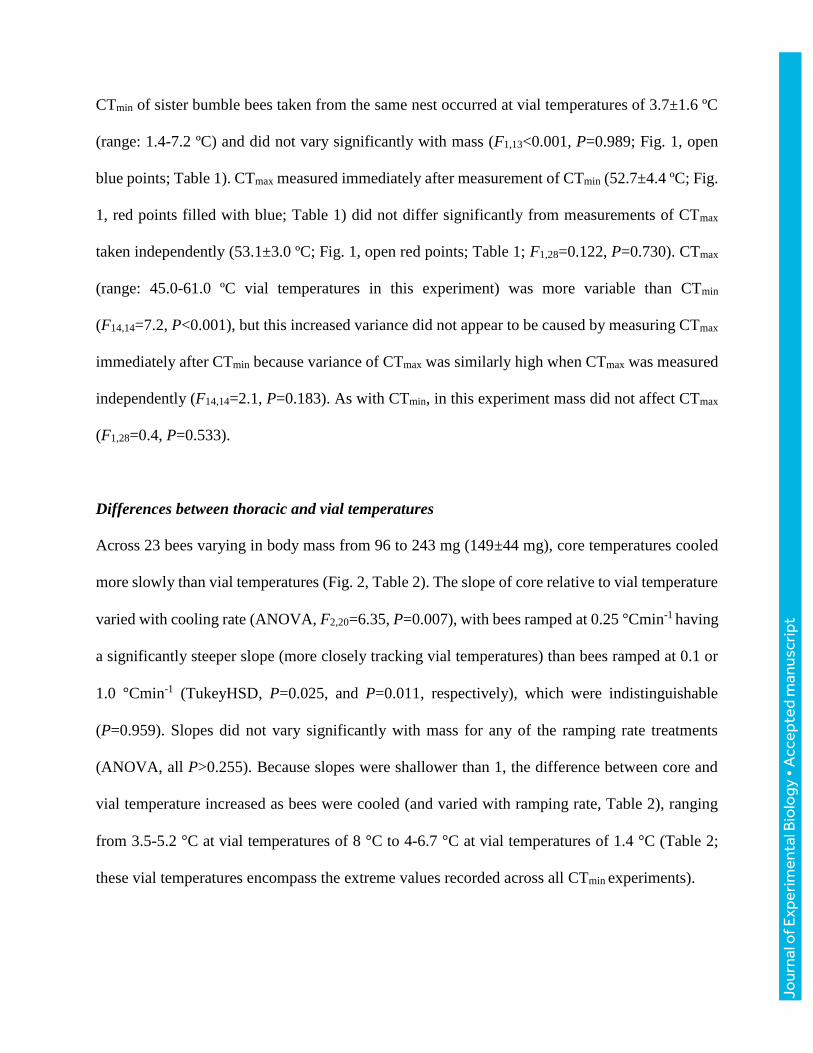
Critical thermal maxima of B. impatiens was determined as the onset of muscular spasms, a metric
often used to determine upper critical thresholds of ectotherms (Lutterschmidt and Hutchison,
1997a; Lutterschmidt and Hutchison, 1997b). As bees approached this limit, the wings fluttered as
the head and antennae, normally held erect, curled ventrally. Subsequently, the abdomen adducted,
the wings unfolded and spread laterally, and the stinger extended before the bee became still. Bees
typically survived 2-10 h after measurement of CTmax with fewer than 30% of bees surviving 24 h
or longer.
Jour
nal o
f Exp
erim
enta
l Bio
logy
• A
ccep
ted
man
uscr
ipt
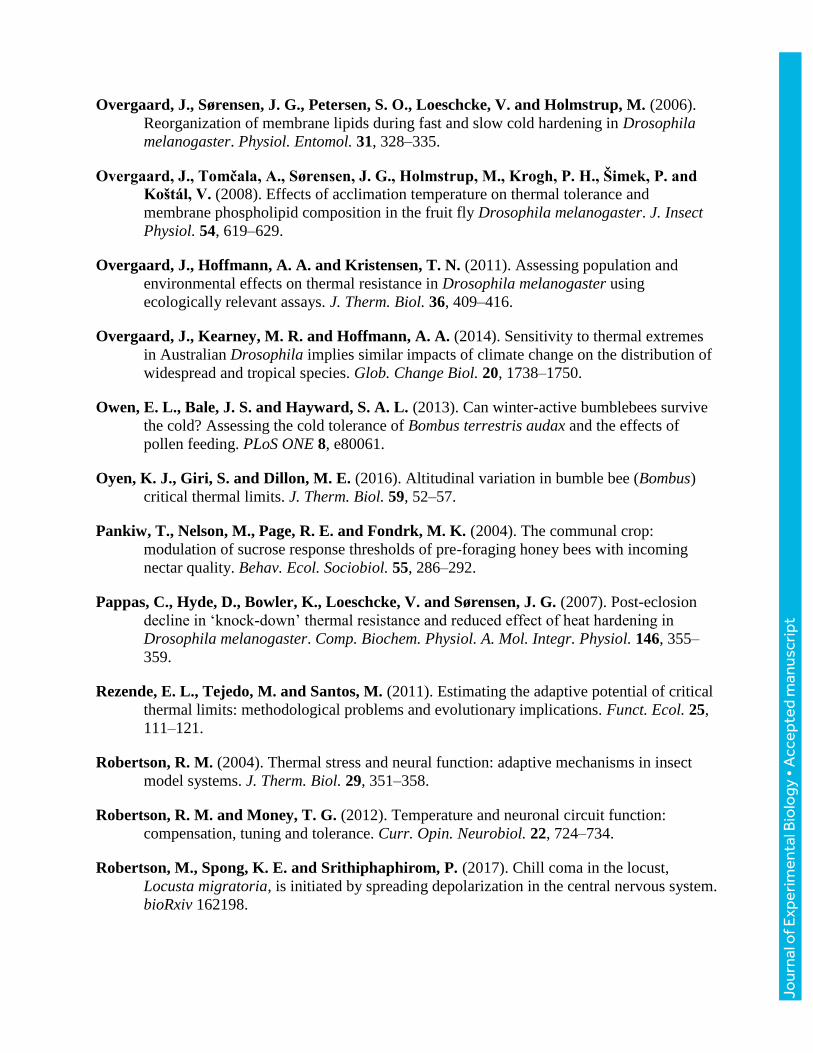
CTmin of sister bumble bees taken from the same nest occurred at vial temperatures of 3.7±1.6 ºC
(range: 1.4-7.2 ºC) and did not vary significantly with mass (F1,13<0.001, P=0.989; Fig. 1, open
blue points; Table 1). CTmax measured immediately after measurement of CTmin (52.7±4.4 ºC; Fig.
1, red points filled with blue; Table 1) did not differ significantly from measurements of CTmax
taken independently (53.1±3.0 ºC; Fig. 1, open red points; Table 1; F1,28=0.122, P=0.730). CTmax
(range: 45.0-61.0 ºC vial temperatures in this experiment) was more variable than CTmin
(F14,14=7.2, P<0.001), but this increased variance did not appear to be caused by measuring CTmax
immediately after CTmin because variance of CTmax was similarly high when CTmax was measured
independently (F14,14=2.1, P=0.183). As with CTmin, in this experiment mass did not affect CTmax
(F1,28=0.4, P=0.533).
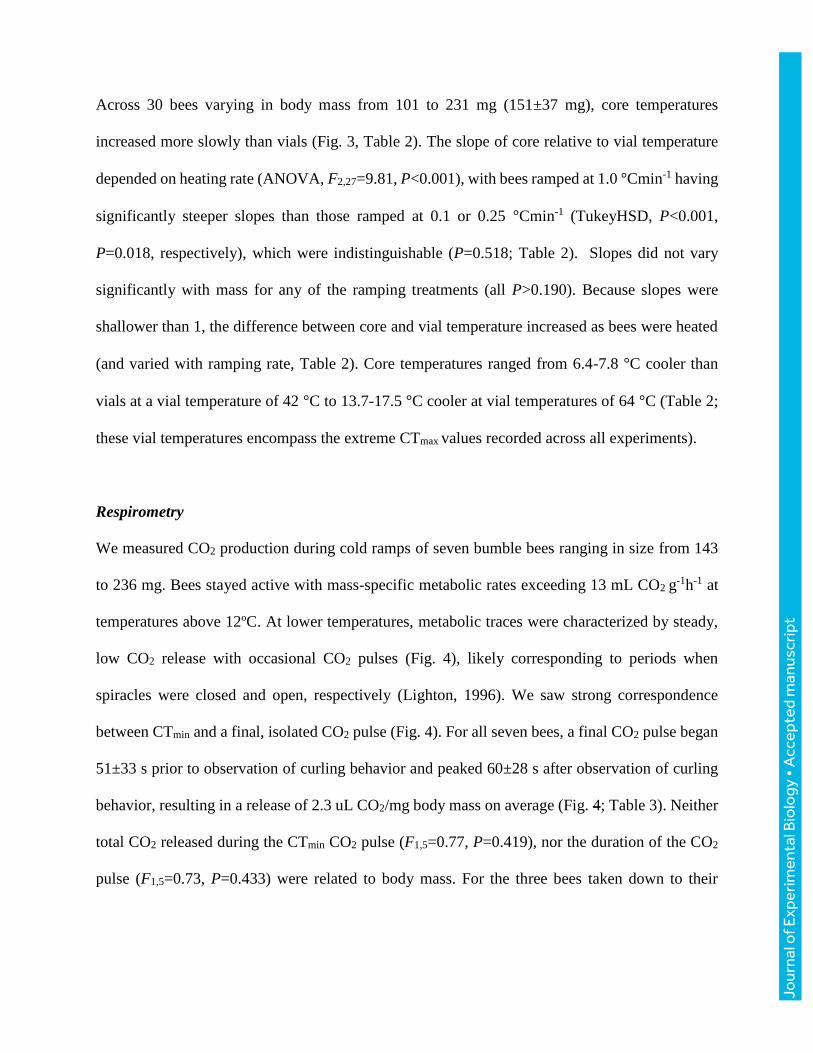
Differences between thoracic and vial temperatures
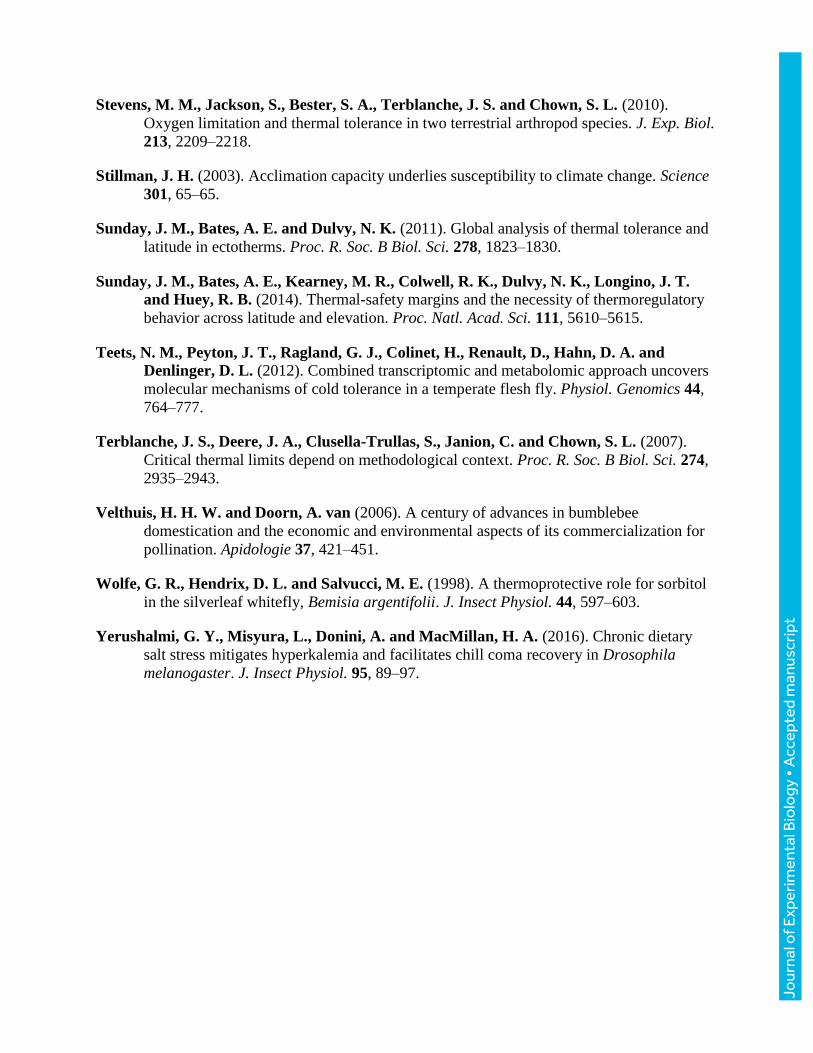
Across 23 bees varying in body mass from 96 to 243 mg (149±44 mg), core temperatures cooled
more slowly than vial temperatures (Fig. 2, Table 2). The slope of core relative to vial temperature
varied with cooling rate (ANOVA, F2,20=6.35, P=0.007), with bees ramped at 0.25 °Cmin-1 having
a significantly steeper slope (more closely tracking vial temperatures) than bees ramped at 0.1 or
1.0 °Cmin-1 (TukeyHSD, P=0.025, and P=0.011, respectively), which were indistinguishable
(P=0.959). Slopes did not vary significantly with mass for any of the ramping rate treatments
(ANOVA, all P>0.255). Because slopes were shallower than 1, the difference between core and
vial temperature increased as bees were cooled (and varied with ramping rate, Table 2), ranging
from 3.5-5.2 °C at vial temperatures of 8 °C to 4-6.7 °C at vial temperatures of 1.4 °C (Table 2;
these vial temperatures encompass the extreme values recorded across all CTmin experiments).
Jour
nal o
f Exp
erim
enta
l Bio
logy
• A
ccep
ted
man
uscr
ipt
Across 30 bees varying in body mass from 101 to 231 mg (151±37 mg), core temperatures
increased more slowly than vials (Fig. 3, Table 2). The slope of core relative to vial temperature
depended on heating rate (ANOVA, F2,27=9.81, P<0.001), with bees ramped at 1.0 °Cmin-1 having
significantly steeper slopes than those ramped at 0.1 or 0.25 °Cmin-1 (TukeyHSD, P<0.001,
P=0.018, respectively), which were indistinguishable (P=0.518; Table 2). Slopes did not vary
significantly with mass for any of the ramping treatments (all P>0.190). Because slopes were
shallower than 1, the difference between core and vial temperature increased as bees were heated
(and varied with ramping rate, Table 2). Core temperatures ranged from 6.4-7.8 °C cooler than
vials at a vial temperature of 42 °C to 13.7-17.5 °C cooler at vial temperatures of 64 °C (Table 2;
these vial temperatures encompass the extreme CTmax values recorded across all experiments).
Respirometry
We measured CO2 production during cold ramps of seven bumble bees ranging in size from 143
to 236 mg. Bees stayed active with mass-specific metabolic rates exceeding 13 mL CO2 g-1h-1 at
temperatures above 12ºC. At lower temperatures, metabolic traces were characterized by steady,
low CO2 release with occasional CO2 pulses (Fig. 4), likely corresponding to periods when
spiracles were closed and open, respectively (Lighton, 1996). We saw strong correspondence
between CTmin and a final, isolated CO2 pulse (Fig. 4). For all seven bees, a final CO2 pulse began
51±33 s prior to observation of curling behavior and peaked 60±28 s after observation of curling
behavior, resulting in a release of 2.3 uL CO2/mg body mass on average (Fig. 4; Table 3). Neither
total CO2 released during the CTmin CO2 pulse (F1,5=0.77, P=0.419), nor the duration of the CO2
pulse (F1,5=0.73, P=0.433) were related to body mass. For the three bees taken down to their
Jour
nal o
f Exp
erim
enta
l Bio
logy
• A
ccep
ted
man
uscr
ipt
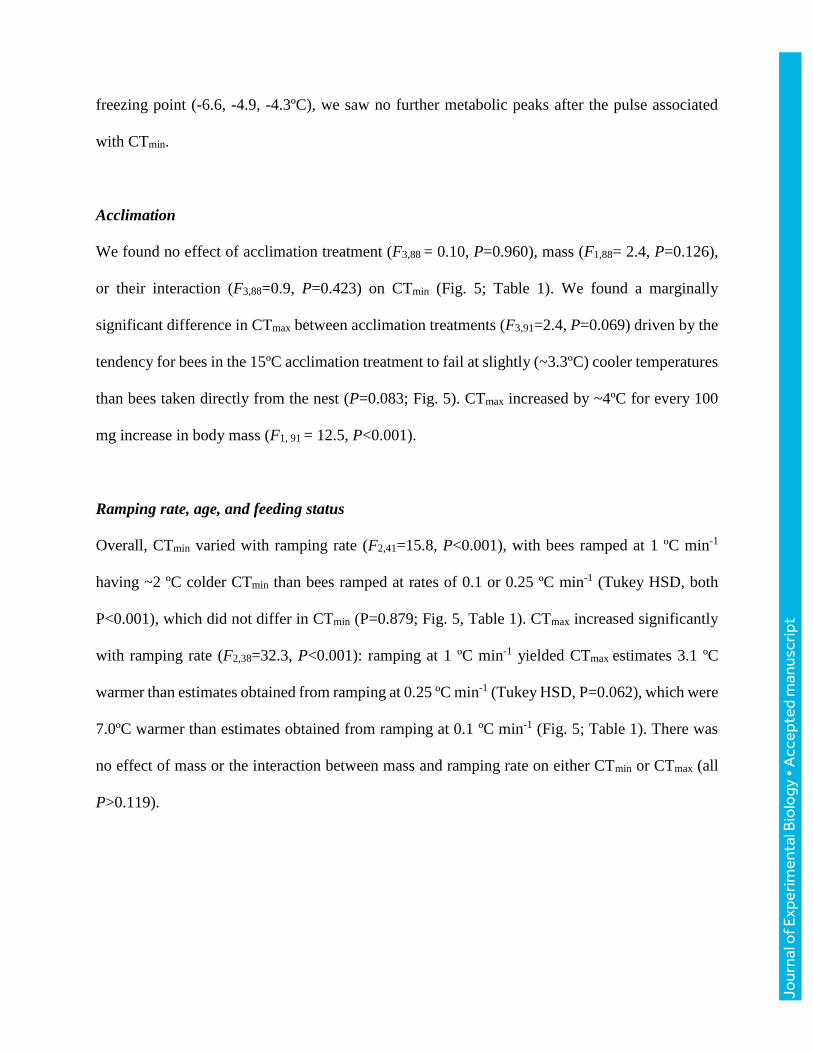
freezing point (-6.6, -4.9, -4.3ºC), we saw no further metabolic peaks after the pulse associated
with CTmin.
Acclimation
We found no effect of acclimation treatment (F3,88 = 0.10, P=0.960), mass (F1,88= 2.4, P=0.126),
or their interaction (F3,88=0.9, P=0.423) on CTmin (Fig. 5; Table 1). We found a marginally
significant difference in CTmax between acclimation treatments (F3,91=2.4, P=0.069) driven by the
tendency for bees in the 15ºC acclimation treatment to fail at slightly (~3.3ºC) cooler temperatures
than bees taken directly from the nest (P=0.083; Fig. 5). CTmax increased by ~4ºC for every 100
mg increase in body mass (F1, 91 = 12.5, P<0.001).
Ramping rate, age, and feeding status
Overall, CTmin varied with ramping rate (F2,41=15.8, P<0.001), with bees ramped at 1 ºC min-1
having ~2 ºC colder CTmin than bees ramped at rates of 0.1 or 0.25 ºC min-1 (Tukey HSD, both
P<0.001), which did not differ in CTmin (P=0.879; Fig. 5, Table 1). CTmax increased significantly
with ramping rate (F2,38=32.3, P<0.001): ramping at 1 ºC min-1 yielded CTmax estimates 3.1 ºC
warmer than estimates obtained from ramping at 0.25 ºC min-1 (Tukey HSD, P=0.062), which were
7.0ºC warmer than estimates obtained from ramping at 0.1 ºC min-1 (Fig. 5; Table 1). There was
no effect of mass or the interaction between mass and ramping rate on either CTmin or CTmax (all
P>0.119).
Jour
nal o
f Exp
erim
enta
l Bio
logy
• A
ccep
ted
man
uscr
ipt
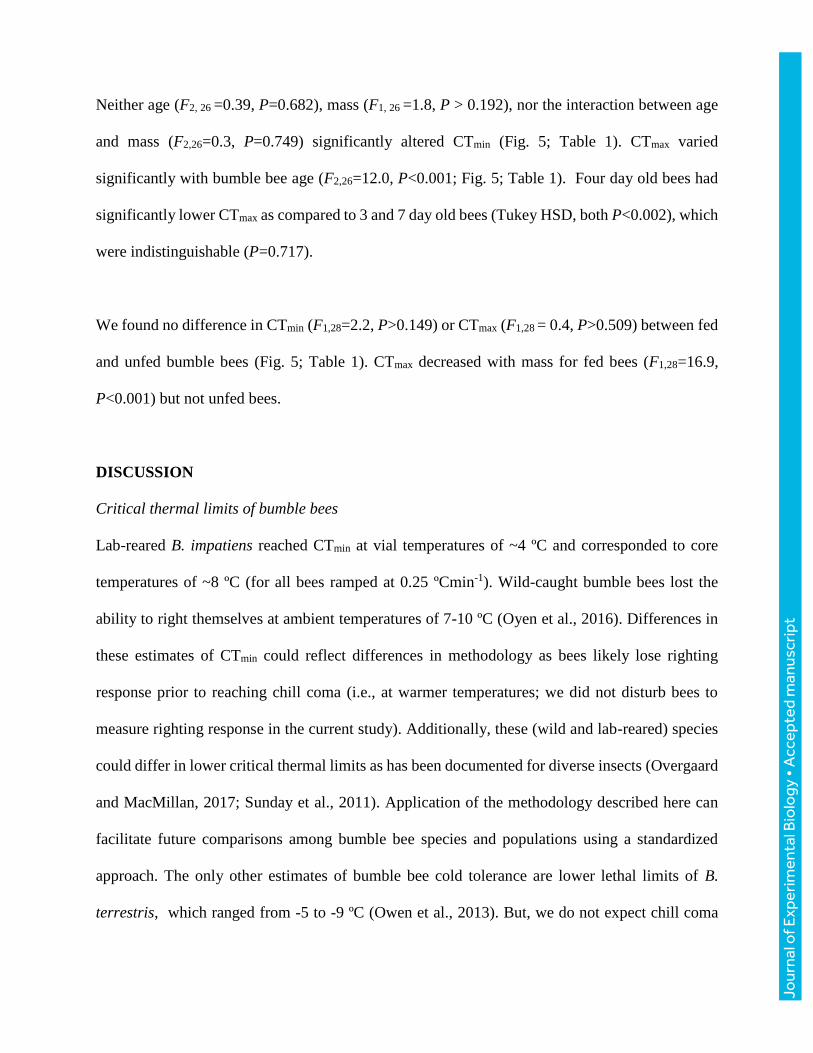
Neither age (F2, 26 =0.39, P=0.682), mass (F1, 26 =1.8, P > 0.192), nor the interaction between age
and mass (F2,26=0.3, P=0.749) significantly altered CTmin (Fig. 5; Table 1). CTmax varied
significantly with bumble bee age (F2,26=12.0, P<0.001; Fig. 5; Table 1). Four day old bees had
significantly lower CTmax as compared to 3 and 7 day old bees (Tukey HSD, both P<0.002), which
were indistinguishable (P=0.717).
We found no difference in CTmin (F1,28=2.2, P>0.149) or CTmax (F1,28 = 0.4, P>0.509) between fed
and unfed bumble bees (Fig. 5; Table 1). CTmax decreased with mass for fed bees (F1,28=16.9,
P<0.001) but not unfed bees.
DISCUSSION
Critical thermal limits of bumble bees
Lab-reared B. impatiens reached CTmin at vial temperatures of ~4 ºC and corresponded to core
temperatures of ~8 ºC (for all bees ramped at 0.25 ºCmin-1). Wild-caught bumble bees lost the
ability to right themselves at ambient temperatures of 7-10 ºC (Oyen et al., 2016). Differences in
these estimates of CTmin could reflect differences in methodology as bees likely lose righting
response prior to reaching chill coma (i.e., at warmer temperatures; we did not disturb bees to
measure righting response in the current study). Additionally, these (wild and lab-reared) species
could differ in lower critical thermal limits as has been documented for diverse insects (Overgaard
and MacMillan, 2017; Sunday et al., 2011). Application of the methodology described here can
facilitate future comparisons among bumble bee species and populations using a standardized
approach. The only other estimates of bumble bee cold tolerance are lower lethal limits of B.
terrestris, which ranged from -5 to -9 ºC (Owen et al., 2013). But, we do not expect chill coma
Jour
nal o
f Exp
erim
enta
l Bio
logy
• A
ccep
ted
man
uscr
ipt
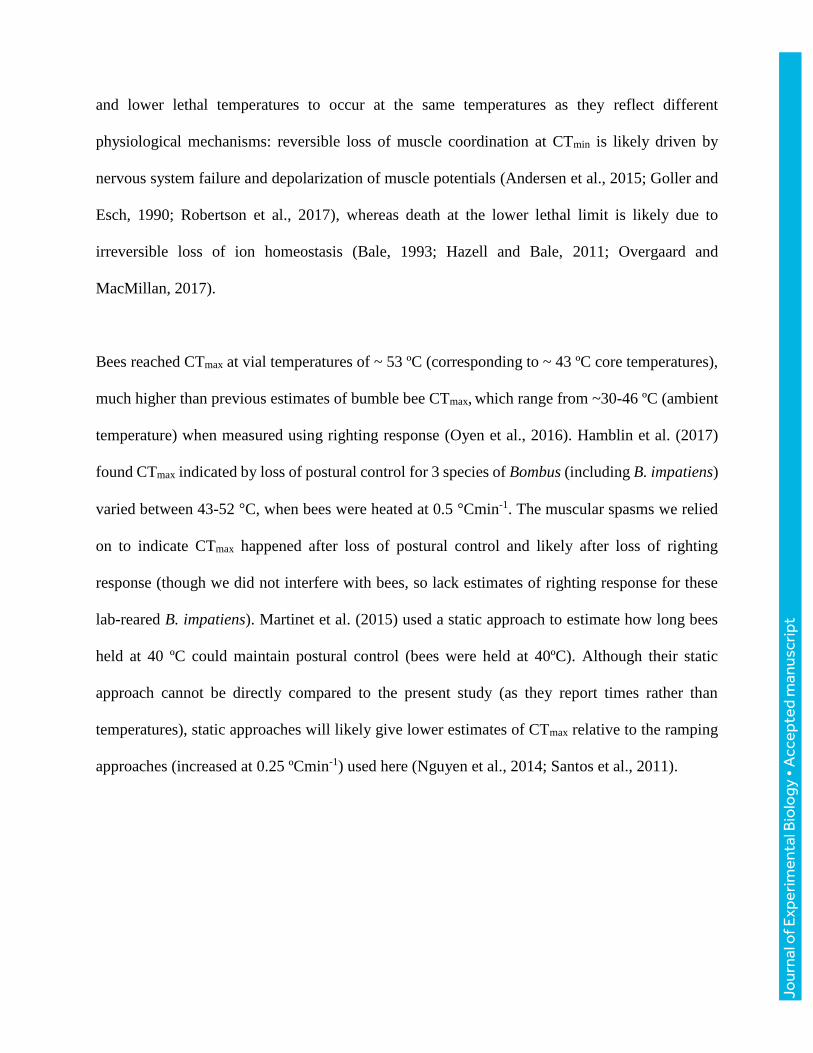
and lower lethal temperatures to occur at the same temperatures as they reflect different
physiological mechanisms: reversible loss of muscle coordination at CTmin is likely driven by
nervous system failure and depolarization of muscle potentials (Andersen et al., 2015; Goller and
Esch, 1990; Robertson et al., 2017), whereas death at the lower lethal limit is likely due to
irreversible loss of ion homeostasis (Bale, 1993; Hazell and Bale, 2011; Overgaard and
MacMillan, 2017).
Bees reached CTmax at vial temperatures of ~ 53 ºC (corresponding to ~ 43 ºC core temperatures),
much higher than previous estimates of bumble bee CTmax, which range from ~30-46 ºC (ambient
temperature) when measured using righting response (Oyen et al., 2016). Hamblin et al. (2017)
found CTmax indicated by loss of postural control for 3 species of Bombus (including B. impatiens)
varied between 43-52 °C, when bees were heated at 0.5 °Cmin-1. The muscular spasms we relied
on to indicate CTmax happened after loss of postural control and likely after loss of righting
response (though we did not interfere with bees, so lack estimates of righting response for these
lab-reared B. impatiens). Martinet et al. (2015) used a static approach to estimate how long bees
held at 40 ºC could maintain postural control (bees were held at 40ºC). Although their static
approach cannot be directly compared to the present study (as they report times rather than
temperatures), static approaches will likely give lower estimates of CTmax relative to the ramping
approaches (increased at 0.25 ºCmin-1) used here (Nguyen et al., 2014; Santos et al., 2011).
Jour
nal o
f Exp
erim
enta
l Bio
logy
• A
ccep
ted
man
uscr
ipt
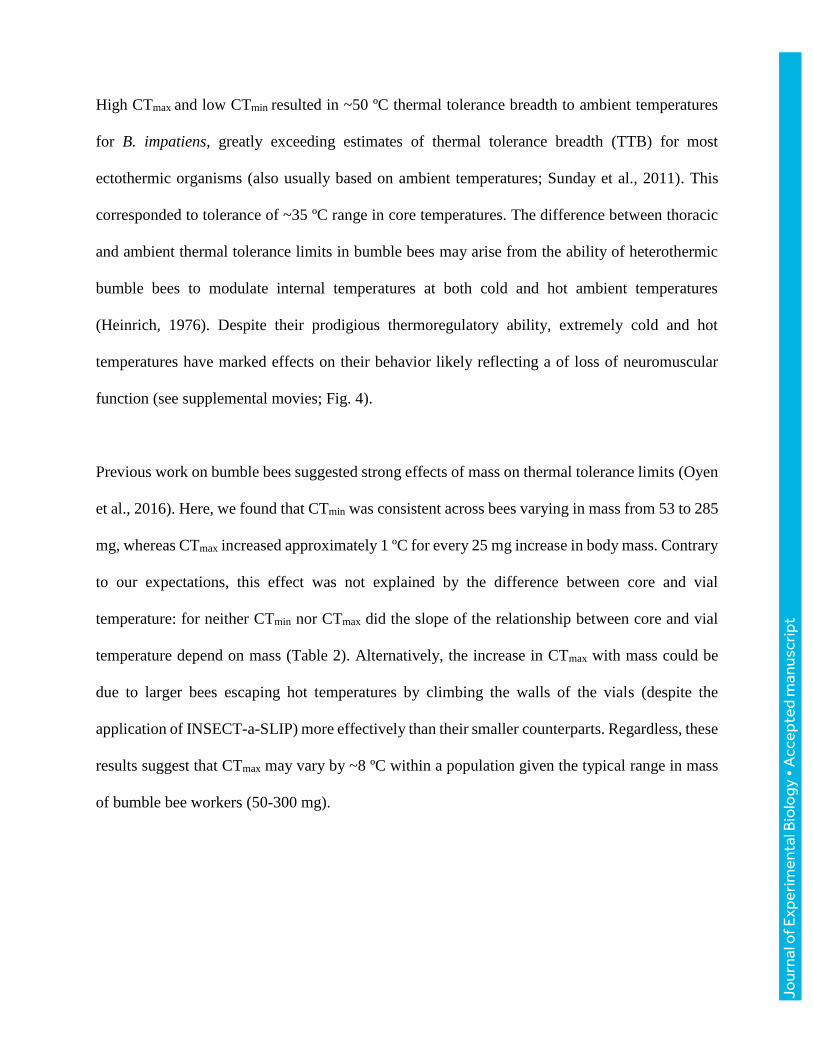
High CTmax and low CTmin resulted in ~50 ºC thermal tolerance breadth to ambient temperatures
for B. impatiens, greatly exceeding estimates of thermal tolerance breadth (TTB) for most
ectothermic organisms (also usually based on ambient temperatures; Sunday et al., 2011). This
corresponded to tolerance of ~35 ºC range in core temperatures. The difference between thoracic
and ambient thermal tolerance limits in bumble bees may arise from the ability of heterothermic
bumble bees to modulate internal temperatures at both cold and hot ambient temperatures
(Heinrich, 1976). Despite their prodigious thermoregulatory ability, extremely cold and hot
temperatures have marked effects on their behavior likely reflecting a of loss of neuromuscular
function (see supplemental movies; Fig. 4).
Previous work on bumble bees suggested strong effects of mass on thermal tolerance limits (Oyen
et al., 2016). Here, we found that CTmin was consistent across bees varying in mass from 53 to 285
mg, whereas CTmax increased approximately 1 ºC for every 25 mg increase in body mass. Contrary
to our expectations, this effect was not explained by the difference between core and vial
temperature: for neither CTmin nor CTmax did the slope of the relationship between core and vial
temperature depend on mass (Table 2). Alternatively, the increase in CTmax with mass could be
due to larger bees escaping hot temperatures by climbing the walls of the vials (despite the
application of INSECT-a-SLIP) more effectively than their smaller counterparts. Regardless, these
results suggest that CTmax may vary by ~8 ºC within a population given the typical range in mass
of bumble bee workers (50-300 mg).
Jour
nal o
f Exp
erim
enta
l Bio
logy
• A
ccep
ted
man
uscr
ipt
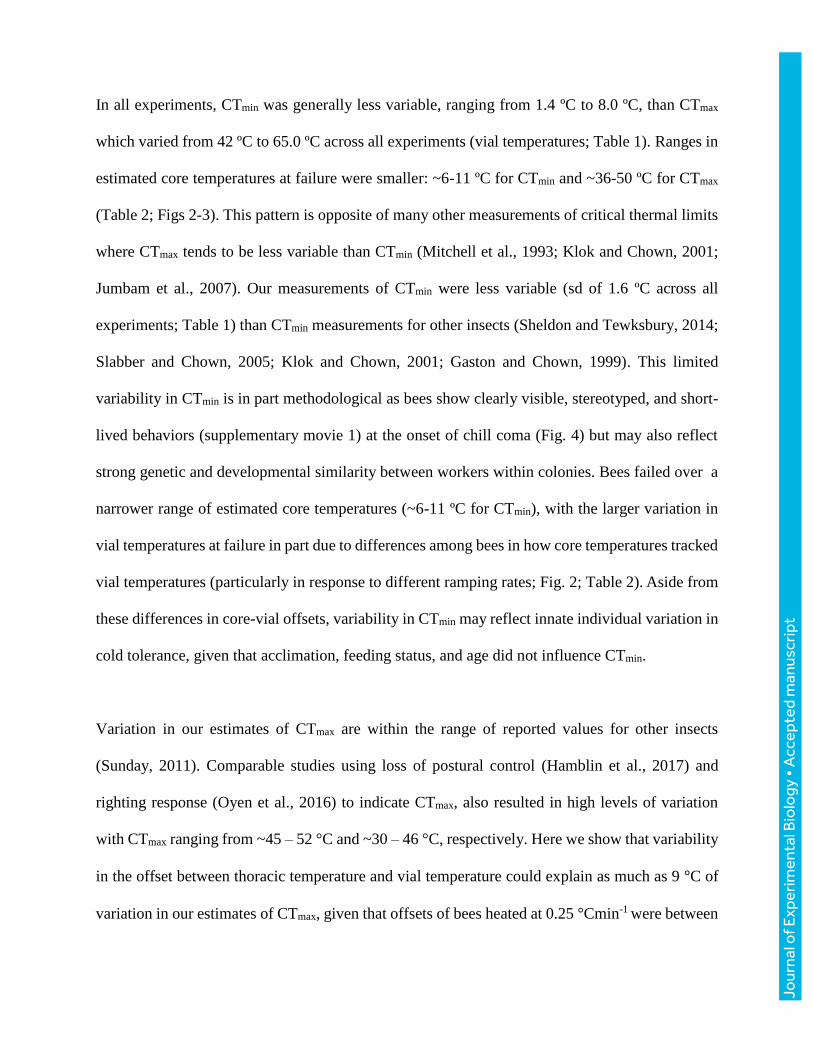
In all experiments, CTmin was generally less variable, ranging from 1.4 ºC to 8.0 ºC, than CTmax
which varied from 42 ºC to 65.0 ºC across all experiments (vial temperatures; Table 1). Ranges in
estimated core temperatures at failure were smaller: ~6-11 ºC for CTmin and ~36-50 ºC for CTmax
(Table 2; Figs 2-3). This pattern is opposite of many other measurements of critical thermal limits
where CTmax tends to be less variable than CTmin (Mitchell et al., 1993; Klok and Chown, 2001;
Jumbam et al., 2007). Our measurements of CTmin were less variable (sd of 1.6 ºC across all
experiments; Table 1) than CTmin measurements for other insects (Sheldon and Tewksbury, 2014;
Slabber and Chown, 2005; Klok and Chown, 2001; Gaston and Chown, 1999). This limited
variability in CTmin is in part methodological as bees show clearly visible, stereotyped, and short-
lived behaviors (supplementary movie 1) at the onset of chill coma (Fig. 4) but may also reflect
strong genetic and developmental similarity between workers within colonies. Bees failed over a
narrower range of estimated core temperatures (~6-11 ºC for CTmin), with the larger variation in
vial temperatures at failure in part due to differences among bees in how core temperatures tracked
vial temperatures (particularly in response to different ramping rates; Fig. 2; Table 2). Aside from
these differences in core-vial offsets, variability in CTmin may reflect innate individual variation in
cold tolerance, given that acclimation, feeding status, and age did not influence CTmin.
Variation in our estimates of CTmax are within the range of reported values for other insects
(Sunday, 2011). Comparable studies using loss of postural control (Hamblin et al., 2017) and
righting response (Oyen et al., 2016) to indicate CTmax, also resulted in high levels of variation
with CTmax ranging from ~45 – 52 °C and ~30 – 46 °C, respectively. Here we show that variability
in the offset between thoracic temperature and vial temperature could explain as much as 9 °C of
variation in our estimates of CTmax, given that offsets of bees heated at 0.25 °Cmin-1 were between
Jour
nal o
f Exp
erim
enta
l Bio
logy
• A
ccep
ted
man
uscr
ipt
6 and 15 °C. Higher variability in CTmax may also reflect the length of the behavior (onset of
muscular spasms, which may last for minutes) and the difficulty distinguishing the onset of muscle
spasms from the erratic behavior of bumble bees in hot temperatures.
Respirometry
Metabolic traces of all measured individuals followed a similar pattern with high levels of CO2
output above 12ºC followed by lower overall CO2 production, which typically corresponded to
lower activity levels. Differences among individuals in the duration and total CO2 released during
the CTmin CO2 pulse were not related to body mass but might reflect time elapsed since the previous
CO2 pulse. The clear behavioral indication of CTmin (see supplemental movie 1) always
corresponded to a final pulse and subsequent decrease in CO2 release, matching similar patterns in
CO2 production observed in other insects as they enter chill coma (Sinclair et al., 2004; Stevens et
al., 2010; MacMillan et al., 2012). The CO2 pulse likely indicates a loss of muscular control at
CTmin and resulting inability to close spiracles, leading to an efflux of CO2 without subsequent
periodic pulses (Goller and Esch, 1990; Hosler et al., 2000). Relaxation of spiracles typically, but
not always, results in opening rather than closing (Chapman, 1998) and therefore may lead to a
slow release of CO2 after muscular failure (Stevens et al., 2010). Because this pattern is consistent
among diverse insect taxa, it likely represents a complete loss of neuromuscular control induced
by low temperature (Overgaard and MacMillan, 2017; Robertson et al., 2017). The loss of muscle
control following CTmin could represent a localized failure at the muscular level, systemic failure
within the central nervous system, or both (Overgaard and MacMillan, 2017). Because this
physiological threshold is marked by clear behavior, bumble bees provide a compelling system for
studying the mechanisms underlying effects of extreme temperatures on insects.
Jour
nal o
f Exp
erim
enta
l Bio
logy
• A
ccep
ted
man
uscr
ipt
Acclimation
Acclimation responses in critical thermal limits have been documented in many insects (Fields et
al., 1998; Overgaard et al., 2008; Chidawanyika and Terblanche, 2011) and may represent a key
physiological mechanism allowing species to cope with environmental change (Overgaard et al.,
2011; Seebacher et al., 2015; but see Gunderson et al., 2017). However, we found little evidence
for effects of temperature acclimation on either CTmin or CTmax of B. impatiens. Ants show a
similarly weak response of thermal limits to acclimation, with more pronounced effects of
acclimation on CTmax than on CTmin (Jumbam et al., 2008). Few data are available for acclimation
capacity in bees, but rapid cold hardening, a form of plasticity likely driven by upregulation of
molecular chaperones and changes in cell membrane structure, has been documented in B.
terrestris (Owen et al., 2013). Although rapid cold hardening, the heat shock response, and
acclimation are potentially physiologically distinct responses (Bowler, 2005; Sinclair and Roberts,
2005), the minimal response of CTmin and CTmax to acclimation temperatures reported here
suggests that adult bumble bees must behaviorally compensate for environmental heat waves or
cold snaps.
Ramping rate
Ramping rates may alter estimates of critical thermal limits by increasing or decreasing the lag
between environmental temperature and organism core temperature equilibration or by inducing
different physiological responses associated with the duration of exposure (Terblanche et al.,
2007). Bumble bees ramped at 1ºC min-1 had significantly (~2 °C) lower CTmin and (~10 °C) higher
CTmax (Fig. 5), suggesting that either the offset between core and vial temperatures was greater at
Jour
nal o
f Exp
erim
enta
l Bio
logy
• A
ccep
ted
man
uscr
ipt
faster ramping rates or that tolerance increased because duration of exposure to stressful
temperatures decreased. Given that thoracic temperatures of bumble bees cooled at 1.0 °Cmin-1
were not significantly different from those ramped at 0.1 °Cmin-1, the difference in CTmin, at faster
cooling rates may be driven by decreased exposure time to physiologically stressful temperatures
(Terblanche et al., 2007).
Bumble bees failed at thoracic temperatures between ~32 - 46 °C when heated at 0.25 °Cmin-1, or
0.1 °Cmin-1, but failed at thoracic temperatures between ~48 – 58 °C when heated at 1.0 °Cmin-1.
This increase in CTmax estimates at faster ramping rates was not due to larger offsets between core
and vial temperatures because the offset between thoracic and vial temperatures decreased at faster
ramping rates (Fig. 3; Table 2). Rather, faster ramping rates decreased the time bees are exposed
to physiologically stressful conditions, such that those ramped more quickly reach higher
temperatures before failure. Increased thoracic temperatures at faster heating rates may represent
a breakdown in thermoregulatory ability. Bumble bees actively shunt heat from the thorax to the
abdomen via blood flow to prevent overheating (Heinrich, 1976), but if temperatures rise too
quickly, they may not be able to effectively regulate body temperature via blood flow.
Critical thermal limits of cockroaches (Cocking, 1959) and fruit flies (Overgaard et al., 2006) also
shift dependent on ramping rate. Slower ramping rates may provide sufficient time for hardening,
a form of phenotypic plasticity (Hoffmann et al., 2003) which involves changes in cellular
membrane structure that protect cells from injury (Anneli Korhonen and Lagerspetz, 1996; Kelty
and Lee, 2001). Tsetse flies have lower CTmin and CTmax when ramped more slowly, possibly due
to rapid cold hardening prior to CTmin and increased duration of exposure to stressful hot
Jour
nal o
f Exp
erim
enta
l Bio
logy
• A
ccep
ted
man
uscr
ipt
temperatures near CTmax (Terblanche et al., 2007). Rapid cold hardening has been documented in
B. terrestris (Owen et al., 2013), but is unlikely to explain lower CTmin of B. impatiens at faster
ramping rates (Table 1, 2), because time for cold hardening is reduced. For the same reason,
elevated CTmax at fast ramping rates is unlikely to reflect upregulation of stress compounds, such
as heat shock proteins, or thermoprotective metabolites, e.g. sorbitol (Wolfe et al., 1998) or glucose
(Sformo et al., 2010). Broader thermal tolerance measures (higher CTmax and lower CTmin) at faster
ramping rates may instead reflect a shorter duration of exposure to stressful temperatures
(Terblanche et al., 2007).
Age and feeding
Age and feeding status can affect physiological and biochemical processes and therefore may alter
critical thermal limits. Several studies have shown variation in critical thermal limits with age
(Bowler and Hollingsworth, 1966; Bowler, 1967; Nyamukondiwa and Terblanche, 2009;
Chidawanyika et al., 2017). Age did not alter CTmin in B. impatiens, but CTmax was significantly
lower in 4 day old bees relative to either 3 or 7 day old bees. The reason for this pattern is an open
question. In fruit flies, CTmin decreased with age and CTmax increased with age up to 14 days old
(Nyamukondiwa and Terblanche, 2009). We found little variation in thermal tolerance of bumble
bees up to 7 days old (Table 1). However, bumble bees may sometimes live for more than 14 days
(Goulson, 2010) and whether these older bumble bees show shifts in thermal tolerance remains to
be tested.
Jour
nal o
f Exp
erim
enta
l Bio
logy
• A
ccep
ted
man
uscr
ipt
Maintenance of ion homeostasis at low temperatures likely underlies cold tolerance in many
organisms. Feeding can therefore alter lower thermal limits of through effects on hemolymph ion
concentrations. In both fruit flies and beetles feeding led to higher CTmax, perhaps by increasing
the overall biomass of the organism or by improving nutritional status (Nyamukondiwa and
Terblanche, 2009; Chidawanyika et al., 2017). In bumble bees, feeding had no effect on thermal
tolerance, but starvation longer than five hours led to high mortality at moderate temperatures
(between 26ºC and 31ºC), emphasizing the importance of constant feeding for these animals.
Bumble bee workers have only minimal glycogen stores as compared to bumble bee queens, which
can increase energy stores before overwintering (Röseler and Röseler, 1986). Although we saw no
effect of feeding versus starvation on thermal limits of bumble bees, wild bees may regularly
experience differences in nutritional quality of nectar (Nicolson and Thornburg, 2007), which
alters foraging activity (Pankiw et al., 2004) and influences physiological condition (Stabler et al.,
2015). Investigating the effects of differences in nutritional properties of nectar on thermal limits
of bees may therefore be a fruitful avenue for future research and reveal differences in thermal
tolerance traits related to bumble bee diet.
Acclimation, age, and feeding status had little influence on critical thermal limits of bees.
However, CTmin and CTmax varied significantly between nests, when all bees from a nest were
considered together, regardless of experimental treatment (F2,203=33.7, P<0.001). Bees for
experiments came from three distinct nests, with bees used in the acclimation experiments having
CTmin ~1ºC higher overall than bees used in the initial measurements of CTmin (TukeyHSD,
P=0.034), and ~1.7ºC higher than bees used in ramping rate, age, and feeding experiments
(TukeyHSD, P<0.001), with bees from the latter two nests indistinguishable in terms of CTmin
Jour
nal o
f Exp
erim
enta
l Bio
logy
• A
ccep
ted
man
uscr
ipt
(TukeyHSD, P=0.184). CTmax did not differ significantly among nests (F2,217=0.90, P=0.407).
These analyses group bees from different experimental treatments, so must be interpreted with
caution. However, they do suggest that thermal limits may differ between colonies, perhaps due to
genetic or maternal effects or to differences in developmental conditions; but we know little about
the history of the commercially-reared nests. Future work on among-colony differences in thermal
tolerance will be particularly revealing if the source of queens and developmental conditions of
the colonies are known.
Critical thermal limits of bumble bees described here are repeatable and largely unaffected by
acclimation, feeding status, or age and are clearly associated with physiological thresholds. This
strong link between an easily observable behavior and the underlying physiological limit makes
bumble bees a compelling system for studying the cellular mechanisms leading to loss of muscular
control at CTmin and CTmax. Furthermore, measurements of critical thermal limits of bumble bees
across populations and species may provide valuable insights relating to recent population declines
and range shifts (Grixti et al., 2009; Cameron et al., 2011; Kerr et al., 2015), as well as facilitating
mechanistic predictions (Kearney and Porter, 2009) of the effects of climate change on future
distributions of these vital pollinators.
Jour
nal o
f Exp
erim
enta
l Bio
logy
• A
ccep
ted
man
uscr
ipt
ACKNOWLEDGEMENTS
We thank Steve DeVries for extensive help with designing and building the equipment used in
these experiments.
COMPETING INTERESTS
The authors declare no competing or financial interests.
FUNDING
This work was funded by NSF-DEB 1457659 to M.E. Dillon.
Jour
nal o
f Exp
erim
enta
l Bio
logy
• A
ccep
ted
man
uscr
ipt
REFERENCES
Allen, J. L., Chown, S. L., Janion-Scheepers, C. and Clusella-Trullas, S. (2016). Interactions
between rates of temperature change and acclimation affect latitudinal patterns of
warming tolerance. Conserv. Physiol. 4,.
Andersen, J. L., MacMillan, H. A. and Overgaard, J. (2015). Muscle membrane potential and
insect chill coma. J. Exp. Biol. 218, 2492–2495.
Anderson, R. L. and Mutchmor, J. A. (1968). Temperature acclimation and its influence on
the electrical activity of the nervous system in three species of cockroaches. J. Insect
Physiol. 14, 243–251.
Anneli Korhonen, I. and Lagerspetz, K. Y. H. (1996). Heat shock response and thermal
acclimation in Asellus aquaticus. J. Therm. Biol. 21, 49–56.
Ayrinhac, A., Debat, V., Gibert, P., Kister, A.-G., Legout, H., Moreteau, B., Vergilino, R.
and David, J. R. (2004). Cold adaptation in geographical populations of Drosophila
melanogaster: phenotypic plasticity is more important than genetic variability. Funct.
Ecol. 18, 700–706.
Bale, J. S. (1993). Classes of insect cold hardiness. Funct. Ecol. 7, 751–753.
Bale, J. S., Hansen, T. N., Nishino, M. and Baust, J. G. (1989). Effect of cooling rate on the
survival of larvae, pupariation, and adult emergence of the gallfly Eurosta solidaginis.
Cryobiology 26, 285–289.
Bowler, K. (1967). Changes in temperature tolerance with adult age in Tenebrio molitor.
Entomol. Exp. Appl. 10, 16–22.
Bowler, K. (2005). Acclimation, heat shock and hardening. J. Therm. Biol. 30, 125–130.
Bowler, K. and Hollingsworth, M. J. (1966). A study of some aspects of the physiology of
ageing in Drosophila subobscura. Exp. Gerontol. 2, 1–8.
Bowler, K. and Terblanche, J. S. (2008). Insect thermal tolerance: what is the role of ontogeny,
ageing and senescence? Biol. Rev. 83, 339–355.
Bradfisch, G. A., Drewes, C. D. and Mutchmor, J. A. (1982). The effects of cooling on an
identified reflex pathway in the cockroach (periplaneta americana), in relation to chill-
coma. J. Exp. Biol. 96, 131–141.
Calosi, P., Bilton, D. T., Spicer, J. I., Votier, S. C. and Atfield, A. (2010). What determines a
species’ geographical range? Thermal biology and latitudinal range size relationships in
European diving beetles (Coleoptera: Dytiscidae). J. Anim. Ecol. 79, 194–204.
Jour
nal o
f Exp
erim
enta
l Bio
logy
• A
ccep
ted
man
uscr
ipt
Cameron, S. A., Lozier, J. D., Strange, J. P., Koch, J. B., Cordes, N., Solter, L. F. and
Griswold, T. L. (2011). Patterns of widespread decline in North American bumble bees.
Proc. Natl. Acad. Sci. 108, 662–667.
Chapman, R. F. (1998). The Insects: Structure and Function. Cambridge University Press.
Chidawanyika, F. and Terblanche, J. S. (2011). Costs and benefits of thermal acclimation for
codling moth, Cydia pomonella (Lepidoptera: Tortricidae): implications for pest control
and the sterile insect release programme. Evol. Appl. 4, 534–544.
Chidawanyika, F., Nyamukondiwa, C., Strathie, L. and Fischer, K. (2017). Effects of
thermal regimes, starvation and age on heat tolerance of the parthenium beetle
Zygogramma bicolorata (Coleoptera: Chrysomelidae) following dynamic and static
protocols. PLOS ONE 12, e0169371.
Cocking, A. W. (1959). The effects of high temperatures on roach (Rutilus rutilus). J. Exp. Biol.
36, 217–226.
Coello Alvarado, L. E., MacMillan, H. A. and Sinclair, B. J. (2015). Chill-tolerant Gryllus
crickets maintain ion balance at low temperatures. J. Insect Physiol. 77, 15–25.
Coleman, P. C., Bale, J. S. and Hayward, S. A. L. (2015). Meat feeding restricts rapid cold
hardening response and increases thermal activity thresholds of adult blow flies,
calliphora vicina (diptera: calliphoridae). PLOS ONE 10, e0131301.
Colinet, H., Lee, S. F. and Hoffmann, A. (2010). Temporal expression of heat shock genes
during cold stress and recovery from chill coma in adult Drosophila melanogaster. FEBS
J. 277, 174–185.
Colinet, H., Siaussat, D., Bozzolan, F. and Bowler, K. (2013a). Rapid decline of cold tolerance
at young age is associated with expression of stress genes in Drosophila melanogaster. J.
Exp. Biol. 216, 253–259.
Colinet, H., Larvor, V., Bical, R. and Renault, D. (2013b). Dietary sugars affect cold tolerance
of Drosophila melanogaster. Metabolomics 9, 608–622.
Cowles, R. B. and Bogert, C. M. (1944). A preliminary study of the thermal requirements of
desert reptiles. Bull. Am. Mus. Nat. Hist. 83, 265–296.
Crill, W. D., Huey, R. B. and Gilchrist, G. W. (1996). Within- and between-generation effects
of temperature on the morphology and physiology of drosophila melanogaster. Evolution
50, 1205–1218.
Davison, T. F. (1969). Changes in temperature tolerance during the life cycle of Calliphora
erythrocephala. J. Insect Physiol. 15, 977–988.
Fields, P. G., Fleurat-Lessard, F., Lavenseau, L., Febvay, G., Peypelut, L. and Bonnot, G. (1998). The effect of cold acclimation and deacclimation on cold tolerance, trehalose and
Jour
nal o
f Exp
erim
enta
l Bio
logy
• A
ccep
ted
man
uscr
ipt
free amino acid levels in Sitophilus granarius and Cryptolestes ferrugineus (Coleoptera).
J. Insect Physiol. 44, 955–965.
Findsen, A., Pedersen, T. H., Petersen, A. G., Nielsen, O. B. and Overgaard, J. (2014). Why
do insects enter and recover from chill coma? Low temperature and high extracellular
potassium compromise muscle function in Locusta migratoria. J. Exp. Biol. 217, 1297–
1306.
Fry, F. J. (1967). Responses of vertebrate poikilotherms to temperature. Thermobiology 375–
409.
Gaston, K. J. and Chown, S. L. (1999). Elevation and climatic tolerance: a test using dung
beetles. Oikos 86, 584–590.
Gates, D. M. (1980). Temperature and organisms. In Biophysical Ecology, pp. 527–569.
Springer, New York, NY.
Goller, F. and Esch, H. (1990). Comparative study of chill-coma temperatures and muscle
potentials in insect flight muscles. J. Exp. Biol. 150, 221–231.
Goulson, D. (2010). Bumblebees: behaviour, ecology, and conservation. Oxford University
Press, USA.
Goulson, D., Lye, G. C. and Darvill, B. (2008). Decline and conservation of bumble bees.
Annu. Rev. Entomol. 53, 191–208.
Grixti, J. C., Wong, L. T., Cameron, S. A. and Favret, C. (2009). Decline of bumble bees
(Bombus) in the North American Midwest. Biol. Conserv. 142, 75–84.
Gunderson, A. R., Dillon, M. E. and Stillman, J. H. (2017). Estimating the benefits of
plasticity in ectotherm heat tolerance under natural thermal variability. Funct. Ecol. 31,
1529–1539.
Hamblin, A. L., Youngsteadt, E., López-Uribe, M. M. and Frank, S. D. (2017). Physiological
thermal limits predict differential responses of bees to urban heat-island effects. Biol.
Lett. 13, 20170125.
Hazell, S. P. and Bale, J. S. (2011). Low temperature thresholds: Are chill coma and CTmin
synonymous? J. Insect Physiol. 57, 1085–1089.
Heinrich, B. (1972). Temperature regulation in the bumblebee bombus vagans: a field study.
Science 175, 185–187.
Heinrich, B. (1975). Thermoregulation in bumblebees ii. energetics of warm-up and free flight.
J. Comp. Physiol. 96, 155–166.
Heinrich, B. (1976). Heat exchange in relation to blood flow between thorax and abdomen in
bumblebees. J. Exp. Biol. 64, 561–585.
Jour
nal o
f Exp
erim
enta
l Bio
logy
• A
ccep
ted
man
uscr
ipt
Hoffmann, A. A., Sørensen, J. G. and Loeschcke, V. (2003). Adaptation of Drosophila to
temperature extremes: bringing together quantitative and molecular approaches. J.
Therm. Biol. 28, 175–216.
Hosler, J. S., Burns, J. E. and Esch, H. E. (2000). Flight muscle resting potential and species-
specific differences in chill-coma. J. Insect Physiol. 46, 621–627.
Huey, R. B. and Kingsolver, J. G. (1989). Evolution of thermal sensitivity of ectotherm
performance. Trends Ecol. Evol. 4, 131–135.
Joplin, K. H., Yocum, G. D. and Denlinger, D. L. (1990). Cold shock elicits expression of heat
shock proteins in the flesh fly, Sarcophaga crassipalpis. J. Insect Physiol. 36, 825–834.
Jumbam, K. R., Terblanche, J. S., Deere, J. A., Somers, M. J. and Chown, S. L. (2007).
Critical thermal limits and their responses to acclimation in two sub-Antarctic spiders:
Myro kerguelenensis and Prinerigone vagans. Polar Biol. 31, 215–220.
Jumbam, K. R., Jackson, S., Terblanche, J. S., McGeoch, M. A. and Chown, S. L. (2008).
Acclimation effects on critical and lethal thermal limits of workers of the Argentine ant,
Linepithema humile. J. Insect Physiol. 54, 1008–1014.
Kearney, M. and Porter, W. (2009). Mechanistic niche modelling: combining physiological
and spatial data to predict species’ ranges. Ecol. Lett. 12, 334–350.
Kellermann, V., Heerwaarden, B. van, Sgrò, C. M. and Hoffmann, A. A. (2009).
Fundamental evolutionary limits in ecological traits drive Drosophila species
distributions. Science 325, 1244–1246.
Kelty, J. D. and Lee, R. E. (2001). Rapid cold-hardening of Drosophila melanogaster (Diptera:
Drosophiladae) during ecologically based thermoperiodic cycles. J. Exp. Biol. 204, 1659–
1666.
Kerr, J. T., Pindar, A., Galpern, P., Packer, L., Potts, S. G., Roberts, S. M., Rasmont, P.,
Schweiger, O., Colla, S. R., Richardson, L. L., et al. (2015). Climate change impacts
on bumblebees converge across continents. Science 349, 177–180.
Kim, B.-G., Shim, J.-K., Kim, D.-W., Kwon, Y. J. and Lee, K.-Y. (2008). Tissue-specific
variation of heat shock protein gene expression in relation to diapause in the bumblebee
Bombus terrestris. Entomol. Res. 38, 10–16.
Klok, C. J. and Chown, S. L. (2001). Critical thermal limits, temperature tolerance and water
balance of a sub-Antarctic kelp fly, Paractora dreuxi (Diptera: Helcomyzidae). J. Insect
Physiol. 47, 95–109.
Koštál, V., Korbelová, J., Poupardin, R., Moos, M. and Šimek, P. (2016). Arginine and
proline applied as food additives stimulate high freeze tolerance in larvae of Drosophila
melanogaster. J. Exp. Biol. 219, 2358–2367.
Jour
nal o
f Exp
erim
enta
l Bio
logy
• A
ccep
ted
man
uscr
ipt
Lighton, J. R. B. (1996). Discontinuous gas exchange in insects. Annu. Rev. Entomol. 41, 309–
324.
Lighton, J. R. B. and Turner, R. J. (2004). Thermolimit respirometry: an objective assessment
of critical thermal maxima in two sympatric desert harvester ants, Pogonomyrmex
rugosus and P. californicus. J. Exp. Biol. 207, 1903–1913.
Lutterschmidt, W. I. and Hutchison, V. H. (1997a). The critical thermal maximum: history
and critique. Can. J. Zool. 75, 1561–1574.
Lutterschmidt, W. I. and Hutchison, V. H. (1997b). The critical thermal maximum: data to
support the onset of spasms as the definitive end point. Can. J. Zool. 75, 1553–1560.
MacMillan, H. A. and Sinclair, B. J. (2011). Mechanisms underlying insect chill-coma. J.
Insect Physiol. 57, 12–20.
MacMillan, H. A., Williams, C. M., Staples, J. F. and Sinclair, B. J. (2012). Metabolism and
energy supply below the critical thermal minimum of a chill-susceptible insect. J. Exp.
Biol. 215, 1366–1372.
MacMillan, H. A., Andersen, J. L., Davies, S. A. and Overgaard, J. (2015). The capacity to
maintain ion and water homeostasis underlies interspecific variation in Drosophila cold
tolerance. Sci. Rep. 5,.
Martinet, B., Lecocq, T., Smet, J. and Rasmont, P. (2015). A protocol to assess insect
resistance to heat waves, applied to bumblebees (Bombus Latreille, 1802). PLoS ONE 10,
e0118591.
Mitchell, J. D., Hewitt, P. H. and van der Linde, T. C. de K. (1993). Critical thermal limits
and temperature tolerance in the harvester termite Hodotermes mossambicus (Hagen). J.
Insect Physiol. 39, 523–528.
Morandin, L. A., Laverty, T. M. and Kevan, P. G. (2001). Effect of bumble bee
(hymenoptera: apidae) pollination intensity on the quality of greenhouse tomatoes. J.
Econ. Entomol. 94, 172–179.
Nguyen, C., Bahar, M. H., Baker, G. and Andrew, N. R. (2014). Thermal Tolerance Limits of
Diamondback Moth in Ramping and Plunging Assays. PLOS ONE 9, e87535.
Nicolson, S. W. and Thornburg, R. W. (2007). Nectar chemistry. In Nectaries and Nectar, pp.
215–264. Springer, Dordrecht.
Nyamukondiwa, C. and Terblanche, J. S. (2009). Thermal tolerance in adult Mediterranean
and Natal fruit flies (Ceratitis capitata and Ceratitis rosa): Effects of age, gender and
feeding status. J. Therm. Biol. 34, 406–414.
Overgaard, J. and MacMillan, H. A. (2017). The integrative physiology of insect chill
tolerance. Annu. Rev. Physiol. 79, 187–208.
Jour
nal o
f Exp
erim
enta
l Bio
logy
• A
ccep
ted
man
uscr
ipt
Overgaard, J., Sørensen, J. G., Petersen, S. O., Loeschcke, V. and Holmstrup, M. (2006).
Reorganization of membrane lipids during fast and slow cold hardening in Drosophila
melanogaster. Physiol. Entomol. 31, 328–335.
Overgaard, J., Tomčala, A., Sørensen, J. G., Holmstrup, M., Krogh, P. H., Šimek, P. and
Koštál, V. (2008). Effects of acclimation temperature on thermal tolerance and
membrane phospholipid composition in the fruit fly Drosophila melanogaster. J. Insect
Physiol. 54, 619–629.
Overgaard, J., Hoffmann, A. A. and Kristensen, T. N. (2011). Assessing population and
environmental effects on thermal resistance in Drosophila melanogaster using
ecologically relevant assays. J. Therm. Biol. 36, 409–416.
Overgaard, J., Kearney, M. R. and Hoffmann, A. A. (2014). Sensitivity to thermal extremes
in Australian Drosophila implies similar impacts of climate change on the distribution of
widespread and tropical species. Glob. Change Biol. 20, 1738–1750.
Owen, E. L., Bale, J. S. and Hayward, S. A. L. (2013). Can winter-active bumblebees survive
the cold? Assessing the cold tolerance of Bombus terrestris audax and the effects of
pollen feeding. PLoS ONE 8, e80061.
Oyen, K. J., Giri, S. and Dillon, M. E. (2016). Altitudinal variation in bumble bee (Bombus)
critical thermal limits. J. Therm. Biol. 59, 52–57.
Pankiw, T., Nelson, M., Page, R. E. and Fondrk, M. K. (2004). The communal crop:
modulation of sucrose response thresholds of pre-foraging honey bees with incoming
nectar quality. Behav. Ecol. Sociobiol. 55, 286–292.
Pappas, C., Hyde, D., Bowler, K., Loeschcke, V. and Sørensen, J. G. (2007). Post-eclosion
decline in ‘knock-down’ thermal resistance and reduced effect of heat hardening in
Drosophila melanogaster. Comp. Biochem. Physiol. A. Mol. Integr. Physiol. 146, 355–
359.
Rezende, E. L., Tejedo, M. and Santos, M. (2011). Estimating the adaptive potential of critical
thermal limits: methodological problems and evolutionary implications. Funct. Ecol. 25,
111–121.
Robertson, R. M. (2004). Thermal stress and neural function: adaptive mechanisms in insect
model systems. J. Therm. Biol. 29, 351–358.
Robertson, R. M. and Money, T. G. (2012). Temperature and neuronal circuit function:
compensation, tuning and tolerance. Curr. Opin. Neurobiol. 22, 724–734.
Robertson, M., Spong, K. E. and Srithiphaphirom, P. (2017). Chill coma in the locust,
Locusta migratoria, is initiated by spreading depolarization in the central nervous system.
bioRxiv 162198.
Jour
nal o
f Exp
erim
enta
l Bio
logy
• A
ccep
ted
man
uscr
ipt

Röseler, P.-F. and Röseler, I. (1986). Caste specific differences in fat body glycogen
metabolism of the bumblebee, Bombus terrestris. Insect Biochem. 16, 501–508.
Santos, M., Castañeda, L. E. and Rezende, E. L. (2011). Making sense of heat tolerance
estimates in ectotherms: lessons from Drosophila. Funct. Ecol. 25, 1169–1180.
Seebacher, F., White, C. R. and Franklin, C. E. (2015). Physiological plasticity increases
resilience of ectothermic animals to climate change. Nat. Clim. Change 5, 61–66.
Sformo, T., Walters, K., Jeannet, K., Wowk, B., Fahy, G. M., Barnes, B. M. and Duman, J.
G. (2010). Deep supercooling, vitrification and limited survival to –100°C in the Alaskan
beetle Cucujus clavipes puniceus (Coleoptera: Cucujidae) larvae. J. Exp. Biol. 213, 502–
509.
Sheldon, K. S. and Tewksbury, J. J. (2014). The impact of seasonality in temperature on
thermal tolerance and elevational range size. Ecology 95, 2134–2143.
Shreve, S. M., Yi, S.-X. and Lee, R. E. (2007). Increased dietary cholesterol enhances cold
tolerance in Drosophila melanogaster. Cryoletters 28, 33–37.
Sinclair, B. J. and Roberts, S. P. (2005). Acclimation, shock and hardening in the cold. J.
Therm. Biol. 30, 557–562.
Sinclair, B. J., Klok, C. J. and Chown, S. L. (2004). Metabolism of the sub-Antarctic
caterpillar Pringleophaga marioni during cooling, freezing and thawing. J. Exp. Biol.
207, 1287–1294.
Sinclair, B. J., Coello Alvarado, L. E. and Ferguson, L. V. (2015). An invitation to measure
insect cold tolerance: Methods, approaches, and workflow. J. Therm. Biol. 53, 180–197.
Skandalis, D. A., Roy, C. and Darveau, C.-A. (2011). Behavioural, morphological, and
metabolic maturation of newly emerged adult workers of the bumblebee, Bombus
impatiens. J. Insect Physiol. 57, 704–711.
Slabber, S. and Chown, S. L. (2005). Differential responses of thermal tolerance to acclimation
in the sub-Antarctic rove beetle Halmaeusa atriceps. Physiol. Entomol. 30, 195–204.
Somero, G. N. (2010). The physiology of climate change: how potentials for acclimatization and
genetic adaptation will determine ‘winners’ and ‘losers.’ J. Exp. Biol. 213, 912–920.
Sørensen, J. G., Loeschcke, V. and Kristensen, T. N. (2013). Cellular damage as induced by
high temperature is dependent on rate of temperature change – investigating
consequences of ramping rates on molecular and organismal phenotypes in Drosophila
melanogaster. J. Exp. Biol. 216, 809–814.
Stabler, D., Paoli, P. P., Nicolson, S. W. and Wright, G. A. (2015). Nutrient balancing of the
adult worker bumblebee (Bombus terrestris) depends on the dietary source of essential
amino acids. J. Exp. Biol. 218, 793–802.
Jour
nal o
f Exp
erim
enta
l Bio
logy
• A
ccep
ted
man
uscr
ipt
Stevens, M. M., Jackson, S., Bester, S. A., Terblanche, J. S. and Chown, S. L. (2010).
Oxygen limitation and thermal tolerance in two terrestrial arthropod species. J. Exp. Biol.
213, 2209–2218.
Stillman, J. H. (2003). Acclimation capacity underlies susceptibility to climate change. Science
301, 65–65.
Sunday, J. M., Bates, A. E. and Dulvy, N. K. (2011). Global analysis of thermal tolerance and
latitude in ectotherms. Proc. R. Soc. B Biol. Sci. 278, 1823–1830.
Sunday, J. M., Bates, A. E., Kearney, M. R., Colwell, R. K., Dulvy, N. K., Longino, J. T.
and Huey, R. B. (2014). Thermal-safety margins and the necessity of thermoregulatory
behavior across latitude and elevation. Proc. Natl. Acad. Sci. 111, 5610–5615.
Teets, N. M., Peyton, J. T., Ragland, G. J., Colinet, H., Renault, D., Hahn, D. A. and
Denlinger, D. L. (2012). Combined transcriptomic and metabolomic approach uncovers
molecular mechanisms of cold tolerance in a temperate flesh fly. Physiol. Genomics 44,
764–777.
Terblanche, J. S., Deere, J. A., Clusella-Trullas, S., Janion, C. and Chown, S. L. (2007).
Critical thermal limits depend on methodological context. Proc. R. Soc. B Biol. Sci. 274,
2935–2943.
Velthuis, H. H. W. and Doorn, A. van (2006). A century of advances in bumblebee
domestication and the economic and environmental aspects of its commercialization for
pollination. Apidologie 37, 421–451.
Wolfe, G. R., Hendrix, D. L. and Salvucci, M. E. (1998). A thermoprotective role for sorbitol
in the silverleaf whitefly, Bemisia argentifolii. J. Insect Physiol. 44, 597–603.
Yerushalmi, G. Y., Misyura, L., Donini, A. and MacMillan, H. A. (2016). Chronic dietary
salt stress mitigates hyperkalemia and facilitates chill coma recovery in Drosophila
melanogaster. J. Insect Physiol. 95, 89–97.
Jour
nal o
f Exp
erim
enta
l Bio
logy
• A
ccep
ted
man
uscr
ipt
Figures
Figure 1. Critical thermal limits of B. impatiens vary with body mass. CTmin (open blue
points) and CTmax of bumble bees with CTmax measured after CTmin (blue-filled red points) and
independently (open red points). There was no effect of CTmin on subsequent measurements of
CTmax (F1,28=0.4, P=0.533), and no effect of mass on CTmin or CTmax (F1,13<0.001, P=0.989). See
text for additional statistical analyses.
Jour
nal o
f Exp
erim
enta
l Bio
logy
• A
ccep
ted
man
uscr
ipt
Figure 2. Bumble bee core temperatures decrease linearly with vial temperatures during
cooling ramps. Thick lines indicate average response of core temperatures for 23 bees (thin
lines) held in vials ramped at 0.1, 0.25, and 1.0 °Cmin-1 (blue, purple, and red, respectively).
Gray shaded area indicates range of vial temperatures at which bees reached CTmin across all
experiments (see Table 1). Note that experiments proceed from right to left as vials were cooled.
Circles indicate offset values reported in Table 2. See text and Table 2 for statistical details.
Jour
nal o
f Exp
erim
enta
l Bio
logy
• A
ccep
ted
man
uscr
ipt
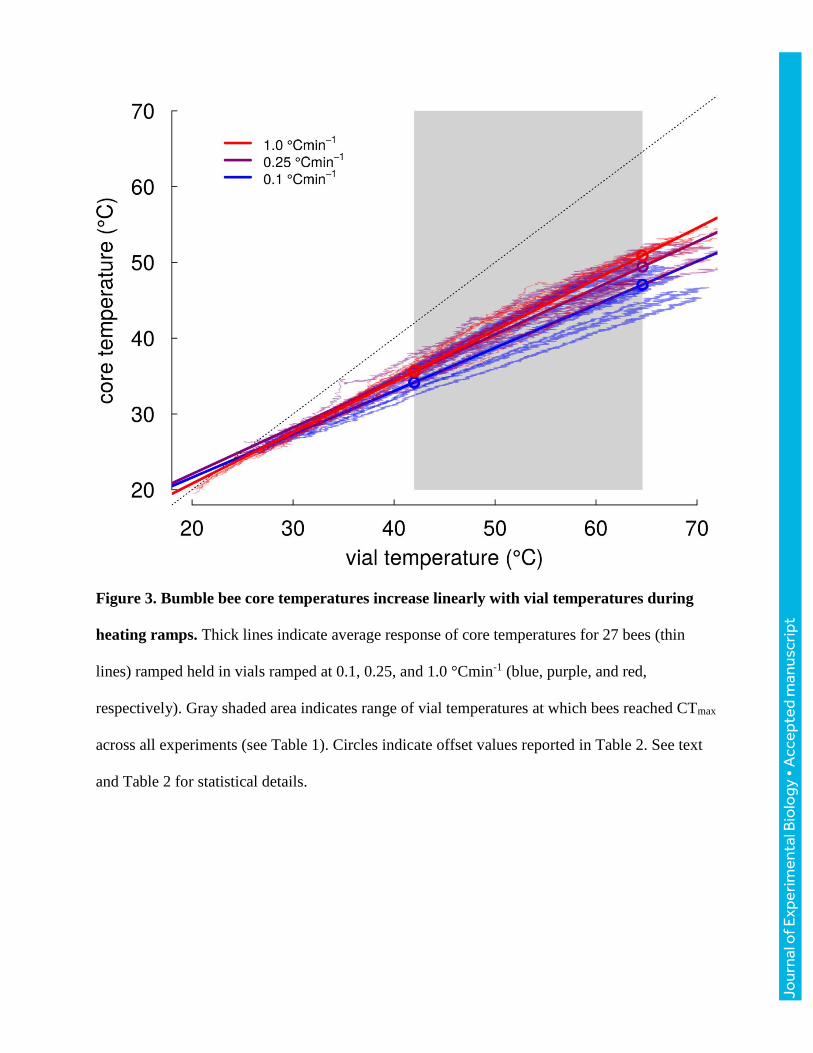
Figure 3. Bumble bee core temperatures increase linearly with vial temperatures during
heating ramps. Thick lines indicate average response of core temperatures for 27 bees (thin
lines) ramped held in vials ramped at 0.1, 0.25, and 1.0 °Cmin-1 (blue, purple, and red,
respectively). Gray shaded area indicates range of vial temperatures at which bees reached CTmax
across all experiments (see Table 1). Circles indicate offset values reported in Table 2. See text
and Table 2 for statistical details.
Jour
nal o
f Exp
erim
enta
l Bio
logy
• A
ccep
ted
man
uscr
ipt
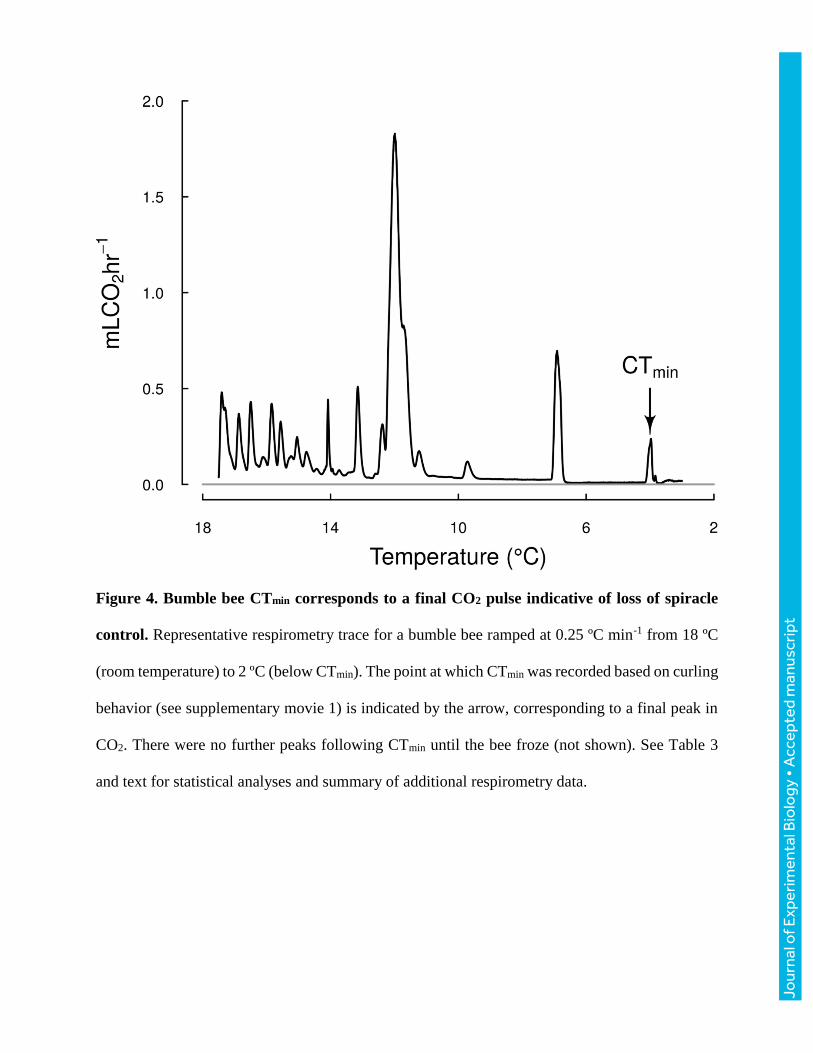
Figure 4. Bumble bee CTmin corresponds to a final CO2 pulse indicative of loss of spiracle
control. Representative respirometry trace for a bumble bee ramped at 0.25 ºC min-1 from 18 ºC
(room temperature) to 2 ºC (below CTmin). The point at which CTmin was recorded based on curling
behavior (see supplementary movie 1) is indicated by the arrow, corresponding to a final peak in
CO2. There were no further peaks following CTmin until the bee froze (not shown). See Table 3
and text for statistical analyses and summary of additional respirometry data.
Jour
nal o
f Exp
erim
enta
l Bio
logy
• A
ccep
ted
man
uscr
ipt
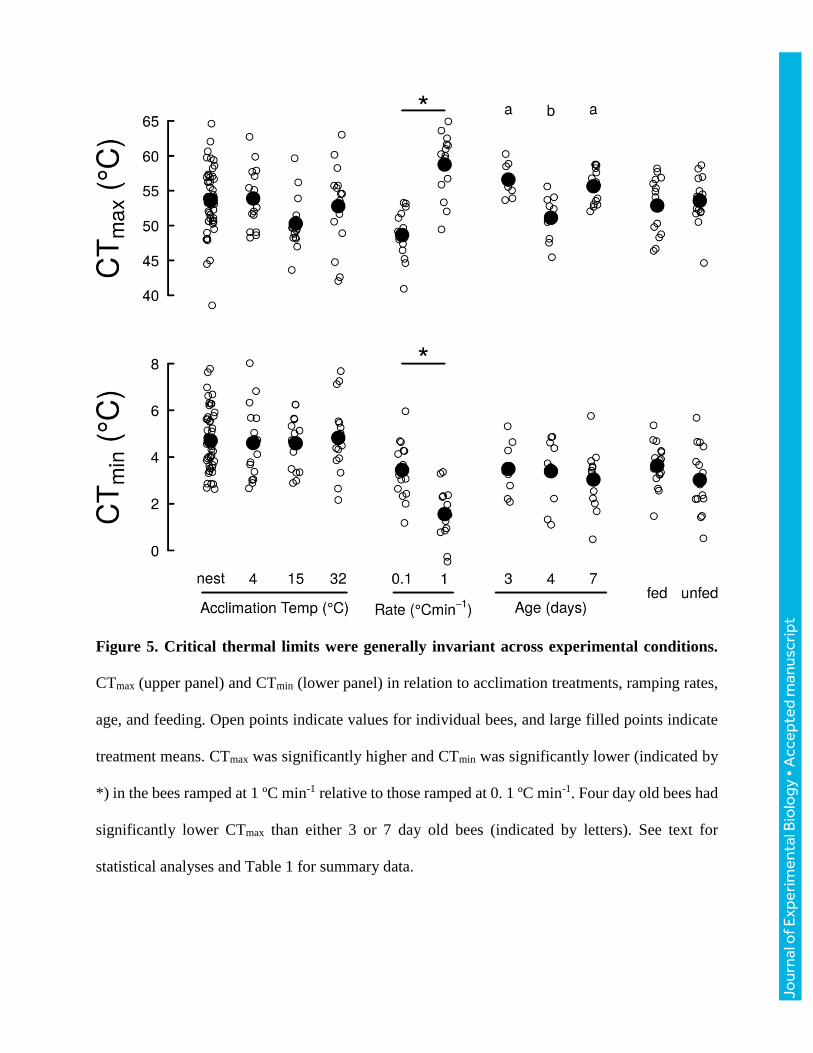
Figure 5. Critical thermal limits were generally invariant across experimental conditions.
CTmax (upper panel) and CTmin (lower panel) in relation to acclimation treatments, ramping rates,
age, and feeding. Open points indicate values for individual bees, and large filled points indicate
treatment means. CTmax was significantly higher and CTmin was significantly lower (indicated by
*) in the bees ramped at 1 ºC min-1 relative to those ramped at 0. 1 ºC min-1. Four day old bees had
significantly lower CTmax than either 3 or 7 day old bees (indicated by letters). See text for
statistical analyses and Table 1 for summary data.
Jour
nal o
f Exp
erim
enta
l Bio
logy
• A
ccep
ted
man
uscr
ipt
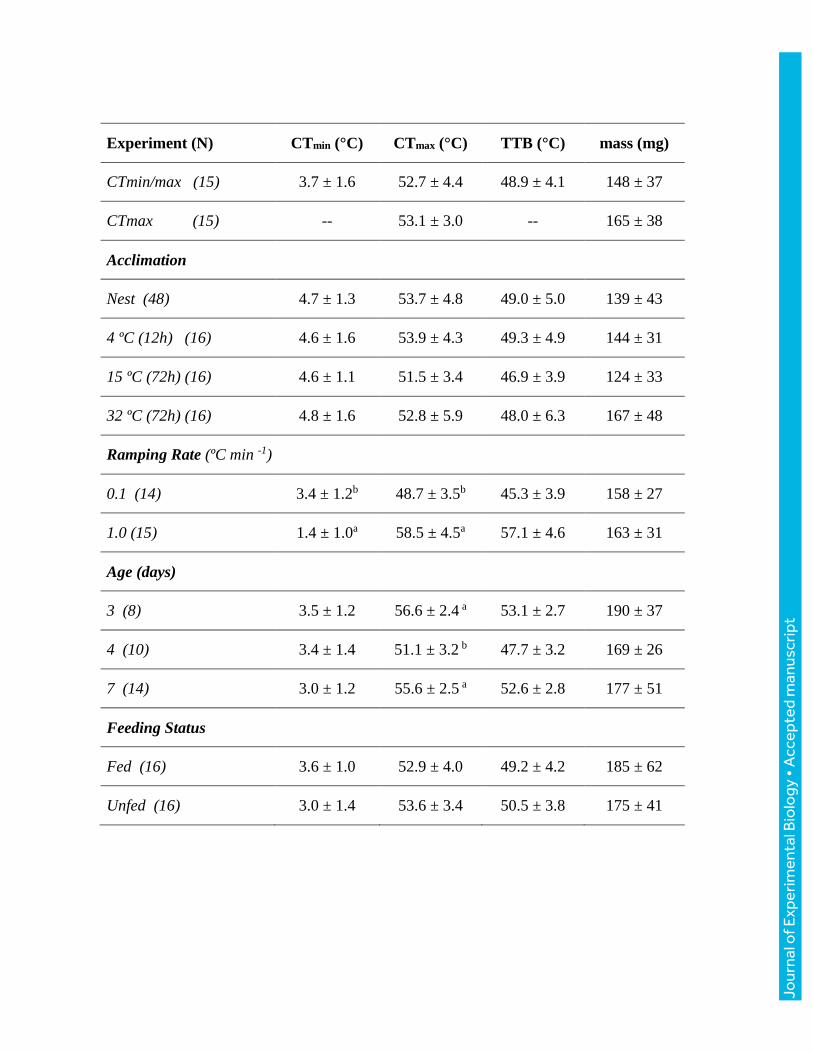
Table 1. Thermal tolerance of B. impatiens was largely unaffected by diverse experimental
conditions. Critical thermal minimum and maximum (CTmin, CTmax, respectively) and thermal
tolerance breadth (TTB) across experiments. Values are mean ± SD of vial temperatures, with
sample sizes indicated by numbers in parentheses. Letters indicate statistical differences within
experiments. See text for statistical analyses.
Jour
nal o
f Exp
erim
enta
l Bio
logy
• A
ccep
ted
man
uscr
ipt
Experiment (N) CTmin (°C) CTmax (°C) TTB (°C) mass (mg)
CTmin/max (15) 3.7 ± 1.6 52.7 ± 4.4 48.9 ± 4.1 148 ± 37
CTmax (15) -- 53.1 ± 3.0 -- 165 ± 38
Acclimation
Nest (48) 4.7 ± 1.3 53.7 ± 4.8 49.0 ± 5.0 139 ± 43
4 ºC (12h) (16) 4.6 ± 1.6 53.9 ± 4.3 49.3 ± 4.9 144 ± 31
15 ºC (72h) (16) 4.6 ± 1.1 51.5 ± 3.4 46.9 ± 3.9 124 ± 33
32 ºC (72h) (16) 4.8 ± 1.6 52.8 ± 5.9 48.0 ± 6.3 167 ± 48
Ramping Rate (ºC min -1)
0.1 (14) 3.4 ± 1.2b 48.7 ± 3.5b 45.3 ± 3.9 158 ± 27
1.0 (15) 1.4 ± 1.0a 58.5 ± 4.5a 57.1 ± 4.6 163 ± 31
Age (days)
3 (8) 3.5 ± 1.2 56.6 ± 2.4 a 53.1 ± 2.7 190 ± 37
4 (10) 3.4 ± 1.4 51.1 ± 3.2 b 47.7 ± 3.2 169 ± 26
7 (14) 3.0 ± 1.2 55.6 ± 2.5 a 52.6 ± 2.8 177 ± 51
Feeding Status
Fed (16) 3.6 ± 1.0 52.9 ± 4.0 49.2 ± 4.2 185 ± 62
Unfed (16) 3.0 ± 1.4 53.6 ± 3.4 50.5 ± 3.8 175 ± 41
Jour
nal o
f Exp
erim
enta
l Bio
logy
• A
ccep
ted
man
uscr
ipt
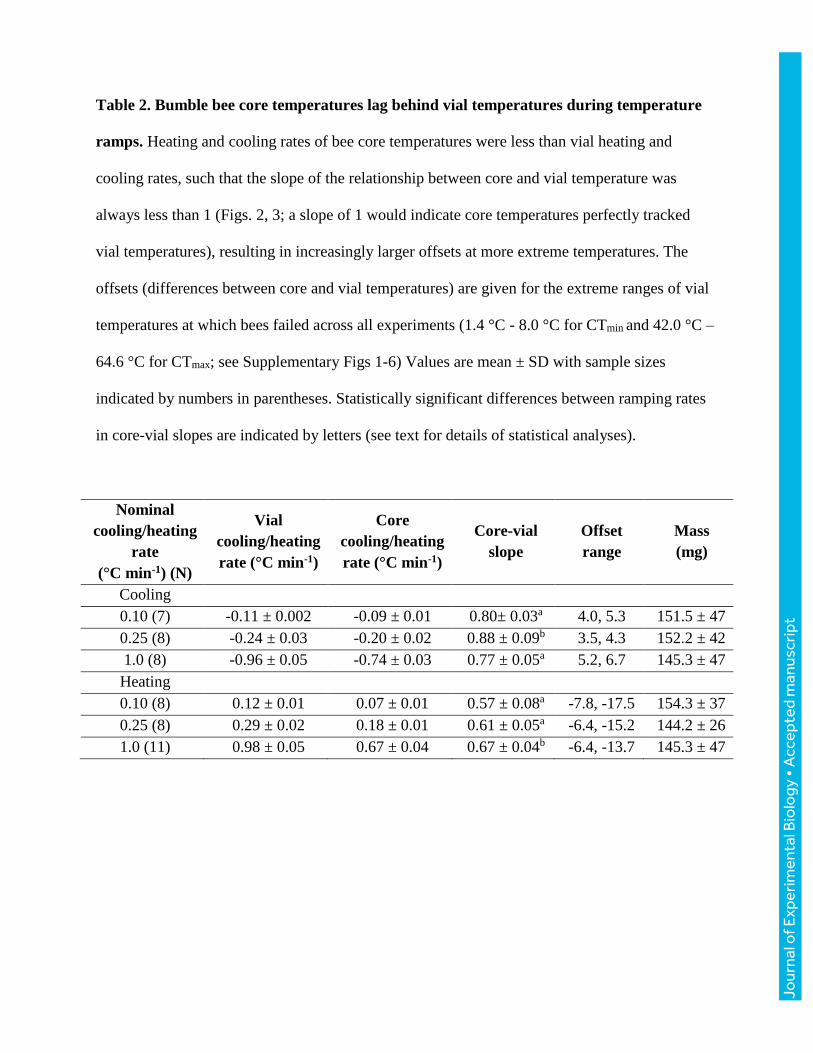
Table 2. Bumble bee core temperatures lag behind vial temperatures during temperature
ramps. Heating and cooling rates of bee core temperatures were less than vial heating and
cooling rates, such that the slope of the relationship between core and vial temperature was
always less than 1 (Figs. 2, 3; a slope of 1 would indicate core temperatures perfectly tracked
vial temperatures), resulting in increasingly larger offsets at more extreme temperatures. The
offsets (differences between core and vial temperatures) are given for the extreme ranges of vial
temperatures at which bees failed across all experiments (1.4 °C - 8.0 °C for CTmin and 42.0 °C –
64.6 °C for CTmax; see Supplementary Figs 1-6) Values are mean ± SD with sample sizes
indicated by numbers in parentheses. Statistically significant differences between ramping rates
in core-vial slopes are indicated by letters (see text for details of statistical analyses).
Nominal
cooling/heating
rate
(°C min-1) (N)
Vial
cooling/heating
rate (°C min-1)
Core
cooling/heating
rate (°C min-1)
Core-vial
slope
Offset
range
Mass
(mg)
Cooling
0.10 (7) -0.11 ± 0.002 -0.09 ± 0.01 0.80± 0.03a 4.0, 5.3 151.5 ± 47
0.25 (8) -0.24 ± 0.03 -0.20 ± 0.02 0.88 ± 0.09b 3.5, 4.3 152.2 ± 42
1.0 (8) -0.96 ± 0.05 -0.74 ± 0.03 0.77 ± 0.05a 5.2, 6.7 145.3 ± 47
Heating
0.10 (8) 0.12 ± 0.01 0.07 ± 0.01 0.57 ± 0.08a -7.8, -17.5 154.3 ± 37
0.25 (8) 0.29 ± 0.02 0.18 ± 0.01 0.61 ± 0.05a -6.4, -15.2 144.2 ± 26
1.0 (11) 0.98 ± 0.05 0.67 ± 0.04 0.67 ± 0.04b -6.4, -13.7 145.3 ± 47
Jour
nal o
f Exp
erim
enta
l Bio
logy
• A
ccep
ted
man
uscr
ipt
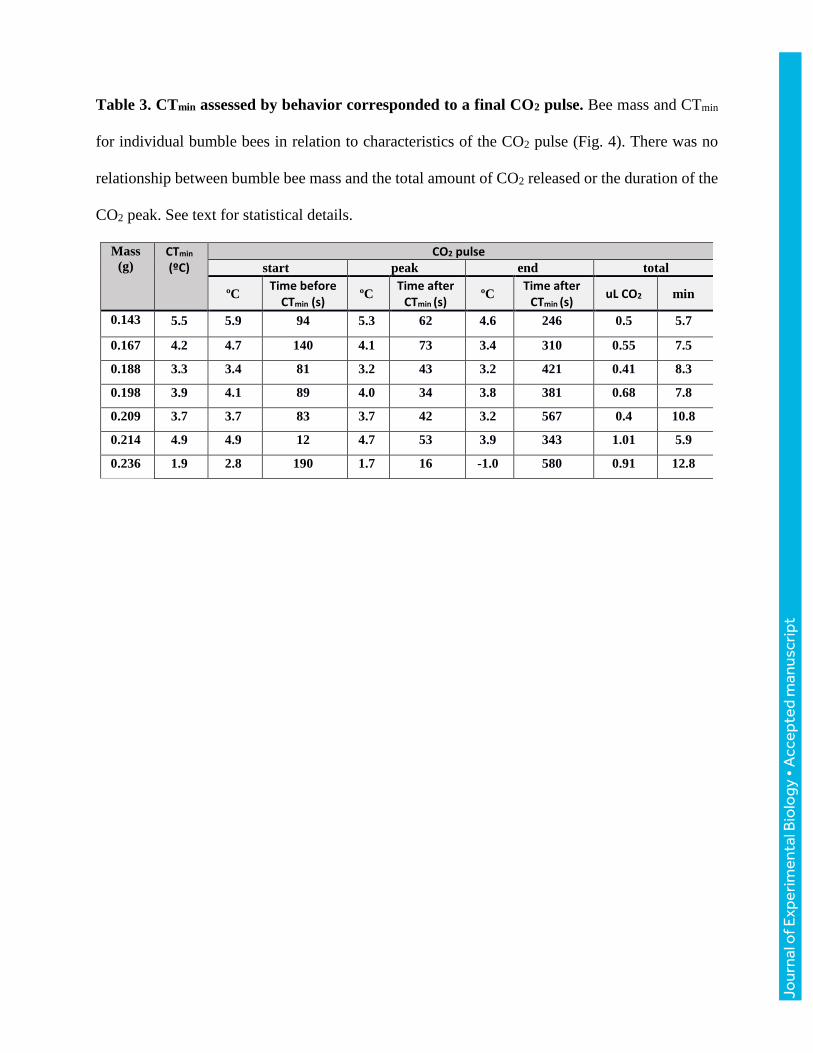
Table 3. CTmin assessed by behavior corresponded to a final CO2 pulse. Bee mass and CTmin
for individual bumble bees in relation to characteristics of the CO2 pulse (Fig. 4). There was no
relationship between bumble bee mass and the total amount of CO2 released or the duration of the
CO2 peak. See text for statistical details.
Mass
(g) CTmin
(ºC) CO2 pulse
start peak end total
ºC Time before
CTmin (s) ºC Time after
CTmin (s) ºC Time after
CTmin (s) uL CO2 min
0.143 5.5 5.9 94 5.3 62 4.6 246 0.5 5.7
0.167 4.2 4.7 140 4.1 73 3.4 310 0.55 7.5
0.188 3.3 3.4 81 3.2 43 3.2 421 0.41 8.3
0.198 3.9 4.1 89 4.0 34 3.8 381 0.68 7.8
0.209 3.7 3.7 83 3.7 42 3.2 567 0.4 10.8
0.214 4.9 4.9 12 4.7 53 3.9 343 1.01 5.9
0.236 1.9 2.8 190 1.7 16 -1.0 580 0.91 12.8
Jour
nal o
f Exp
erim
enta
l Bio
logy
• A
ccep
ted
man
uscr
ipt
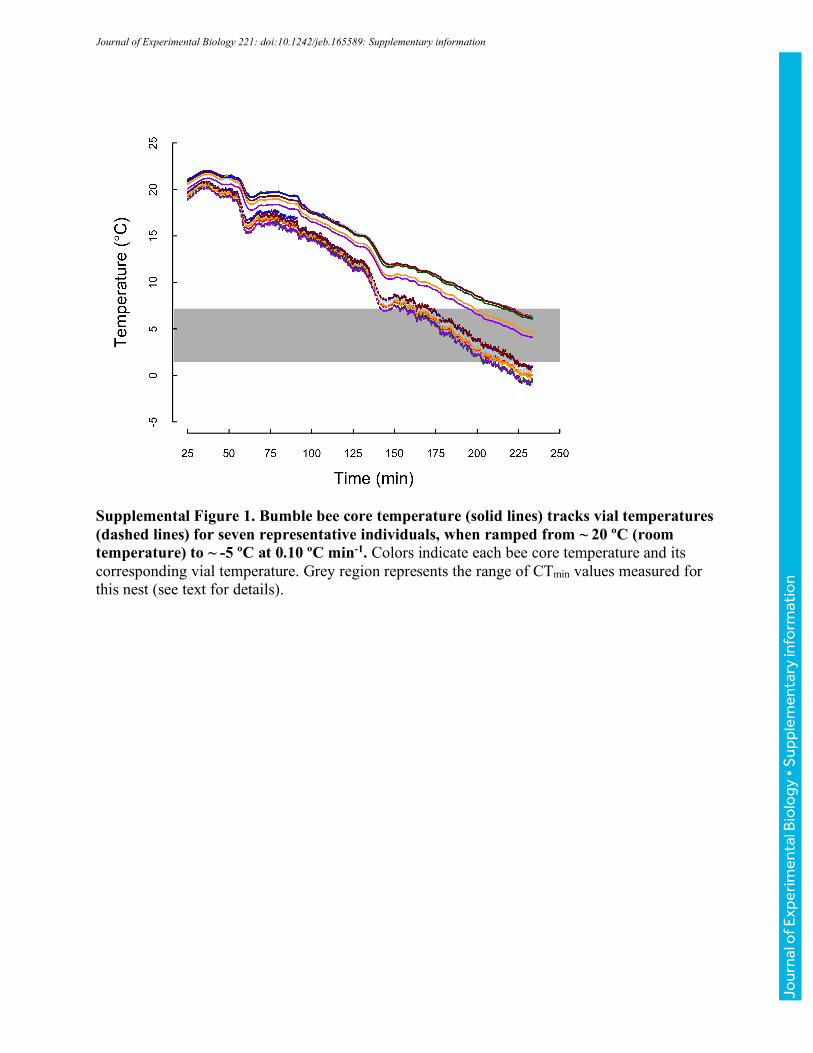
Supplemental Figure 1. Bumble bee core temperature (solid lines) tracks vial temperatures (dashed lines) for seven representative individuals, when ramped from ~ 20 ºC (room temperature) to ~ -5 ºC at 0.10 ºC min-1. Colors indicate each bee core temperature and its corresponding vial temperature. Grey region represents the range of CTmin values measured for this nest (see text for details).
Journal of Experimental Biology 221: doi:10.1242/jeb.165589: Supplementary information
Jour
nal o
f Exp
erim
enta
l Bio
logy
• S
uppl
emen
tary
info
rmat
ion
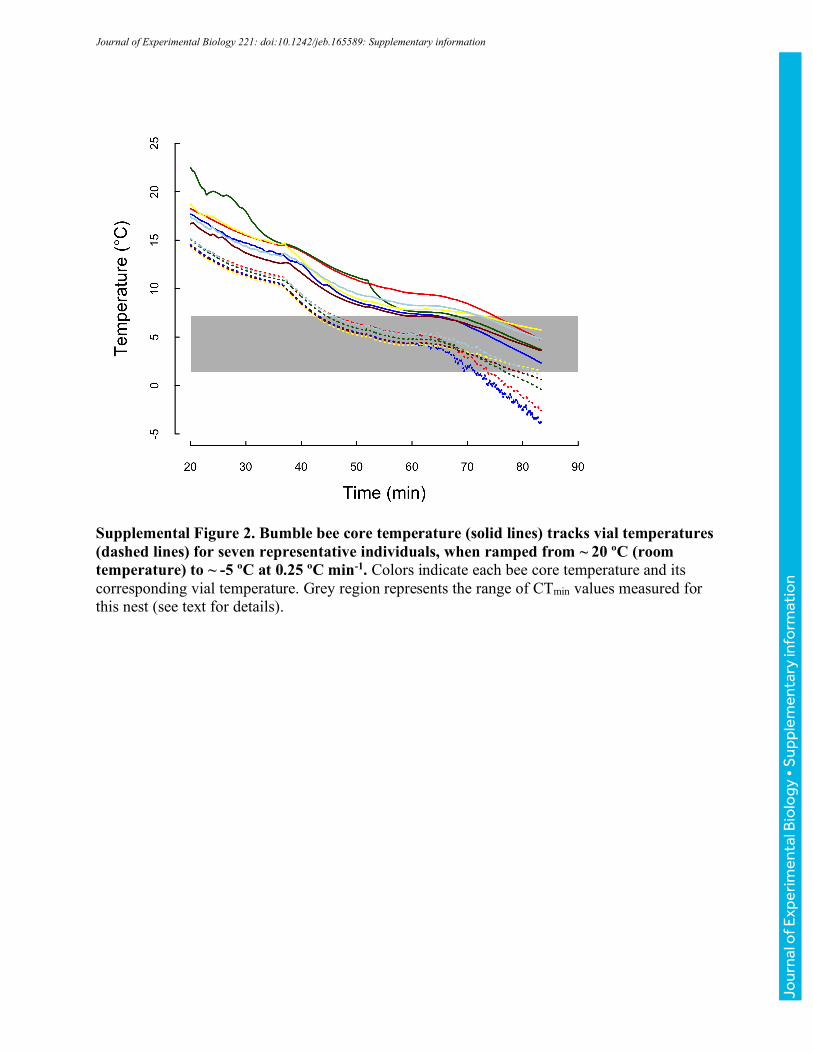
Supplemental Figure 2. Bumble bee core temperature (solid lines) tracks vial temperatures (dashed lines) for seven representative individuals, when ramped from ~ 20 ºC (room temperature) to ~ -5 ºC at 0.25 ºC min-1. Colors indicate each bee core temperature and its corresponding vial temperature. Grey region represents the range of CTmin values measured for this nest (see text for details).
Journal of Experimental Biology 221: doi:10.1242/jeb.165589: Supplementary information
Jour
nal o
f Exp
erim
enta
l Bio
logy
• S
uppl
emen
tary
info
rmat
ion
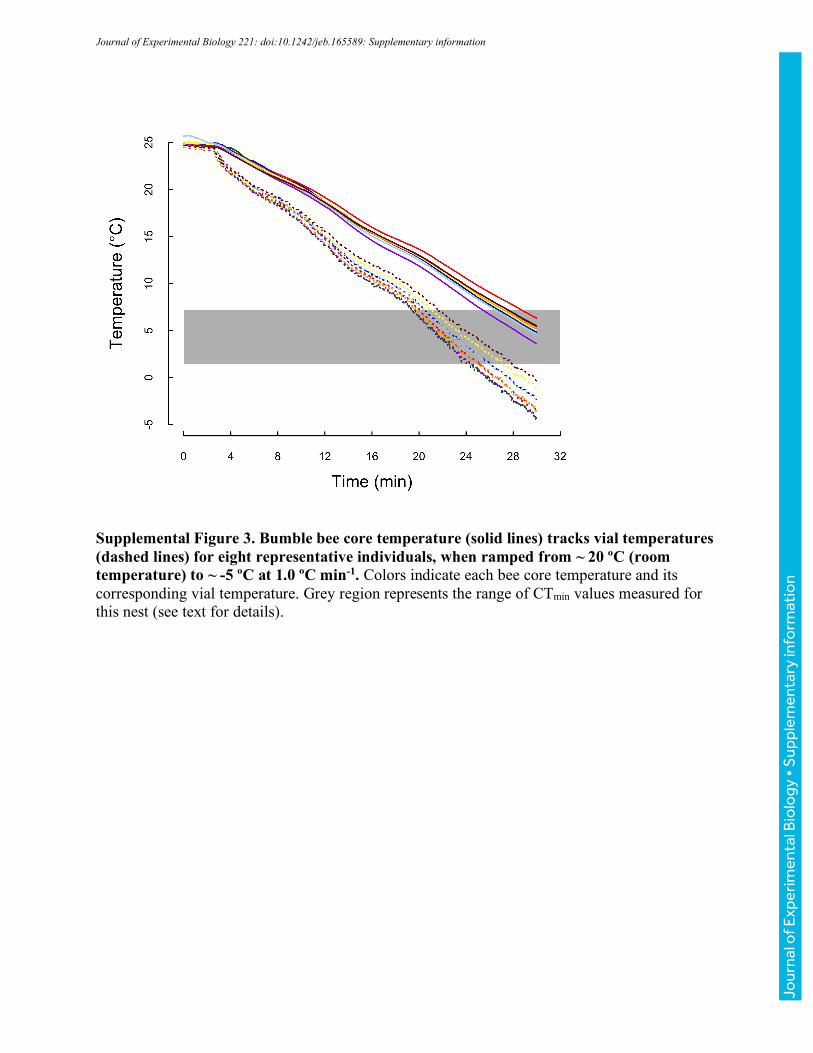
Supplemental Figure 3. Bumble bee core temperature (solid lines) tracks vial temperatures (dashed lines) for eight representative individuals, when ramped from ~ 20 ºC (room temperature) to ~ -5 ºC at 1.0 ºC min-1. Colors indicate each bee core temperature and its corresponding vial temperature. Grey region represents the range of CTmin values measured for this nest (see text for details).
Journal of Experimental Biology 221: doi:10.1242/jeb.165589: Supplementary information
Jour
nal o
f Exp
erim
enta
l Bio
logy
• S
uppl
emen
tary
info
rmat
ion
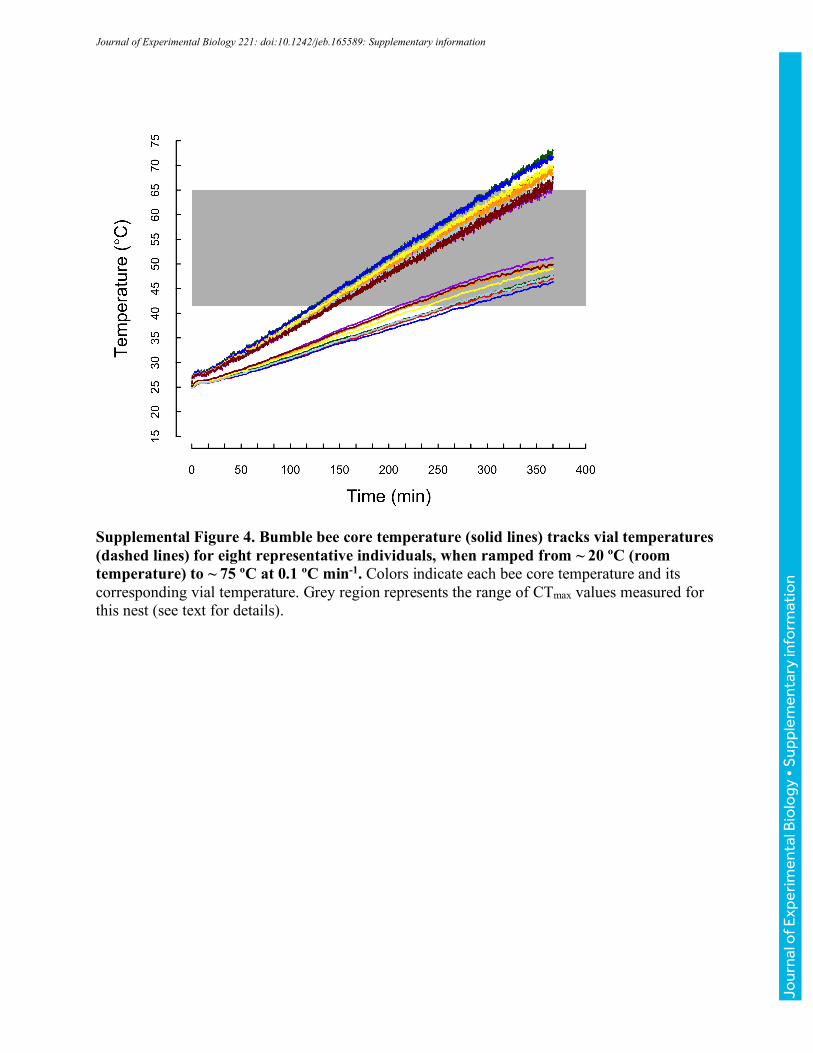
Supplemental Figure 4. Bumble bee core temperature (solid lines) tracks vial temperatures (dashed lines) for eight representative individuals, when ramped from ~ 20 ºC (room temperature) to ~ 75 ºC at 0.1 ºC min-1. Colors indicate each bee core temperature and its corresponding vial temperature. Grey region represents the range of CTmax values measured for this nest (see text for details).
Journal of Experimental Biology 221: doi:10.1242/jeb.165589: Supplementary information
Jour
nal o
f Exp
erim
enta
l Bio
logy
• S
uppl
emen
tary
info
rmat
ion
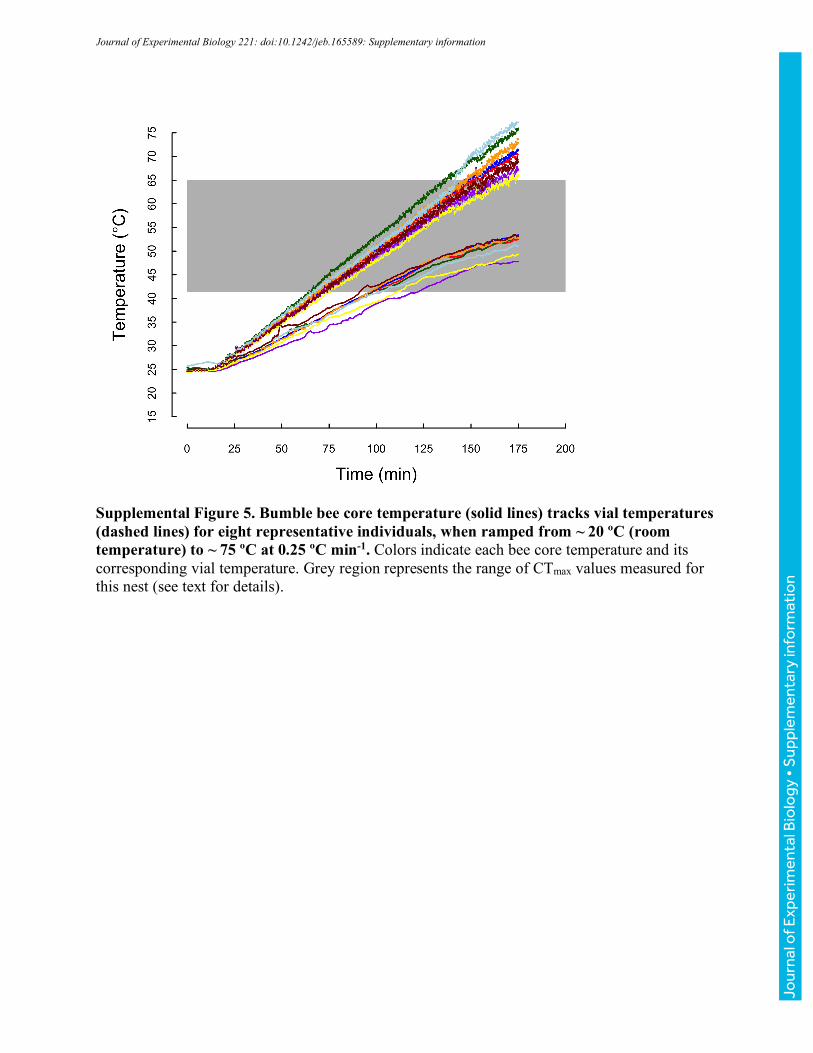
Supplemental Figure 5. Bumble bee core temperature (solid lines) tracks vial temperatures (dashed lines) for eight representative individuals, when ramped from ~ 20 ºC (room temperature) to ~ 75 ºC at 0.25 ºC min-1. Colors indicate each bee core temperature and its corresponding vial temperature. Grey region represents the range of CTmax values measured for this nest (see text for details).
Journal of Experimental Biology 221: doi:10.1242/jeb.165589: Supplementary information
Jour
nal o
f Exp
erim
enta
l Bio
logy
• S
uppl
emen
tary
info
rmat
ion
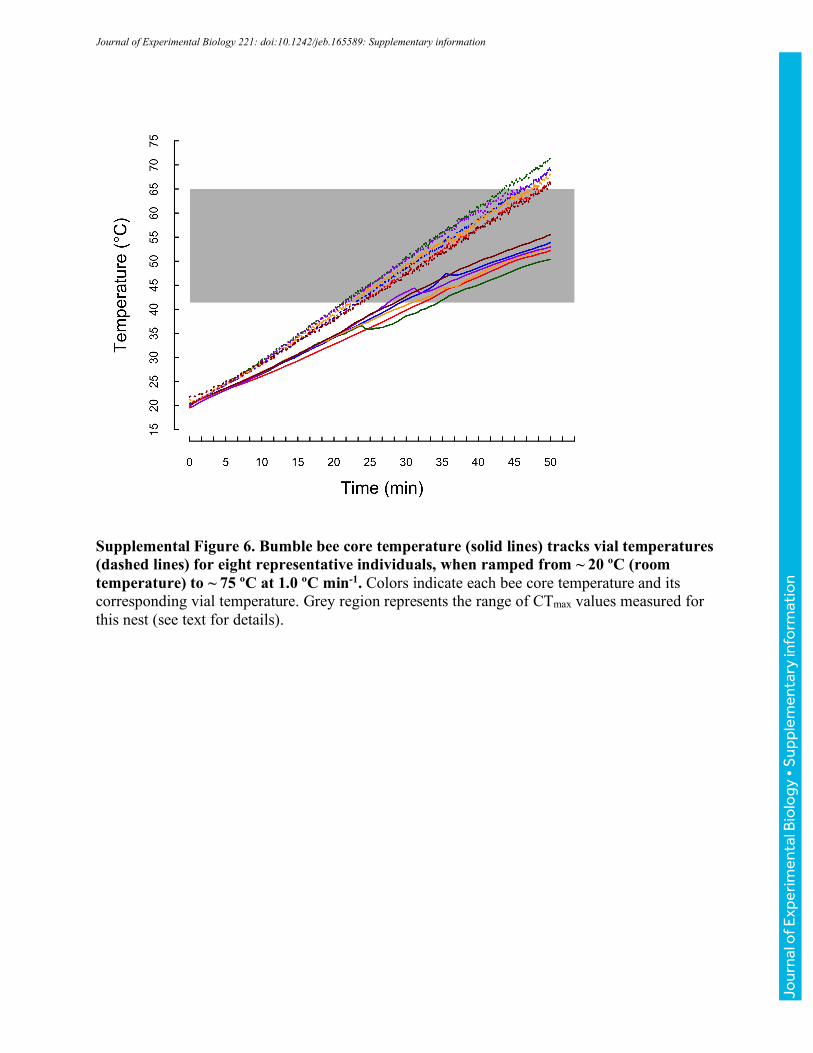
Supplemental Figure 6. Bumble bee core temperature (solid lines) tracks vial temperatures (dashed lines) for eight representative individuals, when ramped from ~ 20 ºC (room temperature) to ~ 75 ºC at 1.0 ºC min-1. Colors indicate each bee core temperature and its corresponding vial temperature. Grey region represents the range of CTmax values measured for this nest (see text for details).
Journal of Experimental Biology 221: doi:10.1242/jeb.165589: Supplementary information
Jour
nal o
f Exp
erim
enta
l Bio
logy
• S
uppl
emen
tary
info
rmat
ion
Movie S1
Movie S2
Journal of Experimental Biology 221: doi:10.1242/jeb.165589: Supplementary information
Jour
nal o
f Exp
erim
enta
l Bio
logy
• S
uppl
emen
tary
info
rmat
ion