Embed Size (px)
Citation preview

Critical Realism
1
Working Paper Series
Modeling Citation Behaviour in Management Science Journals
John Mingers Kent Business School Quentin L Burrell Isle of Man International Business School
Kent Business School
Working Paper No. 101 October 2005
ISSN 1748-7595 (Online)

Critical Realism
2
Modeling Citation Behavior in Management Science Journals 1
JOHN MINGERS
Kent Business School, University of Kent, Canterbury CT2 7NZ
Kent, UK [email protected]
+(0)1227 824008
QUENTIN L BURRELL
Isle of Man International Business School, Douglas, Isle of Man IM2 1QB [email protected]
Citation rates are becoming increasingly important in judging the research quality of journals, institutions and departments, and individual faculty. This paper looks at the pattern of citations across different management science journals and over time. A stochastic model is proposed which views the generating mechanism of citations as a gamma mixture of Poisson processes generating overall a negative binomial distribution. This is tested empirically with a large sample of papers published in 1990 from six management science journals and found to fit well. The model is extended to include obsolescence, i.e., that the citation rate for a paper varies over its cited lifetime. This leads to the additional citations distribution which shows that future citations are a linear function of past citations with a time-dependent and decreasing slope. This is also verified empirically in a way that allows different obsolescence functions to be fitted to the data. Conclusions concerning the predictability of future citations, and future research in this area are discussed. Keywords : citations, gamma-Poisson model, negative binomial distribution,
obsolescence, stochastic modeling
1 I would like to acknowledge the work of Hajir Karbassi in collecting the data on which this research is based
Critical Realism
3
Modeling Citation Behavior in Management Science Journals
1. Introduction
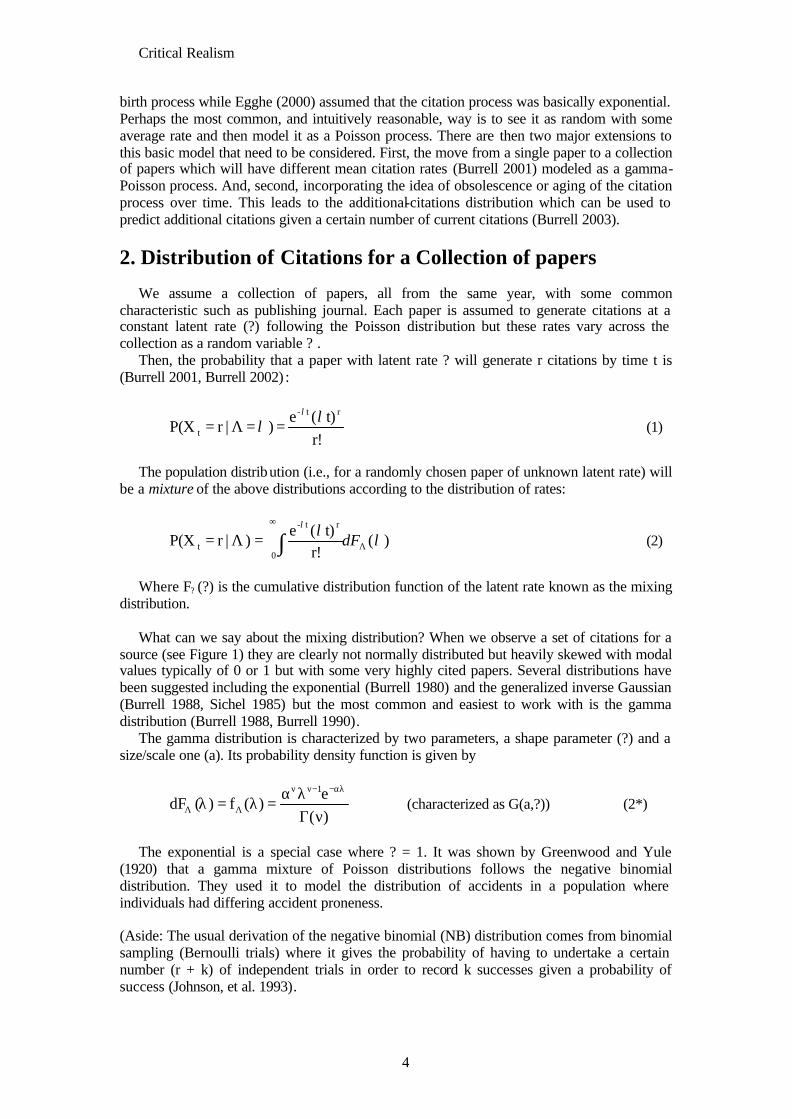
Measuring the quality of academic publications and journals is of ever greater concern. For individual academics, the reputations of the journals they publish in and the number of citations their papers receive affect their careers through tenure and promotion. For journal publishers, ranking lists, whether based on peer review or citation counts, are vital for circulation. While for universities and university departments, evaluations of research quality, such as the Research Assessment Exercise (RAE) in the UK, determine the allocation of government funding, and make or break reputations.
Traditionally, peer review (or stated preference) has been the main way of judging journal quality and many different rankings exist – see for example the Harzing database (Harzing 2005) which is a very valuable collection of fourteen different peer review rankings as well as citation impact factors covering over 800 business and management journals (Mingers and Harzing 2005). But recently more attention has been focused on revealed preference measures which are based on actual publication behavior , typically citation rates from the ISI citation index. An example is Tahai and Meyers’s (1999) analysis of 65 top journals based on citations in 17 key management journals. There are studies that combine both approaches such as Baden-Fuller et al’s (2000) which identified 32 top journals as part of an evaluation of business school rankings, and DuBois (2000) who used citations and a survey to rank international business journals. The method of combination tends to be ad hoc – judgment in Baden-Fuller’s case and simple averages for DuBois.
Most citation studies either look at the total numbers of citations received by papers or journals, or they consider impact scores. These are produced by ISI and measure the number of citations per paper received by a journal in the previous two years. Whilst useful as a snapshot, such measures do have several biases (Glänzel and Moed 2002, Jennings 1998), particularly over the width of coverage of the publication, the disciplinary area, and the short length of time within a paper’s citation life.
This study is concerned with citations but primarily in terms of the dynamic behavior of citations over the lifetime of a paper. In particular, it addresses the question of to what extent we can predict the future number of citations that a paper will receive if we know how many it has received so far. This would be a simple question if the number of citations received followed a roughly linear path, but in fact it does not. For any particular paper there may be a high degree of variability from year to year and there also tends to be a long term pattern. Typically, citations start slowly not least because the citing papers take some time to appear in print. Citations then build up as citations lead to new readers who may also cite it. Then citations tail off as the material becomes dated and obsolete. There are several other patterns that may occur, including “shooting stars” and “sleeping beauties” that will be discussed later in the paper (Van Raan 2004).
A sample of over 600 papers from six management science journals has been studied. These papers were all published in 1990 giving a fourteen year history of citation behavior. The journals varied in terms of prestige, location, and subject coverage. If we take a single paper we can trace the number of citations per year that it receives over time. We can also do this for a collection of papers that has some degree of homogeneity: for example, the same journal, or the same year, or the same subject, or the same author. There are several ways in which this process can be modeled. For example Glänzel and Schoepflin (1995) used a linear
Critical Realism
4
birth process while Egghe (2000) assumed that the citation process was basically exponential. Perhaps the most common, and intuitively reasonable, way is to see it as random with some average rate and then model it as a Poisson process. There are then two major extensions to this basic model that need to be considered. First, the move from a single paper to a collection of papers which will have different mean citation rates (Burrell 2001) modeled as a gamma-Poisson process. And, second, incorporating the idea of obsolescence or aging of the citation process over time. This leads to the additional-citations distribution which can be used to predict additional citations given a certain number of current citations (Burrell 2003).
2. Distribution of Citations for a Collection of papers
We assume a collection of papers, all from the same year, with some common characteristic such as publishing journal. Each paper is assumed to generate citations at a constant latent rate (?) following the Poisson distribution but these rates vary across the collection as a random variable ? .
Then, the probability that a paper with latent rate ? will generate r citations by time t is (Burrell 2001, Burrell 2002) :
r!t)(e
) |r P(Xrt-
tλ
λλ
==Λ= (1)
The population distribution (i.e., for a randomly chosen paper of unknown latent rate) will
be a mixture of the above distributions according to the distribution of rates:
)(r!
t)(e ) |r P(X
rt-
0t λ
λλ
Λ
∞
∫=Λ= dF (2)
Where F? (?) is the cumulative distribution function of the latent rate known as the mixing
distribution. What can we say about the mixing distribution? When we observe a set of citations for a
source (see Figure 1) they are clearly not normally distributed but heavily skewed with modal values typically of 0 or 1 but with some very highly cited papers. Several distributions have been suggested including the exponential (Burrell 1980) and the generalized inverse Gaussian (Burrell 1988, Sichel 1985) but the most common and easiest to work with is the gamma distribution (Burrell 1988, Burrell 1990).
The gamma distribution is characterized by two parameters, a shape parameter (?) and a size/scale one (a). Its probability density function is given by
1e
dF ( ) f ( )( )
ν ν− −αλ
Λ Λα λ
λ = λ =Γ ν
(characterized as G(a,?)) (2*)
The exponential is a special case where ? = 1. It was shown by Greenwood and Yule
(1920) that a gamma mixture of Poisson distributions follows the negative binomial distribution. They used it to model the distribution of accidents in a population where individuals had differing accident proneness.
(Aside: The usual derivation of the negative binomial (NB) distribution comes from binomial sampling (Bernoulli trials) where it gives the probability of having to undertake a certain number (r + k) of independent trials in order to record k successes given a probability of success (Johnson, et al. 1993).

Critical Realism
5
k rr k 1P(X r) p (1 p)
k 1+ −
= = − − , r = 0, 1, 2, … (3)
The mean and variance of this NBD are given by E[X] = µ = k(1-p)/p; and Var(X) = s2 = k(1-p)/p2
With this interpretation k must be integer and the distribution is sometimes called the
Pascal distribution.) When we apply the gamma mixing procedure to the time-dependent Poisson process (1)
we find, upon substituting (2*) in (2) and performing the integration:
r
t
r 1P(X r) 1
1 t t
ν+ ν − α α = = − ν − α + α + , r = 0, 1, 2, … (4)
So, k is replaced by ? and p = a/(a+t). Note that in this case ? need not be integer. Also, E[Xt] = µ(t) = ?t/a; and Var(Xt) = s 2 (t) = ?t(t+a)/a2
We can summarise this by writing:
tX NB ,t
α ≈ ν α + (4*)
Thus we might expect to find that if we look at the distribution of the number of citations of papers from a particular homogeneous source they would follow the negative binomial distribution over any chosen time period. This will now be tested empirically.
2.1 Empirical Results We have six different source collections each one being all the papers from a particular
journal in 1990 – Management Science (ManSci), Operations Research (OpsRes), Decision Science (DecSci), European J. Operational Research (EJOR), J. Operational Research Society (JORS), and Omega (Omega). These were selected for their variety on several factors – level of prestige and quality; prevalence of heavily mathematical articles; US and European; narrowness and width of coverage. The number of citations for each journal over the full 14 year period 1991-2004 was tabulated and the means and standard deviations are shown in Table 1, and histograms in Figure 1.
There are two comments about the data. i) At first all document types from a journal were recorded. However, with JORS and EJOR there were large numbers of book reviews which virtually all received zero citations. Whilst a book review could be cited it is very rare. Other journals, especially ManSci and OpsRes did not have reviews and so had a much smaller proportion of zero citations. To avoid this bias, only documents of type “article”, “editorial” or “letter” were recorded. ii) With the ISI database selection of a year in the database limits does not correspond exactly with the actual year of publication. For JORS for example, selecting “1990” picks up some papers from the end of 1989 and excludes some from the end of 1990.
Table 1 about here The mean number of citations (over 14 years) varied significantly from 7 (JORS and
Omega) to 39 (ManSci). All the distributions were extremely skewed - in comparison with a standard Poisson distribution, where the mean and variance are equal, variances were up to 40 times the mean. The maximum number of citations for a paper ranged from 66 (DecSci) to

Critical Realism
6
277 (OpsRes) although such popular papers were quite rare. In JORS and OpsRes there was only one paper above 100 although there were eight cases in ManSci.
Figure 1 about here One interesting, and perhaps surprising, fact is the number of papers that were never cited
during the period of observation. This is, in fact, a common observation in the literature: “… many articles, even those published in prestigious journals, remain uncited” (Rousseau 1994) (cited in (Burrell 2001). It has been incorporated in other citation models (Egghe 2000, Glänzel and Schoepflin 1995) but Burrell (2001) shows that it is actually a consequence of the gamma-Poisson model we are exploring, and that the proportion of never-cited articles depends only on the distribution of latent rates. In each case (except ManSci) the modal value of the distribution of number of citations was in fact zero and the % of zero cites ranges from 5% (ManSci) to 22% (Omega) and 18% (JORS). In other words, nearly a quarter of the articles published in Omega in 1990 have never been cited, even by their own authors. This would seem to be a serious case of publishing papers which in fact make little contribution to the academic world.
The distributions were fitted in Systat using maximum likelihood estimation of parameters
and Chi-Square to measure significance. Table 1 shows the fitted parameters and the Chi-Square probabilities for each journal. The majority are extremely well fitted with p-values around 0.5. The exceptions are JORS and Omega. The JORS data are skewed by one very large value of 176 citations (the next highest number is 62). With that value the fitted parameters are so distorted that the negative binomial does not fit. If that is removed, the p-value rises to 0.19 and the parameters values become k=0.704, p=0.106 as shown in the Table. The Omega result is caused mainly by an excess of citations in the 2-3 range but this is presumably a chance occurrence on a relatively small set of data.
The JORS extreme value is interesting in showing how a particular type of paper can
generate large numbers of citations. The paper (Beasley 1990), which is only four pages long, describes a library that the author had set up of test problems for different OR techniques. Clearly this was very successful with many later researchers using the library and referencing the paper. This is an important point for infometric research in general although not so important for this statistical analysis.
From the fitted parameters we can calculate the negative binomial moments. These are
generally close to the observed ones apart from the effects of the extreme values in JORS, and OpsRes on dispersion. There was a reasonably constant relationship between the mean and standard deviation. From the parameters we can also calculate the parameters of the underlying latent rate gamma distribution using (4). The ? value determines the shape. If ?=1 we have the exponential distribution and for ?>1 the shape tends to a normal distribution. Ours are all <1 showing that the distributions are more skewed than the exponential.
It might be thought that the above analysis implicitly assumes that the papers have all
reached their total number of citations. This will of course not be the case in practice since we will only be able to observe over a fixed number of periods and some will still be being cited.2 However, as previously noted, the gamma-Poisson model implies the negative binomial whatever the period of observation but the scale parameter is time dependent. This brings us
2 Indeed, it is difficult to put a final age on citations – for example the ISI database only goes back to 1981 but there are papers (e.g., Fisher, M. 1981. The Lagrangian-relaxation method for solving integer-programming problems, Management Science, 27, 1 1-18.) that are still being regularly cited now.

Critical Realism
7
to consider the second extension to the basic Poisson model – the behavior of the citation rate over time.
3. The Dynamic Behavior of Citations
It is generally agreed, and empirically observable, that citations for a particular article do not occur evenly over time. They usually begin slowly when the article is newly published, rise to a peak rate, and then diminish as the content of the paper becomes obsolete. There are obviously exceptions to this: for example papers that become classics and are cited constantly for many, many years; or papers that lie dormant and then perhaps become discovered or fashionable (Glänzel and Schoepflin 1995, Van Raan 2004). 3
Burrell (2001, 2002, 2003) has suggested modeling this by incorporating an
“obsolescence” function into the basic citation model that would alter the latent rate over time. When ? is not constant the distribution is known as a nonhomogeneous Poisson process (NHPP). Burrell (2001) makes the assumption that while the latent rate will differ between papers the obsolescence function will be the same for all within a particular collection. This will be of the form ?t = ?c(t) where c(t) reflects the changing pattern of ? over time. If this is normalized then we can consider c(t) to be a probability density function and C(t) to be its cumulative distribution function.
This gives the following generalization of (1) for a paper with known ?:
r!
))((e ) |r P(X
rt)(-
ttCC λ
λλ
==Λ= (1a)
And of (2) for a randomly chosen paper:
)(r!
t))((e ) |r P(X
rt)(-
0t λ
λλ
Λ
∞
∫=Λ= dFCC
(2a)
This general theory can be taken in two directions. First we can consider the number of
additional citations papers will receive if they have received r citations by time t. This is the additional-citations distribution (Burrell 2003). Second, we can consider the dynamic behavior of citations in terms of how long it takes to generate a certain number (n) of citations. This is known as the nth-citation distribution (Burrell 2002). This can apply to a single paper, or to a collection of papers, in which case we can interpret it as the proportion of papers that will have generated n citations by time t.
If we assume, as we have above, that the latent rate distribution is a gamma, then the
gamma-Poisson model becomes (Burrell 2002) :
r
t
r 1P(X r) 1
1 C(t) C(t)
ν+ ν − α α= = − ν − α + α +
, r = 0, 1, 2, … (4a)
Thus we have that tX NB ,C(t)
α≈ ν α +
3 On this last point Burrell Burrell, Q. 2006. Are "sleeping beauties" to be expected?, Scientometrics, 65, 3 has demonstrated that such occurrences might be expected using the model we are considering.

Critical Realism
8
However, first we must look at the obsolescence distribution empirically. The questions are: what might be an appropriate form for the obsolescence function, and is it reasonable to assume the same form, and even parameters, across a collection of papers?
In terms of form, we can note that if C(t) = t then we have a straight line corresponding to
the standard Poisson case of constant ?. If, as we are expecting, ? varies from low to high to low then we would expect an S shaped distribution curve. There are many possibilities here: see: Makridakis at al (1983, p. 658) and Meade and Islam (1998) who list 29 different curves.
)/()( tbaetC −= (SPSS S-Curve) a)
)1(1
)(tab
tC+
= (SPSS, Pearl-Reed, logistic curve) b)
There is another version of this curve that differs only in the parameterization and hence gives the same results empirically:
)1(1
)(btae
tC−+
= (Pearl logistic)
3)1()( btaetC −−= (Von Bertalanffy) c)
b taeetC
−−=)( (Gompertz) d)
abtetC )/(1)( −−= (Weibull) e)
)(),(
1)(ναν
ΓΓ
−=x
tC (Gamma) f)
The extent to which these fit collections of papers will be tested in a later section. Fitting them to citations for individual papers in not carried out in this paper.
4. The Additional-Citations Distribution
In the context of the UK RAE the number of additional citations that a paper may receive is of great interest. By definition, the RAE only considers recent papers – in the case of the 2008 RAE only papers since 2001 – and indeed many will only be one or two years old. If citations were to be used in any way as a measure of quality for an individual paper, rather than for a journal, then understanding the degree of predictability of future citations is important.
Give the above gamma-Poisson model, Burrell (2003) has derived the additional-citations
distribution - the number of additional citations a paper will receive given that it has received r by time t - as follows:
Let Y(t,s) = Xt+s – Xt = number of additional citations received during the interval (t, t+s) Then
nr
t stCtC
stCtC
nrnr
rXnstYP
++
+−
++
++Γ
++Γ===
+
)()(
1)(
)(!)()(
)|),((α
αα
αν
νν
(5)

Critical Realism
9
This is also a negative binomial -
+
+++
να
αr
stCtC
NB ,)(
)( (5*)
Thus the mean additional citations (from the definition of the mean of a NB) is:
+
−++==
)()()(
)(]|),([tC
tCstCrrXstYE t α
ν (6)
This is a very interesting result since it shows that, for known values of ?, a, the expected
number of additional citations in a future time period is a simple linear function of the number
of citations so far (r) with slope
+
−+)(
)()(tC
tCstCα
. Thus, the more citations a paper has
received by time t, the more it is expected to receive. This phenomenon is well known in informetrics, often referred to as “success-breeds-success” after Price (1976) or the “Matthew effect” after Merton (1988). The value of C(t) determines the increment or slope of this line. C(t) represents the proportion of the way through its life a paper is, given its obsolescence function. So a paper that has received 5 citations after 20% of its life can expect more in the future that one receiving 5 citations after 80% of its life.
Some special results following from this are:
i) The total number of additional citations is
+
++
να
αr
tCNB ,
1)(
with expected value
+−
+==)()(1
)(]|)([tCtC
rrXtYE t αν (7)
where Y(t) is the total number of additional citations that will ever be received in the life of the paper.
Table 2 gives an example for the ManSci papers. The estimated parameters (from Table 1)
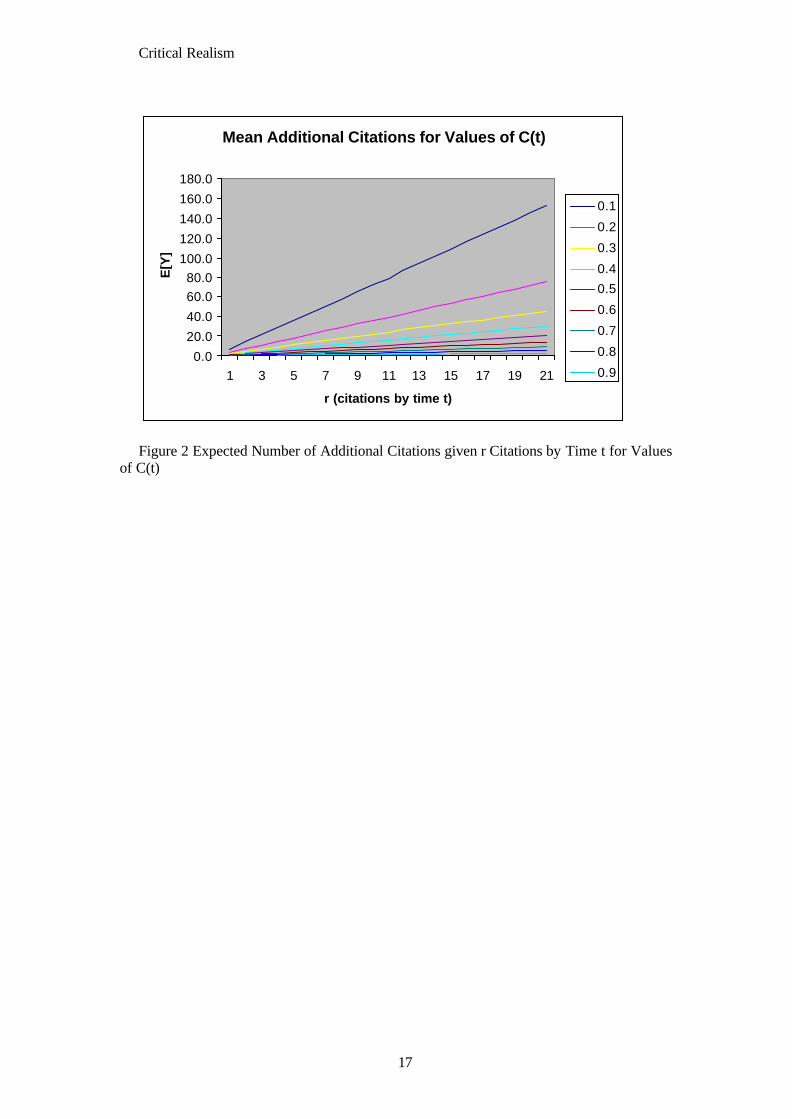
are ? = 0.89 and a = .023. The Table gives the expected additional citations for different values of r and C(t). Note that by using C(t) directly we are not assuming a particular obsolescence function but equally cannot tie the results back to particular years. So, a Management Science paper that has received 5 citations 30% of the way through its citing life could expect to receive a further 12.8 citations by the end. But if it had received 10 citations by then it could expect 23.6 more. This is as we would expect – the more citations a paper has received by a certain time, the more we would expect it to receive in the future. Alternatively, if it had received 5 citations after 70% of its life it could only expect 2.4 more by the end.
In practice, these results will be affected by the obsolescence function for the collection. A function with a rapid decay will generate fewer citations in later life. One which involved a “late development” would obviously have the opposite effect.
Table 2 about here Graphs are shown in Figure 2
Figure 2 about here Table 3 shows intercepts and slopes for the different journals for particular values of C(t) –
0.1, 0.3, and 0.5. We can see that in their early life the differences between journals are quite
Critical Realism
10
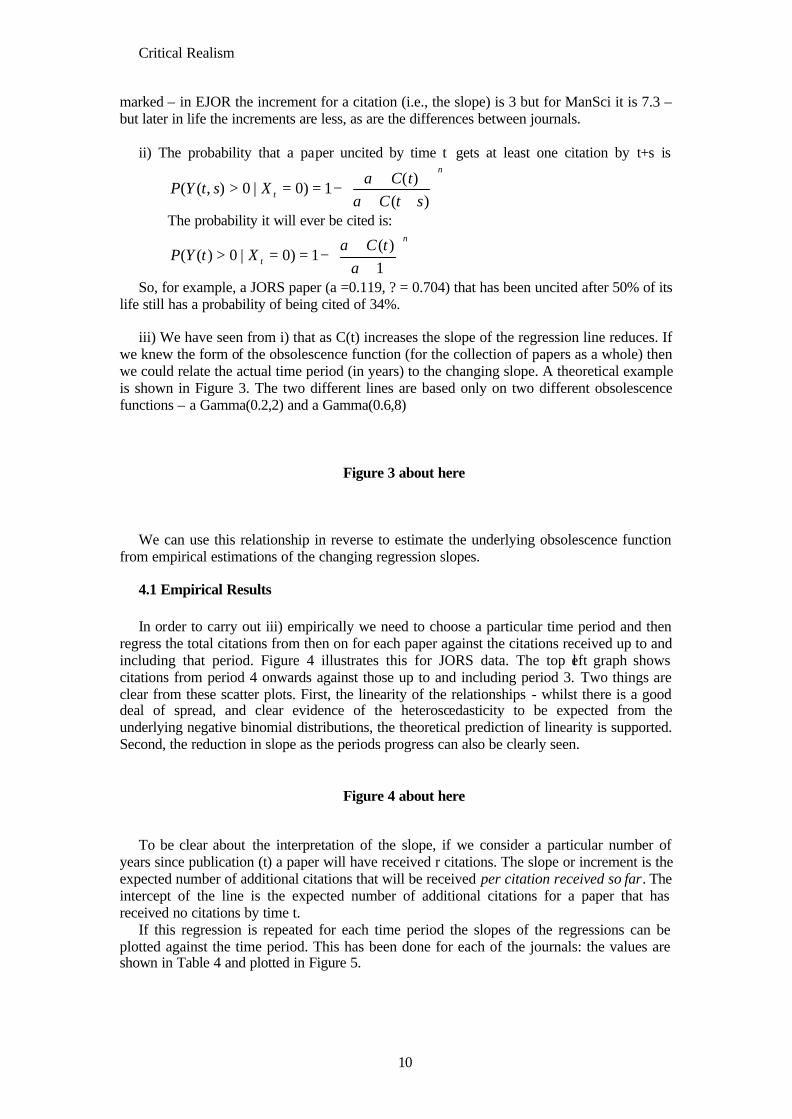
marked – in EJOR the increment for a citation (i.e., the slope) is 3 but for ManSci it is 7.3 – but later in life the increments are less, as are the differences between journals.
ii) The probability that a paper uncited by time t gets at least one citation by t+s is
ν
αα
++
+−==>
)()(
1)0|0),((stC
tCXstYP t
The probability it will ever be cited is: ν
αα
++
−==>1
)(1)0|0)((
tCXtYP t
So, for example, a JORS paper (a =0.119, ? = 0.704) that has been uncited after 50% of its life still has a probability of being cited of 34%.
iii) We have seen from i) that as C(t) increases the slope of the regression line reduces. If
we knew the form of the obsolescence function (for the collection of papers as a whole) then we could relate the actual time period (in years) to the changing slope. A theoretical example is shown in Figure 3. The two different lines are based only on two different obsolescence functions – a Gamma(0.2,2) and a Gamma(0.6,8)
Figure 3 about here We can use this relationship in reverse to estimate the underlying obsolescence function
from empirical estimations of the changing regression slopes.
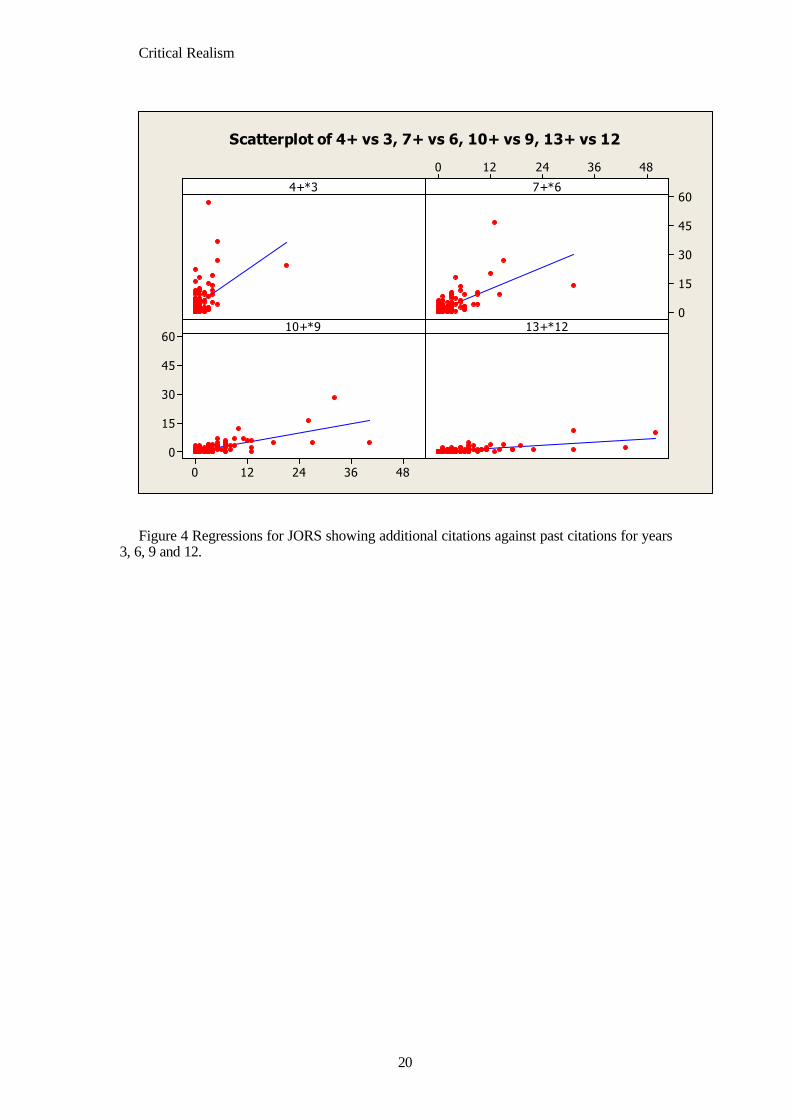
4.1 Empirical Results In order to carry out iii) empirically we need to choose a particular time period and then
regress the total citations from then on for each paper against the citations received up to and including that period. Figure 4 illustrates this for JORS data. The top left graph shows citations from period 4 onwards against those up to and including period 3. Two things are clear from these scatter plots. First, the linearity of the relationships - whilst there is a good deal of spread, and clear evidence of the heteroscedasticity to be expected from the underlying negative binomial distributions, the theoretical prediction of linearity is supported. Second, the reduction in slope as the periods progress can also be clearly seen.
Figure 4 about here To be clear about the interpretation of the slope, if we consider a particular number of
years since publication (t) a paper will have received r citations. The slope or increment is the expected number of additional citations that will be received per citation received so far. The intercept of the line is the expected number of additional citations for a paper that has received no citations by time t.
If this regression is repeated for each time period the slopes of the regressions can be plotted against the time period. This has been done for each of the journals: the values are shown in Table 4 and plotted in Figure 5.
Critical Realism
11
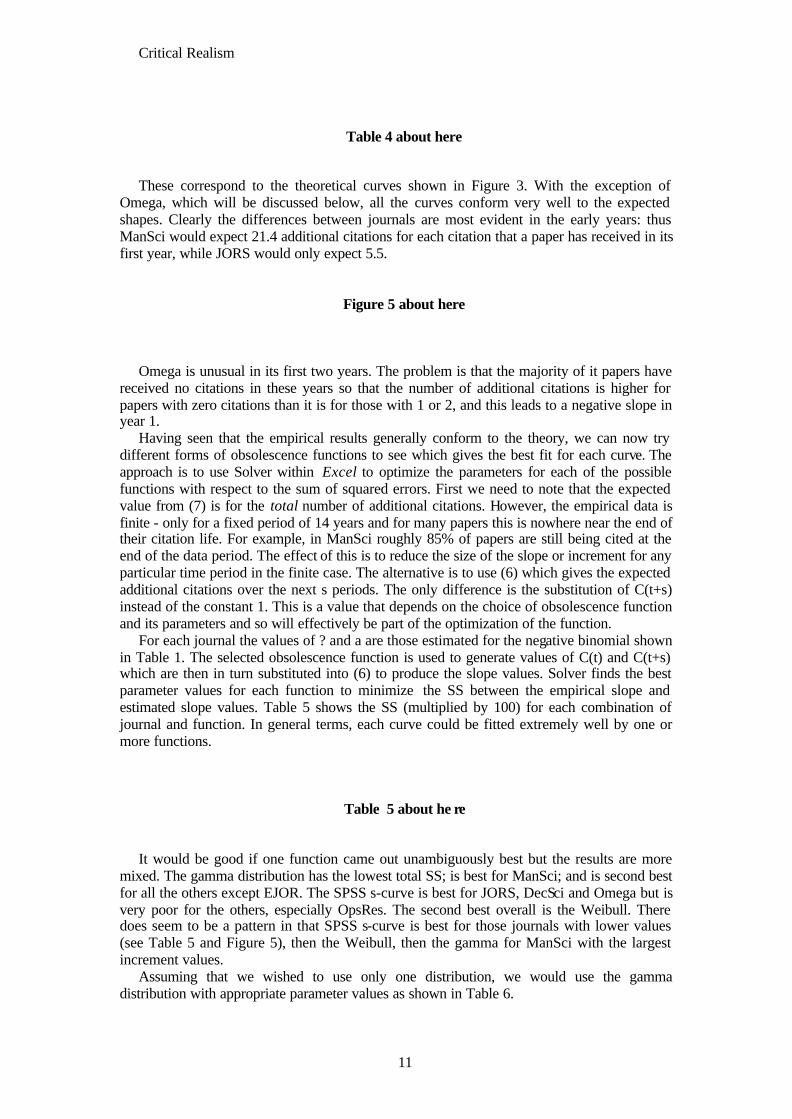
Table 4 about here These correspond to the theoretical curves shown in Figure 3. With the exception of
Omega, which will be discussed below, all the curves conform very well to the expected shapes. Clearly the differences between journals are most evident in the early years: thus ManSci would expect 21.4 additional citations for each citation that a paper has received in its first year, while JORS would only expect 5.5.
Figure 5 about here Omega is unusual in its first two years. The problem is that the majority of it papers have
received no citations in these years so that the number of additional citations is higher for papers with zero citations than it is for those with 1 or 2, and this leads to a negative slope in year 1.
Having seen that the empirical results generally conform to the theory, we can now try different forms of obsolescence functions to see which gives the best fit for each curve. The approach is to use Solver within Excel to optimize the parameters for each of the possible functions with respect to the sum of squared errors. First we need to note that the expected value from (7) is for the total number of additional citations. However, the empirical data is finite - only for a fixed period of 14 years and for many papers this is nowhere near the end of their citation life. For example, in ManSci roughly 85% of papers are still being cited at the end of the data period. The effect of this is to reduce the size of the slope or increment for any particular time period in the finite case. The alternative is to use (6) which gives the expected additional citations over the next s periods. The only difference is the substitution of C(t+s) instead of the constant 1. This is a value that depends on the choice of obsolescence function and its parameters and so will effectively be part of the optimization of the function.
For each journal the values of ? and a are those estimated for the negative binomial shown in Table 1. The selected obsolescence function is used to generate values of C(t) and C(t+s) which are then in turn substituted into (6) to produce the slope values. Solver finds the best parameter values for each function to minimize the SS between the empirical slope and estimated slope values. Table 5 shows the SS (multiplied by 100) for each combination of journal and function. In general terms, each curve could be fitted extremely well by one or more functions.
Table 5 about he re
It would be good if one function came out unambiguously best but the results are more
mixed. The gamma distribution has the lowest total SS; is best for ManSci; and is second best for all the others except EJOR. The SPSS s-curve is best for JORS, DecSci and Omega but is very poor for the others, especially OpsRes. The second best overall is the Weibull. There does seem to be a pattern in that SPSS s-curve is best for those journals with lower values (see Table 5 and Figure 5), then the Weibull, then the gamma for ManSci with the largest increment values.
Assuming that we wished to use only one distribution, we would use the gamma distribution with appropriate parameter values as shown in Table 6.
Critical Realism
12
Table 6 about here
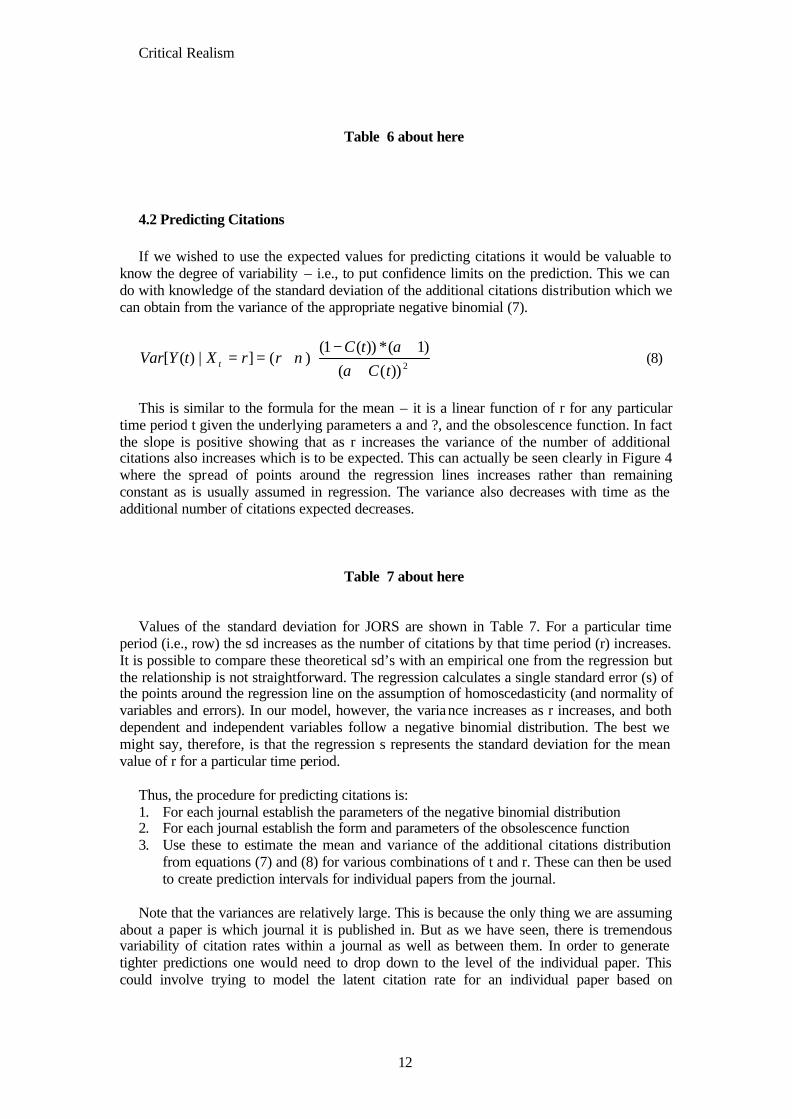
4.2 Predicting Citations If we wished to use the expected values for predicting citations it would be valuable to
know the degree of variability – i.e., to put confidence limits on the prediction. This we can do with knowledge of the standard deviation of the additional citations distribution which we can obtain from the variance of the appropriate negative binomial (7).
++−
+==2))((
)1(*))(1()(]|)([
tCtC
rrXtYVar t αα
ν (8)
This is similar to the formula for the mean – it is a linear function of r for any particular
time period t given the underlying parameters a and ?, and the obsolescence function. In fact the slope is positive showing that as r increases the variance of the number of additional citations also increases which is to be expected. This can actually be seen clearly in Figure 4 where the spread of points around the regression lines increases rather than remaining constant as is usually assumed in regression. The variance also decreases with time as the additional number of citations expected decreases.
Table 7 about here
Values of the standard deviation for JORS are shown in Table 7. For a particular time
period (i.e., row) the sd increases as the number of citations by that time period (r) increases. It is possible to compare these theoretical sd’s with an empirical one from the regression but the relationship is not straightforward. The regression calculates a single standard error (s) of the points around the regression line on the assumption of homoscedasticity (and normality of variables and errors). In our model, however, the variance increases as r increases, and both dependent and independent variables follow a negative binomial distribution. The best we might say, therefore, is that the regression s represents the standard deviation for the mean value of r for a particular time period.
Thus, the procedure for predicting citations is: 1. For each journal establish the parameters of the negative binomial distribution 2. For each journal establish the form and parameters of the obsolescence function 3. Use these to estimate the mean and variance of the additional citations distribution
from equations (7) and (8) for various combinations of t and r. These can then be used to create prediction intervals for individual papers from the journal.
Note that the variances are relatively large. This is because the only thing we are assuming
about a paper is which journal it is published in. But as we have seen, there is tremendous variability of citation rates within a journal as well as between them. In order to generate tighter predictions one would need to drop down to the level of the individual paper. This could involve trying to model the latent citation rate for an individual paper based on

Critical Realism
13
particular characteristics such as the reputation of the author, subject of paper, type of paper. Or, it could involve a better specification of the obsolescence function for an individual paper.
5. Conclusions
This paper has considered the stochastic behavior of citations for papers published in the management science literature. The sample of data consisted of all the papers published in 1990 in six well-respected journals. The main conclusions are as follows:
• The distributions of the overall number of citations per paper varied considerably between journals with means ranging from 7 to 38. More unexpectedly, there were significant proportions of papers in all journals which had never been cited at all (from 5% to 22%) clearly raising issues about the contribution of such papers. At the other extreme, it was surprising that many papers were still being regularly cited fifteen years since publication (85% in Management Science).
• The distribution of citations for a collection of papers (i.e., each different journal) could be fitted by the negative binomial and this supports the view that the underlying data generating mechanism can be modeled by a gamma mixture of Poisson processes. From the calculated negative binomial parameters we can estimate the latent gamma distribution.
• The next stage was to incorporate the idea of obsolescence, i.e, that the rate of citations for a paper (and thus the parameter of the Poisson generating process) changes over time. An arbitrary obsolescence function was incorporated into the gamma-Poisson model, the particular form needing to be estimated empirically.
• This model was then used to consider the predictability of citations through the additional citations distributions. Given that a paper had received r citations by time t, how many more could it expect? The resulting distribution demonstrated the interesting properties that future citations were a linear function of the number of past citations, and that the slope of this line, the citation increment, decreases over the life cycle of the paper. Empirical results supported both of these conclusions, and provided useful information about the worth of each journal.
• Since the change in slope was dependent on the form of the assumed obsolescence function, it was possible from the empirical data to evaluate different possible functional forms. There was no clear result from this but there was some evidence that the best fitting function depended on the journal’s mean citation rate.
• In terms of practical predictability of future citations for a particular paper, the variances and therefore confidence limits were very large as might be expected given that the only information used is the publishing journal.
There are several avenues of further research that can be explored: i) analyzing an older
sample of data to give longer citation lives, perhaps back to the start if ISI data in 1981. ii) Considering the obsolescence functions in more detail – especially whether the same function can be assumed for all the papers within a collection or whether they need to be estimated individually. iii) Bringing in other factors such as the reputation of the author, the type of article, or the subject of the paper to better predict future citations.

Critical Realism
14
*JORS Omega EJOR DecSci OpsRs ManSci Actual mean 7.333 7.196 11.267 11.141 14.661 38.553 Actual sd 17.872 15.544 19.000 14.042 28.558 42.439 n 123 51 202 43 112 85 % zero cites 18 22 14 12 10 5 Max cites 176 87 140 66 277 181
Fitted negative binomial parameters k 0.704 0.481 0.602 0.739 0.710 0.890 p 0.106 0.063 0.051 0.062 0.046 0.023 Chi-Square p 0.192 0.07 0.48 0.47 0.34 0.48
Calculated negative binomial moments mean 5.938 7.196 11.267 11.139 14.661 38.553 var 56.014 114.944 222.136 179.066 317.440 1709.519 sd 7.484 10.721 14.904 13.382 17.817 41.346 sd/mean 1.261 1.490 1.323 1.201 1.215 1.072
Gamma parameters ? 0.704 0.481 0.602 0.739 0.710 0.890 a 0.119 0.067 0.053 0.066 0.048 0.023
Table 1 Empirical and Fitted parameters * Note that the actual parameters are from the original data, the fitted parameters are with
the extreme value (176) excluded.

Critical Realism
15
Fre
qu
en
cy28024020016012080400
150
100
50
0
28024020016012080400
150
100
50
028024020016012080400
JORS2 OPSRES2 EJOR2
MANSCI2 DECSCI2 OMEGA2
Histogram of JORS2, OPSRES2, EJOR2, MANSCI2, DECSCI2, OMEGA2
Figure 1 Histograms of the Distributions of Citations

Critical Realism
16
C(t)
Cites (r) 0.1 0.2 0.3 0.4 0.5 0.6 0.7 0.8 0.9 0 6.5 3.2 1.9 1.3 0.9 0.6 0.4 0.2 0.1 1 13.8 6.8 4.1 2.7 1.8 1.2 0.8 0.5 0.2 2 21.1 10.4 6.3 4.1 2.8 1.9 1.2 0.7 0.3 3 28.5 14.0 8.4 5.5 3.7 2.5 1.6 0.9 0.4 4 35.8 17.5 10.6 6.9 4.7 3.1 2.0 1.2 0.5 5 43.1 21.1 12.8 8.4 5.6 3.8 2.4 1.4 0.6 6 50.4 24.7 14.9 9.8 6.6 4.4 2.9 1.7 0.7 7 57.7 28.3 17.1 11.2 7.5 5.1 3.3 1.9 0.9 8 65.0 31.9 19.3 12.6 8.5 5.7 3.7 2.2 1.0 9 72.4 35.5 21.4 14.0 9.5 6.3 4.1 2.4 1.1
10 79.7 39.1 23.6 15.4 10.4 7.0 4.5 2.6 1.2 11 87.0 42.7 25.8 16.9 11.4 7.6 4.9 2.9 1.3 12 94.3 46.2 27.9 18.3 12.3 8.3 5.3 3.1 1.4 13 101.6 49.8 30.1 19.7 13.3 8.9 5.8 3.4 1.5 14 109.0 53.4 32.3 21.1 14.2 9.6 6.2 3.6 1.6 15 116.3 57.0 34.4 22.5 15.2 10.2 6.6 3.9 1.7 16 123.6 60.6 36.6 24.0 16.1 10.8 7.0 4.1 1.8 17 130.9 64.2 38.8 25.4 17.1 11.5 7.4 4.3 1.9 18 138.2 67.8 40.9 26.8 18.1 12.1 7.8 4.6 2.0 19 145.5 71.4 43.1 28.2 19.0 12.8 8.3 4.8 2.2 20 152.9 74.9 45.3 29.6 20.0 13.4 8.7 5.1 2.3
Slope 7.3 3.6 2.2 1.4 1.0 0.6 0.4 0.2 0.1
Table 2 Expected Number of Additional Citations given r Cites by Time t for values of
C(t) for Management Science
Critical Realism
17
Mean Additional Citations for Values of C(t)
0.0
20.0
40.0
60.080.0
100.0
120.0
140.0
160.0
180.0
1 3 5 7 9 11 13 15 17 19 21
r (citations by time t)
E[Y
]
0.1
0.2
0.3
0.4
0.5
0.6
0.7
0.8
0.9
Figure 2 Expected Number of Additional Citations given r Citations by Time t for Values
of C(t)

Critical Realism
18
JORS Omega EJOR DecSci OpsRs ManSci ? 0.704 0.481 0.300 0.739 0.710 0.890 a 0.119 0.067 0.200 0.066 0.048 0.023
C(t) 0.1 intercept 2.90 2.59 0.90 4.00 4.30 6.50 slope 4.12 5.40 3.00 5.41 6.06 7.31
C(t) 0.30 intercept 1.18 0.92 0.42 1.41 1.43 1.93 slope 1.67 1.91 1.40 1.91 2.01 2.17
C(t) 0.50 intercept 0.57 0.42 0.21 0.65 0.65 0.85 slope 0.81 0.88 0.71 0.88 0.91 0.96
Table 3 Theoretical Regression Parameters based on Values of C(t) for Different Journals

Critical Realism
19
0
1
2
3
4
5
6
0 5 10 15
Time
Reg
ress
ion
slop
e
Gamma(0.2, 2)
Gamma(0.8,6)
Figure 3 Declining regression slope by period based on different obsolescence functions
(theoretical) to be compared with Figure 5
Critical Realism
20
483624120
60
45
30
15
0
483624120
60
45
30
15
0
4+*3 7+*6
10+*9 13+*12
Scatterplot of 4+ vs 3, 7+ vs 6, 10+ vs 9, 13+ vs 12
Figure 4 Regressions for JORS showing additional citations against past citations for years
3, 6, 9 and 12.

Critical Realism
21
t *OpsRes ManSci DecSci EJOR *JORS Omega 1 16.70 21.43 7.36 11.65 5.53 -1.19 2 10.40 6.73 6.62 8.13 3.81 2.28 3 5.80 4.06 4.66 6.3 1.58 5.615 4 3.35 2.45 2.68 4.24 1.18 4.35 5 2.30 1.7 2.11 2.75 1.11 3.36 6 1.35 1.29 1.3 1.72 0.941 2 7 0.95 0.99 0.74 1.16 0.612 1.32 8 0.70 0.72 0.55 0.826 0.538 1.09 9 0.50 0.57 0.46 0.555 0.397 0.666
10 0.37 0.44 0.37 0.384 0.316 0.49 11 0.24 0.31 0.23 0.253 0.205 0.3 12 0.13 0.19 0.14 0.152 0.143 0.133 13 0.08 0.1 0.07 0.085 0.086 0.052
Table 4 Slope coefficients for each journal by period of citation *Note that an extreme value was removed from both OpsRes and JORS as they were
distorting the regression

Critical Realism
22
-5.00
0.00
5.00
10.00
15.00
20.00
25.00
0 5 10 15
Period
Slo
pe
OpsRes
ManSci
DecSci
EJOR
JORS
Omega
Figure 5 Declining slope coefficients for each journal by period of citation

Critical Realism
23
Gamma (f)
Weibull (e)
SPSS s-curve (a)
Gompertz (d)
von Bert. (c)
SPSS logistic (b) Total
ManSci 280.00 376.00 401.00 602.00 311.00 1445.00 4860.00 OpsRes 44.49 24.31 230.70 117.82 65.40 530.20 1543.13 EJOR 88.20 50.73 435.92 60.07 106.88 84.06 909.92 JORS 80.00 84.85 71.22 105.68 85.62 190.03 807.43 *Omega 16.85 20.86 11.98 17.18 610.11 17.49 711.96 DecSci 77.31 113.18 19.75 91.84 77.29 83.30 545.97 Total 586.86 669.93 1170.56 994.60 1256.29 2350.08
Table 5 Sum of Squares for various obsolescence functions (multiplied by 100) *Omega was fitted ignoring the first two periods – see text

Critical Realism
24
? a
ManSci 2.49 0.37 OpsRes 3.31 0.40 EJOR 3.07 0.18 JORS 1.98 0.26 Omega 2.88 0.24 DecSci 2.45 0.18
Table 6 Values of the gamma parameters for the obsolescence functions in Table 5

t Regress
s Calcul-ated s Values of r – the number of citations by time t
0 1 2 3 4 5 6 7 8 9 10 1 8.40 6.57 5.87 9.14 11.51 13.47 15.18 16.72 18.12 19.43 20.65 21.81 22.90 2 7.12 5.22 3.85 5.99 7.54 8.83 9.95 10.96 11.88 12.74 13.54 14.29 15.01 3 6.90 4.17 2.59 4.03 5.08 5.95 6.70 7.38 8.00 8.58 9.12 9.63 10.11 4 6.55 3.42 1.86 2.89 3.64 4.26 4.80 5.28 5.72 6.14 6.52 6.89 7.23 5 5.48 2.87 1.40 2.18 2.74 3.21 3.62 3.98 4.32 4.63 4.92 5.19 5.46 6 4.62 2.44 1.10 1.71 2.15 2.52 2.84 3.13 3.39 3.63 3.86 4.08 4.28 7 3.94 2.11 0.89 1.38 1.74 2.04 2.30 2.53 2.74 2.94 3.12 3.30 3.47 8 3.66 1.84 0.74 1.14 1.44 1.69 1.90 2.09 2.27 2.43 2.59 2.73 2.87 9 2.45 1.61 0.62 0.96 1.21 1.42 1.60 1.76 1.91 2.05 2.18 2.30 2.42
10 1.92 1.42 0.53 0.82 1.04 1.21 1.37 1.51 1.63 1.75 1.86 1.96 2.06 11 1.59 1.26 0.46 0.71 0.89 1.05 1.18 1.30 1.41 1.51 1.60 1.69 1.78 12 1.14 1.12 0.40 0.62 0.78 0.91 1.02 1.13 1.22 1.31 1.39 1.47 1.55 13 0.80 0.99 0.35 0.54 0.68 0.80 0.90 0.99 1.07 1.15 1.22 1.29 1.35
Table 7 Theoretical values of the standard deviation of additional citations for each time period (t) according to the number of citations by then (r) for
JORS. Cross-referenced to the empirical standard deviation from the regressions.
Critical Realism
26
Baden-Fuller, C., F. Ravazzolo and T. Schweizer 2000. Making and measuring reputations - The research ranking of European business schools, Long Range Planning, 33, 5 621-650. Beasley, J. 1990. OR-library: distributing test problems by electronic mail, J. Operational Research Society, 41, 11 1069-1072. Burrell, Q. 1980. A simple stochastic model for library loans, J. of Documentation, 36, 115-132. Burrell, Q. 1988. Predictive aspects of some bibliometric processes, In L. Egghe and R. Rousseau (Ed.), Infometrics 87/88, Elsevier, Amsterdam, 43-63. Burrell, Q. 1990. Using the gamma-Poisson model to predict library circulation, J. American Society for Information Science, 41, 164-170. Burrell, Q. 2001. Stochastic modelling of the first-citation distribution, Scientometrics, 52, 1 3-12. Burrell, Q. 2002. The nth-citation distribution and obsolescence, Scientometrics, 53, 3 309-323. Burrell, Q. 2003. Predicting future citation behaviour, J. American Society for Information Science, 54, 5 372-378. Burrell, Q. 2006. Are "sleeping beauties" to be expected?, Scientometrics, 65, 3 DuBois, F. L. and D. Reeb 2000. Ranking the international business journals, Journal of International Business Studies, 31, 4 689-704. Egghe, L. 2000. A heuristic study of the first citation distribution, Scientometrics, 48, 345-359. Fisher, M. 1981. The Lagrangian-relaxation method for solving integer-programming problems, Management Science, 27, 1 1-18. Glänzel, W. and H. Moed 2002. Journal impact measures in bibliometric research, Scientometrics, 53, 2 171-193. Glänzel, W. and U. Schoepflin 1995. A bibliometric study of ageing and reception processes of scientific literature, J. Information Science, 21, 37-53. Greenwood, M. and G. Yule 1920. An enquire into the nature of frequency distributions representative of multiple happenings with particular reference to the occurrence of multiple attacks of disease or repeated accidents, J. Royal Statistical Society A, 83, 255-279 Harzing, A-W 2005. Journal Quality List, 2005, January Jennings, C. 1998. Citation data: the wrong impact?, Nature Neuroscience, 1, 8 641-642.
Critical Realism
27
Johnson, N., S. Kotz and A. Kemp 1993. Univariate Discrete Distributions, Wiley, New York. Makridakis, S., S. Wheelwright and V. McGee 1983. Forecasting: Methods and Applications, New York, Wiley. Meade, N. and T. Islam 1998. Technological forecasting - model selection, model stability and combining models, Management Science, 44, 8 1115-1130. Merton, R. 1988. The Matthew effectin science II: Cumulative advantage and the symbolism of intellectual property, ISIS, 79, 606-623. Mingers, J. and A.-W. Harzing 2005. Ranking journals in business and management: a statistical analysis of the Harzing dataset, Working Paper 65, Kent Business School, April 2005. Price, D. 1976. A general theory of bibliometric and other cumulative advantage processes, J. Am. Soc. for Information Science, 27, 292-306. Rousseau, R. 1994. Double exponential models for first citation processes, Scientometrics, 30, 213-227. Sichel, H. 1985. A bibliometric distribution which really works, J. American Society for Information Science, 36, 314-321. Tahai, A. and M. Meyer 1999. A revealed preference study of management journals' direct influences, Strategic Management Journal, 20, 279-296. Van Raan, A. 2004. Sleeping beauties in science, Scientometrics, 59, 467-472.

Critical Realism
28
http://www.kent.ac.uk/kbs/research-information/index.htm