Embed Size (px)
Citation preview
Critical Issues: Leading the RTI Process
Syracuse, New YorkNovember 2, 2009
John E. McCook, [email protected]
Copyright© 2009 John E. McCook
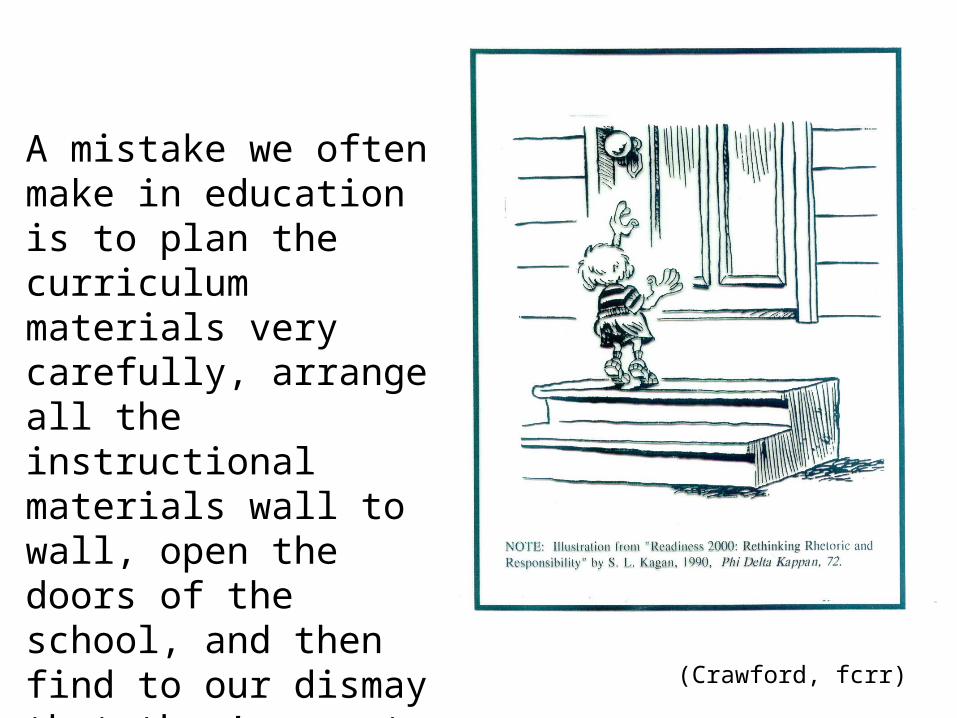
A mistake we often make in education is to plan the curriculum materials very carefully, arrange all the instructional materials wall to wall, open the doors of the school, and then find to our dismay that they’ve sent us the wrong kids.
(Crawford, fcrr)
3
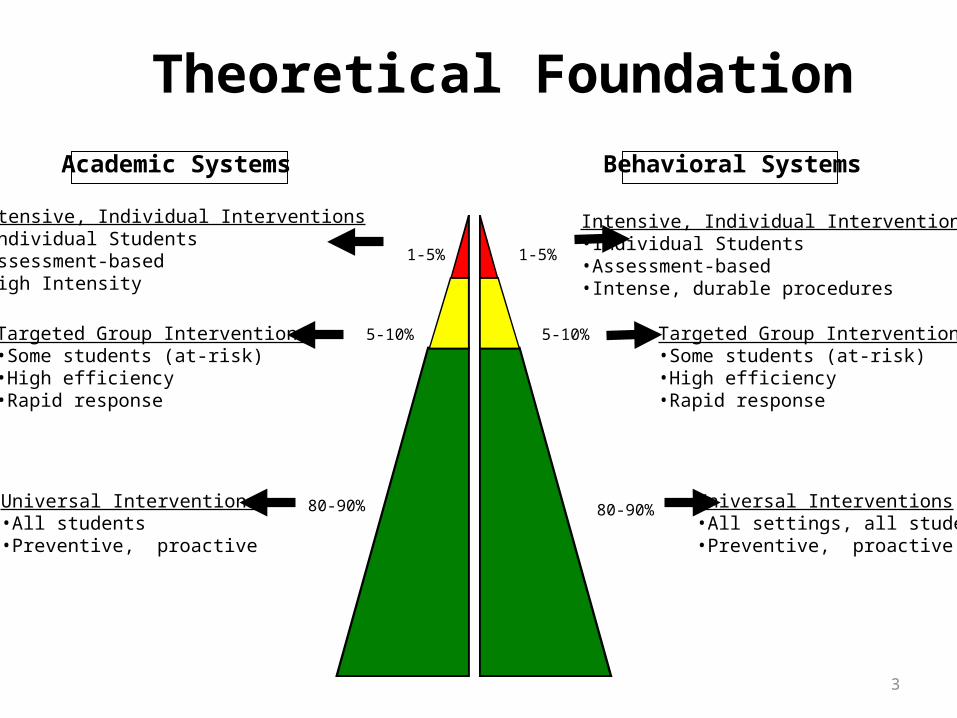
Academic Systems Behavioral Systems
1-5% 1-5%
5-10% 5-10%
80-90% 80-90%
Intensive, Individual Interventions•Individual Students•Assessment-based•High Intensity
Intensive, Individual Interventions•Individual Students•Assessment-based•Intense, durable procedures
Targeted Group Interventions•Some students (at-risk)•High efficiency•Rapid response
Targeted Group Interventions•Some students (at-risk)•High efficiency•Rapid response
Universal Interventions•All students•Preventive, proactive
Universal Interventions•All settings, all students•Preventive, proactive
Theoretical Foundation
4
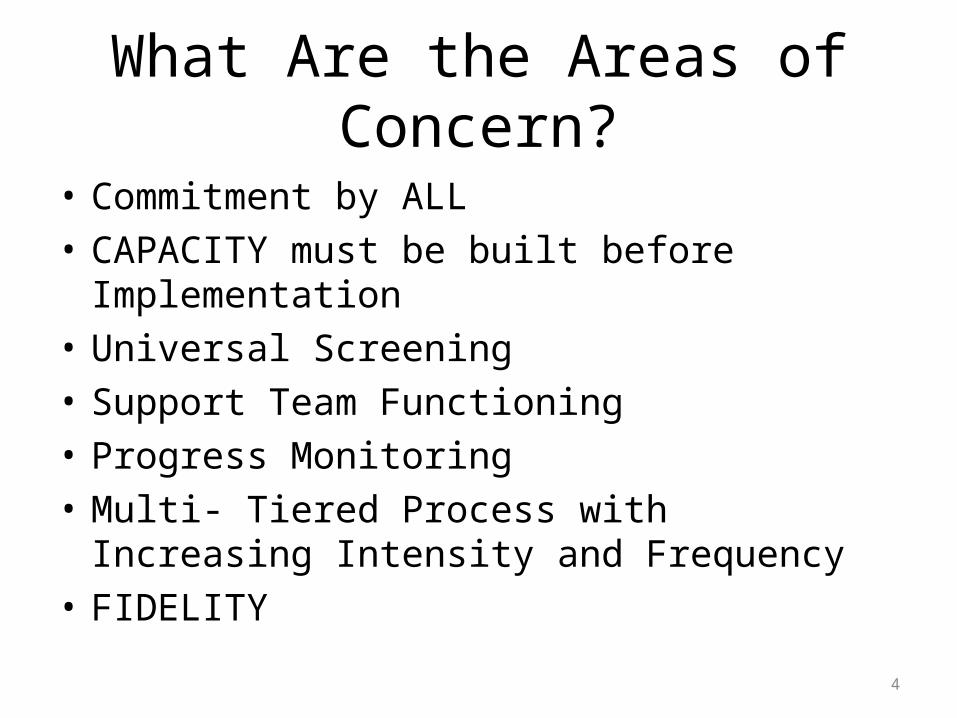
What Are the Areas of Concern?
• Commitment by ALL• CAPACITY must be built before Implementation• Universal Screening• Support Team Functioning• Progress Monitoring• Multi- Tiered Process with Increasing Intensity
and Frequency• FIDELITY
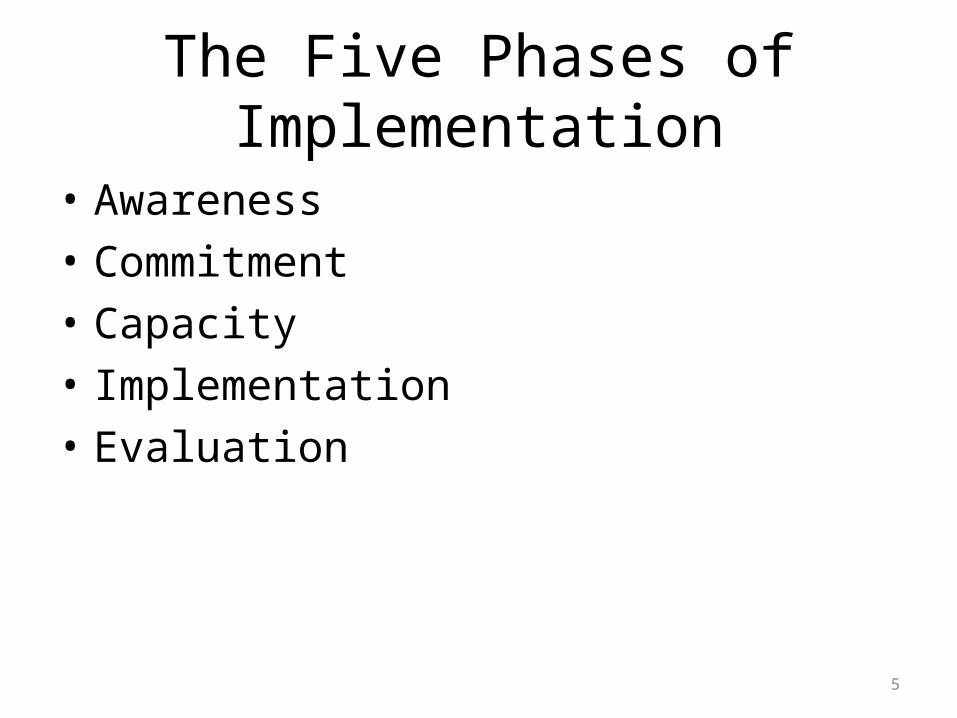
The Five Phases of Implementation
• Awareness• Commitment• Capacity• Implementation• Evaluation
5
6
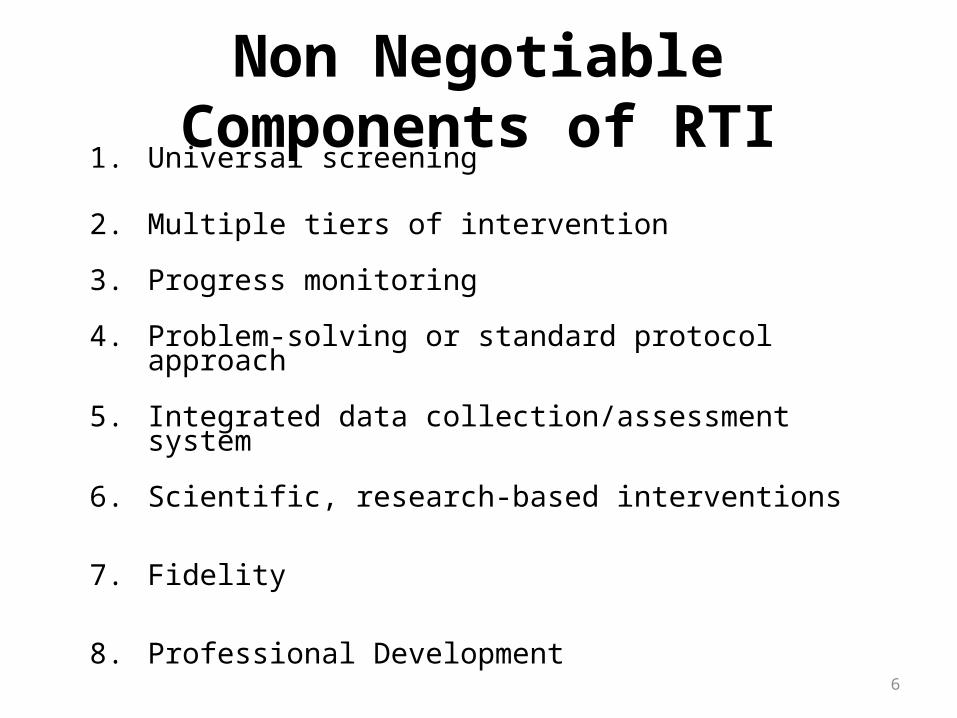
Non Negotiable Components of RTI
1. Universal screening
2. Multiple tiers of intervention
3. Progress monitoring
4. Problem-solving or standard protocol approach
5. Integrated data collection/assessment system
6. Scientific, research-based interventions
7. Fidelity
8. Professional Development
7
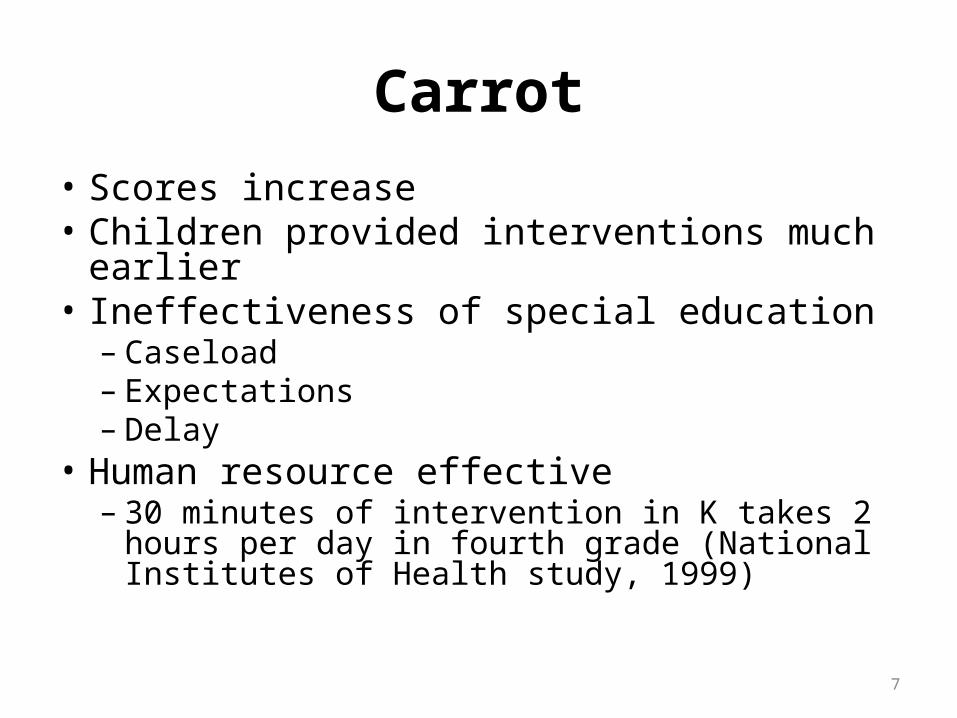
Carrot
• Scores increase• Children provided interventions much earlier• Ineffectiveness of special education
– Caseload– Expectations– Delay
• Human resource effective – 30 minutes of intervention in K takes 2 hours per
day in fourth grade (National Institutes of Health study, 1999)
8
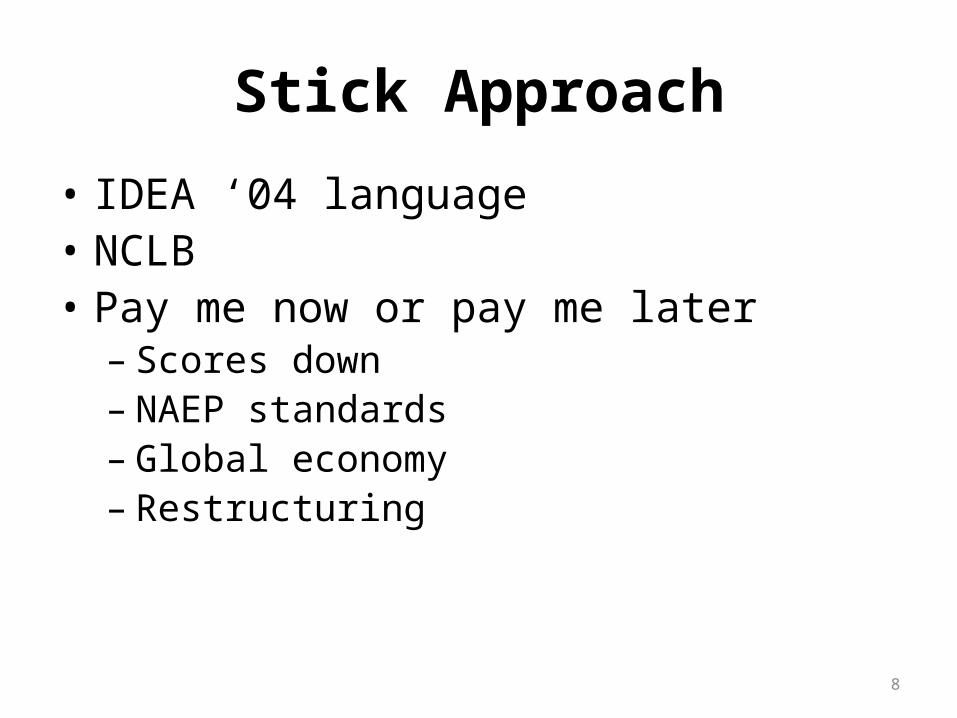
Stick Approach
• IDEA ‘04 language• NCLB• Pay me now or pay me later
– Scores down– NAEP standards– Global economy– Restructuring
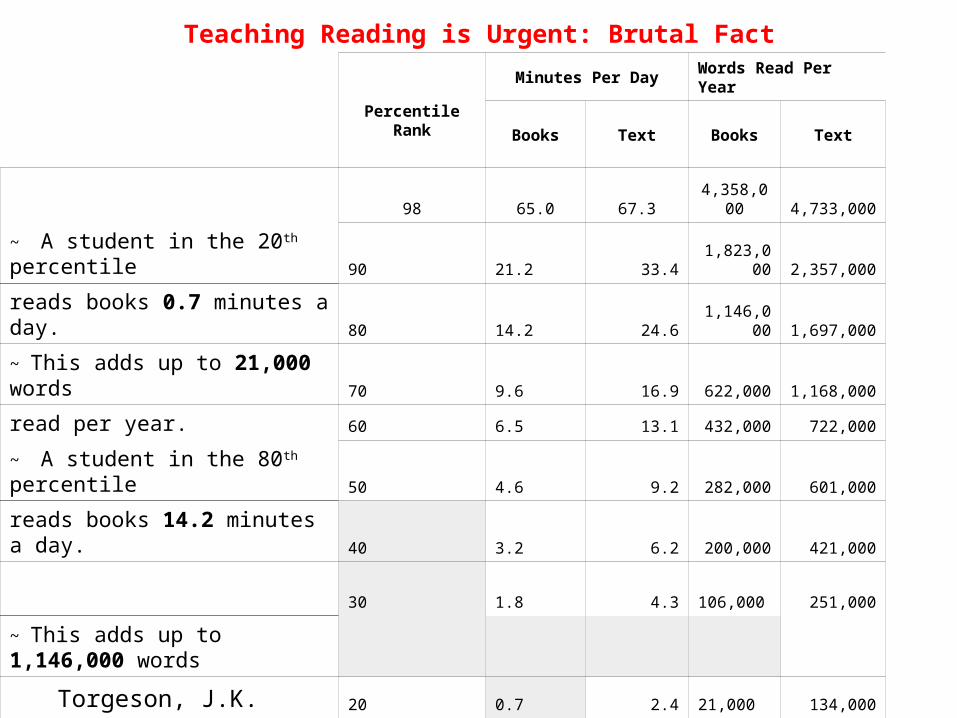
Teaching Reading is Urgent: Brutal Fact
PercentileRank
Minutes Per Day Words Read Per Year
Books Text Books Text
98 65.0 67.3 4,358,000 4,733,000
~ A student in the 20th percentile 90 21.2 33.4 1,823,000 2,357,000
reads books 0.7 minutes a day. 80 14.2 24.6 1,146,000 1,697,000
~ This adds up to 21,000 words 70 9.6 16.9 622,000 1,168,000
read per year. 60 6.5 13.1 432,000 722,000
~ A student in the 80th percentile 50 4.6 9.2 282,000 601,000
reads books 14.2 minutes a day. 40 3.2 6.2 200,000 421,000
30 1.8 4.3 106,000 251,000
~ This adds up to 1,146,000 words
20 0.7 2.4 21,000 134,000
read per year.
10 0.1 1.0 8,000 51,000
2 0 0 0 8,000Torgeson, J.K. 2005
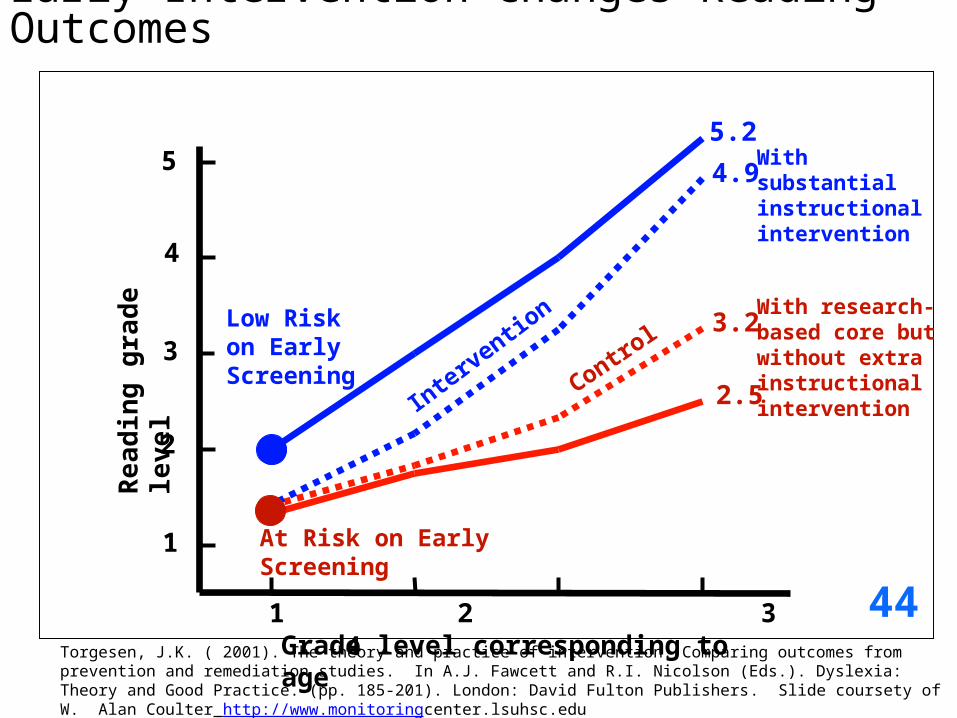
Grade level corresponding to age 1 2 3 4
Read
ing
grad
e le
vel
4
3
2
1
5
2.5
5.2
Early Intervention Changes Reading Outcomes
At Risk on Early Screening
Low Risk on Early Screening
3.2
Control
With research-based core but without extra instructional intervention
4.9
Intervention
With substantial instructional intervention
Torgesen, J.K. ( 2001). The theory and practice of intervention: Comparing outcomes from prevention and remediation studies. In A.J. Fawcett and R.I. Nicolson (Eds.). Dyslexia: Theory and Good Practice. (pp. 185-201). London: David Fulton Publishers. Slide coursety of W. Alan Coulter http://www.monitoringcenter.lsuhsc.edu
44
Why RTI?
• Use information that makes sense to school personnel– Logical– Research based– Discussion is based on school staff experience– Utilize teacher’s daily data as part of the problem solving
method– Is this the best we can do?– "The question is not, Is it possible to educate all children
well? But rather, Do we want to do it badly enough?" D. Meier
Why RTI?
• “The United States is the only country in the industrialized world where children are less likely to graduate from high school than their parents were.” New York Times, page A29, Nicholas D. Kristof, November 13, 2008. (study by Education Trust, advocacy group based in Washington, D.C.) emphasis added
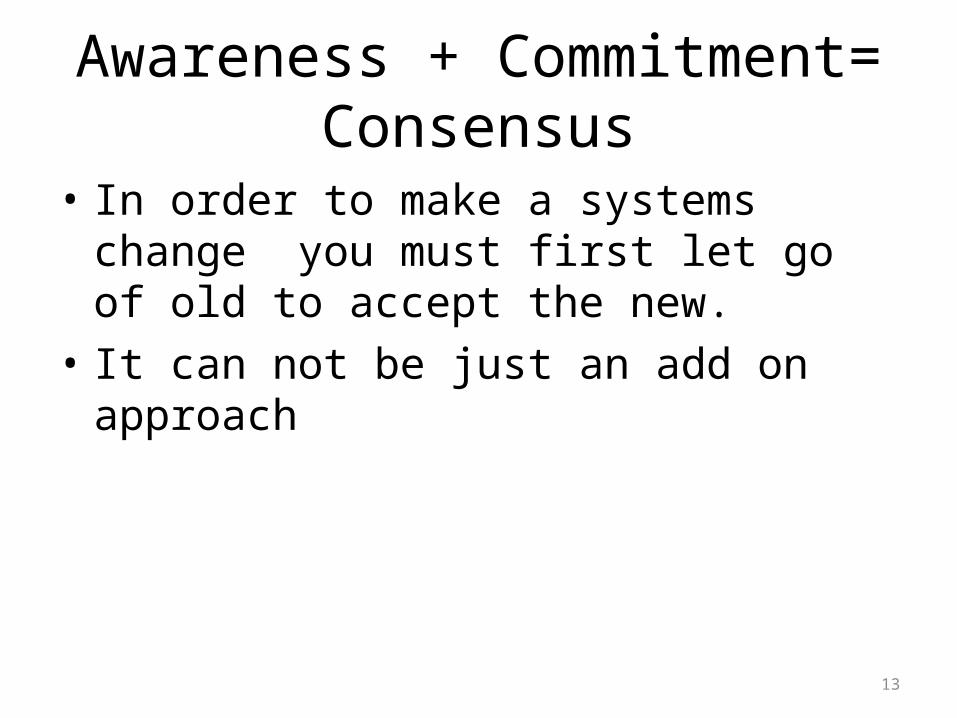
Awareness + Commitment= Consensus
• In order to make a systems change you must first let go of old to accept the new.
• It can not be just an add on approach
13
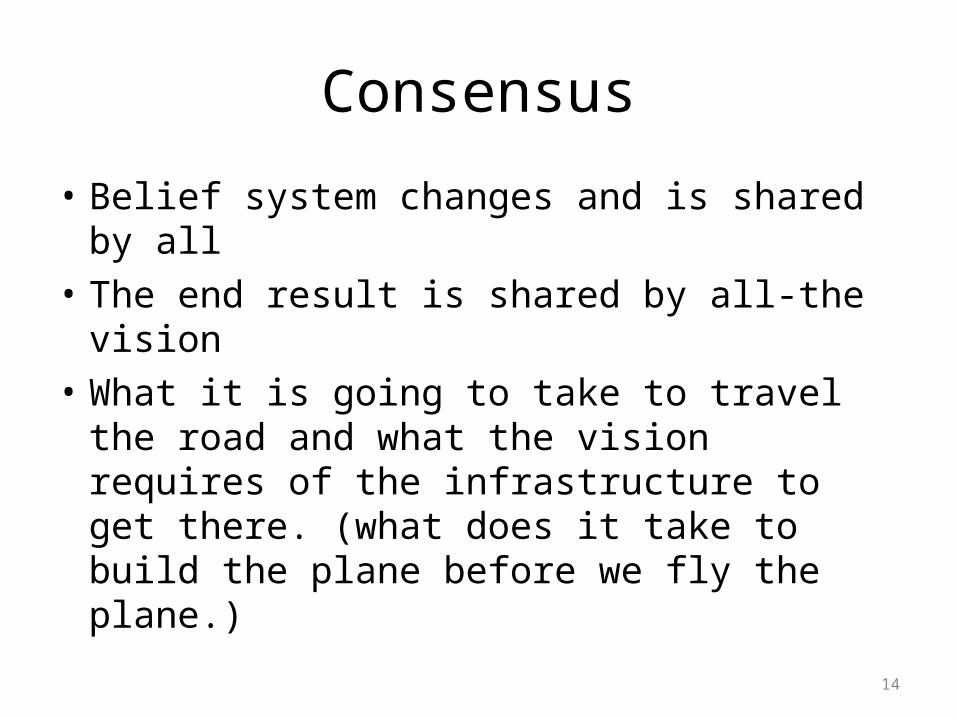
Consensus
• Belief system changes and is shared by all• The end result is shared by all-the vision• What it is going to take to travel the road and
what the vision requires of the infrastructure to get there. (what does it take to build the plane before we fly the plane.)
14
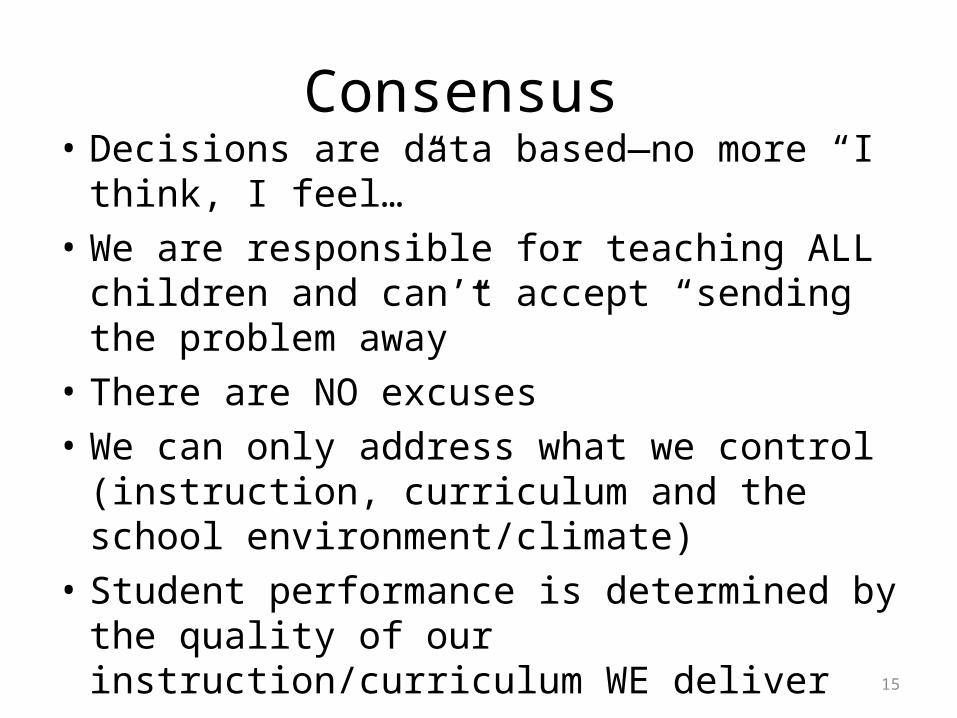
Consensus • Decisions are data based—no more “I think, I
feel…”• We are responsible for teaching ALL children
and can’t accept “sending the problem away”• There are NO excuses• We can only address what we control
(instruction, curriculum and the school environment/climate)
• Student performance is determined by the quality of our instruction/curriculum WE deliver
15
Road to Consensus
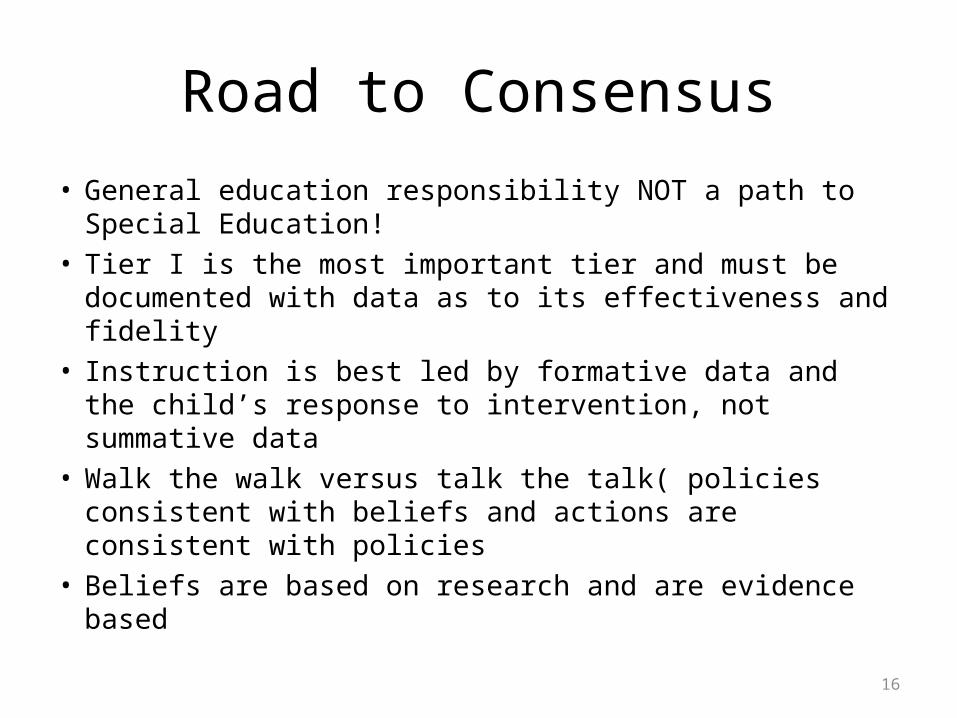
• General education responsibility NOT a path to Special Education!
• Tier I is the most important tier and must be documented with data as to its effectiveness and fidelity
• Instruction is best led by formative data and the child’s response to intervention, not summative data
• Walk the walk versus talk the talk( policies consistent with beliefs and actions are consistent with policies
• Beliefs are based on research and are evidence based16
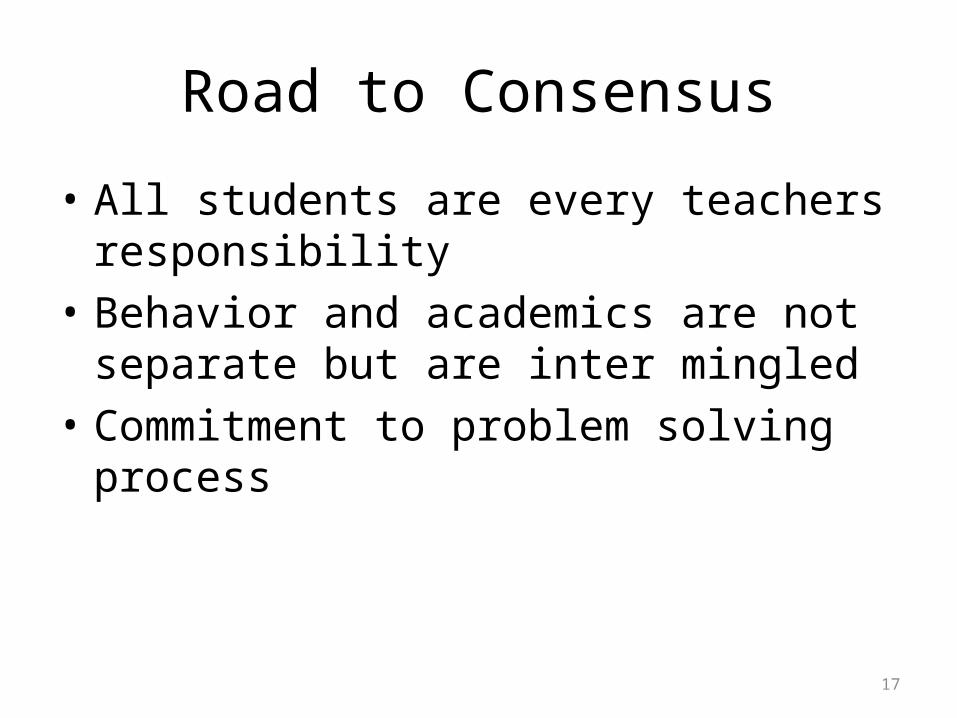
Road to Consensus
• All students are every teachers responsibility• Behavior and academics are not separate but
are inter mingled• Commitment to problem solving process
17

Road to Consensus- Professional Development
• General education classroom must be based on evidence based programs and instruction
• Use of data and data teams (training)• Support processes
18
19
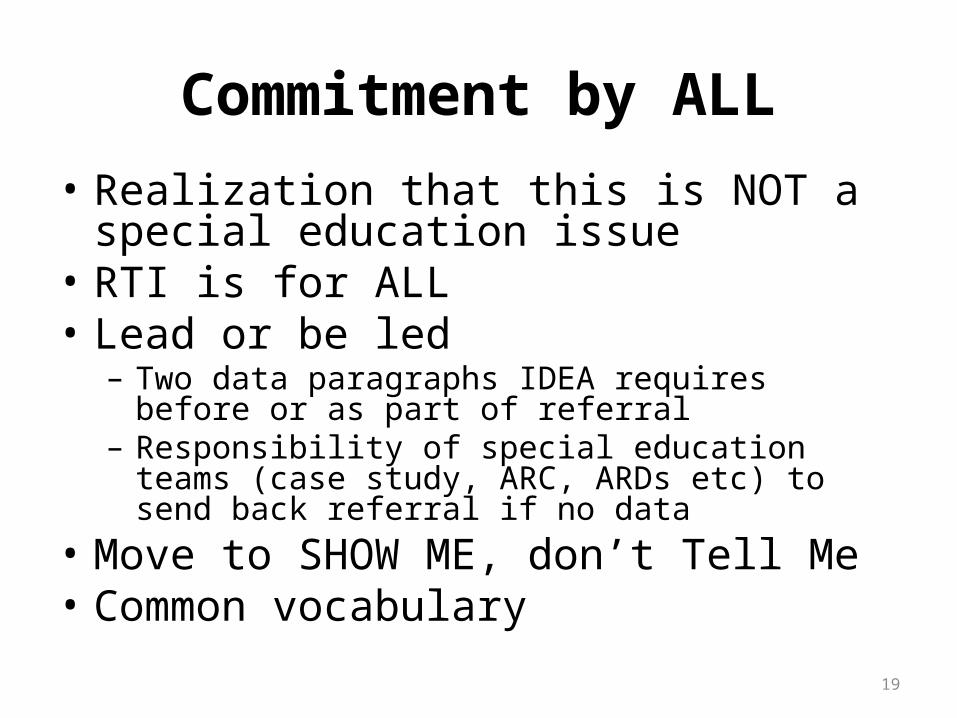
Commitment by ALL• Realization that this is NOT a special education
issue• RTI is for ALL • Lead or be led
– Two data paragraphs IDEA requires before or as part of referral
– Responsibility of special education teams (case study, ARC, ARDs etc) to send back referral if no data
• Move to SHOW ME, don’t Tell Me • Common vocabulary
20
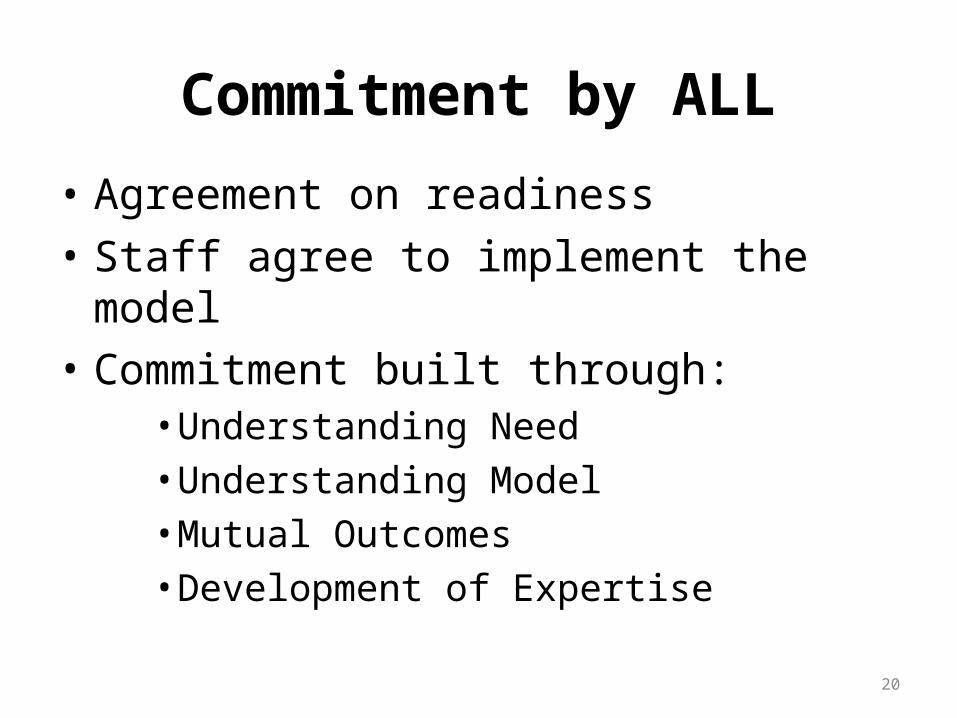
Commitment by ALL
• Agreement on readiness• Staff agree to implement the model• Commitment built through:
• Understanding Need• Understanding Model• Mutual Outcomes• Development of Expertise
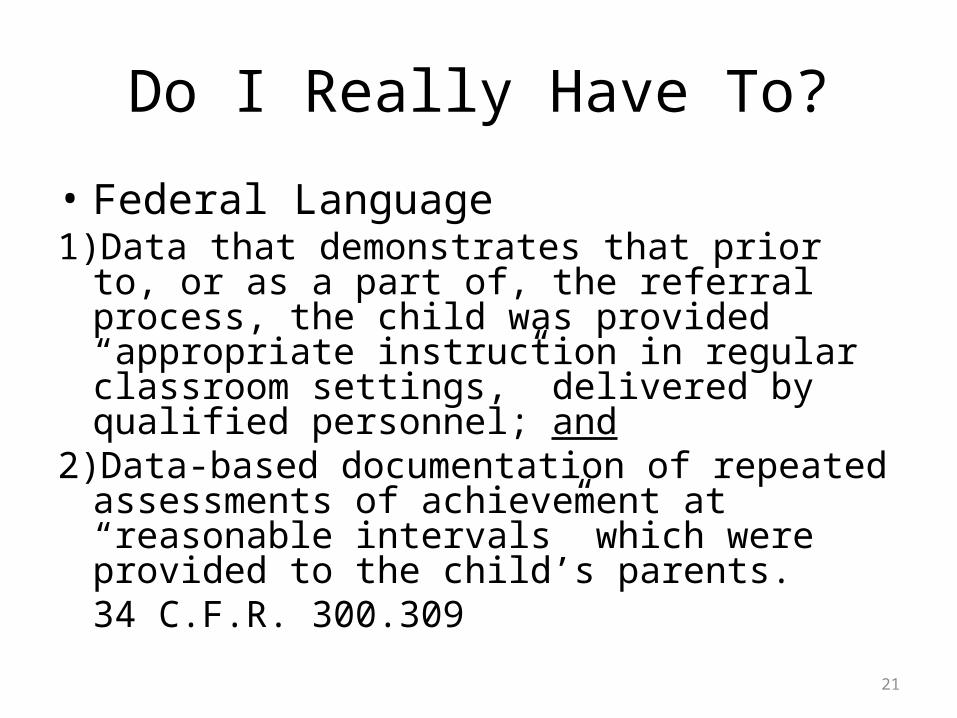
Do I Really Have To?
• Federal Language1) Data that demonstrates that prior to, or as a part of,
the referral process, the child was provided “appropriate instruction in regular classroom settings,” delivered by qualified personnel; and
2) Data-based documentation of repeated assessments of achievement at “reasonable intervals” which were provided to the child’s parents.
34 C.F.R. 300.309
21
22
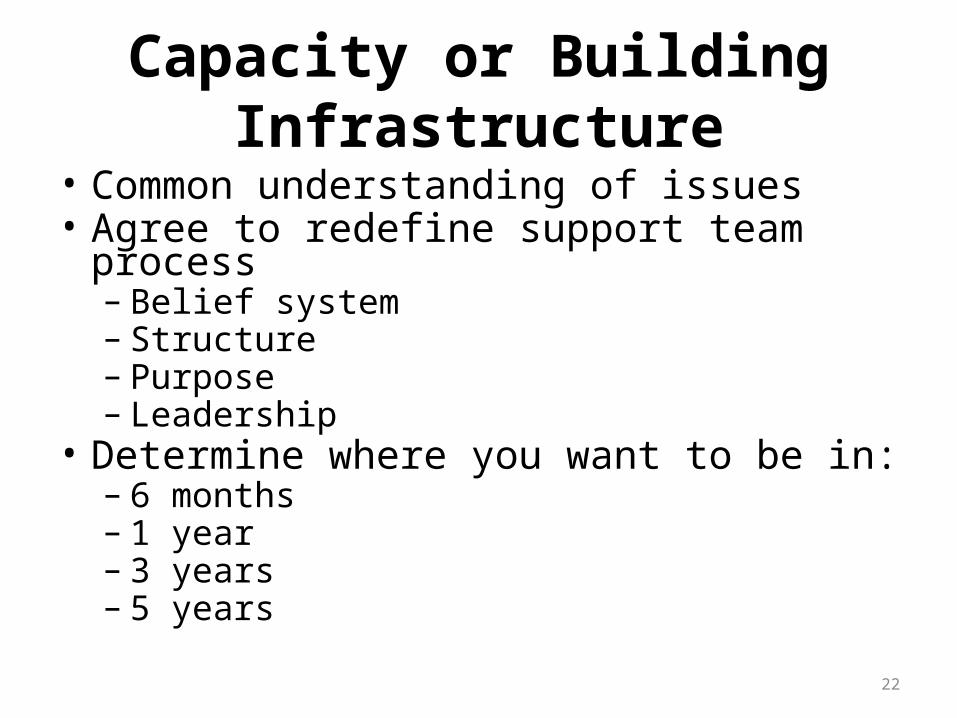
Capacity or Building Infrastructure• Common understanding of issues• Agree to redefine support team process
– Belief system– Structure– Purpose– Leadership
• Determine where you want to be in:– 6 months– 1 year– 3 years – 5 years
23
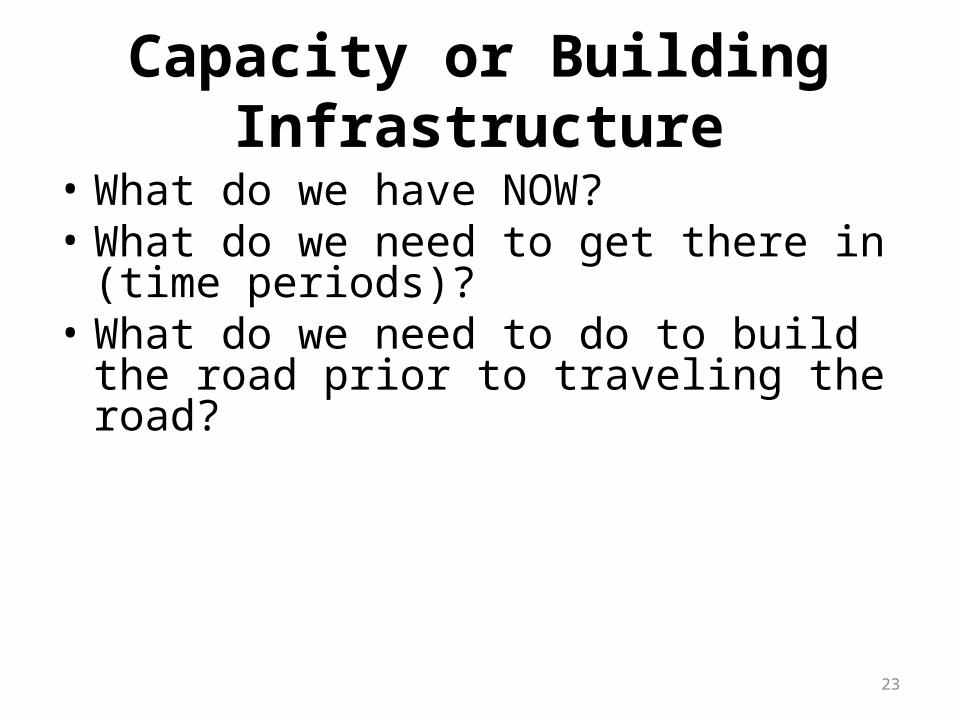
Capacity or Building Infrastructure
• What do we have NOW?• What do we need to get there in (time
periods)?• What do we need to do to build the road prior
to traveling the road?
24
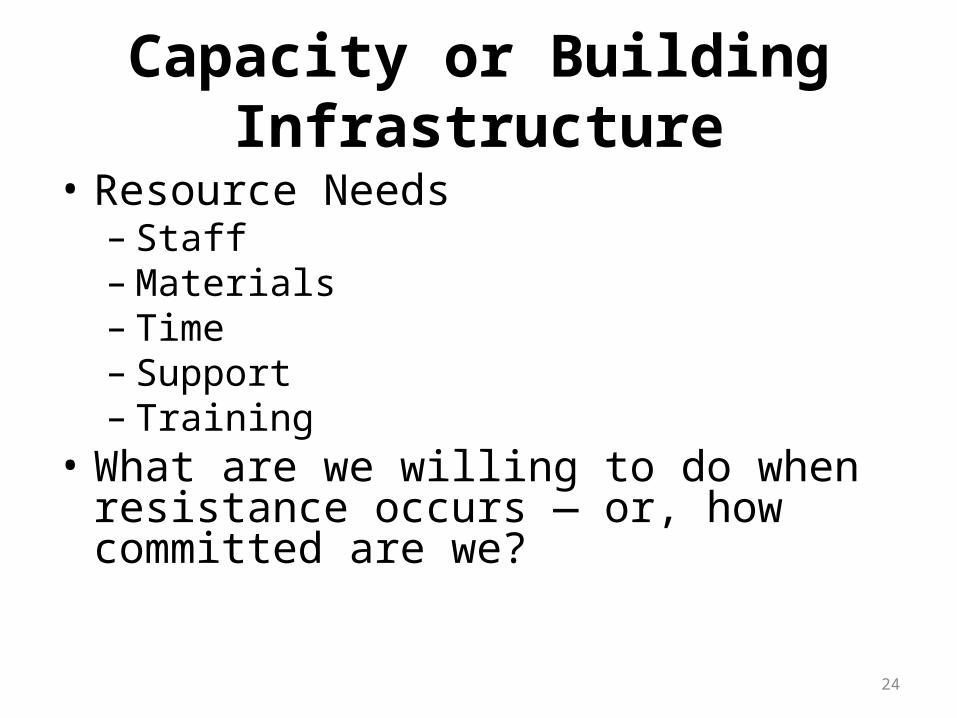
Capacity or Building Infrastructure
• Resource Needs– Staff– Materials– Time– Support– Training
• What are we willing to do when resistance occurs — or, how committed are we?
25
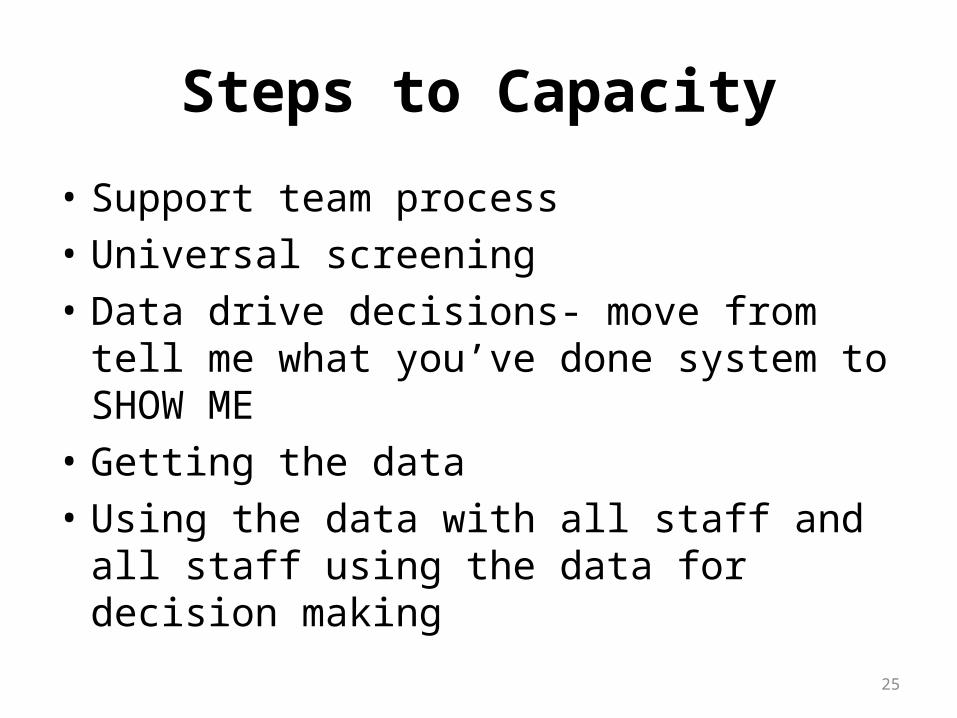
Steps to Capacity
• Support team process• Universal screening• Data drive decisions- move from tell me what
you’ve done system to SHOW ME• Getting the data• Using the data with all staff and all staff using
the data for decision making
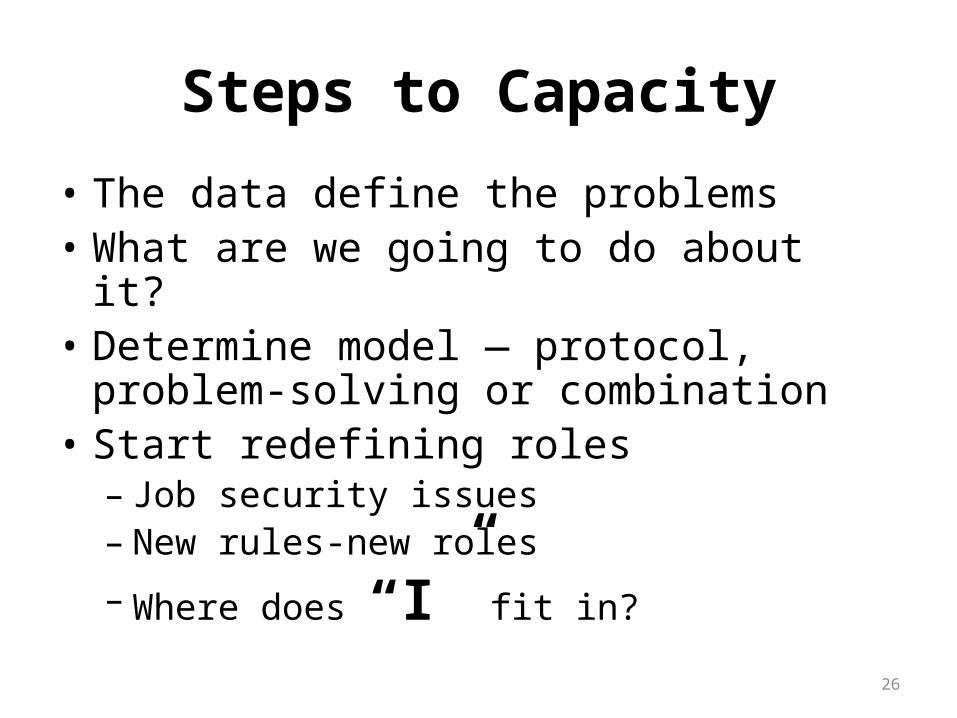
26
Steps to Capacity
• The data define the problems• What are we going to do about it?• Determine model — protocol, problem-
solving or combination• Start redefining roles
– Job security issues– New rules-new roles
– Where does “I” fit in?
27
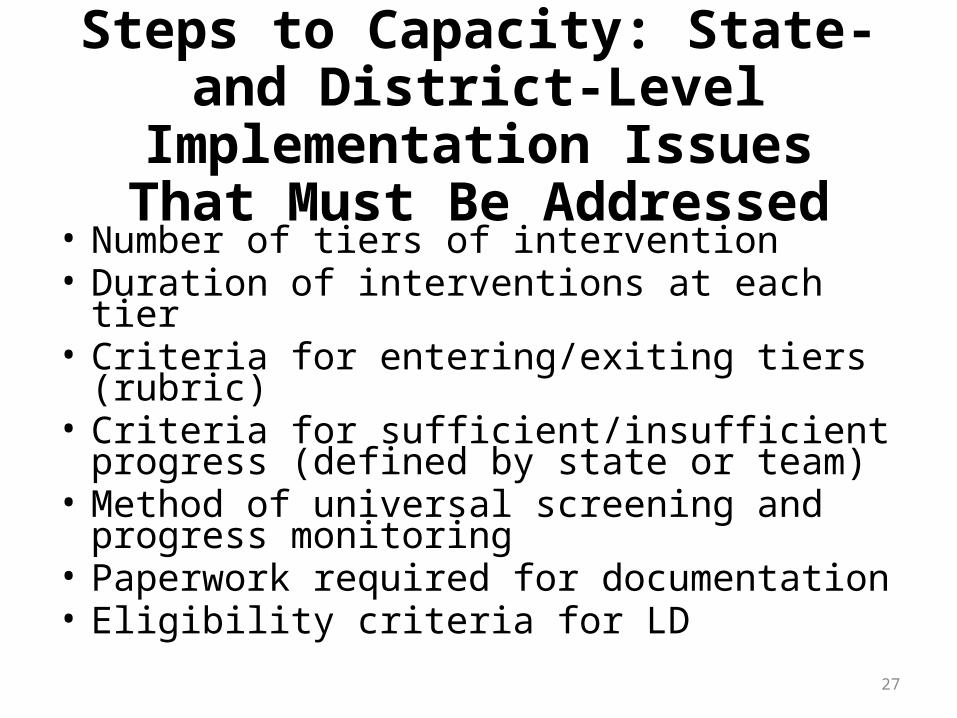
Steps to Capacity: State- and District-Level Implementation Issues
That Must Be Addressed• Number of tiers of intervention• Duration of interventions at each tier• Criteria for entering/exiting tiers (rubric)• Criteria for sufficient/insufficient progress
(defined by state or team)• Method of universal screening and progress
monitoring• Paperwork required for documentation• Eligibility criteria for LD
28
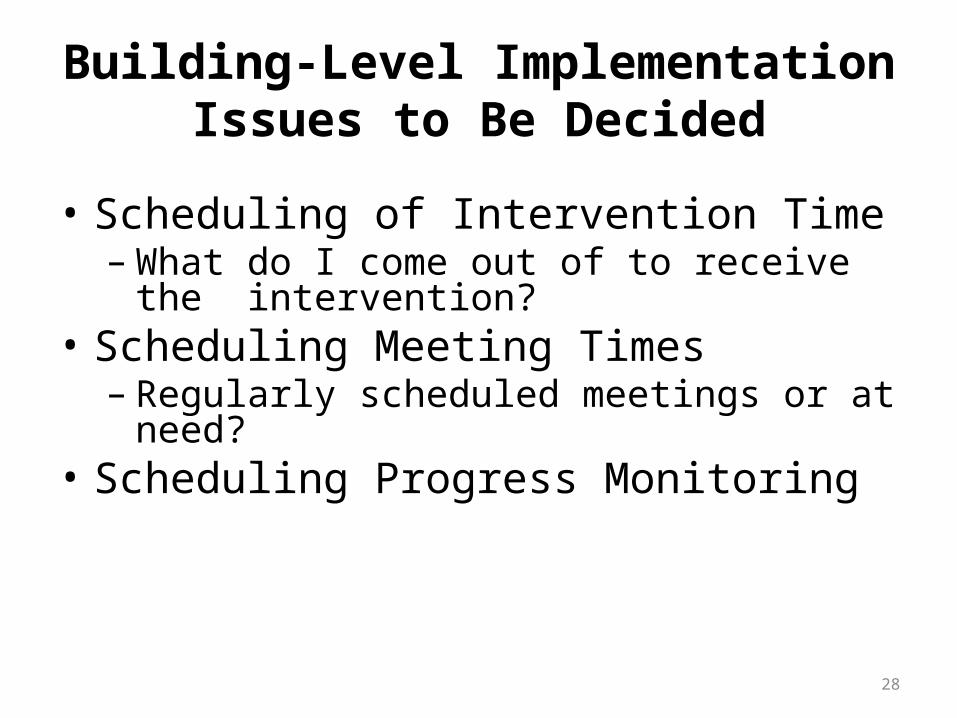
Building-Level Implementation Issues to Be Decided
• Scheduling of Intervention Time– What do I come out of to receive the
intervention?• Scheduling Meeting Times
– Regularly scheduled meetings or at need?• Scheduling Progress Monitoring
29
Building-Level Implementation Issues to Be Decided
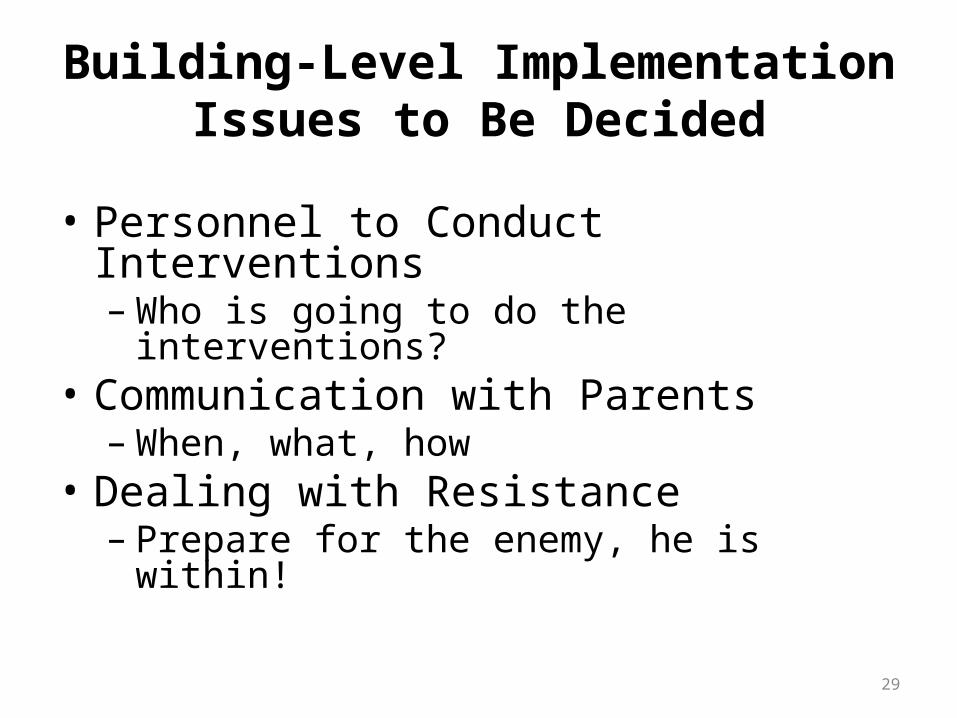
• Personnel to Conduct Interventions– Who is going to do the interventions?
• Communication with Parents– When, what, how
• Dealing with Resistance– Prepare for the enemy, he is within!
30
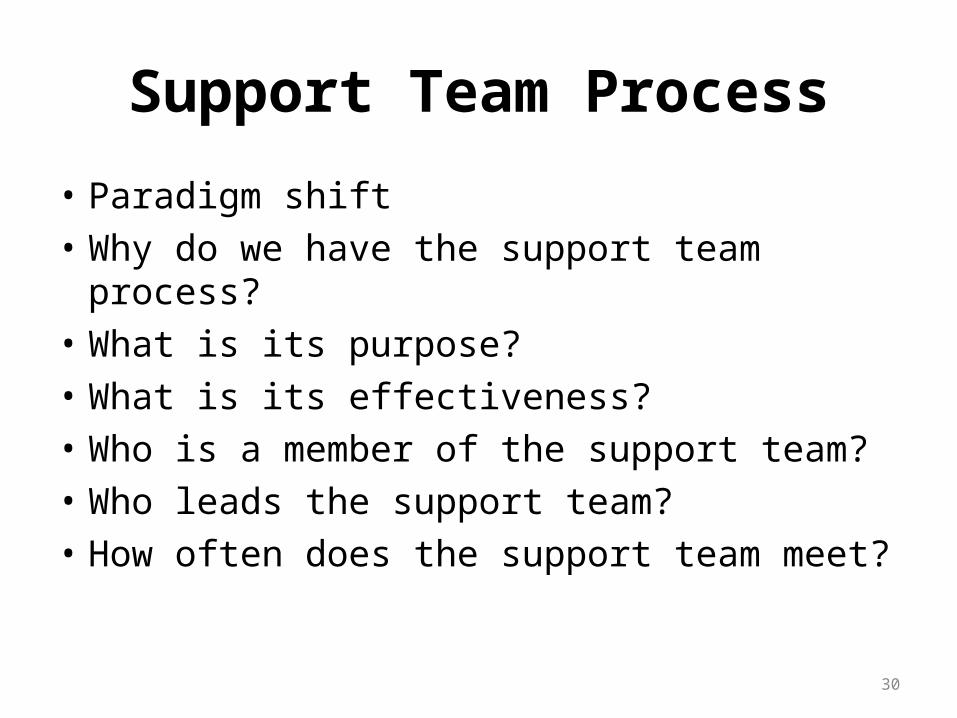
Support Team Process
• Paradigm shift• Why do we have the support team process?• What is its purpose?• What is its effectiveness?• Who is a member of the support team?• Who leads the support team?• How often does the support team meet?
31
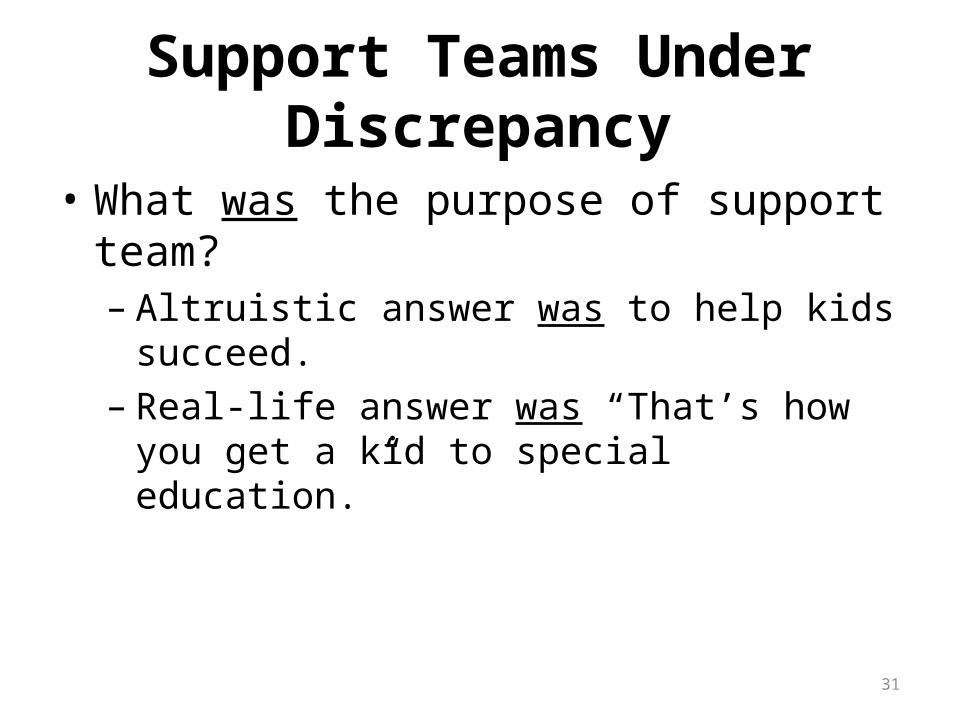
Support Teams Under Discrepancy
• What was the purpose of support team?– Altruistic answer was to help kids succeed.– Real-life answer was “That’s how you get a kid to
special education.”
32
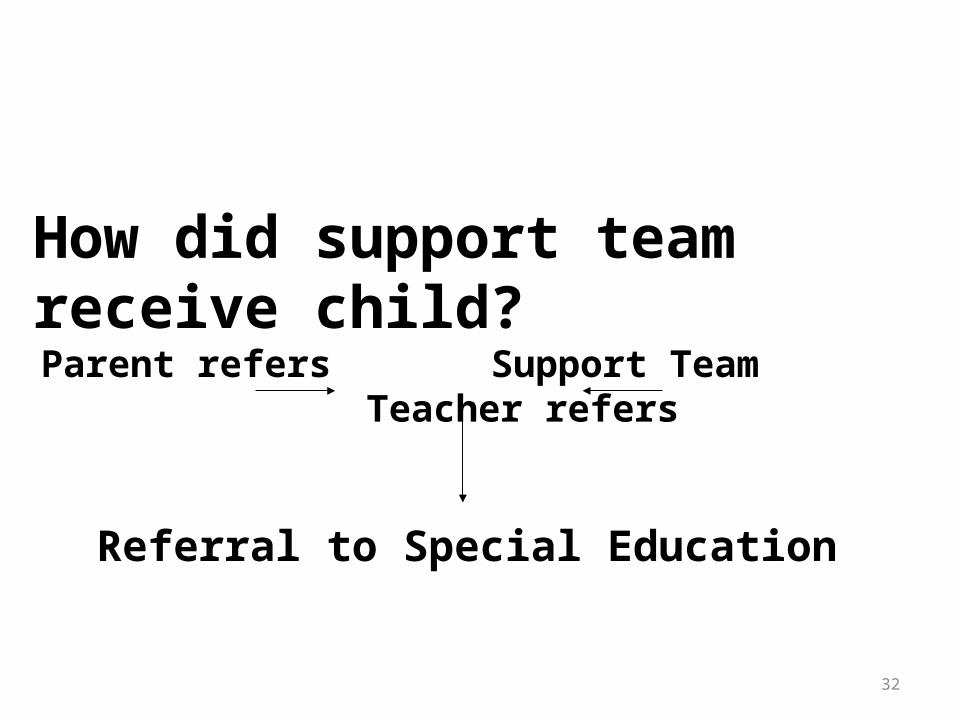
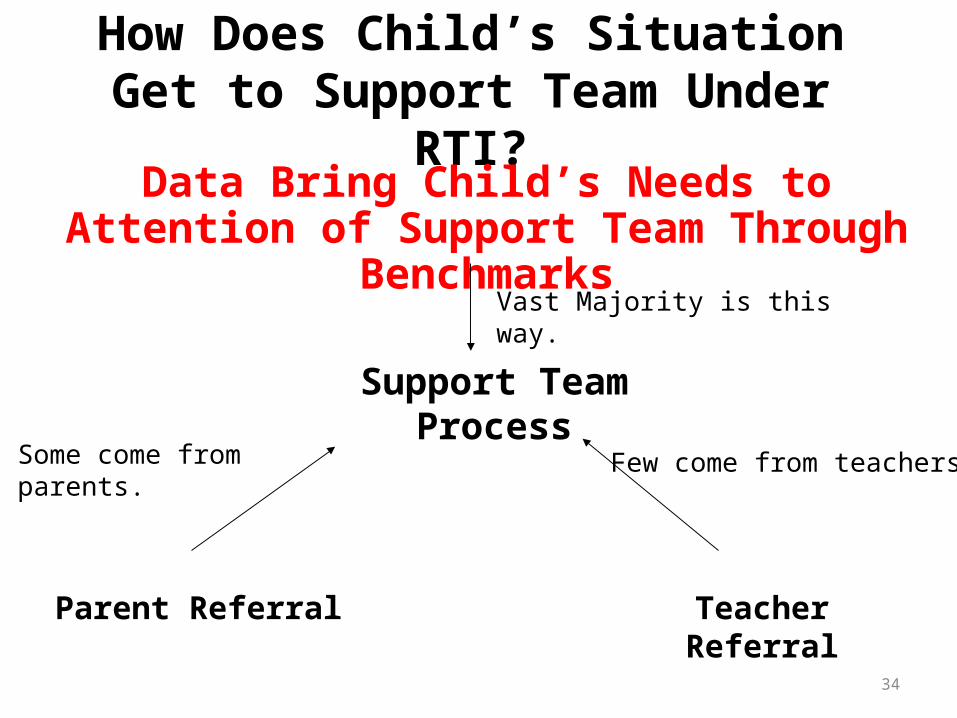
Parent refers Support Team Teacher refers
Referral to Special Education
How did support team receive child?
33
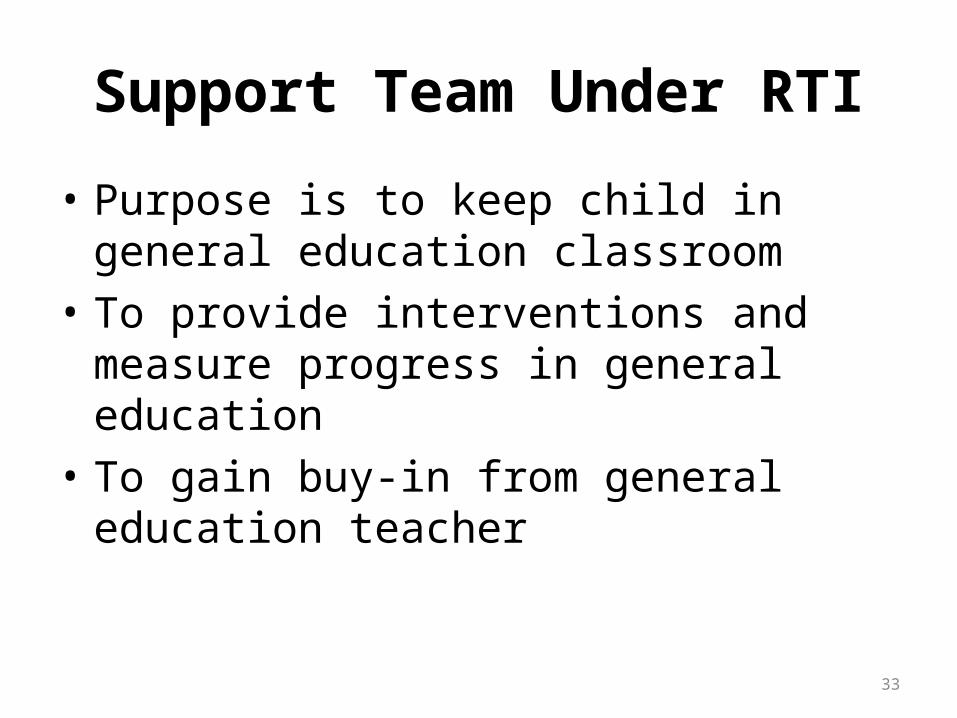
Support Team Under RTI
• Purpose is to keep child in general education classroom
• To provide interventions and measure progress in general education
• To gain buy-in from general education teacher
34
How Does Child’s Situation Get to Support Team Under RTI?
Data Bring Child’s Needs to Attention of Support Team Through Benchmarks
Support Team Process
Parent Referral Teacher Referral
Vast Majority is this way.
Few come from teachers.Some come from parents.
35
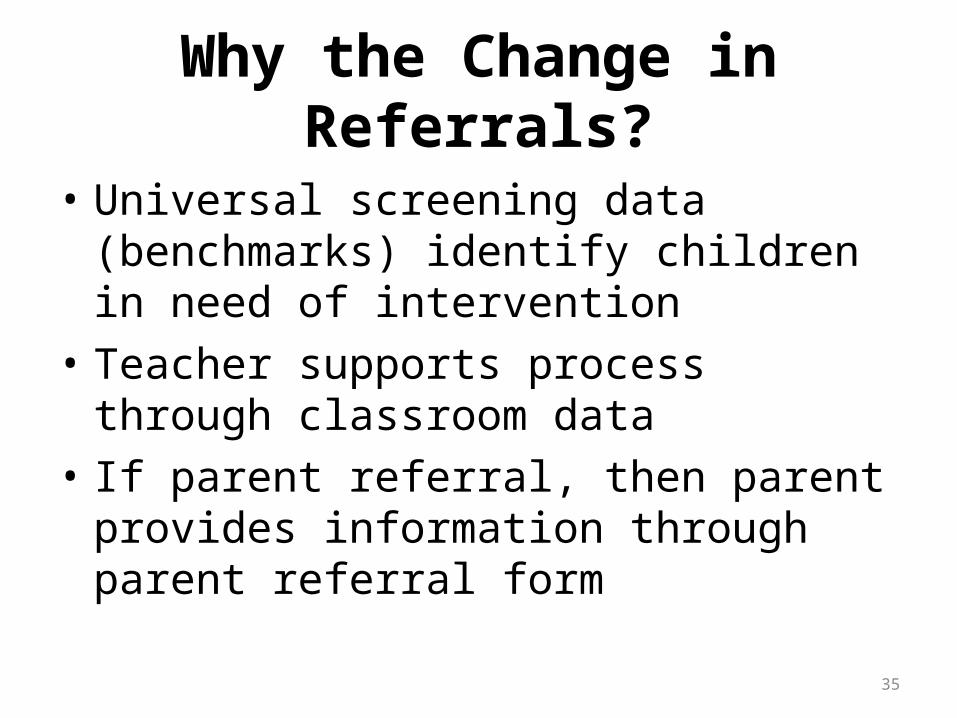
Why the Change in Referrals?
• Universal screening data (benchmarks) identify children in need of intervention
• Teacher supports process through classroom data
• If parent referral, then parent provides information through parent referral form
36
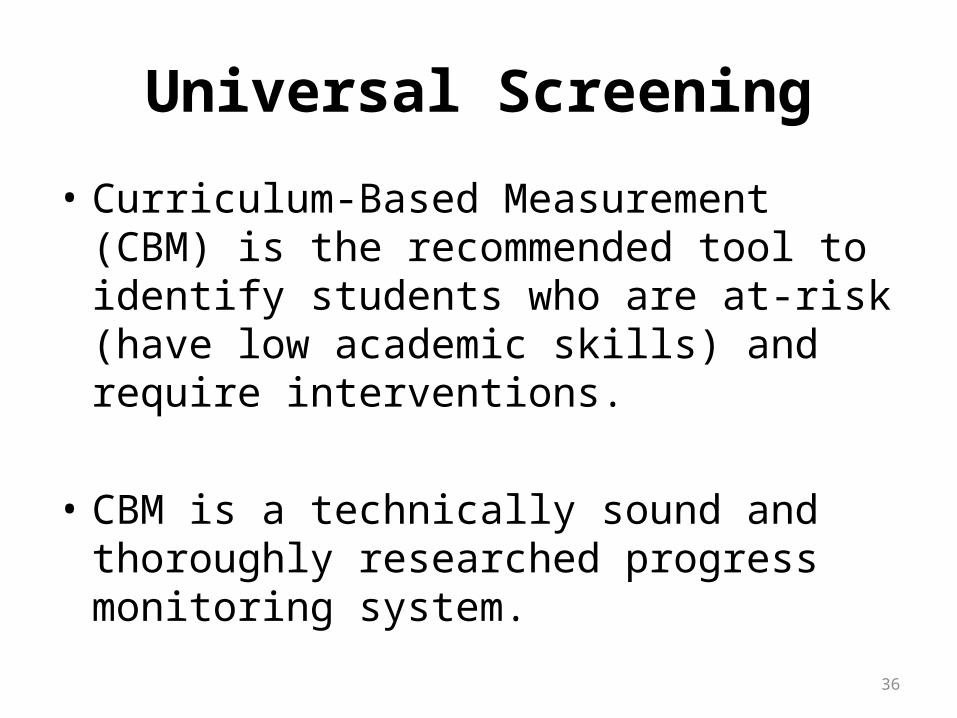
Universal Screening
• Curriculum-Based Measurement (CBM) is the recommended tool to identify students who are at-risk (have low academic skills) and require interventions.
• CBM is a technically sound and thoroughly researched progress monitoring system.
37
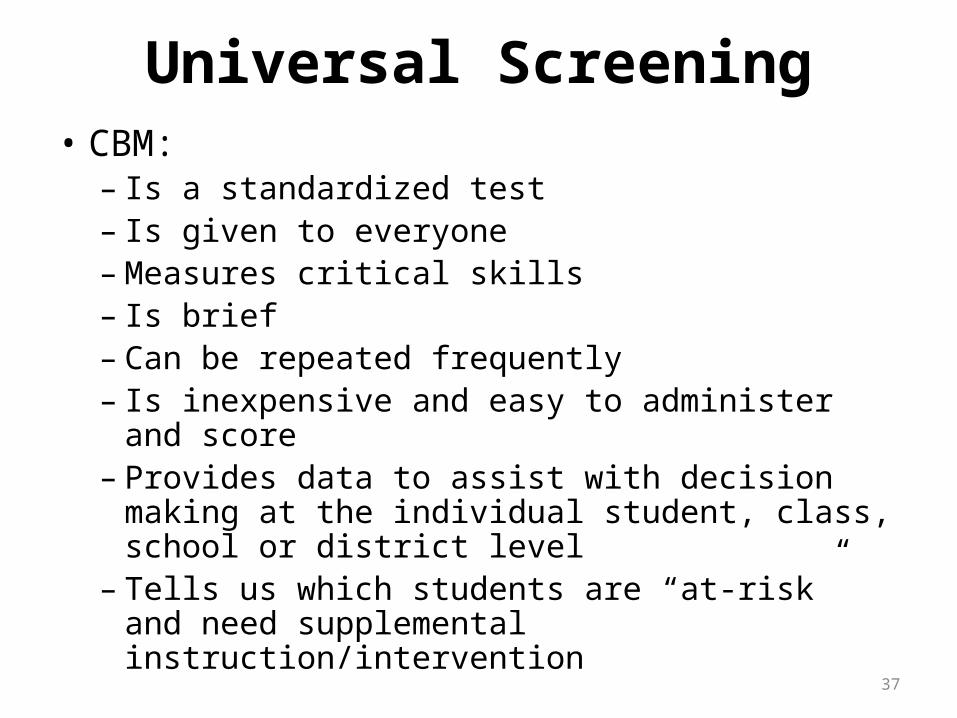
Universal Screening• CBM:
– Is a standardized test– Is given to everyone– Measures critical skills– Is brief– Can be repeated frequently– Is inexpensive and easy to administer and score– Provides data to assist with decision making at the
individual student, class, school or district level– Tells us which students are “at-risk” and need
supplemental instruction/intervention
38
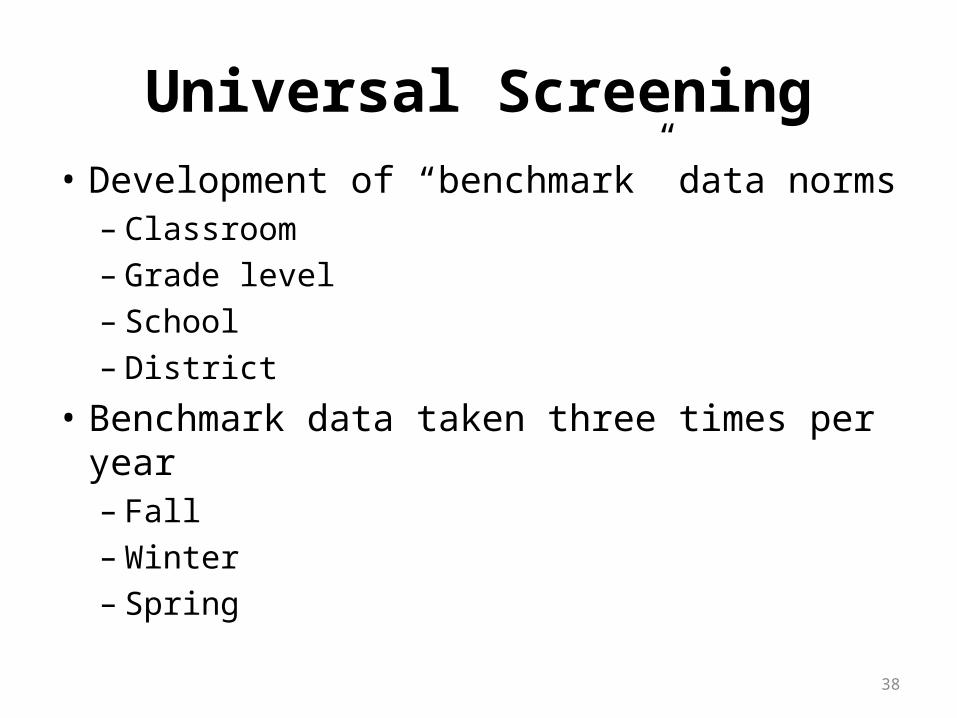
Universal Screening• Development of “benchmark” data norms
– Classroom– Grade level– School– District
• Benchmark data taken three times per year– Fall– Winter– Spring
39
Universal Screening
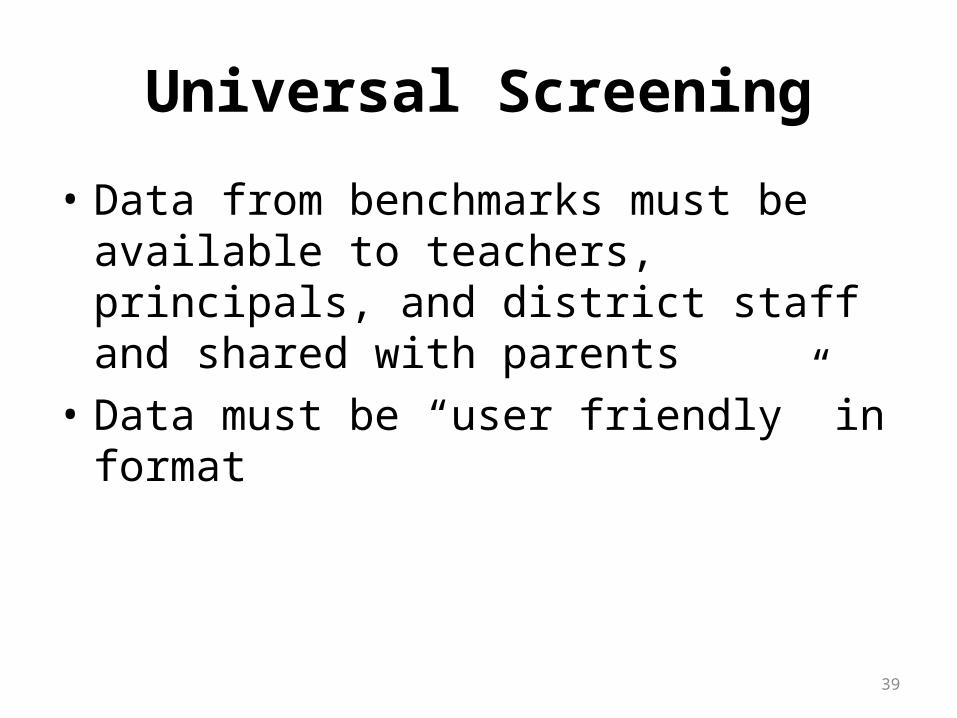
• Data from benchmarks must be available to teachers, principals, and district staff and shared with parents
• Data must be “user friendly” in format
40
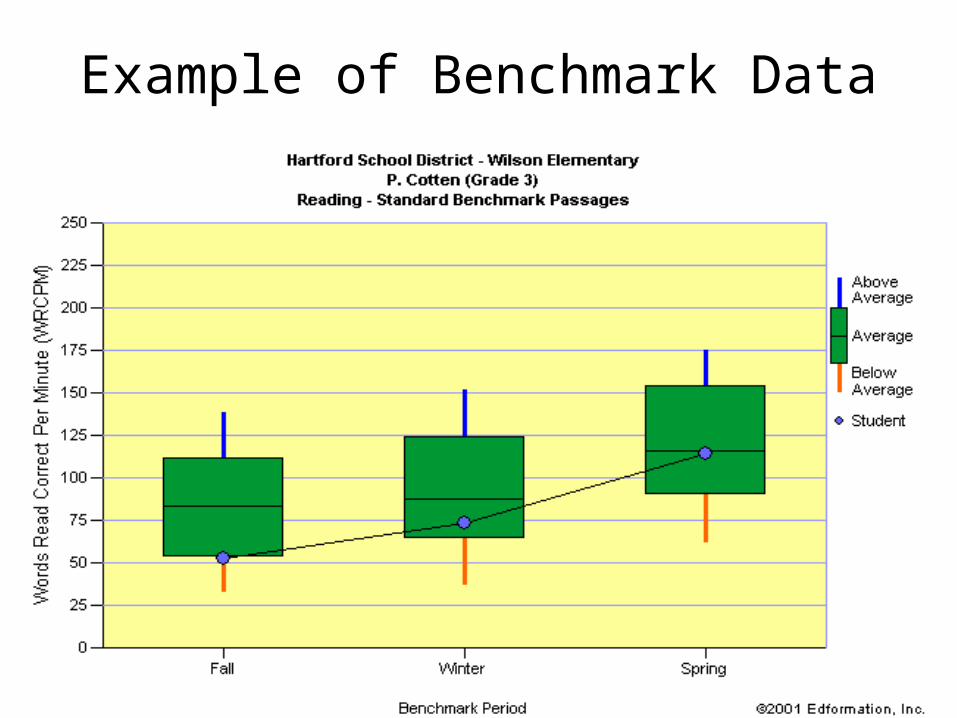
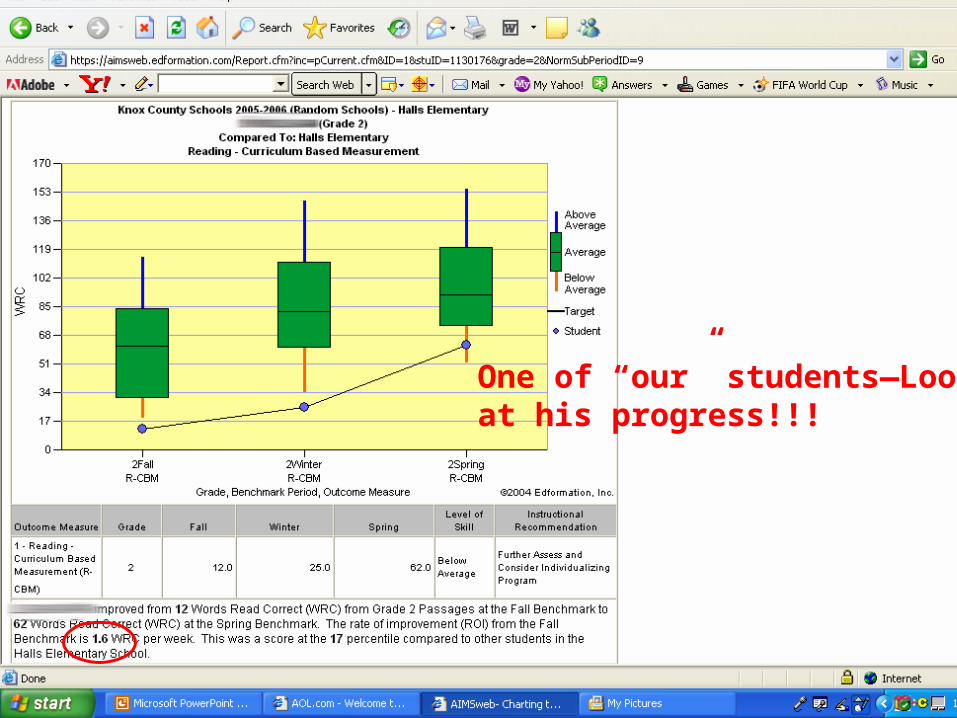
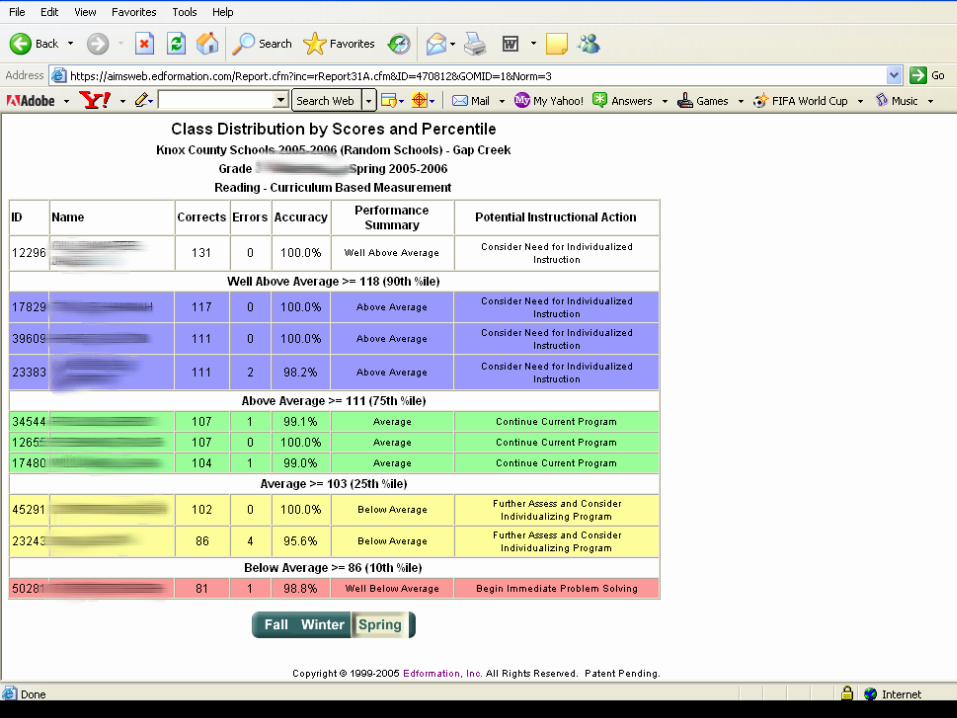
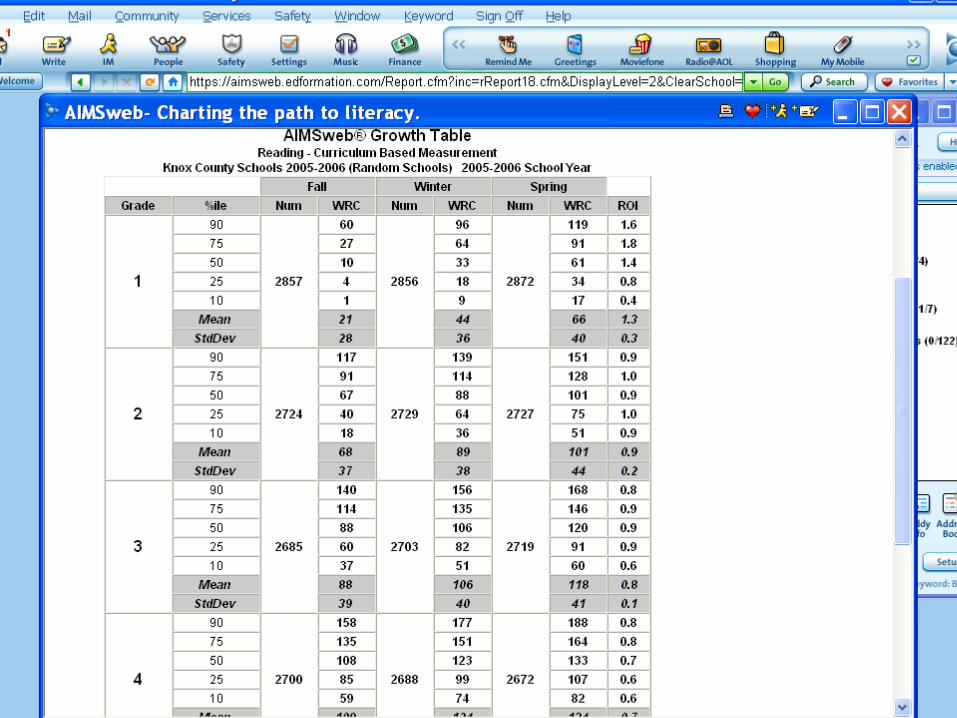
Example of Benchmark Data
41
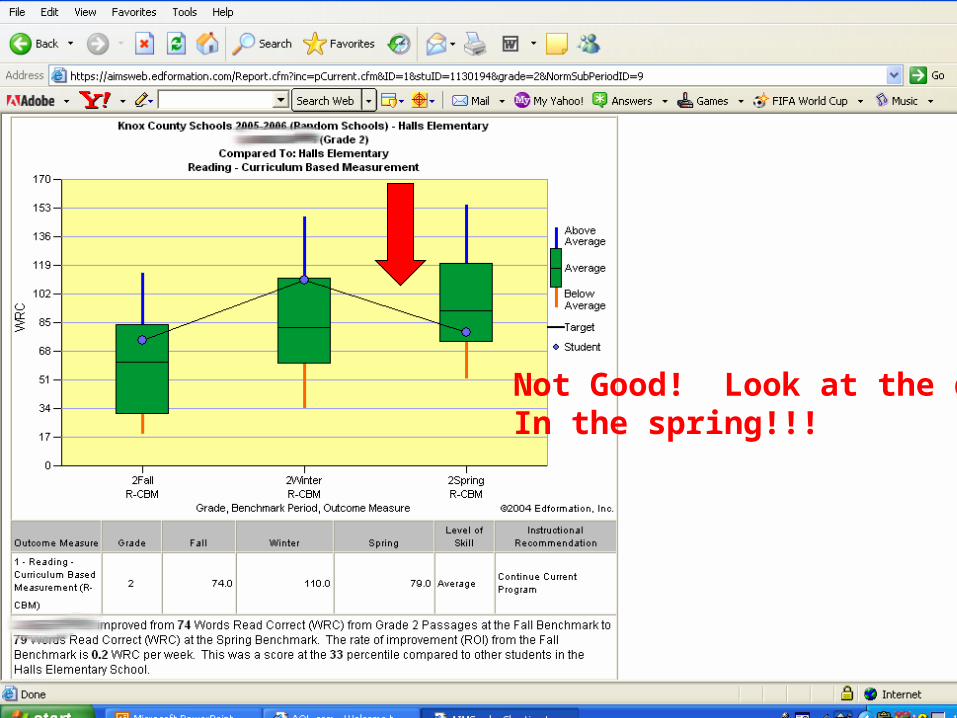
Not Good! Look at the dropIn the spring!!!
42
One of “our” students—Lookat his progress!!!
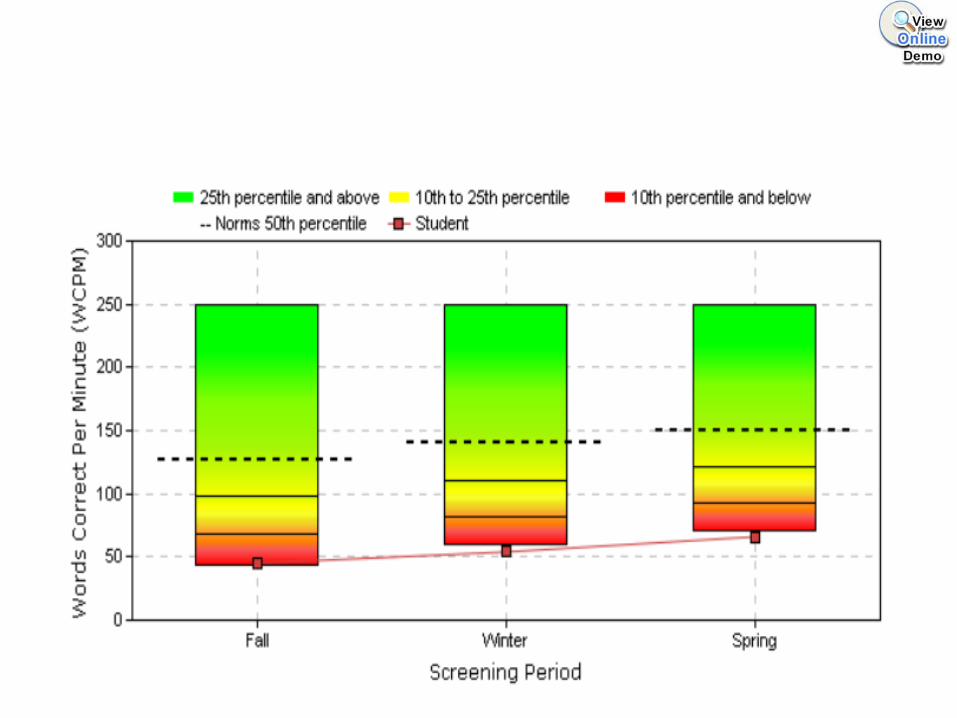
Student GainsThis student is not closing the gap compared to his peers
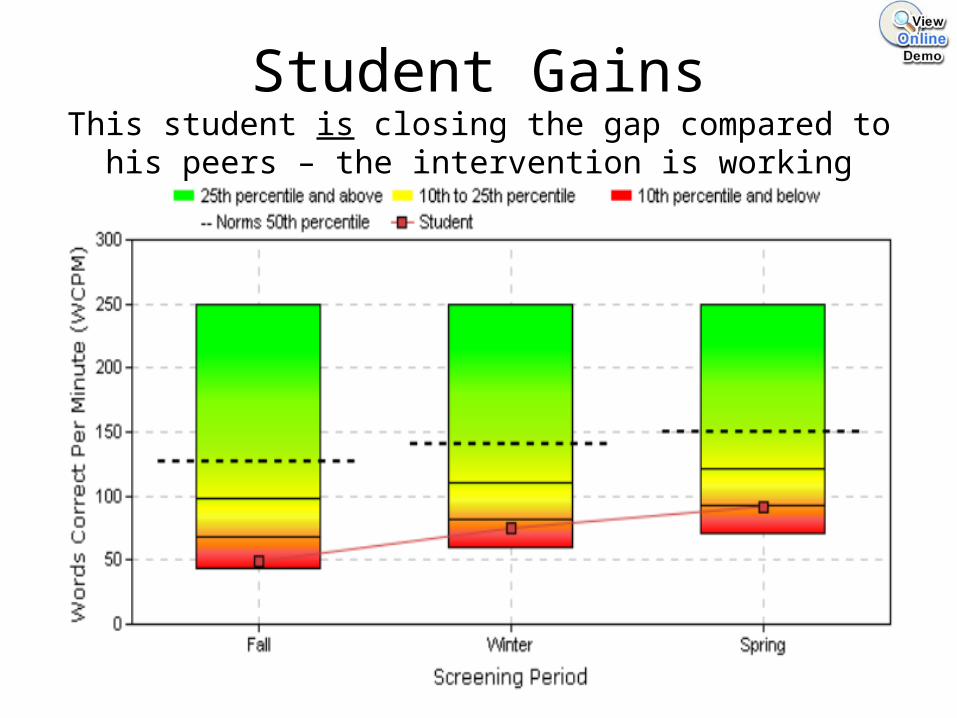
Student GainsThis student is closing the gap compared to his peers – the
intervention is working
45
46
47
48
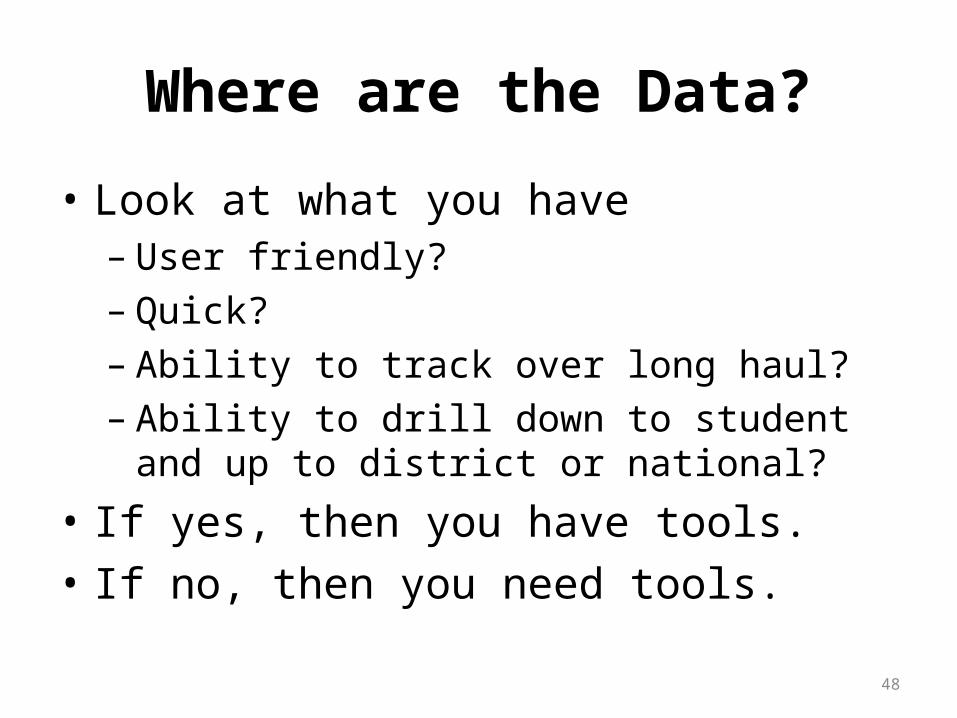
Where are the Data?
• Look at what you have – User friendly?– Quick?– Ability to track over long haul?– Ability to drill down to student and up to district
or national?
• If yes, then you have tools.• If no, then you need tools.
49
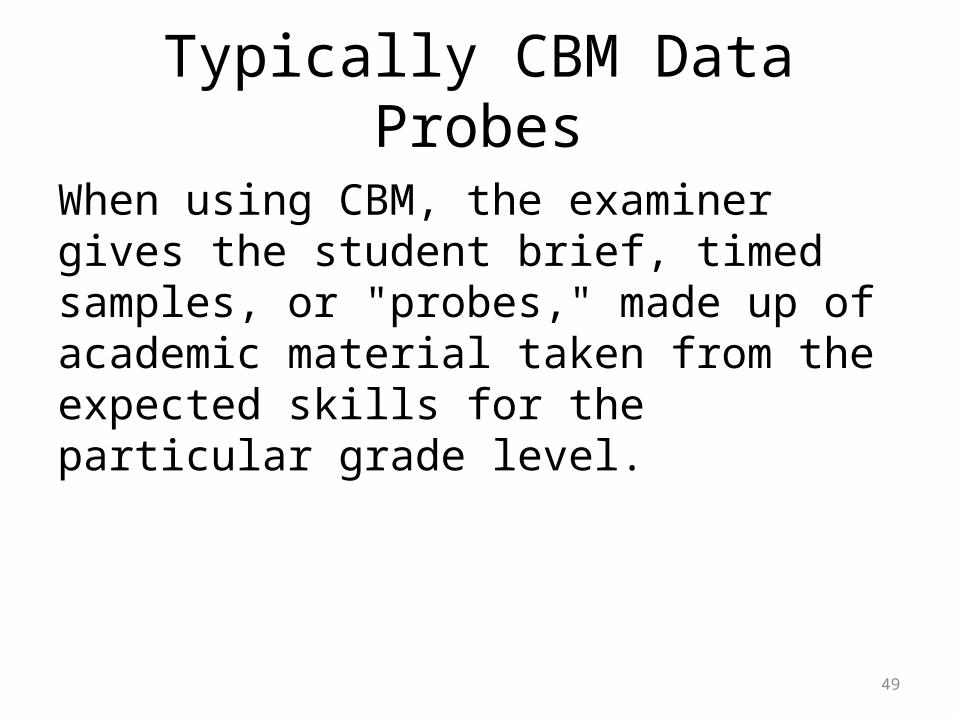
Typically CBM Data Probes
When using CBM, the examiner gives the student brief, timed samples, or "probes," made up of academic material taken from the expected skills for the particular grade level.
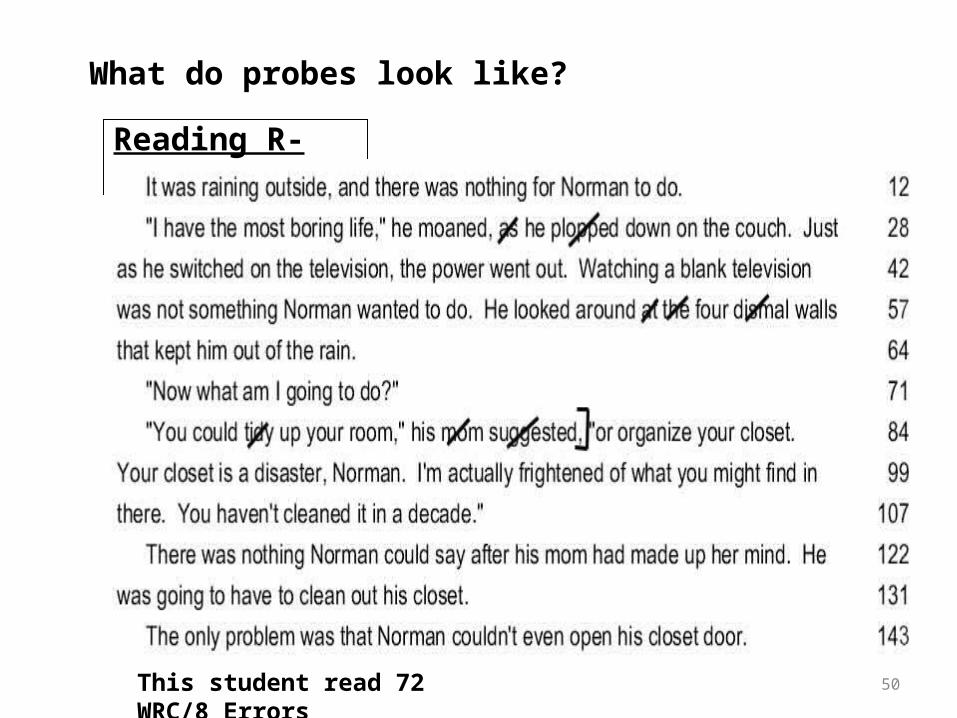
50
Reading R-CBM
This student read 72 WRC/8 Errors
What do probes look like?
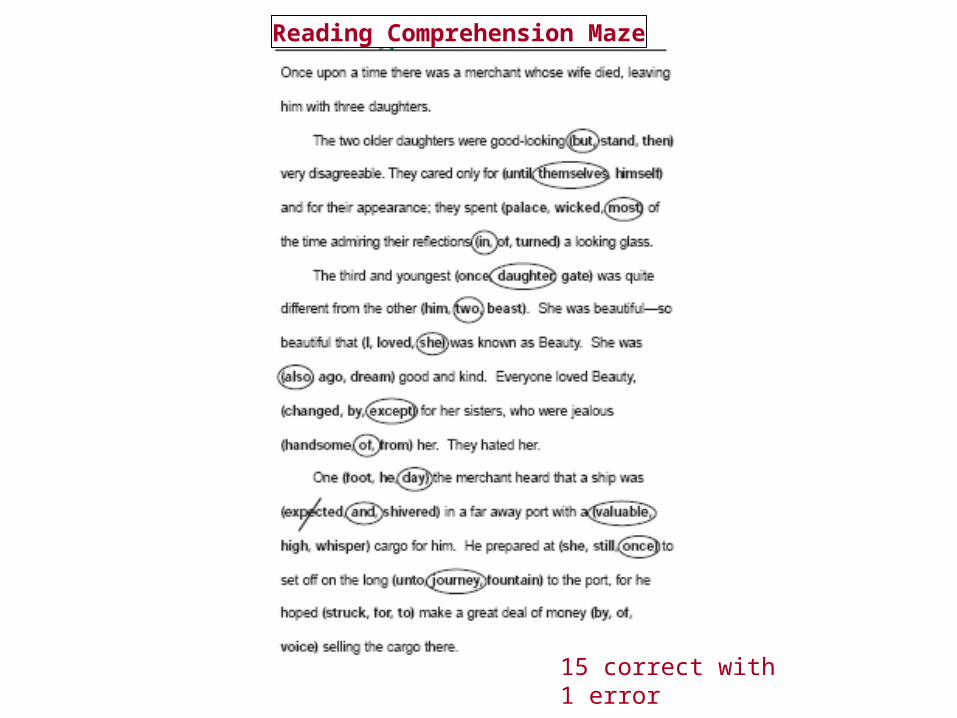
Reading Comprehension Maze
15 correct with 1 error
52
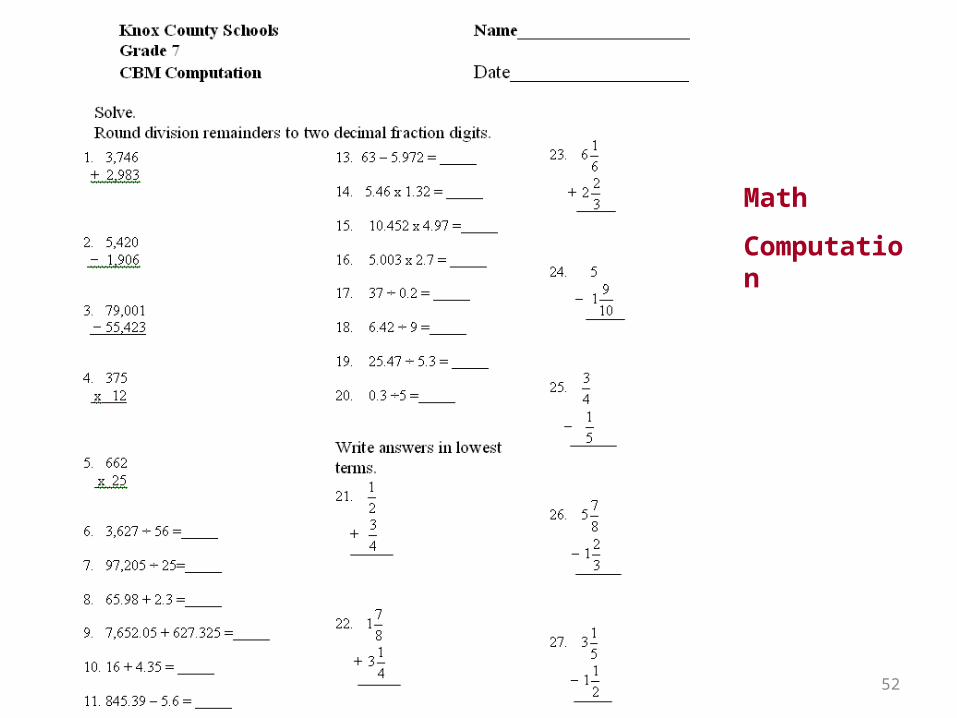
Math
Computation

53
Math Concepts and Applications

54
Summative vs. Formative Assessment
• Summative assessment occurs after instruction
• Example: “High Stakes” testing• Conducted infrequently• Does not provide teachers with ongoing
assessment data• Answers the question, “Did the students
learn?”
55
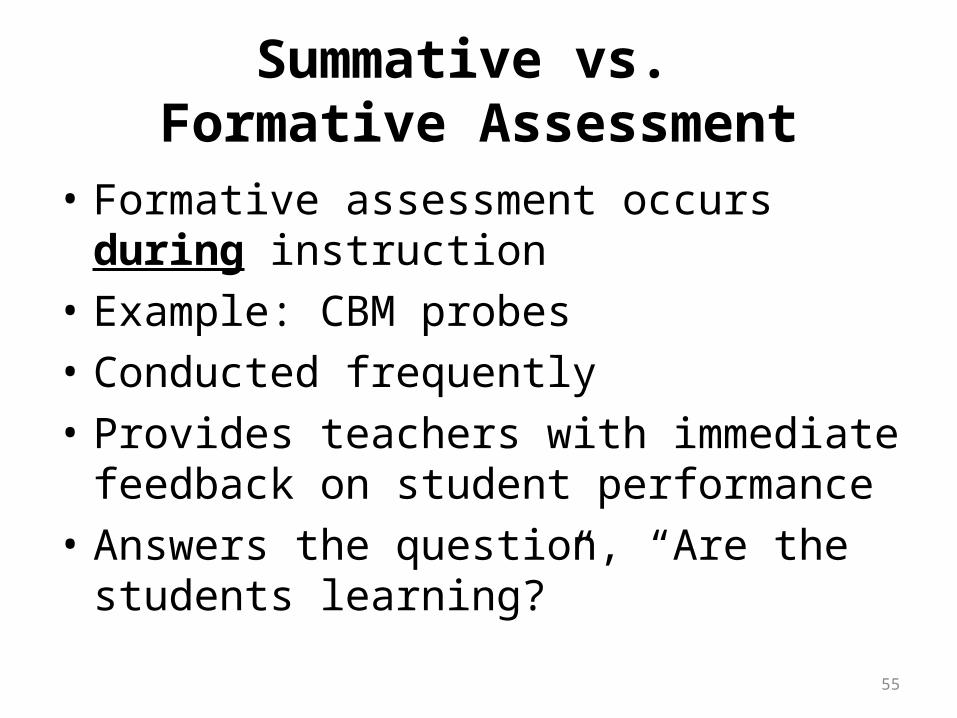
Summative vs. Formative Assessment
• Formative assessment occurs during instruction
• Example: CBM probes• Conducted frequently• Provides teachers with immediate feedback
on student performance• Answers the question, “Are the students
learning?”
56
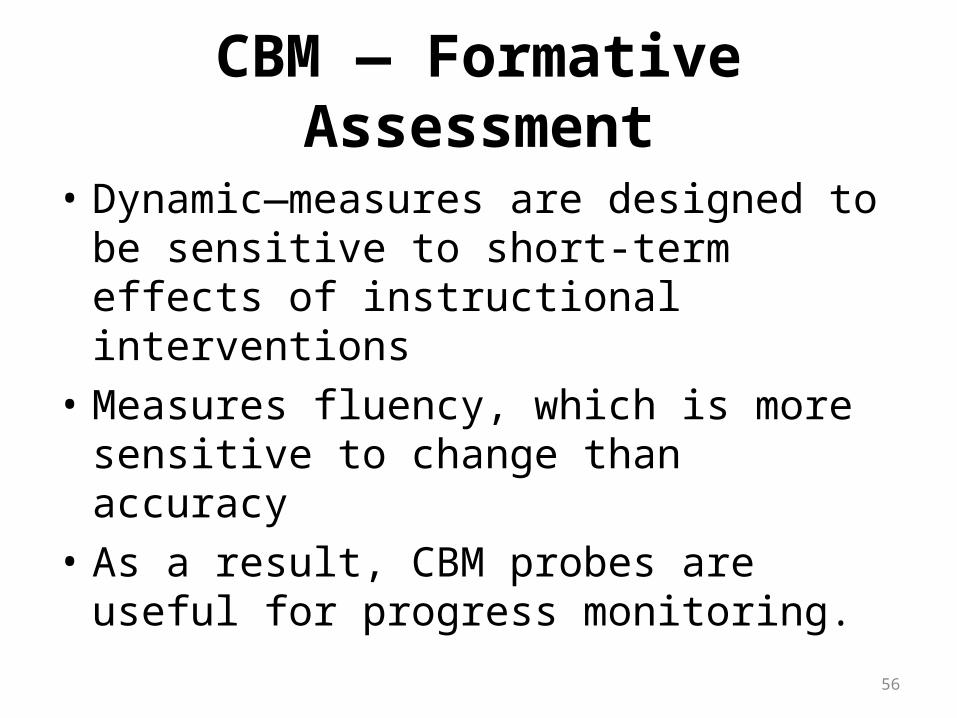
CBM — Formative Assessment
• Dynamic—measures are designed to be sensitive to short-term effects of instructional interventions
• Measures fluency, which is more sensitive to change than accuracy
• As a result, CBM probes are useful for progress monitoring.
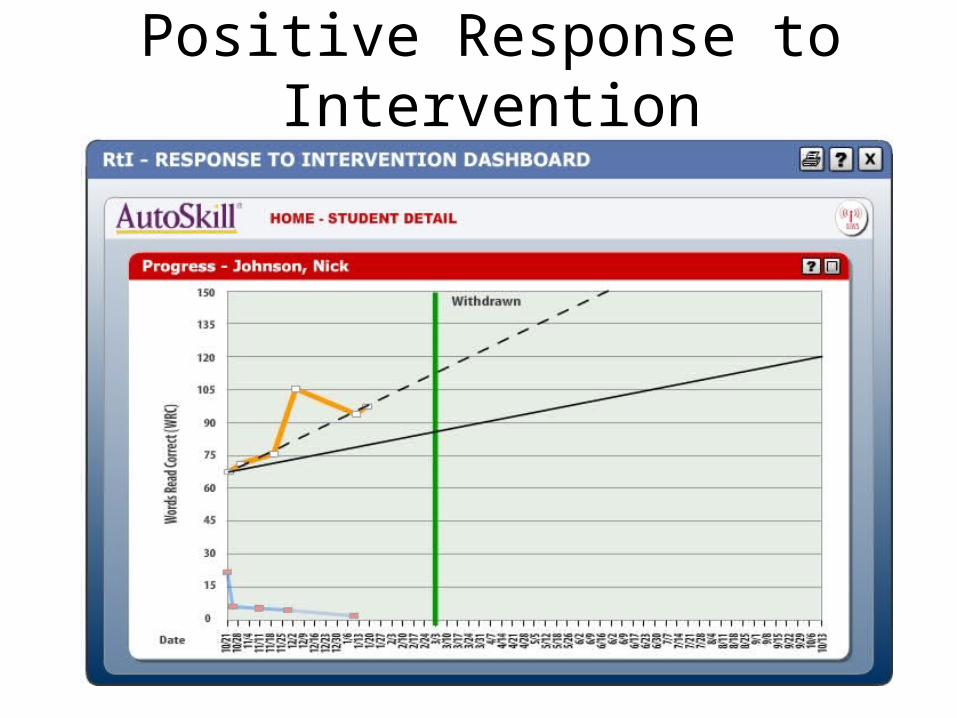
Positive Response to Intervention
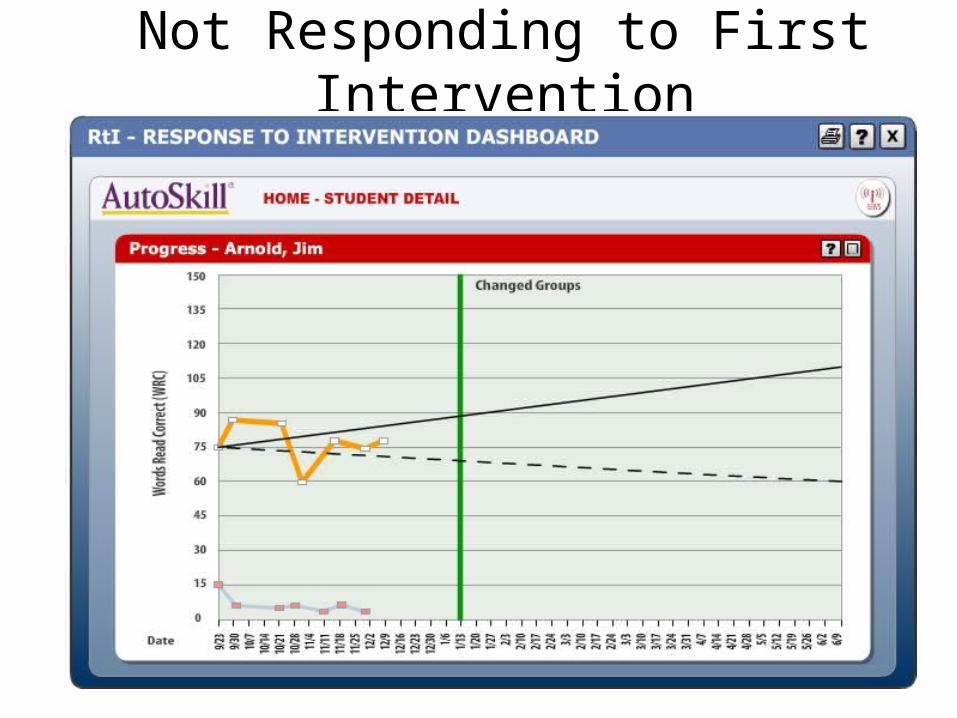
Not Responding to First Intervention
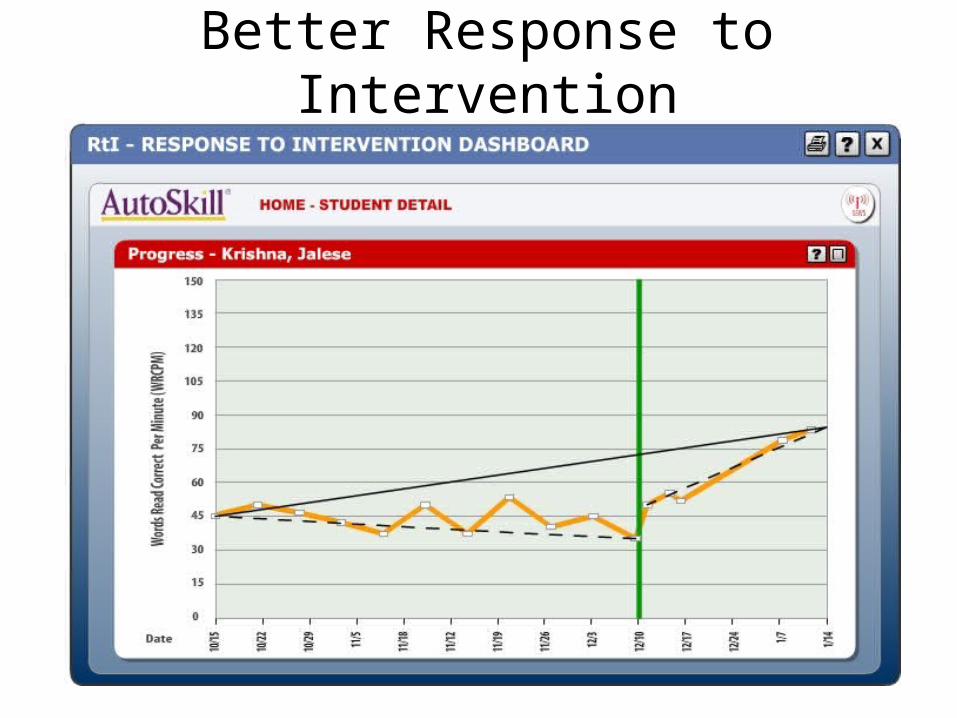
Better Response to Intervention
60
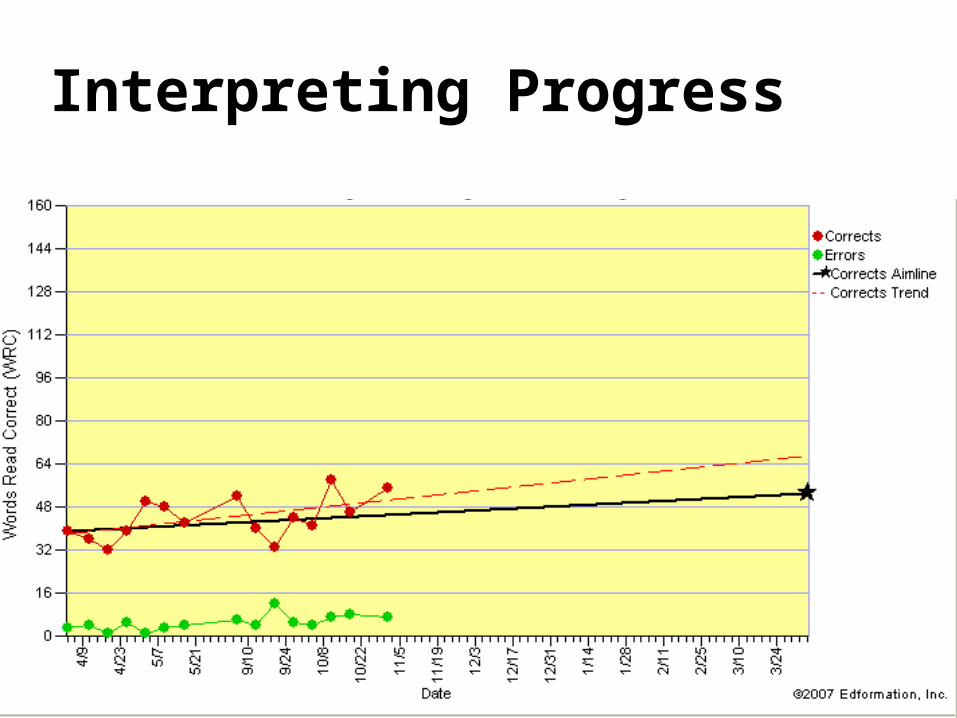
Interpreting Progress
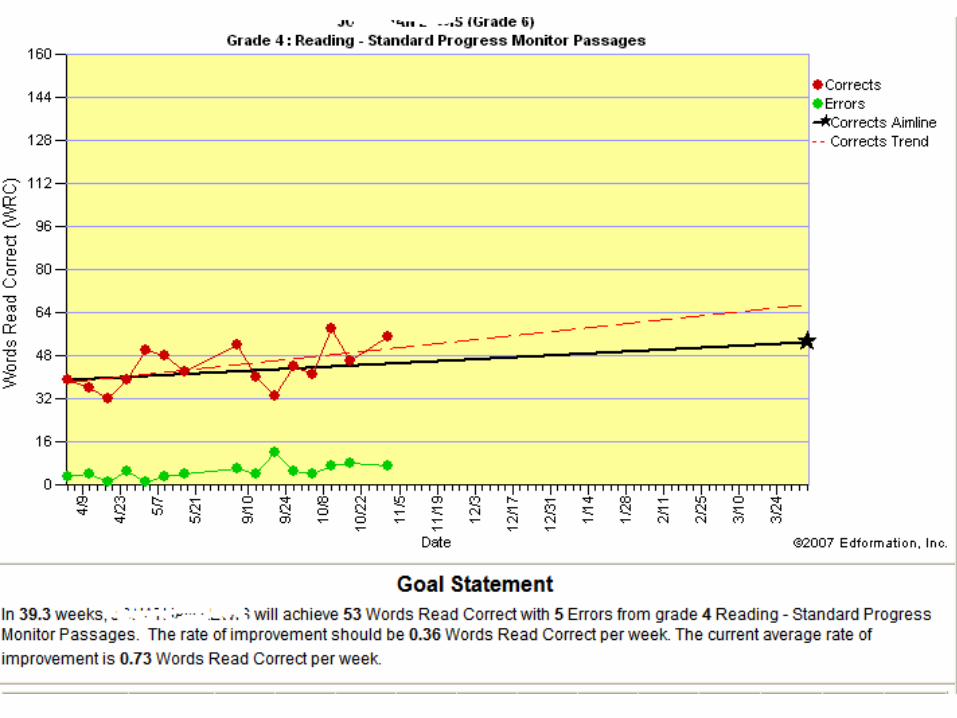
61
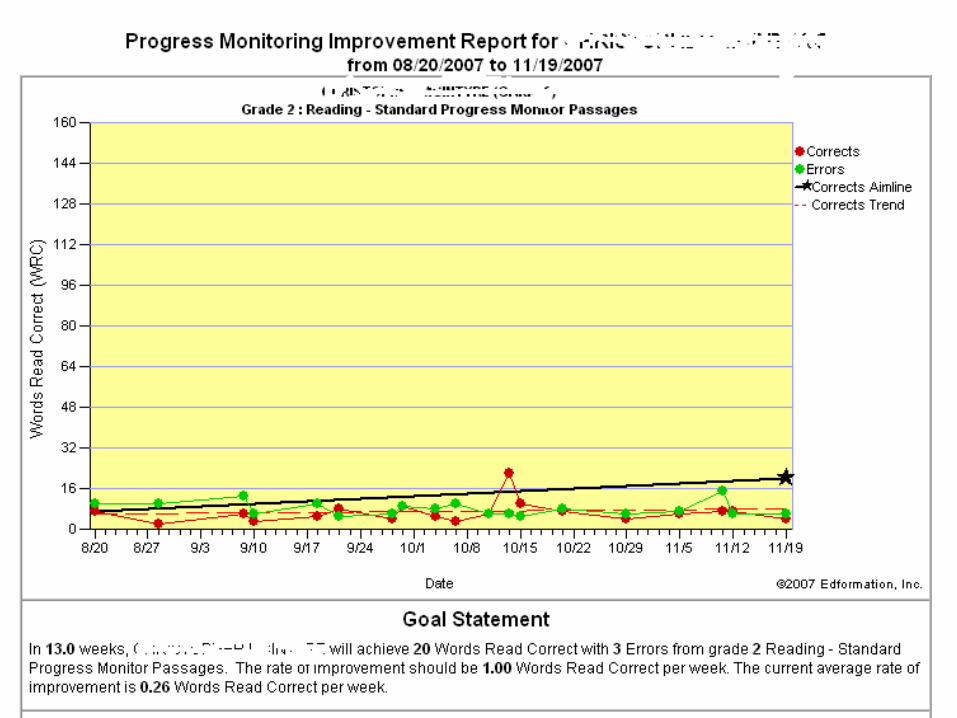
62
63
Interpreting CBM
• What is an appropriate achievement level?– At-risk range may be defined differently in different
districts• What is appropriate growth?
– Adequate improvement may be defined differently in different districts.
64
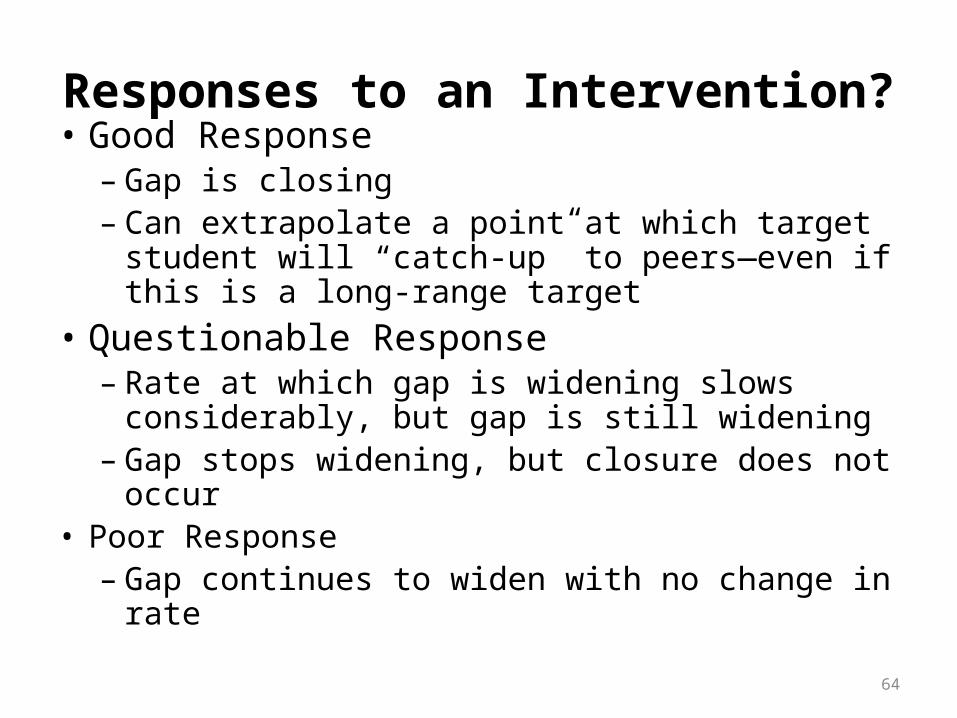
Responses to an Intervention?• Good Response
– Gap is closing– Can extrapolate a point at which target student
will “catch-up” to peers—even if this is a long-range target
• Questionable Response– Rate at which gap is widening slows considerably,
but gap is still widening– Gap stops widening, but closure does not occur
• Poor Response– Gap continues to widen with no change in rate
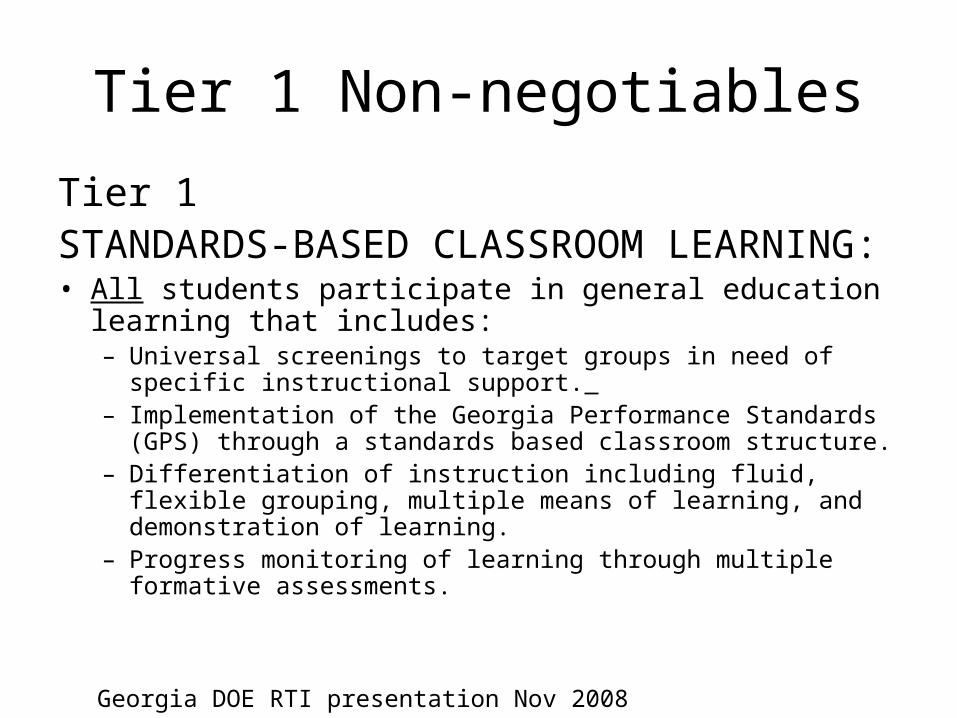
Tier 1 Non-negotiables
Tier 1 STANDARDS-BASED CLASSROOM LEARNING:• All students participate in general education learning that
includes: – Universal screenings to target groups in need of specific instructional
support. – Implementation of the Georgia Performance Standards (GPS) through
a standards based classroom structure. – Differentiation of instruction including fluid, flexible grouping, multiple
means of learning, and demonstration of learning.– Progress monitoring of learning through multiple formative
assessments.
Georgia DOE RTI presentation Nov 2008
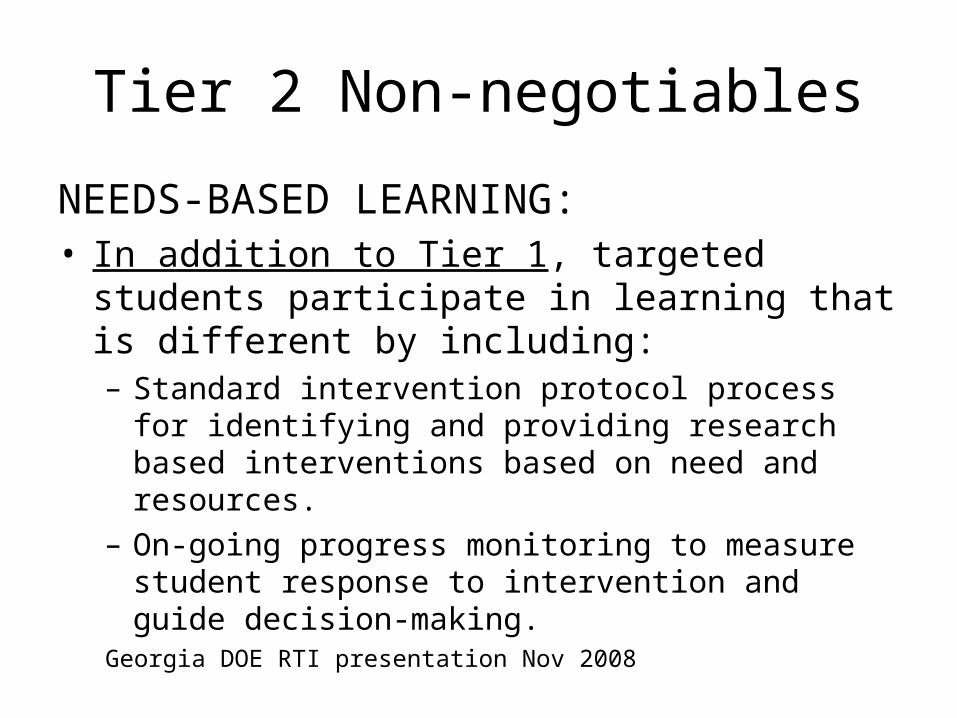
Tier 2 Non-negotiables
NEEDS-BASED LEARNING:• In addition to Tier 1, targeted students participate in
learning that is different by including:– Standard intervention protocol process for identifying and
providing research based interventions based on need and resources.
– On-going progress monitoring to measure student response to intervention and guide decision-making.
Georgia DOE RTI presentation Nov 2008
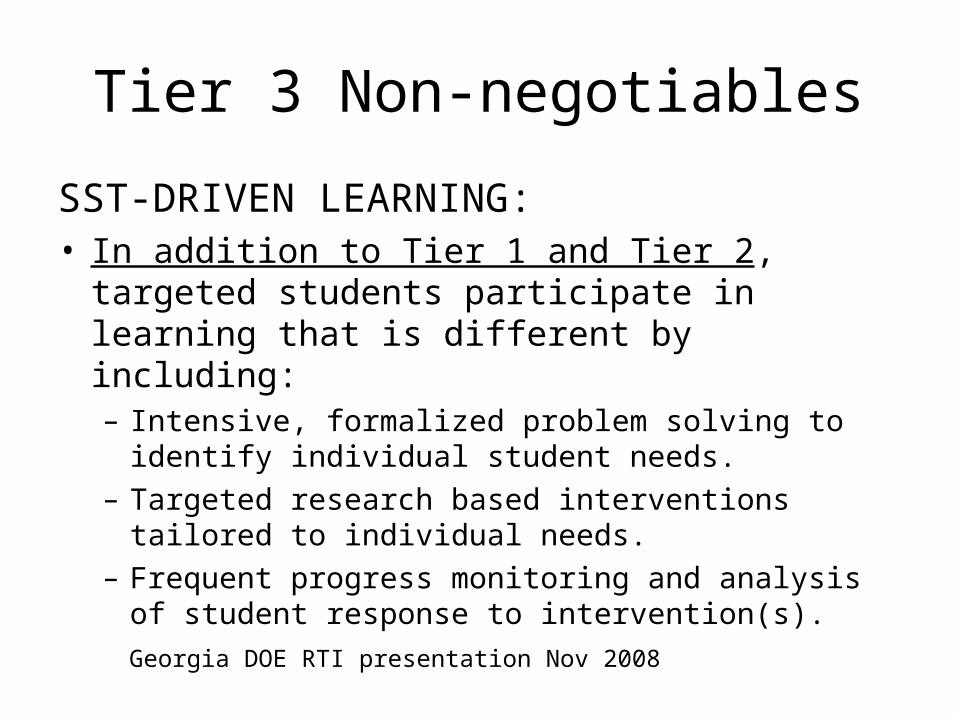
Tier 3 Non-negotiables
SST-DRIVEN LEARNING:• In addition to Tier 1 and Tier 2, targeted students
participate in learning that is different by including:– Intensive, formalized problem solving to identify individual
student needs.– Targeted research based interventions tailored to
individual needs.– Frequent progress monitoring and analysis of student
response to intervention(s).
Georgia DOE RTI presentation Nov 2008
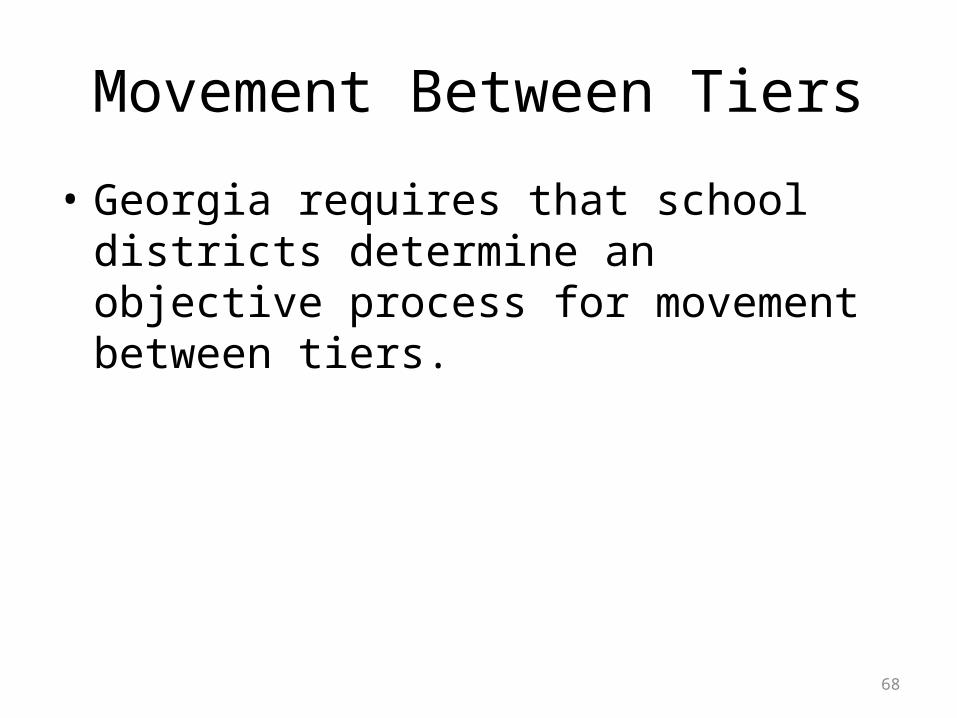
Movement Between Tiers
• Georgia requires that school districts determine an objective process for movement between tiers.
68
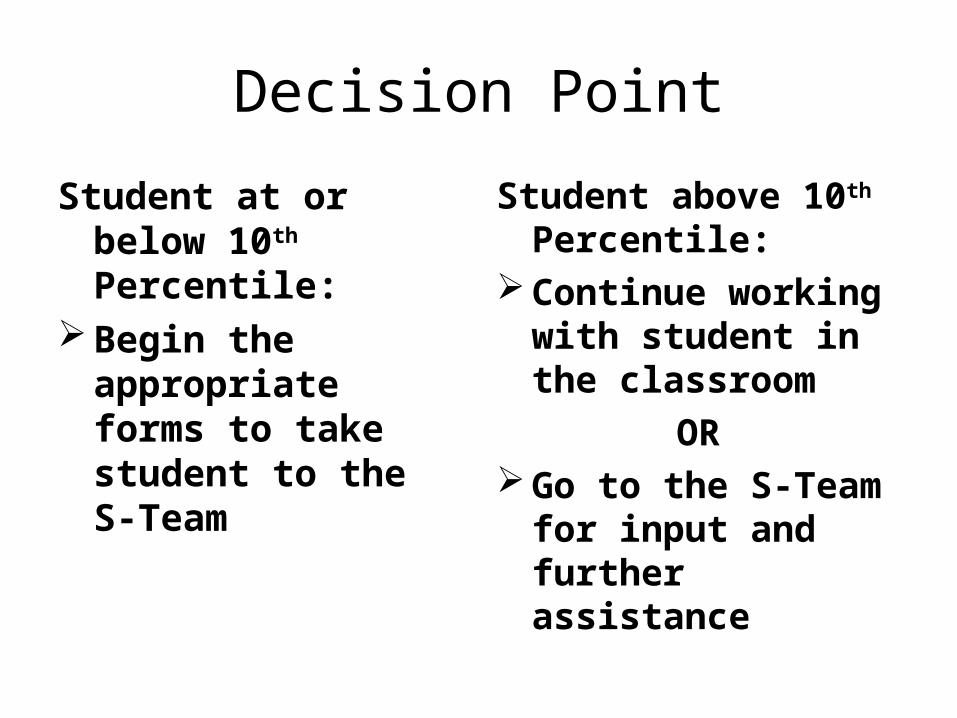
Decision Point
Student at or below 10th Percentile:
Begin the appropriate forms to take student to the S-Team
Student above 10th Percentile:
Continue working with student in the classroom
OR Go to the S-Team for
input and further assistance
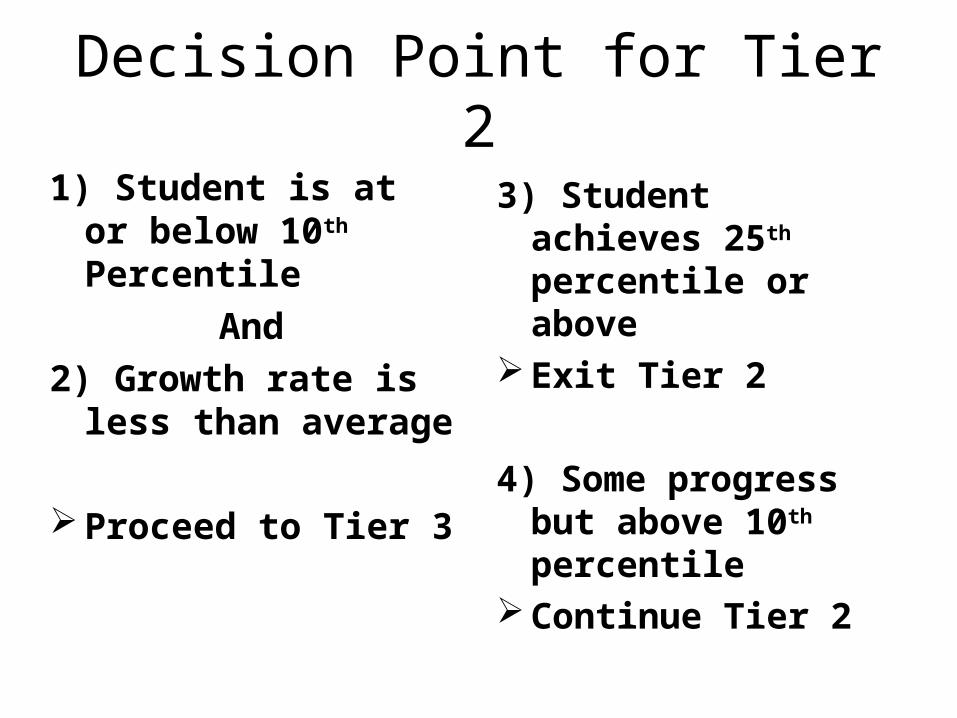
Decision Point for Tier 2
1) Student is at or below 10th Percentile
And2) Growth rate is less
than average
Proceed to Tier 3
3) Student achieves 25th percentile or above
Exit Tier 2
4) Some progress but above 10th percentile
Continue Tier 2
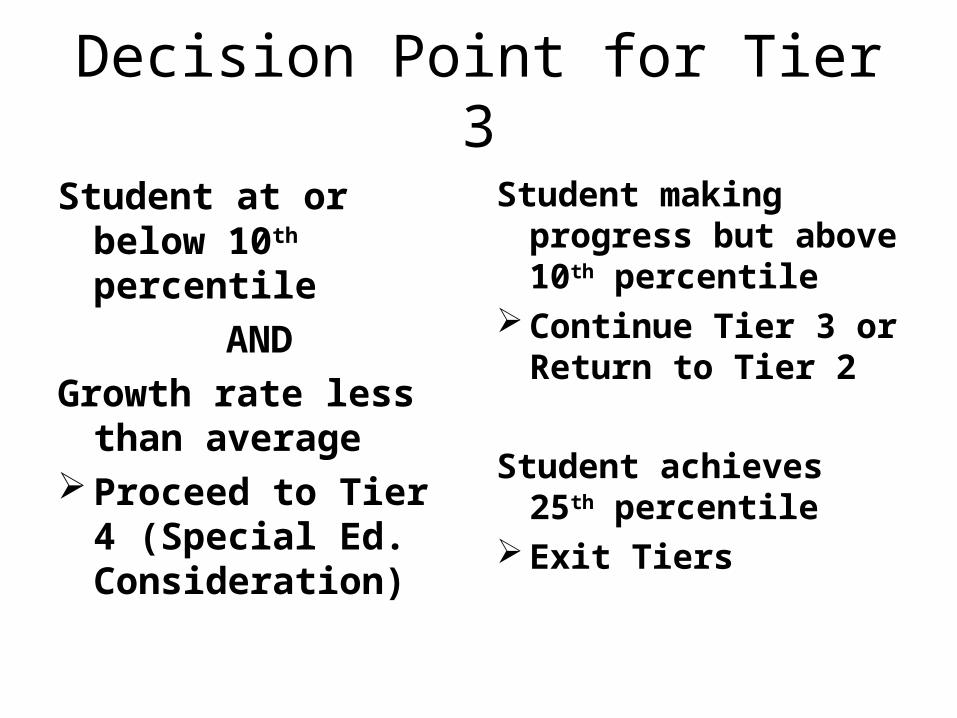
Decision Point for Tier 3
Student at or below 10th percentile
ANDGrowth rate less than
average Proceed to Tier 4
(Special Ed. Consideration)
Student making progress but above 10th percentile
Continue Tier 3 or Return to Tier 2
Student achieves 25th percentile
Exit Tiers
72
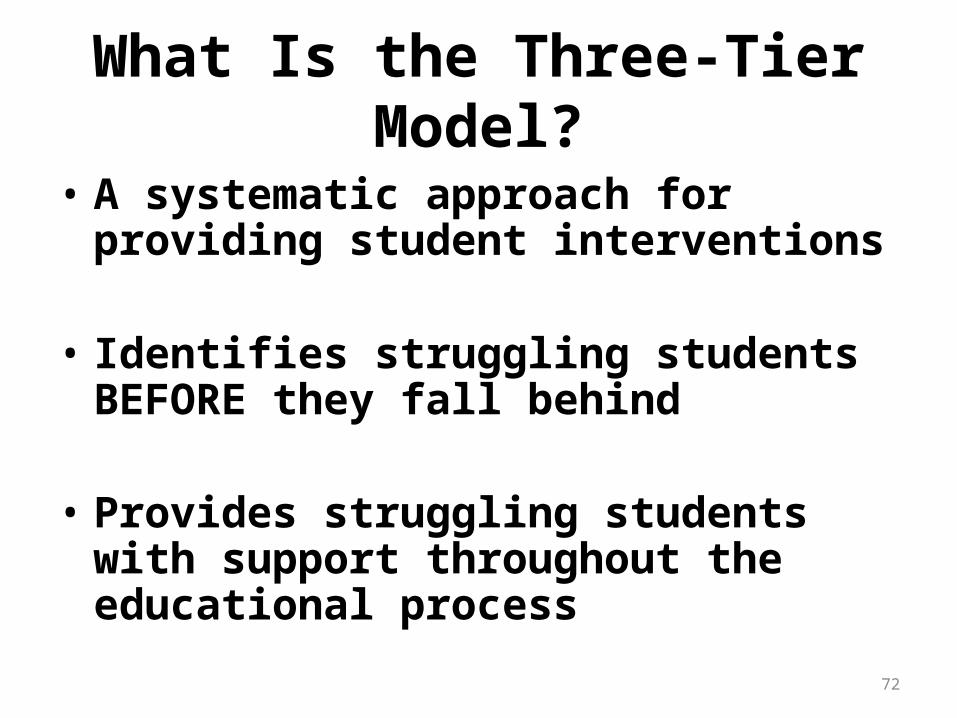
What Is the Three-Tier Model?
• A systematic approach for providing student interventions
• Identifies struggling students BEFORE they fall behind
• Provides struggling students with support throughout the educational process
73
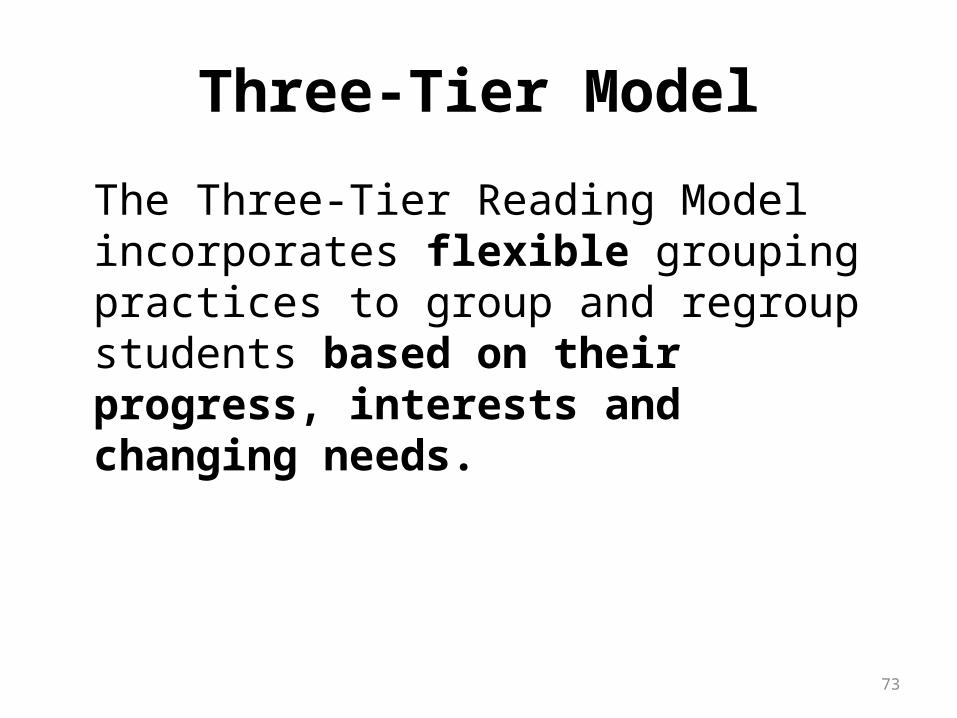
Three-Tier Model
The Three-Tier Reading Model incorporates flexible grouping practices to group and regroup students based on their progress, interests and changing needs.
74
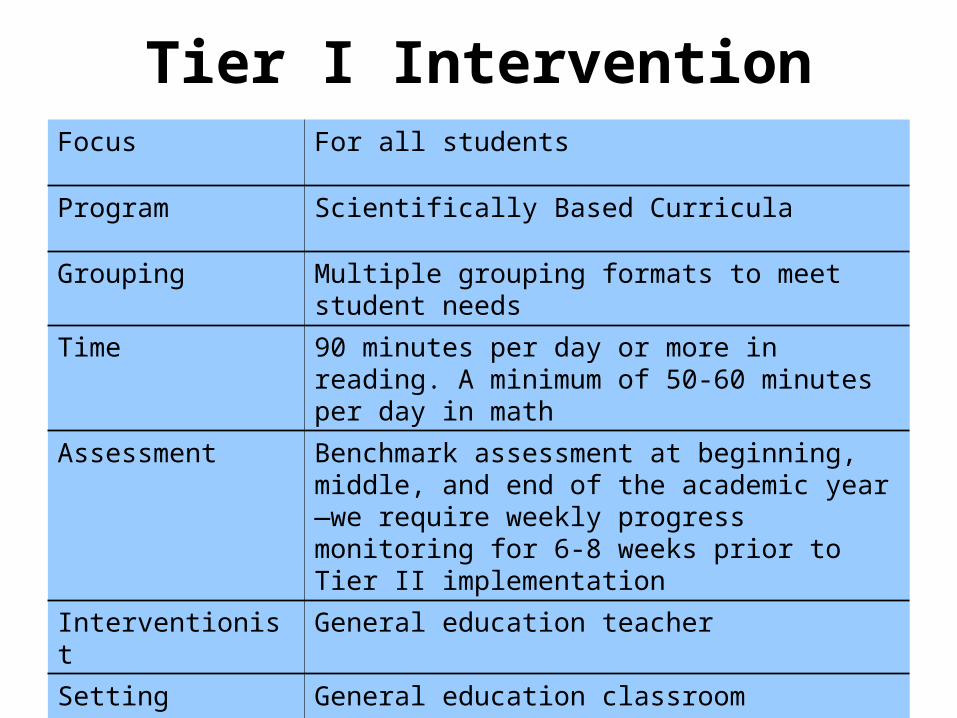
Tier I InterventionFocus For all students
Program Scientifically Based Curricula
Grouping Multiple grouping formats to meet student needs
Time 90 minutes per day or more in reading. A minimum of 50-60 minutes per day in math
Assessment Benchmark assessment at beginning, middle, and end of the academic year—we require weekly progress monitoring for 6-8 weeks prior to Tier II implementation
Interventionist General education teacher
Setting General education classroom
75
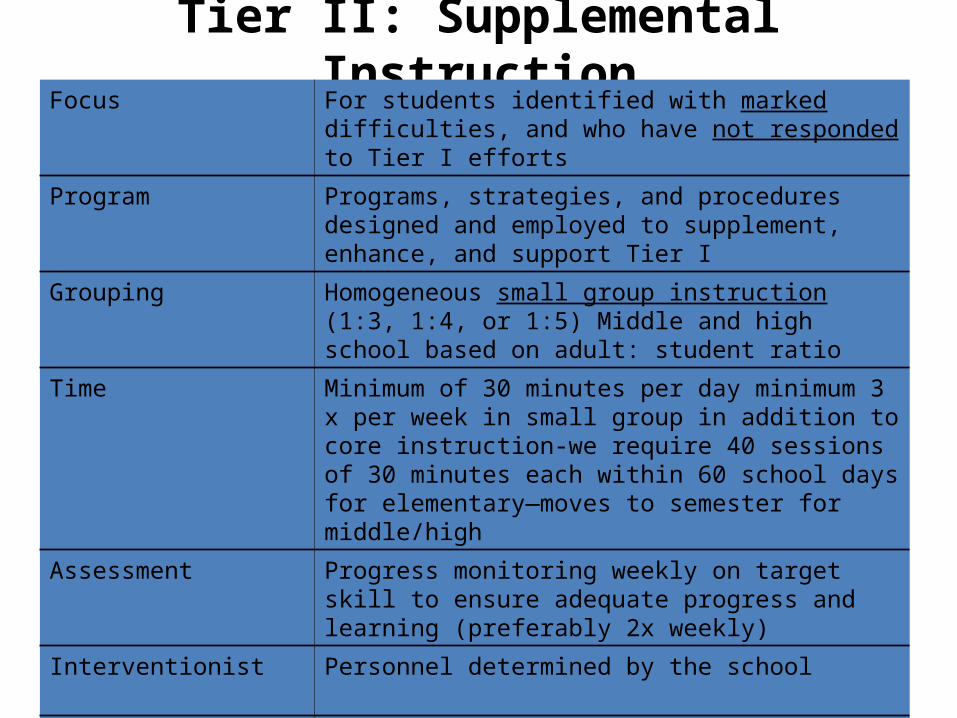
Tier II: Supplemental InstructionFocus For students identified with marked difficulties, and
who have not responded to Tier I efforts
Program Programs, strategies, and procedures designed and employed to supplement, enhance, and support Tier I
Grouping Homogeneous small group instruction (1:3, 1:4, or 1:5) Middle and high school based on adult: student ratio
Time Minimum of 30 minutes per day minimum 3 x per week in small group in addition to core instruction-we require 40 sessions of 30 minutes each within 60 school days for elementary—moves to semester for middle/high
Assessment Progress monitoring weekly on target skill to ensure adequate progress and learning (preferably 2x weekly)
Interventionist Personnel determined by the school
Setting Appropriate setting designated by the school; may be within or outside of the classroom
76
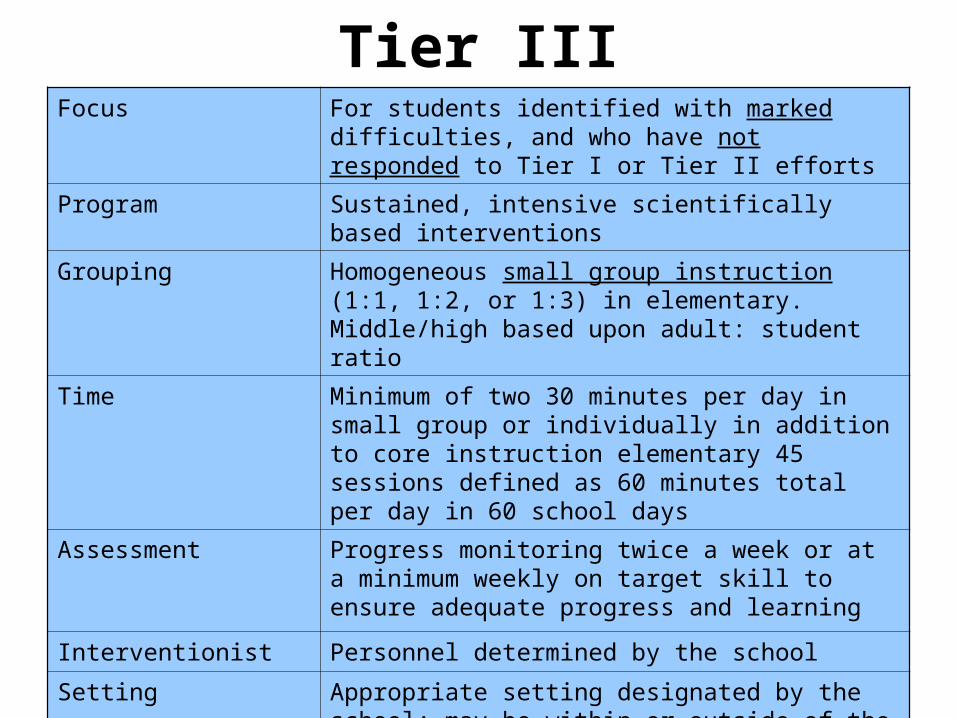
Tier IIIFocus For students identified with marked difficulties, and
who have not responded to Tier I or Tier II efforts
Program Sustained, intensive scientifically based interventions
Grouping Homogeneous small group instruction (1:1, 1:2, or 1:3) in elementary. Middle/high based upon adult: student ratio
Time Minimum of two 30 minutes per day in small group or individually in addition to core instruction elementary 45 sessions defined as 60 minutes total per day in 60 school days
Assessment Progress monitoring twice a week or at a minimum weekly on target skill to ensure adequate progress and learning
Interventionist Personnel determined by the school
Setting Appropriate setting designated by the school; may be within or outside of the classroom
77
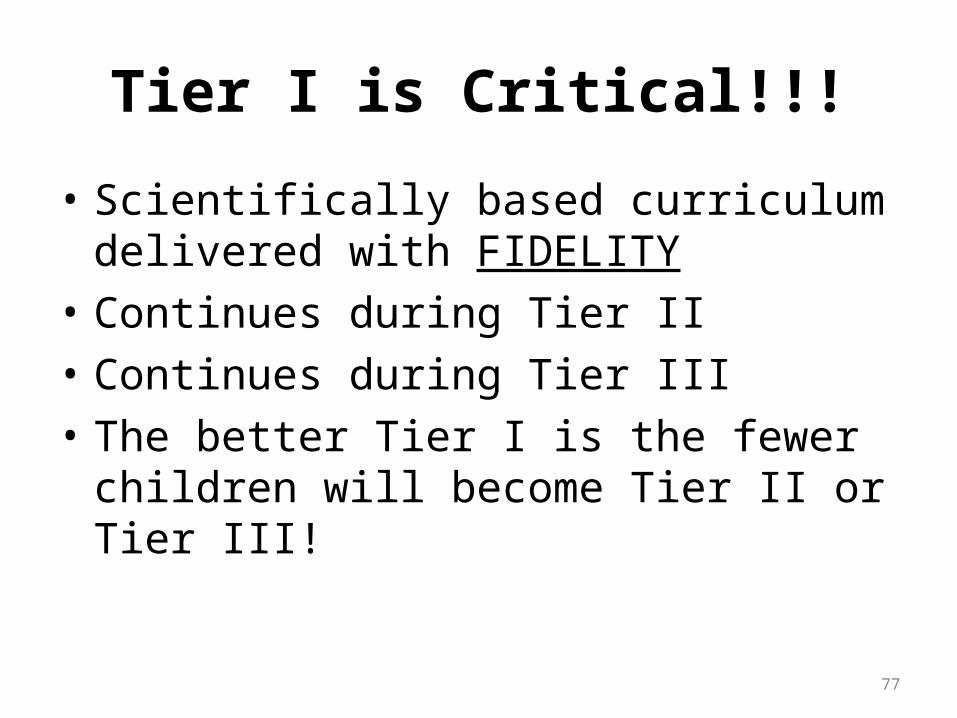
Tier I is Critical!!!
• Scientifically based curriculum delivered with FIDELITY
• Continues during Tier II• Continues during Tier III• The better Tier I is the fewer children will
become Tier II or Tier III!
78
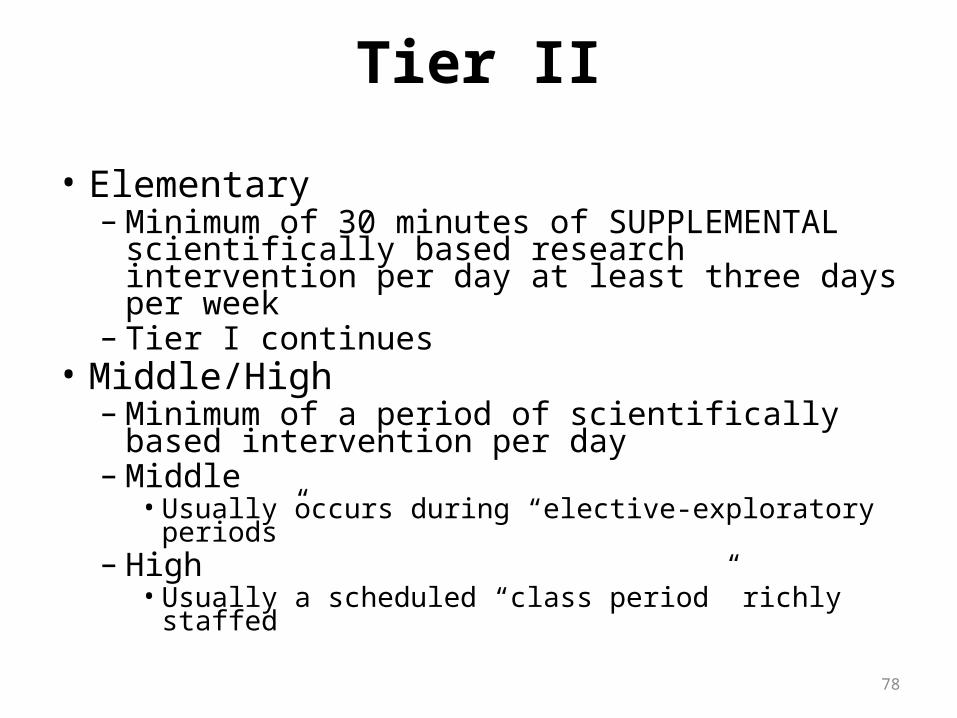
Tier II
• Elementary– Minimum of 30 minutes of SUPPLEMENTAL
scientifically based research intervention per day at least three days per week
– Tier I continues• Middle/High
– Minimum of a period of scientifically based intervention per day
– Middle• Usually occurs during “elective-exploratory periods”
– High• Usually a scheduled “class period” richly staffed
79
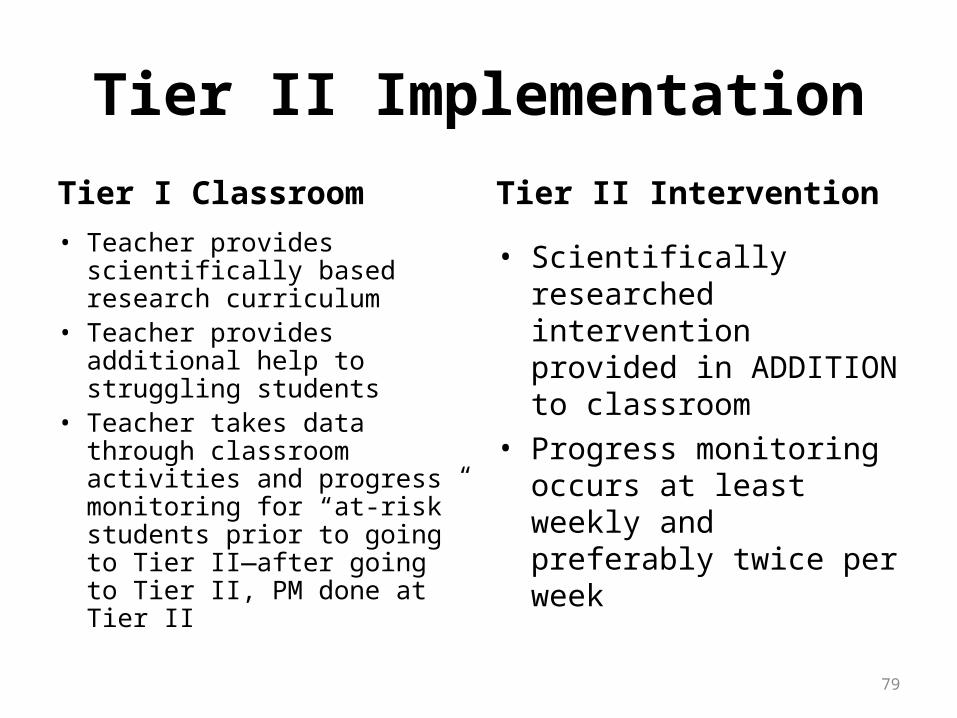
Tier II ImplementationTier I Classroom
• Teacher provides scientifically based research curriculum
• Teacher provides additional help to struggling students
• Teacher takes data through classroom activities and progress monitoring for “at-risk” students prior to going to Tier II—after going to Tier II, PM done at Tier II
Tier II Intervention
• Scientifically researched intervention provided in ADDITION to classroom
• Progress monitoring occurs at least weekly and preferably twice per week
80
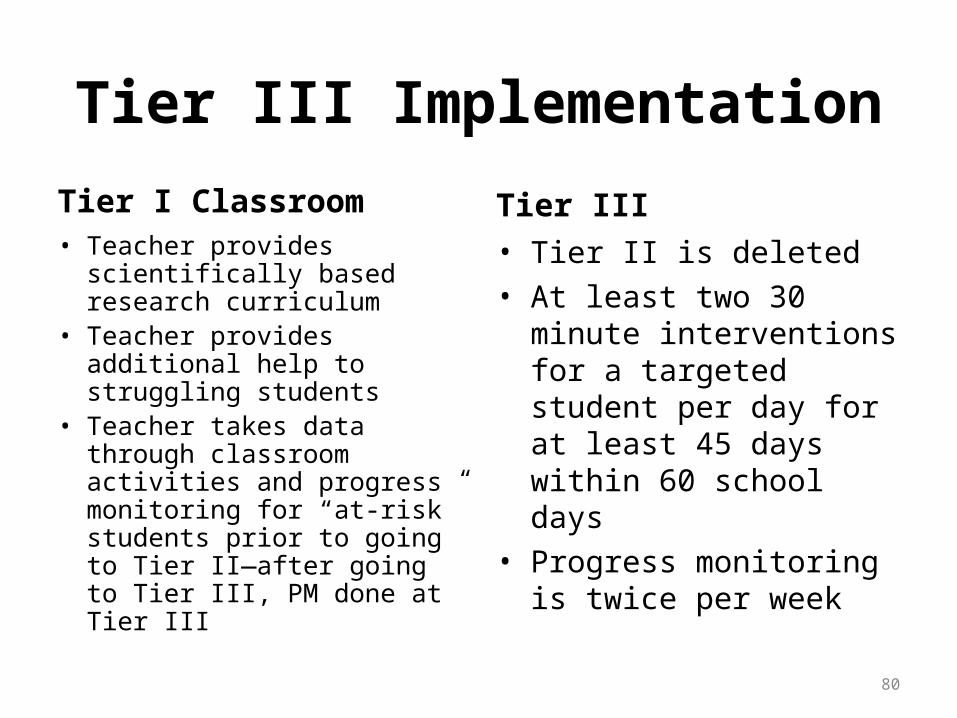
Tier III Implementation
Tier I Classroom• Teacher provides
scientifically based research curriculum
• Teacher provides additional help to struggling students
• Teacher takes data through classroom activities and progress monitoring for “at-risk” students prior to going to Tier II—after going to Tier III, PM done at Tier III
Tier III• Tier II is deleted• At least two 30 minute
interventions for a targeted student per day for at least 45 days within 60 school days
• Progress monitoring is twice per week
81
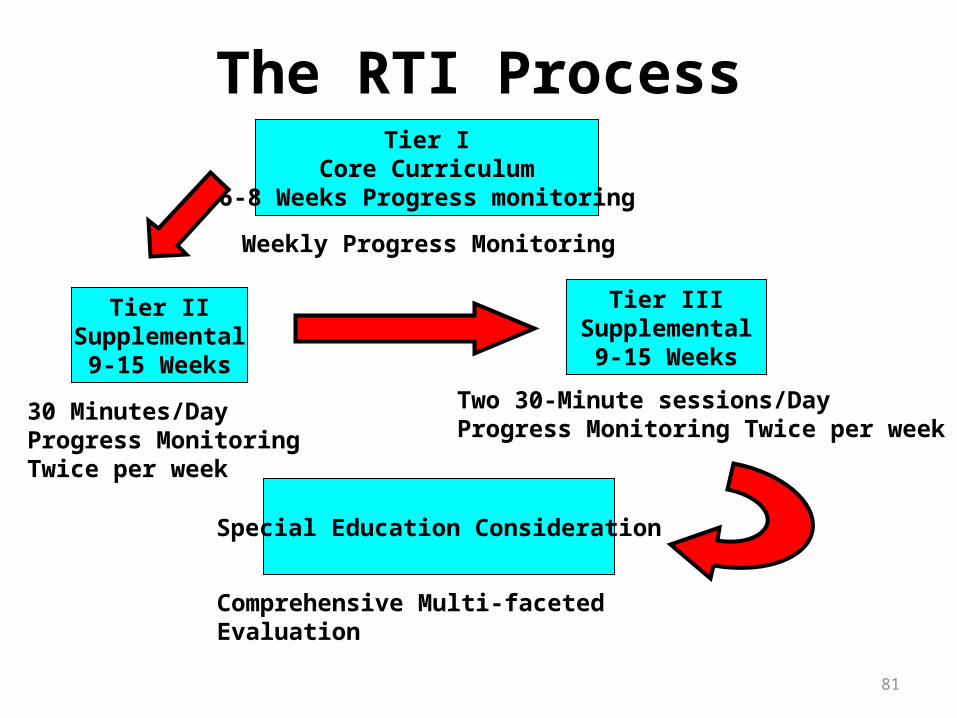
The RTI ProcessTier I
Core Curriculum6-8 Weeks Progress monitoring
Weekly Progress Monitoring
Tier IISupplemental9-15 Weeks
Tier IIISupplemental9-15 Weeks
30 Minutes/DayProgress MonitoringTwice per week
Two 30-Minute sessions/DayProgress Monitoring Twice per week
Special Education Consideration
Comprehensive Multi-faceted Evaluation
82
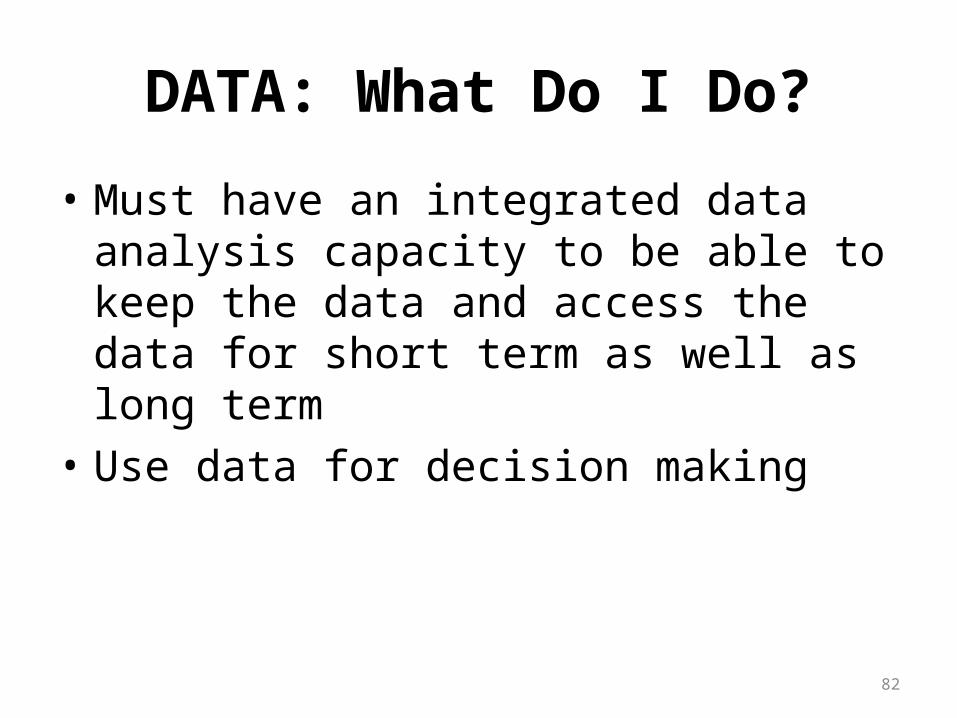
DATA: What Do I Do?
• Must have an integrated data analysis capacity to be able to keep the data and access the data for short term as well as long term
• Use data for decision making
83
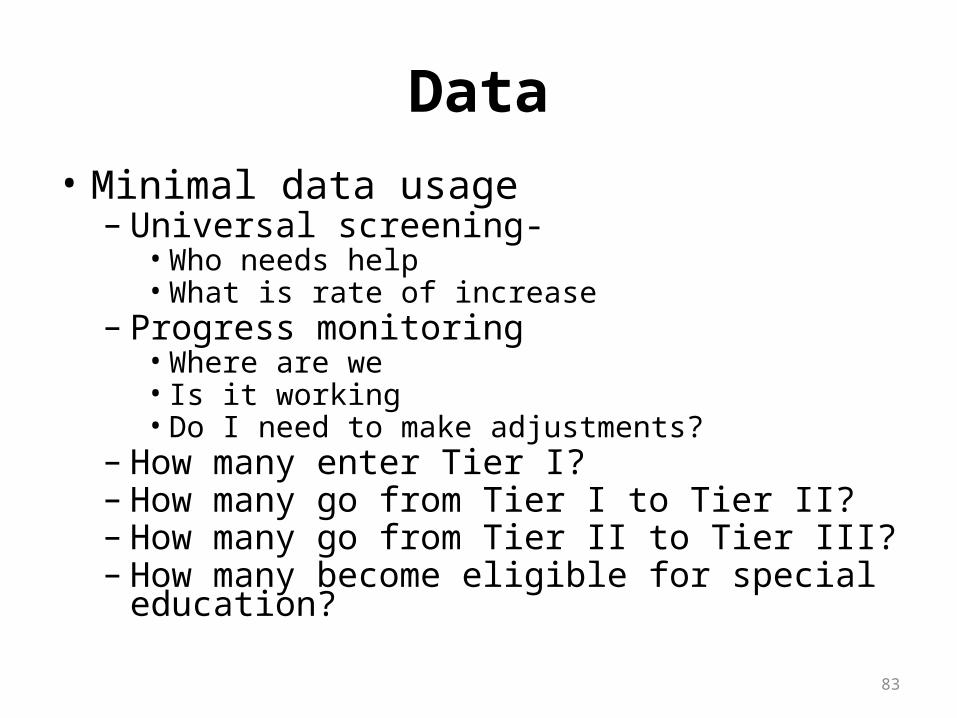
Data• Minimal data usage
– Universal screening-• Who needs help• What is rate of increase
– Progress monitoring• Where are we• Is it working• Do I need to make adjustments?
– How many enter Tier I?– How many go from Tier I to Tier II?– How many go from Tier II to Tier III?– How many become eligible for special education?
84
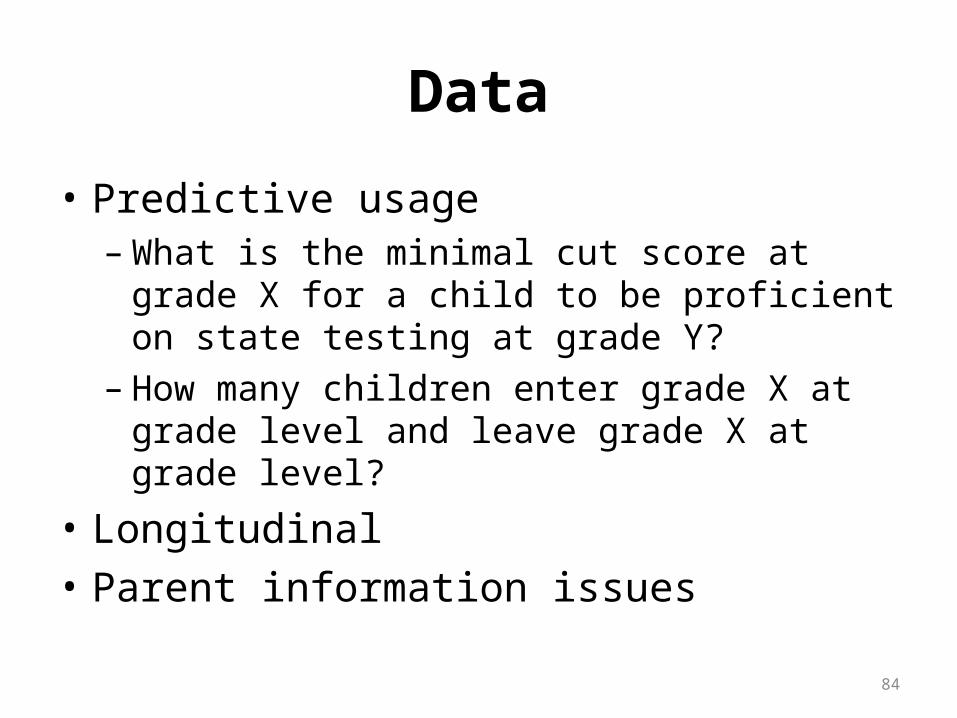
Data
• Predictive usage– What is the minimal cut score at grade X for a
child to be proficient on state testing at grade Y?– How many children enter grade X at grade level
and leave grade X at grade level?
• Longitudinal• Parent information issues
85
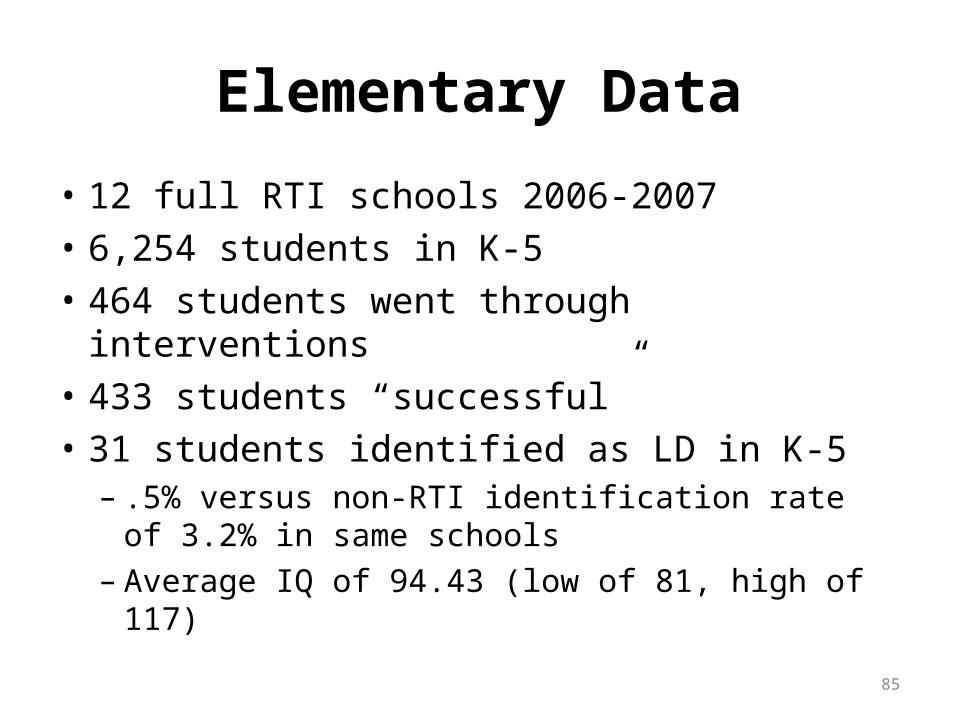
Elementary Data
• 12 full RTI schools 2006-2007• 6,254 students in K-5• 464 students went through interventions• 433 students “successful” • 31 students identified as LD in K-5
– .5% versus non-RTI identification rate of 3.2% in same schools
– Average IQ of 94.43 (low of 81, high of 117)
86
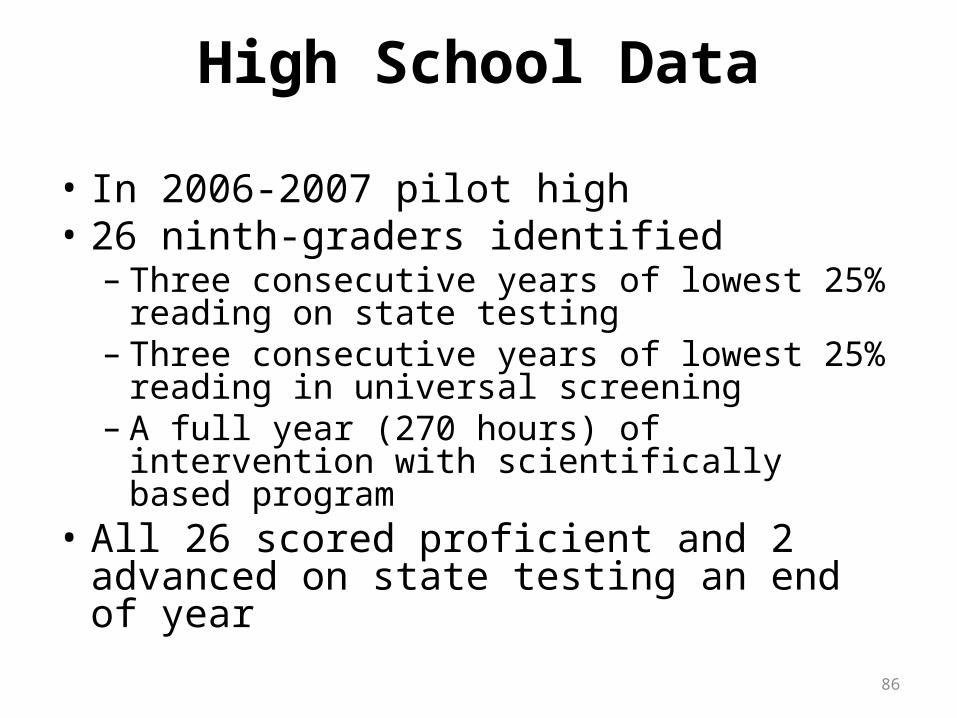
High School Data
• In 2006-2007 pilot high• 26 ninth-graders identified
– Three consecutive years of lowest 25% reading on state testing
– Three consecutive years of lowest 25% reading in universal screening
– A full year (270 hours) of intervention with scientifically based program
• All 26 scored proficient and 2 advanced on state testing an end of year
87
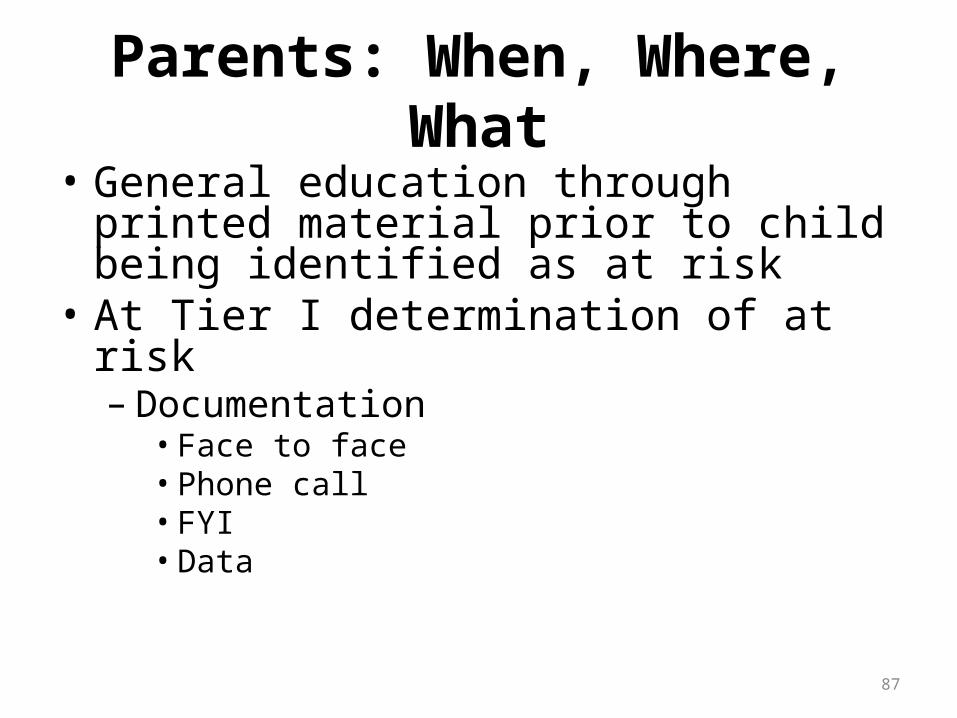
Parents: When, Where, What• General education through printed material
prior to child being identified as at risk• At Tier I determination of at risk
– Documentation• Face to face• Phone call• FYI • Data

88
Resistance
• Prepare for resistance• The enemy is within!!!!
89
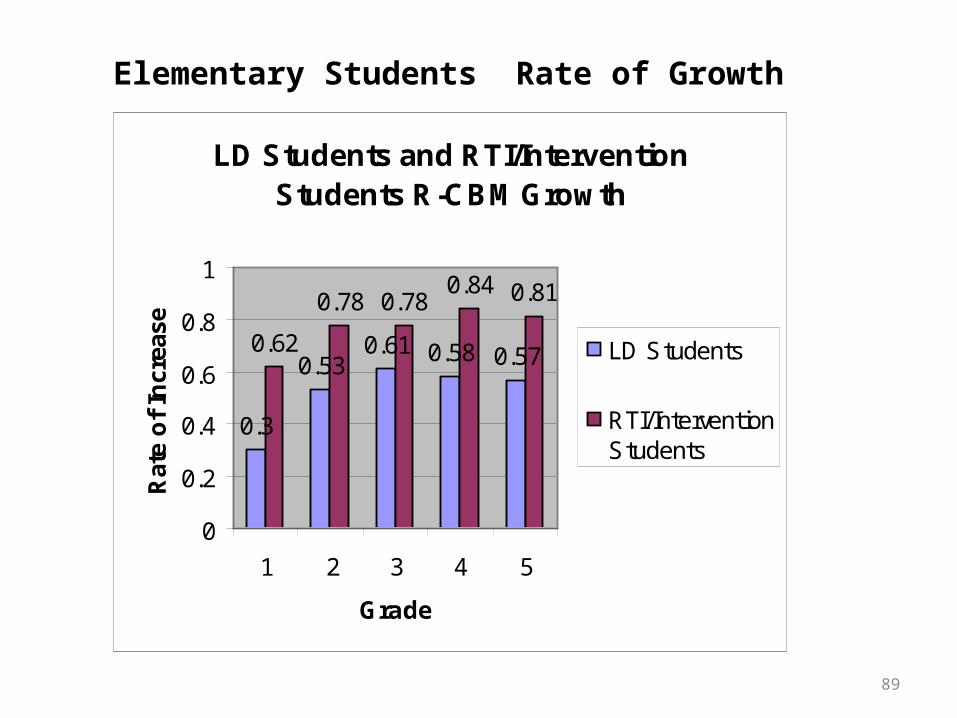
LD Students and RTI/Intervention Students R-CBM Growth
0.3
0.530.61 0.58 0.570.62
0.78 0.780.84 0.81
0
0.2
0.4
0.6
0.8
1
1 2 3 4 5
Grade
Rat
e o
f In
crea
se
LD Students
RTI/InterventionStudents
Elementary Students Rate of Growth


![McCook Weekly Tribune. (McCook, NE) 1884-05-01 [p ].€¦ · WHISPERS OF THE VIBE Call for a Meeting in the Interest of Reducing National Taxation.-](https://img.pdfslide.us/doc/110x75/601726f8d088ee406010fbba/mccook-weekly-tribune-mccook-ne-1884-05-01-p-whispers-of-the-vibe-call-for.jpg)

![The McCook Tribune. (McCook, NE) 1890-12-26 [p ]. · 2019. 2. 6. · f-Uf McCOOK, NE- B.OYEE. 'TIE: SOMTE.A'E- JtltAKJCA. yairs ATfJ) XOTES.- FREMONT'S. Y.M. C. A..has.a mem- bership](https://img.pdfslide.us/doc/110x75/606cf575154c055b55010d08/the-mccook-tribune-mccook-ne-1890-12-26-p-2019-2-6-f-uf-mccook-ne-.jpg)
![The McCook Tribune. (McCook, NE) 1889-04-19 [p ]....Thayor has.issued his pro-clamation-*&. * i"A " organizing Hooker county. Stella dispatch says the town was 111 * muchexcitedthe,](https://img.pdfslide.us/doc/110x75/5e5a5188001ebf1346211216/the-mccook-tribune-mccook-ne-1889-04-19-p-thayor-hasissued-his-pro-clamation-.jpg)


![McCook Weekly Tribune. (McCook, NE) 1885-02-26 [p ]. · The Auburn creamery will resume busi- ... William Meyer, of Omaha, attempted to retain possession of Mrs. Lathrop's little](https://img.pdfslide.us/doc/110x75/5f83ccbc363ebc0c04163184/mccook-weekly-tribune-mccook-ne-1885-02-26-p-the-auburn-creamery-will-resume.jpg)

![The McCook Tribune. (McCook, NE) 1890-06-13 [p ]. · 2019-02-06 · H ' THE M'COOK TRIBUNE- B F. Iff. KIMrtlKLIi, Pnbllnhcr-.M. McCOOK, ..N-EB.H. state mewhl- H NEBRASKA MISCELLANEOUS](https://img.pdfslide.us/doc/110x75/5ecca2cea0af283cb576c29d/the-mccook-tribune-mccook-ne-1890-06-13-p-2019-02-06-h-the-mcook-tribune-.jpg)


![The McCook Tribune. (McCook, NE) 1886-06-24 [p ]](https://img.pdfslide.us/doc/110x75/615a3b22ef7d0d46562f01c7/the-mccook-tribune-mccook-ne-1886-06-24-p-.jpg)