Embed Size (px)
DESCRIPTION
Critical Infrastructure Protection In the Transportation Network. A Mathematical Model and Methodology for Determining and Analyzing The k -Critical Links of a Highway Network. Objective. - PowerPoint PPT Presentation
Citation preview

Department of EMISSMU School of Engineering
Leadership in Engineering
Critical Infrastructure Protection In the Transportation Network
A Mathematical Model and Methodology for Determining and Analyzing
The k-Critical Links of a Highway Network

2Department of EMIS
SMU School of Engineering
Leadership in Engineering
Objective
• The objective of this dissertation is to develop a methodology, using a SE approach, and apply the methodology to a mathematical model, using performance metrics such as travel time and flow, to simulate the impacts k-Links disconnects have on highway networks of major metropolitan cities for risk mitigation and resource allocation

3Department of EMIS
SMU School of Engineering
Leadership in Engineering
The Systems Engineering Process
• Problem Definition and Need Identification
• Feasibility Study
• Operational Requirements
• Maintenance Support Concept
• Technical Performance Measures
• Functional Analysis and Allocation

4Department of EMIS
SMU School of Engineering
Leadership in Engineering
The Systems Engineering Process
• Trade-Off Analyses
• System Specification

5Department of EMIS
SMU School of Engineering
Leadership in Engineering
Problem Definition and Need Analysis
• Defining the System – System of SystemsAgriculture
Water
Public Health
EmergencyServices
DefenseIndustrial
Base
Telecom.
EnergyTransportation
Government
Chemical andHazMat
Postal andShipping
Banking andFinance
FoodAgriculture
Water
Public Health
EmergencyServices
DefenseIndustrial
Base
Telecom.
EnergyTransportation
Government
Chemical andHazMat
Postal andShipping
Banking andFinance
Food

6Department of EMIS
SMU School of Engineering
Leadership in Engineering
Example of Model
1
2
a
i
b c
3
4
6, 300
5, 4006, 700
4, 400
3, 300
1
2
a
i
b c
3
4
6, 300
5, 400
8, 4503, 450
4, 700
1
2
a
i
b c
3
4
6, 300
5, 4006, 700
4, 400
3, 3004, 700
4, 250
Problem Definition and Need Analysis

7Department of EMIS
SMU School of Engineering
Leadership in Engineering
Feasibility Study
• What tools are available to perform analysis?
• What methods have been developed in this area?

8Department of EMIS
SMU School of Engineering
Leadership in Engineering
Operational Requirements
Requirements
OperatingEnvironment
OperationalLife Cycle
UtilizationRequirements
PrimeDefinitionOf Mission
PerformanceParameters
OperationalDeployment
EffectivenessFactors

9Department of EMIS
SMU School of Engineering
Leadership in Engineering
Maintenance Concept
• Levels of Maintenance
• Repair Policies
• Organizational Responsibilities
• Maintenance Support Elements
• Effectiveness Requirements
• Environment

10Department of EMIS
SMU School of Engineering
Leadership in Engineering
Technical Performance Parameters
EfficiencyOf Model
AccuracyOf Model
Sim
ula
tion

11Department of EMIS
SMU School of Engineering
Leadership in Engineering
Functional AnalysisC
ompo
nent
s
• Transportation CI SoS
INPUT•Disconnects•Hrs of Op.
PROCESS•Mathematical model
Att
ribu
tes
•Flow•Distance
•Links •Nodes•Efficiency of model
RelationshipsMovement of Goods
Efficiently Finding K Links
Perf. of Defined
Links
OUTPUT•Performance
•Disconnects•Hours of operation

12Department of EMIS
SMU School of Engineering
Leadership in Engineering
Functional Analysis
SystemRequirements
SystemSolution
Validate &Verify
Actual Model
System Objective
City Boundary
Section of City
Small Network Enumeration
SimulationProcessing Time
Functional Analysis
SimulationProcessing Time

13Department of EMIS
SMU School of Engineering
Leadership in Engineering
OutputPerformance:•Travel Time/Throughput
I35W I35E I45
I35W I35E Hwy 75
I20
I30
I20
InputSingle Disconnect; 1/0
Variables•Temporal Time of Day: I =1, 2, 3 (peak, norm, other)•Links: l =(i,j), [(i+1), (j+1)],…, (i+n, j+n)
L1 L2 L3
L8 L7 L6
L5
L4
L9
Information Flow
I=1
I=1
Network
Trade-Off Analysis

14Department of EMIS
SMU School of Engineering
Leadership in Engineering
1
2
a
i
b c
3
4
6, 300
5, 4004, 250
8, 450
6, 700
4, 400
3, 300
3, 450
a i b c 3 41 3002 400a 450 250i 450b 700c 400 300
Flow = Veh / Hr
Trade-Off Analysis: Link (a,b)
Time, Flow
1,3 = {1,a a,i i,b b,c c,3} = 271,3 = {1,a a,b b,c c,3} = 201,4 = {1,a a,i i,b b,c c,4} = 261,4 = {1,a a,b b,c c,4} = 192,4 = {1,a a,i i,b b,c c,3} = 262,3 = {1,a a,b b,c c,3} = 192,4 = {1,a a,i i,b b,c c,4} = 252,4 = {1,a a,b b,c c,4} = 18
O D Matrix3 4
1 200 1002 200 200

15Department of EMIS
SMU School of Engineering
Leadership in Engineering
1
2
a
i
b c
3
4
6, 300
5, 400
8, 700
6, 700
4, 400
3, 300
3, 700
Trade-Off Analysis: Link (a,b)
a i b c 3 41 3002 400a 700 0i 700b 700c 400 300
Flow = Veh / Hr 1,3 = {1,a a,i i,b b,c c,3} = 271,3 = {1,a a,b b,c c,3} = 201,4 = {1,a a,i i,b b,c c,4} = 261,4 = {1,a a,b b,c c,4} = 192,4 = {1,a a,i i,b b,c c,3} = 262,3 = {1,a a,b b,c c,3} = 192,4 = {1,a a,i i,b b,c c,4} = 252,4 = {1,a a,b b,c c,4} = 18
O D Matrix3 4
1 200 1002 200 200
Avg. T = 2.5Min/Veh

16Department of EMIS
SMU School of Engineering
Leadership in Engineering
Trade-Off Analysis: All Links
DisconnectLink
MarkDisconnected
Link i,j
ConnectLink
Go to NextLink i,j
LinkModeled
OutputPerformance All Links
Marked
StoreData
RunAlgorith
mshort/long
NO
YES
NO
YESAnalyzeOutputs
17Department of EMIS
SMU School of Engineering
Leadership in Engineering
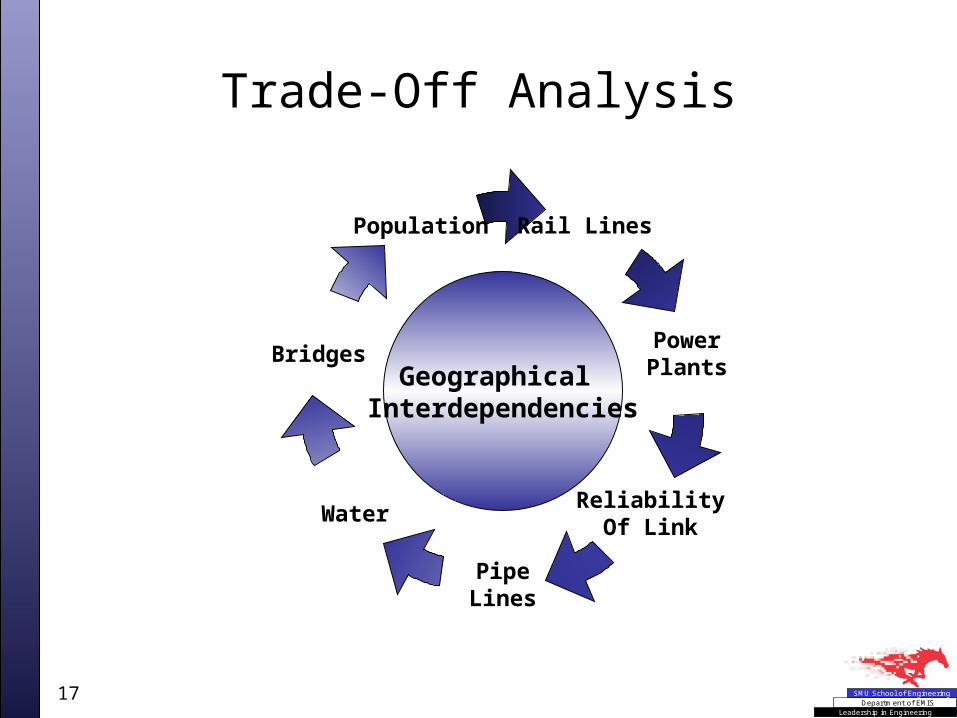
Trade-Off Analysis
Rail Lines
Bridges
Population
PowerPlants
ReliabilityOf Link
PipeLines
Water
Geographical Interdependencies

18Department of EMIS
SMU School of Engineering
Leadership in Engineering
0.0
100.0
200.0
300.0
400.0
500.0
System
System 412.2 268.0 479.6 383.8 402.5
Link a Link b Link c Link d Link e
DefinedLinks Link a Link b Link c Link d Link eLink 1 17.2 25.1 35.0 72.0 19.1Link 2 74.0 36.3 93.4 19.8 15.6Link 3 22.2 17.4 28.8 0.5 97.4Link 4 37.1 74.2 32.0 29.7 28.0Link 5 90.7 9.3 95.5 98.1 60.7Link 6 28.9 32.9 82.7 61.7 54.8Link 7 75.1 23.1 1.2 14.9 13.2Link 8 43.1 33.8 64.5 18.4 60.3Link 9 23.9 16.0 46.4 68.9 53.4System 412.2 268.0 479.6 383.8 402.5
Links in Network
Example of Model: Performance for a General Metric
OUTPUTS
Sum of Performance
, …,
Trade-Off Analysis

19Department of EMIS
SMU School of Engineering
Leadership in Engineering
0.0
50.0
100.0
150.0
200.0
250.0
300.0
350.0
400.0
450.0
500.0
(2, 11) (1, 11) (2, 12) (3, 14) (1, 12) (4, 7) (5, 6) (3, 8) (4, 8) (2, 5) (3, 8) (1, 2) (3, 5) (2, 4) (4, 5) (5, 8)
Example of Model
Links
Perf
orm
ance
Worst
Best
OUTPUTS
0 is threshold
k Links = {2,11}, …, {1,12}affecting the TransportationCI the most
Trade-Off Analysis

20Department of EMIS
SMU School of Engineering
Leadership in Engineering
Validation and Verification
• SE Approach– Integrations Process– Verify and Validate Requirements
• Model– Small Network– Enumeration– Efficiency of Model
System Specification

21Department of EMIS
SMU School of Engineering
Leadership in Engineering
Research Significance
• Contribution: This dissertation provides officials a decision-making methodology and tool for resource allocation and risk mitigation– Metrics that measure the performance of the
network given disconnects occurring– Ranking of k Links affecting the network the most

22Department of EMIS
SMU School of Engineering
Leadership in Engineering
Research Significance
• Decision Making Methodology and Tool

23Department of EMIS
SMU School of Engineering
Leadership in Engineering
Conclusion
• Transportation CI is important– To individuals’ way of life – To companies’ way of doing business
• Proposed a Methodology using a Mathematical Model to Determine Impact of k Links Disconnects have on the Defined Links of a Network for risk mitigation and resource allocation

24Department of EMIS
SMU School of Engineering
Leadership in Engineering
Conclusion
• Research Significance– Society: A Methodology and Tool for Officials to
use in the Decision Making Process– Engineering:
• Systems Engineering Approach for Solving Complex Systems
• Efficient and Accurate Network Modeling for Large and Complex Systems