Embed Size (px)
Citation preview

“Critical Evaluation of Financial Services provided
for Marginal Entrepreneurs by Selected Banks in
Gujarat”
A Thesis submitted to Gujarat Technological University
for the Award of
Doctor of Philosophy
in
Management
by
Dubal Jahnavi Kishorbhai
[Enrollment No. 119997392011]
under supervision of
Prof. (Dr.) Ram Kumar Balyan
GUJARAT TECHNOLOGICAL UNIVERSITY
AHMEDABAD
August- 2021

© Dubal Jahnavi Kishorbhai

i
DECLARATION
I declare that the thesis entitled “Critical Evaluation of Financial Services provided for
Marginal Entrepreneurs by Selected Banks in Gujarat” submitted by me for the degree of
Doctor of Philosophy is the record of research work carried out by me during the period from
September, 2011 to August, 2021 under the supervision of Prof. (Dr.) Ram Kumar Balyan and
this has not formed the basis for the award of any degree, diploma, associateship,
fellowship, titles in this or any other University or other institution of higher learning.
I further declare that the material obtained from other sources has been duly acknowledged in
the thesis. I shall be solely responsible for any plagiarism or other irregularities, if noticed in
the thesis.
Signature of the Research Scholar: Date: 07/08/2021
Name of Research Scholar: Ms. Dubal Jahnavi Kishorbhai
Place: Ahmedabad

ii
CERTIFICATE
I certify that the work incorporated in the thesis “Critical Evaluation of Financial Services
provided for Marginal Entrepreneurs by Selected Banks in Gujarat” submitted by
Kumari Dubal Jahnavi Kishorbhai was carried out by the candidate under my
supervision/guidance. To the best of my knowledge: (i) the candidate has not submitted the
same research work to any other institution for any degree/diploma, Associateship, Fellowship
or other similar titles (ii) the thesis submitted is a record of original research work done by the
Research Scholar during the period of study under my supervision, and (iii) the thesis
represents independent research work on the part of the Research Scholar.
Signature of Supervisor: Date: 07/08/2021
Name of Supervisor: Prof. (Dr.) Ram Kumar Balyan
Place: Ahmedabad
iii
Course –work Completion Certificate
This is to certify that Ms. Dubal Jahnavi Kishorbhai, Enrolment no.: 119997392011 is a PhD
scholar enrolled for PhD program in the branch Management of Gujarat Technological
University, Ahmedabad.
(Please tick the relevant option(s))
He/ She has been exempted from the course-work (successfully completed during
M.Phil Course)
He/ She has been exempted from Research Methodology Course only (successfully
completed during M.Phil Course)
He/ She has successfully completed the PhD course work for the partial requirement
for the award of PhD Degree. His/ Her performance in the course work is as follows-
Grades Obtained in Research Methodology
(PH001)
Grades Obtained in Self Study Course (Core
Subject)
(PH002)
AB BB
Supervisor’s Sign:
Prof. (Dr.) Ram Kumar Balyan
iv
Originality Report Certificate
It is certified that PhD Thesis titled “Critical Evaluation of Financial Services provided for
Marginal Entrepreneurs by Selected Banks in Gujarat” by Dubal Jahnavi Kishorbhai
has been examined by us. We undertake the following:
a) Thesis has significant new work / knowledge as compared already published or are under
consideration to be published elsewhere. No sentence, equation, diagram, table, paragraph or
section has been copied verbatim from previous work unless it is placed under quotation marks
and duly referenced.
b) The work presented is original and own work of the author (i.e. there is no plagiarism). No
ideas, processes, results or words of others have been presented as Author own work.
c) There is no fabrication of data or results which have been compiled / analysed.
d) There is no falsification by manipulating research materials, equipment or processes, or
changing or omitting data or results such that the research is not accurately represented in the
research record.
e) The thesis has been checked using Urkund (copy of originality report attached) and
found within limits (5%) as per GTU Plagiarism Policy and instructions issued from time to
time (i.e. permitted similarity index <=25%).
Signature of the Research Scholar : Date: 07/08/2021
Name of Research Scholar: Dubal Jahnavi Kishorbhai
Place: Ahmedabad
Signature of Supervisor: Date: 07/08/2021
Name of Supervisor: Prof. (Dr.) Ram Kumar Balyan
Place: Ahmedabad
v
Urkund Analysis Result
Analysed Document: Thesis_J. K. Dubal.“Critical Evaluation of Financial Services
provided for Marginal Entrepreneurs by Selected Banks in
Gujarat”.docx (D112493710)
Submitted: 9/13/2021 2:53:00 PM
Submitted By: [email protected]
Significance: 5 %
Sources included in the report:
Nileshsir.docx (D55471032)
Full Text - KR GOLA Thesis 2017.doc (D28195066) Mahipal Gadhvi Ch5+Ch6.pdf
(D22204034) Suman Arora 30-12-2015.pdf (D17612275)
MSME-Access to Finance Revised.pdf (D36306628)
https://www.slideshare.net/ResurgentIndia/empowering-msmes-role-of-banks-financial-
institutions-it-skill-development-rating-agencies
https://docplayer.net/amp/147208399-Financing-india-s-msmes.html
https://docplayer.net/6980022-Sub-group-on-flow-of-private-sector-investments-for-msme-
sector-executive-summary.html
https://www.giz.de/en/downloads/giz2013-en-msme-knowledge-series.pdf
https://fr.slideshare.net/ResurgentIndia/improving-access-to-finance
Instances where selected sources appear:
34

vi
PhD THESIS Non-Exclusive License to
GUJARAT TECHNOLOGICAL UNIVERSITY
In consideration of being a PhD Research Scholar at GTU and in the interests of the facilitation
of research at GTU and elsewhere, I, Dubal Jahnavi Kishorbhai having Enrollment No.:
119997392011, hereby grant a non-exclusive, royalty free and perpetual license to GTU on the
following terms:
a) GTU is permitted to archive, reproduce and distribute my thesis, in whole or in part, and/or
my abstract, in whole or in part (referred to collectively as the “Work”) anywhere in the world,
for non-commercial purposes, in all forms of media;
b) GTU is permitted to authorize, sub-lease, sub-contract or procure any of the acts mentioned
in paragraph (a);
c) GTU is authorized to submit the Work at any National / International Library, under the
authority of their “Thesis Non-Exclusive License”;
d) The Universal Copyright Notice (©) shall appear on all copies made under the authority of
this license;
e) I undertake to submit my thesis, through my University, to any Library and Archives. Any
abstract submitted with the thesis will be considered to form part of the thesis.
f) I represent that my thesis is my original work, does not infringe any rights of others, including
privacy rights, and that I have the right to make the grant conferred by this non-exclusive
license.
g) If third party copyrighted material was included in my thesis for which, under the terms of
the Copyright Act, written permission from the copyright owners is required, I have obtained
such permission from the copyright owners to do the acts mentioned in paragraph (a) above for
the full term of copyright protection.
h) I retain copyright ownership and moral rights in my thesis, and may deal with the copyright
in my thesis, in any way consistent with rights granted by me to my University in this non-
exclusive license.
vii
i) I further promise to inform any person to whom I may hereafter assign or license my
copyright in my thesis of the rights granted by me to my University in this non-exclusive
license.
j) I am aware of and agree to accept the conditions and regulations of PhD including all policy
matters related to authorship and plagiarism.
Signature of the Research Scholar:
Name of Research Scholar: Dubal Jahnavi Kishorbhai
Date: 07/08/2021 Place: Ahmedabad
Signature of Supervisor:
Name of Supervisor: Prof. (Dr.) Ram Kumar Balyan
Date:07/08/2021 Place: Ahmedabad
Seal:

viii
(briefly specify the modifications suggested by the panel)
(The panel must give justifications for rejecting the research work)
Thesis Approval Form
The viva-voce of the PhD Thesis submitted by Ms. Dubal Jahnavi Kishorbhai (Enrollment No.
119997392011) entitled “Critical Evaluation of Financial Services provided for Marginal
Entrepreneurs by Selected Banks in Gujarat” was conducted on 07/08/2021 at
Gujarat Technological University.
(Please tick any one of the following option)
The performance of the candidate was satisfactory. We recommend that he/she be
awarded the PhD degree.
Any further modifications in research work recommended by the panel after 3 months
from the date of first viva-voce upon request of the Supervisor or request of
Independent Research Scholar after which viva-voce can be re-conducted by the same
panel again.
The performance of the candidate was unsatisfactory. We recommend that he/she
should not be awarded the PhD degree.
Prof. (Dr) Ram Kumar Balyan Supervisor 1) Prof. (Dr) Sanjay Bhayani
(External Examiner 1)
2) Prof. (Dr) Hanuman Prasad 3) (External Examiner 3) Name and Signature
(External Examiner 2)
ix
ABSTRACT
Entrepreneurs are the growth engine of the economy. They act as change agent by playing vital
role in the process of industrial and economic development of any country. It makes significant
contribution in gratifying various socio-economic objectives such as growth in employment,
increased output, promotion of exports etc. The role of entrepreneurship in economic
development varies from economy to economy depending upon its material resources,
industrial climate and the responsiveness of the political system to the entrepreneurial function.
Path breaking offerings by entrepreneurs, in the form of new goods & services, result in new
employment, which can produce a cascading effect or virtuous circle in the economy. If we
understand the benefits and drawbacks, a balanced approach to nurturing entrepreneurship will
definitely result in a positive impact on economy and society.
The study aims at financial necessity of the marginal entrepreneurs, various sources of finance,
their difficulty in procuring the same and if finance adequately in time then their potential to
the growth of the economy. The research problem is Critical Evaluation of financial services
provided for marginal entrepreneurs by selected banks in Gujarat. Keeping in view, the role
and importance of small entrepreneurs and their necessity of finance and difficulties in getting
it and if financed ultimately leads to enhanced economy performance. After careful
investigation of literature, researcher found that there is lack of research in bank finance to
entrepreneurs especially in the Gujarat. Various researchers have found the different aspects of
financing gap. But among all, the bank finance is considered as the primary source of finance
and there is urgent need to analyses the reasons of unavailability of bank finance to the
entrepreneurs. That is why the topic has attracted me to select for research study.
For this study, primary and secondary data are used. To collect the primary data from
respondents, researcher has used the structured questionnaire. Separate questionnaires prepared
for the entrepreneurs and bankers. For the collection of secondary data, published annual
reports of selected banks, data available in RBI website and other authenticated sites and
documents are used.
This study is analytical in nature. After collecting the data from primary and secondary sources,
thorough analysis is done from various aspects. Further, to test the demand side and supply
side hypothesis of the study, researcher has used the Chi Square technique. On the basis of
same, findings are presented.

x
ACKNOWLEDGEMENT
I wish to express my sincere gratitude to those individuals who have continuously supported
me during my journey of the doctoral research. Foremost, I would like to express my deepest
regards and my most sincere gratitude to my supervisor Professor (Dr.) Ram Kumar Balyan,
Professor and Director, Sant Kabir Institute of Professional Studies, Ahmedabad, for the
continuous support for my research, for his patience, motivation, enthusiasm, and immense
knowledge. His guidance helped me in all the time of research and writing of this thesis. I could
not have imagined having a better advisor and mentor for my doctoral study.
The completion of the doctoral work could not have been possible without flawless support
and guidance of the DPC (Doctoral Progress Committee) Members: Dr. Gurpreet Arora,
Dean, Sant Kabir Institute of Professional Studies, Ahmedabad, and Dr. Dharmendra Mistry,
Principal, Navgujarat College, Ahmedabad, who guided me through my final proceedings of
the thesis submission. I would like to express that they have not only helped me through the
PhD proceedings, but has always guided my career in the right direction since last eight years
ever since I joined Ph.D. Program. Their unconditional support, cooperation and correct
guidance would always be remembered.
I would like to extend my thanks towards entire team of Gujarat Technological University for
all their support and all the expert panel members of each of the research week presentations
for their valuable suggestions.
My journey of research was always supported by my parents Shree Kishorbhai O. Dubal and
Smt. Minaxiben K. Dubal, and my brother Shree Chinmay K. Dubal. The thesis is dedicated to
them for all their support, love and motivation. Their unconditional affection was the factor
that kept me going during the ups and downs of the doctoral process.
Last but not the least I thank almighty God for the blessings and strength which has made this
possible. In conclusion, I thank all those who have directly or indirectly contributed to make
this journey successful.
Dubal Jahnavi Kishorbhai
xi
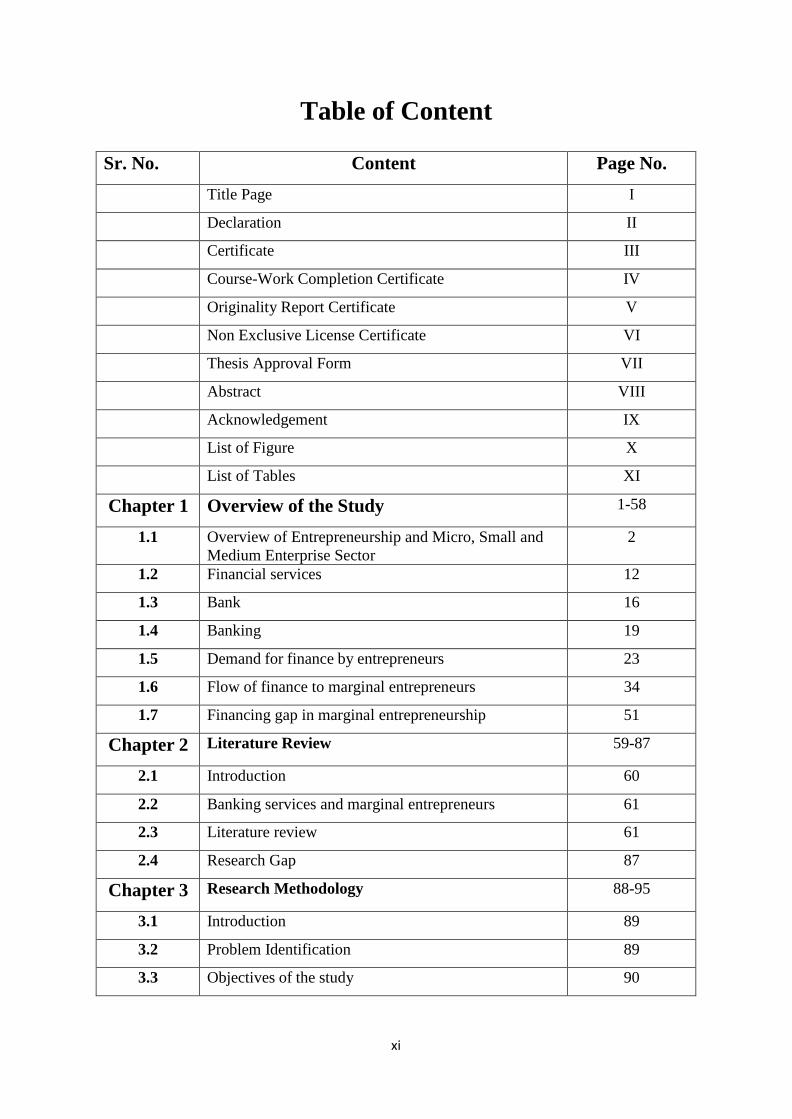
Table of Content
Sr. No. Content Page No.
Title Page I
Declaration II
Certificate III
Course-Work Completion Certificate IV
Originality Report Certificate V
Non Exclusive License Certificate VI
Thesis Approval Form VII
Abstract VIII
Acknowledgement IX
List of Figure X
List of Tables XI
Chapter 1 Overview of the Study 1-58
1.1 Overview of Entrepreneurship and Micro, Small and
Medium Enterprise Sector
2
1.2 Financial services 12
1.3 Bank 16
1.4 Banking 19
1.5 Demand for finance by entrepreneurs 23
1.6 Flow of finance to marginal entrepreneurs 34
1.7 Financing gap in marginal entrepreneurship 51
Chapter 2 Literature Review 59-87
2.1 Introduction 60
2.2 Banking services and marginal entrepreneurs 61
2.3 Literature review 61
2.4 Research Gap 87
Chapter 3 Research Methodology 88-95
3.1 Introduction 89
3.2 Problem Identification 89
3.3 Objectives of the study 90
xii
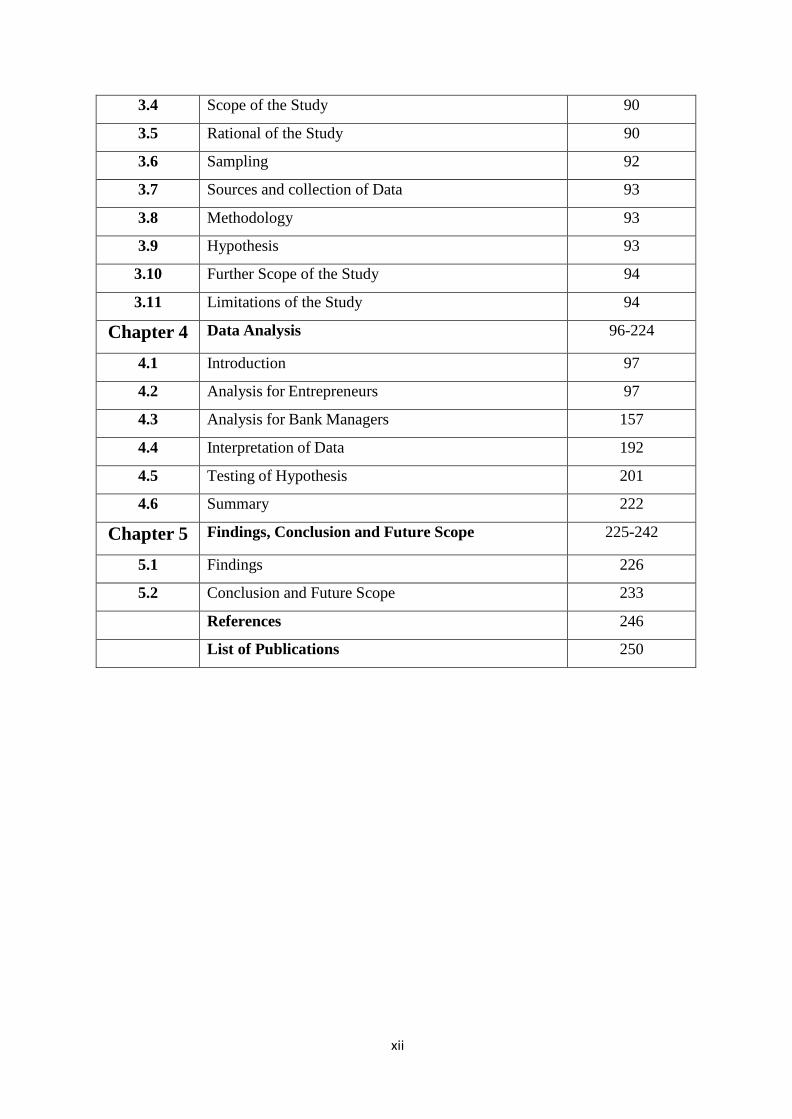
3.4 Scope of the Study 90
3.5 Rational of the Study 90
3.6 Sampling 92
3.7 Sources and collection of Data 93
3.8 Methodology 93
3.9 Hypothesis 93
3.10 Further Scope of the Study 94
3.11 Limitations of the Study 94
Chapter 4 Data Analysis 96-224
4.1 Introduction 97
4.2 Analysis for Entrepreneurs 97
4.3 Analysis for Bank Managers 157
4.4 Interpretation of Data 192
4.5 Testing of Hypothesis 201
4.6 Summary 222
Chapter 5 Findings, Conclusion and Future Scope 225-242
5.1 Findings 226
5.2 Conclusion and Future Scope 233
References 246
List of Publications 250
Chapter 1 Page 1
Chapter - 1
Overview of the Study
Chapter contents:
1.1 Introduction
1.2 Financial Services
1.3 Bank
1.4 Banking
1.5 Demand for finance by
entrepreneurs
1.6 Flow of finance to marginal
entrepreneurs sector
1.7 Financing gap in marginal
entrepreneurs sector
Chapter 1 Page 2
1. Overview of Entrepreneurship and Micro, Small and Medium Enterprise Sector:
1.1 Introduction:
Enterprise is defined as the act of creating, innovating and setting up a business, taking
financial risks expecting profits. The enterprise in company form offers a product, a process
or service for sale or hires to professionals or individuals, contributing to a community’s
overall economic development. Entrepreneurs are the growth engine of the economy. They
act as change agent by playing vital role in the process of industrial and economic
development of any country. It makes significant contribution in gratifying various socio-
economic objectives such as growth in employment, increased output, promotion of exports
etc. The role of entrepreneurship in economic development varies from economy to economy
depending upon its material resources, industrial climate and the responsiveness of the
political system to the entrepreneurial function .Path breaking offerings by entrepreneurs, in
the form of new goods & services, result in new employment, which can produce a cascading
effect or virtuous circle in the economy .If we understand the benefits and drawbacks, a
balanced approach to nurturing entrepreneurship will definitely result in a positive impact on
economy and society.
Entrepreneurship is known for the high risks involved in launching a startup. The fact is
people often suffer failures along the their path to success, and some businesses have to close,
due to a lack of fund, sales decisions, or a lack of demand in the market. That’s why
entrepreneurship is mostly viewed as something risky and out of the comfort zone. Enterprise
takes courage to make ones dreams come true and see possibilities, solutions and opportunities
for the future where others see only problems. Entrepreneurs face many challenges
specifically of funding. Although, various sources of finances are available to the small
Entrepreneurs, mainly divided into two: formal and informal. Timely availability of finance
from formal sources always remains challenging. The study aims at the importance of
marginal entrepreneurs in the growth of the economy, distinct problems faced by them
specifically difficulty in availability of finance and their potential, if financed in required
amount at the time necessary, ultimately leads to the enhanced economic performance.
Indian economy is conquered by entrepreneurs with a vivacious set of enterprises, which are
prestigiously known as Micro, Small and Medium Enterprises. Contribution of entrepreneurs
in the form of small and medium sized firms has always significant in the Indian economy.

Chapter 1 Page 3
Prevailing and new generation entrepreneurs have played significant role in generating GDP,
creating employment opportunities, producing goods and services at lower costs and
generating foreign exchange through trade. Identifying the significant contribution of
entrepreneurs in economic growth and also in employment generation in the country,
Government of India had taken various initiatives to develop them and SMEs. Looking to
the significance of entrepreneurs and SMEs, it is estimated that if India aspirations to have
growth rate of 8 – 10% for the next couple of decades, it needs a strong facilitation and
environment for entrepreneurs and SME sector. Without that, it seems to be very difficult to
achieve the sustainable growth.
Today, there are about 30 million MSMEs in the country and this sector has shown an
average growth of 18% over the last five years. In this backdrop, MSME is considered to be
fast growing sector of the economy. The sector is gaining more prominence to realize the
theme of 12thFive Year Plan (2012-2017), ‘faster, sustainable and more inclusive growth’.
However, there is an existing market failure between entrepreneurs and potential financiers,
financing gap to be present. For the progress of entrepreneurs, finance is the most vital
element, without that, growth and development of any enterprise is not possible. Various
researches have proved that bank finance is one of the major source of finance for
entrepreneurs apart from other sources. Though, availability of bank finance as per
requirement is always be a critical issue. In spite of various efforts by the Government of
India and Reserve Bank of India, it is considered as unsettled issue for entrepreneurs and
banks.
1.2 Micro, Small and Medium Enterprise Sector:
Generally the term ‘MSME’ portray the small businesses in the private sector. Different
countries use different factor such as employee strength, annual sales, value of fixed assets,
and loan size proxies to define the sector in the context of finance. In India, the Micro, Small
and Medium Enterprise Development Act 2006 of the Government of India provides the
definition of the MSME sector. The definition uses investment in plant and machinery as a
factor to category the enterprises. Following table 1 shows the definition of MSMED Act.
Chapter 1 Page 4
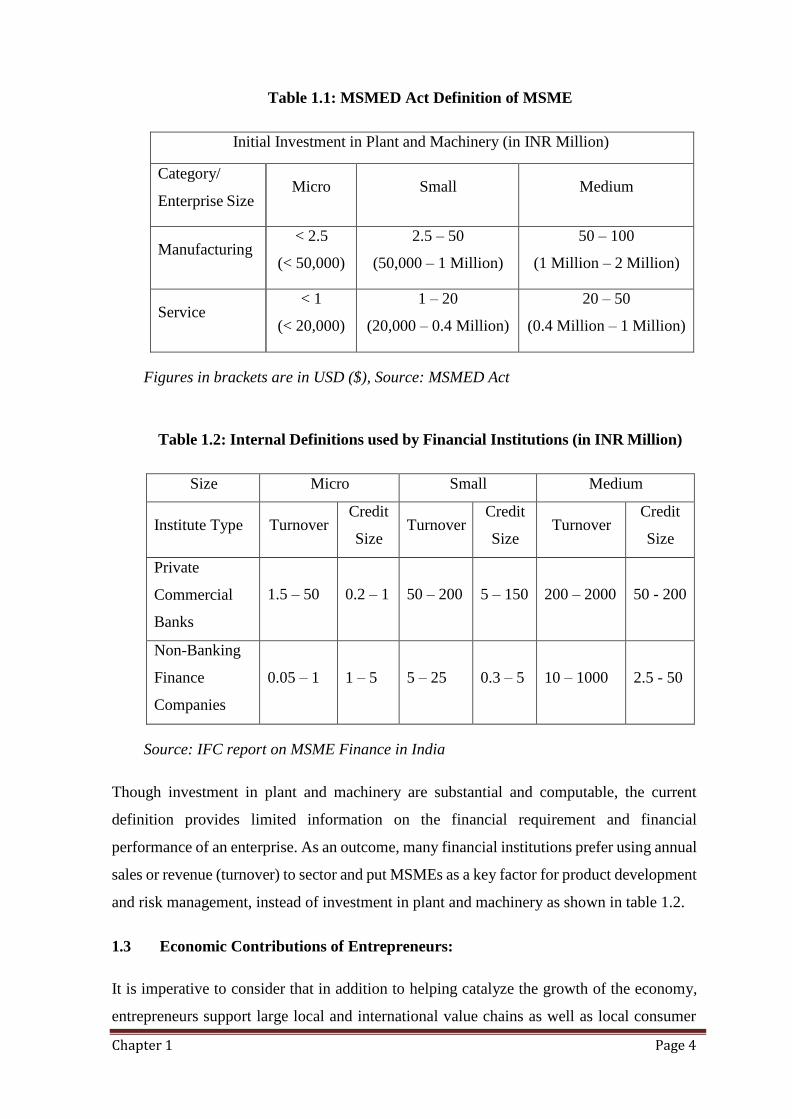
Table 1.1: MSMED Act Definition of MSME
Initial Investment in Plant and Machinery (in INR Million)
Category/
Enterprise Size Micro Small Medium
Manufacturing < 2.5
(< 50,000)
2.5 – 50
(50,000 – 1 Million)
50 – 100
(1 Million – 2 Million)
Service < 1
(< 20,000)
1 – 20
(20,000 – 0.4 Million)
20 – 50
(0.4 Million – 1 Million)
Figures in brackets are in USD ($), Source: MSMED Act
Table 1.2: Internal Definitions used by Financial Institutions (in INR Million)
Size Micro Small Medium
Institute Type Turnover Credit
Size Turnover
Credit
Size Turnover
Credit
Size
Private
Commercial
Banks
1.5 – 50
0.2 – 1
50 – 200
5 – 150
200 – 2000
50 - 200
Non-Banking
Finance
Companies
0.05 – 1
1 – 5
5 – 25
0.3 – 5
10 – 1000
2.5 - 50
Source: IFC report on MSME Finance in India
Though investment in plant and machinery are substantial and computable, the current
definition provides limited information on the financial requirement and financial
performance of an enterprise. As an outcome, many financial institutions prefer using annual
sales or revenue (turnover) to sector and put MSMEs as a key factor for product development
and risk management, instead of investment in plant and machinery as shown in table 1.2.
1.3 Economic Contributions of Entrepreneurs:
It is imperative to consider that in addition to helping catalyze the growth of the economy,
entrepreneurs support large local and international value chains as well as local consumer
Chapter 1 Page 5
515
100 100
18
markets as supplier, manufacturers, contractors, distributors, retailers and service providers
via Micro, Small and Medium Enterprises. They are responsible for a very large share of
industrial units and in addition have a say considerably to employment in the country.
Following table 1.3 present the key statistic on economic contribution of MSME sector.
Table 1.3 Key Statistics on Economic Contribution of MSME
Share of Value
Industrial Units 95%
Industrial Output 45%
Exports [in value] 40%
Gross Domestic Product (GDP) 8%
Employment (in millions) 69
Source: Ministry of MSME, Annual Report, 2009-10; RBI
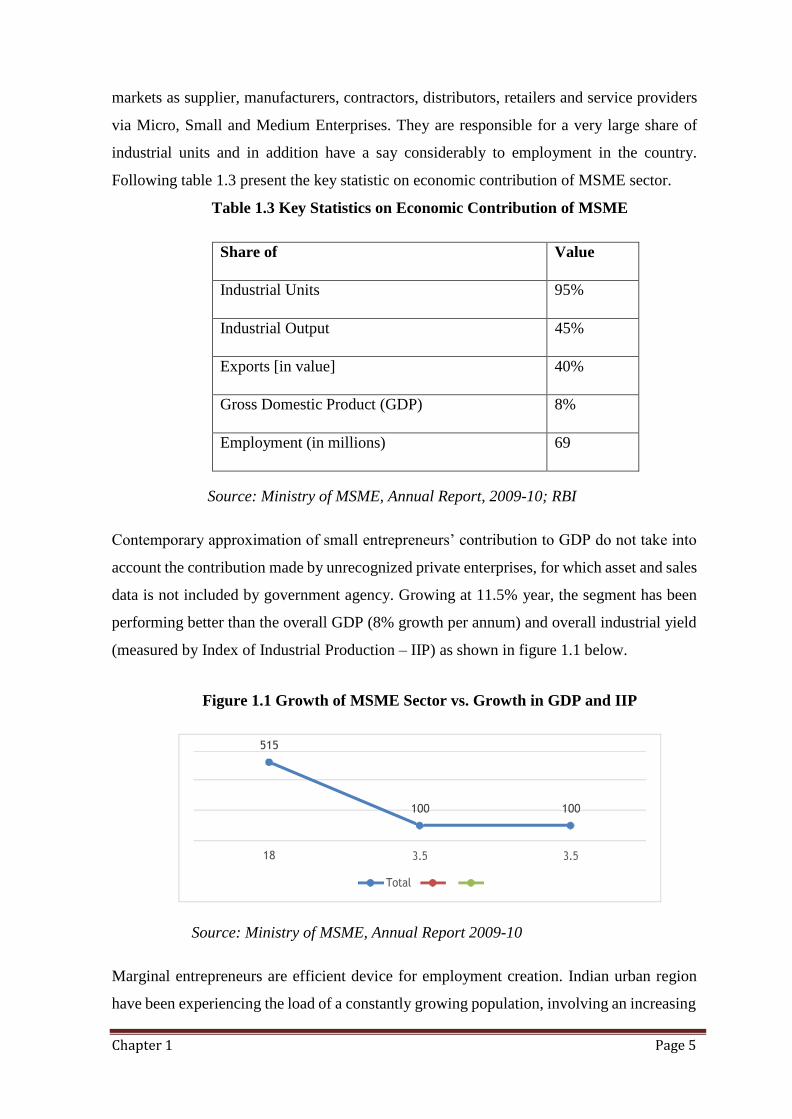
Contemporary approximation of small entrepreneurs’ contribution to GDP do not take into
account the contribution made by unrecognized private enterprises, for which asset and sales
data is not included by government agency. Growing at 11.5% year, the segment has been
performing better than the overall GDP (8% growth per annum) and overall industrial yield
(measured by Index of Industrial Production – IIP) as shown in figure 1.1 below.
Figure 1.1 Growth of MSME Sector vs. Growth in GDP and IIP
Source: Ministry of MSME, Annual Report 2009-10
Marginal entrepreneurs are efficient device for employment creation. Indian urban region
have been experiencing the load of a constantly growing population, involving an increasing
Chapter 1 Page 6
fraction of migrant in search of employment and source of revenue. City transportation is
already prolonged, and policy makers are looking for way out to moderate issues occurring
from migrant population enlargement. rustic marginal entrepreneurs and those stayed outside
of the mega cities, offer a feasible option for employment to local manpower, consequently,
giving a prospect for public to contribute in prolific, non-farm actions, with no requiring to
move around to city areas. With sufficient monetary and non-financial resources, as well as
capacity building, the marginal entrepreneurs segment can raise and contribute to economic
development noticeably higher than it is doing currently.
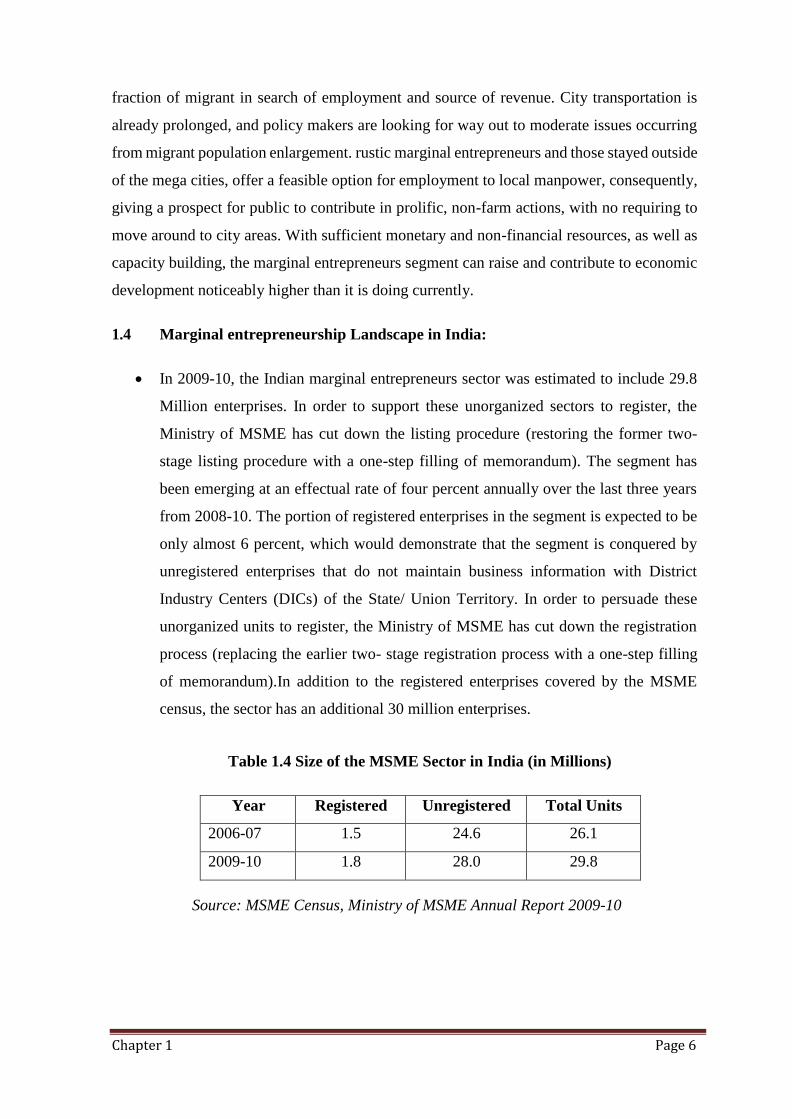
1.4 Marginal entrepreneurship Landscape in India:
In 2009-10, the Indian marginal entrepreneurs sector was estimated to include 29.8
Million enterprises. In order to support these unorganized sectors to register, the
Ministry of MSME has cut down the listing procedure (restoring the former two-
stage listing procedure with a one-step filling of memorandum). The segment has
been emerging at an effectual rate of four percent annually over the last three years
from 2008-10. The portion of registered enterprises in the segment is expected to be
only almost 6 percent, which would demonstrate that the segment is conquered by
unregistered enterprises that do not maintain business information with District
Industry Centers (DICs) of the State/ Union Territory. In order to persuade these
unorganized units to register, the Ministry of MSME has cut down the registration
process (replacing the earlier two- stage registration process with a one-step filling
of memorandum).In addition to the registered enterprises covered by the MSME
census, the sector has an additional 30 million enterprises.
Table 1.4 Size of the MSME Sector in India (in Millions)
Year Registered Unregistered Total Units
2006-07 1.5 24.6 26.1
2009-10 1.8 28.0 29.8
Source: MSME Census, Ministry of MSME Annual Report 2009-10
Chapter 1 Page 7
1.5 Heterogeneity in the Marginal Entrepreneurship Sector:
The segment is classified into Micro, Small and Medium based on the size of the enterprise,
as defined earlier. Each of these segment however is extremely diverse, due to differences
in ownership structure, area of operation, type of industry, and the stage of development of
an enterprise. Business activities of these units are not governed by any legal provision, and
these usually do not preserve any official financial accounts. Most of these can be defined
as the micro enterprises.
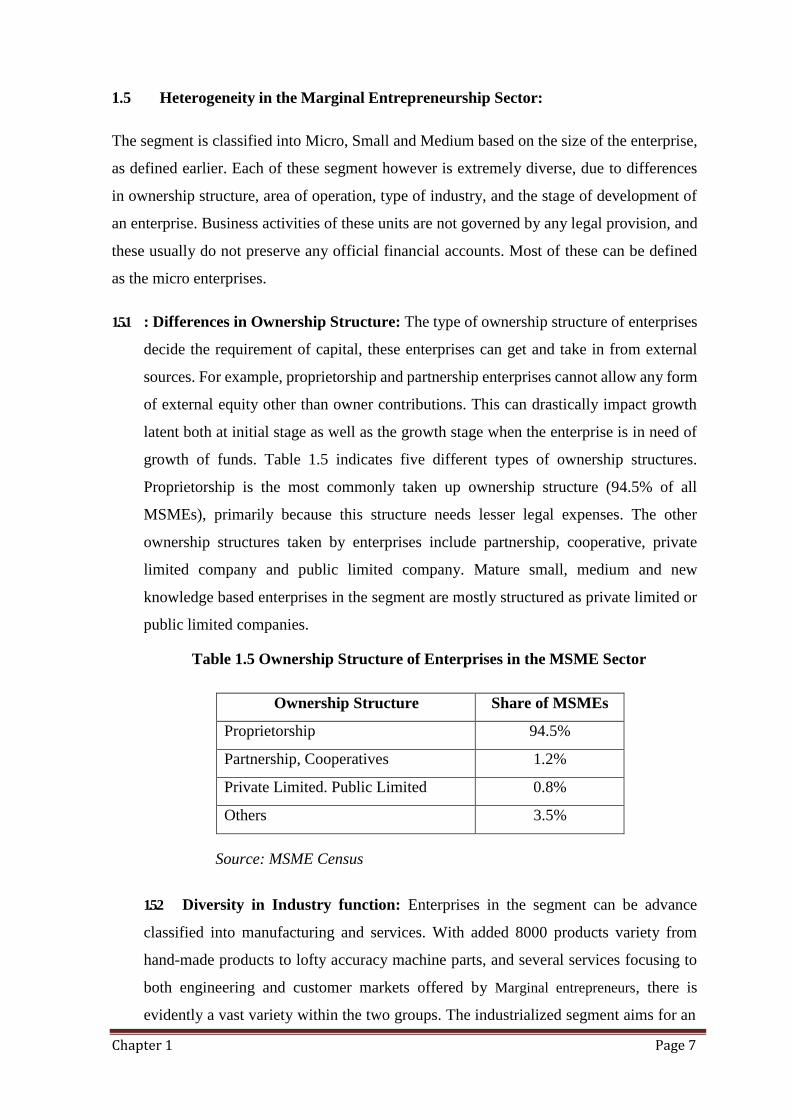
1.5.1 : Differences in Ownership Structure: The type of ownership structure of enterprises
decide the requirement of capital, these enterprises can get and take in from external
sources. For example, proprietorship and partnership enterprises cannot allow any form
of external equity other than owner contributions. This can drastically impact growth
latent both at initial stage as well as the growth stage when the enterprise is in need of
growth of funds. Table 1.5 indicates five different types of ownership structures.
Proprietorship is the most commonly taken up ownership structure (94.5% of all
MSMEs), primarily because this structure needs lesser legal expenses. The other
ownership structures taken by enterprises include partnership, cooperative, private
limited company and public limited company. Mature small, medium and new
knowledge based enterprises in the segment are mostly structured as private limited or
public limited companies.
Table 1.5 Ownership Structure of Enterprises in the MSME Sector
Ownership Structure Share of MSMEs
Proprietorship 94.5%
Partnership, Cooperatives 1.2%
Private Limited. Public Limited 0.8%
Others 3.5%
Source: MSME Census
1.5.2 Diversity in Industry function: Enterprises in the segment can be advance
classified into manufacturing and services. With added 8000 products variety from
hand-made products to lofty accuracy machine parts, and several services focusing to
both engineering and customer markets offered by Marginal entrepreneurs, there is
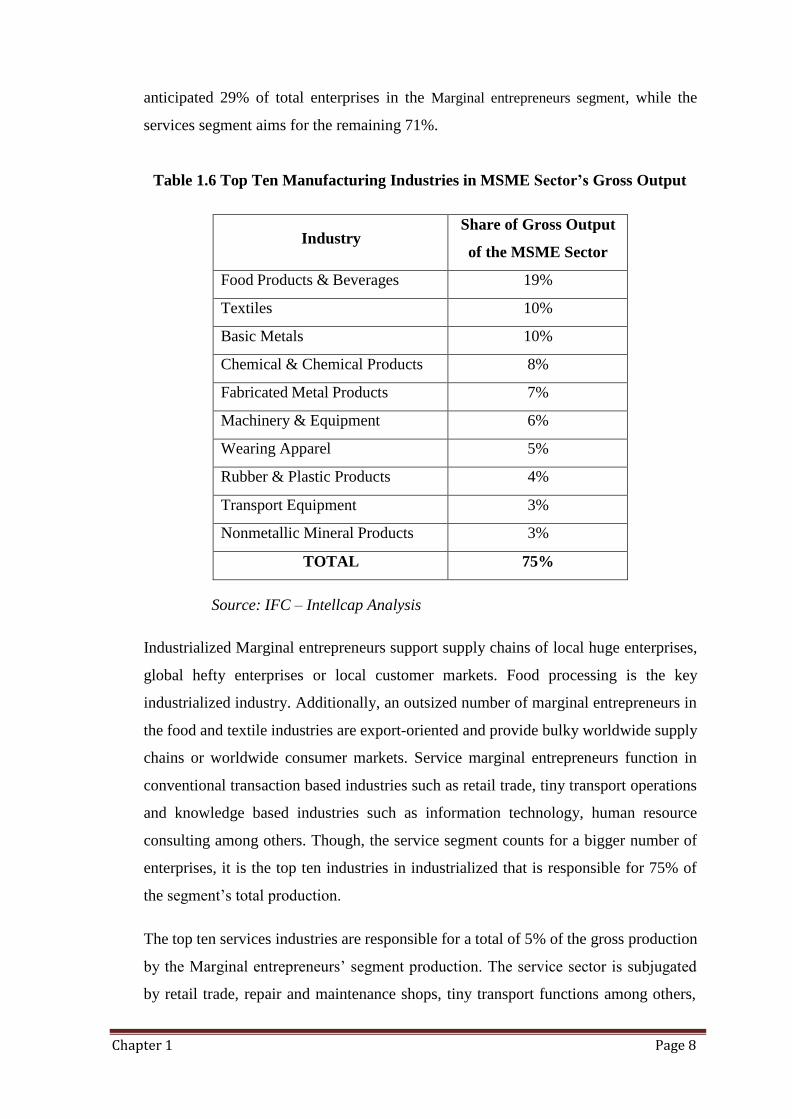
evidently a vast variety within the two groups. The industrialized segment aims for an
Chapter 1 Page 8
anticipated 29% of total enterprises in the Marginal entrepreneurs segment, while the
services segment aims for the remaining 71%.
Table 1.6 Top Ten Manufacturing Industries in MSME Sector’s Gross Output
Industry Share of Gross Output
of the MSME Sector
Food Products & Beverages 19%
Textiles 10%
Basic Metals 10%
Chemical & Chemical Products 8%
Fabricated Metal Products 7%
Machinery & Equipment 6%
Wearing Apparel 5%
Rubber & Plastic Products 4%
Transport Equipment 3%
Nonmetallic Mineral Products 3%
TOTAL 75%
Source: IFC – Intellcap Analysis
Industrialized Marginal entrepreneurs support supply chains of local huge enterprises,
global hefty enterprises or local customer markets. Food processing is the key
industrialized industry. Additionally, an outsized number of marginal entrepreneurs in
the food and textile industries are export-oriented and provide bulky worldwide supply
chains or worldwide consumer markets. Service marginal entrepreneurs function in
conventional transaction based industries such as retail trade, tiny transport operations
and knowledge based industries such as information technology, human resource
consulting among others. Though, the service segment counts for a bigger number of
enterprises, it is the top ten industries in industrialized that is responsible for 75% of
the segment’s total production.
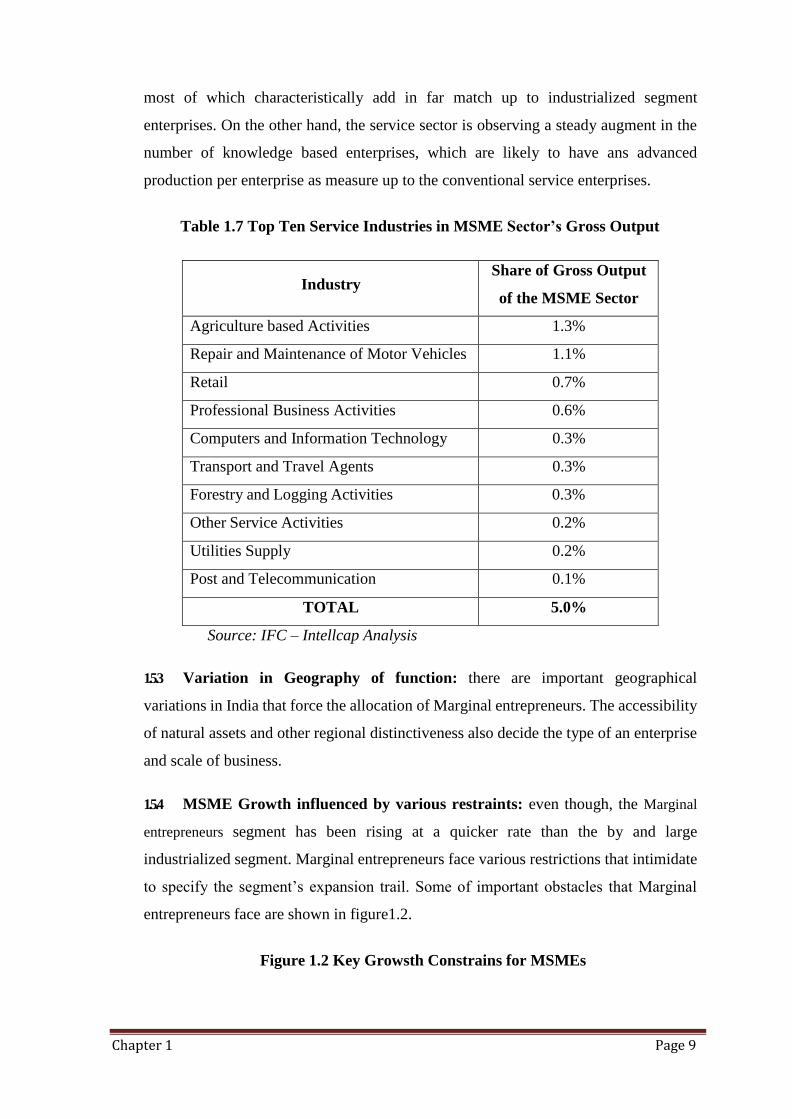
The top ten services industries are responsible for a total of 5% of the gross production
by the Marginal entrepreneurs’ segment production. The service sector is subjugated
by retail trade, repair and maintenance shops, tiny transport functions among others,
Chapter 1 Page 9
most of which characteristically add in far match up to industrialized segment
enterprises. On the other hand, the service sector is observing a steady augment in the
number of knowledge based enterprises, which are likely to have ans advanced
production per enterprise as measure up to the conventional service enterprises.
Table 1.7 Top Ten Service Industries in MSME Sector’s Gross Output
Industry Share of Gross Output
of the MSME Sector
Agriculture based Activities 1.3%
Repair and Maintenance of Motor Vehicles 1.1%
Retail 0.7%
Professional Business Activities 0.6%
Computers and Information Technology 0.3%
Transport and Travel Agents 0.3%
Forestry and Logging Activities 0.3%
Other Service Activities 0.2%
Utilities Supply 0.2%
Post and Telecommunication 0.1%
TOTAL 5.0%
Source: IFC – Intellcap Analysis
1.5.3 Variation in Geography of function: there are important geographical
variations in India that force the allocation of Marginal entrepreneurs. The accessibility
of natural assets and other regional distinctiveness also decide the type of an enterprise
and scale of business.
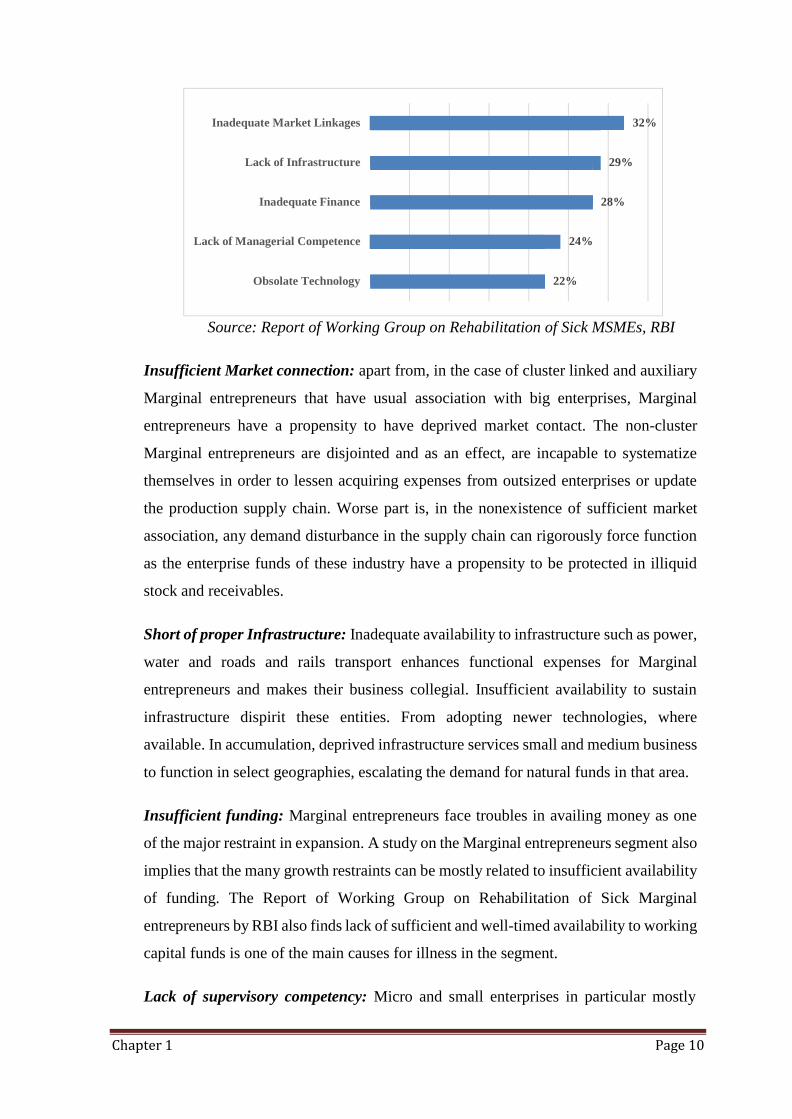
1.5.4 MSME Growth influenced by various restraints: even though, the Marginal
entrepreneurs segment has been rising at a quicker rate than the by and large
industrialized segment. Marginal entrepreneurs face various restrictions that intimidate
to specify the segment’s expansion trail. Some of important obstacles that Marginal
entrepreneurs face are shown in figure1.2.
Figure 1.2 Key Growsth Constrains for MSMEs
Chapter 1 Page 10
Inadequate Market Linkages 32%
Lack of Infrastructure 29%
Inadequate Finance 28%
Lack of Managerial Competence 24%
Obsolate Technology 22%
Source: Report of Working Group on Rehabilitation of Sick MSMEs, RBI
Insufficient Market connection: apart from, in the case of cluster linked and auxiliary
Marginal entrepreneurs that have usual association with big enterprises, Marginal
entrepreneurs have a propensity to have deprived market contact. The non-cluster
Marginal entrepreneurs are disjointed and as an effect, are incapable to systematize
themselves in order to lessen acquiring expenses from outsized enterprises or update
the production supply chain. Worse part is, in the nonexistence of sufficient market
association, any demand disturbance in the supply chain can rigorously force function
as the enterprise funds of these industry have a propensity to be protected in illiquid
stock and receivables.
Short of proper Infrastructure: Inadequate availability to infrastructure such as power,
water and roads and rails transport enhances functional expenses for Marginal
entrepreneurs and makes their business collegial. Insufficient availability to sustain
infrastructure dispirit these entities. From adopting newer technologies, where
available. In accumulation, deprived infrastructure services small and medium business
to function in select geographies, escalating the demand for natural funds in that area.
Insufficient funding: Marginal entrepreneurs face troubles in availing money as one
of the major restraint in expansion. A study on the Marginal entrepreneurs segment also
implies that the many growth restraints can be mostly related to insufficient availability
of funding. The Report of Working Group on Rehabilitation of Sick Marginal
entrepreneurs by RBI also finds lack of sufficient and well-timed availability to working
capital funds is one of the main causes for illness in the segment.
Lack of supervisory competency: Micro and small enterprises in particular mostly
Chapter 1 Page 11
consist of first-generation entrepreneurs, who have had a limited structured education
on resource setting up, funds management and manpower management. As an outcome,
lack of managerial capability often demonstrated in improper book-keeping and a
limited awareness of recognized financial institutions, which additionally hinder the
expansion of these enterprises.
Outdated technology: As industries such as automotive, forging, software development
segment require advanced technologies in functions, the many of the small and medium
entrepreneurs do not have that kind of technological edge. A low technology foundation
results in low efficiency, which makes these entrepreneurs less competitive. Financial
institutions connect lack of technology with collegial businesses and therefore are
cautious of financing entrepreneurs which are not technologically up-to-date in
functions. These entrepreneurs have inadequate knowledge about new technologies, or
the technology financing schemes.
The 2007 Marginal entrepreneurs Census indicated that only 5% of entrepreneurs in the
segment had availability to several types of recognized finance, while over 92% of the
entities found having short of availability to any type of institutional finance. Studies
on financing pattern in the segment and the Marginal entrepreneurs survey advocate
that Marginal entrepreneurs prefer self-financing, which not only includes the savings
of the entrepreneurs, but also the funding availed from friends, family and relatives.
Table 1.8 Percentage of Split of MSMEs by Sources of Finance
No Finance/
Self Finance
Through
Institutional Sources
Through Non
institutionalSources
Percentage of
Enterprises 92.80% 5.20% 2.10%
Source: MSME Census 2007
Nevertheless, the situation has been varying in current days. As a consequence of larger
focus on the Marginal entrepreneurs segment by the government and the regulator as
well as by the financial sector, institutional finance to Marginal entrepreneurs has been
enlarged significantly. Working on the 2010 data from the Reserve Bank of India (RBI),
the study approximates that financial institutions provide, to some point or the other,
nearly (33%) of the Marginal entrepreneurs.
Chapter 1 Page 12
Conversely, in spite of the enhanced availability, various micro and small entrepreneurs
stay not served and underserved. Policymakers in India have always maintained a watch
on Marginal entrepreneurs funding, as specified by the Priority Sector Lending (PSL)
norms for commercial banks that were set, and have been in place, for some decades
now. Setting programs such as the Credit Guarantee Trust in present days has given a
changed drive to that object. On the other hand, in spite of the policy efforts and a
evidently more receptive recognized financial segment, the Marginal entrepreneurs
segment go on with to face a funding gap due to intrinsic demand and supply-side
restraints. This study highlights on some of these major confronts.
2. Financial Service
2.1 Introduction
Financial services are the economic services provided by the finance industry, which takes in
a wide variety of organizations that administer money, including credit unions, banks, credit
card companies, insurance companies, consumer finance companies, stock brokerages,
investment funds and some government sponsored enterprises.
2.2 History of financial services
The term "financial services" became more widespread in the United States partly as a result
of the Gramm-Leach-Bliley Act of the late 1990s, which facilitated different types of
companies working in the U.S. financial services industry at that time to amalgamate.
Companies typically have two separate approaches to this new type of business. One approach
would be banks which just acquire an insurance company or an investment bank, maintain the
original sort of the obtained firm, and insert the acquirement to its investment company only
to expand its paycheck. Outside the U.S. (e.g., in Japan), non-financial services companies
are allowed within the investment company. In this situation, each company still appears
autonomous, and has its own clientele, etc. In the other method, a bank would merely make
its own brokerage unit or insurance unit and try to sell those products to its own current
clientele, with inducement for uniting all things with one company.
2.3 Different Financial Services
Banks: A "commercial bank" is what is usually referred to as merely a "bank". The word
"commercial" is used to differentiate it from an "investment bank," a sort of financial services
unit which, instead of lending money directly to a business, helps business move up money
from other firms in the form of bonds (debt) or stock (equity).
Banking services
Chapter 1 Page 13
The key functions of banks include:
Maintaining money safe also allowing withdrawals as and needed.
Issuing cheque books so that invoices can be settled and other types of payments can
be made.
Facilitate personal loans, commercial loans, and mortgage loans. (usually loans to buy
a home, property or business premises)
Issuing and processing credit cards transactions and invoices
Issuing debit cards for use as an alternate for cheques.
Make possible financial transactions at branches or by using Automatic Teller
Machines (ATMs)
Transfers of funds and Electronic fund transfers between banks
Facility of standing orders and direct debits, so payments for invoices can be made
fast and automatically.
Facilitate overdraft agreements for the temporary advances of the Bank's own fund to
settle monthly spending expenses of a consumer in their current account.
Facilitate with internet banking system to the customers to view and function their
respective accounts through internet.
Facilitate Charge card advances of the Bank's own fund for consumers wanting to
settle credit advances monthly.
Facilitate a cheque guarantee by the Bank itself and prepaid by the customer, such as
a cashier's cheque or certified cheque.
Notary service for financial and other documents
Accepting the deposits from customer and provide the credit facilities to them.
Other financial services
1. Intermediation or advisory services - These services include stock brokers (private
client services) and discount brokers. Stock brokers help investors in buying or selling
shares. For the most part, internet-based companies are frequently referred to as
discount brokerages, even though many now have branch offices to help clients. These
brokerages basically assist individual investors. Full service and private client firms
chiefly help and implement trades for clients with large amount of capital to invest,
such as big companies, wealthy individuals, and investment management funds.
2. Equity - Private equity funds are normally closed-end funds, which typically take
controlling equity stakes in business that are either private, or taken private once
Chapter 1 Page 14
obtained. Private equity funds frequently utilize leveraged buyouts (LBOs) to acquire
the firms in which they invest. The most successful private equity funds can produce
returns extensively higher than provided by the equity markets
3. Venture capital is a type of private equity capital normally provided by professional,
external investors to new, high-potential-growth companies in the interest of
captivating the company to an IPO or trade sale of the business.
4. Angel investment - An angel investor or angel known as a business angel or informal
investor in Europe, is a prosperous person who provides capital for a business start-
up, typically in exchange for convertible debt or ownership equity. A tiny but
increasing number of angel investors organize themselves into angel groups or angel
networks to allocate research and pool their investment capital.
5. Conglomerates - A financial services conglomerate is a financial services firm that is
active in more than one sector of the financial services market e.g. life insurance,
general insurance, health insurance, asset management, retail banking, wholesale
banking, investment banking, etc. A main reason for the survival of such business is
the subsistence of diversification advantage that are there when different types of
business are collectivized i.e. bad things don't always happen at the same time. As a
result, economic capital for a conglomerate is normally considerably less than
economic capital is for the sum of its parts.
6. Debt resolution - It is a customer service that helps persons having large debt to pay
off as asked for, but do not want to file insolvency and want to pay off their debts
owed. This debt can be accumulated in several ways involving but not limited to
personal loans, credit cards or in some cases merchant accounts. There are many
services/companies that can help with this.
2.4 Financial Services in India
Indian financial markets, largely consisting of segments like asset management, banking,
insurance, foreign direct investments and foreign institutional investors, efficiently uphold the
savings of the economy by straightening them towards suitable investment alternatives. The
Indian financial sector is very well developed, competitive and integrated to face all troubles.
World Economic Forum’s latest report ‘Financial Development Report 2012’ has named India
as the world's top-ranked country in terms of life insurance density. Life insurance density is
the ratio of direct domestic premiums for life insurance to per capita gross domestic product
of a country. India has been ranked 40th in terms of overall financial development of a
Chapter 1 Page 15
country, but is much ahead of larger economies like the US, UK, Japan and China for life
insurance density.
Banking Services
Important recent statistics related to the Indian banking industry are discussed below:
According to the Reserve Bank of India (RBI)’s ‘Quarterly Statistics on Deposits and Credit
of Scheduled Commercial Banks’, March 2012, nationalized Banks accounted for 53.0 per
cent of the aggregate deposits, while the State Bank of India (SBI) and its Associates
accounted for 21.8 per cent. The share of New Private Sector Banks, Old Private Sector
Banks, Foreign Banks, and Regional Rural Banks in aggregate deposits was 13.0 per cent, 4.8
per cent, 4.4 per cent and 3.0 per cent, respectively. Nationalized Banks are responsible for
the highest share of 52.0 per cent in gross bank credit followed by State Bank of India and its
Associates (22.5 per cent) and New Private Sector Banks (13.5 per cent). Foreign Banks, Old
Private Sector Banks and Regional Rural Banks had shares of around 4.8 per cent, 4.8 per
cent and 2.4 per cent, respectively. Another statement issued by the RBI revealed that foreign
exchange reserves stood at, US$ 294.99 billion for the week ended January 4, 2013 wherein
the value of gold reserves was recorded at US$ 27.21 billion and that of foreign currency
assets (FCAs) was at US$ 261.06 billion. The value of special drawing rights (SDRs) was
US$ 4.40 billion and the country’s reserve position with the IMF was at US$ 2.30 billion.
Financial Services in India: Recent Developments
The Ergo Insurance Group, part of world’s leading reinsurer Munich Re, and the
Avantha Group, India's leading business conglomerate, have came into a joint venture
agreement in the space of life insurance. The new company, to be named Avantha
Ergo Life Insurance Company Ltd, is anticipated to begin function at the beginning of
2014, subject to regulatory approval.
The Small Industries Development Bank of India (SIDBI) has associated with eight
regional rural banks (RRBs) and urban co-operative banks in West Bengal. The scope
of agreements involves training the staff of RRBs and co-operative banks in project
appraisal, monitoring and collection as also providing free availability to software on
a down-scaling methodology designed for lending to micro enterprises.
Financial Services: Government Initiatives
The Indian Government has re-affirmed its efforts to push economic growth by increasing the
FDI limit from 26 per cent to 49 per cent in insurance. The reform is anticipated to delight
international players who had been waiting to venture into India and also persuade existing
Chapter 1 Page 16
players to enlarge their stakes in strategic association. The Indian insurance sector needs US$
10-12 billion capital infusion in the next five years. Moreover, in a bid to magnetize higher
foreign inflows, the Government of India (GoI) has released up an opportunity for FIIs of all
authorities to earn tax-free interest by investing in debt instruments of a state-owned
enterprise. Owing to this landmark move, FIIs and non-resident Indian (NRIs) have been
consented to invest in the public issue of tax-free bonds by Housing and Urban Development
Corporation that released up on January 9, 2013.
The GoI has also permitted the institution of a Credit Risk Guarantee Fund Trust (CRGFT)
for low income housing, with a preliminary spend of Rs.1000 crore (US$ 185.92 million).
The CRGFT, scheduled on May 1, 2012 and initiated on October 31, 2012 would administer
and operate the Scheme, which is demand-driven, as stated by Ajay Maken, Union Minister
of Housing & Urban Poverty Alleviation (HUPA).
3. Bank
3.1 Introduction
A bank is a financial institution and a financial intermediary that collects the deposits and
channelizes those deposits into lending activities, either directly by loaning or indirectly
through capital markets. A bank is the link between customers that have capital requirements
and customers with capital surpluse.
Due to the pursuance within a financial system and an economy, banks are usually highly
regulated in most countries. Most banks operate under a system known as fractional reserve
banking where they hold merely a small reserve of the funds deposited and lend out the rest
for profit. They are usually subject to minimum capital requirements which are based on an
worldwide set of capital standards, known as the Basel norms.
The oldest bank still in subsistence is Monte deiPaschi di Siena, headquartered in Siena, Italy,
which has been functioning continuously since 1472. It is followed by Berenberg Bank of
Hamburg (1590) and SverigesRiksbank of Sweden (1668).
Banking in its contemporary sense went forward in rich cities of Renaissance Italy, such
as Florence, Veniceand Genoa. In the history of banking, a number of banking reign—among
them notably Medici, Fugger, Welser, Berenberg, Baring and Rothschild—have played a vital
role over many centuries.
3.2 Definition
The definition of a bank differs from country to country. As per English common law, a
Chapter 1 Page 17
banker is defined as a person who carries on the business of banking, which is specified as:
conducting current accounts for the customers,
paying cheques drawn on him/her, and
collecting cheques for the customers.
In most common law jurisdictions, there is a Bills of Exchange Act that encode the law in
relation to negotiable instruments, including cheques, and this Act encloses a statutory
definition of the term banker: banker involves a body of persons, whether incorporated or not,
who carry on the business of banking' (Section 2, Interpretation). Although this definition
seems spherical, it is actually efficient, because it guarantees that the legal basis for bank
transactions such as cheques does not depend on how the bank is organized or regulated.
The business of banking is in many English common law countries not explained by decree
but by common law, the definition above. In other English common law jurisdictions there
are statutory definitions of the business of banking or banking business. When looking at these
definitions it is important to keep in mind that they are explaining the business of banking for
the rationale of the legislation, and not necessarily in common. In particular, most of the
definitions are from legislation that has the rationale of entry regulating and supervising banks
rather than regulating the real business of banking. Nevertheless, in many cases, the statutory
definitions closely reflect the general law one. Examples of statutory definitions:
"banking business" means the business of receiving money on current or deposit
account, paying and collecting cheques drawn by or paid in by customers, the making
of advances to customers, and involves such other business as the Authority may
prescribe for the purposes of this Act; (Banking Act (Singapore), Section 2,
Interpretation).
"banking business" means the business of either or both of the following:
1. receiving from the usual public fund on current, deposit, savings or other similar
account payable on claim or within less than three months or with a time of call or
notice of less than that period;
2. making payments or collecting checks drawn by or paid in by clients.
As the arrival of EFTPOS, Electronic Funds Transfer at Point Of Sale, direct credit, direct
debit and internet banking, the cheque has lose its dominance in the majority banking systems
as a payment instrument. This has led legal philosopher to suggest that the cheque based
definition should be widen to involve financial institutions that carry out current accounts for
clients and facilitate clients to pay and be paid by third parties, even if they do not pay and
Chapter 1 Page 18
collect cheques.
3.3 History
Banking in the contemporary sense of the word can be outlined to medieval and early
revitalization Italy, to the wealthy cities in the north like Florence, Lucca, Siena, Venice and
Genoa. The Bardi and Peruzzi families ruled banking in 14th century Florence, set up
branches in various other areas of Europe. One of the most well-known Italian banks was the
Medici Bank, set up by Giovanni di Bicci de' Medici in 1397. The earlier known state deposit
bank, Banco di San Giorgio (Bank of St. George), was established in 1407 at Genoa, Italy.
Origin of the word
The term bank came in Middle English from Middle French banque, from Old Italian banca,
from Old High German banc, bank "bench, counter". Benches were utilized as counters or
exchange counters during the revitalization by Florentine bankers, who used to make their
business a top desks covered by green tablecloths. One of the oldest articles found showing
money-changing activity is a silver Greek drachm coin from ancient Hellenic colony Trapezus
on the Black Sea, modern Trabzon, there in the British Museum in London. The coin shows
a banker's table, trapeze, burdened with currency, a witticism on the name of the town. In fact,
even today in contemporary Greek the word Trapeza means both a table and a bank.
An additional, possible origin of the word is from the Sanskrit words 'byaya' (expense) and
'onka' (calculation) = byaya-onka. These words still endure in Bangla, which is one of
Sanskrit's own language. Such expenditure estimation was the biggest part of arithmetical
dissertation written by Indian mathematician as early as 500 B.C.
4. Banking
4.1 Standard activities
Banks operate as payment mediators by conducting checking or current accounts for clients,
paying cheques drawn by customers on the bank, and collecting cheques deposited to
customers' current accounts. Banks also facilitate client payments via other payment methods
such as Automated Clearing House (ACH), Wire transfers or telegraphic transfer, EFTPOS,
and automated teller machine (ATM).
Banks have access to money by accepting funds deposited on current accounts, by accepting
term deposits, and by issuing debt securities such as banknotes and bonds. Banks loan money
by making advances to clients on current accounts, by making installment loans, and by
Chapter 1 Page 19
investing in marketable debt securities and other forms of fund lending.
Banks give different payment services, and a bank account is considered crucial by most
business and persons. Non-banks that give payment services such as transfer of funds
companies are normally not considered as a sufficient alternate for a bank account.
4.2 Channels
Banks tender various diverse channels to avail their banking and other services:
Automated Teller Machines
A branch is a retail location
Call center
Mail: many banks take cheque deposits through mail and apply mail to converse to
their clients, e.g. by sending out proclamation
Mobile banking is a technique of using one's mobile phone to carry out banking
transactions
Online banking is a term used for performing numerous transactions, payments etc.
through the Internet
Relationship Managers, mostly for private banking or business banking, frequently
visit clients at their home or business.
Telephone banking is a service which permits its clients to carry out operation over
the telephone with automated assistant or when requested with telephone operator
Video banking is a term used for executing banking transactions or professional
banking consultations via a remote video and audio connection. Video banking can be
act upon through the rationale built banking transaction machines, similar to an
Automated teller machine, or through a video conference facilitated bank branch
clarification.
4.3 Business model
A bank can create returns in a diversity of diverse traditions involving interest, operation fees
and financial assistance. The core technique is through charging interest on the resources it
provides out to the clients. The bank make revenue from the difference between the level of
interest it pays for deposits and other sources of funds, and the stage of interest it charges in
its lending activities. This difference is referred to as the broader between the expenditure of
funds and the loan interest rate.
Chapter 1 Page 20
Conventionally, abundance from lending activities has been recurring and reliant on the needs
and strengths of loan clients and the phase of the economic cycle. Fees and financial assistance
make a more steady returns stream and banks have consequently placed more prominence on
these returns lines to even their financial presentation. In the past 20 years American banks
have adopted various procedures to make sure that they stay lucrative while reacting to
progressively more varying market circumstances. First, this involves the Gramm-Leach-
Bliley Act, which permits banks again to unite with investment and insurance houses.
Merging banking, investment, and insurance functions permits conventional banks to act in
response to increasing client demands for "one-stop shopping" by making possible cross-
selling of products, which, the banks hope, will also enlarge productivity.
Second, they have enlarged the use of risk-based pricing from business lending to clients
lending, which means incriminating higher interest rates to those clients that are considered
to be a higher credit risk and thus, increased chance of non-payment on loans. This aids to
counterbalance the loss from bad loans, lowers the cost of loans to those who have good credit
histories, and offers credit products to high risk clients who would otherwise be refused credit.
Third, they have required enlarging the system of payment processing accessible to the wide-
ranging public and business clients. These products involve debit cards, prepaid cards, smart
cards, and credit cards. They make it easier for clients to expediently create transactions and
smooth their expenditure over time, in some countries with undersized financial systems; it is
still ordinary to deal firmly in cash, involving carrying suitcases filled with cash to purchase
a home.
Nevertheless, with handiness of easy credit, there is also enlarged risk that clients will manage
badly their financial resources and collect extreme debt. Banks build funds from card products
through interest payments and fees charged to clients and transaction fees to companies that
accept the credit- debit - cards. This assists in making earnings and make possible economic
development as a whole.
4.4 Products
Retail banking
Checking account
Savings account
Chapter 1 Page 21
Money market account
Certificate of deposit (CD)
Individual retirement account (IRA)
Credit card
Debit card
Mortgage
Home equity loan
Mutual fund
Personal loan
Time deposits
ATM card
Current Accounts
Business (or commercial/investment) banking
Business loan
Capital raising (Equity / Debt / Hybrids)
Mezzanine finance
Project finance
Revolving credit
Risk management (FX, interest rates, commodities, derivatives)
Term loan
Cash Management Services (Lock box, Remote Deposit Capture, Merchant
Processing)
3.5 Risk and capital
Banks counter a number of risks in order to accomplish its business, and how well these risks
are managed and understood is a chief force behind productivity, and how much resources a
bank is required to maintain. Some of the foremost risks encountered by banks include:
Credit risk: It is a risk of loss occurring from a borrower who does not make payments as
assured.
Liquidity risk: It is a risk that a agreed security or asset cannot be traded quickly enough in
the market to prevent a loss or make the required revenue.
Market risk: It is a risk that the value of a portfolio, either an investment portfolio or a trading
portfolio, will decline due to the alteration in value of the market risk aspects.
Operational risk: It is a risk taking place from implementation of a company's business
Chapter 1 Page 22
operations.
Reputational risk: It is a kind of risk associated to the reliability of the business.
Macroeconomic risk: It is a risk interconnected to the comprehensive economy the bank is
functioning in.
The fund prerequisite is a bank regulation, which sets a framework on how banks and
depository institutions must handle their funds. The classification of assets and capital is
vastly homogeneous so that it can be risk weighted.
4.6 Banks in the economy
Economic functions
The economic functions of banks include:
Issue of money, in the form of banknotes and current accounts subject to cheque or
payment at the customer's order. These claims on banks can act as money because they
are negotiable or repayable on demand, and hence valued at par. They are efficiently
manageable by only delivery, in the case of banknotes, or by drawing a cheque that
the payee may bank or cash.
Netting and settlement of payments – banks act as both collection and paying
mediators for clients, taking part in interbank clearing and settlement structure to
collect, present, be presented with, and disburse payment instruments. This allows
banks to economize on reserves held for settlement of payments, since inward and
outward payments compensate each other. It also enables the compensating the
payment flows between geographical areas, dropping the cost of settlement between
them.
Credit intermediation – banks borrow and lend back-to-back on their own account
as mediators.
Credit quality improvement – Banks lend money to regular commercial and
personal borrowers, but are high quality borrowers. The enhancement comes from
diversification of the bank's assets and funds which provides a safeguard to take up
losses without failure to pay on its obligations. On the other hand, banknotes and
deposits are normally unsecured; if the bank faces any difficulty and pledges assets as
security, to raise the funding it needs to continue to function, this puts the note holders
and depositors in a cost-effectively subordinated situation.
Asset liability mismatch/Maturity transformation – Banks borrow further on
demand debt and short term debt, but give more long term loans. In other words, they
Chapter 1 Page 23
Total Finance
Demand 32.5
Demand of Debt 26
Dmand of Equity 6.5
borrow short and lend long. With a stronger credit quality than most other borrowers,
banks can do this by comprehensive issues e.g. accepting deposits and issuing
banknotes and redemptions e.g. withdrawals and redemption of banknotes, keeping
reserves of cash, investing in marketable securities that can be readily transformed to
cash if needed, and raising replacement capital as needed from various sources e.g.
wholesale cash markets and securities markets.
Money creation – whenever a bank gives a loan in a fractional-reserve banking
system, a fresh sum of virtual fund is generated.
5. Demand for Finance by Entrepreneurs:
5.1 Introduction:
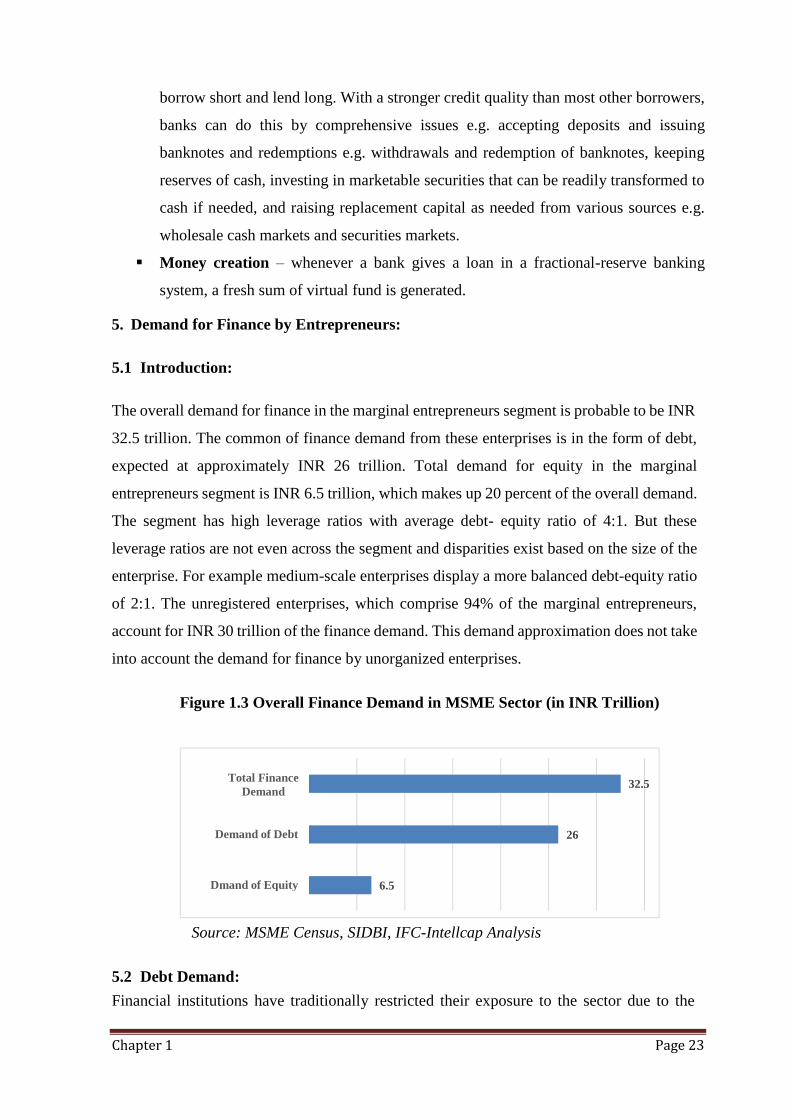
The overall demand for finance in the marginal entrepreneurs segment is probable to be INR
32.5 trillion. The common of finance demand from these enterprises is in the form of debt,
expected at approximately INR 26 trillion. Total demand for equity in the marginal
entrepreneurs segment is INR 6.5 trillion, which makes up 20 percent of the overall demand.
The segment has high leverage ratios with average debt- equity ratio of 4:1. But these
leverage ratios are not even across the segment and disparities exist based on the size of the
enterprise. For example medium-scale enterprises display a more balanced debt-equity ratio
of 2:1. The unregistered enterprises, which comprise 94% of the marginal entrepreneurs,
account for INR 30 trillion of the finance demand. This demand approximation does not take
into account the demand for finance by unorganized enterprises.
Figure 1.3 Overall Finance Demand in MSME Sector (in INR Trillion)
Source: MSME Census, SIDBI, IFC-Intellcap Analysis
5.2 Debt Demand:
Financial institutions have traditionally restricted their exposure to the sector due to the
Chapter 1 Page 24
perception that these businesses carry high risk and high cost of delivery, and have limited
access to immovable collateral. While, the overall debt demand in the segment is expected
to be Rs. 26 trillion, but not all of it can be met instantaneously by the formal financial sector
due to some reasons. Proportion of such demand is estimated at 37%, in addition, nearly
25% of the total projected demand is from micro enterprises that prefer debt from the
informal sector rather than formal. Table 1.9 provides the exclusions from overall debt
demand and their share of the total debt demand.
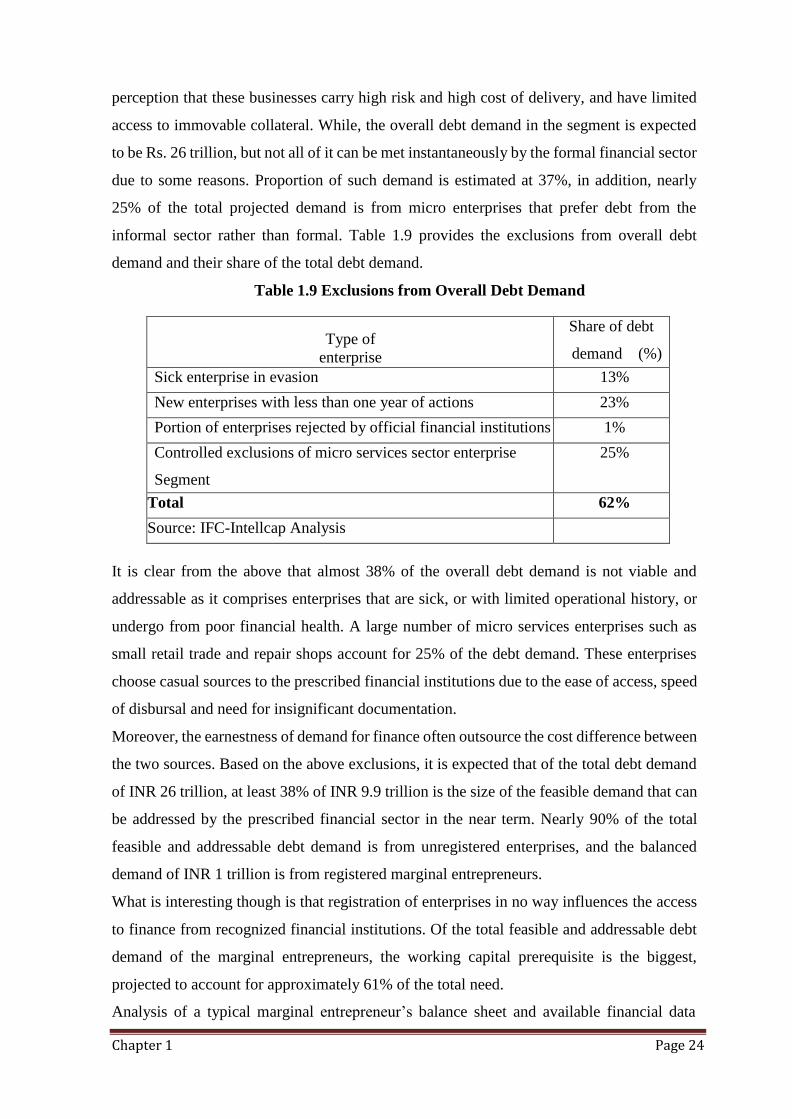
Table 1.9 Exclusions from Overall Debt Demand
Type of
enterprise
Share of debt
demand (%)
Sick enterprise in evasion 13%
New enterprises with less than one year of actions 23%
Portion of enterprises rejected by official financial institutions 1%
Controlled exclusions of micro services sector enterprise
Segment
25%
Total 62%
Source: IFC-Intellcap Analysis
It is clear from the above that almost 38% of the overall debt demand is not viable and
addressable as it comprises enterprises that are sick, or with limited operational history, or
undergo from poor financial health. A large number of micro services enterprises such as
small retail trade and repair shops account for 25% of the debt demand. These enterprises
choose casual sources to the prescribed financial institutions due to the ease of access, speed
of disbursal and need for insignificant documentation.
Moreover, the earnestness of demand for finance often outsource the cost difference between
the two sources. Based on the above exclusions, it is expected that of the total debt demand
of INR 26 trillion, at least 38% of INR 9.9 trillion is the size of the feasible demand that can
be addressed by the prescribed financial sector in the near term. Nearly 90% of the total
feasible and addressable debt demand is from unregistered enterprises, and the balanced
demand of INR 1 trillion is from registered marginal entrepreneurs.
What is interesting though is that registration of enterprises in no way influences the access
to finance from recognized financial institutions. Of the total feasible and addressable debt
demand of the marginal entrepreneurs, the working capital prerequisite is the biggest,
projected to account for approximately 61% of the total need.
Analysis of a typical marginal entrepreneur’s balance sheet and available financial data
Chapter 1 Page 25
4.4
2.9 2.6
Micro Small Medium
verifies the fact. Current asset account for 74% balance sheet growing year on year, while
capital expenditure accounts for only 26% of the growing, clearly demonstrating critical role
of working capital finance in the functioning and growth of MSMEs.
5.2.1 Debt Demand by Size of Enterprise:
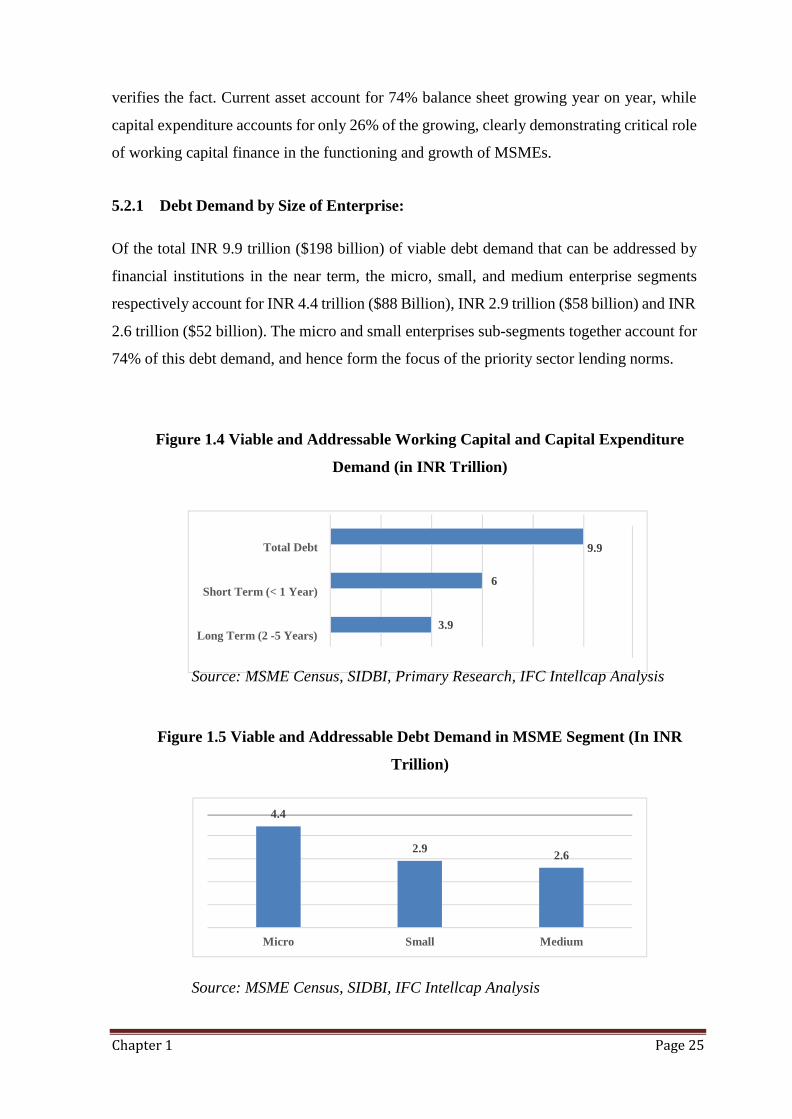
Of the total INR 9.9 trillion ($198 billion) of viable debt demand that can be addressed by
financial institutions in the near term, the micro, small, and medium enterprise segments
respectively account for INR 4.4 trillion ($88 Billion), INR 2.9 trillion ($58 billion) and INR
2.6 trillion ($52 billion). The micro and small enterprises sub-segments together account for
74% of this debt demand, and hence form the focus of the priority sector lending norms.
Figure 1.4 Viable and Addressable Working Capital and Capital Expenditure
Demand (in INR Trillion)
Total Debt 9.9
Short Term (< 1 Year)
Long Term (2 -5 Years)
Source: MSME Census, SIDBI, Primary Research, IFC Intellcap Analysis
Figure 1.5 Viable and Addressable Debt Demand in MSME Segment (In INR
Trillion)
Source: MSME Census, SIDBI, IFC Intellcap Analysis
6
3.9
Chapter 1 Page 26
Micro Enterprise Segment: Micro enterprises mostly operate in order-driven industries such
as retail trade, repair and maintenance, restaurants and textiles among others, and have a
significant working capital demand. Following characteristics are noteworthy:
o Analysis of the viable and addressable debt demand indicates that at least 10.6
million micro enterprises constitute a viable financing segment for formal financial
institutions in the near term.
o Primary research done by IFC – Intellcap shows that the average credit requirement
of a micro enterprises across manufacturing and services is estimated to be INR 0.3
million – INR 0.4 million ($6,000 –$8,000).
o Most of these enterprises largely transact in cash, and hence do not have accurately
recorded financials, making it difficult for financial institutions to assess their
creditworthiness.
o Micro enterprises are also characterized with limited access to both immovable and
movable collateral, while the majority of financial institutions prefer collateral-
based financing as a risk mitigate. These enterprises are mostly centered on
entrepreneurs alone, which makes them vulnerable because micro- entrepreneurs
have often had limited training in resource planning and are not always aware of all
the potential financing avenues available.
Small Enterprise Segment: Small enterprises require higher capital investments and tend to
operate in value-add manufacturing and knowledge-based service industries. Entrepreneurs
who run small enterprises have a relatively better knowledge of external sources of finance.
Some key facts about this segment are:
o Estimates indicate that 0.7 million small enterprises are viable for financing and
addressable by formal financial institutions in the near term. The average credit
requirement of a small enterprise across manufacturing and services industries is
estimated to be INR 4 million – INR 4.5 Million ($80,000 – 90,000). With limited
access to immovable collateral or assets, small enterprises especially in knowledge-
based industries, are handicapped in their ability to access adequate debt from
formal financial institutions.
o Although mature small enterprises, particularly knowledge-based enterprises, tend
to use bank instruments for most of their business transactions, cash continues to be
preferred across the overall small segment as entrepreneurs have limited incentive to
maintain financial records. Lack of financial documentation further increases the challenge
of accessing finance from formal financial institutions.
Chapter 1 Page 27
o Small enterprises access finance from both formal and informal sources, but in case
of formal sources, these units tend to have relationships with 1-2 financial
institutions.
Medium Enterprise Segment: Unlike micro and small enterprises, medium enterprises
exhibit a more predictable demand for debt, and these units are able to access multiple
sources of capital. Businesses in the segment are typically structured as limited companies
that allow for infusion of alternative forms of capital such as equity. In addition, predictable
cash flows and a formal structure, allows medium enterprises to choose formal financial
institutions as their preferred financiers.
The study estimates that 0.05 million medium enterprises can be served by the formal
financial institutions. Some of the characteristic aspects about the segment are:
o The average credit requirement of a medium enterprise across manufacturing and
services industries is in the range of INR 40 million – INR 55 million ($0.8 – 1.1
million).
o Medium-sized enterprises are professionally managed and hence depend a lot less
on the entrepreneur for management of day-to-day operations, allowing him to
explore broader aspects like financing from multiple sources.
o The financial history of these enterprises tends to be traceable. Coupled with high
average value of financial transactions, these enterprises are able to access financial
services more easily, forming financial relationships with multiple financial
institutions.
5.2.2 Debt Demand by Type of Enterprise:
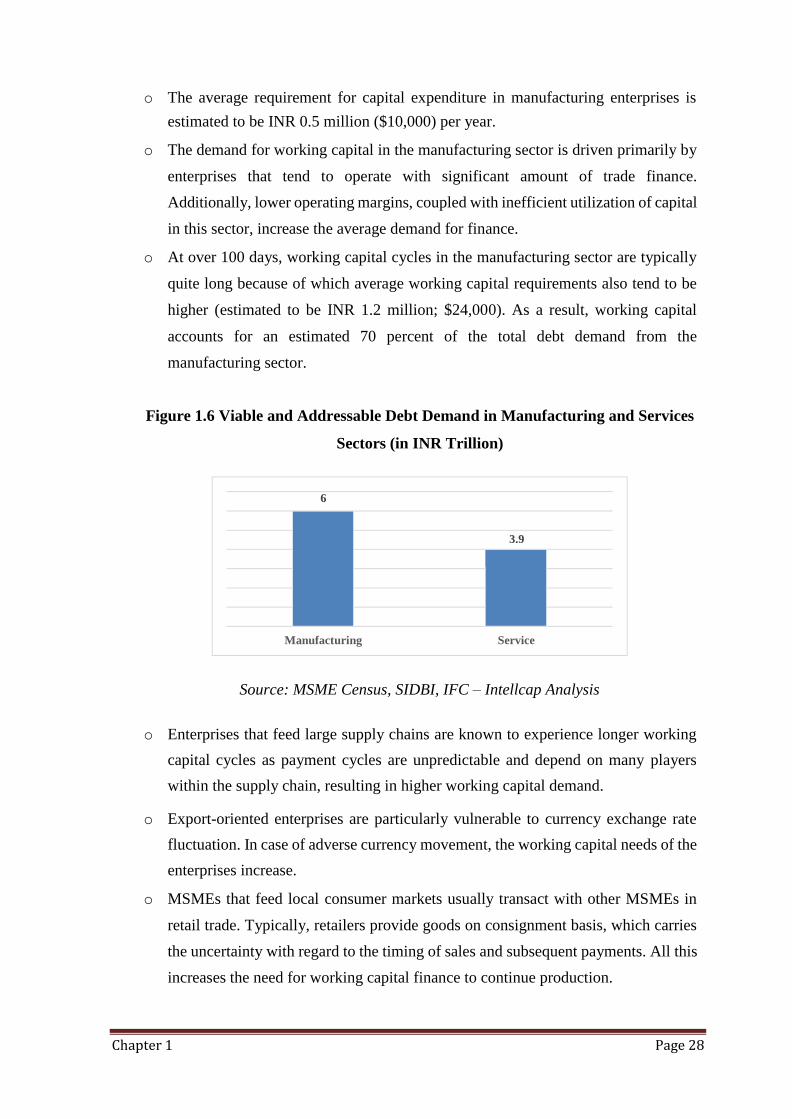
The manufacturing sector accounts for 61% of the viable debt demand that can be addressed
by formal financial institutions in the near term, whereas the services sector accounts for the
balance 39%. Accordingly, the share of manufacturing and services in the viable debt
demand that can be addressed by financial institutions in the near term is INR 6 trillion ($120
billion) and INR 3.9 trillion ($78 billion) respectively.
Manufacturing Sector: Although the manufacturing sector accounts for a smaller share of
enterprises, operations are more capital-intensive, as a result of which working capital
requirement tends to be higher in the manufacturing sector than that in the services sector.
Some of the features of finance needs of manufacturing MSMEs are:
Chapter 1 Page 28
6
Manufacturing Service
o The average requirement for capital expenditure in manufacturing enterprises is
estimated to be INR 0.5 million ($10,000) per year.
o The demand for working capital in the manufacturing sector is driven primarily by
enterprises that tend to operate with significant amount of trade finance.
Additionally, lower operating margins, coupled with inefficient utilization of capital
in this sector, increase the average demand for finance.
o At over 100 days, working capital cycles in the manufacturing sector are typically
quite long because of which average working capital requirements also tend to be
higher (estimated to be INR 1.2 million; $24,000). As a result, working capital
accounts for an estimated 70 percent of the total debt demand from the
manufacturing sector.
Figure 1.6 Viable and Addressable Debt Demand in Manufacturing and Services
Sectors (in INR Trillion)
3.9
Source: MSME Census, SIDBI, IFC – Intellcap Analysis
o Enterprises that feed large supply chains are known to experience longer working
capital cycles as payment cycles are unpredictable and depend on many players
within the supply chain, resulting in higher working capital demand.
o Export-oriented enterprises are particularly vulnerable to currency exchange rate
fluctuation. In case of adverse currency movement, the working capital needs of the
enterprises increase.
o MSMEs that feed local consumer markets usually transact with other MSMEs in
retail trade. Typically, retailers provide goods on consignment basis, which carries
the uncertainty with regard to the timing of sales and subsequent payments. All this
increases the need for working capital finance to continue production.
Chapter 1 Page 29
Service Sector: Service industries such as retail trade, repair and maintenance, and
restaurants are typically cash businesses with shorter turnaround, because of which their
overall external capital requirements tend to be low on an average.
On the other hand, there are knowledge-based services industries such as software
development and management consulting within the services sector, the finance
requirements of which are similar to that of manufacturing industries i.e. higher working
capital and capital expenditure requirements. Some characteristic traits of the demand of
services enterprises are:
oThe share of working capital as a portion of the average debt demand for services
enterprises is estimated to be41%.
oServices enterprises require less external capital on an on-going basis, except for such
things as work premises renovation, purchase and refurbishment of equipment. They
do, however, need significant capital support during the start-upstage.
oGiven the nature of most of these enterprises, they have limited access to immovable
collateral which makes access to formal finance challenging.
oKnowledge-based enterprises require working capital for primarily investing in
people. For this, businesses either depend on internal accruals or internal equity
investments, as debt from formal financial institutions for financing of man power
costs remains a challenge.
5.3 Equity Demand:
The overall equity demand in the sector is estimated to be INR 6.5 trillion ($130 billion),
with short-term equity requirement accounting for INR 4 trillion ($80 billion), and long-term
equity making up a demand of INR2.5trillion ($50billion).
Analysis of financing patterns in the MSME sector suggests that enterprises use internal
accruals and informal sources to finance the short-term equity demand (INR 4 trillion; $80
billion) and 25 percent of the long-term equity demand (INR 0.6 trillion or $12billion).
Excluding entrepreneurs’ equity contribution (internal accruals and informal sources), the
equity demand from external sources is estimated to be INR 1.9 trillion ($38 billion).
However, all the equity demand may not be viable and addressable as 95.7 percent of
enterprises are structured as either proprietorships or partnerships that are not amenable to
external equity infusion. In the estimation, all the micro enterprises and a section of small
enterprises are assumed to be structured as either proprietorships or partnerships. Excluding
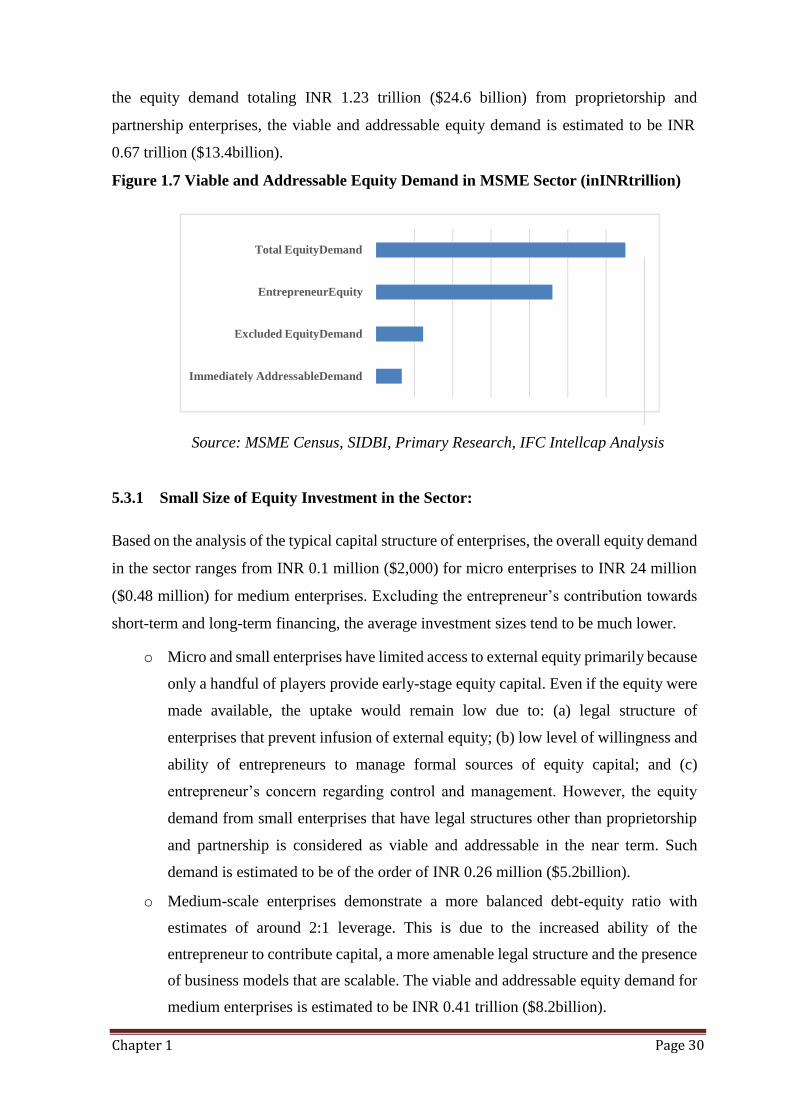
Chapter 1 Page 30
Total EquityDemand
EntrepreneurEquity
Excluded EquityDemand
Immediately AddressableDemand
the equity demand totaling INR 1.23 trillion ($24.6 billion) from proprietorship and
partnership enterprises, the viable and addressable equity demand is estimated to be INR
0.67 trillion ($13.4billion).
Figure 1.7 Viable and Addressable Equity Demand in MSME Sector (inINRtrillion)
Source: MSME Census, SIDBI, Primary Research, IFC Intellcap Analysis
5.3.1 Small Size of Equity Investment in the Sector:
Based on the analysis of the typical capital structure of enterprises, the overall equity demand
in the sector ranges from INR 0.1 million ($2,000) for micro enterprises to INR 24 million
($0.48 million) for medium enterprises. Excluding the entrepreneur’s contribution towards
short-term and long-term financing, the average investment sizes tend to be much lower.
o Micro and small enterprises have limited access to external equity primarily because
only a handful of players provide early-stage equity capital. Even if the equity were
made available, the uptake would remain low due to: (a) legal structure of
enterprises that prevent infusion of external equity; (b) low level of willingness and
ability of entrepreneurs to manage formal sources of equity capital; and (c)
entrepreneur’s concern regarding control and management. However, the equity
demand from small enterprises that have legal structures other than proprietorship
and partnership is considered as viable and addressable in the near term. Such
demand is estimated to be of the order of INR 0.26 million ($5.2billion).
o Medium-scale enterprises demonstrate a more balanced debt-equity ratio with
estimates of around 2:1 leverage. This is due to the increased ability of the
entrepreneur to contribute capital, a more amenable legal structure and the presence
of business models that are scalable. The viable and addressable equity demand for
medium enterprises is estimated to be INR 0.41 trillion ($8.2billion).
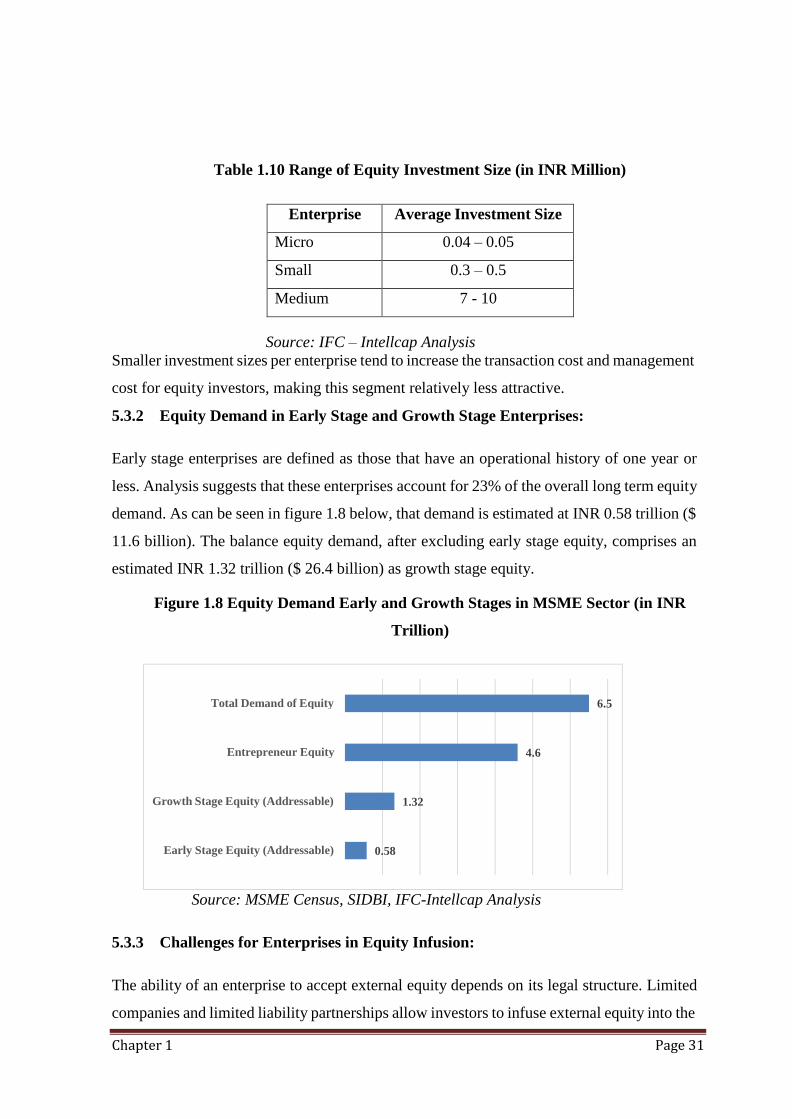
Chapter 1 Page 31
Total Demand of Equity 6.5
Entrepreneur Equity 4.6
Growth Stage Equity (Addressable) 1.32
Early Stage Equity (Addressable) 0.58
Table 1.10 Range of Equity Investment Size (in INR Million)
Enterprise Average Investment Size
Micro 0.04 – 0.05
Small 0.3 – 0.5
Medium 7 - 10
Source: IFC – Intellcap Analysis
Smaller investment sizes per enterprise tend to increase the transaction cost and management
cost for equity investors, making this segment relatively less attractive.
5.3.2 Equity Demand in Early Stage and Growth Stage Enterprises:
Early stage enterprises are defined as those that have an operational history of one year or
less. Analysis suggests that these enterprises account for 23% of the overall long term equity
demand. As can be seen in figure 1.8 below, that demand is estimated at INR 0.58 trillion ($
11.6 billion). The balance equity demand, after excluding early stage equity, comprises an
estimated INR 1.32 trillion ($ 26.4 billion) as growth stage equity.
Figure 1.8 Equity Demand Early and Growth Stages in MSME Sector (in INR
Trillion)
Source: MSME Census, SIDBI, IFC-Intellcap Analysis
5.3.3 Challenges for Enterprises in Equity Infusion:
The ability of an enterprise to accept external equity depends on its legal structure. Limited
companies and limited liability partnerships allow investors to infuse external equity into the
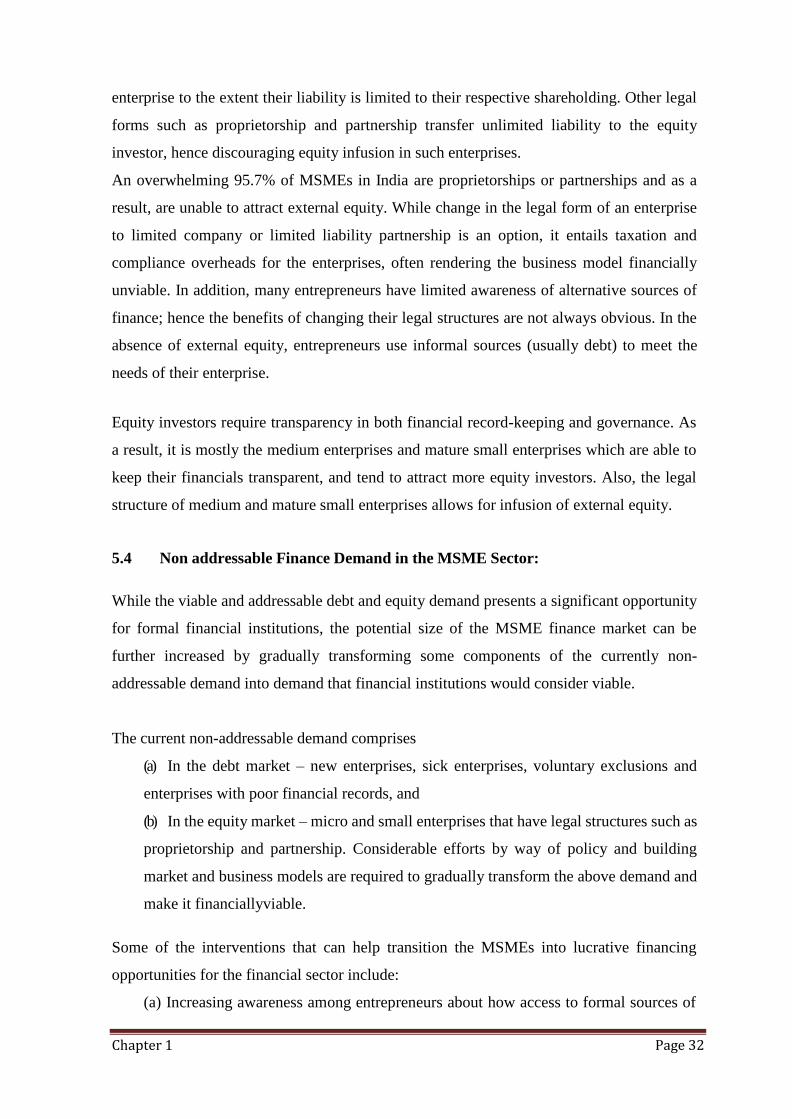
Chapter 1 Page 32
enterprise to the extent their liability is limited to their respective shareholding. Other legal
forms such as proprietorship and partnership transfer unlimited liability to the equity
investor, hence discouraging equity infusion in such enterprises.
An overwhelming 95.7% of MSMEs in India are proprietorships or partnerships and as a
result, are unable to attract external equity. While change in the legal form of an enterprise
to limited company or limited liability partnership is an option, it entails taxation and
compliance overheads for the enterprises, often rendering the business model financially
unviable. In addition, many entrepreneurs have limited awareness of alternative sources of
finance; hence the benefits of changing their legal structures are not always obvious. In the
absence of external equity, entrepreneurs use informal sources (usually debt) to meet the
needs of their enterprise.
Equity investors require transparency in both financial record-keeping and governance. As
a result, it is mostly the medium enterprises and mature small enterprises which are able to
keep their financials transparent, and tend to attract more equity investors. Also, the legal
structure of medium and mature small enterprises allows for infusion of external equity.
5.4 Non addressable Finance Demand in the MSME Sector:
While the viable and addressable debt and equity demand presents a significant opportunity
for formal financial institutions, the potential size of the MSME finance market can be
further increased by gradually transforming some components of the currently non-
addressable demand into demand that financial institutions would consider viable.
The current non-addressable demand comprises
(a) In the debt market – new enterprises, sick enterprises, voluntary exclusions and
enterprises with poor financial records, and
(b) In the equity market – micro and small enterprises that have legal structures such as
proprietorship and partnership. Considerable efforts by way of policy and building
market and business models are required to gradually transform the above demand and
make it financiallyviable.
Some of the interventions that can help transition the MSMEs into lucrative financing
opportunities for the financial sector include:
(a) Increasing awareness among entrepreneurs about how access to formal sources of
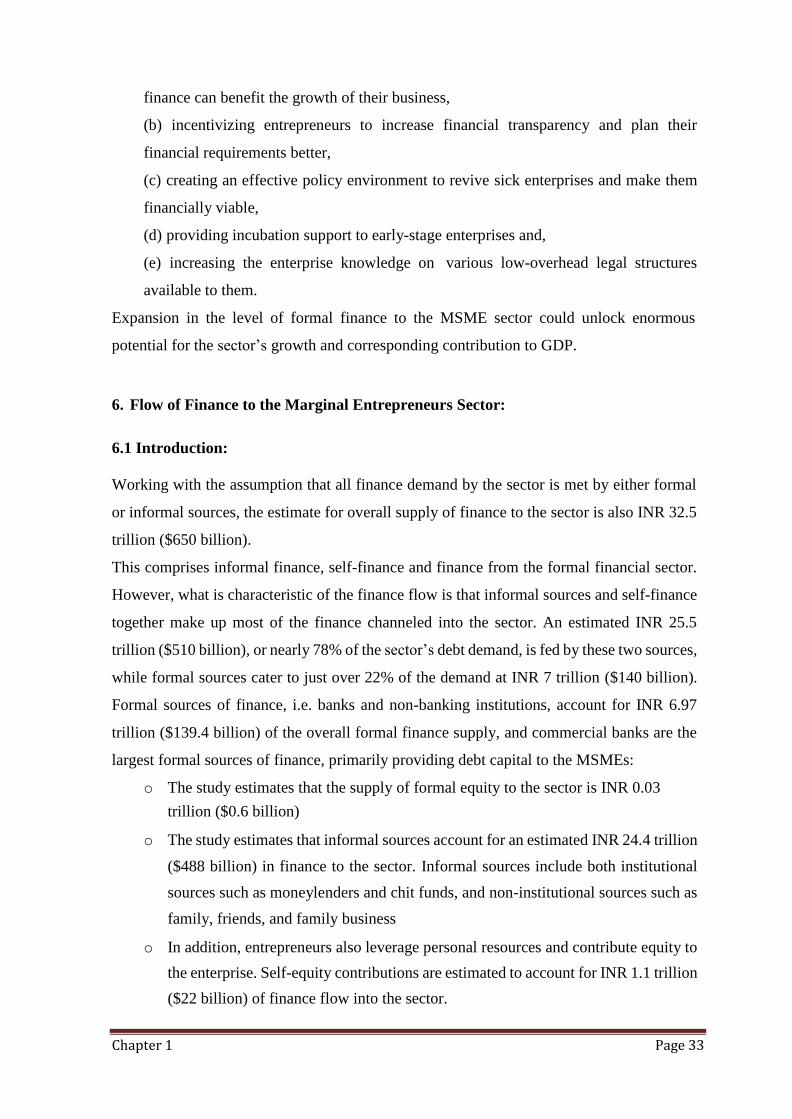
Chapter 1 Page 33
finance can benefit the growth of their business,
(b) incentivizing entrepreneurs to increase financial transparency and plan their
financial requirements better,
(c) creating an effective policy environment to revive sick enterprises and make them
financially viable,
(d) providing incubation support to early-stage enterprises and,
(e) increasing the enterprise knowledge on various low-overhead legal structures
available to them.
Expansion in the level of formal finance to the MSME sector could unlock enormous
potential for the sector’s growth and corresponding contribution to GDP.
6. Flow of Finance to the Marginal Entrepreneurs Sector:
6.1 Introduction:
Working with the assumption that all finance demand by the sector is met by either formal
or informal sources, the estimate for overall supply of finance to the sector is also INR 32.5
trillion ($650 billion).
This comprises informal finance, self-finance and finance from the formal financial sector.
However, what is characteristic of the finance flow is that informal sources and self-finance
together make up most of the finance channeled into the sector. An estimated INR 25.5
trillion ($510 billion), or nearly 78% of the sector’s debt demand, is fed by these two sources,
while formal sources cater to just over 22% of the demand at INR 7 trillion ($140 billion).
Formal sources of finance, i.e. banks and non-banking institutions, account for INR 6.97
trillion ($139.4 billion) of the overall formal finance supply, and commercial banks are the
largest formal sources of finance, primarily providing debt capital to the MSMEs:
o The study estimates that the supply of formal equity to the sector is INR 0.03
trillion ($0.6 billion)
o The study estimates that informal sources account for an estimated INR 24.4 trillion
($488 billion) in finance to the sector. Informal sources include both institutional
sources such as moneylenders and chit funds, and non-institutional sources such as
family, friends, and family business
o In addition, entrepreneurs also leverage personal resources and contribute equity to
the enterprise. Self-equity contributions are estimated to account for INR 1.1 trillion
($22 billion) of finance flow into the sector.
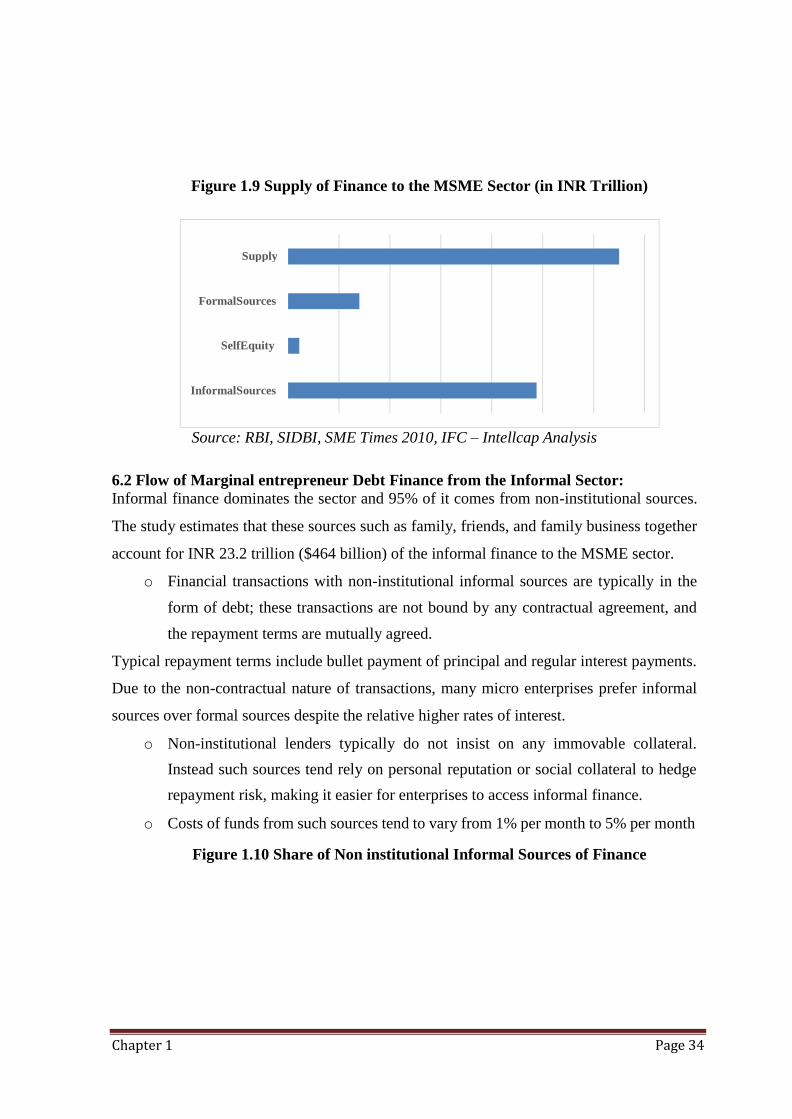
Chapter 1 Page 34
Supply
FormalSources
SelfEquity
InformalSources
Figure 1.9 Supply of Finance to the MSME Sector (in INR Trillion)
Source: RBI, SIDBI, SME Times 2010, IFC – Intellcap Analysis
6.2 Flow of Marginal entrepreneur Debt Finance from the Informal Sector:
Informal finance dominates the sector and 95% of it comes from non-institutional sources.
The study estimates that these sources such as family, friends, and family business together
account for INR 23.2 trillion ($464 billion) of the informal finance to the MSME sector.
o Financial transactions with non-institutional informal sources are typically in the
form of debt; these transactions are not bound by any contractual agreement, and
the repayment terms are mutually agreed.
Typical repayment terms include bullet payment of principal and regular interest payments.
Due to the non-contractual nature of transactions, many micro enterprises prefer informal
sources over formal sources despite the relative higher rates of interest.
o Non-institutional lenders typically do not insist on any immovable collateral.
Instead such sources tend rely on personal reputation or social collateral to hedge
repayment risk, making it easier for enterprises to access informal finance.
o Costs of funds from such sources tend to vary from 1% per month to 5% per month
Figure 1.10 Share of Non institutional Informal Sources of Finance
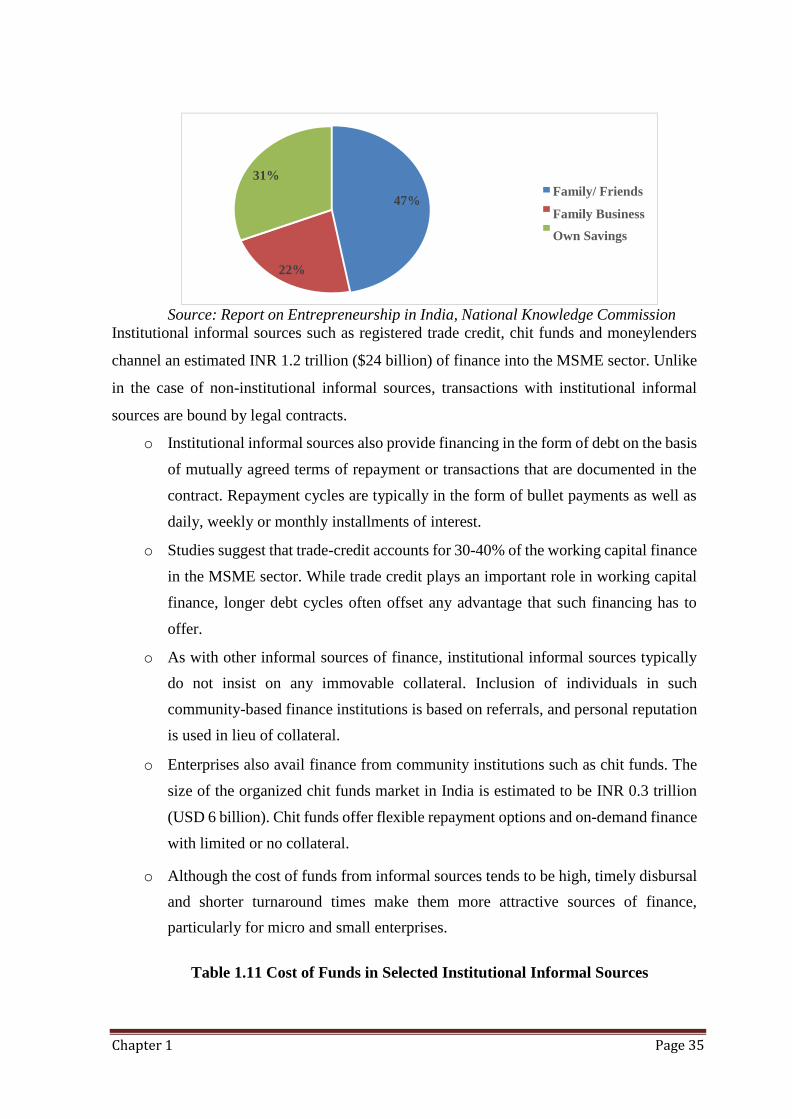
Chapter 1 Page 35
Source: Report on Entrepreneurship in India, National Knowledge Commission
Institutional informal sources such as registered trade credit, chit funds and moneylenders
channel an estimated INR 1.2 trillion ($24 billion) of finance into the MSME sector. Unlike
in the case of non-institutional informal sources, transactions with institutional informal
sources are bound by legal contracts.
o Institutional informal sources also provide financing in the form of debt on the basis
of mutually agreed terms of repayment or transactions that are documented in the
contract. Repayment cycles are typically in the form of bullet payments as well as
daily, weekly or monthly installments of interest.
o Studies suggest that trade-credit accounts for 30-40% of the working capital finance
in the MSME sector. While trade credit plays an important role in working capital
finance, longer debt cycles often offset any advantage that such financing has to
offer.
o As with other informal sources of finance, institutional informal sources typically
do not insist on any immovable collateral. Inclusion of individuals in such
community-based finance institutions is based on referrals, and personal reputation
is used in lieu of collateral.
o Enterprises also avail finance from community institutions such as chit funds. The
size of the organized chit funds market in India is estimated to be INR 0.3 trillion
(USD 6 billion). Chit funds offer flexible repayment options and on-demand finance
with limited or no collateral.
o Although the cost of funds from informal sources tends to be high, timely disbursal
and shorter turnaround times make them more attractive sources of finance,
particularly for micro and small enterprises.
Table 1.11 Cost of Funds in Selected Institutional Informal Sources
31%
47% Family/ Friends
Family Business
Own Savings
22%
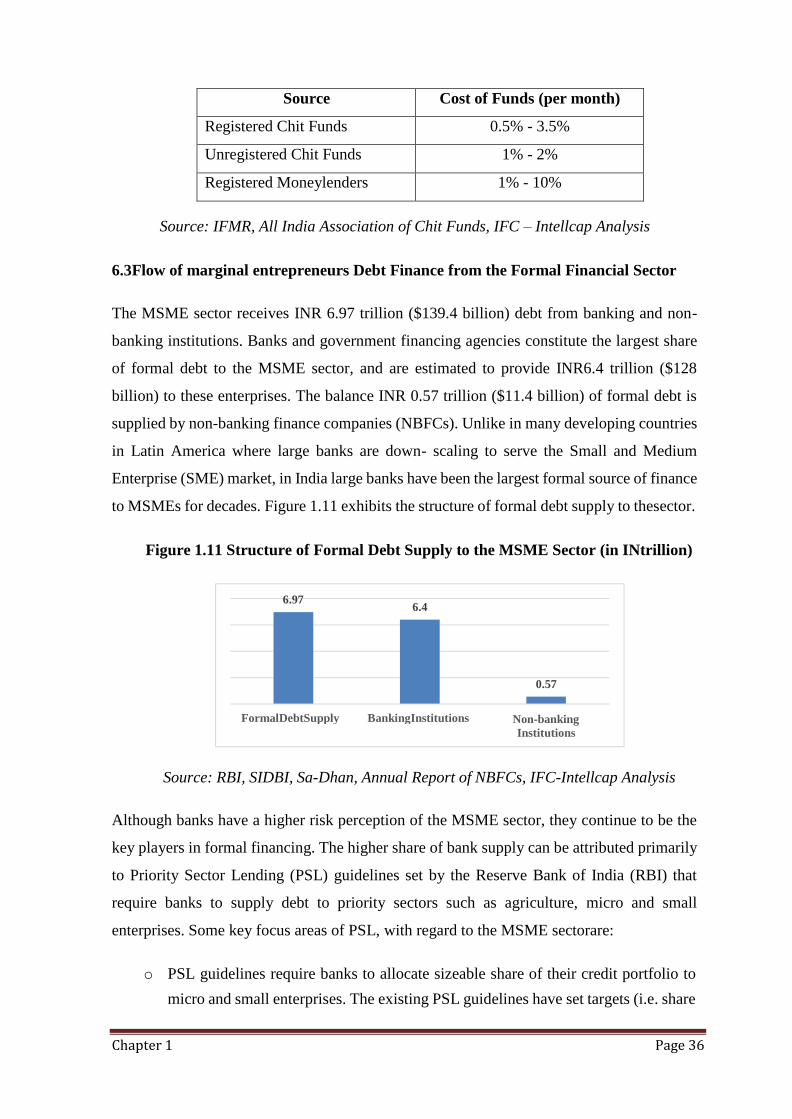
Chapter 1 Page 36
6.97 6.4
0.57
FormalDebtSupply BankingInstitutions Non-banking
Institutions
Source Cost of Funds (per month)
Registered Chit Funds 0.5% - 3.5%
Unregistered Chit Funds 1% - 2%
Registered Moneylenders 1% - 10%
Source: IFMR, All India Association of Chit Funds, IFC – Intellcap Analysis
6.3 Flow of marginal entrepreneurs Debt Finance from the Formal Financial Sector
The MSME sector receives INR 6.97 trillion ($139.4 billion) debt from banking and non-
banking institutions. Banks and government financing agencies constitute the largest share
of formal debt to the MSME sector, and are estimated to provide INR6.4 trillion ($128
billion) to these enterprises. The balance INR 0.57 trillion ($11.4 billion) of formal debt is
supplied by non-banking finance companies (NBFCs). Unlike in many developing countries
in Latin America where large banks are down- scaling to serve the Small and Medium
Enterprise (SME) market, in India large banks have been the largest formal source of finance
to MSMEs for decades. Figure 1.11 exhibits the structure of formal debt supply to thesector.
Figure 1.11 Structure of Formal Debt Supply to the MSME Sector (in INtrillion)
Source: RBI, SIDBI, Sa-Dhan, Annual Report of NBFCs, IFC-Intellcap Analysis
Although banks have a higher risk perception of the MSME sector, they continue to be the
key players in formal financing. The higher share of bank supply can be attributed primarily
to Priority Sector Lending (PSL) guidelines set by the Reserve Bank of India (RBI) that
require banks to supply debt to priority sectors such as agriculture, micro and small
enterprises. Some key focus areas of PSL, with regard to the MSME sectorare:
o PSL guidelines require banks to allocate sizeable share of their credit portfolio to
micro and small enterprises. The existing PSL guidelines have set targets (i.e. share
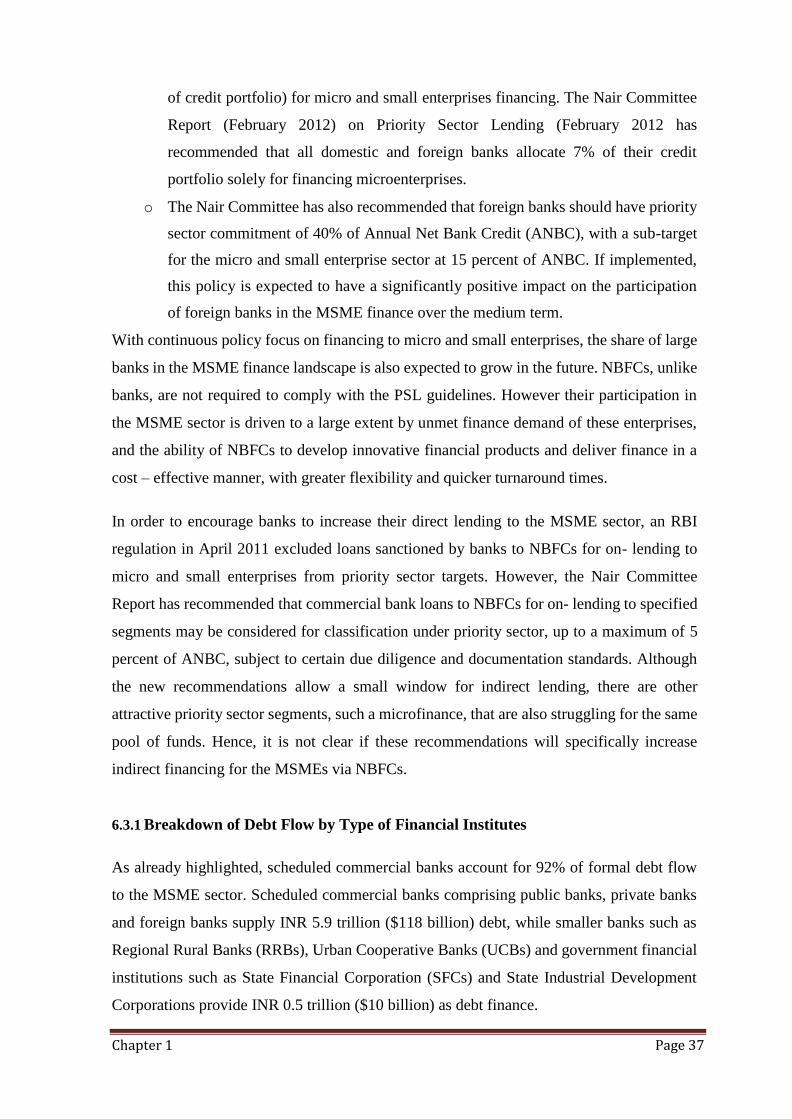
Chapter 1 Page 37
of credit portfolio) for micro and small enterprises financing. The Nair Committee
Report (February 2012) on Priority Sector Lending (February 2012 has
recommended that all domestic and foreign banks allocate 7% of their credit
portfolio solely for financing microenterprises.
o The Nair Committee has also recommended that foreign banks should have priority
sector commitment of 40% of Annual Net Bank Credit (ANBC), with a sub-target
for the micro and small enterprise sector at 15 percent of ANBC. If implemented,
this policy is expected to have a significantly positive impact on the participation
of foreign banks in the MSME finance over the medium term.
With continuous policy focus on financing to micro and small enterprises, the share of large
banks in the MSME finance landscape is also expected to grow in the future. NBFCs, unlike
banks, are not required to comply with the PSL guidelines. However their participation in
the MSME sector is driven to a large extent by unmet finance demand of these enterprises,
and the ability of NBFCs to develop innovative financial products and deliver finance in a
cost – effective manner, with greater flexibility and quicker turnaround times.
In order to encourage banks to increase their direct lending to the MSME sector, an RBI
regulation in April 2011 excluded loans sanctioned by banks to NBFCs for on- lending to
micro and small enterprises from priority sector targets. However, the Nair Committee
Report has recommended that commercial bank loans to NBFCs for on- lending to specified
segments may be considered for classification under priority sector, up to a maximum of 5
percent of ANBC, subject to certain due diligence and documentation standards. Although
the new recommendations allow a small window for indirect lending, there are other
attractive priority sector segments, such a microfinance, that are also struggling for the same
pool of funds. Hence, it is not clear if these recommendations will specifically increase
indirect financing for the MSMEs via NBFCs.
6.3.1 Breakdown of Debt Flow by Type of Financial Institutes
As already highlighted, scheduled commercial banks account for 92% of formal debt flow
to the MSME sector. Scheduled commercial banks comprising public banks, private banks
and foreign banks supply INR 5.9 trillion ($118 billion) debt, while smaller banks such as
Regional Rural Banks (RRBs), Urban Cooperative Banks (UCBs) and government financial
institutions such as State Financial Corporation (SFCs) and State Industrial Development
Corporations provide INR 0.5 trillion ($10 billion) as debt finance.
Chapter 1 Page 38
6.4
4.5
1.1
0.3 0.5
Banking Public Banks Private Banks Foreign Banks Small Banks
Institution
Supply
Figure 1.12 Structure of Banking Institution Supply to the MSME Sector (in INR
Trillion)
Source: RBI, SIDBI, Sa-Dhan, Annual Report of NBFCs, SME Times 2010, IFC-
Intellcap Analysis
Analysis of the MSME credit portfolios of banks suggests that all bank groups do not
contribute equally to the overall MSME sector.
o Data from RBI suggests that public banks account for 70 percent (INR 4.5trillion;
$90 billion) of the banking debt to the MSME sector, while the private and foreign
banks account for 22 percent (INR 1.4 trillion; $28 billion), and small banks such
as regional rural banks, urban co-operative banks account for 8 percent (INR 0.5
trillion; $10 billion) of banking finance.
o The study estimates that commercial banks serve an estimated 8.4 million – 8.5
million MSMEs ; financial institutions such as small banks, NBFCs, MFIs and
others, serve the balance MSMEs receiving formal finance. The above estimates
take into account the fact that medium and small enterprises may have multiple
banking relationships.
o This estimate is considerably higher than that of the MSME Census 2007 on the
number of enterprises served, however it builds on the RBI data available on the
total number of micro and small enterprise accounts currently served, and the
average credit disbursed per enterprise. Public banks serve the largest section, an
estimated 6.9 million MSMEs, while other banking institutions serve an estimated
1.5 – 1.6 million units.
The reason for the variance in the banks’ share in MSME debt finance is because of the
inherent differences in: (a) knowledge of the MSME sector (b) size of the branch network
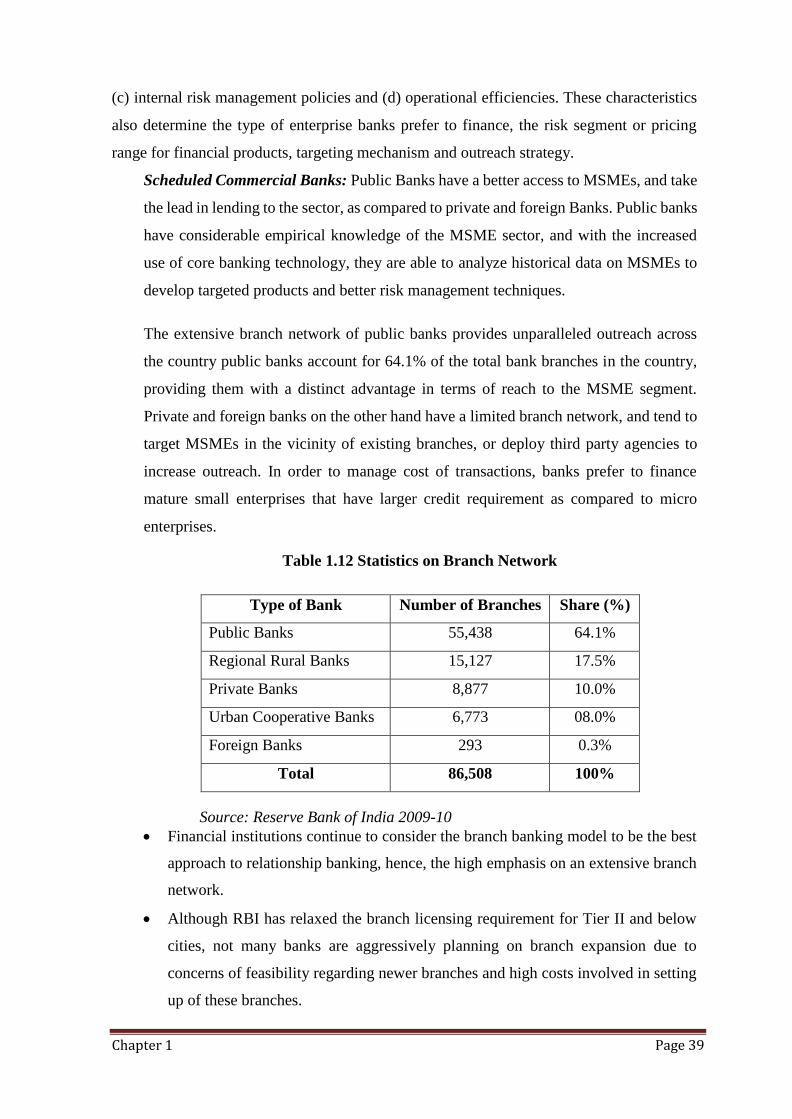
Chapter 1 Page 39
(c) internal risk management policies and (d) operational efficiencies. These characteristics
also determine the type of enterprise banks prefer to finance, the risk segment or pricing
range for financial products, targeting mechanism and outreach strategy.
Scheduled Commercial Banks: Public Banks have a better access to MSMEs, and take
the lead in lending to the sector, as compared to private and foreign Banks. Public banks
have considerable empirical knowledge of the MSME sector, and with the increased
use of core banking technology, they are able to analyze historical data on MSMEs to
develop targeted products and better risk management techniques.
The extensive branch network of public banks provides unparalleled outreach across
the country public banks account for 64.1% of the total bank branches in the country,
providing them with a distinct advantage in terms of reach to the MSME segment.
Private and foreign banks on the other hand have a limited branch network, and tend to
target MSMEs in the vicinity of existing branches, or deploy third party agencies to
increase outreach. In order to manage cost of transactions, banks prefer to finance
mature small enterprises that have larger credit requirement as compared to micro
enterprises.
Table 1.12 Statistics on Branch Network
Type of Bank Number of Branches Share (%)
Public Banks 55,438 64.1%
Regional Rural Banks 15,127 17.5%
Private Banks 8,877 10.0%
Urban Cooperative Banks 6,773 08.0%
Foreign Banks 293 0.3%
Total 86,508 100%
Source: Reserve Bank of India 2009-10
Financial institutions continue to consider the branch banking model to be the best
approach to relationship banking, hence, the high emphasis on an extensive branch
network.
Although RBI has relaxed the branch licensing requirement for Tier II and below
cities, not many banks are aggressively planning on branch expansion due to
concerns of feasibility regarding newer branches and high costs involved in setting
up of these branches.
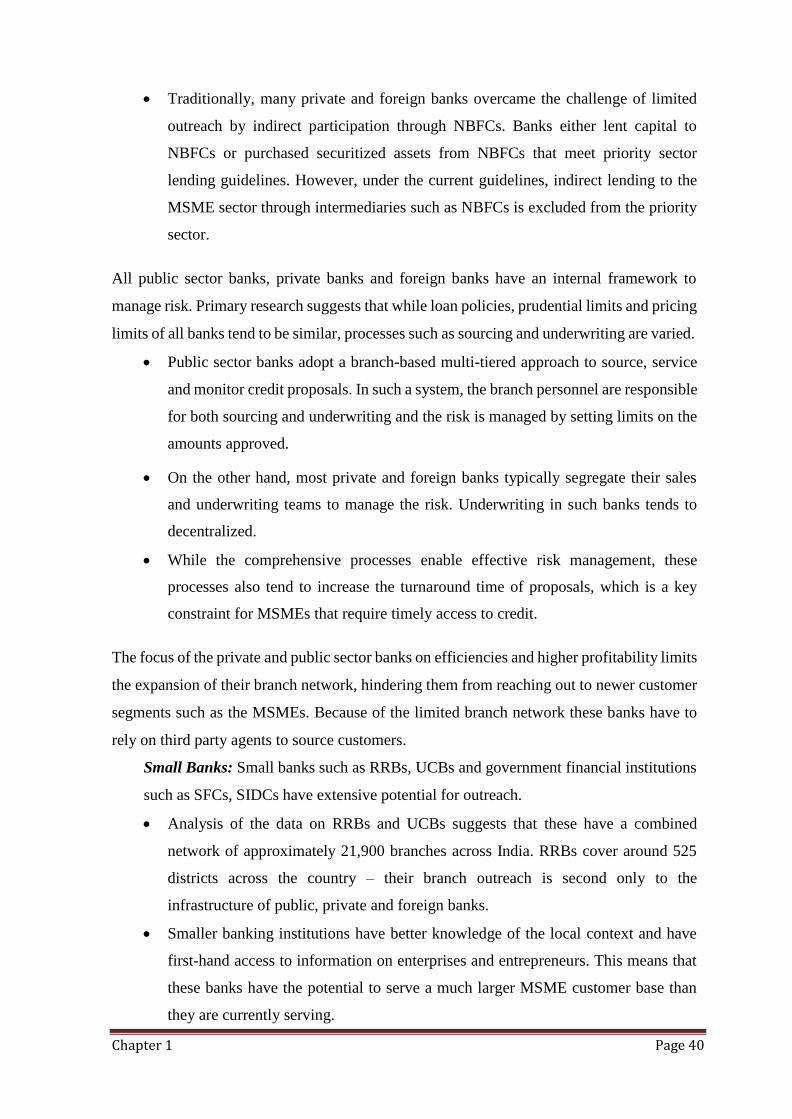
Chapter 1 Page 40
Traditionally, many private and foreign banks overcame the challenge of limited
outreach by indirect participation through NBFCs. Banks either lent capital to
NBFCs or purchased securitized assets from NBFCs that meet priority sector
lending guidelines. However, under the current guidelines, indirect lending to the
MSME sector through intermediaries such as NBFCs is excluded from the priority
sector.
All public sector banks, private banks and foreign banks have an internal framework to
manage risk. Primary research suggests that while loan policies, prudential limits and pricing
limits of all banks tend to be similar, processes such as sourcing and underwriting are varied.
Public sector banks adopt a branch-based multi-tiered approach to source, service
and monitor credit proposals. In such a system, the branch personnel are responsible
for both sourcing and underwriting and the risk is managed by setting limits on the
amounts approved.
On the other hand, most private and foreign banks typically segregate their sales
and underwriting teams to manage the risk. Underwriting in such banks tends to
decentralized.
While the comprehensive processes enable effective risk management, these
processes also tend to increase the turnaround time of proposals, which is a key
constraint for MSMEs that require timely access to credit.
The focus of the private and public sector banks on efficiencies and higher profitability limits
the expansion of their branch network, hindering them from reaching out to newer customer
segments such as the MSMEs. Because of the limited branch network these banks have to
rely on third party agents to source customers.
Small Banks: Small banks such as RRBs, UCBs and government financial institutions
such as SFCs, SIDCs have extensive potential for outreach.
Analysis of the data on RRBs and UCBs suggests that these have a combined
network of approximately 21,900 branches across India. RRBs cover around 525
districts across the country – their branch outreach is second only to the
infrastructure of public, private and foreign banks.
Smaller banking institutions have better knowledge of the local context and have
first-hand access to information on enterprises and entrepreneurs. This means that
these banks have the potential to serve a much larger MSME customer base than
they are currently serving.
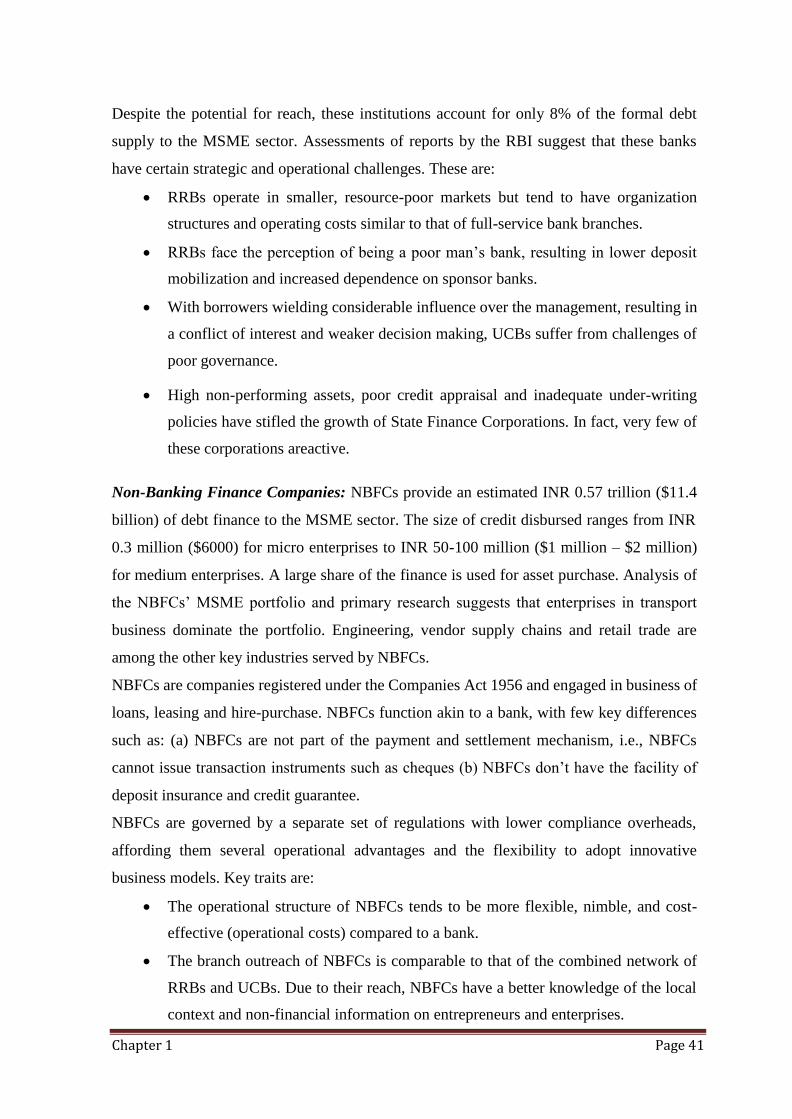
Chapter 1 Page 41
Despite the potential for reach, these institutions account for only 8% of the formal debt
supply to the MSME sector. Assessments of reports by the RBI suggest that these banks
have certain strategic and operational challenges. These are:
RRBs operate in smaller, resource-poor markets but tend to have organization
structures and operating costs similar to that of full-service bank branches.
RRBs face the perception of being a poor man’s bank, resulting in lower deposit
mobilization and increased dependence on sponsor banks.
With borrowers wielding considerable influence over the management, resulting in
a conflict of interest and weaker decision making, UCBs suffer from challenges of
poor governance.
High non-performing assets, poor credit appraisal and inadequate under-writing
policies have stifled the growth of State Finance Corporations. In fact, very few of
these corporations areactive.
Non-Banking Finance Companies: NBFCs provide an estimated INR 0.57 trillion ($11.4
billion) of debt finance to the MSME sector. The size of credit disbursed ranges from INR
0.3 million ($6000) for micro enterprises to INR 50-100 million ($1 million – $2 million)
for medium enterprises. A large share of the finance is used for asset purchase. Analysis of
the NBFCs’ MSME portfolio and primary research suggests that enterprises in transport
business dominate the portfolio. Engineering, vendor supply chains and retail trade are
among the other key industries served by NBFCs.
NBFCs are companies registered under the Companies Act 1956 and engaged in business of
loans, leasing and hire-purchase. NBFCs function akin to a bank, with few key differences
such as: (a) NBFCs are not part of the payment and settlement mechanism, i.e., NBFCs
cannot issue transaction instruments such as cheques (b) NBFCs don’t have the facility of
deposit insurance and credit guarantee.
NBFCs are governed by a separate set of regulations with lower compliance overheads,
affording them several operational advantages and the flexibility to adopt innovative
business models. Key traits are:
The operational structure of NBFCs tends to be more flexible, nimble, and cost-
effective (operational costs) compared to a bank.
The branch outreach of NBFCs is comparable to that of the combined network of
RRBs and UCBs. Due to their reach, NBFCs have a better knowledge of the local
context and non-financial information on entrepreneurs and enterprises.
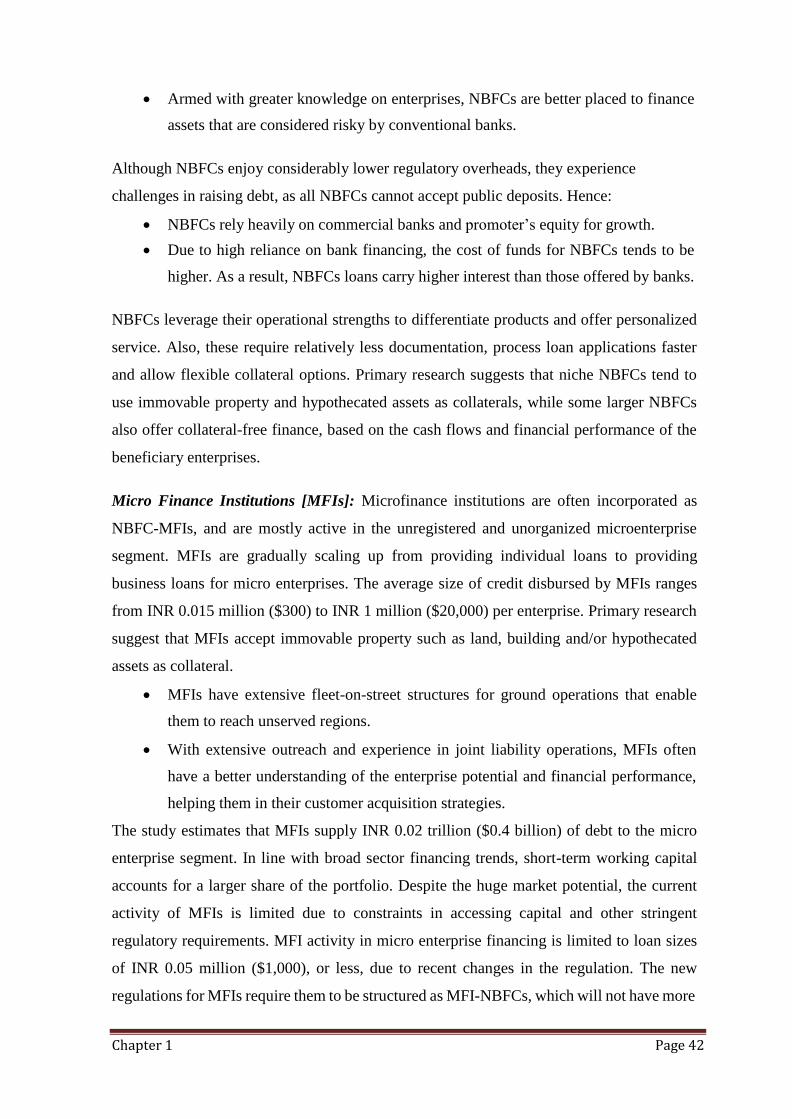
Chapter 1 Page 42
Armed with greater knowledge on enterprises, NBFCs are better placed to finance
assets that are considered risky by conventional banks.
Although NBFCs enjoy considerably lower regulatory overheads, they experience
challenges in raising debt, as all NBFCs cannot accept public deposits. Hence:
NBFCs rely heavily on commercial banks and promoter’s equity for growth.
Due to high reliance on bank financing, the cost of funds for NBFCs tends to be
higher. As a result, NBFCs loans carry higher interest than those offered by banks.
NBFCs leverage their operational strengths to differentiate products and offer personalized
service. Also, these require relatively less documentation, process loan applications faster
and allow flexible collateral options. Primary research suggests that niche NBFCs tend to
use immovable property and hypothecated assets as collaterals, while some larger NBFCs
also offer collateral-free finance, based on the cash flows and financial performance of the
beneficiary enterprises.
Micro Finance Institutions [MFIs]: Microfinance institutions are often incorporated as
NBFC-MFIs, and are mostly active in the unregistered and unorganized microenterprise
segment. MFIs are gradually scaling up from providing individual loans to providing
business loans for micro enterprises. The average size of credit disbursed by MFIs ranges
from INR 0.015 million ($300) to INR 1 million ($20,000) per enterprise. Primary research
suggest that MFIs accept immovable property such as land, building and/or hypothecated
assets as collateral.
MFIs have extensive fleet-on-street structures for ground operations that enable
them to reach unserved regions.
With extensive outreach and experience in joint liability operations, MFIs often
have a better understanding of the enterprise potential and financial performance,
helping them in their customer acquisition strategies.
The study estimates that MFIs supply INR 0.02 trillion ($0.4 billion) of debt to the micro
enterprise segment. In line with broad sector financing trends, short-term working capital
accounts for a larger share of the portfolio. Despite the huge market potential, the current
activity of MFIs is limited due to constraints in accessing capital and other stringent
regulatory requirements. MFI activity in micro enterprise financing is limited to loan sizes
of INR 0.05 million ($1,000), or less, due to recent changes in the regulation. The new
regulations for MFIs require them to be structured as MFI-NBFCs, which will not have more
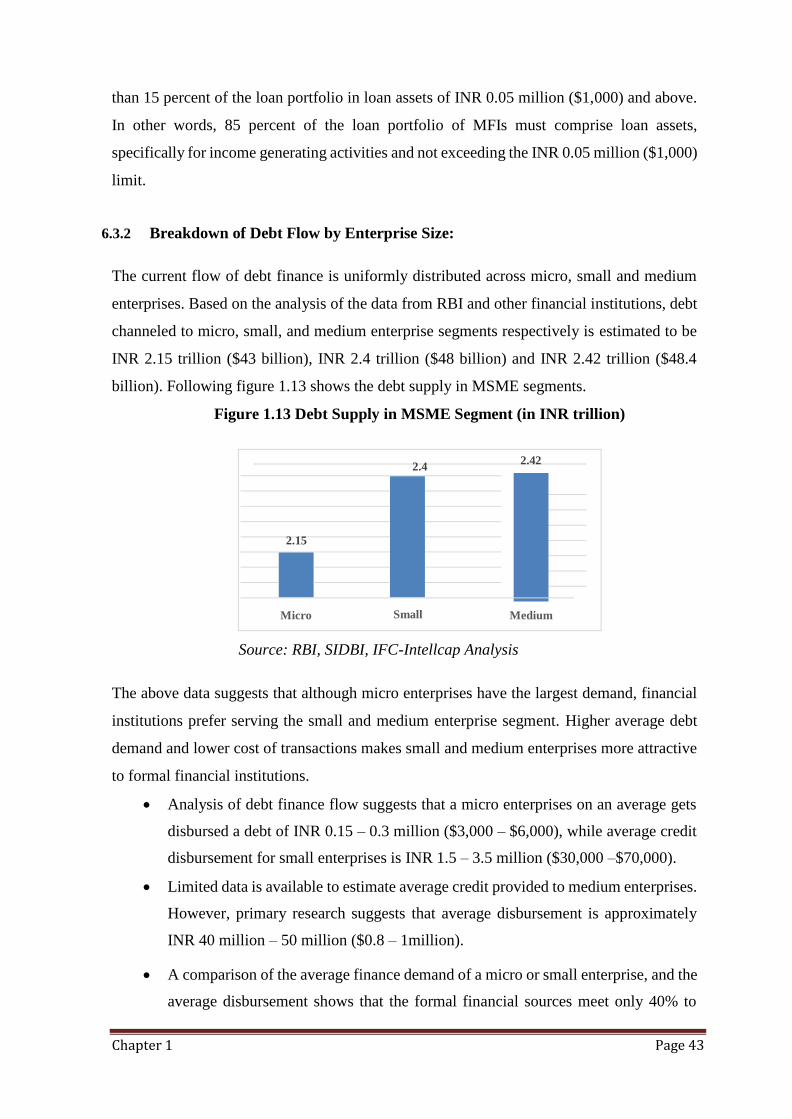
Chapter 1 Page 43
2.4 2.42
2.15
Micro Small Medium
than 15 percent of the loan portfolio in loan assets of INR 0.05 million ($1,000) and above.
In other words, 85 percent of the loan portfolio of MFIs must comprise loan assets,
specifically for income generating activities and not exceeding the INR 0.05 million ($1,000)
limit.
6.3.2 Breakdown of Debt Flow by Enterprise Size:
The current flow of debt finance is uniformly distributed across micro, small and medium
enterprises. Based on the analysis of the data from RBI and other financial institutions, debt
channeled to micro, small, and medium enterprise segments respectively is estimated to be
INR 2.15 trillion ($43 billion), INR 2.4 trillion ($48 billion) and INR 2.42 trillion ($48.4
billion). Following figure 1.13 shows the debt supply in MSME segments.
Figure 1.13 Debt Supply in MSME Segment (in INR trillion)
Source: RBI, SIDBI, IFC-Intellcap Analysis
The above data suggests that although micro enterprises have the largest demand, financial
institutions prefer serving the small and medium enterprise segment. Higher average debt
demand and lower cost of transactions makes small and medium enterprises more attractive
to formal financial institutions.
Analysis of debt finance flow suggests that a micro enterprises on an average gets
disbursed a debt of INR 0.15 – 0.3 million ($3,000 – $6,000), while average credit
disbursement for small enterprises is INR 1.5 – 3.5 million ($30,000 –$70,000).
Limited data is available to estimate average credit provided to medium enterprises.
However, primary research suggests that average disbursement is approximately
INR 40 million – 50 million ($0.8 – 1million).
A comparison of the average finance demand of a micro or small enterprise, and the
average disbursement shows that the formal financial sources meet only 40% to
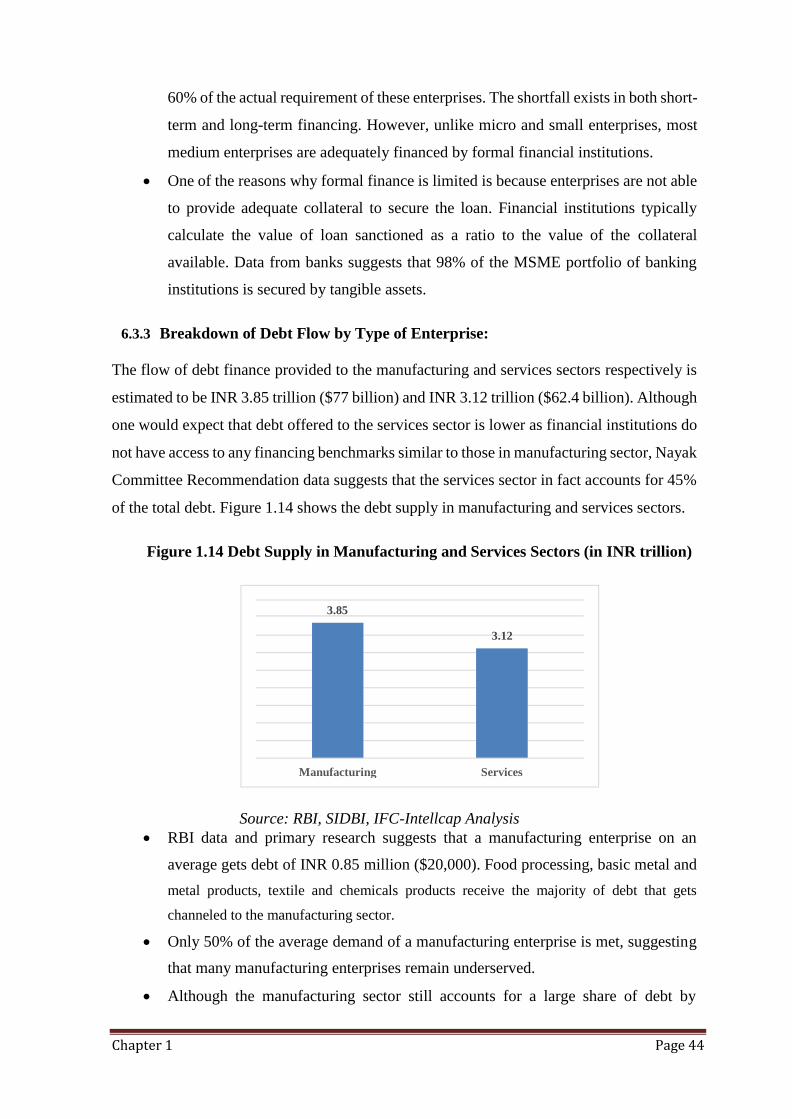
Chapter 1 Page 44
3.85
3.12
Manufacturing Services
60% of the actual requirement of these enterprises. The shortfall exists in both short-
term and long-term financing. However, unlike micro and small enterprises, most
medium enterprises are adequately financed by formal financial institutions.
One of the reasons why formal finance is limited is because enterprises are not able
to provide adequate collateral to secure the loan. Financial institutions typically
calculate the value of loan sanctioned as a ratio to the value of the collateral
available. Data from banks suggests that 98% of the MSME portfolio of banking
institutions is secured by tangible assets.
6.3.3 Breakdown of Debt Flow by Type of Enterprise:
The flow of debt finance provided to the manufacturing and services sectors respectively is
estimated to be INR 3.85 trillion ($77 billion) and INR 3.12 trillion ($62.4 billion). Although
one would expect that debt offered to the services sector is lower as financial institutions do
not have access to any financing benchmarks similar to those in manufacturing sector, Nayak
Committee Recommendation data suggests that the services sector in fact accounts for 45%
of the total debt. Figure 1.14 shows the debt supply in manufacturing and services sectors.
Figure 1.14 Debt Supply in Manufacturing and Services Sectors (in INR trillion)
Source: RBI, SIDBI, IFC-Intellcap Analysis
RBI data and primary research suggests that a manufacturing enterprise on an
average gets debt of INR 0.85 million ($20,000). Food processing, basic metal and
metal products, textile and chemicals products receive the majority of debt that gets
channeled to the manufacturing sector.
Only 50% of the average demand of a manufacturing enterprise is met, suggesting
that many manufacturing enterprises remain underserved.
Although the manufacturing sector still accounts for a large share of debt by
Chapter 1 Page 45
volume, growing at a compounded annual growth rate of 20% a year, it is still lower
than the overall sector average of 30%. This suggests that financial institutions are
slowly shifting to financing the service sector.
Manufacturing enterprises that operate in clusters are relatively better informed on
formal sources of finance than the services enterprises, which are generally
dispersed.
Estimates indicate that a services enterprise on an average gets around INR 0.55
million ($11,000). Traditional services business such as restaurants, small transport
operators, and small water transport operators are the main beneficiaries of formal
credit uptake because financial institutions have developed a good understanding of
these industries over the years.
Traditional services businesses tend to have significant primary security/asset or
collateral to secure financing. Transport operators for example have trucks that can
be pledged as primary security.
The study estimates that formal financial institutions meet approximately 40% to
70% of the debt demand of an enterprise, forcing enterprises to resort to informal
sources to finance the gap.
Currently, the volume of formal debt in the services sector is lower compared to the
manufacturing sector. Including retail trade in priority sector lending is one reason
why the services sector is seeing increasing credit inflows (an estimated INR 0.5 –
0.6 trillion or $10 – 12billion).
Knowledge-based enterprises such as software companies, management consultants
and human resource consultants get far lower debt finance than traditional services
businesses. That is because financial institutions have yet to develop appropriate
risk assessment frameworks to assess such enterprises and most such units require
finance primarily to cover manpower costs. Moreover, knowledge-based
enterprises tend to have limited collateral to secure financing.
6.4 Equity Finance Flows to the Marginal Entrepreneurs Sector:
6.4.1 Introduction
It is estimated that a total of INR 0.03 trillion ($0.6 billion) is directed to the sector by way
of equity financing. Most of the enterprises in the sector are proprietorships and partnerships
that do not allow for infusion of equity. In addition, equity investors require a high level of
operational and financial transparency, which is lacking in a significant number of MSMEs.
Chapter 1 Page 46
In sum, there are several legal challenges that constrain the small and micro enterprises from
getting equity capital. Consequently, it is primarily the mature small and medium enterprises
that are the beneficiaries of equity capital financing. SIDBI Venture Capital Limited, along
with a few private equity firms, is currently leading the supply of equity capital to the sector.
In the General Budget of 2012-13, the Government of India announced the intention to set
up an INR 50 billion ($1 billion) India Opportunities Fund through the Small Industries
Development Bank of India (SIDBI). The proposed fund is expected to enhance the
availability of equity for sector. The fund could also potentially encourage private sector
funds to participate and innovate in setting up equity/debt funds specifically targeting the
sector.
6.4.2 Challenges in Equity Financing
Equity investment in MSMEs is difficult not only because of legal constraints already
highlighted, but also because of significant operational challenges involved in managing
MSME-focused funds, which include:
Size of investment deals is typically quite small, and there is a lack of adequate
information on the market segment as well as on individual enterprises. Hence a
high level of due diligence is required, which increases the transaction cost and is
not always commensurate with potential returns.
In the absence of credible data and information, accurate valuation of enterprises
becomes difficult.
The failure rate of enterprises in this segment tends to be high, significantly
increasing risk for investors.
Options for exit from the MSME segment are limited, and there have been few
actual exits in this sector in the past.
6.5 Marginal Entrepreneurs Finance Process Flow and Challenges:
6.5.1 Introduction
Although the process of providing debt and equity capital for financing the segment is not a
lot different from that followed for other segments, yet investors need to have differentiated
product and marketing strategies for the sector. This is to factor in the heterogeneity and risk
inherent in the MSME sector.
6.5.2 Debt Finance Process and Challenges:
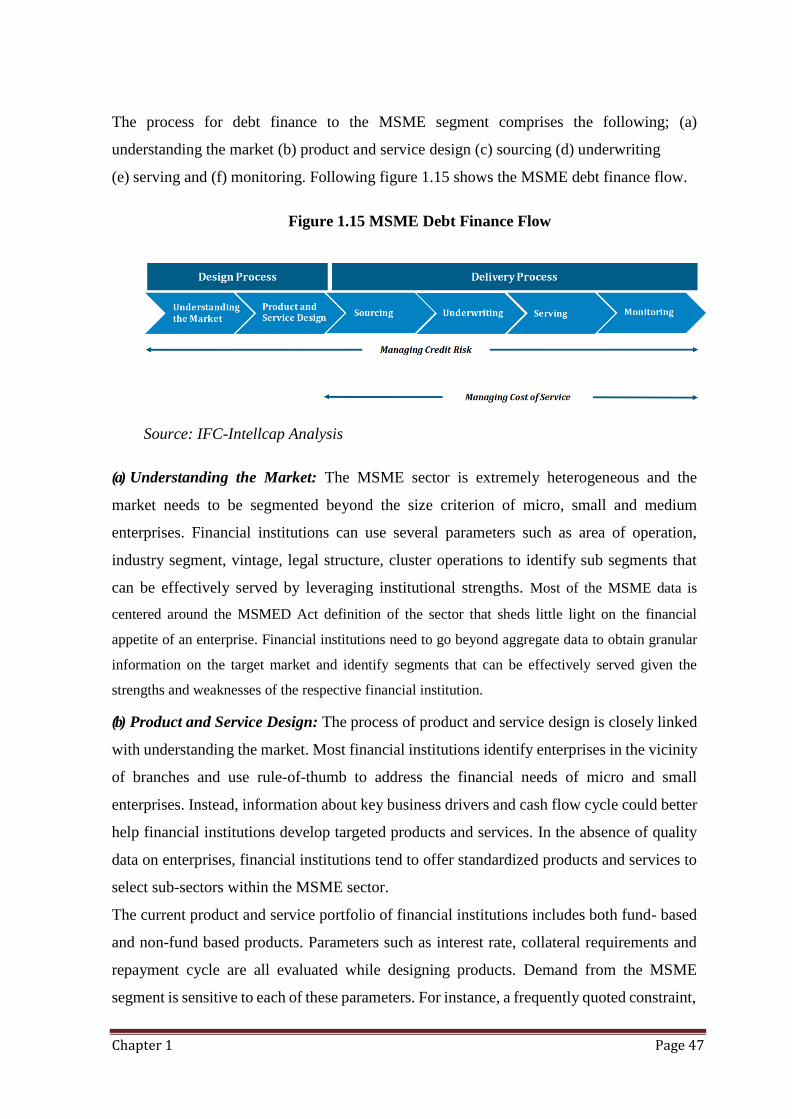
Chapter 1 Page 47
The process for debt finance to the MSME segment comprises the following; (a)
understanding the market (b) product and service design (c) sourcing (d) underwriting
(e) serving and (f) monitoring. Following figure 1.15 shows the MSME debt finance flow.
Figure 1.15 MSME Debt Finance Flow
Source: IFC-Intellcap Analysis
(a) Understanding the Market: The MSME sector is extremely heterogeneous and the
market needs to be segmented beyond the size criterion of micro, small and medium
enterprises. Financial institutions can use several parameters such as area of operation,
industry segment, vintage, legal structure, cluster operations to identify sub segments that
can be effectively served by leveraging institutional strengths. Most of the MSME data is
centered around the MSMED Act definition of the sector that sheds little light on the financial
appetite of an enterprise. Financial institutions need to go beyond aggregate data to obtain granular
information on the target market and identify segments that can be effectively served given the
strengths and weaknesses of the respective financial institution.
(b) Product and Service Design: The process of product and service design is closely linked
with understanding the market. Most financial institutions identify enterprises in the vicinity
of branches and use rule-of-thumb to address the financial needs of micro and small
enterprises. Instead, information about key business drivers and cash flow cycle could better
help financial institutions develop targeted products and services. In the absence of quality
data on enterprises, financial institutions tend to offer standardized products and services to
select sub-sectors within the MSME sector.
The current product and service portfolio of financial institutions includes both fund- based
and non-fund based products. Parameters such as interest rate, collateral requirements and
repayment cycle are all evaluated while designing products. Demand from the MSME
segment is sensitive to each of these parameters. For instance, a frequently quoted constraint,
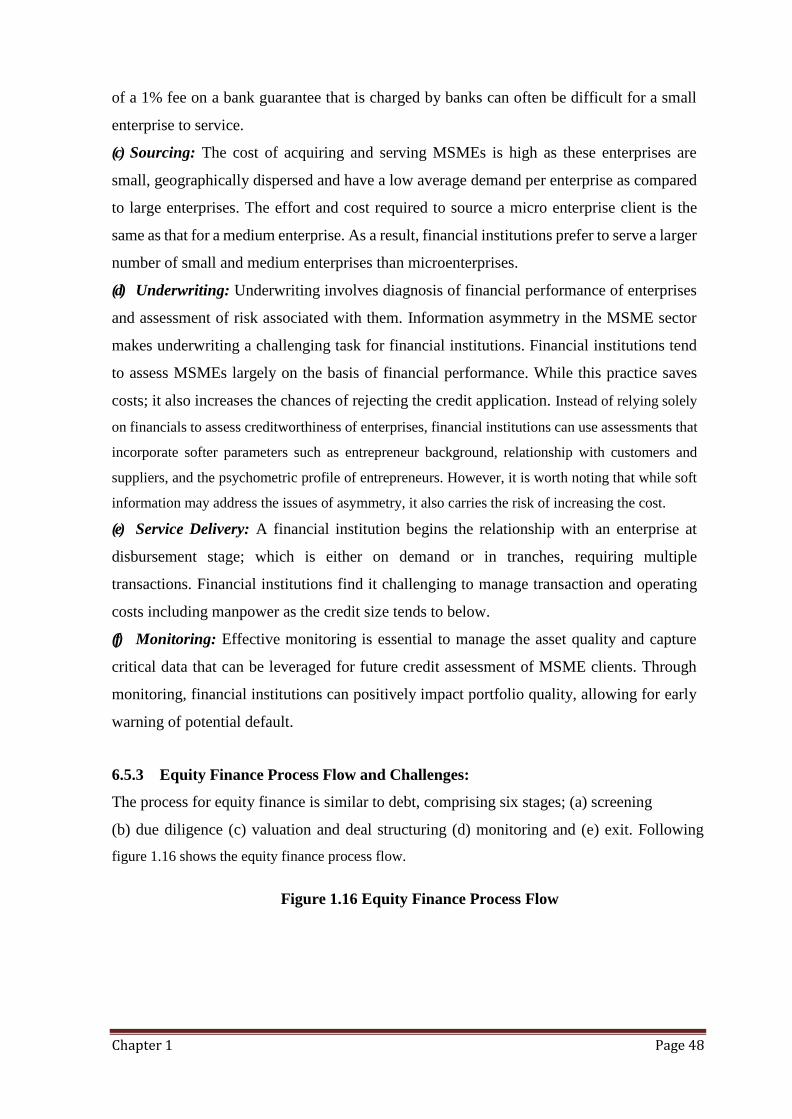
Chapter 1 Page 48
of a 1% fee on a bank guarantee that is charged by banks can often be difficult for a small
enterprise to service.
(c) Sourcing: The cost of acquiring and serving MSMEs is high as these enterprises are
small, geographically dispersed and have a low average demand per enterprise as compared
to large enterprises. The effort and cost required to source a micro enterprise client is the
same as that for a medium enterprise. As a result, financial institutions prefer to serve a larger
number of small and medium enterprises than microenterprises.
(d) Underwriting: Underwriting involves diagnosis of financial performance of enterprises
and assessment of risk associated with them. Information asymmetry in the MSME sector
makes underwriting a challenging task for financial institutions. Financial institutions tend
to assess MSMEs largely on the basis of financial performance. While this practice saves
costs; it also increases the chances of rejecting the credit application. Instead of relying solely
on financials to assess creditworthiness of enterprises, financial institutions can use assessments that
incorporate softer parameters such as entrepreneur background, relationship with customers and
suppliers, and the psychometric profile of entrepreneurs. However, it is worth noting that while soft
information may address the issues of asymmetry, it also carries the risk of increasing the cost.
(e) Service Delivery: A financial institution begins the relationship with an enterprise at
disbursement stage; which is either on demand or in tranches, requiring multiple
transactions. Financial institutions find it challenging to manage transaction and operating
costs including manpower as the credit size tends to below.
(f) Monitoring: Effective monitoring is essential to manage the asset quality and capture
critical data that can be leveraged for future credit assessment of MSME clients. Through
monitoring, financial institutions can positively impact portfolio quality, allowing for early
warning of potential default.
6.5.3 Equity Finance Process Flow and Challenges:
The process for equity finance is similar to debt, comprising six stages; (a) screening
(b) due diligence (c) valuation and deal structuring (d) monitoring and (e) exit. Following
figure 1.16 shows the equity finance process flow.
Figure 1.16 Equity Finance Process Flow
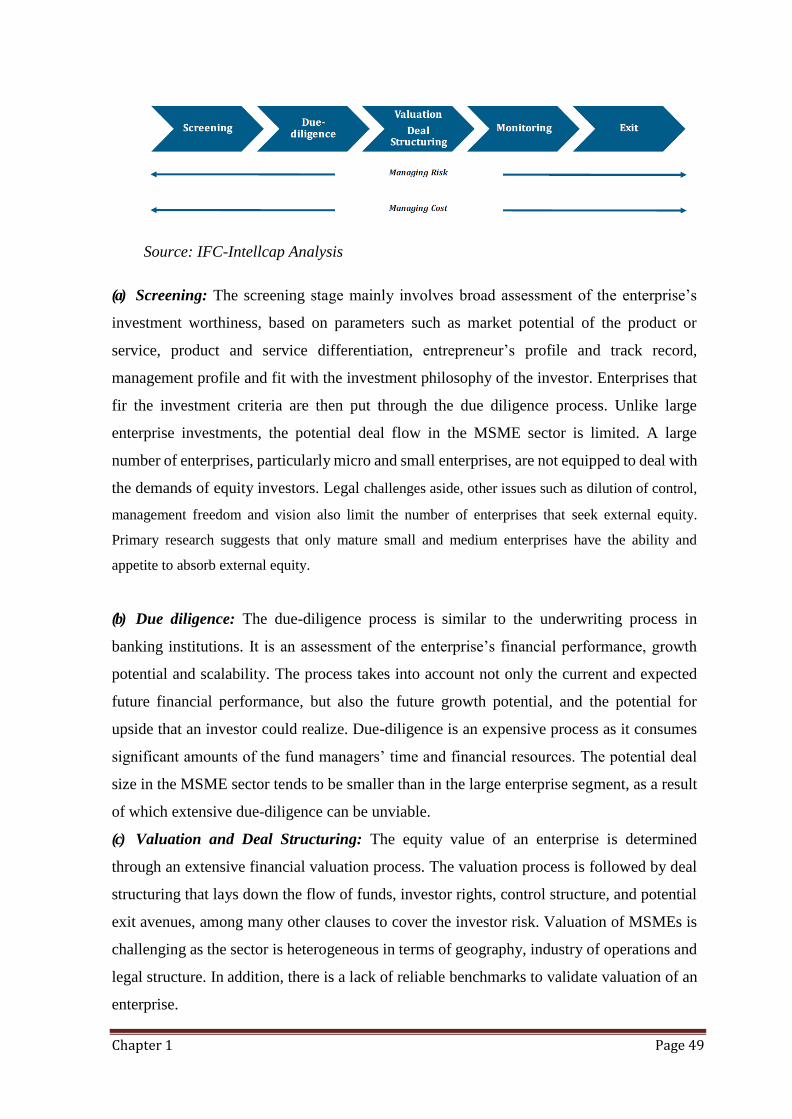
Chapter 1 Page 49
Source: IFC-Intellcap Analysis
(a) Screening: The screening stage mainly involves broad assessment of the enterprise’s
investment worthiness, based on parameters such as market potential of the product or
service, product and service differentiation, entrepreneur’s profile and track record,
management profile and fit with the investment philosophy of the investor. Enterprises that
fir the investment criteria are then put through the due diligence process. Unlike large
enterprise investments, the potential deal flow in the MSME sector is limited. A large
number of enterprises, particularly micro and small enterprises, are not equipped to deal with
the demands of equity investors. Legal challenges aside, other issues such as dilution of control,
management freedom and vision also limit the number of enterprises that seek external equity.
Primary research suggests that only mature small and medium enterprises have the ability and
appetite to absorb external equity.
(b) Due diligence: The due-diligence process is similar to the underwriting process in
banking institutions. It is an assessment of the enterprise’s financial performance, growth
potential and scalability. The process takes into account not only the current and expected
future financial performance, but also the future growth potential, and the potential for
upside that an investor could realize. Due-diligence is an expensive process as it consumes
significant amounts of the fund managers’ time and financial resources. The potential deal
size in the MSME sector tends to be smaller than in the large enterprise segment, as a result
of which extensive due-diligence can be unviable.
(c) Valuation and Deal Structuring: The equity value of an enterprise is determined
through an extensive financial valuation process. The valuation process is followed by deal
structuring that lays down the flow of funds, investor rights, control structure, and potential
exit avenues, among many other clauses to cover the investor risk. Valuation of MSMEs is
challenging as the sector is heterogeneous in terms of geography, industry of operations and
legal structure. In addition, there is a lack of reliable benchmarks to validate valuation of an
enterprise.
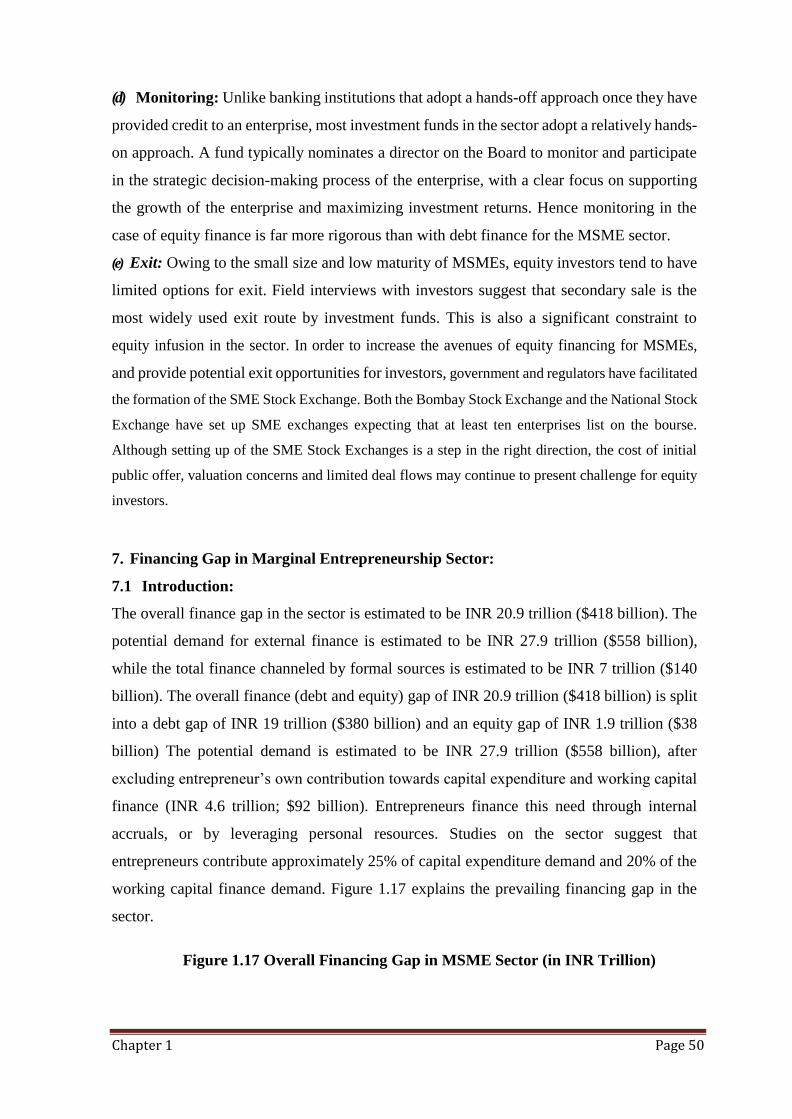
Chapter 1 Page 50
(d) Monitoring: Unlike banking institutions that adopt a hands-off approach once they have
provided credit to an enterprise, most investment funds in the sector adopt a relatively hands-
on approach. A fund typically nominates a director on the Board to monitor and participate
in the strategic decision-making process of the enterprise, with a clear focus on supporting
the growth of the enterprise and maximizing investment returns. Hence monitoring in the
case of equity finance is far more rigorous than with debt finance for the MSME sector.
(e) Exit: Owing to the small size and low maturity of MSMEs, equity investors tend to have
limited options for exit. Field interviews with investors suggest that secondary sale is the
most widely used exit route by investment funds. This is also a significant constraint to
equity infusion in the sector. In order to increase the avenues of equity financing for MSMEs,
and provide potential exit opportunities for investors, government and regulators have facilitated
the formation of the SME Stock Exchange. Both the Bombay Stock Exchange and the National Stock
Exchange have set up SME exchanges expecting that at least ten enterprises list on the bourse.
Although setting up of the SME Stock Exchanges is a step in the right direction, the cost of initial
public offer, valuation concerns and limited deal flows may continue to present challenge for equity
investors.
7. Financing Gap in Marginal Entrepreneurship Sector:
7.1 Introduction:
The overall finance gap in the sector is estimated to be INR 20.9 trillion ($418 billion). The
potential demand for external finance is estimated to be INR 27.9 trillion ($558 billion),
while the total finance channeled by formal sources is estimated to be INR 7 trillion ($140
billion). The overall finance (debt and equity) gap of INR 20.9 trillion ($418 billion) is split
into a debt gap of INR 19 trillion ($380 billion) and an equity gap of INR 1.9 trillion ($38
billion) The potential demand is estimated to be INR 27.9 trillion ($558 billion), after
excluding entrepreneur’s own contribution towards capital expenditure and working capital
finance (INR 4.6 trillion; $92 billion). Entrepreneurs finance this need through internal
accruals, or by leveraging personal resources. Studies on the sector suggest that
entrepreneurs contribute approximately 25% of capital expenditure demand and 20% of the
working capital finance demand. Figure 1.17 explains the prevailing financing gap in the
sector.
Figure 1.17 Overall Financing Gap in MSME Sector (in INR Trillion)
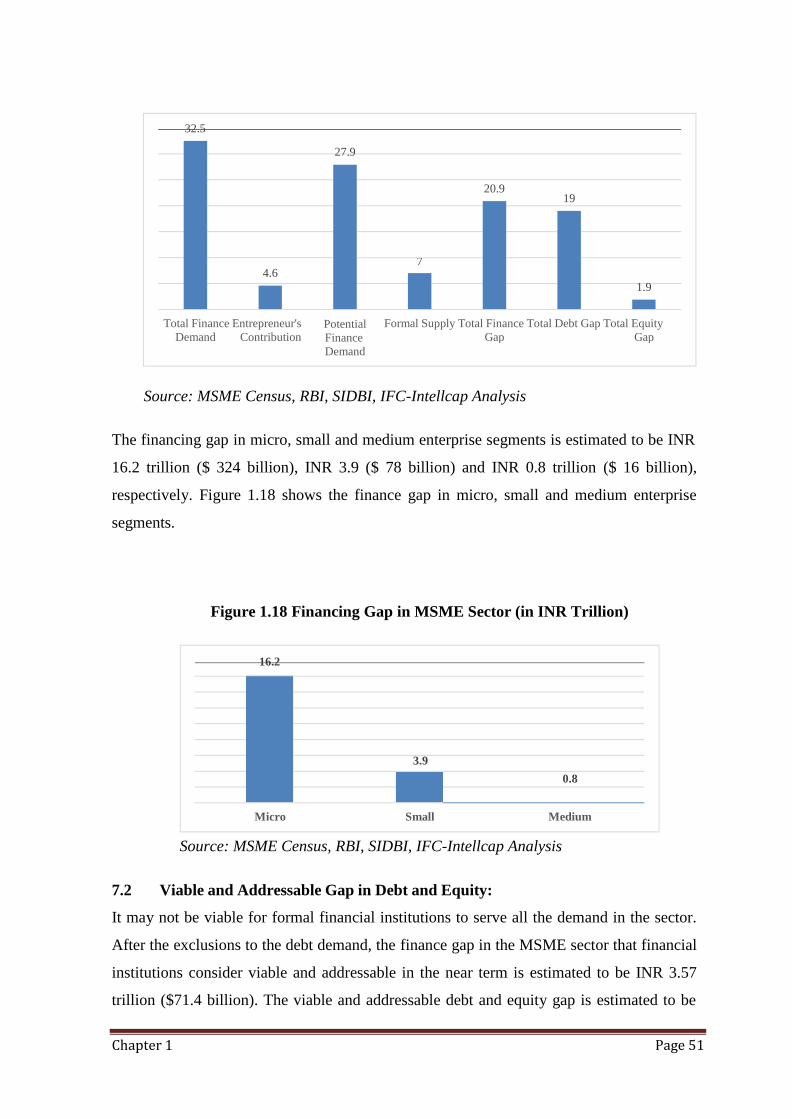
Chapter 1 Page 51
16.2
Micro Small Medium
Source: MSME Census, RBI, SIDBI, IFC-Intellcap Analysis
The financing gap in micro, small and medium enterprise segments is estimated to be INR
16.2 trillion ($ 324 billion), INR 3.9 ($ 78 billion) and INR 0.8 trillion ($ 16 billion),
respectively. Figure 1.18 shows the finance gap in micro, small and medium enterprise
segments.
Figure 1.18 Financing Gap in MSME Sector (in INR Trillion)
3.9
0.8
Source: MSME Census, RBI, SIDBI, IFC-Intellcap Analysis
7.2 Viable and Addressable Gap in Debt and Equity:
It may not be viable for formal financial institutions to serve all the demand in the sector.
After the exclusions to the debt demand, the finance gap in the MSME sector that financial
institutions consider viable and addressable in the near term is estimated to be INR 3.57
trillion ($71.4 billion). The viable and addressable debt and equity gap is estimated to be
32.5
27.9
20.9 19
1.9
Total Finance Entrepreneur's
Contribution Potential
Finance
Demand
Formal Supply Total Finance Total Debt Gap Total Equity
Demand Gap Gap
7 4.6
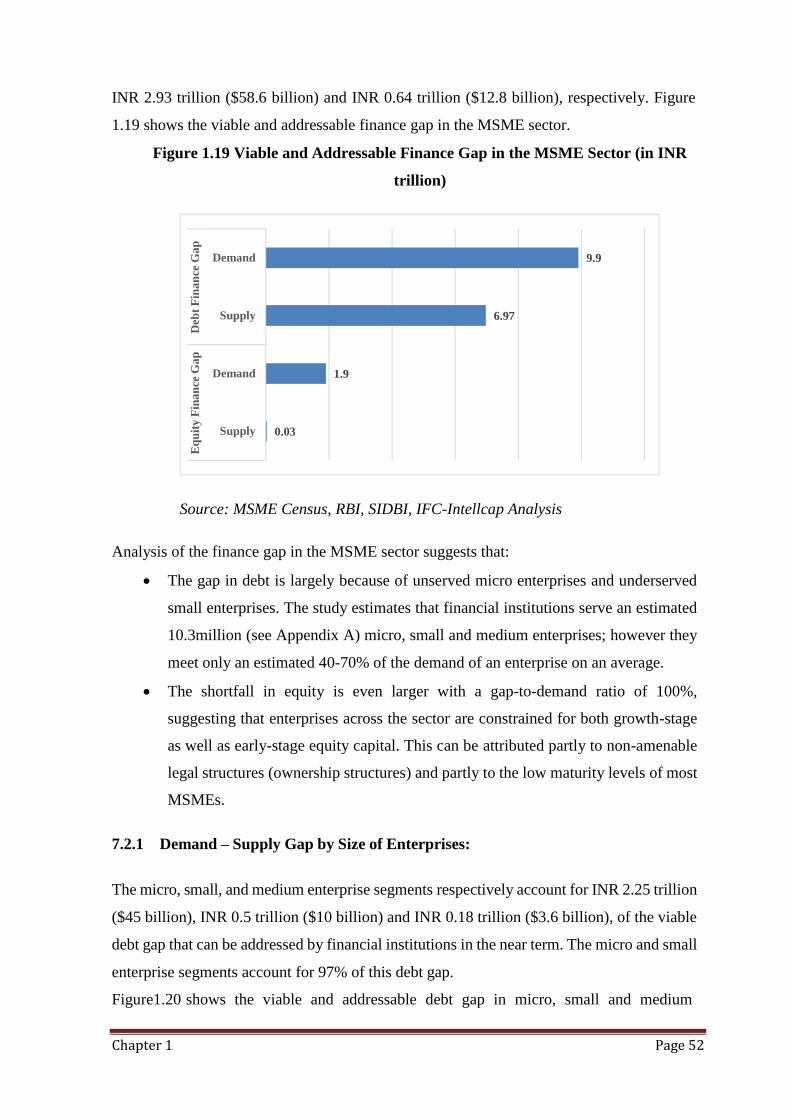
Chapter 1 Page 52
INR 2.93 trillion ($58.6 billion) and INR 0.64 trillion ($12.8 billion), respectively. Figure
1.19 shows the viable and addressable finance gap in the MSME sector.
Figure 1.19 Viable and Addressable Finance Gap in the MSME Sector (in INR
trillion)
Source: MSME Census, RBI, SIDBI, IFC-Intellcap Analysis
Analysis of the finance gap in the MSME sector suggests that:
The gap in debt is largely because of unserved micro enterprises and underserved
small enterprises. The study estimates that financial institutions serve an estimated
10.3million (see Appendix A) micro, small and medium enterprises; however they
meet only an estimated 40-70% of the demand of an enterprise on an average.
The shortfall in equity is even larger with a gap-to-demand ratio of 100%,
suggesting that enterprises across the sector are constrained for both growth-stage
as well as early-stage equity capital. This can be attributed partly to non-amenable
legal structures (ownership structures) and partly to the low maturity levels of most
MSMEs.
7.2.1 Demand – Supply Gap by Size of Enterprises:
The micro, small, and medium enterprise segments respectively account for INR 2.25 trillion
($45 billion), INR 0.5 trillion ($10 billion) and INR 0.18 trillion ($3.6 billion), of the viable
debt gap that can be addressed by financial institutions in the near term. The micro and small
enterprise segments account for 97% of this debt gap.
Figure1.20 shows the viable and addressable debt gap in micro, small and medium
Demand 9.9
Supply 6.97
Demand 1.9
Supply 0.03
Eq
uit
y F
ina
nce
Ga
p
Deb
t F
ina
nce
Ga
p
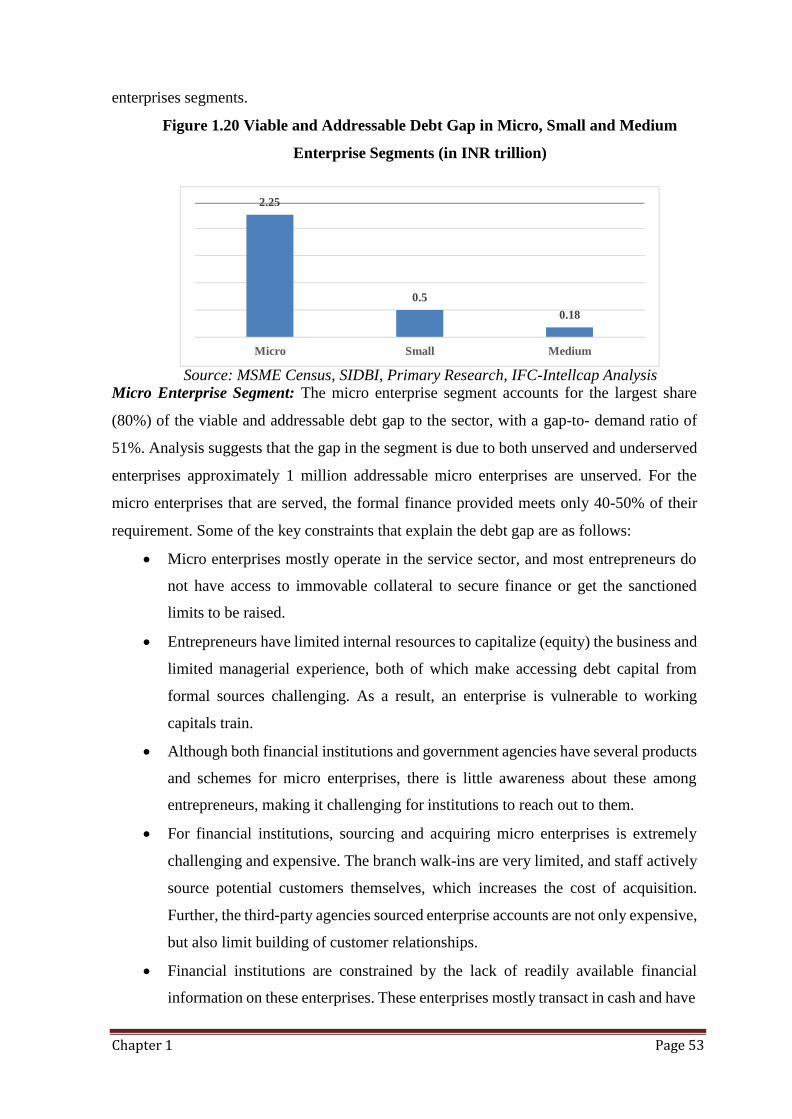
Chapter 1 Page 53
2.25
0.5
0.18
Micro Small Medium
enterprises segments.
Figure 1.20 Viable and Addressable Debt Gap in Micro, Small and Medium
Enterprise Segments (in INR trillion)
Source: MSME Census, SIDBI, Primary Research, IFC-Intellcap Analysis Micro Enterprise Segment: The micro enterprise segment accounts for the largest share
(80%) of the viable and addressable debt gap to the sector, with a gap-to- demand ratio of
51%. Analysis suggests that the gap in the segment is due to both unserved and underserved
enterprises approximately 1 million addressable micro enterprises are unserved. For the
micro enterprises that are served, the formal finance provided meets only 40-50% of their
requirement. Some of the key constraints that explain the debt gap are as follows:
Micro enterprises mostly operate in the service sector, and most entrepreneurs do
not have access to immovable collateral to secure finance or get the sanctioned
limits to be raised.
Entrepreneurs have limited internal resources to capitalize (equity) the business and
limited managerial experience, both of which make accessing debt capital from
formal sources challenging. As a result, an enterprise is vulnerable to working
capitals train.
Although both financial institutions and government agencies have several products
and schemes for micro enterprises, there is little awareness about these among
entrepreneurs, making it challenging for institutions to reach out to them.
For financial institutions, sourcing and acquiring micro enterprises is extremely
challenging and expensive. The branch walk-ins are very limited, and staff actively
source potential customers themselves, which increases the cost of acquisition.
Further, the third-party agencies sourced enterprise accounts are not only expensive,
but also limit building of customer relationships.
Financial institutions are constrained by the lack of readily available financial
information on these enterprises. These enterprises mostly transact in cash and have
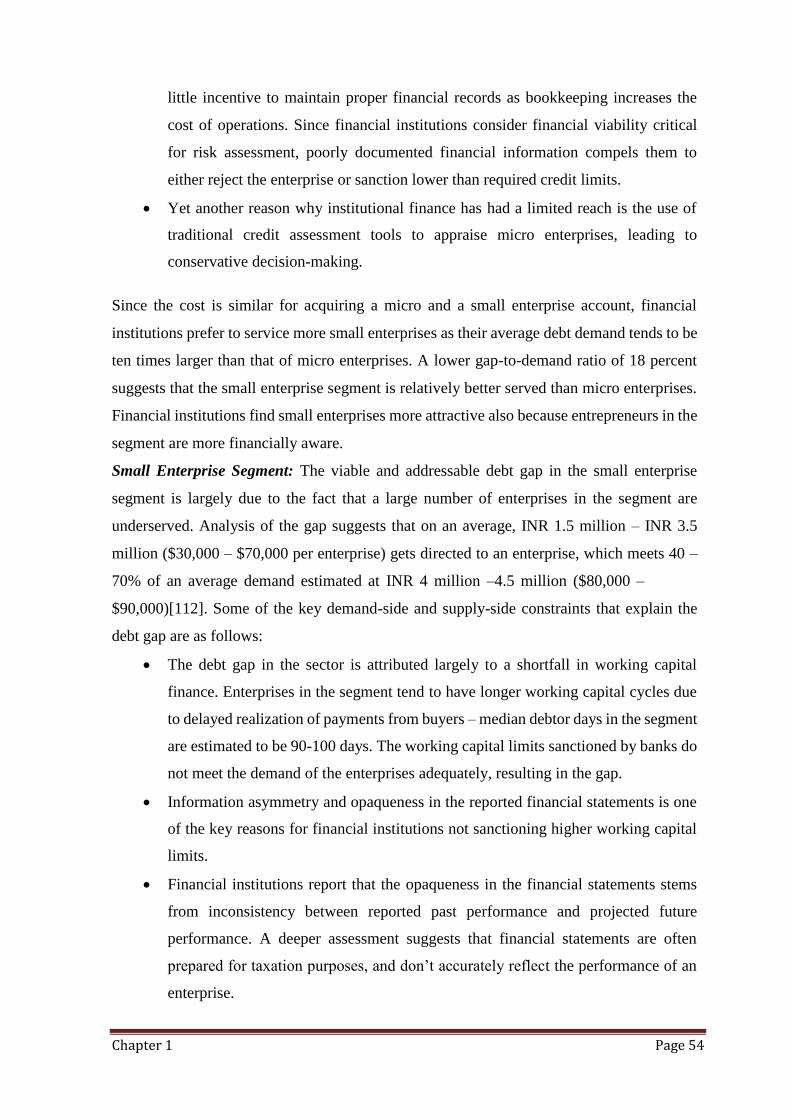
Chapter 1 Page 54
little incentive to maintain proper financial records as bookkeeping increases the
cost of operations. Since financial institutions consider financial viability critical
for risk assessment, poorly documented financial information compels them to
either reject the enterprise or sanction lower than required credit limits.
Yet another reason why institutional finance has had a limited reach is the use of
traditional credit assessment tools to appraise micro enterprises, leading to
conservative decision-making.
Since the cost is similar for acquiring a micro and a small enterprise account, financial
institutions prefer to service more small enterprises as their average debt demand tends to be
ten times larger than that of micro enterprises. A lower gap-to-demand ratio of 18 percent
suggests that the small enterprise segment is relatively better served than micro enterprises.
Financial institutions find small enterprises more attractive also because entrepreneurs in the
segment are more financially aware.
Small Enterprise Segment: The viable and addressable debt gap in the small enterprise
segment is largely due to the fact that a large number of enterprises in the segment are
underserved. Analysis of the gap suggests that on an average, INR 1.5 million – INR 3.5
million ($30,000 – $70,000 per enterprise) gets directed to an enterprise, which meets 40 –
70% of an average demand estimated at INR 4 million –4.5 million ($80,000 –
$90,000)[112]. Some of the key demand-side and supply-side constraints that explain the
debt gap are as follows:
The debt gap in the sector is attributed largely to a shortfall in working capital
finance. Enterprises in the segment tend to have longer working capital cycles due
to delayed realization of payments from buyers – median debtor days in the segment
are estimated to be 90-100 days. The working capital limits sanctioned by banks do
not meet the demand of the enterprises adequately, resulting in the gap.
Information asymmetry and opaqueness in the reported financial statements is one
of the key reasons for financial institutions not sanctioning higher working capital
limits.
Financial institutions report that the opaqueness in the financial statements stems
from inconsistency between reported past performance and projected future
performance. A deeper assessment suggests that financial statements are often
prepared for taxation purposes, and don’t accurately reflect the performance of an
enterprise.
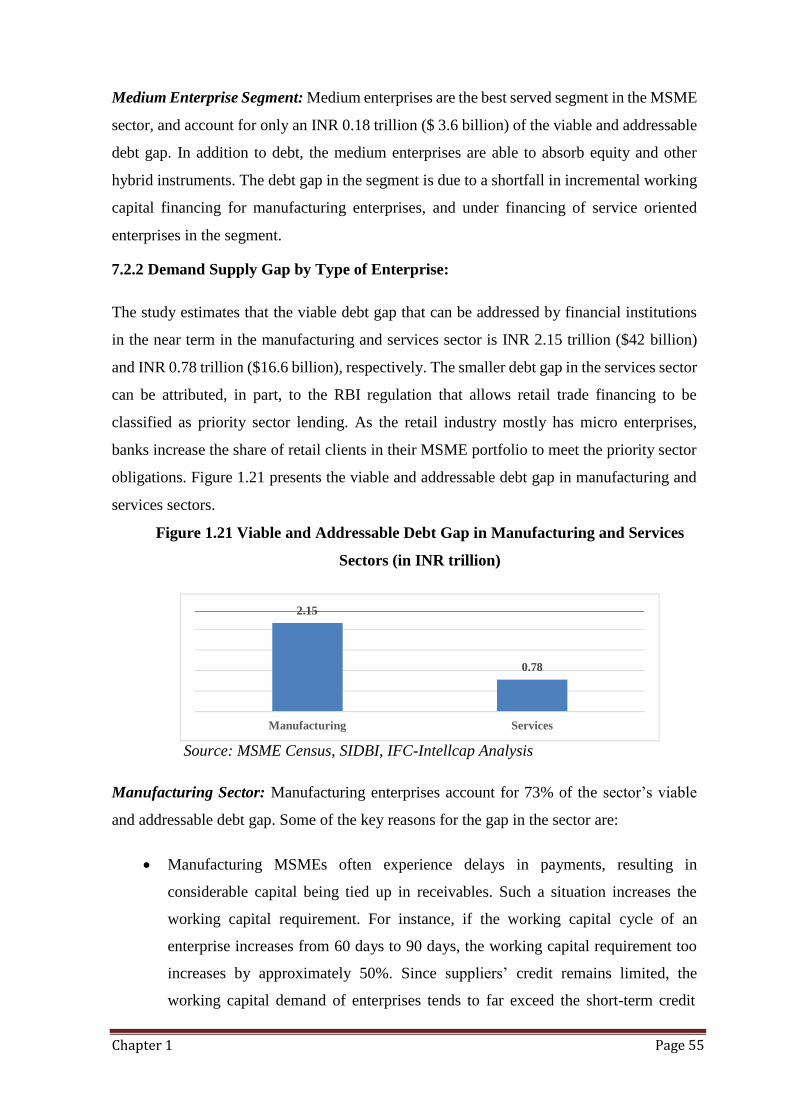
Chapter 1 Page 55
2.15
0.78
Manufacturing Services
Medium Enterprise Segment: Medium enterprises are the best served segment in the MSME
sector, and account for only an INR 0.18 trillion ($ 3.6 billion) of the viable and addressable
debt gap. In addition to debt, the medium enterprises are able to absorb equity and other
hybrid instruments. The debt gap in the segment is due to a shortfall in incremental working
capital financing for manufacturing enterprises, and under financing of service oriented
enterprises in the segment.
7.2.2 Demand Supply Gap by Type of Enterprise:
The study estimates that the viable debt gap that can be addressed by financial institutions
in the near term in the manufacturing and services sector is INR 2.15 trillion ($42 billion)
and INR 0.78 trillion ($16.6 billion), respectively. The smaller debt gap in the services sector
can be attributed, in part, to the RBI regulation that allows retail trade financing to be
classified as priority sector lending. As the retail industry mostly has micro enterprises,
banks increase the share of retail clients in their MSME portfolio to meet the priority sector
obligations. Figure 1.21 presents the viable and addressable debt gap in manufacturing and
services sectors.
Figure 1.21 Viable and Addressable Debt Gap in Manufacturing and Services
Sectors (in INR trillion)
Source: MSME Census, SIDBI, IFC-Intellcap Analysis
Manufacturing Sector: Manufacturing enterprises account for 73% of the sector’s viable
and addressable debt gap. Some of the key reasons for the gap in the sector are:
Manufacturing MSMEs often experience delays in payments, resulting in
considerable capital being tied up in receivables. Such a situation increases the
working capital requirement. For instance, if the working capital cycle of an
enterprise increases from 60 days to 90 days, the working capital requirement too
increases by approximately 50%. Since suppliers’ credit remains limited, the
working capital demand of enterprises tends to far exceed the short-term credit
Chapter 1 Page 56
limits allocated by financial institutions, resulting in a large financing gap.
The problem of working capital shortfall is more severe in export/import-oriented
MSMEs. In addition to delayed payments, cash flows of the enterprise are also
vulnerable to currency rate fluctuations, and with limited formal finance, such enterprises
tend to be underserved.
Enterprises in the sector also face challenges in financing growth. Most
manufacturing enterprises plan growth around capacity expansion as opposed to
productivity enhancement through process efficiencies. Financial institutions are
wary of financing regular capacity expansion as they perceive MSMEs to be
vulnerable to economic downturn, when capacity expansion goesunder utilized.
Services Sector: Services enterprises make up 27% of the overall viable and addressable
debt gap. Financing is better in traditional services industries such as retail, small transport
operators, and hospitality, as financial industries have a better understanding of these sectors.
Some of the reasons for gap in the sector are:
Traditional services experience a greater debt shortfall in capital expenditure
financing compared to working capital requirements because there is a high level
of cash transactions in business operations that can be used to finance working
capital needs.
Although traditional services enterprises often have access to primary security, they
tend to transact mostly in cash, with limited records of their financial transactions.
Due to inadequate information on financial behavior of the enterprise and
entrepreneur; the sanctioned finance limits tend to be lower than what they need.
Financial institutions do not have reliable financing benchmarks for the services
sector unlike for the manufacturing sector, for which there are benchmarks based
on the recommendations of the Nayak Committee. As a result, there is greater
difficulty in determining the actual financing needs of different types of enterprises
in the services sector, leading to under-financing of the sector.
7.2.3 Viable and Addressable Gap in Equity:
The viable and addressable gap in equity is severe, with gap-to-demand ratio of ~95 percent
estimated to be INR 0.64 trillion ($12.8 billion). The current flow of INR 0.03 trillion ($0.6
billion) is largely directed to mature small and medium enterprises. Figure 1.22 shows the
viable and addressable equity gap in MSME sector.
Figure 1.22 Viable and Addressable Equity Gap in MSME Sector (in INR
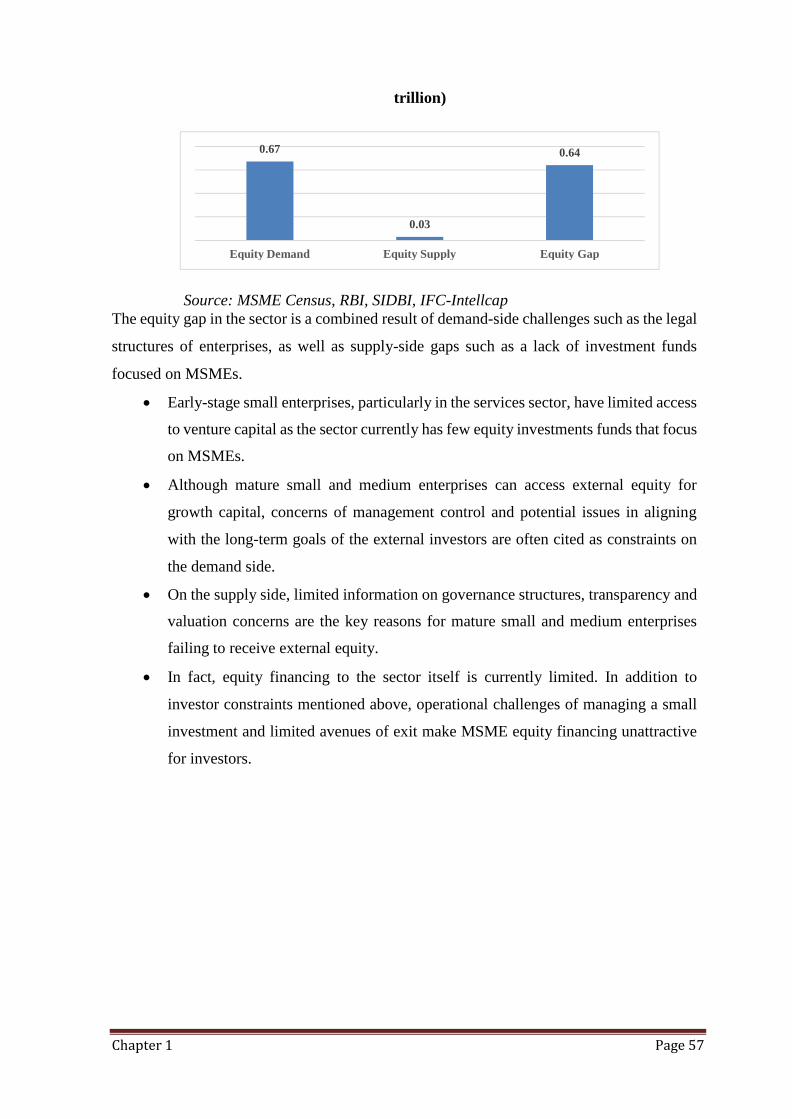
Chapter 1 Page 57
0.67 0.64
Equity Demand Equity Supply Equity Gap
0.03
trillion)
Source: MSME Census, RBI, SIDBI, IFC-Intellcap
The equity gap in the sector is a combined result of demand-side challenges such as the legal
structures of enterprises, as well as supply-side gaps such as a lack of investment funds
focused on MSMEs.
Early-stage small enterprises, particularly in the services sector, have limited access
to venture capital as the sector currently has few equity investments funds that focus
on MSMEs.
Although mature small and medium enterprises can access external equity for
growth capital, concerns of management control and potential issues in aligning
with the long-term goals of the external investors are often cited as constraints on
the demand side.
On the supply side, limited information on governance structures, transparency and
valuation concerns are the key reasons for mature small and medium enterprises
failing to receive external equity.
In fact, equity financing to the sector itself is currently limited. In addition to
investor constraints mentioned above, operational challenges of managing a small
investment and limited avenues of exit make MSME equity financing unattractive
for investors.
Chapter 2 Page 59
Chapter-2
Literature Review
Chapter contents:
2.1 Introduction
2.2 Banking services and marginal entrepreneurs
2.3 Literature Review
2.4 Research Gap
Chapter 2 Page 60
2.1 Introduction:
The availability of external finance for small and medium enterprises is a topic of significant
research interest to academics and an important issue to policy makers around the globe.
The conceptual framework to which most of the current research literature adheres has been
quite helpful in understanding the institutions and markets that provide funds to SMEs in
developed and developing nations. This framework has also provided insights into the
effects of policies that affect access to funding by creditworthy SMEs in these nations.
However, there is an argument that the current framework is oversimplified, and neglects
key elements of the financial system that affect SME credit availability.
Small business and entrepreneurship form an integral part of a healthy national economy. In
recent years various factors, such as the impact of privatization and specialization in
industry and corporate restructuring and downsizing as influenced by new management
theories such as Thomas Peters'" Liberation Management: Necessary Disorganization for
the Nanosecond Nineties" (New York, A.A. Knopf, 1992), have combined to encourage the
emergence of more small and medium-sized companies. At the same time new opportunities
for such companies are seen in the wooing of small business into exporting and international
trade, and the creative efforts of major corporations in the area of business community
development.
The valuable contributions of such small businesses are widely recognized by all sectors of
society, as can be seen by the many efforts to aid small businesses taking place at the
federal, state, and local level. Such efforts range from new rulings of the Securities and
Exchange Commission simplifying its filing requirements for small businesses making stock
offerings to the public to a revamping of business school curriculums to include the study of
small business entrepreneurship.
Yet, in spite of this increased awareness, recent news coverage, while acknowledging a
current economic climate of low interest rates and available money supply, indicates that
access to capital continues to be the most difficult challenge for small business owners.
Recent newspaper articles point to several reasons why even under optimal conditions,
entrepreneurs are still not successful at getting financing: banks, by the very nature of their
business, are resistant to the high-risk loans which many small businesses represent;
potential entrepreneurs may lack the business savvy to articulate what they need in business
Chapter 2 Page 61
terminology; and such inexperienced business persons may also fail to present a well-
thought out long-range alternative plan to cover emergencies and other contingencies.
Factors such as these all contribute to the decision of a would-be financing source not to
commit money to a particular business. For describing the problem statement, various literature
has been reviewed in the area of entrepreneurs’ availability to finance. Below revealed are some of
the literature reviewed.
2.2 Banking Services and Marginal Entrepreneurs
The relationship between banks and small businesses has always been one of mutual
dependence. Small businesses are a very important customer group for banks. Small
business borrowers, according to one estimate, account for one quarter of total bank credit
provided to non-financial businesses and represent 80-90% of the business customers
serviced by account managers (Hatch and Wynant, 1991). Most commercial banks consider
any business with sales of up to $10 million as small (Nixon, 1994). Using this definition,
some 20 million small businesses are served by 14,000 banks in the United States (Nixon,
1994; Posner, 1992).
While large corporations have access to a variety of capitalization alternatives, bank loans
are often the small business owner's only option. Some estimates suggest that commercial
banks provide about one-third of the total capital for small businesses (Gillette, 1982).
Furthermore, while large companies have experts and departments providing input to their
financial decisions, small business owners often have no one to turn to for advice but the
bank. They need considerable guidance and hand holding. As such, the typical small
business banking relationship involves more than just the exchange of money for a note.
Banks usually provide small businesses with an array of services including advice about
capital needs and uses, and information regarding industry performance and outlook.
2.3. Literature Review
Growth and development of entrepreneurship in India is a foremost main concern due to
the dynamic role these enterprises play in country’s industrial economy. One rupee
investment in fixed assets in this segment yields an expected 4.6 rupees of goods and
services with an incremental 10% in value addition. (Cheolsu, K 2009). Over the past two
decades, there has been an increasing drive wide-reaching towards the execution of m-
banking for the unbanked people.
Chapter 2 Page 62
The marginal entrepreneurs are part of this unbanked sector, underprivileged of scholarly
banking services while playing a dynamic economic role in the emerging countries
(Nichter & Goldmark 2009).
According to the Ministry of MSMEs, over 12.8 million MSMEs together hire about 31
million people, harvest 39% of India’s engineering output and create 95% of all industrial
units. Their return contributes for around 33% of total exports and 50% of total engineering
exports. (Ravi S 2009). Marginal Entrepreneurs in most countries, like their minor nature
of business always get lesser sustenance and satisfactory banking services. Conventionally,
banking has been one of the main limitations for Marginal Entrepreneurs (Ardic et al.
2012, Beck & Demirguc-Kunt 2006, Harvie 2004, Levy 1999).
To begin with, an organized financial system more proficiently distributes capital than
persons. Information abnormalities and transaction costs seem when individual borrowing
and lending decisions must be made. (Demirgud – Kunt, et al. 2008). Such examples take
place almost in all financial markets and have shown more opposing effect to micro and
small entrepreneurs. In fact, financing restrictions has concentrated the growth by 6% for
large firms and 10% for small firms. (Beck, Demirgue-Kunt and Maksimovic 2005).
Prescribed bank financing is also pragmatic linked to firm growth and a large firm size
which normally results in greater efficiency, as firms are capable to take advantage of
economies of scale. (Diamond 1999).
Firms that cannot avail bank finances, preserve more cash in hand to finance their working
capital need or purchase fixed assets – and this puts them at a greater risk of making
ruthless investment decisions due to loosened cost controls. So far in adding to the findings
discussed above regarding marginal entrepreneurs level repayments of availability to
finance, a study accompanied on bank advancing in India determined that there is definite
indication of significant potential in advancing in the Indian banking system. (Banerjee,
Cole and Duflo 2003)
Another study on advancing in India takes these findings even further by directing to the
specific dependence of marginal entrepreneurs ‘there are strong structural bedrocks to the
insufficient flow of finance, the organizational structure of banks and procedures, have
taken them faraway from task coordination and have created a specific wrongness against
unimportant loan portfolios. (Morries at el. 2001). Asian entrepreneurs as well as
proprietors of prevailing marginal entrepreneurs may counter difficulties in procuring loan
Chapter 2 Page 63
from commercial banking administrations due to interest rate charges, lack of guarantee or
security for loans and risk factors; mechanisms of a supply gap. There is also an
information gap on the part of marginal entrepreneurs concerning their awareness of
sources and accessibility of finance. (Holmes et al. 2003).
The reserves accessible for advancing in developing nations is inadequate and in the
perspective of financing marginal entrepreneurs, the transaction costs related to micro
financing arise the obstacles for both – lenders and borrowers. Lenders’ profit less from
small loans and both venture risk and the opportunity of loan default may be high.
Borrowers have limited, if any financial resources, of their own to invest in a business
endeavor and lacking of guarantee to secure financing. Composed, these causes produce
information anomalies, vulnerability issues, high transferring costs and a variety of other
troubles which are more apparent in the marginal entrepreneurs financing outlook.
(Srinivas 2005).
There is also confirmation from a range of nations that marginal entrepreneurs in minimal,
rural, remote places face reasonable disadvantages in recovering and safeguarding finance,
as well as difficulties arise from the remoteness of markets and manpower supply and
proficiency restraints. (Felsenstein & Fleischer 2002). In India, a vivacious and
industrialized micro finance sector would inspiration economic development crosswise the
country and sustenance in the movement of wealth among the crowded for ultimately
weakening down the gap between the haves and have not. (Raghavan 2006 and Dutta
2007)
Accomplishing the Indian Government’s economic and social goals is directly linked to the
provision of financing, and thus, to the creation and advancement of development banks.
Encompassed in the mission statements of these banks were necessities to capitalize in
organizations and activities to encourage manufacturing growth in relatively more under
established regions. Thus, be on providing funds for development, particularly in aspects
most needful growth and which have less access to other practices of finance. (Goela &
Bisman, 2007). Several researchers have studied the Entrepreneur Development that has
occupied place since 2003. Some of these noticeable studies were made by Sindhu S.
Narayan and P.S. Geethakutty, (2003), Subrata Dutt, (2004), Anil K Lai and Ronald W.
Clement (2005), Jagannaadha Pawan Tamvada, (2007), Patricia R. Todd and Rajshekhar
G. Javalgri, (2007), Patricia R. Todd and Rajshekhar G Javalgi (2007), K. Lavanya Latha
and B.E.V.V.N. Murthy, (2009), Amit K. Chakrabatty and Krishnamay Gosh (2009),
Chapter 2 Page 64
Madhavi, S.P. (2010).
Women entrepreneurship has been acknowledged as an essential element of economic
development in Kozhikode, Palakkard and Thissur districts of Kerala. Sindhu and
Geethakuuty studied the elements that contribute to the economic growth in these districts.
The researchers industrialized the entrepreneurial achievement index to measure the level
of success in agribusiness by the women entrepreneurs. Outcome revealed that majority of
women were self-initiated and innovative and these factors coupled with support from the
financial institutions were the dynamics that led these women entrepreneurs to be
successful. (Sindhu S. Narayan and P.S. Geethakutty, 2003)
The rural industrial entrepreneurship through non-farm entrepreneurship has contributed to
the economic development in Bengal Region of India. Subrata D., studied the impact of
rural industries by separating the district into five managerial blocks and collected data
from each block by schedule interviews. Using the Linear Structural Model, the data was
assessed. The outcome revealed that the rural industrial entrepreneurship has strong impact
on the rural economic development (Subrata Dutt, 2004).
The market developments in India have stimulated individual enterprises to enhance their
economic growth. Anil and Ronald studied the individual enterprises in the government
well-ordered environment and their response to market based environment. Education in
entrepreneurial skills, financial support and net-working have empowered the individual
enterprise to be successful (Anil K Lai and Ronald W. Clement 2005).
Kalyan S and Atish C examined the marketing strategies of small scale bakery firms in the
city of Kolkata in India, The researchers used the customers’ survey to confirm the
performance of the small scale bakery industry in the light of their business tactics. The
consequence revealed that the small scale bakery firms have united their operations with
their business strategy (Kalyan Sengupta and Atish Chattopudhyay, 2006).
The skill-based technology in India has reformed the artisans’ repetitive livelihood and
economic growth. Arindam Banik et al advanced a theoretical model founded on
conditions of government sponsored poverty lessening programme. The model was used in
cross-examining the situation of the craftsperson. The outcome revealed that changes be
contingent on wages, toolkits and working condition. (Arindam Banik et al 2007). The
factors of entrepreneurship and role of the entrepreneurship were less known in
underdeveloped countries. Jagannaadha composed the data through National Sample
Survey Organisation of India and examined it by using Bayesian semi- parametric
Chapter 2 Page 65
methods. The outcome revealed that the factors were self-employment, firm formation and
geographical location (Jagannaadha Pawan Tamvada, 2007).
Patricia R and Rajshekhar G J evaluated the factors that influenced the internationalization
of small and medium sized enterprises in India. The significance of developing and
promoting small and medium sized enterprises in India was to position them in the
international market place, which was reliant on the economic situation. The assessment of
economic situation of small medium enterprises exposed that there were resource gaps.
The researchers shortened that utilization of technology and special infrastructure could
enable effective use of resources and improve the entrepreneurial activities among the
small medium enterprise (Patricia R. Todd and Rajshekhar G. Javalgri, 2007).
The process of rural development is reliant on the support expected from the members of
rural cooperatives. Authenticating the facts, Amit and Krishnasamy composed the sample
from 100 members. Data were collected from the published annual reports of rural co-
operatives. Both the data were analyzed and the outcome revealed that rural cooperatives
have enhanced the living standard of rural people and augmented the process of rural
development of the study area (Amit K. Chakrabatty and Krishnamay Gosh 2009).
India has implemented policies that have encouraged consumer demand and nurtured
entrepreneurship, whereas China has assumed policies that have stimulated resource
mobilization. Kalyanaram has endeavored to benchmark India’s growth and development
against China by associating the growth models and market potential. He found that China
and India have implemented two different models of growth and determined that India’s
model is likely to more maintainable (Kalyanaram G.K., 2009).
Small scale enterprises in Nellore District of Andra Pradesh confronted problematic in
sustaining their entrepreneurial activities. Lavvanya and Murthy inspected the elements
that administer the entrepreneurial activities. They evaluated a sample size of 553 units in
that district by using ANOVA and Z test. The outcome revealed that the high price of raw
materials, lack of market mechanism and marketing of products were major difficulties
faced by the entrepreneurs. (Lavvanya Latha K. and B.E.V.V. N. Murthy, 2009) Madhavi
S P. did a relative study of rural and urban women entrepreneurs in Ahmednagar District of
Andra Pradesh. Sampling and Garrent’s ranking technique were used in associating the
rural and urban women entrepreneurs. The conclusion shown that women from rural area
Chapter 2 Page 66
were not doing well due to lack of financial backing and insufficient demand from
customers. (Madhavi, S.P. 2010)
2.3.1. The significant role of Entrepreneur in Indian Economy
Daniel Smith, University of North Carolina at Chapel Hill, in his paper The Role of
Entrepreneurship in Economic Growth in 2010, conveyed evidence that entrepreneurship
should be encompassed as an imperative cause of economic growth self-governing of the
other factors. Initially, will begin with a review of important literature, and then move to an
overview of the data and variables used along with an explanation of the statistical
methodology. Here, is the presentation the exploration of the relevant empirical effects and
end with a conclusion specifying possible directions for future research. It is essential to
note that, for the purposes of this paper, entrepreneurship will be defined as simply the
number of new businesses formed in a given time period. Innovation will be defined as the
creation of formerly unidentified economically cost-effective ideas.
The customary neoclassical theory of economic growth was first established by Robert
Solow in his 1956 paper “A Contribution to the Theory of Economic Growth” (Todaro and
Smith, p. 128 and p. 139). In this paper, Solow claims that economic growth is a function of
two inputs- the levels of capital and labor in a given area. The exact nature of this function
is determined by the technological potentials available to the society in question (Solow, p.
66).Thus, under this theory, the economic growth of a given country is determined by the
amounts of labor and capital that country retains and the technological potentials to which
that country has access, i.e., the level of knowledge within that country. In recent times,
many economists have believed that market friendly government policies are one more
significant cause of economic growth.
Hans Pitlik releases his paper “The Path of Liberalization and Economic Growth” by saying
that numerous empirical studies have shown that pro-market government policies have a
positive impact on the economic growth of a given country. His description for this is that
pro-market policies proliferates the benefits individuals receive for performing activities that
are favorable to economic growth (Piltik, p.57). This notion infers that entrepreneurship
may be significantly influenced by market-friendly government policies.
This notion is sustained by the findings of Matthieu Chemin in his article “The Impact of the
Chapter 2 Page 67
Judiciary on Entrepreneurship: Evaluation of Pakistan’s ‘Access to Justice Programme’.” In
this article, Chemin finds that a 2002 reform of the Pakistani judicial system resulted in a
significant increase in the level of entrepreneurial activity there (Chemin, p.114). This
recommends that some government policies can increase entrepreneurship, and that
entrepreneurship is influenced by at least one of the traditional elements of economic
growth. Nevertheless, the fact that entrepreneurship can be inclined by some of the
traditional elements of economic growth does not essentially rule it out as a separate
predictor of economic growth. If there is even one element driving entrepreneurship not
included among the conventional aspects of economic growth and entrepreneurship does
have an impact on economic growth, then entrepreneurship should be considered as a
further separate dynamic of economic growth. The reason for is that, if entrepreneurship is
exaggerated by one or more dynamics apart from the conventional aspects of economic
growth and entrepreneurship has an impact on economic growth, then entrepreneurship is
essentially acting as a substitution for these other elements. Including entrepreneurship as an
independent factor of economic growth would thus endorse that the stimulus of these other
elements on economic growth was at least partly taken into account. There have been many
theories which suggest that entrepreneurship is indeed influenced by factors beyond those
traditionally thought to influence economic growth.
One of these philosophies can be found in the ideas of Joseph Schumpeter. In his work The
Theory of Economic Development, Schumpeter first says that entrepreneurship reasons
economic growth by permitting the means of production in a society to be used in
innovative and more proficient combinations. Schumpeter thus claims that it is
entrepreneurship, not merely information, which causes technological innovation. He then
claims that entrepreneurship is a process that is entirely distinctive from the rational
economic behavior of people, not a natural result of it. His perceptive is that, for people to
behave in an economically rational manner, they must acquire relevant knowledge on which
to base their decisions. He also says that since people typically draw their knowledge from
their past experience, all their rational economic behavior will be based on past ideas and
events. According to Schumpeter, then, economically rational behavior is by definition not
innovative. As a result of this, rational economic behavior cannot consequence in the
making of exclusively new and untried combinations of the means of production, the major
component of entrepreneurship.
Thus, rational economic behavior would basically cause people to familiarize to any

Chapter 2 Page 68
changes in the levels of these conventional elements in whatever way had proven to be most
effective in the past. Hence, entrepreneurship, requiring innovation, cannot be an ordinary
result of just the traditional factors of economic growth. A more current argument for
considering entrepreneurship as an independent factor of economic growth is found in the
article “Entrepreneurship and Regional Growth: An Evolutionary Perspective” by Max
Kielbach and David Audretsch. The authors of this article inspect the particular nature of the
relationship between knowledge and economic growth. They claim that a distinction should
be made between the general body of publicly available knowledge and economic
knowledge – a subset of knowledge from the general body which business have found a way
to use cost-effectiveness. Kielbach and Audretsch go on to say that general knowledge is
converted into economic knowledge by the exertions of entrepreneurs, who essentially
examine through the general body of knowledge until they find a portion they believe they
can adventure and then commence a business based on that piece of knowledge. This
scrutinizing through the general body of knowledge can be viewed as a process of
innovation. It is the economic knowledge that energies economic growth (Kielbach and
Audretsch,). Hence, according to this article, knowledge by itself is not adequate to create
economic growth since entrepreneurship is prerequisite to turn general knowledge into
economic knowledge.
This runs counter to the dispute that entrepreneurship is basically a natural result of high
levels of labor, capital, and knowledge. Kielbach and Audretsch’s theory is sustained by the
findings of C. Mirjam van Praag and Peter H. Versloot in their article “What is the Value of
Entrepreneurship? A Review of Relevant Research.” In this article, van Praag and Versloot
find that countries with an advanced level of entrepreneurship also have advanced levels of
innovation and technological change. This is precisely what one would expect to find if
Kielbach and Audretsch’s theory that entrepreneurship is essential for turning general
knowledge into economic knowledge, and thus innovation, is true.
This philosophy is identical to that found in the article “The Alert and Creative
Entrepreneur: A Clarification” by Israel Kirzner. In his article, Kirzner claims that the main
energetic force behind entrepreneurship is people noticing and taking advantage of
previously unrecognized price differences (Kirzner). Instances of this might comprise
somebody comprehending that they could use an prevailing but little-known technique to
produce and sell a given good extensively with reduced cost than anyone else, or someone
purchasing goods to be sold at a higher price in the future (Kirzner). It is this recognition
Chapter 2 Page 69
and exploitation of price differentials which moves market toward equilibrium (Kirzner, p.
147). This is a direct paradox to the Schumpeterian idea that entrepreneurship inevitably
disrupts the equilibria of markets (Kirzner, pp. 147-148). This contradiction is, however, not
important to the thesis of this paper because both Schumpeter and Kirzner agree that
entrepreneurship is not merely affected by the conventional elemetns of economic growth.
Even though they may disagree about the particular nature of the prospects for profit
confronting the potential entrepreneur, Kielbach, Audretsch, and Kirzner all approve that
entrepreneurship is initiated by the capability of people to perceive and act on these
opportunities innovatively. If this idea is correct, then the level of entrepreneurship in a
given society is initiated by both the extent to which individuals in that society discern and
utilize previously overlooked opportunities for profit and the levels of some of the
conventional elements of economic growth existing in that society.
Robert Bednarzick also puts an argument that entrepreneurship is not only a consequence of
the conventional elements of economic growth. In his article “The Role of Entrepreneurship
in U.S. and European Job Growth,” Bednarzick identifies seven key elements that influence
entrepreneurship in a given country: the prospects for entrepreneurship present, the
demographics, the level of education, the entrepreneurial capacity, the infrastructure, the
extent to which culture encourages entrepreneurship, and whether or not capital is controlled
mainly by banks or public markets. Bednarzick also claims that there is a positive
relationship between entrepreneurship and economic growth.
Of the seven factors that Bednarzick listed in his article, only the first three elements can be
seen as being significantly affected by the levels of the conventional elements of economic
growth in a given country. The entrepreneurial opportunities present in a given country
would be affected by how pro-market the government policies of that country were.
Similarly, the level of education in a country would apparently be associated to the level of
knowledge in that country, and the size of the labor force would clearly be affected by the
population demographics of that country.
Nevertheless, it is problematic to see how any of the other factors that Bednarzick lists could
be significantly affected by the conventional elements of economic growth. The
infrastructure of a given country would be most influenced by government spending, not
market-friendly government policy and regulation, and the extent to which a country’s
culture emboldens entrepreneurship is most likely influenced by sociological factors.
Chapter 2 Page 70
Entrepreneurial capability is normally regarded as an external variable whose causes are
vague (Otani,). Whether capital is controlled mostly by public markets or banks depends on
the general economic structure of a given society, not the conventional elements of
economic growth. This recommends even though the conventional elements of economic
growth will influence the level of entrepreneurship in a given country to some extent, they
do not influence to the extent of justifying its exclusion from the neoclassical model of
economic growth.
Further direct sustenance for the view taken by this paper is found in the article
“Nondestructive Creation: Entrepreneurship and Management Research in the Study of
Growth” by R.G. Hubbard. In this article, Hubbard attributes the high economic growth in
the U.S. in the 1990’s and early 2000’s to a grouping of high levels of entrepreneurship and
managers at companies being capable to adapt to changing business conditions. He
highlights that this high level of economic growth cannot be only attributed to increases in
labor, capital, or the level of technology present in the U.S., pointing out that the level of
technology in several European and Asian countries exceeded that of the U.S. during this
period and that productivity in the U.S. remained high even when it cut down in many other
countries in the early 2000’s.
Making the supposition that the level of technological sophistication in a given country
corresponds approximately to the general level of knowledge in that country, then
Hubbard’s argument recommends that at least three of the four conventional elements of
economic growth do not have a major impact on entrepreneurship. Hubbard’s analysis of
U.S. economic growth during this period strongly advises that some measure of
entrepreneurship should be incorporated as an independent factor of economic growth.
2.3.2. Financial necessity of small entrepreneur and different sources
Robert McGloughlin, in his Resource Report:2 Literature Review on the financial
requirements and products available to small scale owners and entrepreneurs from
commercial banks, 2006 emphases on the findings of local and international studies that
relate, or have relevance to, the financial requirements and the financial products that are
offered to small scale proprietors and entrepreneurs. This document sets out the issues and
current methods to financing small scale proprietors and entrepreneurs those are found
internationally and locally. The small enterprise economy has the prospective to contribute
Chapter 2 Page 71
to the development goals of stimulating economic growth, reducing unemployment and
reducing levels of poverty. This report sets out the issues and current methodologies to
financing Housing Entrepreneurs on the basis of both international and local experience.
(1) Availability of products: Formal financial institutions have found providing support to
small scale proprietors and entrepreneurs has been risky, costly and unprofitable
(Rogerson), even leading to the expiration of a number of local institutions, such as
Saambou Bank. As a consequence the development of financial products and services to this
market has been inadequate. Yet availability of finance remains one of the crucial
roadblocks sighted by small scale proprietors and entrepreneurs to entering or growing their
business, as found by various studies mentioned by Rogerson.
(2) Lending practices and sustainability: Literature from a variety of lenders providing
different forms of finance to housing entrepreneurs was reviewed. On the basis of this
review, the following common features were identified in respect of lending practices:
- Lending should only occur where there are profitable and viable markets.
- Entrepreneurs should have the required skills to undertake the work and the
entrepreneurial initiative.
- Appointment with other producers in the sector should be stimulated.
- Crucial restrictions in the economic chain should be recognized and removed.
- Customer education and counseling should be an integral part of the loan process
providing appropriate and affordable business development and support services.
Sustenance should be provided by skilled and trained staff who are specialized and
knowledgeable of the sector in which the entrepreneur functions. Entrepreneurs should be
supported in sharing market information, technical knowhow and information.
- Loans should be custom-made to meet the cash flow requirements of the borrowers.
- Loans should not be made on the basis of the applicants’ capability to repay the loan from
earnings, rather the main emphasis in approving the loan should rest on expected cash flow
and the character of the applicant.
- In order to ensure that the loan is repaid apprehensively, it is important that the lender
‘knows the customer’. Consequently, an operating office should be situated amongst the
client base and should have continuous contact with the borrower. The lender should have a
clear understanding of the borrower and be concentrated on assisting the borrower to
succeed.
- Community organizations can be used as a platform to sell and market the loan products.
Chapter 2 Page 72
- Borrowers should give genuine collateral.
- For landlords and entrepreneurs who are expanding their assets gradually, large traditional
loans are not well suited to their more incremental needs. A combination of finance from
various sources such as savings, loans from family and friends and small loans are being
used to overcome difficulties associated with long term recognized finance.
The following ten points were acknowledged as being principles for sustainable lending:
- offer short term loans with regular repayment periods;
- offer small preliminary loans;
- focus on provision of working capital to enterprises with an established track record;
- specialize in financial services and diversify loan portfolios;
- streamline services by making the credit programme a customer friendly process;
- concentrate services and focus on scale;
- shorten turnaround times between loan application and disbursement;
- stimulate repayment through group harmony and joint liability;
- recognize that the poor do save by connecting credit programmes to savings; and
- charge full-cost interest rates, factoring in inflation, loan losses, delinquency and cost of
loaning funds.
Small and Medium Enterprises’ Access to Credit and Support in South Africa Compiled by
Underhill Corporate Solutions (UCS) Pretoria, South Africa December, 2011:
The key object of the study was to evaluate the access to credit and sustenance by SMEs in
SA. The main research question was “Is there an SME financing gap in South Africa?” The
term “financing gap” refers to a situation where a sizeable proportion of economically
substantial SMEs cannot obtain finance from banks, capital markets or other suppliers of
finance. Additionally, it is often alleged that (i) many entrepreneurs or SMEs that do not
presently have access to funds, would have the capability to use those funds productively if
the funds were available; (ii) but due to structural characteristics, the recognized financial
system are unable to provide sufficient finance to such entities.
To satisfactorily answer the question “Is there an SME financing gap in SA?” the study
separated the SME sector into two markets; (i) demand for and (ii) supply of credit. The
analysis reveals that, just as for the rest of the SA economy, the SME sector is divided into
two; (i) the first economy, where recognized SMEs are functioning and (ii) the second
economy, unceremonious SMEs. Expending the definition of financing gap given above,
Chapter 2 Page 73
only recognized SMEs, by virtue of being properly registered and having a bank account,
have access to banks, capital markets or other suppliers of finance. Unceremonious SMEs
are excluded totally from the formal financial market. Financing gap in terms of SME
numbers: SA has between 2,4 to 6 million SMEs. Around 20% of these SMEs are registered
with Companies and Intellectual Property Commission (CIPC) and have a bank account.
Of the recognized SMEs, less than 100,000 (27.3%) successfully apply and receive finance
from the recognized financial sector. Almost half of the SMEs are not registered hence are
operating informally. Due to their informality, most (84.7%) of them are financially
excluded. That is, they do not have access to the formal financial markets. Hence, the total
financing gap, both formal and informal SMEs, is expected at around 45-48% of all SMEs
in South Africa. The broad picture that appears from the various surveys of SME financing
“strongly suggest that business owners in South Africa view access to financing as a
significant problem for business activity” (Turner et al, 2008: 15), i.e. that there might be a
“financing gap” despite the various public and private sector initiatives to simplify access to
financing. Respondents to the FinScope Small Business Survey (2010), though, when asked
to identify the single most significant obstacle to growth, access to finance ranked third with
8.7% of small business owners mentioning the lack of access to finance as a reason.
This finance may be attributable to the fact that South Africa has a comparatively well-
developed financial sector with a ratio of domestic credit to GDP of 78%. This study’s
analysis of supply side of the SME credit market shows that South Africa has a variety of
financing programmes and funding schemes by both the public and private sector funding
agencies. It was also noted that regardless of the availability of an array of funding
programmes, awareness of these programmes and the acceptance has been very low (DTI,
2008), particularly for Government supported schemes.
For those SMEs that apply for finance, the refusal rate has been high, particularly for bank
sponsored schemes. There seems to be: (i) a general lack of awareness of the finance
programmes; (ii) a disparity between the products offered on the supply side and that which
is required by the SME market; and (iii) a gap between the minimum requirements for a
business loan and status especially on the issue of formality of the majority of SMEs. This
means that even registered microenterprises are less expected to have access to credit.
Moreover, a large fraction of the SMEs are completely omitted from the financial market.
Chapter 2 Page 74
Even those SMEs that are in the recognized market, a further difficulty faced by
entrepreneurs trying to access finance is that mostly government banks are less set up to
cope with small loans. For instance, only 59% of small and medium enterprises had any
credit products as compared to 82% for large firms. Micro finance institutions, on the other
hand, do have structures in place for smaller loans, but the loans are at high interest rates
that many small businesses are unable to afford. Other factors constraining SMEs’ access to
finance include the lack of business managerial experience and skills, inadequate
information on available products, comparatively low levels of financial knowledge, poor
business plans and other external factors.
The literature review shows that there are a various sources of credit for SMEs. Though, it is
not possible to govern with any degree of correctness whether the financing available is
adequate to meet the requirements of the SME sector due to the lack of information,
particularly with regard to the demand side and the specific reasons for the lack of access.
Hence, more exploration is needed in this area to:
(1) ascertain the specific requirements of the SME sector when it comes to financing and
(2) whether the financing available meets those needs in terms of both “quantity” and
“quality”.
There is a probability that there is adequate credit being made available, but the terms and
conditions under which it can be retrieved are not favorable for the SME sector it is
envisioned to serve. In other words, there is sufficient “quantities” of funding available, but
the “quality” of funding, i.e. the product design/services being offered, does not match the
requirements of the sector. In this case, the policy response should not be designed to
increasing the amount of credit available to the sector, but should involve revisiting the
product offering of the credit already accessible and ensuring that it meets the needs of the
SME sector it is anticipated to serve.
Another possibility that needs attention is that in which credit is available and sufficient to
meet demand, but the lack of access is attributable either to the specific features of the
SMEs applying for the loan or the lack of awareness that the funding is available. In these
instances, the policy response required would necessarily be different from that of
increasing funding available, or indeed, changing product design/service offering. If there is,
in fact, a shortage of finance, quantity of loanable funds, the Government can increase the
supply of funds through funding of existing agencies like the National Youth Development
Chapter 2 Page 75
Agency (NYDA), Khula and other Government owned institutions. With regard to the
scenario where sufficient credit is available, but the terms and conditions of availing the
financing is problematic for the SMEs due to poor product design/service offering, then
interventions will need to address this particular deficiency. With respect to private entities,
it is anticipated that competition and the desire to increase returns from catering to this
segment will improve product design and services offered. For Government funded
programmes, the evaluation and monitoring of the various schemes and programmes on a
regular basis should help the Government to keep well-informed of the applicability of the
various programmes and schemes.
Thirdly, with respect to situations where credit is available, but availability is constrained by
SME specific factors, then involvements will have to be targeted to deal with these specific
SME characteristics. To summarize, the characteristics being referred to relate to: (1) the
lack of information available with respect to the business, or where there is information
available the information is of very poor quality;
(2) the lack of collateral; (3) the failure to avail financial services, including credit, due to
various insights small business owners have of the requirements needed for availability; (4)
the reduced level of managerial competence and skills of the small business owner; (5) the
age of the enterprise; and (6) the legal status of the enterprise.
The significant recommendations arising from the study are interventions that focus on:
(i) Increasing the levels of formality of SMEs – this can be achieved through the
compulsory registration of SMEs that have not yet registered, at minimal or no cost to the
SME.
(ii) Training and capacity building – building on current programs and establishing new
ones if warranted to improve the levels of managerial competence of the small business
owner.
(iii) Establishing of a Government department to deal specifically with SMEs,
entrepreneurship and support to this sector.
(iv) The monitoring and evaluation by Government of its SME funding programmes on a
regular basis. This will help the Government keep abreast of the applicability of the various
programmes and schemes. The immediate objective of the evaluation of current
programmes and schemes is identifying the reasons why awareness and uptake has been
low.
Na Dai, Assistant Professor, School of Business, Albany, NY and Vladimir Ivanov, U.S.
Chapter 2 Page 76
Securities and Exchange Commission, Washington in their research Entrepreneurial
Optimism, Credit Availability, and Cost of Financing: Evidence from U.S. Small
Businesses
1. Managerial Optimism
The role of managerial optimism and overconfidence in a firm’s investment and financing
decisions has been a subject of an ongoing debate in the corporate finance literature.
Following Roll’s (1983) pioneering study on the role of managerial overoptimism in
corporate acquisitions, the merits of managers’ possible departure from full rationality, and
behavioral corporate finance in general, have been examined in a number of theoretical and
empirical studies.
Heaton (2002) is the first to introduce a behavioral capital structure model. He suggests that
because optimistic managers systematically attach higher probabilities to good firm
performance than the capital market, they believe that the capital market undervalues the
firm’s risky securities. Thus, in an efficient market, issuing a risky security is always
perceived by optimistic managers as a negative net present value event. Heaton’s model thus
induces a pecking order capital structure preference, where managers prefer internal cash or
risk-free debt to risky debt, and prefer risky debt to equity.
Hackbarth (2008) develops a trade-off model of capital structure with optimistic and
overconfident managers. His model predicts that optimistic managers choose higher debt
levels and issue new debt more often. On the other hand, the optimism has also a beneficial
effect in his model since it restrains managers from wasting the funds of the corporation.
However, the predictions of Heaton (2002) and Hackbarth (2008) are not novel, since they
are also independently derived from the traditional agency and asymmetric information
models of capital structure discussed in the previous sub-section. Thus, when testing the
predictions of the behavioral capital structure models one has to control for the agency and
asymmetric information explanations of the capital structure choice.
Several empirical studies examine the effect of managerial optimism on corporate
investment decisions. For instance, Malmendier and Tate (2005, 2008) use the tendency of
CEOs to delay the exercise of their stock options to proxy for optimism, and show that this
measure correlates with the intensity of their firms’ investments. Ben-David, Graham and
Harvey (2007) and Sutner and Weber (2008) show that the overconfidence of top executives
affects various corporate decisions using survey data. Liu and Taffler (2008) measure CEO
Chapter 2 Page 77
overconfidence with formal content analysis of CEO statements, and document that CEO
optimism is positively correlated with investment activity.
A few recent studies explore the role of optimism in entrepreneurs’ and, in a broader sense,
individuals’ decision making. Puri and Robinson (2007) creates a measure of optimism
using the Survey of Consumer Finance by comparing self-reported life expectancy to that
implied by statistical tables. They find that optimism is related to numerous work/life
choices.
Cassar and Friedman (2007) find that overconfidence increases the likelihood that an
individual will begin pursuing startup activities. However, outside of entry decisions, they
do not find overconfidence to be a significant determinant of the amount of financial and
human capital the entrepreneur invests in the startup or the risk of the entrepreneurial
investment. Landier and Thesmar (2009) model the effect of entrepreneurial optimism on
financial contracting, particularly the choice of short-term debt and long-term debt and find
supporting evidence using a France survey data. They measure optimism using
entrepreneurs’ demographic characteristics, such as their age, gender, and education.
2. Capital Structure
Over the years, numerous theories on why and how firms borrow money have been
proposed. Among those, there are generally three explanations of a firm’s capital structure
decisions that have received the most attention from finance scholars: the Pecking Order
Theory (Myers and Majluf, 1984; Myers, 1984), the Trade-Off Theory (Jensen and
Meckling, 1976; Jensen, 1986; Hart and Moore, 1994), and the Market Timing Theory
(Baker and Wurgler, 2002). The pecking order theory is based on asymmetric information
arguments and predicts that firms turn to the sources of financing with the lowest degree of
information asymmetry first.
Thus, according to this theory firms utilize retained earnings first, then use debt financing
(which has a smaller adverse selection premium than outside equity), and use outside equity
as a last resort. On the other hand, the trade-off theory asserts that the decision to use debt is
based on the trade-off between the benefits from debt (tax deductibility of interest payments,
disciplining effect on managers) and costs associated with it (costs of financial distress,
shareholderdebtholder conflicts). Lastly, the market timing theory, which is the newest of
the three, argues that the firm issues equity in hot equity markets and debt in cold equity
Chapter 2 Page 78
markets.The voluminous empirical literature on capital structure has so far yielded mixed
results on which theory best explains a firm’s capital structure decision.3 A recent study by
Frank and Goyal (2008) documents six core factors that significantly affect capital structure
decisions: mean industry leverage, market-to-book ratios, tangibility of assets, firm profits,
firm size, and expected inflation.
While the overwhelming majority of empirical studies involve publicly traded firms, very
few focus on small private firms. These limited studies typically focus on venture capital
backed firms (Cumming, 2005). Most recently, Cole (2009) investigates the capital structure
decisions of small private U.S. firms. He finds that firm size, age, and profitability are
negatively related to firm leverage and firm liquidity, risk and tangibility of assets are
positively related to firm leverage.
Small Business Lending
Despite the fact that they have few assets and cannot offer much collateral, small firms tend
to borrow significant amount of money (for example, Berger and Udell (1998) report that
roughly 50% of the small firms’ financing comes in a form of debt), and concentrate their
external borrowing from commercial banks (Petersen and Rajan, 1994; Berger and Udell,
1998). The asymmetric information problems that plague the relationship between small
businesses and lenders (Stiglitz and Weiss, 1981) might prevent a good firm from obtaining
much needed financing. These problems could be mitigated in several ways, such as
relationship lending, collateral requirements, choice of loan terms and maturity, use of bank
guarantees, etc. Probably the main way of alleviating the moral hazard and adverse selection
issues generated by information asymmetry is by relying on relationship lending. The
benefits of relationship lending are well-documented in the literature. For example, a
number of studies find that building close ties with lenders results in larger availability of
credit (Petersen and Rajan, 1994; Elsas and Krahnen, 1998; Scott and Dunkelberg, 1999;
Machauer and Weber, 2000); Cole (1998) documents that a pre-existing relationship
between a company and a lender (for example, savings accounts and financial management
services) increases the likelihood that the lender will extend credit, but the length of the
relationship does not play a significant role.
Both Petersen and Rajan (1994) and Cole (1998) find that small firms with many banking
relationships are less likely to obtain credit, suggesting that private information about a firm
is less valuable when this firm uses multiple sources of credit. In addition, small firms with
Chapter 2 Page 79
longer bank relationships pay lower rates (Berger and Udell, 1995; Harhoff and Korting,
1998; Scott and Dunkelberg, 1999; Degryse and van Cayseele, 2000), have to provide less
collateral (Berger and Udell, 1995; Harhoff and Korting, 1998; Scott and Dunkelberg,
1999), and have greater protection against the interest rate cycle (Berlin and Mester, 1998;
Ferri and Messouri, 2000).
The literature has also established that the distance between borrowers and lenders and the
communication method (in person or not) matter in small business lending. For instance,
Peterson and Rajan (2002) show that distance decreases with the borrowing cost while
arm’s length communication method (phone and mail) increases the borrowing cost. This is
presumably because local banks are better at collecting “soft” or private information.
Similarly, the in person communication method allows banks to better observe the true
quality of the firm. Bank type also plays a role in relationship lending. Berger, Saunders,
Scalise, and Udell (1998) and Berger, Miller, Petersen, Rajan, and Stein (2005) show that
smaller banks are better at collecting soft information and dealing with informationally-
opaque borrowers than larger banks. Cole, Goldberg, and White (2004) find that small
banks rely on information from preexisting relationships, while larger banks use more
standard criteria obtained from financial statements when making lending decisions.
Again, like in the case with capital structure, very few studies have examined the role that
entrepreneurial optimism plays in small business lending.
for the Small Business Service , The Impact of Perceived Access to Finance Difficulties
on the Demand for External Finance , Final Report, 2007, Centre for Enterprise and
Economic Development Research ,Middlesex University, London by Dr Peter Wyer,
CEEDR, Dr Ignatius Ekanem, CEEDR, Professor David North, CEEDR, Professor
David Deakins, University of Paisley :
The purpose of this review was to investigate the extent to which perceived difficulties
concerning access to finance discourage potential and existing entrepreneurs from
demanding external finance. It focuses on evidence relating to the barriers to accessing
finance that can arise because of the perceptions that ‘would-be’ and existing entrepreneurs
have regarding their chances of success in applying for external finance, the process
involved in obtaining it, and the various ‘costs’ to them and their business of being
successful.
The review has had the following aims: (i) to provide a comprehensive overview of the
Chapter 2 Page 80
existing research literature and understanding of the status quo relating to the perceived
difficulties of accessing finance; (ii) to identify key policy relevant issues; and (iii) to
outline future research and policy agendas. The review encompassed theoretical writings on
the subject, empirical work including quantitative survey methods as well as qualitative
research based on case studies, and various data sources/sets which are likely to repay
further analysis. As well as drawing upon relevant research evidence from the UK, the
review has also used literature relating to a number of developed economies, notably the
USA, Canada, Scandinavia, and other European Union countries.
Difficulties in Acquiring Finance
Thorsten Beck in his paper, Financing Constraints of SMEs in Developing Countries:
Evidence, Determinants and Solutions, May 2007, surveys empirical research that shows
that small and medium enterprises (SMEs) are more constrained by financing and other
institutional obstacles than large enterprises, exacerbated by the weaknesses in the financial
systems of many developing countries. They use the concept of the access possibilities
frontier to explain how difficulties in managing risk and transaction costs involved in SME
lending makes financial institutions and markets so reluctant to reach out to this group of
enterprises, especially in developing countries. Also discuss different policies and reforms
that can entice financial institutions and markets to lend to SMEs and comment on the role
of the government in institution building, providing the regulatory framework and undertake
market-friendly activist policies. However, they also point to pitfalls in government's
involvement in SME financing.
Barriers Encountered during Micro and Small Business Start-up andRecommendation
for the change:
This research examines the position of micro and small businesses in the UK economy and
the factors which influence their conception, their survival and their extinction. These
factors are found in both the external and internal environment of the small business, with
the literature placing particular emphasis on the psychological characteristics of successful
entrepreneurs. In consideration of such factors, this chapter begins by looking at the
concepts involved in the investigation of small businesses and the current position of small
businesses in the UK, followed by a thorough review of the recent literature pertaining to
small businesses and those involved in the start-up and running of small business.
Chapter 2 Page 81
The literature relating to small business originates from three main disciplines: economical,
sociological and psychological. The majority of that literature is based on studies conducted
in the USA, which has implications for the interpretation of such studies from both a legal
and economic viewpoint. Although they provide a significant contribution to our
understanding of the processes involved in small business formation, they do not afford a
direct insight into the situation of small businesses in the UK and caution must be taken
when considering their findings.
This chapter will put forward practical recommendations, based on the experiences of
potential and new micro and small business owners, for increasing the success rate of new
micro and small businesses in the North West. These recommendations, if implemented,
would provide new business owners with greater internal control of their enterprise and
more appropriate external support, in emotional, financial and practical terms.
They are directed towards any individual or organisation involved in the initialization and
formation of new businesses in the North West, and those concerned with the subsequent
success and growth of such enterprises. This includes service providers (e.g. Business
Links), financial institutions (e.g. Banks), government regulators (e.g. Employment
Service), and potential and new micro and small business owners.
Recommendations will be considered in three main categories: Financial, Training,
and Support and Advice, Financial Recommendations, Employment Service
Regulations
The Employment Service needs to recognize that new business formation is a valid
alternative to formal employment. Currently, attendance on a Business Enterprise
Programme renders an individual ‘unavailable for work’. This means that, not only is their
entitlement to benefit brought into question, but they are expected to continue with formal
job search throughout the duration of the course. New business formation is a time
consuming and demanding process, potential new business owners cannot focus all their
efforts on the successful initialization of such an enterprise if they have to maintain a facade
of job search activities. The Employment Service is placing undue pressure on potential new
business owners who claim benefits, thereby inhibiting their chances of successful
enterprise creation rather than assisting it.
Potential new business owners who are claiming benefits should be allowed a ‘permitted
period’ in which to initialize a new enterprise. They could prove their intent by attendance
Chapter 2 Page 82
on a Business. Enterprise Programme and the production of a comprehensive business plan,
with nonattendance or failure to produce a business plan resulting in individuals being
deemed ‘unavailable for work’. This would satisfy benefit regulations and provide potential
new business owners with the time to discover if their business idea is a viable proposition.
Those who choose to withdraw from new business formation on completion of a business
plan should not be penalised, while those who decide to continue should be allowed a
reasonable time for their enterprise to become operational.
Government and European Grants
Potential and new micro and small business owners need to be better informed about
available grants and how they can be applied for. Co-ordination of available grants could be
achieved through a central point of contact with the agencies involved. This would be a
source of impartial advice relating to alternative funding sources and practical help for those
wishing to pursue grant applications. The agencies who administer such grants should
provide more open information on what is available, what is required of applicants and
impartial advice on how to complete application forms. Ideally, agencies or a central contact
point would provide assistance throughout the application process. This process needs to be
faster and less bureaucratic if it is to effectively support the new micro and small businesses
it is aimed at.
New Business Start-up Grants
These grants are paid in equal instalments over a six month period and are a life-line to
many new micro and small businesses. However, six months is a very short period of time
for a new business. Difficulties with obtaining credit from suppliers and payment from
customers frequently leads to substantial cash-flow problems in the first year of new
business operation. The majority of new business owners who were in receipt of start-up
grants, felt that they would have benefited from payments over a twelve month period. This
would provide a more stable financial base for the first year of business operation, ensuring
a high survival rate and increasing the potential for early growth.
In addition, some new business owners believed that the current system for the
administration of start-up grants was not flexible enough to accommodate the needs of new
business owners during the initialization process. In some circumstances new business
owners needed a lump sum, rather than ongoing payments, to be used as matched funding
when approaching financial institutions for venture capital. This could be administered as an
interest free loan, that is ‘paid back’ over a six or twelve months period by the start-up grant
monies, that would have be paid to the new business owner on a weekly basis during that
Chapter 2 Page 83
time. Business failure would result in the balance, which remained outstanding at that time,
becoming due for repayment by the new business owner and, if where appropriate, subject
to interest if the loan could not be paid within a reasonable time scale.
Financial Institutions
The wide variety of approaches taken by banks to micro and small businesses was criticized
heavily by potential and new business owners. Whilst acknowledging that banks work in
open competition, they believed that greater uniformity in services and rates would be of
benefit to all those involved. The way in which financial institutions allocate credit and
loans was also felt to be discriminatory against micro and small businesses, with business
owners being offered substantial amounts of money via personal loans and credit card but
being refused relatively small business loans.
In addition, several new business owners reported that they were unaware that financial
institutions would only provide 50% of the start-up capital required, even on presentation of
comprehensive business plans. Plus, the decision to lend money was taken by someone who
they felt was unqualified to determine whether or not they had a potentially successful
business plan.
Financial institutions are a significant source of start-up capital for new micro and small
businesses. They need to have clear guidelines available to potential new business owners
that state exactly what they are willing to provide in terms of start-up loans. If they can
provide finance via personal loans to an individual, then they should be able to provide that
finance via business loans. Their current approach undermines the confidence of new micro
and small businesses owners and, overall, such institutions give the impression that they
place little value on the creation of such enterprises. As the number of new micro and small
businesses in the North West increases, financial institutions must evolve their services to
reflect the important part these enterprises play in the regeneration of the local economy.
Cash-flow
One of the main reasons new micro and small business fail, or experience great difficulties
in their first year of operation, is their inability to manage cash-flow effectively. This
situation frequently arises because of external factors beyond the control of the business
owner, e.g. inability to secure credit with suppliers while having to provide extensive credit
for customers. Although little can be done by new business owners to obtain credit from
their suppliers, they can request that customers pay ‘up front’ for equipment or materials.
Chapter 2 Page 84
These items would by law become the property of the customer at the time of purchase, so
minimal risk is involved from the customers’ viewpoint. However, it would substantially
reduce the risk on new business owners and cash-flow difficulties.
The majority of cash-flow difficulties appear to arise from customers failing to settle their
accounts in accordance with the agreed credit terms. This places new business owners in a
very difficult situation, they cannot afford to upset their customers by continual harassment
for money yet they cannot afford to allow such monies to remain outstanding. The worst
offenders in terms of payment seem to be large organizations, with the degree of difficulty
in obtaining payment rising with the size of the organization. This may result from
increasing bureaucracy in large companies, which delays payments simply because of the
processes involved in settling accounts. However, this does not absolve them from their role
in the potential destruction of many new businesses. Large organizations should not be in
the business of destroying other businesses and they need to have policies in place which
protect micro and small businesses from such treatment.
Training Recommendations
Business Courses
The vast majority of potential and new micro and small business owners believed that the
Business Enterprise Programmes (BEP), currently run by service providers, were extremely
valuable and of significant benefit to those interested in the initialization of a new
enterprise. However, those who had previous managerial or business experience found that,
although the current course was a good starting point, they needed more in-depth courses.
The type of additional training required included marketing, accounting, and tax. It was
suggested that in order to avoid the need for extra courses, different levels of BEPs could be
offered to potential new business owners. These would cater for those with a business or
managerial backgrounds who wish to have a greater understanding of the principles behind
the business functions discussed, e.g. taxation, and those with none or only a rudimentary
business knowledge who feel that they can only deal with the basics. New business owners
also requested that, where sections of the course were run by external specialists, it would
be useful if they did not just discuss generalist issues but were able to discuss individual
problems. It was reported that although the course increased the general knowledge of new
business owners, it did not help in addressing the specific problems they faced in the
initialization of their own enterprise.
Chapter 2 Page 85
Information Technology (IT)
The discussion of IT on BEPs is extremely limited and was felt to be a major flaw of the
course. Many new business owners reported that they needed up-to-date IT skills to compete
effectively in the market place, with the emphasis on Internet and Web-site training. In
addition, new business owners request access to impartial advice on how and where they
could link-up to the Internet and related services. Manchester has its own web page which
could be utilized by service providers in IT training and could possibly be used to promote
new businesses in the North West. As this web page is available to potential customers’
worldwide, access to such a site could substantially increase the growth potential of those
businesses who wish to operate in the global market place.
Recruitment
The expansion of any new business is not only dependent on increasing demand but on
being able to meet that demand. The recruitment of suitable employees had proved to be a
significant barrier in the ability of new business owners to develop their enterprises. For
some, the problem lay directly in their inability to identify potential employees, reporting
that they just could not find suitable and willing employees. If such employees could be
located, problems arose in the training of such workers. New business owners, who were in
a position to take on new employees, were overworked and did not have the time to train
new workers. This situation was compounded by a lack of appropriate external training
courses. Consequently, the growth potential of many new micro and small businesses was
severely restricted. New micro and small business owners need access to recruitment advice,
as well as assistance in the training of new employees. If new business owners were
encouraged, through government support, to take on employees sooner than they would
have more time available to train them personally. This could be a scheme linked in with the
governments commitment to placing young people in employment. It could enable new
businesses to expand earlier, while providing job training and work experience for young
people. Whilst not problem free, this could be a starting point for new business growth.
Support and Advice Recommendations
Mentors
Many new micro and new business owners felt isolated, especially in times of crisis. They
Chapter 2 Page 86
felt that they had no one to turn to who had similar experience and who fully understood
their predicament. It was suggested that mentors would be one way to counteract this
situation by providing ongoing one-to-one support. Some said they would happily pay for
such a service, as it would save money in the long-term, and enable them to avoid the
pitfalls encountered by their mentor. A mentor in this situation would provide a very similar
function to an organizational mentor, protecting and guiding their charge through the
barriers and problems they themselves have previously experienced. If such a service could
be initiated, it could be perpetuated by those who use it, with recipients passing on their
knowledge to future new micro and small business owners.
Networking Groups
New micro and small business owners felt that it would be particularly useful to have
regular contact with other enterprise owners in similar business sectors to themselves. Such
groups would provide a forum for the discussion of problems and the sharing of both
positive and negative experiences. The availability of these groups could be promoted via a
service provider newsletter, the Internet and the local press.
Premises
Isolation was an issue for a number of new micro and small business owners, with working
alone at home the only option for those who could not afford or locate suitable premises.
The lack of new start-up premises was also recognized by service providers, a situation
which is particularly poor in the North West. Small, reasonably priced start-up premises
would provide new business owners with a place of work outside of the home environment.
This could be in the form of small individual work-stations within a larger open plan
environment, enabling new businesses to share services thereby reducing costs. In addition,
it would provide a supportive environment with others in a similar position and access to
extended business networks. The lack of suitable premises for small businesses in the North
West has served to restrict the growth of some new micro and small businesses. New
business owners experienced substantial difficulty in locating affordable premises that met
their requirements, and for some, the search ended in the decision to remain as they were. If
the growth and development of new micro and small businesses in the North West is to be
effectively encouraged, this situation needs to be addressed.
Chapter 2 Page 87
2.4 Research Gap
New micro and small businesses encounter many barriers to success and growth throughout
the start-up process and their first year of operation. These barriers, erected by government
agencies, financial institutions and large business organizations, are potentially life
threatening to new businesses, who are particularly vulnerable during the first twelve
months following their formation. New business owners also experience substantial
difficulties with employee recruitment, accessing appropriate training courses, and
competing in businesses environments which are becoming increasingly dependent on IT.
These problems are frequently compounded by a lack of access to business network and the
support they can offer in overcoming such barriers to survival and progression.
The recommendations proposed in this chapter would go some way towards improving the
survival and growth rates of new micro and small businesses in the North West. However,
findings presented in this report are just the first step in providing a contribution to our
understanding of the experiences of new micro and small business owners during the
initialization and formation of a new enterprise. The early stages of new business formation
may be a critical period, in which the subsequent level of success and development of an
enterprise is determined. If the impact of the barriers encountered in the first year of
operation, in relation to the survival and growth of new micro and small businesses are to be
fully understood, further longitudinal in-depth study is necessary.
Chapter 3 Page 88
Chapter – 3
Research Methodology
Chapter contents:
3.1 Introduction
3.2 Problem Identification
3.3 Objectives of the Study
3.4 Scope of the Study
3.5 Rational of the study
3.6 Sampling
3.7 Sources and Collections of Data
3.8 Methodology
3.9 Hypothesis
3.10 Further scope of the study
3.11 Limitations of the study
Chapter 3 Page 89
3.1 Introduction:
Micro, Small and Medium Enterprises play a vital role in the industrial development of
any country. Importance of the MSME sector is well documented world over as it makes
significant contributions in gratifying various socio-economic objectives such as growth in
employment, output, promotion of exports and entrepreneurship. In spite of contributing a
lot in the growth of economies, MSMEs across the globe are plagued with generic issues
like lack of skilled labour, technical support and infrastructure problems. Among all other
issues, one of the most important issues is unavailability of finance from formal sources.
Unavailability of proper and adequate finance in time from formal sources, creates lots of
issues for the entrepreneurs. Indian entrepreneurs facing this problem in large extent.
Relevance
This research reports the results of a study aimed at identifying the types of financial and
banking products/services that small businesses need and value the most. The study also
examines aspects of quality and manners of service delivery that small business
establishments consider as important and expect to be provided by their banks. Finally, it
compares small business owners'/managers' views regarding overall quality of services of
community/local banks vis-a-vis that of their non-local counterparts.
3.2 Problem Identification:
After careful investigation of literature, researcher found that there is lack of research in
bank finance to entrepreneurs especially in the Gujarat. Various researchers have found the
different aspects of financing gap. But among all, the bank finance is considered as the
primary source of finance and there is urgent need to analyses the reasons of unavailability
of bank finance to the entrepreneurs. By considering this aspect, researcher has finalized
the title as under:
Critical Evaluation of Financial Services Provided for Marginal Entrepreneurs by
Selected Banks in Gujarat
Chapter 3 Page 90
3.3 Objectives of the Study:
By considering the importance of bank finance to entrepreneurs, following main objectives
are set:
To examine and analyze the status of bank finance to entrepreneurs against the set
benchmark under policy guidelines.
To identify major issues in bank financing - from demand side constraints and supply
side constraints.
To analyze responses sought from entrepreneurs and bank officials in regard to the
problems being faced and related issues in bank finance and ascertain viability of
measures suggested by them to overcome from the constraints.
To take stock of extant policy framework and various provisions for financing to
entrepreneurs and review them in the light of observations of the study.
To analyze primary and secondary data for observations and to offer recommendations
to enhance accessibility of bank finance to entrepreneurs.
3.4 Scope of the Study:
This study is based on the availability of bank finance to entrepreneurs of the Gujarat state
from selected banks. Thus the scope of the study is limited to the entrepreneurs who
belong to Small and Medium Enterprises [SMEs] situated at Gujarat state only. Further,
the need of bank finance is accessed on the basis of their efforts of last three years. It can
be summarized that the study contains the limited scope of bank finance to SMEs of
Gujarat state from selected banks.
3.5 Rational of the Study:
This study aims to provide an assessment of the bank finance availability to entrepreneurs
in Gujarat state. The chapters in this research highlight the detailed analysis on the base of
data collected from entrepreneurs and bank managers. IT shows the demand and supply
side constraints of availability of bank finance. The study evaluates the consequent gap in
the financing needs of entrepreneurs. So the study explores potential interventions to
address the lack of access to bank finance for entrepreneurs. Given the interdependence
between banks and small businesses, and the importance that small businesses have to both
local and national economies in terms of job creation and economic development

Chapter 3 Page 91
stimulation, it is imperative for banks to better understand the nature of financial and
banking needs and priorities of
this segment of their market. It is in pursuit of this objective that the present study was
designed.
Specifically, the purpose of this research is to report the results of a study designed:
(a) to assess and identify the types of financial and banking products/services (e.g.,
depository services, merchant accounts, loan products, etc.) that small businesses need and
value the most, and
(b) to identify the aspects of quality and manner of service delivery (e.g., personal
attention, knowledge of business, timely response, etc.) that small businesses consider as
important and expect to be afforded by their banks.
The study also will compare small business owners'/managers' perceptions regarding the
overall quality of bank services relative to locally owned and managed banks versus non-
local financial institutions.
Finally, a there will be comparison of the overall quality of service between community
banks and non-community banks, as perceived by their respective small business clients,
will be showed in a statistically significant difference.
The results of this study will help banks better understand the true banking and financial
needs of entrepreneurs and small firms. This should assist them to more effectively serve
and meet the needs and concerns of this important segment of their banking market.
Further, the study results provide financial institutions with the ammunition they need to
better assess their own strategic strengths and weaknesses, identify positioning gaps in
their commercial markets, and seek and secure a stronger competitive position vis-a-vis
their rivals in those markets.
Finally, the results indicate that while small firms define quality of banking services in
more or less similar terms, their product/service needs are divergent and tend to be a
function of the structural and idiosyncratic differences in their industries/operations.
The related information of this study could go a long way in helping banks and financial
institutions to not only do a more effective job of segmenting their small business market,
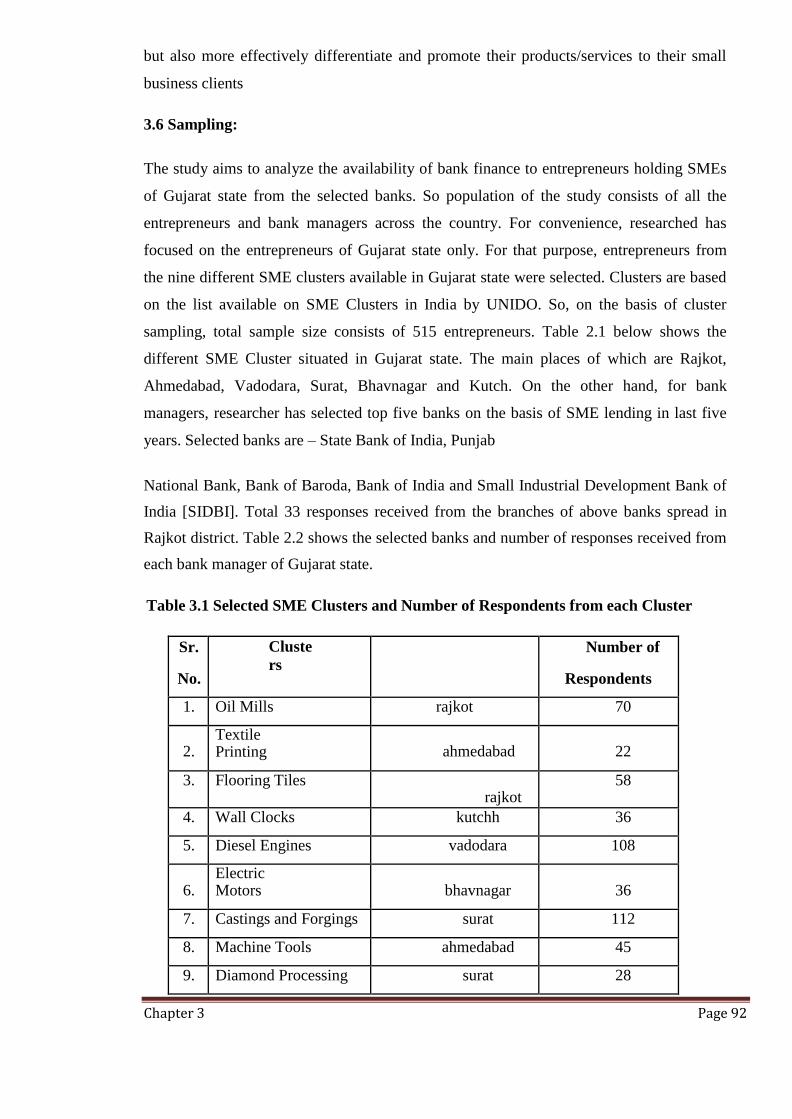
Chapter 3 Page 92
but also more effectively differentiate and promote their products/services to their small
business clients
3.6 Sampling:
The study aims to analyze the availability of bank finance to entrepreneurs holding SMEs
of Gujarat state from the selected banks. So population of the study consists of all the
entrepreneurs and bank managers across the country. For convenience, researched has
focused on the entrepreneurs of Gujarat state only. For that purpose, entrepreneurs from
the nine different SME clusters available in Gujarat state were selected. Clusters are based
on the list available on SME Clusters in India by UNIDO. So, on the basis of cluster
sampling, total sample size consists of 515 entrepreneurs. Table 2.1 below shows the
different SME Cluster situated in Gujarat state. The main places of which are Rajkot,
Ahmedabad, Vadodara, Surat, Bhavnagar and Kutch. On the other hand, for bank
managers, researcher has selected top five banks on the basis of SME lending in last five
years. Selected banks are – State Bank of India, Punjab
National Bank, Bank of Baroda, Bank of India and Small Industrial Development Bank of
India [SIDBI]. Total 33 responses received from the branches of above banks spread in
Rajkot district. Table 2.2 shows the selected banks and number of responses received from
each bank manager of Gujarat state.
Table 3.1 Selected SME Clusters and Number of Respondents from each Cluster
Sr.
No.
Cluste
rs
Number of
Respondents
1. Oil Mills rajkot 70
2. Textile Printing
ahmedabad
22
3. Flooring Tiles
rajkot 58
4. Wall Clocks kutchh 36
5. Diesel Engines vadodara 108
6. Electric Motors
bhavnagar
36
7. Castings and Forgings surat 112
8. Machine Tools ahmedabad 45
9. Diamond Processing surat 28
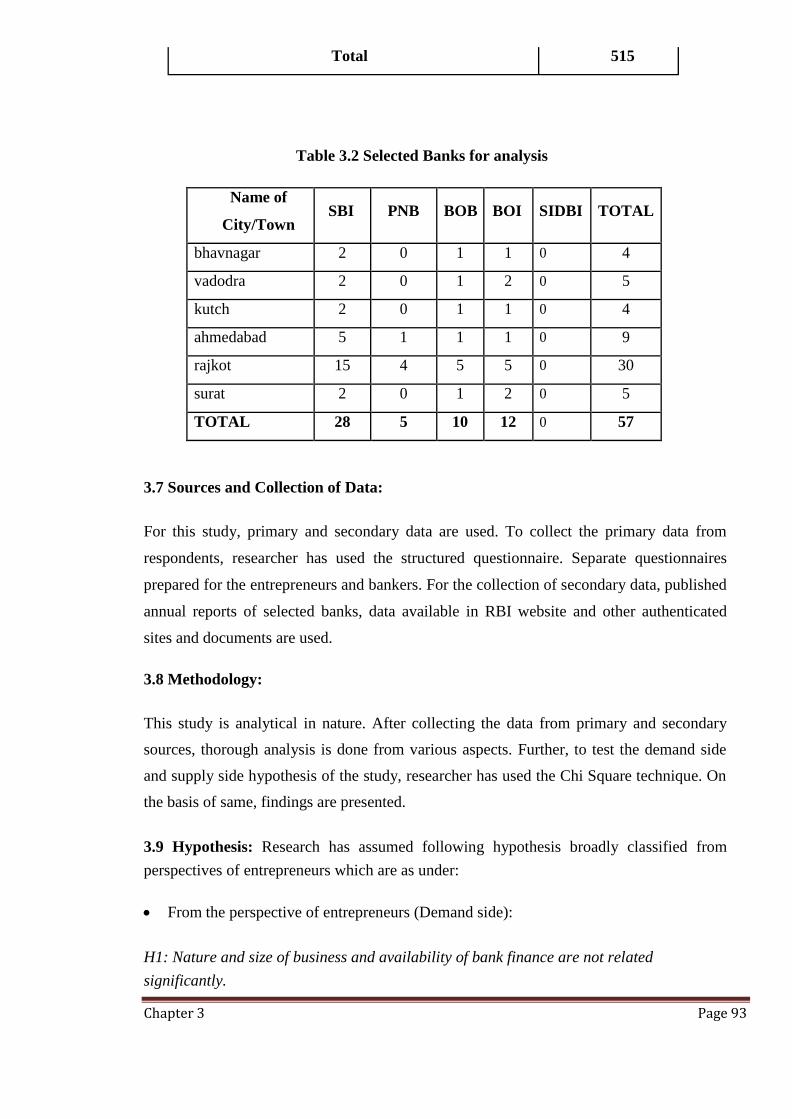
Chapter 3 Page 93
Table 3.2 Selected Banks for analysis
Name of
City/Town SBI PNB BOB BOI SIDBI TOTAL
bhavnagar 2 0 1 1 0 4
vadodra 2 0 1 2 0 5
kutch 2 0 1 1 0 4
ahmedabad 5 1 1 1 0 9
rajkot 15 4 5 5 0 30
surat 2 0 1 2 0 5
TOTAL 28 5 10 12 0 57
3.7 Sources and Collection of Data:
For this study, primary and secondary data are used. To collect the primary data from
respondents, researcher has used the structured questionnaire. Separate questionnaires
prepared for the entrepreneurs and bankers. For the collection of secondary data, published
annual reports of selected banks, data available in RBI website and other authenticated
sites and documents are used.
3.8 Methodology:
This study is analytical in nature. After collecting the data from primary and secondary
sources, thorough analysis is done from various aspects. Further, to test the demand side
and supply side hypothesis of the study, researcher has used the Chi Square technique. On
the basis of same, findings are presented.
3.9 Hypothesis: Research has assumed following hypothesis broadly classified from
perspectives of entrepreneurs which are as under:
From the perspective of entrepreneurs (Demand side):
H1: Nature and size of business and availability of bank finance are not related
significantly.
Total 515
Chapter 3 Page 94
H2: Gender, educational qualification and experience level of entrepreneur and
availability of bank finance are not related significantly.
H3: Location and cluster of business and availability of bank finance are not related
significantly.
H4: Perception regarding financing process and availability of bank finance are not
related significantly.
From the perspective of bankers (Supply side):
H1: Small ticket size and high transaction cost and availability of bank finance are not
related significantly.
H2: Generation of the entrepreneur and availability of bank finance are not related
significantly.
H3: Credit rating of the enterprise and availability of bank finance are not related
significantly.
H4: Marketing efforts and product branding and availability of bank finance are not
related significantly.
3.10 Further Scope of the Study:
Present study is limited to access of bank finance to entrepreneurs of Gujarat state only. So
findings present very limited scope. To expand the scope of study, a huge sample size with
expanded geographical area is required and even more banks should be included to know
the supply side constraints. Even further analysis of the study is possible through more
scientific statistical tools and techniques.
3.11 Limitations of the study:
The study attempts to capture the current status of availability of bank finance to the
entrepreneurs of Gujarat state from selected banks. Following are the major limitations of
the study:
This research has been carried out on the basis of primary as well as secondary data,
which have inherent limitation.
Chapter 3 Page 95
While administering the questionnaires, sometimes it happens that respondents either
hesitate to respond questions or do not get enough time to interact and provide
distorted data that fail to draw realistic findings.
Poor responses from certain clusters and respondents as compared to others are also
one of the constraints.
However, sincere efforts have been made to attain objectives of the research without adverse impact of limitations on overall assessment of the hypothesis.
[Type text] Page 96
Chapter - 4
Data Analysis
Chapter contents:
4.1 Introduction
4.2 Analysis of data for entrepreneurs
4.3 Analysis of data for bank mandgers
4.4 Interpretation of Data
4.5 Testing of Hypothesis
4.6 Summary
Chapter 4 Page 97
4.1 Introduction:
Accessibility of sufficient and in time finance is the vital issue for any type of business
organization. Especially for entrepreneurs who belongs to first generation, finance plays the
important role for them.
Bank finance being one of the important source of finance for them, the same has been
selected for this study. In this study, total nine clusters have been selected belongs to
Gujarat. Gujarat considered as an industrial hub and contributed a lot in industrial sector
especially with the help of marginal entrepreneurs.
To collect the data from selected enterprises, a structured questionnaire has been developed.
Analysis of primary data begins with the data collected from the selected enterprises in form
of questionnaire.
4.2 Analysis of Questionnaire for Entrepreneurs:
After reviewing the available literature and after prudently examination for the selected
problem, a questionnaire has been formed to collect and assemble the required data from the
enterprises.
Questionnaire is divided in six categories to make the process of analysis easy. The six
categories are;
• Information about Enterprise.
• Information about Respondent.
• Information about Banker.
• Information about Investment and Borrowing.
• Past Experience of Bank Loan.
• Problems in Obtaining Bank Loan and their Reasons.
• All these categories have been analyzed separately as under.
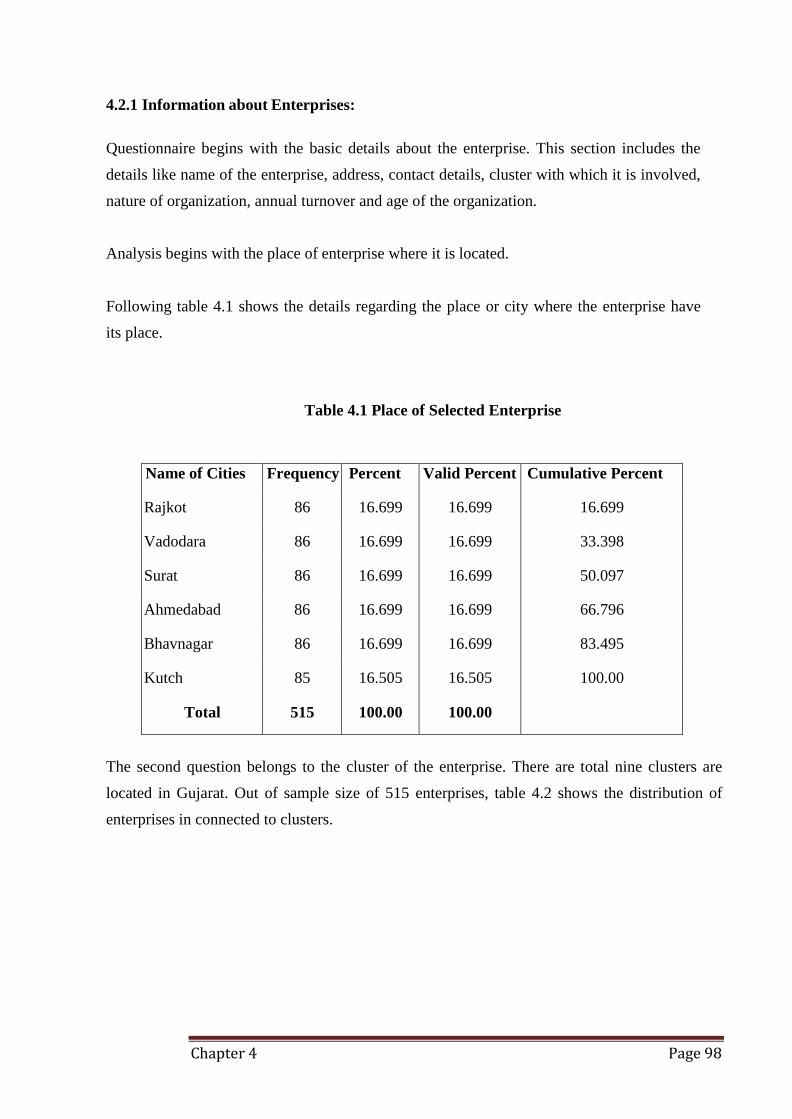
Chapter 4 Page 98
4.2.1 Information about Enterprises:
Questionnaire begins with the basic details about the enterprise. This section includes the
details like name of the enterprise, address, contact details, cluster with which it is involved,
nature of organization, annual turnover and age of the organization.
Analysis begins with the place of enterprise where it is located.
Following table 4.1 shows the details regarding the place or city where the enterprise have
its place.
Table 4.1 Place of Selected Enterprise
Name of Cities Frequency Percent Valid Percent Cumulative Percent
Rajkot 86 16.699 16.699 16.699
Vadodara 86 16.699 16.699 33.398
Surat 86 16.699 16.699 50.097
Ahmedabad 86 16.699 16.699 66.796
Bhavnagar 86 16.699 16.699 83.495
Kutch 85 16.505 16.505 100.00
Total 515 100.00 100.00
The second question belongs to the cluster of the enterprise. There are total nine clusters are
located in Gujarat. Out of sample size of 515 enterprises, table 4.2 shows the distribution of
enterprises in connected to clusters.
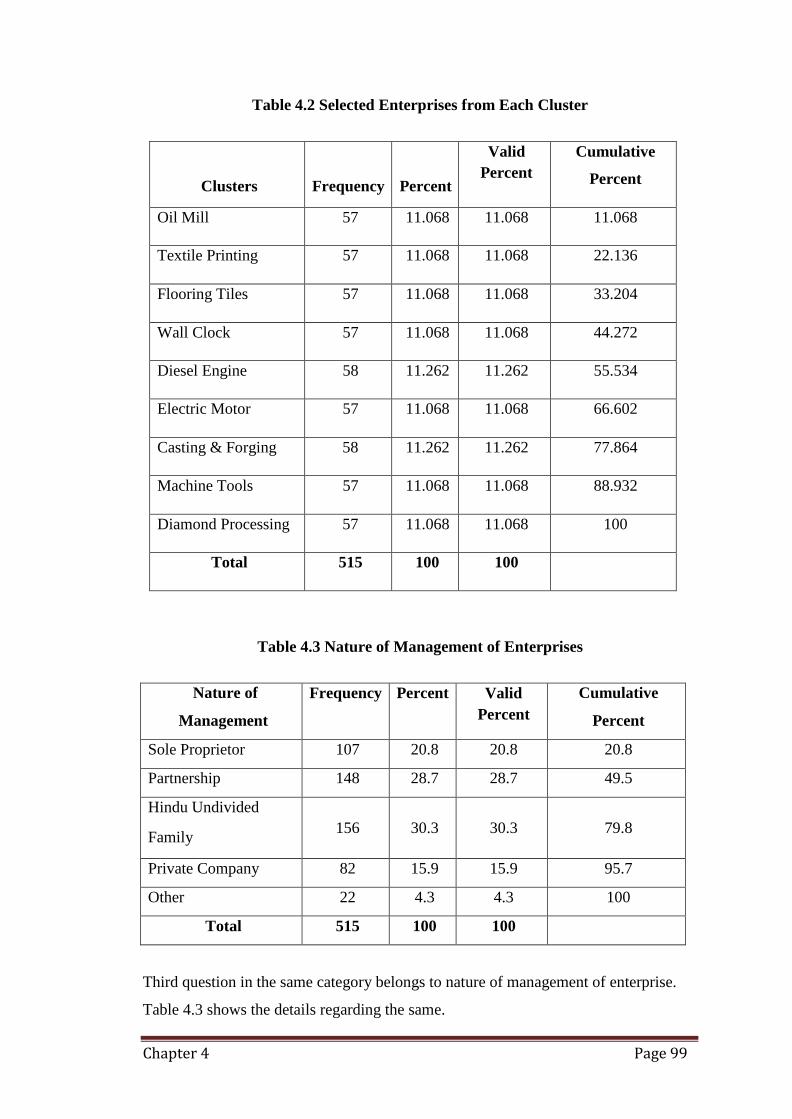
Chapter 4 Page 99
Table 4.2 Selected Enterprises from Each Cluster
Clusters
Frequency
Percent
Valid
Percent
Cumulative
Percent
Oil Mill 57 11.068 11.068 11.068
Textile Printing 57 11.068 11.068 22.136
Flooring Tiles 57 11.068 11.068 33.204
Wall Clock 57 11.068 11.068 44.272
Diesel Engine 58 11.262 11.262 55.534
Electric Motor 57 11.068 11.068 66.602
Casting & Forging 58 11.262 11.262 77.864
Machine Tools 57 11.068 11.068 88.932
Diamond Processing 57 11.068 11.068 100
Total 515 100 100
Table 4.3 Nature of Management of Enterprises
Nature of
Management
Frequency Percent Valid
Percent
Cumulative
Percent
Sole Proprietor 107 20.8 20.8 20.8
Partnership 148 28.7 28.7 49.5
Hindu Undivided
Family
156
30.3
30.3
79.8
Private Company 82 15.9 15.9 95.7
Other 22 4.3 4.3 100
Total 515 100 100
Third question in the same category belongs to nature of management of enterprise.
Table 4.3 shows the details regarding the same.
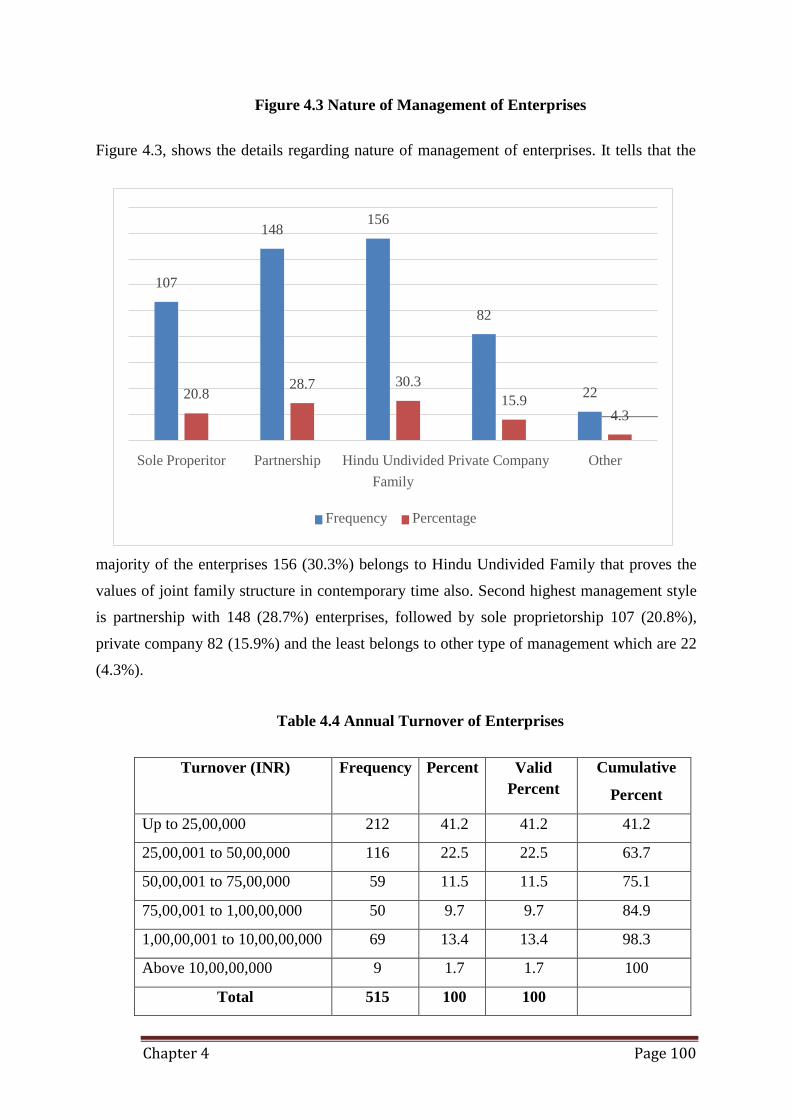
Chapter 4 Page 100
148 156
107
82
20.8 28.7 30.3
15.9 22
4.3
Sole Properitor Partnership Hindu Undivided Private Company
Family
Other
Frequency Percentage
Figure 4.3 Nature of Management of Enterprises
Figure 4.3, shows the details regarding nature of management of enterprises. It tells that the
majority of the enterprises 156 (30.3%) belongs to Hindu Undivided Family that proves the
values of joint family structure in contemporary time also. Second highest management style
is partnership with 148 (28.7%) enterprises, followed by sole proprietorship 107 (20.8%),
private company 82 (15.9%) and the least belongs to other type of management which are 22
(4.3%).
Table 4.4 Annual Turnover of Enterprises
Turnover (INR) Frequency Percent Valid
Percent
Cumulative
Percent
Up to 25,00,000 212 41.2 41.2 41.2
25,00,001 to 50,00,000 116 22.5 22.5 63.7
50,00,001 to 75,00,000 59 11.5 11.5 75.1
75,00,001 to 1,00,00,000 50 9.7 9.7 84.9
1,00,00,001 to 10,00,00,000 69 13.4 13.4 98.3
Above 10,00,00,000 9 1.7 1.7 100
Total 515 100 100
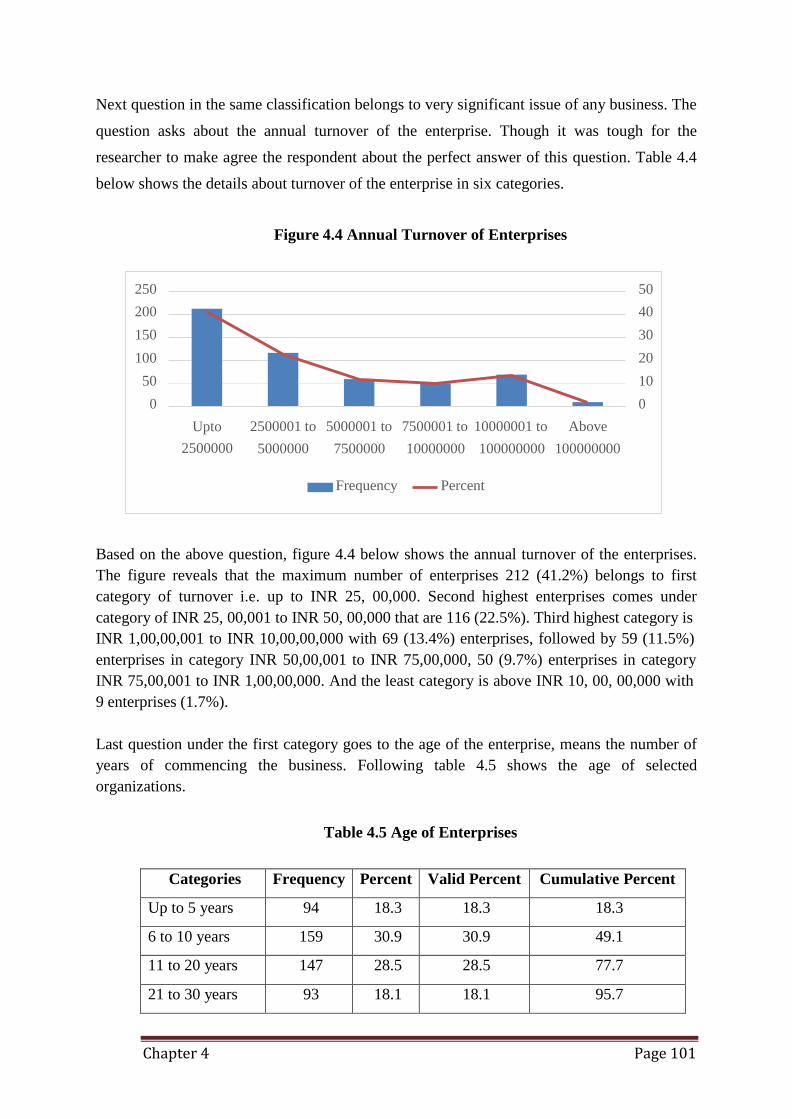
Chapter 4 Page 101
250
200
150
100
50
0
50
40
30
20
10
0
Upto
2500000
2500001 to 5000001 to 7500001 to 10000001 to Above
5000000 7500000 10000000 100000000 100000000
Frequency Percent
Next question in the same classification belongs to very significant issue of any business. The
question asks about the annual turnover of the enterprise. Though it was tough for the
researcher to make agree the respondent about the perfect answer of this question. Table 4.4
below shows the details about turnover of the enterprise in six categories.
Figure 4.4 Annual Turnover of Enterprises
Based on the above question, figure 4.4 below shows the annual turnover of the enterprises.
The figure reveals that the maximum number of enterprises 212 (41.2%) belongs to first
category of turnover i.e. up to INR 25, 00,000. Second highest enterprises comes under
category of INR 25, 00,001 to INR 50, 00,000 that are 116 (22.5%). Third highest category is
INR 1,00,00,001 to INR 10,00,00,000 with 69 (13.4%) enterprises, followed by 59 (11.5%)
enterprises in category INR 50,00,001 to INR 75,00,000, 50 (9.7%) enterprises in category
INR 75,00,001 to INR 1,00,00,000. And the least category is above INR 10, 00, 00,000 with
9 enterprises (1.7%).
Last question under the first category goes to the age of the enterprise, means the number of
years of commencing the business. Following table 4.5 shows the age of selected
organizations.
Table 4.5 Age of Enterprises
Categories Frequency Percent Valid Percent Cumulative Percent
Up to 5 years 94 18.3 18.3 18.3
6 to 10 years 159 30.9 30.9 49.1
11 to 20 years 147 28.5 28.5 77.7
21 to 30 years 93 18.1 18.1 95.7
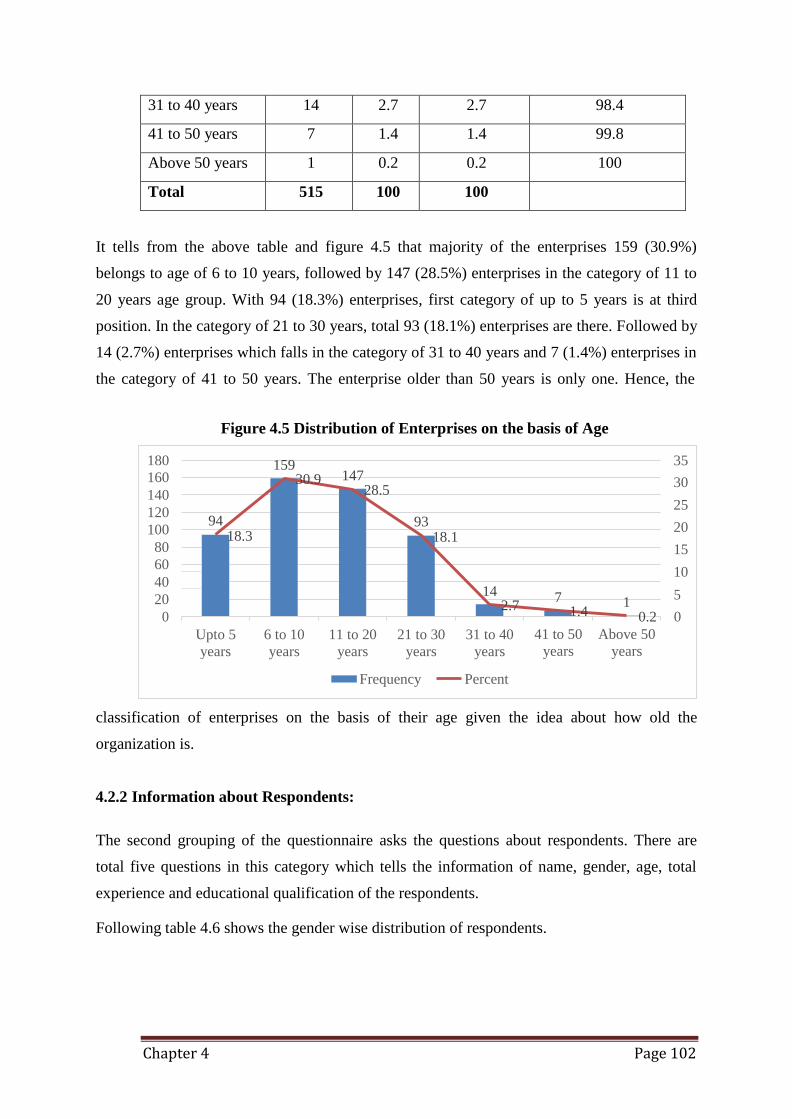
Chapter 4 Page 102
180
160
140
120
100
80
60
40
20
0
159 30.9 147
28.5
94 18.3
93 18.1
35
30
25
20
15
10
14 2.7
7 1.4
1 5
0.2 0
Upto 5
years
6 to 10 11 to 20 21 to 30
years years years
Frequency
31 to 40
years
Percent
41 to 50 Above 50
years years
31 to 40 years 14 2.7 2.7 98.4
41 to 50 years 7 1.4 1.4 99.8
Above 50 years 1 0.2 0.2 100
Total 515 100 100
It tells from the above table and figure 4.5 that majority of the enterprises 159 (30.9%)
belongs to age of 6 to 10 years, followed by 147 (28.5%) enterprises in the category of 11 to
20 years age group. With 94 (18.3%) enterprises, first category of up to 5 years is at third
position. In the category of 21 to 30 years, total 93 (18.1%) enterprises are there. Followed by
14 (2.7%) enterprises which falls in the category of 31 to 40 years and 7 (1.4%) enterprises in
the category of 41 to 50 years. The enterprise older than 50 years is only one. Hence, the
Figure 4.5 Distribution of Enterprises on the basis of Age
classification of enterprises on the basis of their age given the idea about how old the
organization is.
4.2.2 Information about Respondents:
The second grouping of the questionnaire asks the questions about respondents. There are
total five questions in this category which tells the information of name, gender, age, total
experience and educational qualification of the respondents.
Following table 4.6 shows the gender wise distribution of respondents.
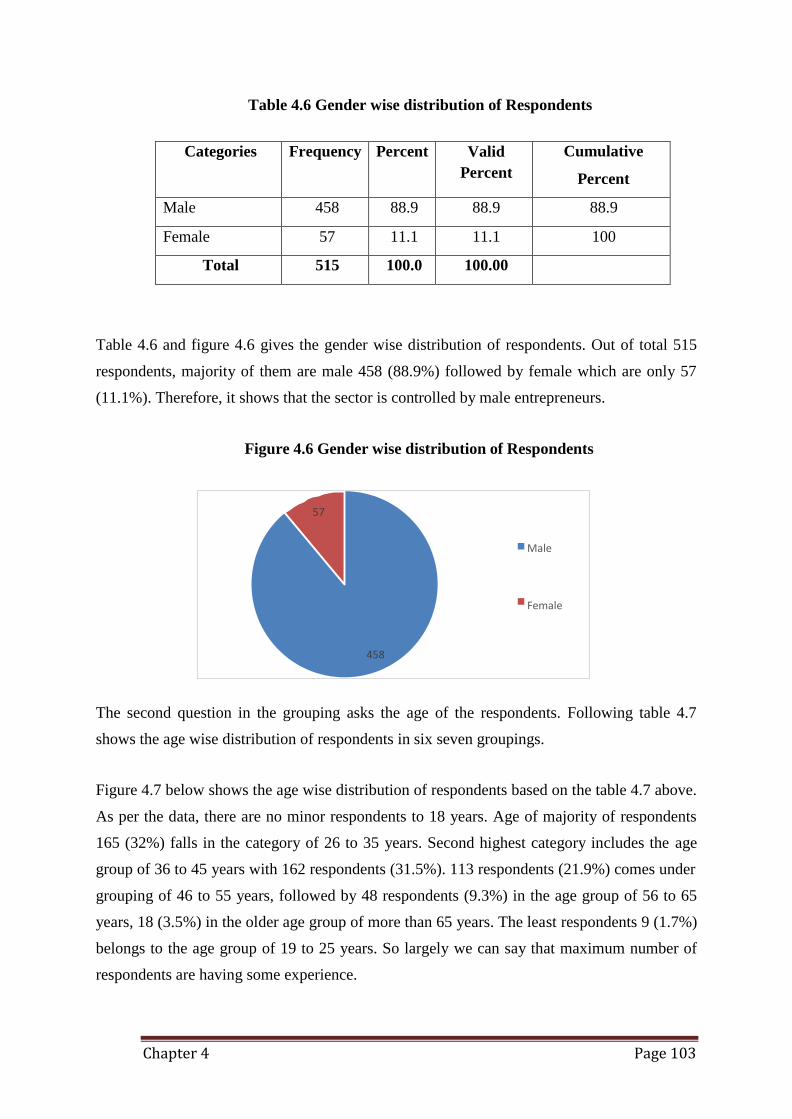
Chapter 4 Page 103
57
Male
Female
458
Table 4.6 Gender wise distribution of Respondents
Categories Frequency Percent Valid
Percent
Cumulative
Percent
Male 458 88.9 88.9 88.9
Female 57 11.1 11.1 100
Total 515 100.0 100.00
Table 4.6 and figure 4.6 gives the gender wise distribution of respondents. Out of total 515
respondents, majority of them are male 458 (88.9%) followed by female which are only 57
(11.1%). Therefore, it shows that the sector is controlled by male entrepreneurs.
Figure 4.6 Gender wise distribution of Respondents
The second question in the grouping asks the age of the respondents. Following table 4.7
shows the age wise distribution of respondents in six seven groupings.
Figure 4.7 below shows the age wise distribution of respondents based on the table 4.7 above.
As per the data, there are no minor respondents to 18 years. Age of majority of respondents
165 (32%) falls in the category of 26 to 35 years. Second highest category includes the age
group of 36 to 45 years with 162 respondents (31.5%). 113 respondents (21.9%) comes under
grouping of 46 to 55 years, followed by 48 respondents (9.3%) in the age group of 56 to 65
years, 18 (3.5%) in the older age group of more than 65 years. The least respondents 9 (1.7%)
belongs to the age group of 19 to 25 years. So largely we can say that maximum number of
respondents are having some experience.
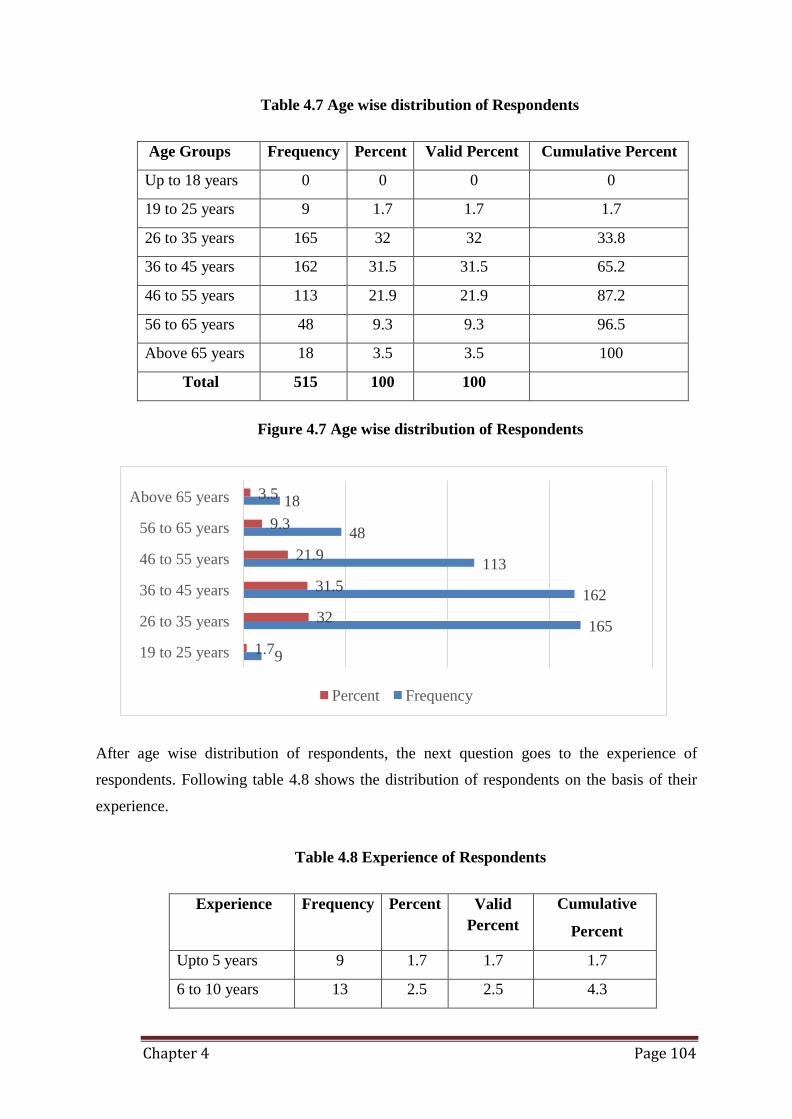
Chapter 4 Page 104
Above 65 years
56 to 65 years
46 to 55 years
36 to 45 years
26 to 35 years
19 to 25 years
3.5 18
9.3
21.9
31.5
32
1.79
48
113
162
165
Percent Frequency
Table 4.7 Age wise distribution of Respondents
Age Groups Frequency Percent Valid Percent Cumulative Percent
Up to 18 years 0 0 0 0
19 to 25 years 9 1.7 1.7 1.7
26 to 35 years 165 32 32 33.8
36 to 45 years 162 31.5 31.5 65.2
46 to 55 years 113 21.9 21.9 87.2
56 to 65 years 48 9.3 9.3 96.5
Above 65 years 18 3.5 3.5 100
Total 515 100 100
Figure 4.7 Age wise distribution of Respondents
After age wise distribution of respondents, the next question goes to the experience of
respondents. Following table 4.8 shows the distribution of respondents on the basis of their
experience.
Table 4.8 Experience of Respondents
Experience Frequency Percent Valid
Percent
Cumulative
Percent
Upto 5 years 9 1.7 1.7 1.7
6 to 10 years 13 2.5 2.5 4.3
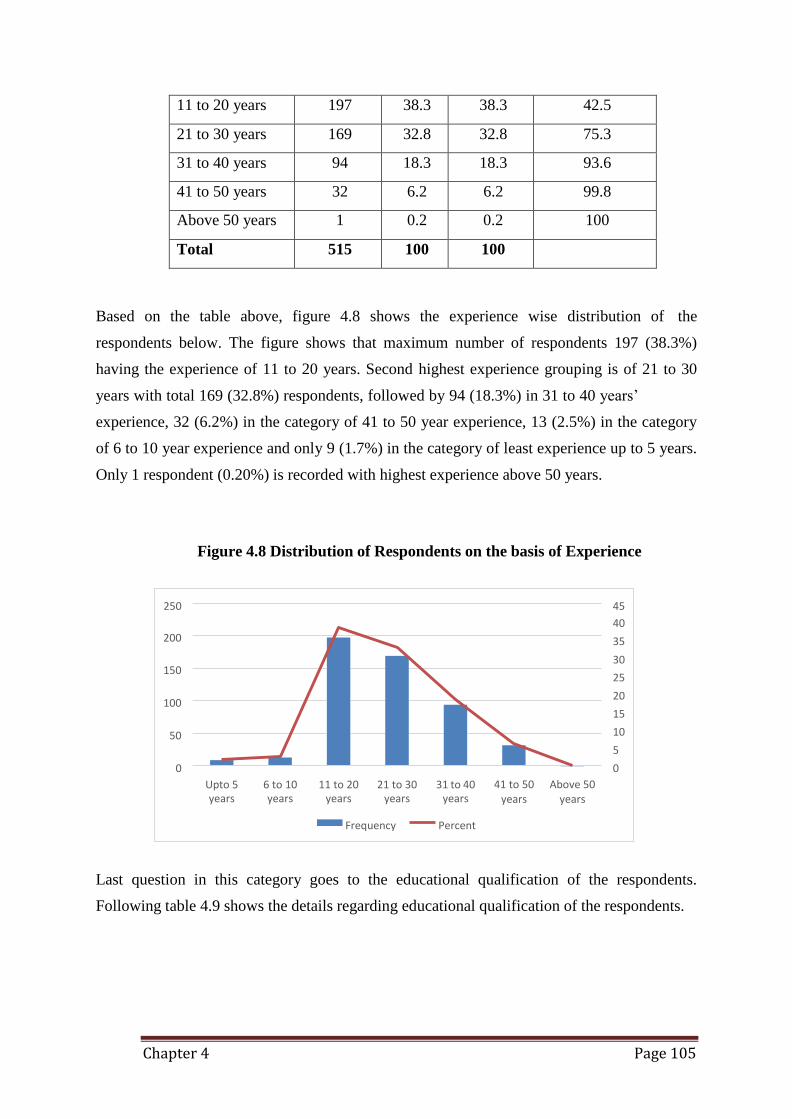
Chapter 4 Page 105
250
200
150
100
50
0
45
40
35
30
25
20
15
10
5
0
Upto 5 6 to 10 11 to 20 21 to 30 years years years years
31 to 40 years
41 to 50 Above 50 years years
Frequency Percent
11 to 20 years 197 38.3 38.3 42.5
21 to 30 years 169 32.8 32.8 75.3
31 to 40 years 94 18.3 18.3 93.6
41 to 50 years 32 6.2 6.2 99.8
Above 50 years 1 0.2 0.2 100
Total 515 100 100
Based on the table above, figure 4.8 shows the experience wise distribution of the
respondents below. The figure shows that maximum number of respondents 197 (38.3%)
having the experience of 11 to 20 years. Second highest experience grouping is of 21 to 30
years with total 169 (32.8%) respondents, followed by 94 (18.3%) in 31 to 40 years’
experience, 32 (6.2%) in the category of 41 to 50 year experience, 13 (2.5%) in the category
of 6 to 10 year experience and only 9 (1.7%) in the category of least experience up to 5 years.
Only 1 respondent (0.20%) is recorded with highest experience above 50 years.
Figure 4.8 Distribution of Respondents on the basis of Experience
Last question in this category goes to the educational qualification of the respondents.
Following table 4.9 shows the details regarding educational qualification of the respondents.
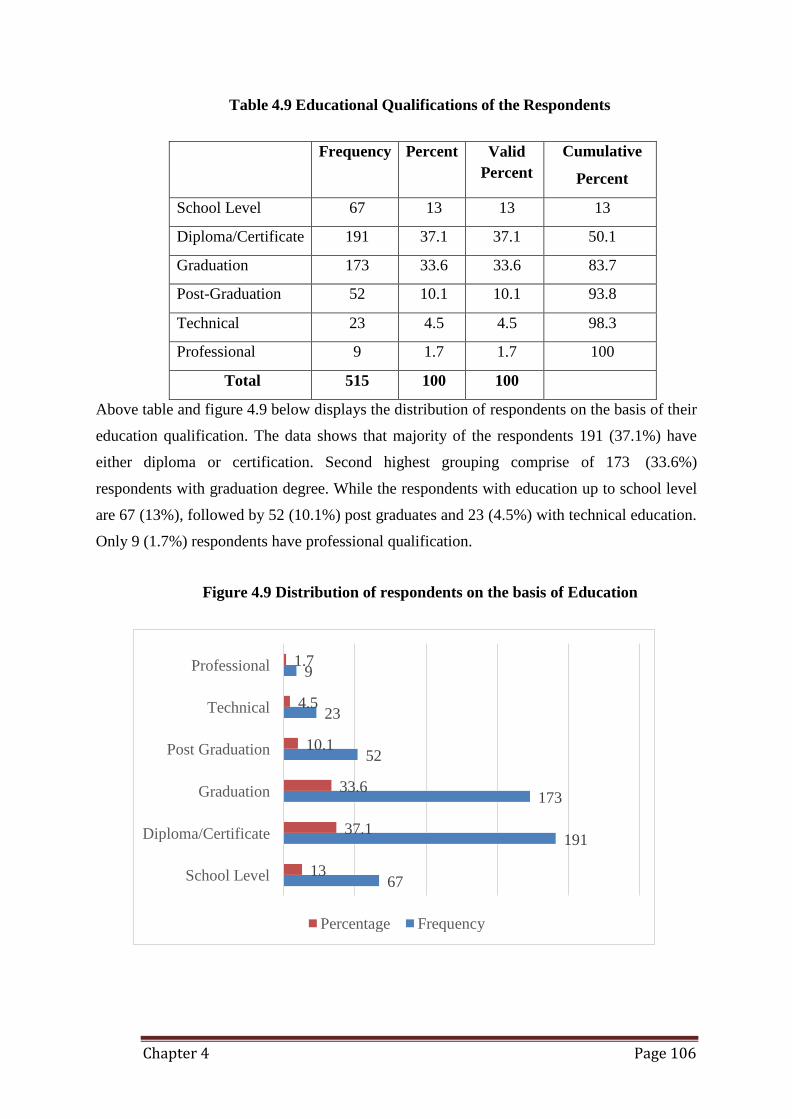
Chapter 4 Page 106
Professional 1.7
Technical
9
4.5 23
Post Graduation 10.1 52
Graduation 33.6 173
Diploma/Certificate 37.1 191
School Level 13 67
Percentage Frequency
Table 4.9 Educational Qualifications of the Respondents
Frequency Percent Valid
Percent
Cumulative
Percent
School Level 67 13 13 13
Diploma/Certificate 191 37.1 37.1 50.1
Graduation 173 33.6 33.6 83.7
Post-Graduation 52 10.1 10.1 93.8
Technical 23 4.5 4.5 98.3
Professional 9 1.7 1.7 100
Total 515 100 100
Above table and figure 4.9 below displays the distribution of respondents on the basis of their
education qualification. The data shows that majority of the respondents 191 (37.1%) have
either diploma or certification. Second highest grouping comprise of 173 (33.6%)
respondents with graduation degree. While the respondents with education up to school level
are 67 (13%), followed by 52 (10.1%) post graduates and 23 (4.5%) with technical education.
Only 9 (1.7%) respondents have professional qualification.
Figure 4.9 Distribution of respondents on the basis of Education
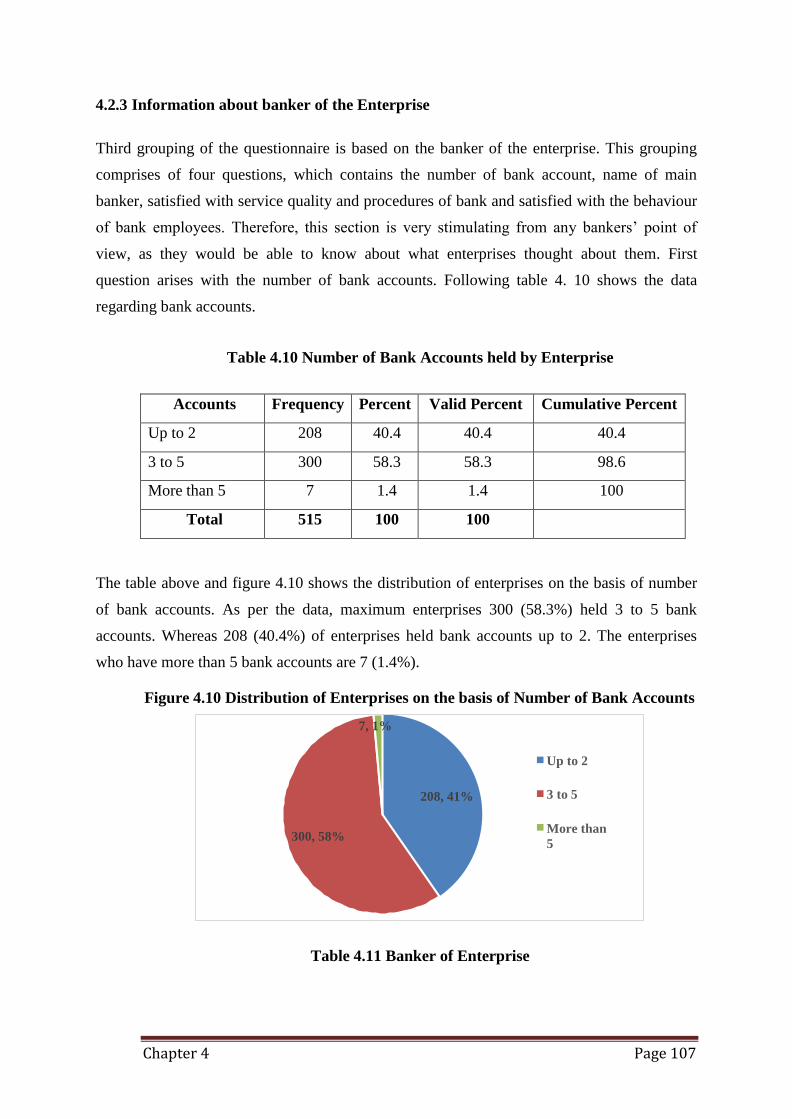
Chapter 4 Page 107
7, 1%
Up to 2
208, 41% 3 to 5
300, 58% More than
5
4.2.3 Information about banker of the Enterprise
Third grouping of the questionnaire is based on the banker of the enterprise. This grouping
comprises of four questions, which contains the number of bank account, name of main
banker, satisfied with service quality and procedures of bank and satisfied with the behaviour
of bank employees. Therefore, this section is very stimulating from any bankers’ point of
view, as they would be able to know about what enterprises thought about them. First
question arises with the number of bank accounts. Following table 4. 10 shows the data
regarding bank accounts.
Table 4.10 Number of Bank Accounts held by Enterprise
Accounts Frequency Percent Valid Percent Cumulative Percent
Up to 2 208 40.4 40.4 40.4
3 to 5 300 58.3 58.3 98.6
More than 5 7 1.4 1.4 100
Total 515 100 100
The table above and figure 4.10 shows the distribution of enterprises on the basis of number
of bank accounts. As per the data, maximum enterprises 300 (58.3%) held 3 to 5 bank
accounts. Whereas 208 (40.4%) of enterprises held bank accounts up to 2. The enterprises
who have more than 5 bank accounts are 7 (1.4%).
Figure 4.10 Distribution of Enterprises on the basis of Number of Bank Accounts
Table 4.11 Banker of Enterprise
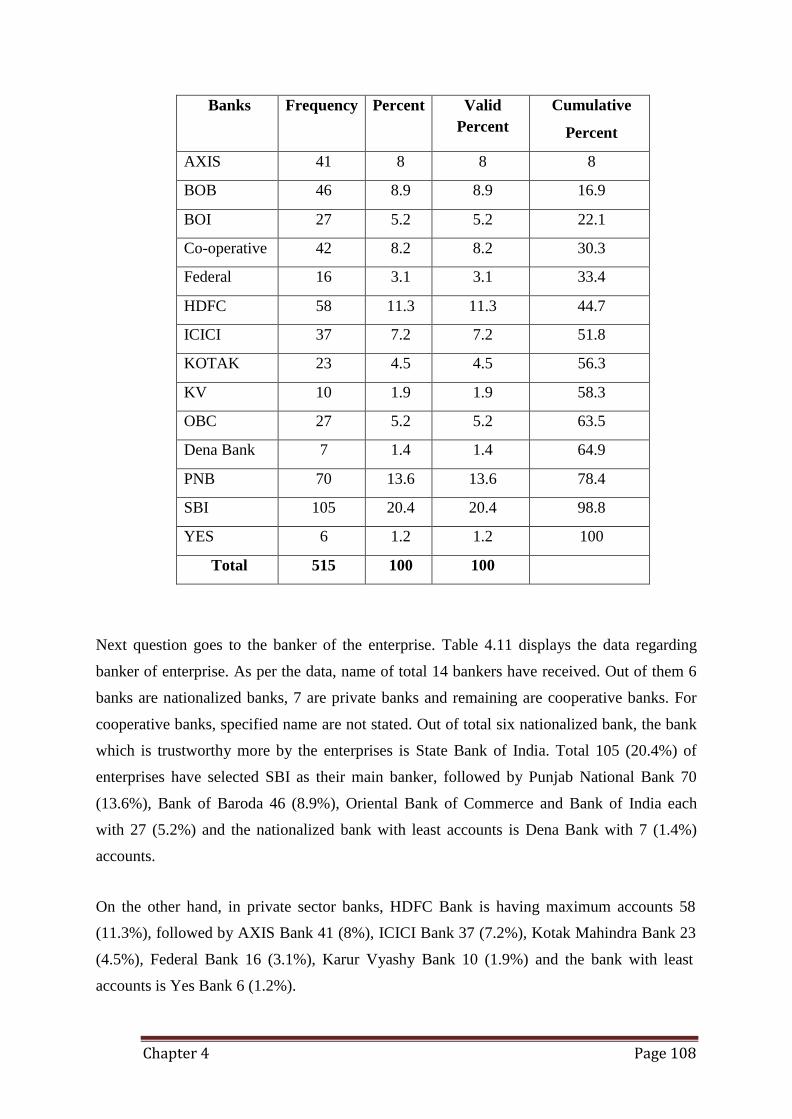
Chapter 4 Page 108
Banks Frequency Percent Valid
Percent
Cumulative
Percent
AXIS 41 8 8 8
BOB 46 8.9 8.9 16.9
BOI 27 5.2 5.2 22.1
Co-operative 42 8.2 8.2 30.3
Federal 16 3.1 3.1 33.4
HDFC 58 11.3 11.3 44.7
ICICI 37 7.2 7.2 51.8
KOTAK 23 4.5 4.5 56.3
KV 10 1.9 1.9 58.3
OBC 27 5.2 5.2 63.5
Dena Bank 7 1.4 1.4 64.9
PNB 70 13.6 13.6 78.4
SBI 105 20.4 20.4 98.8
YES 6 1.2 1.2 100
Total 515 100 100
Next question goes to the banker of the enterprise. Table 4.11 displays the data regarding
banker of enterprise. As per the data, name of total 14 bankers have received. Out of them 6
banks are nationalized banks, 7 are private banks and remaining are cooperative banks. For
cooperative banks, specified name are not stated. Out of total six nationalized bank, the bank
which is trustworthy more by the enterprises is State Bank of India. Total 105 (20.4%) of
enterprises have selected SBI as their main banker, followed by Punjab National Bank 70
(13.6%), Bank of Baroda 46 (8.9%), Oriental Bank of Commerce and Bank of India each
with 27 (5.2%) and the nationalized bank with least accounts is Dena Bank with 7 (1.4%)
accounts.
On the other hand, in private sector banks, HDFC Bank is having maximum accounts 58
(11.3%), followed by AXIS Bank 41 (8%), ICICI Bank 37 (7.2%), Kotak Mahindra Bank 23
(4.5%), Federal Bank 16 (3.1%), Karur Vyashy Bank 10 (1.9%) and the bank with least
accounts is Yes Bank 6 (1.2%).
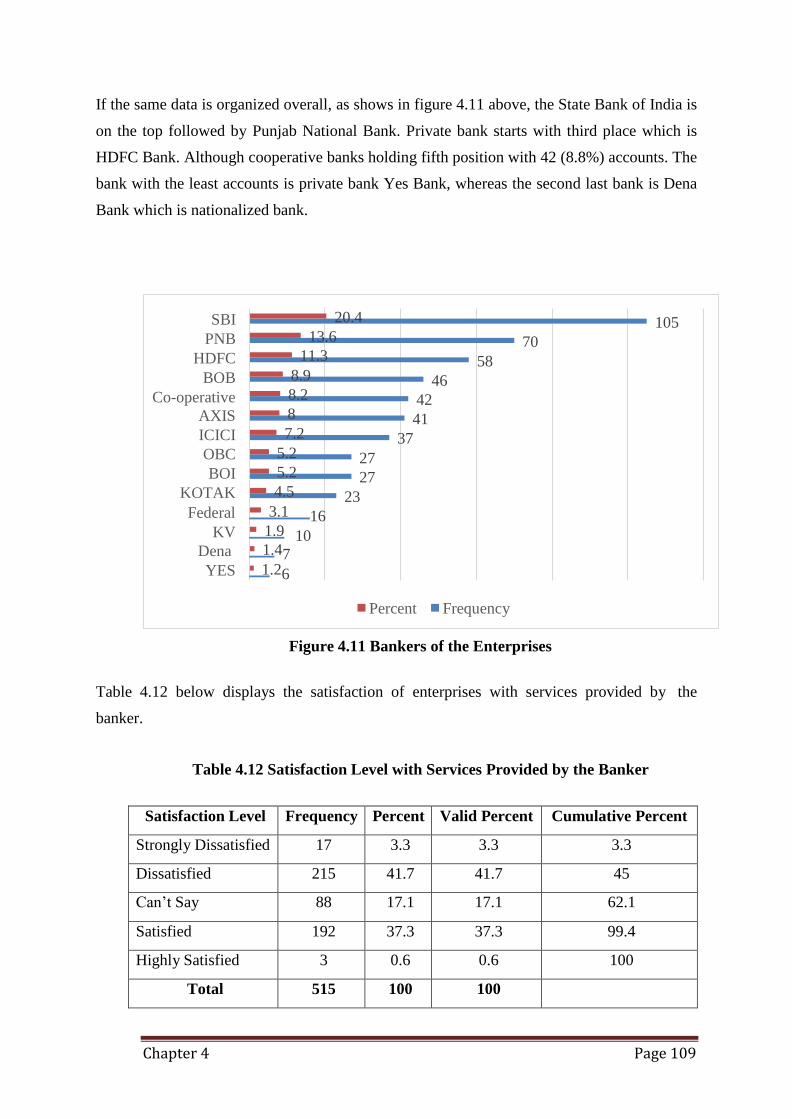
Chapter 4 Page 109
SBI
PNB
HDFC
BOB
Co-operative
AXIS
ICICI
OBC
BOI
KOTAK
Federal
KV
Dena
YES
20.4
13.6
11.3
8.9
8.2
8
7.2
105
70
58
5.2
5.2
4.5
3.1 16
46
42
41
37
27
27
23
1.9
1.47
1.26
10
Percent Frequency
If the same data is organized overall, as shows in figure 4.11 above, the State Bank of India is
on the top followed by Punjab National Bank. Private bank starts with third place which is
HDFC Bank. Although cooperative banks holding fifth position with 42 (8.8%) accounts. The
bank with the least accounts is private bank Yes Bank, whereas the second last bank is Dena
Bank which is nationalized bank.
Figure 4.11 Bankers of the Enterprises
Table 4.12 below displays the satisfaction of enterprises with services provided by the
banker.
Table 4.12 Satisfaction Level with Services Provided by the Banker
Satisfaction Level Frequency Percent Valid Percent Cumulative Percent
Strongly Dissatisfied 17 3.3 3.3 3.3
Dissatisfied 215 41.7 41.7 45
Can’t Say 88 17.1 17.1 62.1
Satisfied 192 37.3 37.3 99.4
Highly Satisfied 3 0.6 0.6 100
Total 515 100 100
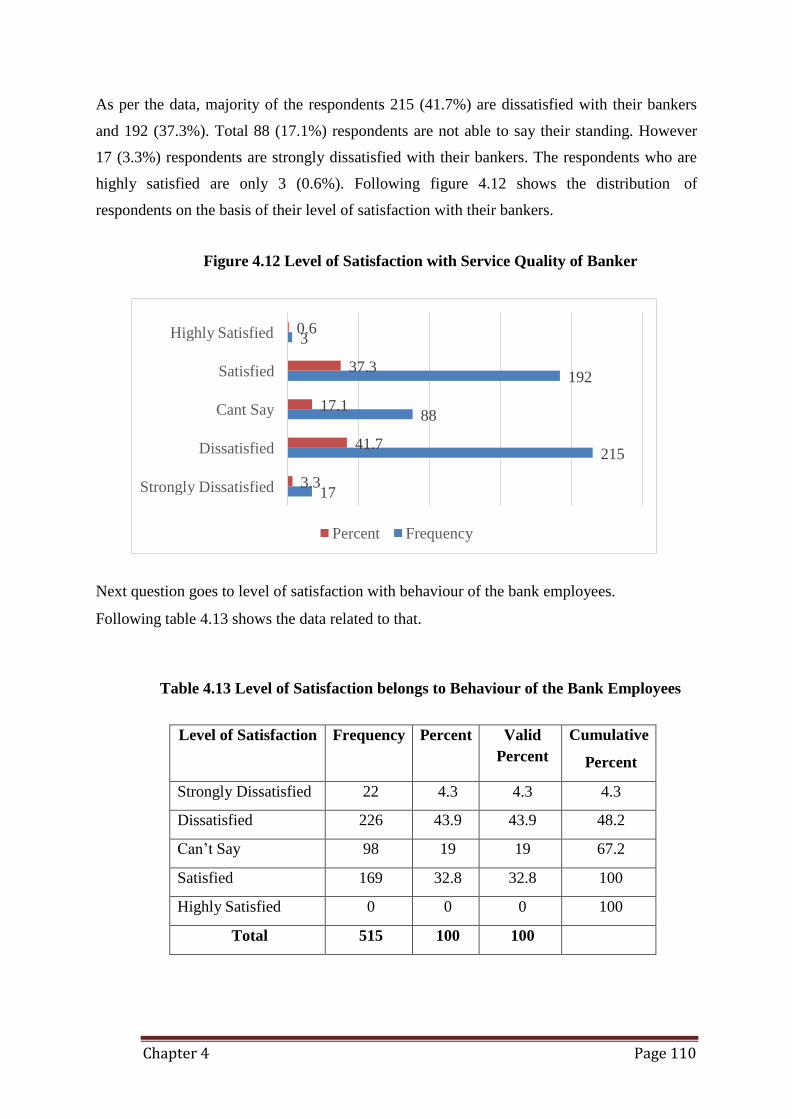
Chapter 4 Page 110
Highly Satisfied 0.6 3
Satisfied 37.3 192
Cant Say 17.1 88
Dissatisfied 41.7 215
Strongly Dissatisfied 3.3 17
Percent Frequency
As per the data, majority of the respondents 215 (41.7%) are dissatisfied with their bankers
and 192 (37.3%). Total 88 (17.1%) respondents are not able to say their standing. However
17 (3.3%) respondents are strongly dissatisfied with their bankers. The respondents who are
highly satisfied are only 3 (0.6%). Following figure 4.12 shows the distribution of
respondents on the basis of their level of satisfaction with their bankers.
Figure 4.12 Level of Satisfaction with Service Quality of Banker
Next question goes to level of satisfaction with behaviour of the bank employees.
Following table 4.13 shows the data related to that.
Table 4.13 Level of Satisfaction belongs to Behaviour of the Bank Employees
Level of Satisfaction Frequency Percent Valid
Percent
Cumulative
Percent
Strongly Dissatisfied 22 4.3 4.3 4.3
Dissatisfied 226 43.9 43.9 48.2
Can’t Say 98 19 19 67.2
Satisfied 169 32.8 32.8 100
Highly Satisfied 0 0 0 100
Total 515 100 100
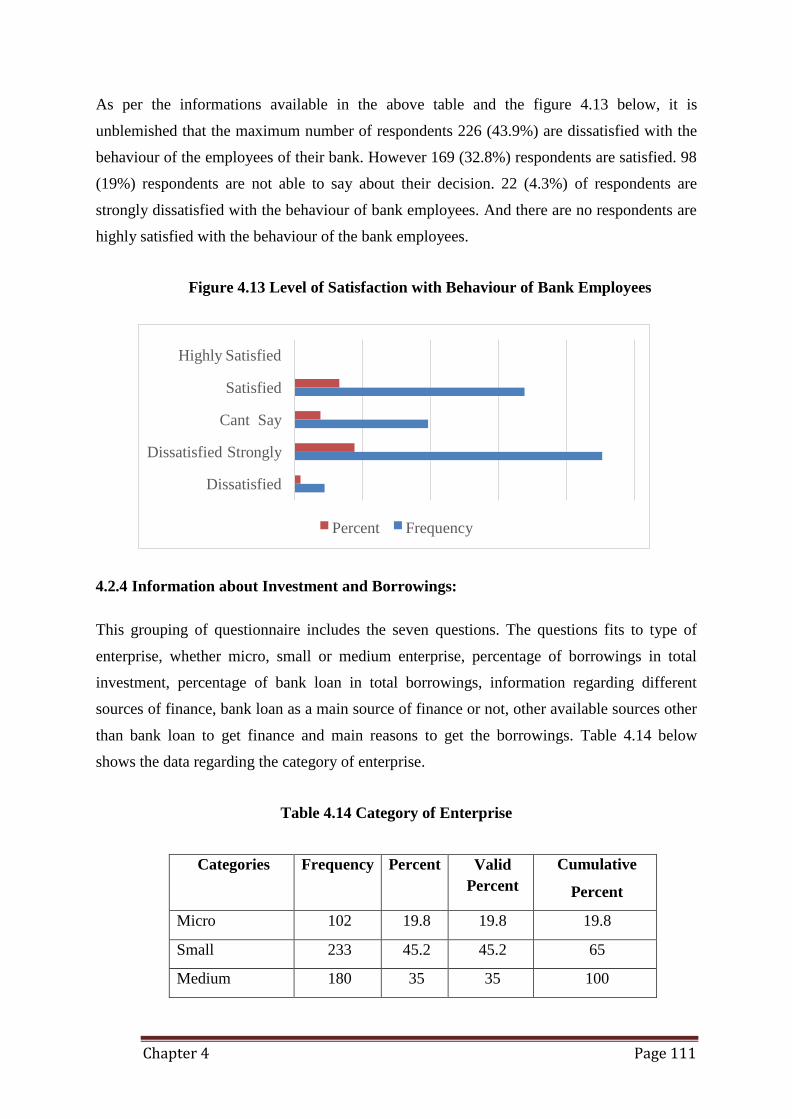
Chapter 4 Page 111
Highly Satisfied
Satisfied
Cant Say
Dissatisfied Strongly
Dissatisfied
Percent Frequency
As per the informations available in the above table and the figure 4.13 below, it is
unblemished that the maximum number of respondents 226 (43.9%) are dissatisfied with the
behaviour of the employees of their bank. However 169 (32.8%) respondents are satisfied. 98
(19%) respondents are not able to say about their decision. 22 (4.3%) of respondents are
strongly dissatisfied with the behaviour of bank employees. And there are no respondents are
highly satisfied with the behaviour of the bank employees.
Figure 4.13 Level of Satisfaction with Behaviour of Bank Employees
4.2.4 Information about Investment and Borrowings:
This grouping of questionnaire includes the seven questions. The questions fits to type of
enterprise, whether micro, small or medium enterprise, percentage of borrowings in total
investment, percentage of bank loan in total borrowings, information regarding different
sources of finance, bank loan as a main source of finance or not, other available sources other
than bank loan to get finance and main reasons to get the borrowings. Table 4.14 below
shows the data regarding the category of enterprise.
Table 4.14 Category of Enterprise
Categories Frequency Percent Valid
Percent
Cumulative
Percent
Micro 102 19.8 19.8 19.8
Small 233 45.2 45.2 65
Medium 180 35 35 100
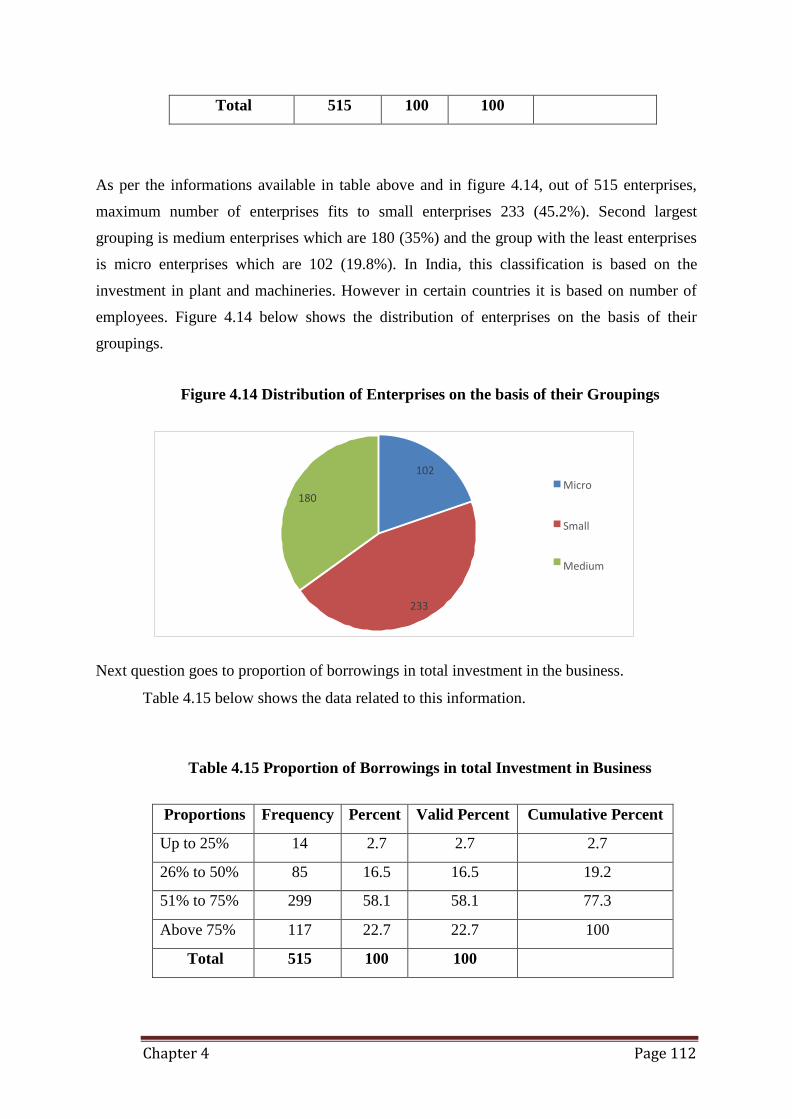
Chapter 4 Page 112
102
Micro 180
Small
Medium
233
Total 515 100 100
As per the informations available in table above and in figure 4.14, out of 515 enterprises,
maximum number of enterprises fits to small enterprises 233 (45.2%). Second largest
grouping is medium enterprises which are 180 (35%) and the group with the least enterprises
is micro enterprises which are 102 (19.8%). In India, this classification is based on the
investment in plant and machineries. However in certain countries it is based on number of
employees. Figure 4.14 below shows the distribution of enterprises on the basis of their
groupings.
Figure 4.14 Distribution of Enterprises on the basis of their Groupings
Next question goes to proportion of borrowings in total investment in the business.
Table 4.15 below shows the data related to this information.
Table 4.15 Proportion of Borrowings in total Investment in Business
Proportions Frequency Percent Valid Percent Cumulative Percent
Up to 25% 14 2.7 2.7 2.7
26% to 50% 85 16.5 16.5 19.2
51% to 75% 299 58.1 58.1 77.3
Above 75% 117 22.7 22.7 100
Total 515 100 100
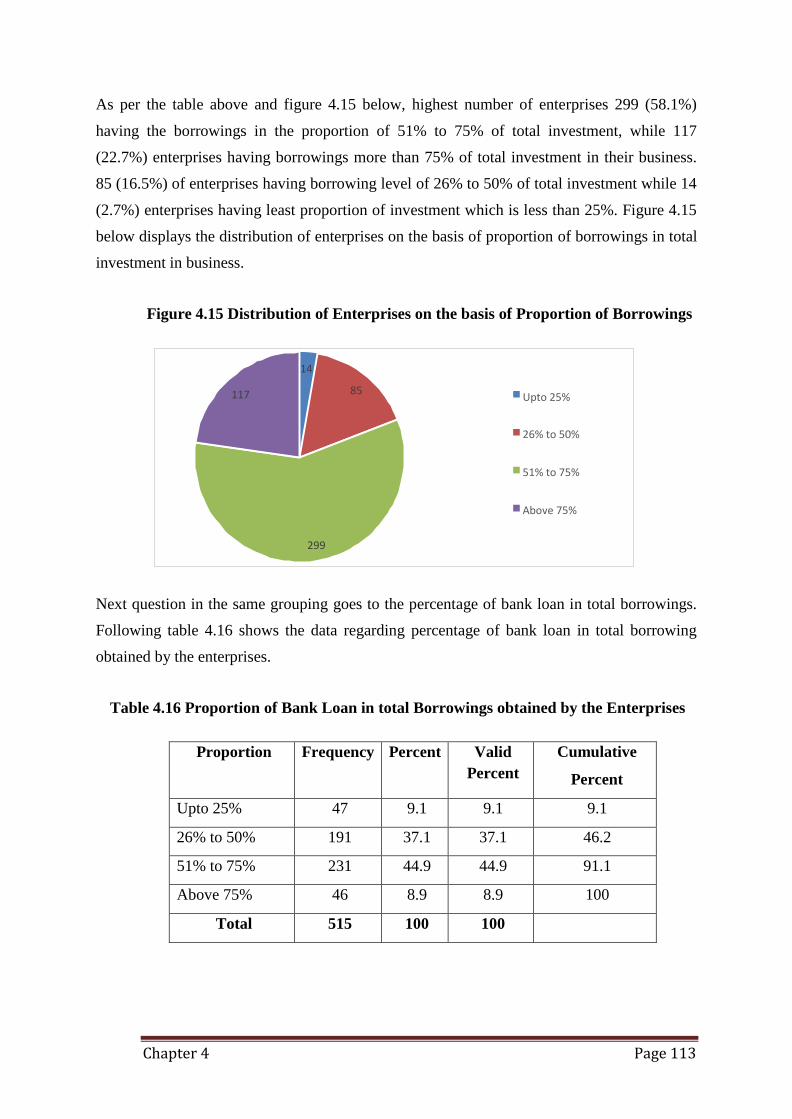
Chapter 4 Page 113
14
117 85 Upto 25%
26% to 50%
51% to 75%
Above 75%
299
As per the table above and figure 4.15 below, highest number of enterprises 299 (58.1%)
having the borrowings in the proportion of 51% to 75% of total investment, while 117
(22.7%) enterprises having borrowings more than 75% of total investment in their business.
85 (16.5%) of enterprises having borrowing level of 26% to 50% of total investment while 14
(2.7%) enterprises having least proportion of investment which is less than 25%. Figure 4.15
below displays the distribution of enterprises on the basis of proportion of borrowings in total
investment in business.
Figure 4.15 Distribution of Enterprises on the basis of Proportion of Borrowings
Next question in the same grouping goes to the percentage of bank loan in total borrowings.
Following table 4.16 shows the data regarding percentage of bank loan in total borrowing
obtained by the enterprises.
Table 4.16 Proportion of Bank Loan in total Borrowings obtained by the Enterprises
Proportion Frequency Percent Valid
Percent
Cumulative
Percent
Upto 25% 47 9.1 9.1 9.1
26% to 50% 191 37.1 37.1 46.2
51% to 75% 231 44.9 44.9 91.1
Above 75% 46 8.9 8.9 100
Total 515 100 100
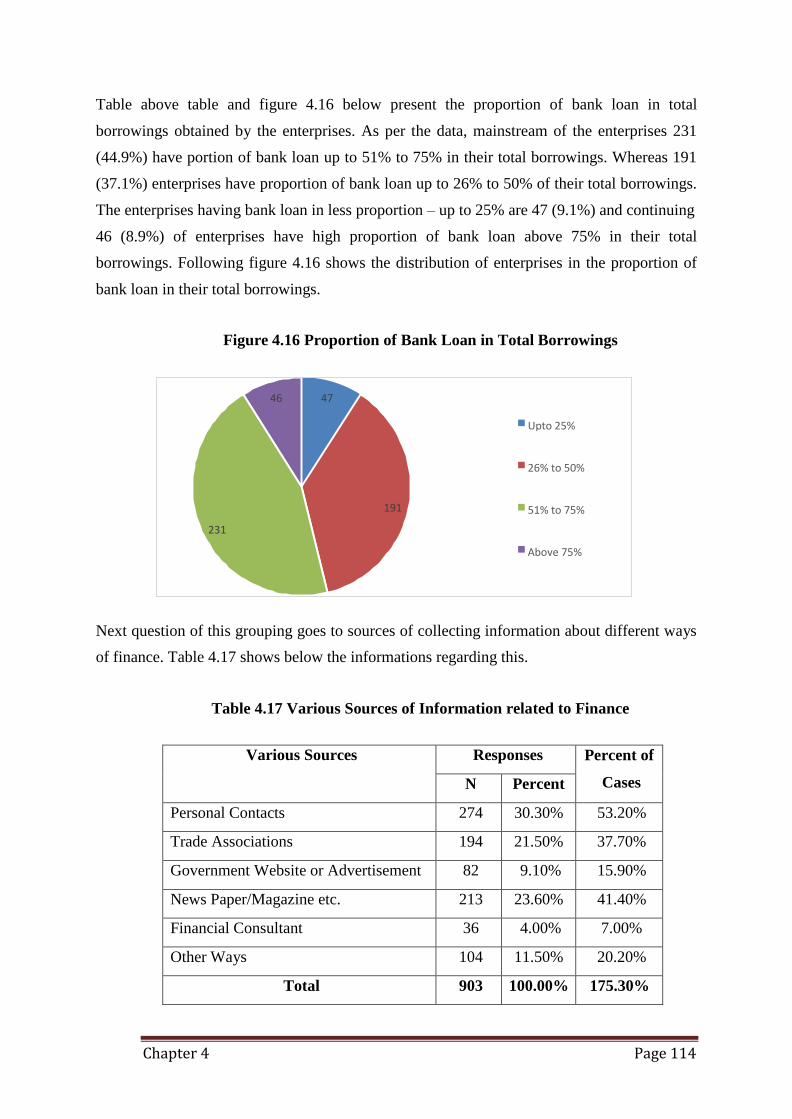
Chapter 4 Page 114
46 47
Upto 25%
26% to 50%
191 51% to 75%
231
Above 75%
Table above table and figure 4.16 below present the proportion of bank loan in total
borrowings obtained by the enterprises. As per the data, mainstream of the enterprises 231
(44.9%) have portion of bank loan up to 51% to 75% in their total borrowings. Whereas 191
(37.1%) enterprises have proportion of bank loan up to 26% to 50% of their total borrowings.
The enterprises having bank loan in less proportion – up to 25% are 47 (9.1%) and continuing
46 (8.9%) of enterprises have high proportion of bank loan above 75% in their total
borrowings. Following figure 4.16 shows the distribution of enterprises in the proportion of
bank loan in their total borrowings.
Figure 4.16 Proportion of Bank Loan in Total Borrowings
Next question of this grouping goes to sources of collecting information about different ways
of finance. Table 4.17 shows below the informations regarding this.
Table 4.17 Various Sources of Information related to Finance
Various Sources Responses Percent of
Cases N Percent
Personal Contacts 274 30.30% 53.20%
Trade Associations 194 21.50% 37.70%
Government Website or Advertisement 82 9.10% 15.90%
News Paper/Magazine etc. 213 23.60% 41.40%
Financial Consultant 36 4.00% 7.00%
Other Ways 104 11.50% 20.20%
Total 903 100.00% 175.30%
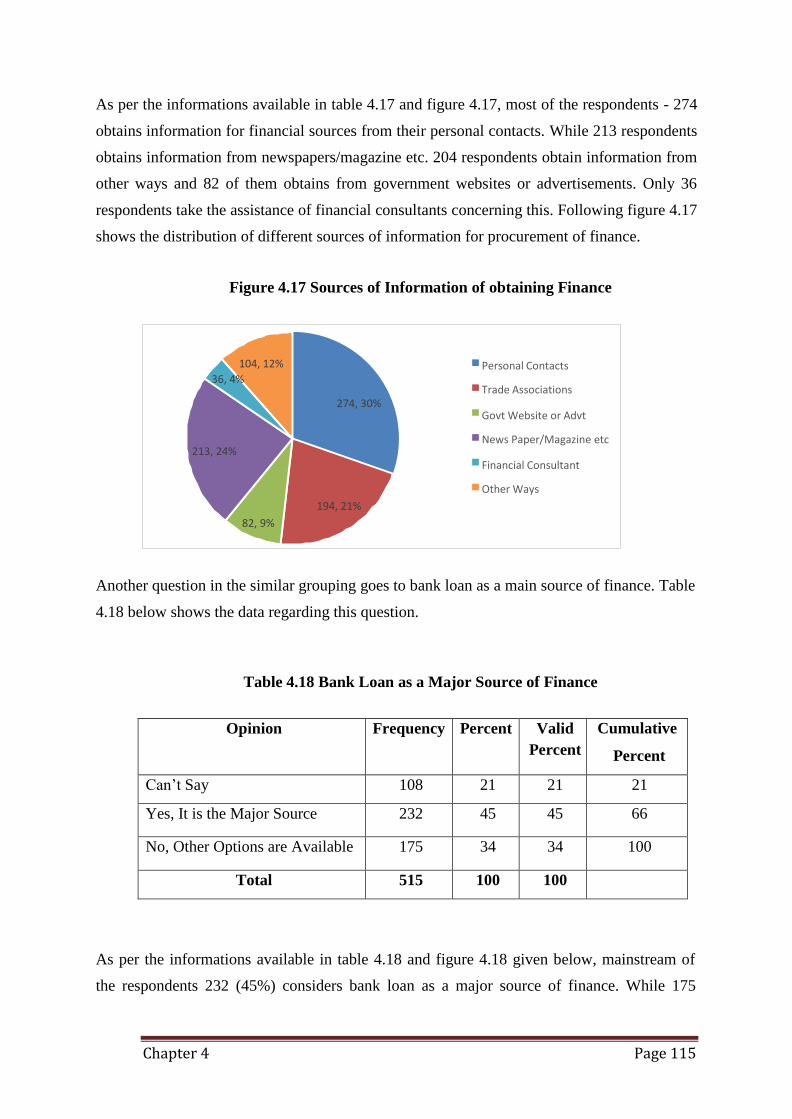
Chapter 4 Page 115
104, 12%
36, 4% Personal Contacts
Trade Associations 274, 30%
Govt Website or Advt
News Paper/Magazine etc 213, 24%
Financial Consultant
Other Ways
194, 21%
82, 9%
As per the informations available in table 4.17 and figure 4.17, most of the respondents - 274
obtains information for financial sources from their personal contacts. While 213 respondents
obtains information from newspapers/magazine etc. 204 respondents obtain information from
other ways and 82 of them obtains from government websites or advertisements. Only 36
respondents take the assistance of financial consultants concerning this. Following figure 4.17
shows the distribution of different sources of information for procurement of finance.
Figure 4.17 Sources of Information of obtaining Finance
Another question in the similar grouping goes to bank loan as a main source of finance. Table
4.18 below shows the data regarding this question.
Table 4.18 Bank Loan as a Major Source of Finance
Opinion Frequency Percent Valid
Percent
Cumulative
Percent
Can’t Say 108 21 21 21
Yes, It is the Major Source 232 45 45 66
No, Other Options are Available 175 34 34 100
Total 515 100 100
As per the informations available in table 4.18 and figure 4.18 given below, mainstream of
the respondents 232 (45%) considers bank loan as a major source of finance. While 175
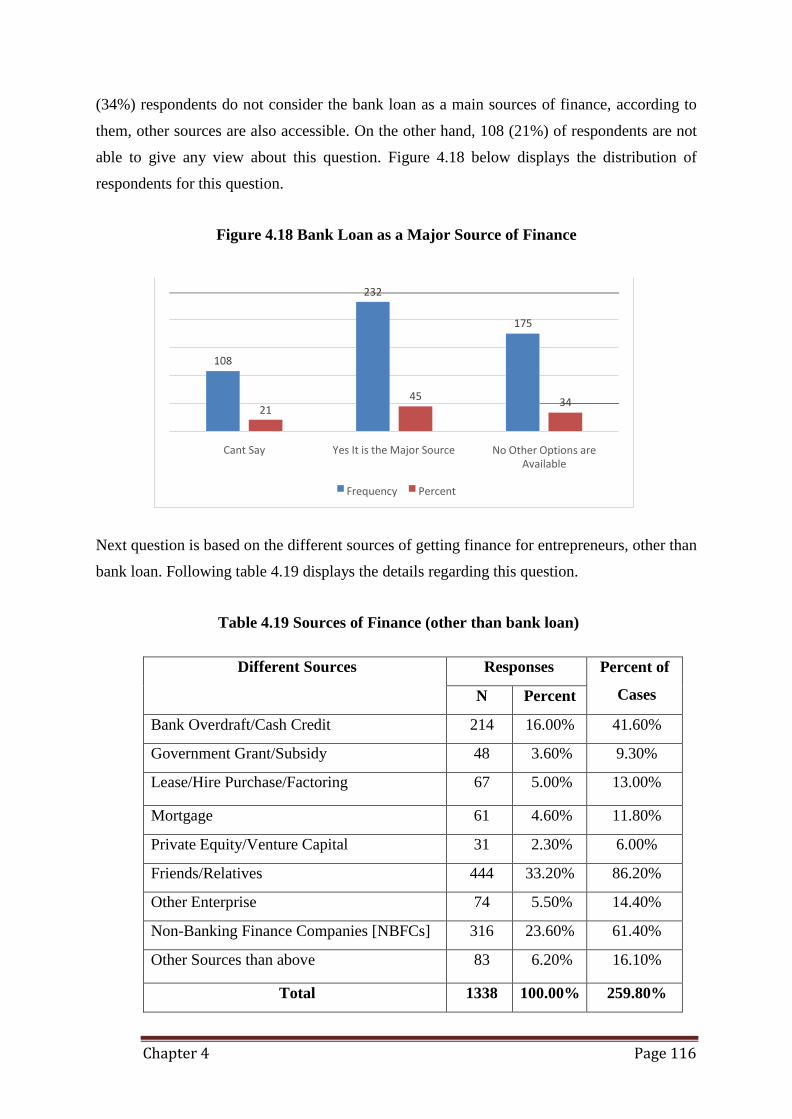
Chapter 4 Page 116
232
175
108
45
21 34
Cant Say Yes It is the Major Source No Other Options are Available
Frequency Percent
(34%) respondents do not consider the bank loan as a main sources of finance, according to
them, other sources are also accessible. On the other hand, 108 (21%) of respondents are not
able to give any view about this question. Figure 4.18 below displays the distribution of
respondents for this question.
Figure 4.18 Bank Loan as a Major Source of Finance
Next question is based on the different sources of getting finance for entrepreneurs, other than
bank loan. Following table 4.19 displays the details regarding this question.
Table 4.19 Sources of Finance (other than bank loan)
Different Sources Responses Percent of
Cases N Percent
Bank Overdraft/Cash Credit 214 16.00% 41.60%
Government Grant/Subsidy 48 3.60% 9.30%
Lease/Hire Purchase/Factoring 67 5.00% 13.00%
Mortgage 61 4.60% 11.80%
Private Equity/Venture Capital 31 2.30% 6.00%
Friends/Relatives 444 33.20% 86.20%
Other Enterprise 74 5.50% 14.40%
Non-Banking Finance Companies [NBFCs] 316 23.60% 61.40%
Other Sources than above 83 6.20% 16.10%
Total 1338 100.00% 259.80%
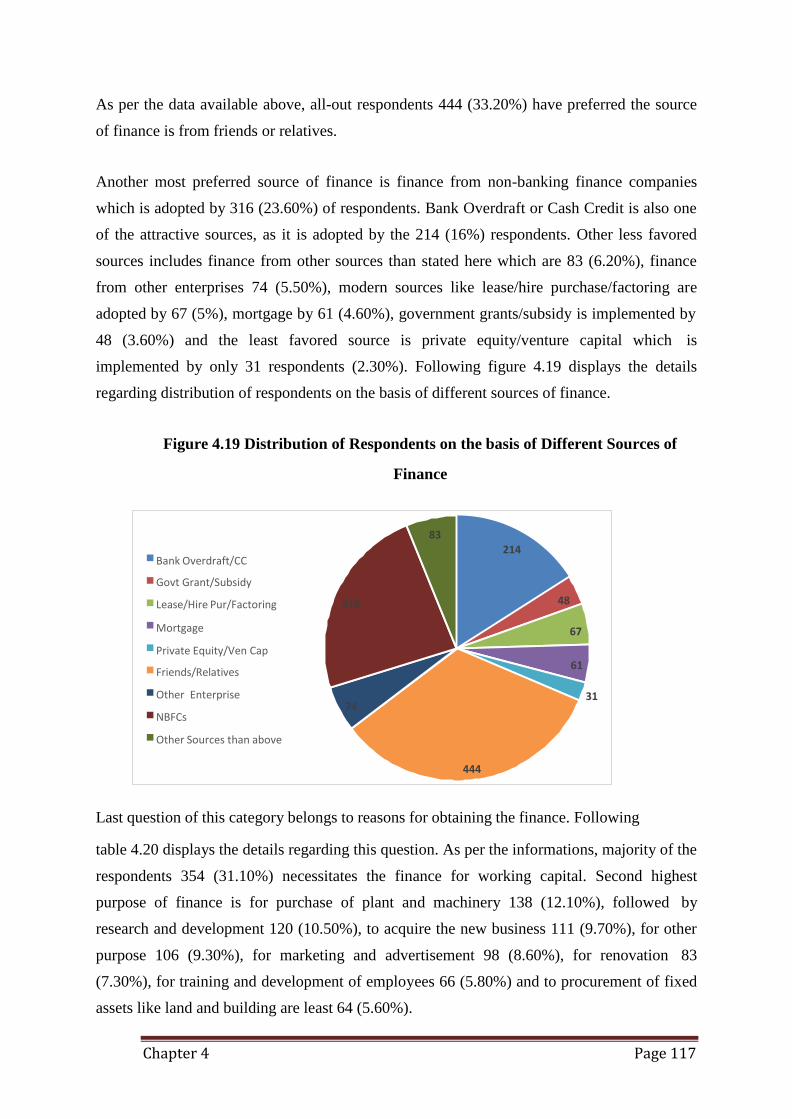
Chapter 4 Page 117
83 214
Bank Overdraft/CC
Govt Grant/Subsidy
Lease/Hire Pur/Factoring 316 48
Mortgage 67
Private Equity/Ven Cap
Friends/Relatives
Other Enterprise
NBFCs
Other Sources than above
61
31 74
444
As per the data available above, all-out respondents 444 (33.20%) have preferred the source
of finance is from friends or relatives.
Another most preferred source of finance is finance from non-banking finance companies
which is adopted by 316 (23.60%) of respondents. Bank Overdraft or Cash Credit is also one
of the attractive sources, as it is adopted by the 214 (16%) respondents. Other less favored
sources includes finance from other sources than stated here which are 83 (6.20%), finance
from other enterprises 74 (5.50%), modern sources like lease/hire purchase/factoring are
adopted by 67 (5%), mortgage by 61 (4.60%), government grants/subsidy is implemented by
48 (3.60%) and the least favored source is private equity/venture capital which is
implemented by only 31 respondents (2.30%). Following figure 4.19 displays the details
regarding distribution of respondents on the basis of different sources of finance.
Figure 4.19 Distribution of Respondents on the basis of Different Sources of
Finance
Last question of this category belongs to reasons for obtaining the finance. Following
table 4.20 displays the details regarding this question. As per the informations, majority of the
respondents 354 (31.10%) necessitates the finance for working capital. Second highest
purpose of finance is for purchase of plant and machinery 138 (12.10%), followed by
research and development 120 (10.50%), to acquire the new business 111 (9.70%), for other
purpose 106 (9.30%), for marketing and advertisement 98 (8.60%), for renovation 83
(7.30%), for training and development of employees 66 (5.80%) and to procurement of fixed
assets like land and building are least 64 (5.60%).
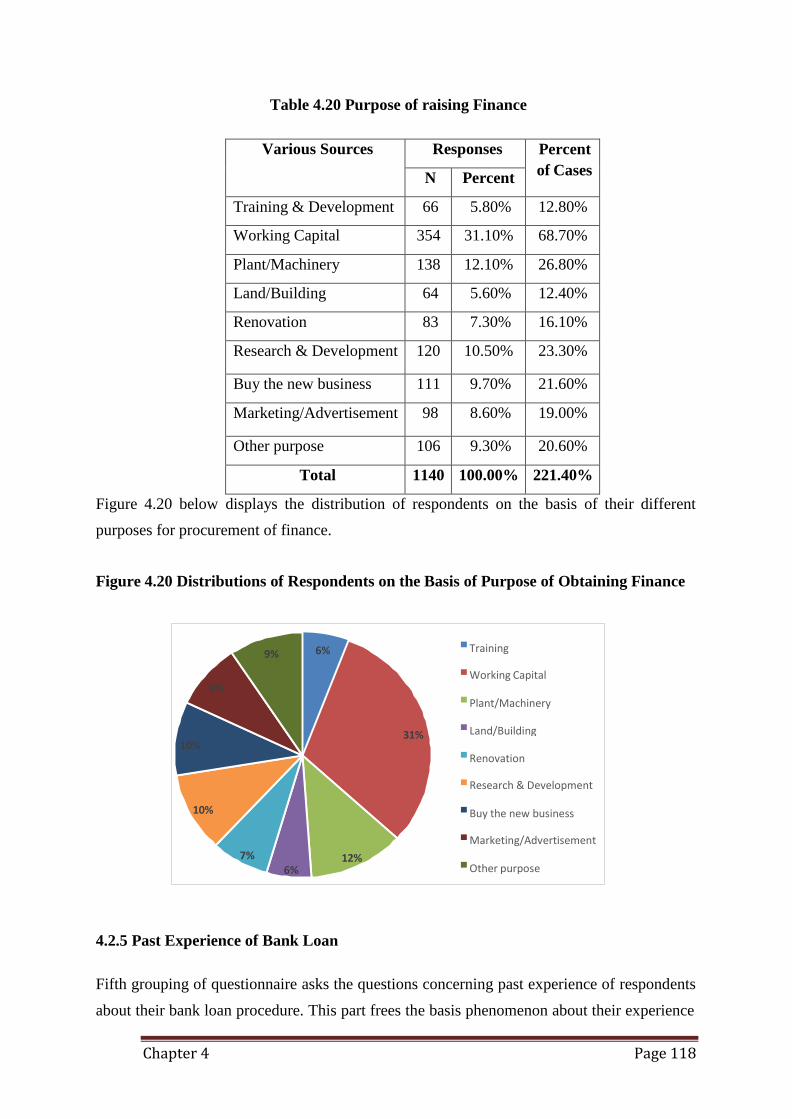
Chapter 4 Page 118
9% 6% Training
Working Capital 9%
Plant/Machinery
31% Land/Building 10%
Renovation
Research & Development
10% Buy the new business
Marketing/Advertisement
7% 12% 6% Other purpose
Table 4.20 Purpose of raising Finance
Various Sources Responses Percent
of Cases N Percent
Training & Development 66 5.80% 12.80%
Working Capital 354 31.10% 68.70%
Plant/Machinery 138 12.10% 26.80%
Land/Building 64 5.60% 12.40%
Renovation 83 7.30% 16.10%
Research & Development 120 10.50% 23.30%
Buy the new business 111 9.70% 21.60%
Marketing/Advertisement 98 8.60% 19.00%
Other purpose 106 9.30% 20.60%
Total 1140 100.00% 221.40%
Figure 4.20 below displays the distribution of respondents on the basis of their different
purposes for procurement of finance.
Figure 4.20 Distributions of Respondents on the Basis of Purpose of Obtaining Finance
4.2.5 Past Experience of Bank Loan
Fifth grouping of questionnaire asks the questions concerning past experience of respondents
about their bank loan procedure. This part frees the basis phenomenon about their experience
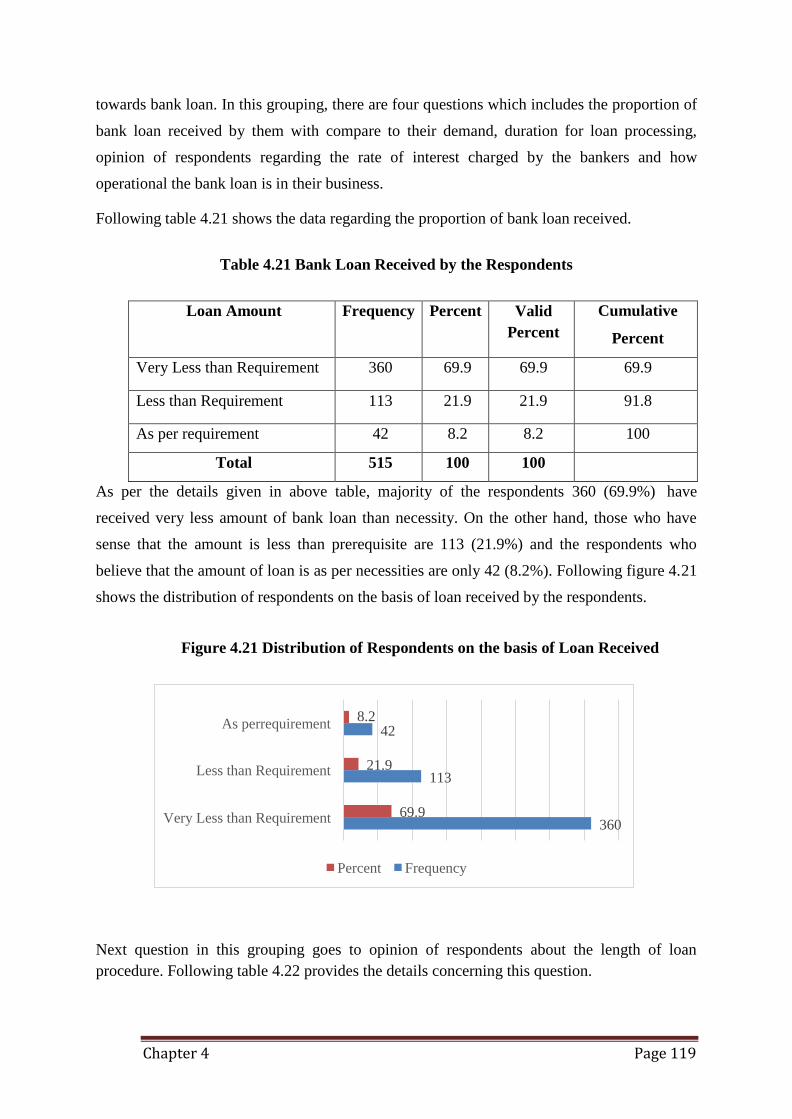
Chapter 4 Page 119
As perrequirement
Less than Requirement
8.2 42
21.9
113
Very Less than Requirement 69.9 360
Percent Frequency
towards bank loan. In this grouping, there are four questions which includes the proportion of
bank loan received by them with compare to their demand, duration for loan processing,
opinion of respondents regarding the rate of interest charged by the bankers and how
operational the bank loan is in their business.
Following table 4.21 shows the data regarding the proportion of bank loan received.
Table 4.21 Bank Loan Received by the Respondents
Loan Amount Frequency Percent Valid
Percent
Cumulative
Percent
Very Less than Requirement 360 69.9 69.9 69.9
Less than Requirement 113 21.9 21.9 91.8
As per requirement 42 8.2 8.2 100
Total 515 100 100
As per the details given in above table, majority of the respondents 360 (69.9%) have
received very less amount of bank loan than necessity. On the other hand, those who have
sense that the amount is less than prerequisite are 113 (21.9%) and the respondents who
believe that the amount of loan is as per necessities are only 42 (8.2%). Following figure 4.21
shows the distribution of respondents on the basis of loan received by the respondents.
Figure 4.21 Distribution of Respondents on the basis of Loan Received
Next question in this grouping goes to opinion of respondents about the length of loan
procedure. Following table 4.22 provides the details concerning this question.
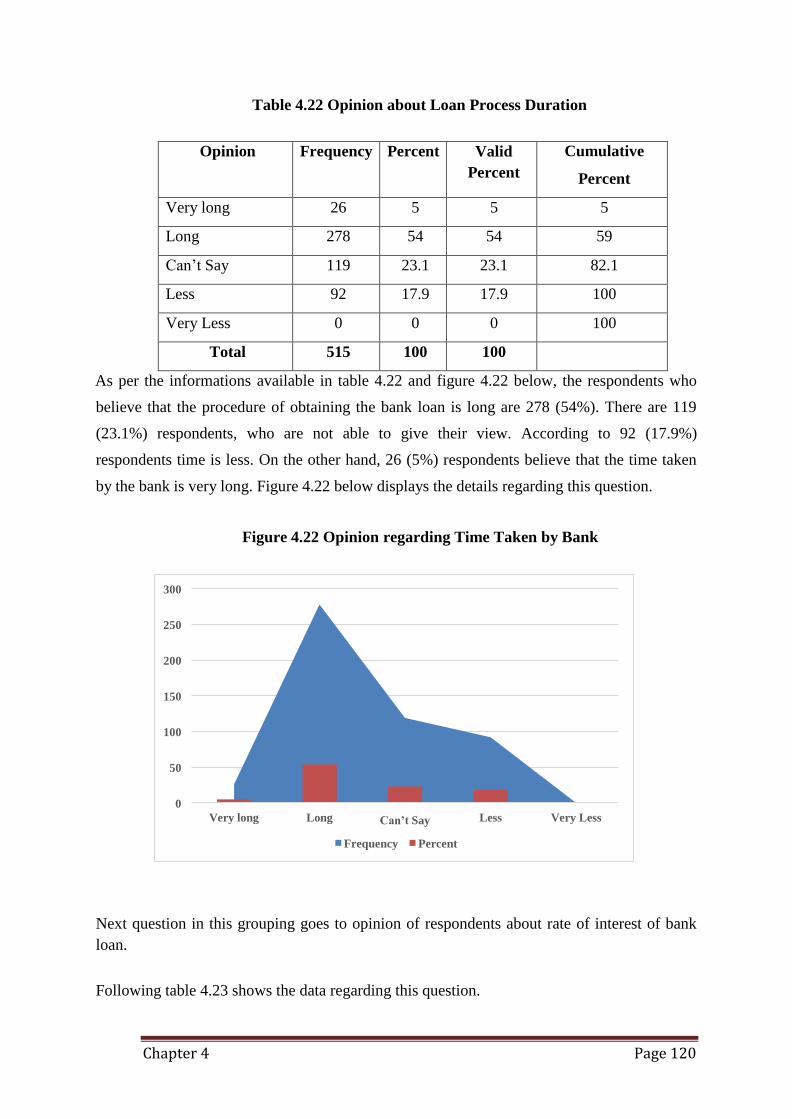
Chapter 4 Page 120
300
250
200
150
100
50
0
Very long Long Can’t Say Less Very Less
Frequency Percent
Table 4.22 Opinion about Loan Process Duration
Opinion Frequency Percent Valid
Percent
Cumulative
Percent
Very long 26 5 5 5
Long 278 54 54 59
Can’t Say 119 23.1 23.1 82.1
Less 92 17.9 17.9 100
Very Less 0 0 0 100
Total 515 100 100
As per the informations available in table 4.22 and figure 4.22 below, the respondents who
believe that the procedure of obtaining the bank loan is long are 278 (54%). There are 119
(23.1%) respondents, who are not able to give their view. According to 92 (17.9%)
respondents time is less. On the other hand, 26 (5%) respondents believe that the time taken
by the bank is very long. Figure 4.22 below displays the details regarding this question.
Figure 4.22 Opinion regarding Time Taken by Bank
Next question in this grouping goes to opinion of respondents about rate of interest of bank
loan.
Following table 4.23 shows the data regarding this question.
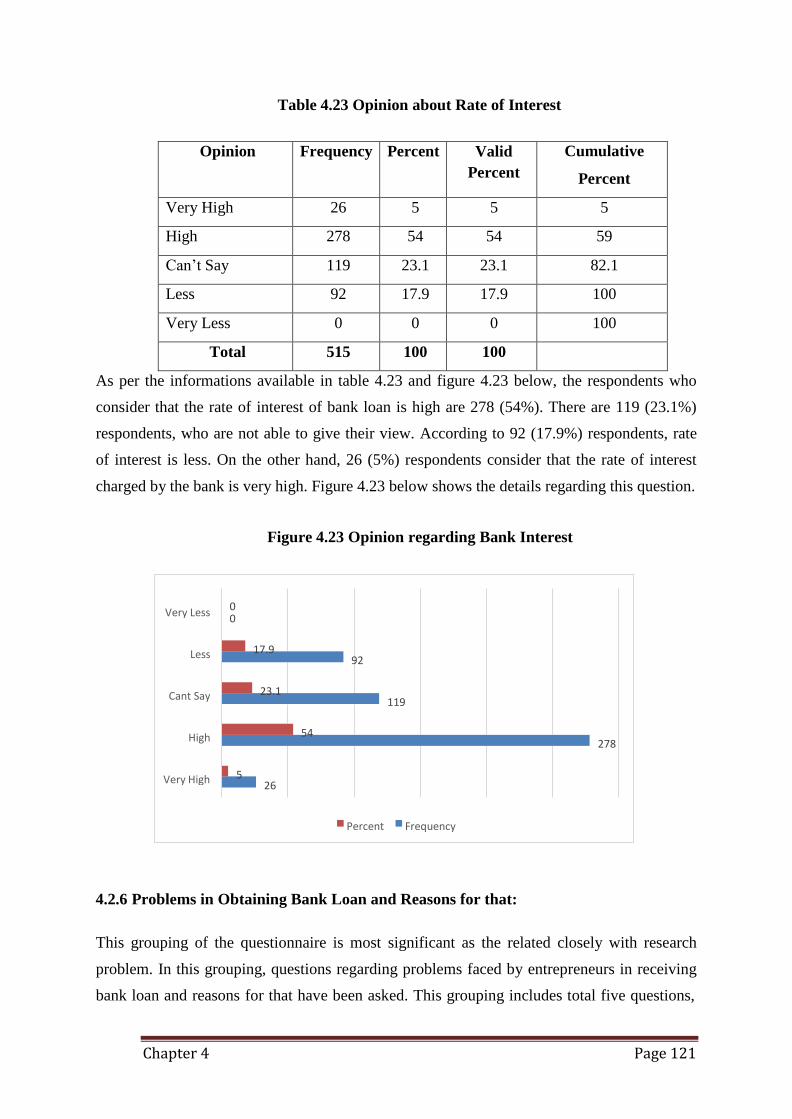
Chapter 4 Page 121
Very Less 0 0
Less 17.9 92
Cant Say 23.1 119
High 54 278
Very High 5 26
Percent Frequency
Table 4.23 Opinion about Rate of Interest
Opinion Frequency Percent Valid
Percent
Cumulative
Percent
Very High 26 5 5 5
High 278 54 54 59
Can’t Say 119 23.1 23.1 82.1
Less 92 17.9 17.9 100
Very Less 0 0 0 100
Total 515 100 100
As per the informations available in table 4.23 and figure 4.23 below, the respondents who
consider that the rate of interest of bank loan is high are 278 (54%). There are 119 (23.1%)
respondents, who are not able to give their view. According to 92 (17.9%) respondents, rate
of interest is less. On the other hand, 26 (5%) respondents consider that the rate of interest
charged by the bank is very high. Figure 4.23 below shows the details regarding this question.
Figure 4.23 Opinion regarding Bank Interest
4.2.6 Problems in Obtaining Bank Loan and Reasons for that:
This grouping of the questionnaire is most significant as the related closely with research
problem. In this grouping, questions regarding problems faced by entrepreneurs in receiving
bank loan and reasons for that have been asked. This grouping includes total five questions,
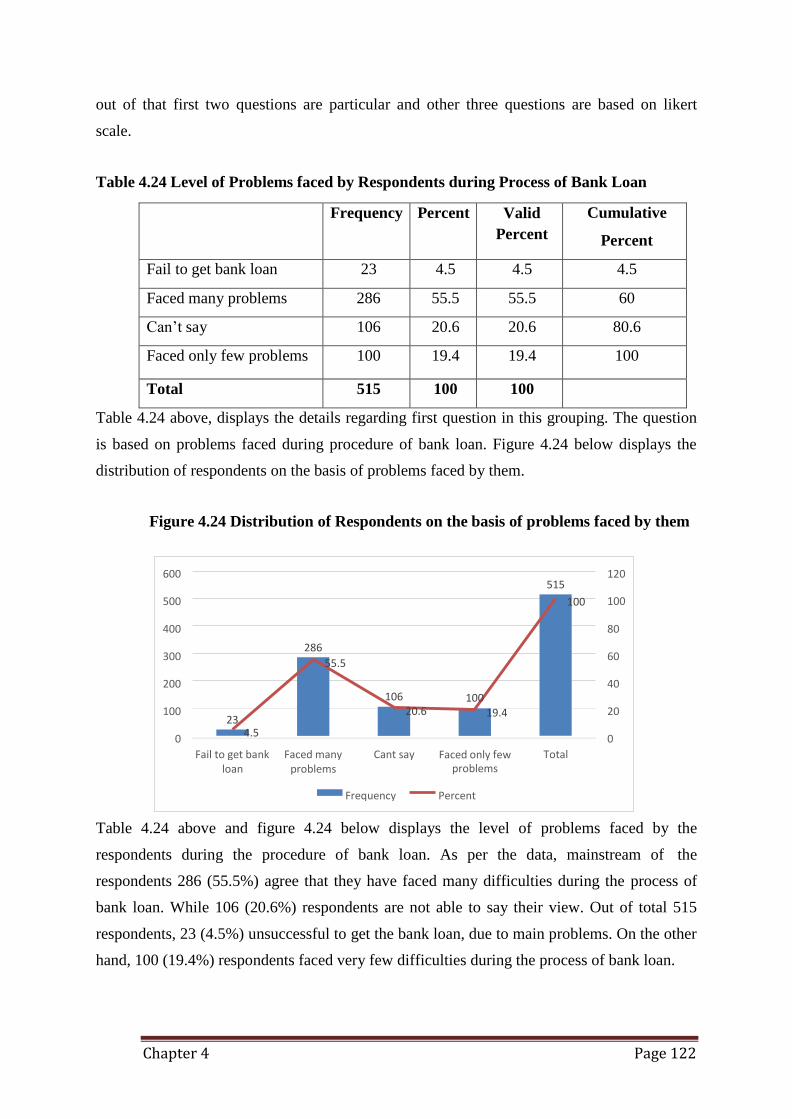
Chapter 4 Page 122
600 120 515
500 100 100
400 80
300 286
55.5 60
200 40 106 100
100 23
20.6 19.4 20
0 4.5
0
Fail to get bank Faced many Cant say loan problems
Faced only few problems
Total
Frequency Percent
out of that first two questions are particular and other three questions are based on likert
scale.
Table 4.24 Level of Problems faced by Respondents during Process of Bank Loan
Frequency Percent Valid
Percent
Cumulative
Percent
Fail to get bank loan 23 4.5 4.5 4.5
Faced many problems 286 55.5 55.5 60
Can’t say 106 20.6 20.6 80.6
Faced only few problems 100 19.4 19.4 100
Total 515 100 100
Table 4.24 above, displays the details regarding first question in this grouping. The question
is based on problems faced during procedure of bank loan. Figure 4.24 below displays the
distribution of respondents on the basis of problems faced by them.
Figure 4.24 Distribution of Respondents on the basis of problems faced by them
Table 4.24 above and figure 4.24 below displays the level of problems faced by the
respondents during the procedure of bank loan. As per the data, mainstream of the
respondents 286 (55.5%) agree that they have faced many difficulties during the process of
bank loan. While 106 (20.6%) respondents are not able to say their view. Out of total 515
respondents, 23 (4.5%) unsuccessful to get the bank loan, due to main problems. On the other
hand, 100 (19.4%) respondents faced very few difficulties during the process of bank loan.
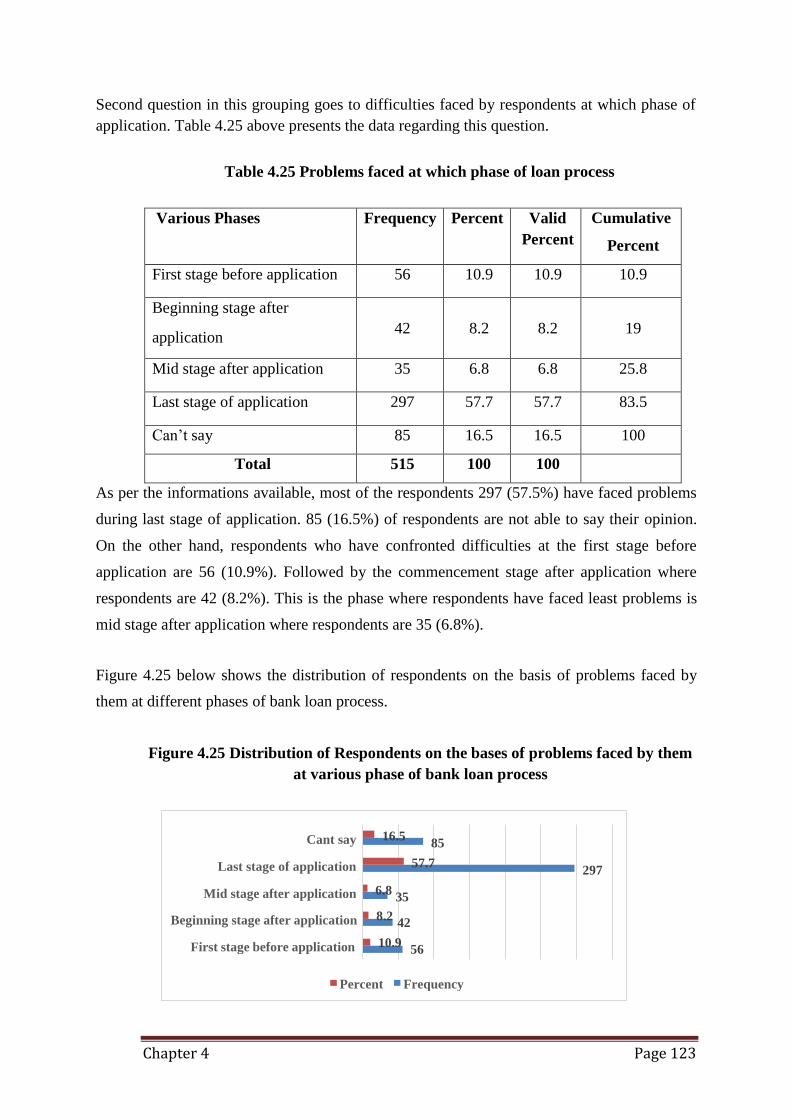
Chapter 4 Page 123
Cant say
Last stage of application
Mid stage after application
Beginning stage after application
First stage before application
16.5 85
57.7 297
6.8 35
8.2 42
10.9 56
Percent Frequency
Second question in this grouping goes to difficulties faced by respondents at which phase of
application. Table 4.25 above presents the data regarding this question.
Table 4.25 Problems faced at which phase of loan process
Various Phases Frequency Percent Valid
Percent
Cumulative
Percent
First stage before application 56 10.9 10.9 10.9
Beginning stage after
application
42
8.2
8.2
19
Mid stage after application 35 6.8 6.8 25.8
Last stage of application 297 57.7 57.7 83.5
Can’t say 85 16.5 16.5 100
Total 515 100 100
As per the informations available, most of the respondents 297 (57.5%) have faced problems
during last stage of application. 85 (16.5%) of respondents are not able to say their opinion.
On the other hand, respondents who have confronted difficulties at the first stage before
application are 56 (10.9%). Followed by the commencement stage after application where
respondents are 42 (8.2%). This is the phase where respondents have faced least problems is
mid stage after application where respondents are 35 (6.8%).
Figure 4.25 below shows the distribution of respondents on the basis of problems faced by
them at different phases of bank loan process.
Figure 4.25 Distribution of Respondents on the bases of problems faced by them
at various phase of bank loan process
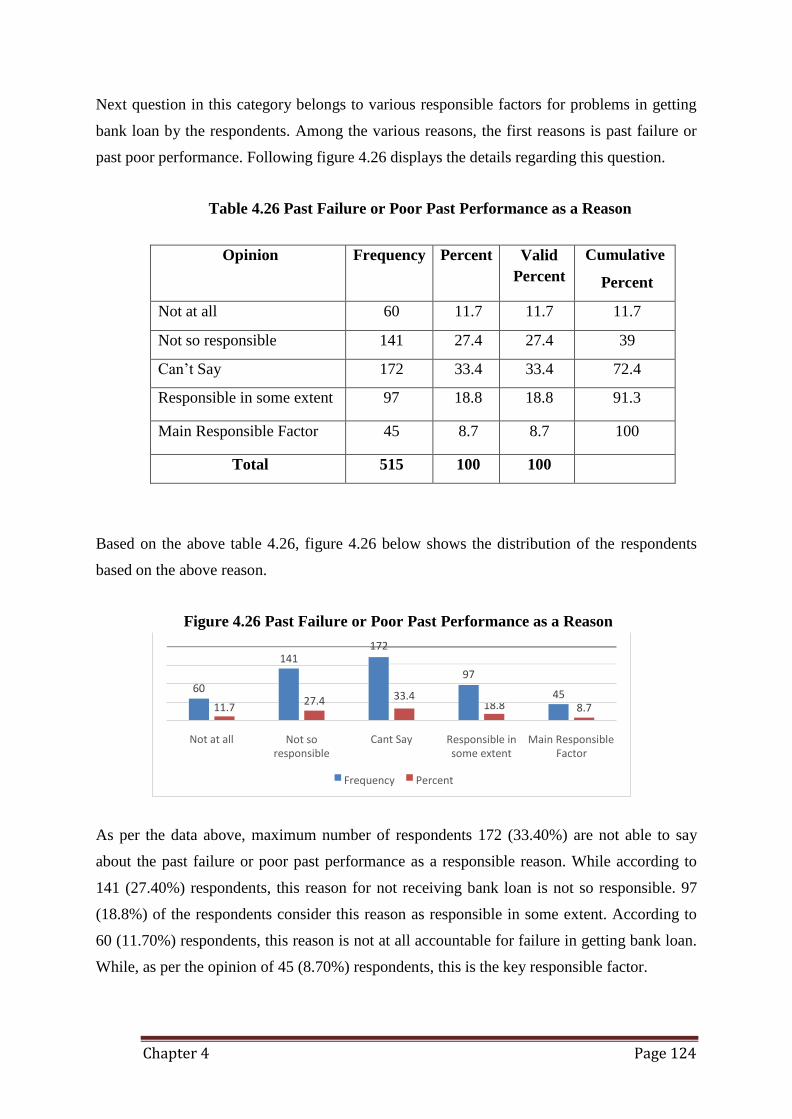
Chapter 4 Page 124
Next question in this category belongs to various responsible factors for problems in getting
bank loan by the respondents. Among the various reasons, the first reasons is past failure or
past poor performance. Following figure 4.26 displays the details regarding this question.
Table 4.26 Past Failure or Poor Past Performance as a Reason
Opinion Frequency Percent Valid
Percent
Cumulative
Percent
Not at all 60 11.7 11.7 11.7
Not so responsible 141 27.4 27.4 39
Can’t Say 172 33.4 33.4 72.4
Responsible in some extent 97 18.8 18.8 91.3
Main Responsible Factor 45 8.7 8.7 100
Total 515 100 100
Based on the above table 4.26, figure 4.26 below shows the distribution of the respondents
based on the above reason.
Figure 4.26 Past Failure or Poor Past Performance as a Reason
As per the data above, maximum number of respondents 172 (33.40%) are not able to say
about the past failure or poor past performance as a responsible reason. While according to
141 (27.40%) respondents, this reason for not receiving bank loan is not so responsible. 97
(18.8%) of the respondents consider this reason as responsible in some extent. According to
60 (11.70%) respondents, this reason is not at all accountable for failure in getting bank loan.
While, as per the opinion of 45 (8.70%) respondents, this is the key responsible factor.
172 141
97 60
27.4 45
8.7
Not at all Not so responsible
Cant Say Responsible in Main Responsible some extent Factor
Frequency Percent
18.8 11.7 33.4
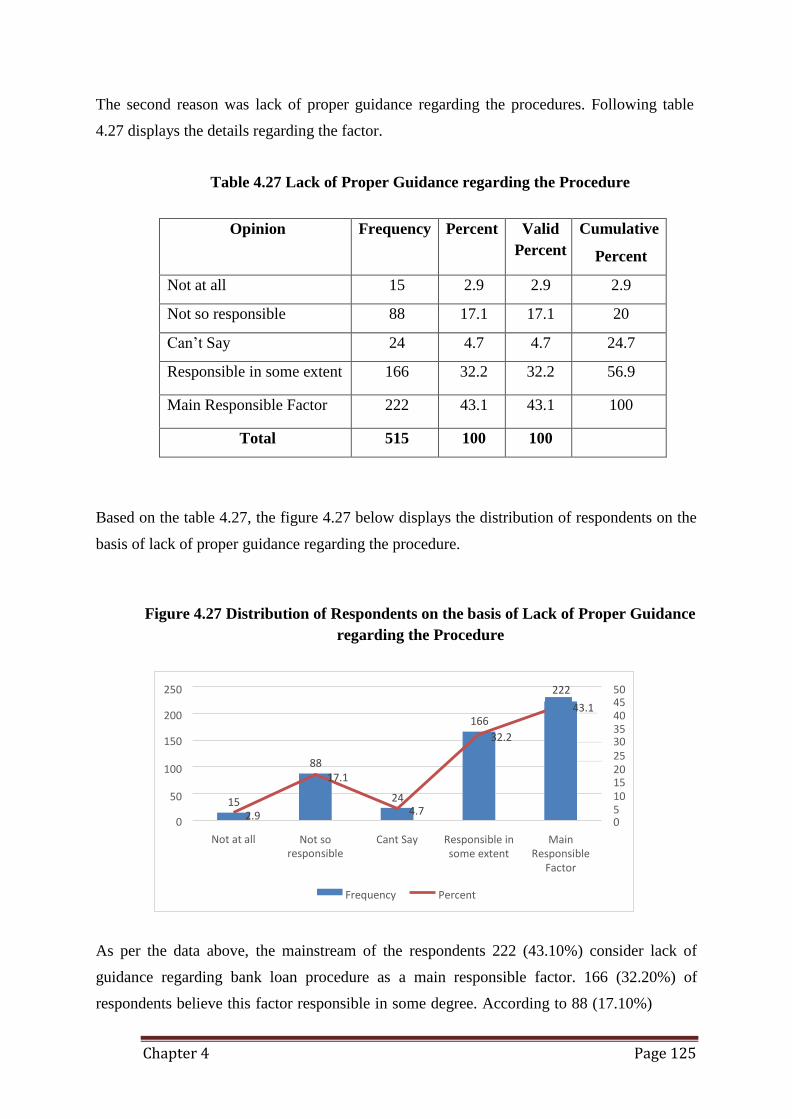
Chapter 4 Page 125
Not at all Not so responsible
Cant Say Responsible in Main some extent Responsible
Factor
Frequency Percent
The second reason was lack of proper guidance regarding the procedures. Following table
4.27 displays the details regarding the factor.
Table 4.27 Lack of Proper Guidance regarding the Procedure
Opinion Frequency Percent Valid
Percent
Cumulative
Percent
Not at all 15 2.9 2.9 2.9
Not so responsible 88 17.1 17.1 20
Can’t Say 24 4.7 4.7 24.7
Responsible in some extent 166 32.2 32.2 56.9
Main Responsible Factor 222 43.1 43.1 100
Total 515 100 100
Based on the table 4.27, the figure 4.27 below displays the distribution of respondents on the
basis of lack of proper guidance regarding the procedure.
Figure 4.27 Distribution of Respondents on the basis of Lack of Proper Guidance
regarding the Procedure
250 222 50
200
150
166
32.2
43.1
45 40 35 30
100 88
17.1
25 20 15
50
0
15 2.9
24 4.7
10 5 0
As per the data above, the mainstream of the respondents 222 (43.10%) consider lack of
guidance regarding bank loan procedure as a main responsible factor. 166 (32.20%) of
respondents believe this factor responsible in some degree. According to 88 (17.10%)
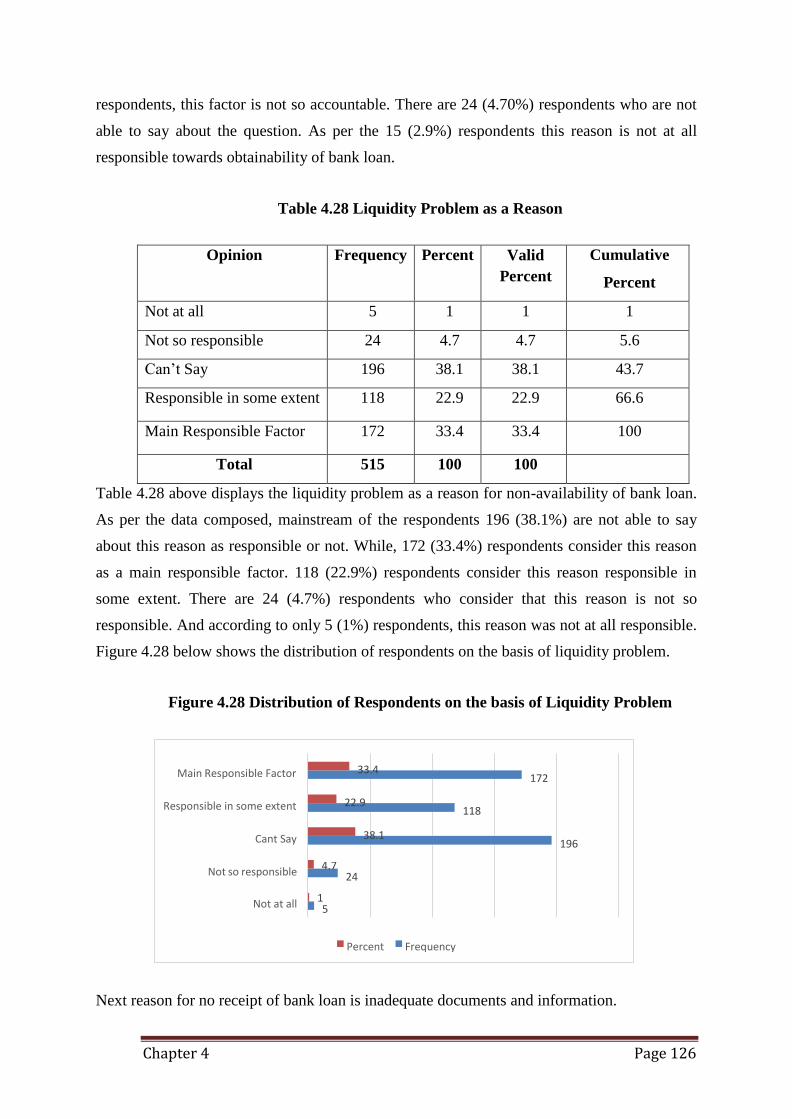
Chapter 4 Page 126
Main Responsible Factor 33.4 172
Responsible in some extent 22.9 118
Cant Say 38.1 196
Not so responsible
Not at all
4.7 24
1 5
Percent Frequency
respondents, this factor is not so accountable. There are 24 (4.70%) respondents who are not
able to say about the question. As per the 15 (2.9%) respondents this reason is not at all
responsible towards obtainability of bank loan.
Table 4.28 Liquidity Problem as a Reason
Opinion Frequency Percent Valid
Percent
Cumulative
Percent
Not at all 5 1 1 1
Not so responsible 24 4.7 4.7 5.6
Can’t Say 196 38.1 38.1 43.7
Responsible in some extent 118 22.9 22.9 66.6
Main Responsible Factor 172 33.4 33.4 100
Total 515 100 100
Table 4.28 above displays the liquidity problem as a reason for non-availability of bank loan.
As per the data composed, mainstream of the respondents 196 (38.1%) are not able to say
about this reason as responsible or not. While, 172 (33.4%) respondents consider this reason
as a main responsible factor. 118 (22.9%) respondents consider this reason responsible in
some extent. There are 24 (4.7%) respondents who consider that this reason is not so
responsible. And according to only 5 (1%) respondents, this reason was not at all responsible.
Figure 4.28 below shows the distribution of respondents on the basis of liquidity problem.
Figure 4.28 Distribution of Respondents on the basis of Liquidity Problem
Next reason for no receipt of bank loan is inadequate documents and information.
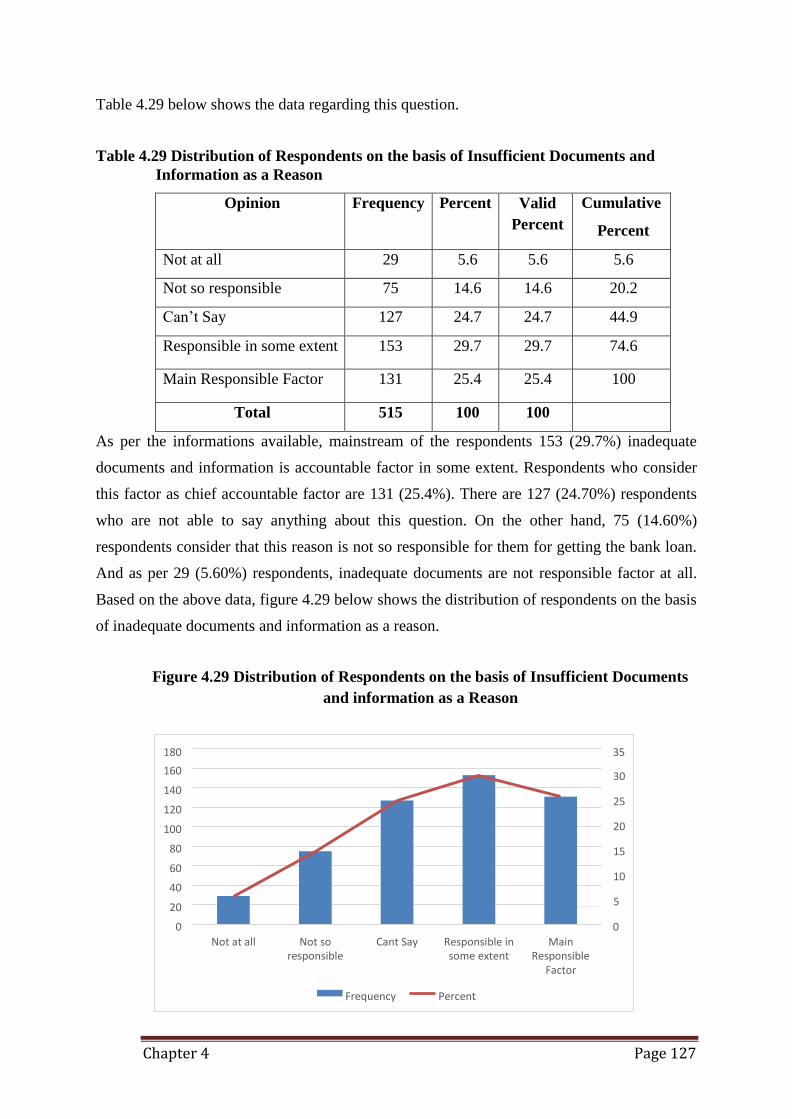
Chapter 4 Page 127
180
160
140
120
100
80
60
40
20
0
35
30
25
20
15
10
5
0
Not at all Not so Cant Say Responsible in Main responsible some extent Responsible
Factor
Frequency Percent
Table 4.29 below shows the data regarding this question.
Table 4.29 Distribution of Respondents on the basis of Insufficient Documents and
Information as a Reason
Opinion Frequency Percent Valid
Percent
Cumulative
Percent
Not at all 29 5.6 5.6 5.6
Not so responsible 75 14.6 14.6 20.2
Can’t Say 127 24.7 24.7 44.9
Responsible in some extent 153 29.7 29.7 74.6
Main Responsible Factor 131 25.4 25.4 100
Total 515 100 100
As per the informations available, mainstream of the respondents 153 (29.7%) inadequate
documents and information is accountable factor in some extent. Respondents who consider
this factor as chief accountable factor are 131 (25.4%). There are 127 (24.70%) respondents
who are not able to say anything about this question. On the other hand, 75 (14.60%)
respondents consider that this reason is not so responsible for them for getting the bank loan.
And as per 29 (5.60%) respondents, inadequate documents are not responsible factor at all.
Based on the above data, figure 4.29 below shows the distribution of respondents on the basis
of inadequate documents and information as a reason.
Figure 4.29 Distribution of Respondents on the basis of Insufficient Documents
and information as a Reason
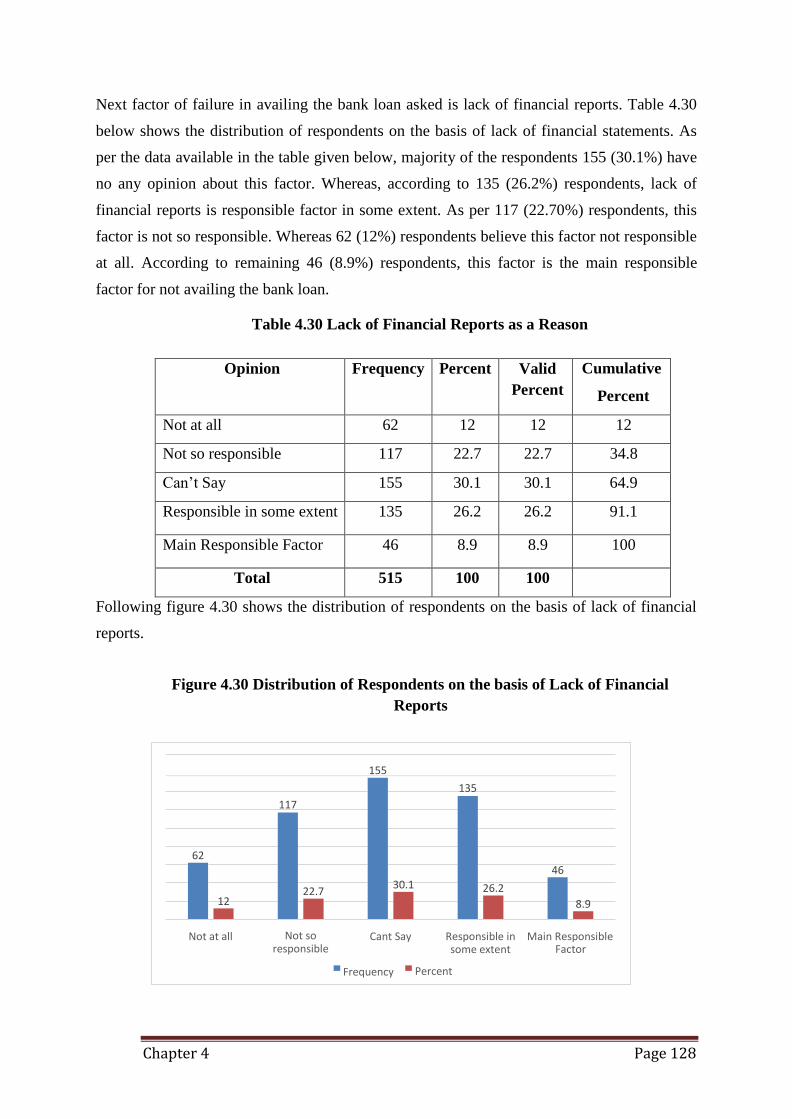
Chapter 4 Page 128
155
135
117
62 46
22.7 30.1 26.2
12 8.9
Not at all Not so responsible
Cant Say Responsible in Main Responsible
Frequency
some extent
Percent
Factor
Next factor of failure in availing the bank loan asked is lack of financial reports. Table 4.30
below shows the distribution of respondents on the basis of lack of financial statements. As
per the data available in the table given below, majority of the respondents 155 (30.1%) have
no any opinion about this factor. Whereas, according to 135 (26.2%) respondents, lack of
financial reports is responsible factor in some extent. As per 117 (22.70%) respondents, this
factor is not so responsible. Whereas 62 (12%) respondents believe this factor not responsible
at all. According to remaining 46 (8.9%) respondents, this factor is the main responsible
factor for not availing the bank loan.
Table 4.30 Lack of Financial Reports as a Reason
Opinion Frequency Percent Valid
Percent
Cumulative
Percent
Not at all 62 12 12 12
Not so responsible 117 22.7 22.7 34.8
Can’t Say 155 30.1 30.1 64.9
Responsible in some extent 135 26.2 26.2 91.1
Main Responsible Factor 46 8.9 8.9 100
Total 515 100 100
Following figure 4.30 shows the distribution of respondents on the basis of lack of financial
reports.
Figure 4.30 Distribution of Respondents on the basis of Lack of Financial
Reports
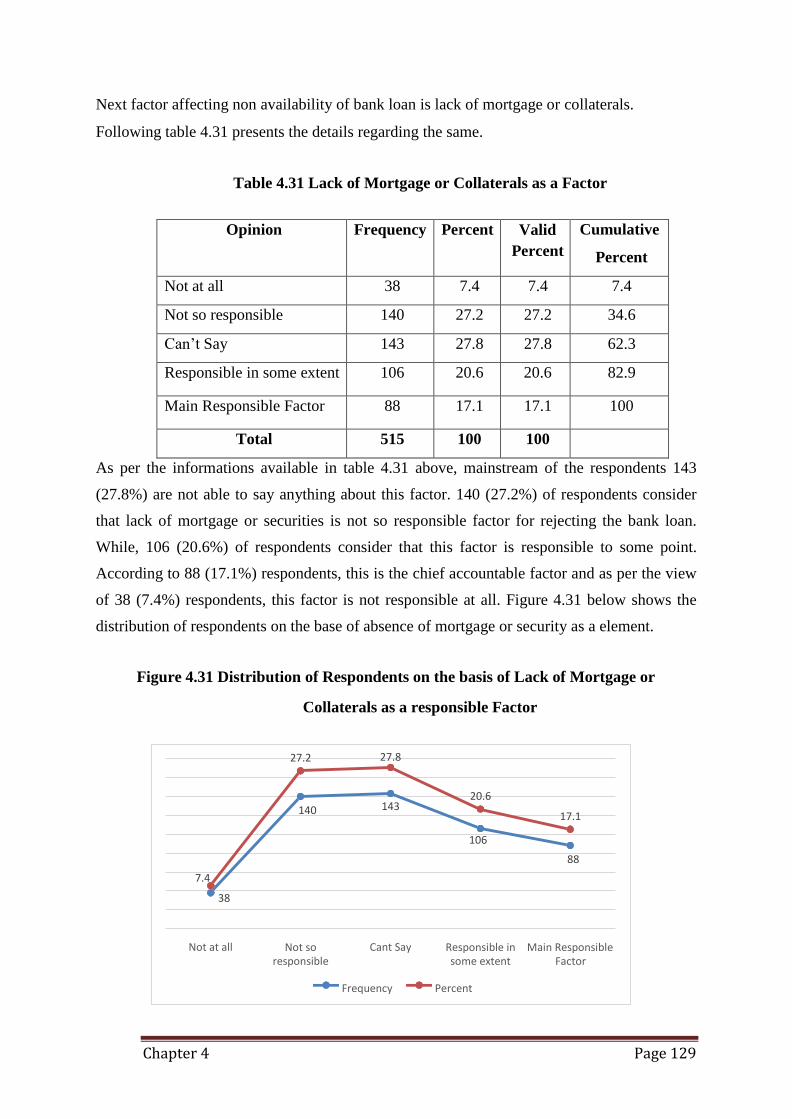
Chapter 4 Page 129
27.2 27.8
20.6 140 143
17.1
106
88
7.4
38
Not at all Not so responsible
Cant Say Responsible in Main Responsible some extent Factor
Frequency Percent
Next factor affecting non availability of bank loan is lack of mortgage or collaterals.
Following table 4.31 presents the details regarding the same.
Table 4.31 Lack of Mortgage or Collaterals as a Factor
Opinion Frequency Percent Valid
Percent
Cumulative
Percent
Not at all 38 7.4 7.4 7.4
Not so responsible 140 27.2 27.2 34.6
Can’t Say 143 27.8 27.8 62.3
Responsible in some extent 106 20.6 20.6 82.9
Main Responsible Factor 88 17.1 17.1 100
Total 515 100 100
As per the informations available in table 4.31 above, mainstream of the respondents 143
(27.8%) are not able to say anything about this factor. 140 (27.2%) of respondents consider
that lack of mortgage or securities is not so responsible factor for rejecting the bank loan.
While, 106 (20.6%) of respondents consider that this factor is responsible to some point.
According to 88 (17.1%) respondents, this is the chief accountable factor and as per the view
of 38 (7.4%) respondents, this factor is not responsible at all. Figure 4.31 below shows the
distribution of respondents on the base of absence of mortgage or security as a element.
Figure 4.31 Distribution of Respondents on the basis of Lack of Mortgage or
Collaterals as a responsible Factor
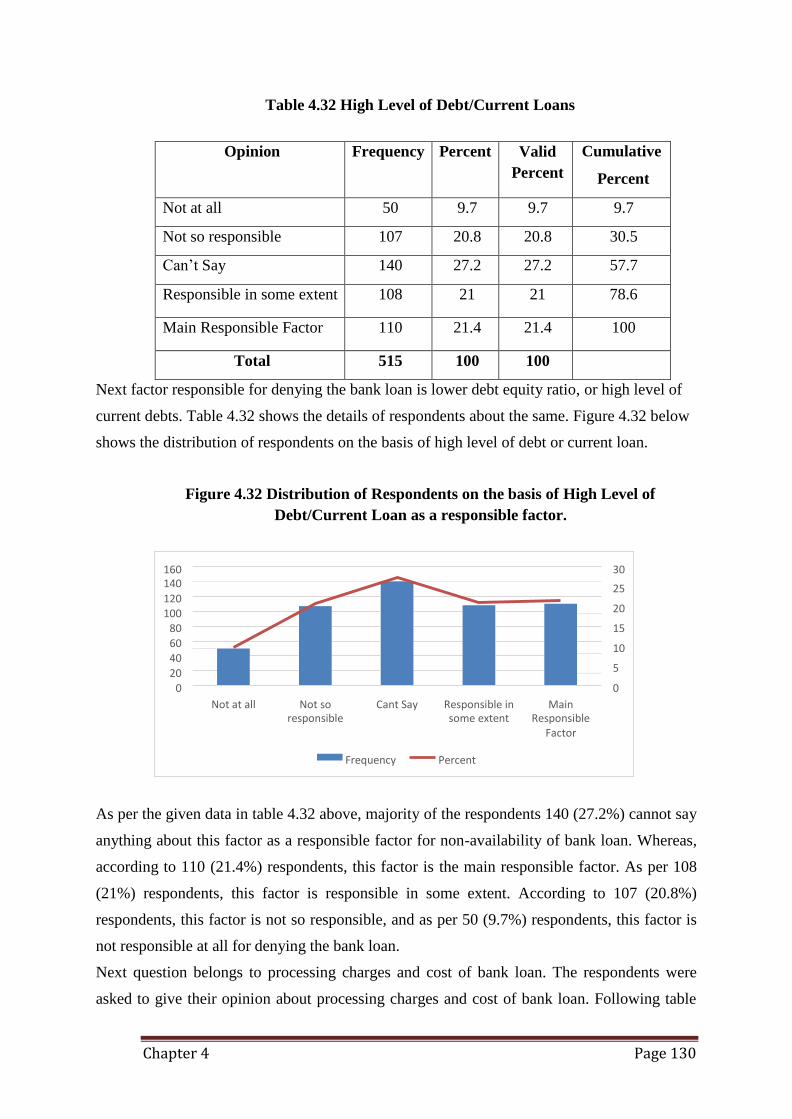
Chapter 4 Page 130
160 140
120 100
80
60 40
20
0
30
25
20
15
10
5
0
Not at all Not so Cant Say Responsible in Main responsible some extent Responsible
Factor
Frequency Percent
Table 4.32 High Level of Debt/Current Loans
Opinion Frequency Percent Valid
Percent
Cumulative
Percent
Not at all 50 9.7 9.7 9.7
Not so responsible 107 20.8 20.8 30.5
Can’t Say 140 27.2 27.2 57.7
Responsible in some extent 108 21 21 78.6
Main Responsible Factor 110 21.4 21.4 100
Total 515 100 100
Next factor responsible for denying the bank loan is lower debt equity ratio, or high level of
current debts. Table 4.32 shows the details of respondents about the same. Figure 4.32 below
shows the distribution of respondents on the basis of high level of debt or current loan.
Figure 4.32 Distribution of Respondents on the basis of High Level of
Debt/Current Loan as a responsible factor.
As per the given data in table 4.32 above, majority of the respondents 140 (27.2%) cannot say
anything about this factor as a responsible factor for non-availability of bank loan. Whereas,
according to 110 (21.4%) respondents, this factor is the main responsible factor. As per 108
(21%) respondents, this factor is responsible in some extent. According to 107 (20.8%)
respondents, this factor is not so responsible, and as per 50 (9.7%) respondents, this factor is
not responsible at all for denying the bank loan.
Next question belongs to processing charges and cost of bank loan. The respondents were
asked to give their opinion about processing charges and cost of bank loan. Following table
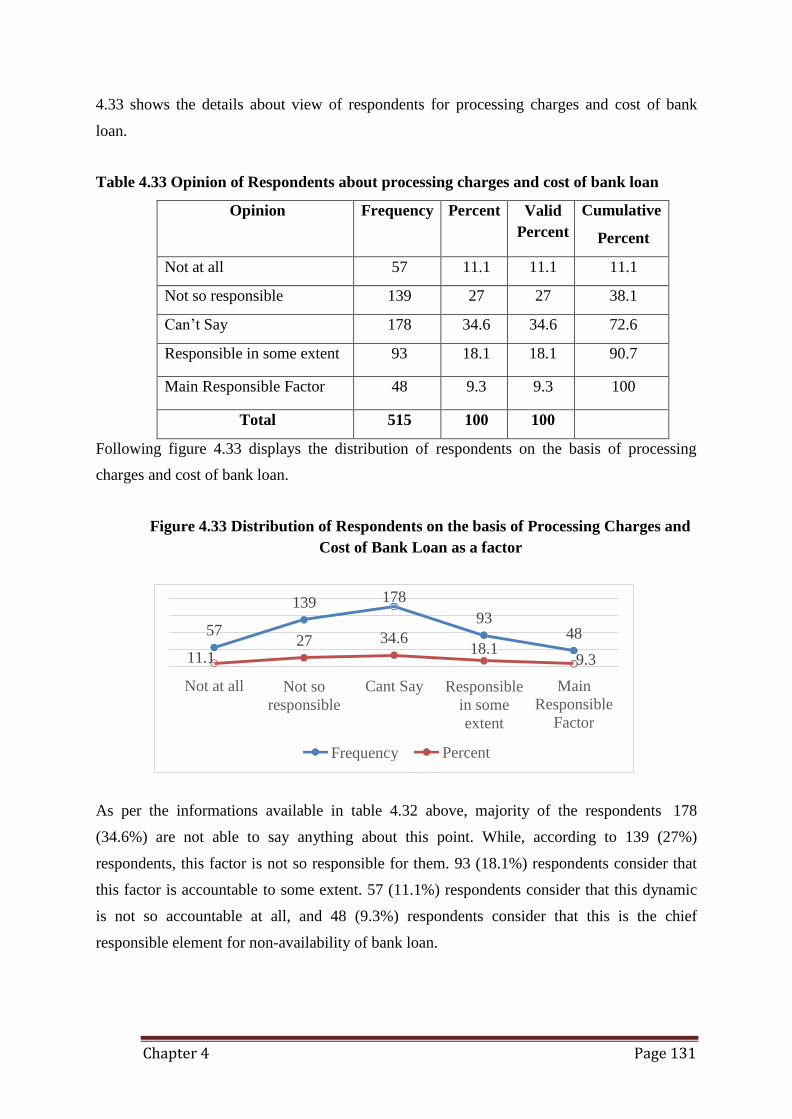
Chapter 4 Page 131
139 178
57
11.1
Not at all
27 34.6
93
18.1
Not so
responsible
Cant Say
48
9.3
Main
Responsible
Factor
Frequency
Responsible
in some
extent
Percent
4.33 shows the details about view of respondents for processing charges and cost of bank
loan.
Table 4.33 Opinion of Respondents about processing charges and cost of bank loan
Opinion Frequency Percent Valid
Percent
Cumulative
Percent
Not at all 57 11.1 11.1 11.1
Not so responsible 139 27 27 38.1
Can’t Say 178 34.6 34.6 72.6
Responsible in some extent 93 18.1 18.1 90.7
Main Responsible Factor 48 9.3 9.3 100
Total 515 100 100
Following figure 4.33 displays the distribution of respondents on the basis of processing
charges and cost of bank loan.
Figure 4.33 Distribution of Respondents on the basis of Processing Charges and
Cost of Bank Loan as a factor
As per the informations available in table 4.32 above, majority of the respondents 178
(34.6%) are not able to say anything about this point. While, according to 139 (27%)
respondents, this factor is not so responsible for them. 93 (18.1%) respondents consider that
this factor is accountable to some extent. 57 (11.1%) respondents consider that this dynamic
is not so accountable at all, and 48 (9.3%) respondents consider that this is the chief
responsible element for non-availability of bank loan.
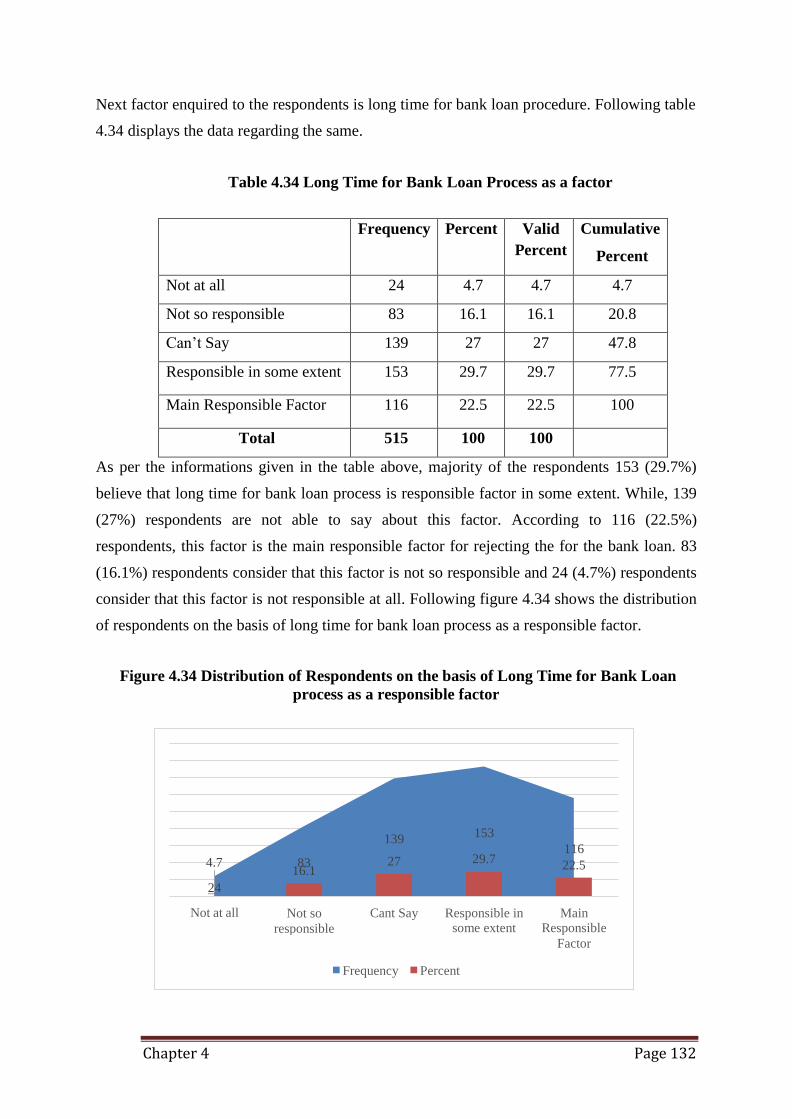
Chapter 4 Page 132
4.7
24
Not at all
16.1 83
139
27
153
29.7 116
22.5
Not so
responsible
Cant Say Responsible in Main some extent Responsible
Factor
Frequency Percent
Next factor enquired to the respondents is long time for bank loan procedure. Following table
4.34 displays the data regarding the same.
Table 4.34 Long Time for Bank Loan Process as a factor
Frequency Percent Valid
Percent
Cumulative
Percent
Not at all 24 4.7 4.7 4.7
Not so responsible 83 16.1 16.1 20.8
Can’t Say 139 27 27 47.8
Responsible in some extent 153 29.7 29.7 77.5
Main Responsible Factor 116 22.5 22.5 100
Total 515 100 100
As per the informations given in the table above, majority of the respondents 153 (29.7%)
believe that long time for bank loan process is responsible factor in some extent. While, 139
(27%) respondents are not able to say about this factor. According to 116 (22.5%)
respondents, this factor is the main responsible factor for rejecting the for the bank loan. 83
(16.1%) respondents consider that this factor is not so responsible and 24 (4.7%) respondents
consider that this factor is not responsible at all. Following figure 4.34 shows the distribution
of respondents on the basis of long time for bank loan process as a responsible factor.
Figure 4.34 Distribution of Respondents on the basis of Long Time for Bank Loan
process as a responsible factor
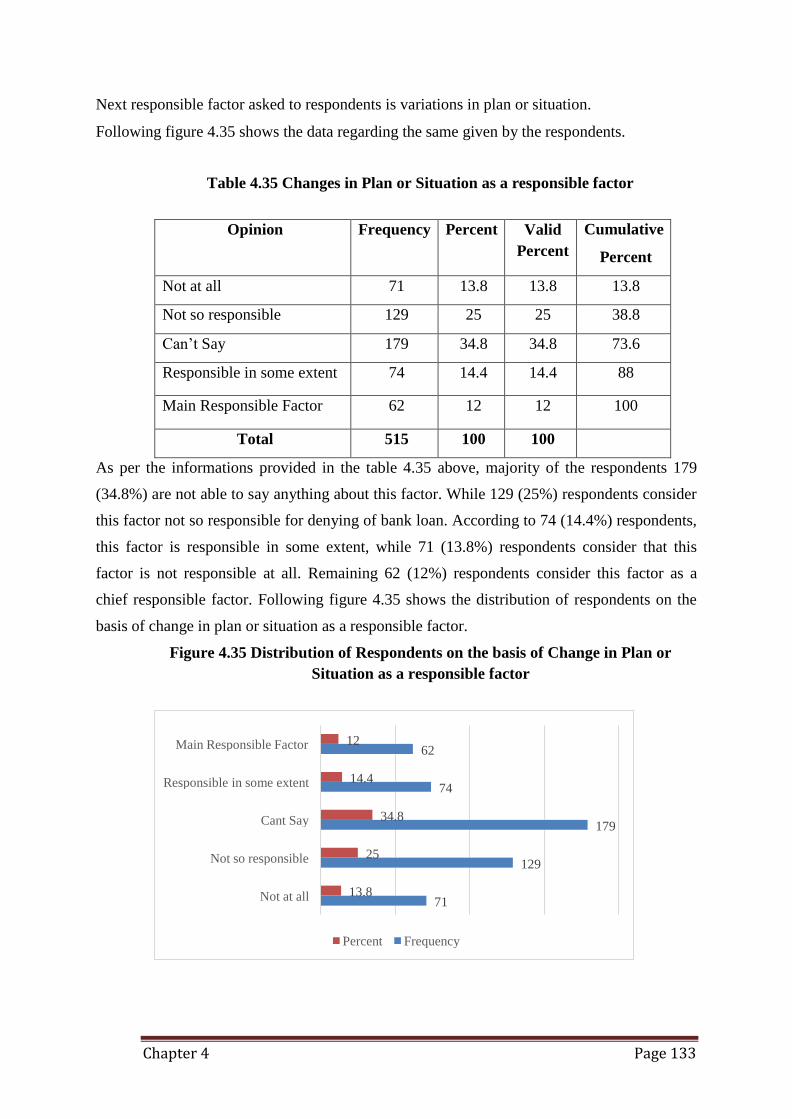
Chapter 4 Page 133
Main Responsible Factor 12 62
Responsible in some extent 14.4 74
Cant Say 34.8 179
Not so responsible 25 129
Not at all 13.8 71
Percent Frequency
Next responsible factor asked to respondents is variations in plan or situation.
Following figure 4.35 shows the data regarding the same given by the respondents.
Table 4.35 Changes in Plan or Situation as a responsible factor
Opinion Frequency Percent Valid
Percent
Cumulative
Percent
Not at all 71 13.8 13.8 13.8
Not so responsible 129 25 25 38.8
Can’t Say 179 34.8 34.8 73.6
Responsible in some extent 74 14.4 14.4 88
Main Responsible Factor 62 12 12 100
Total 515 100 100
As per the informations provided in the table 4.35 above, majority of the respondents 179
(34.8%) are not able to say anything about this factor. While 129 (25%) respondents consider
this factor not so responsible for denying of bank loan. According to 74 (14.4%) respondents,
this factor is responsible in some extent, while 71 (13.8%) respondents consider that this
factor is not responsible at all. Remaining 62 (12%) respondents consider this factor as a
chief responsible factor. Following figure 4.35 shows the distribution of respondents on the
basis of change in plan or situation as a responsible factor.
Figure 4.35 Distribution of Respondents on the basis of Change in Plan or
Situation as a responsible factor
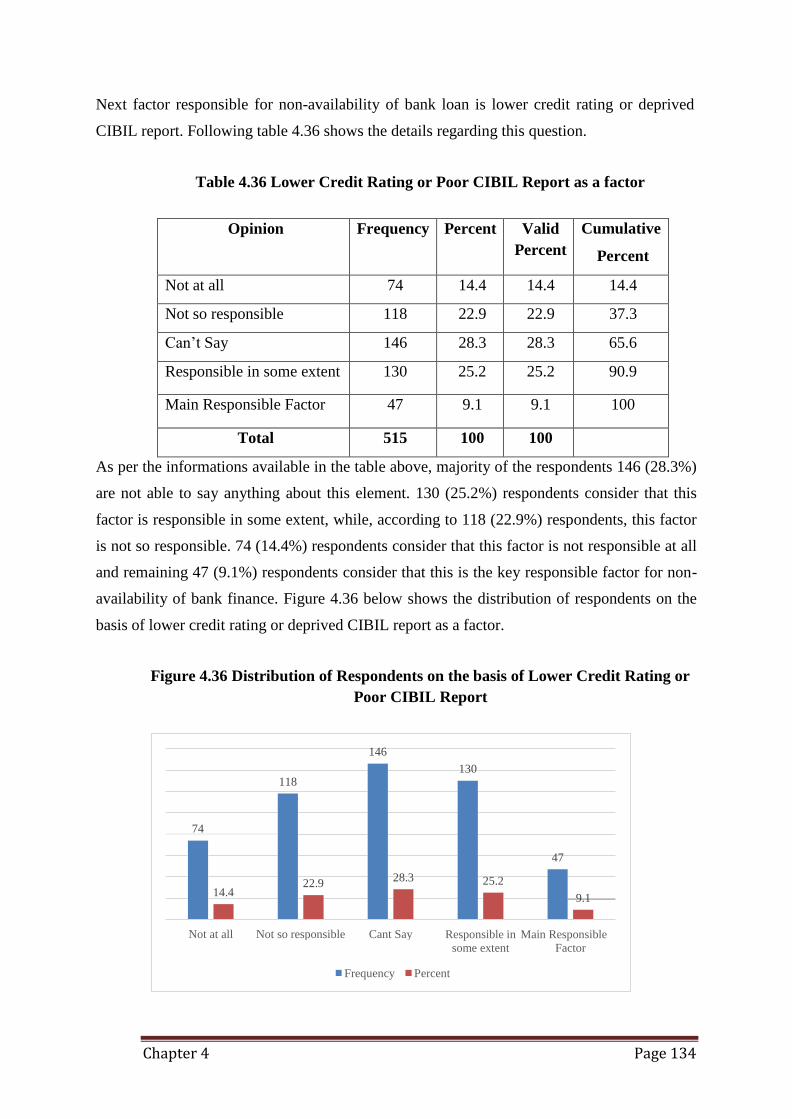
Chapter 4 Page 134
146
130 118
74
47
14.4 22.9
28.3 25.2
9.1
Not at all Not so responsible Cant Say Responsible in Main Responsible some extent Factor
Frequency Percent
Next factor responsible for non-availability of bank loan is lower credit rating or deprived
CIBIL report. Following table 4.36 shows the details regarding this question.
Table 4.36 Lower Credit Rating or Poor CIBIL Report as a factor
Opinion Frequency Percent Valid
Percent
Cumulative
Percent
Not at all 74 14.4 14.4 14.4
Not so responsible 118 22.9 22.9 37.3
Can’t Say 146 28.3 28.3 65.6
Responsible in some extent 130 25.2 25.2 90.9
Main Responsible Factor 47 9.1 9.1 100
Total 515 100 100
As per the informations available in the table above, majority of the respondents 146 (28.3%)
are not able to say anything about this element. 130 (25.2%) respondents consider that this
factor is responsible in some extent, while, according to 118 (22.9%) respondents, this factor
is not so responsible. 74 (14.4%) respondents consider that this factor is not responsible at all
and remaining 47 (9.1%) respondents consider that this is the key responsible factor for non-
availability of bank finance. Figure 4.36 below shows the distribution of respondents on the
basis of lower credit rating or deprived CIBIL report as a factor.
Figure 4.36 Distribution of Respondents on the basis of Lower Credit Rating or
Poor CIBIL Report
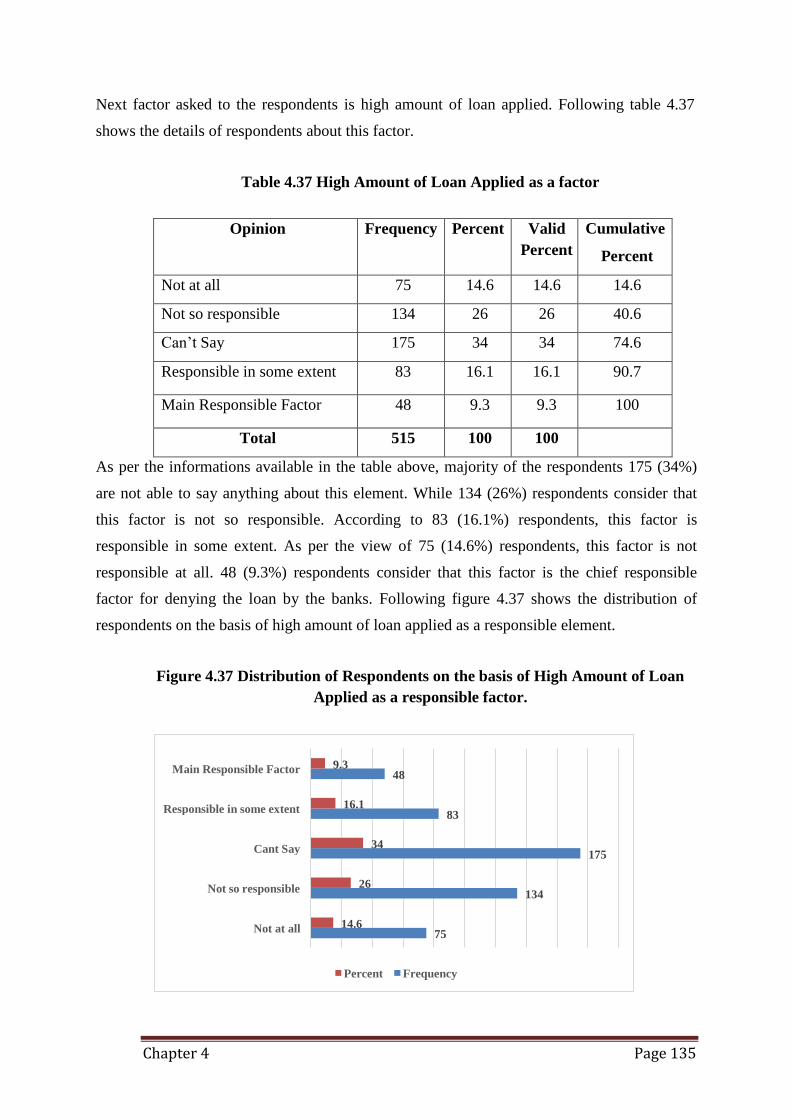
Chapter 4 Page 135
Main Responsible Factor 9.3 48
Responsible in some extent 16.1 83
Cant Say 34 175
Not so responsible 26 134
Not at all 14.6 75
Percent Frequency
Next factor asked to the respondents is high amount of loan applied. Following table 4.37
shows the details of respondents about this factor.
Table 4.37 High Amount of Loan Applied as a factor
Opinion Frequency Percent Valid
Percent
Cumulative
Percent
Not at all 75 14.6 14.6 14.6
Not so responsible 134 26 26 40.6
Can’t Say 175 34 34 74.6
Responsible in some extent 83 16.1 16.1 90.7
Main Responsible Factor 48 9.3 9.3 100
Total 515 100 100
As per the informations available in the table above, majority of the respondents 175 (34%)
are not able to say anything about this element. While 134 (26%) respondents consider that
this factor is not so responsible. According to 83 (16.1%) respondents, this factor is
responsible in some extent. As per the view of 75 (14.6%) respondents, this factor is not
responsible at all. 48 (9.3%) respondents consider that this factor is the chief responsible
factor for denying the loan by the banks. Following figure 4.37 shows the distribution of
respondents on the basis of high amount of loan applied as a responsible element.
Figure 4.37 Distribution of Respondents on the basis of High Amount of Loan
Applied as a responsible factor.
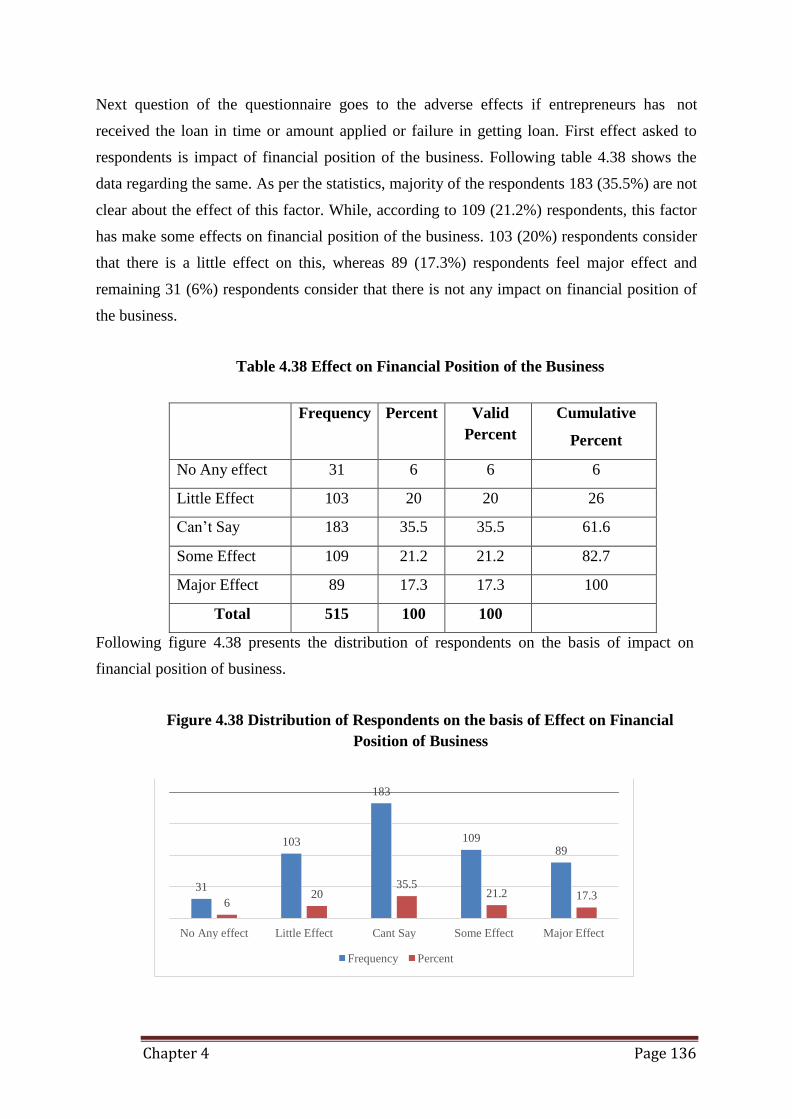
Chapter 4 Page 136
183
103 109 89
31
6 20
35.5 21.2 17.3
No Any effect Little Effect Cant Say Some Effect Major Effect
Frequency Percent
Next question of the questionnaire goes to the adverse effects if entrepreneurs has not
received the loan in time or amount applied or failure in getting loan. First effect asked to
respondents is impact of financial position of the business. Following table 4.38 shows the
data regarding the same. As per the statistics, majority of the respondents 183 (35.5%) are not
clear about the effect of this factor. While, according to 109 (21.2%) respondents, this factor
has make some effects on financial position of the business. 103 (20%) respondents consider
that there is a little effect on this, whereas 89 (17.3%) respondents feel major effect and
remaining 31 (6%) respondents consider that there is not any impact on financial position of
the business.
Table 4.38 Effect on Financial Position of the Business
Frequency Percent Valid
Percent
Cumulative
Percent
No Any effect 31 6 6 6
Little Effect 103 20 20 26
Can’t Say 183 35.5 35.5 61.6
Some Effect 109 21.2 21.2 82.7
Major Effect 89 17.3 17.3 100
Total 515 100 100
Following figure 4.38 presents the distribution of respondents on the basis of impact on
financial position of business.
Figure 4.38 Distribution of Respondents on the basis of Effect on Financial
Position of Business
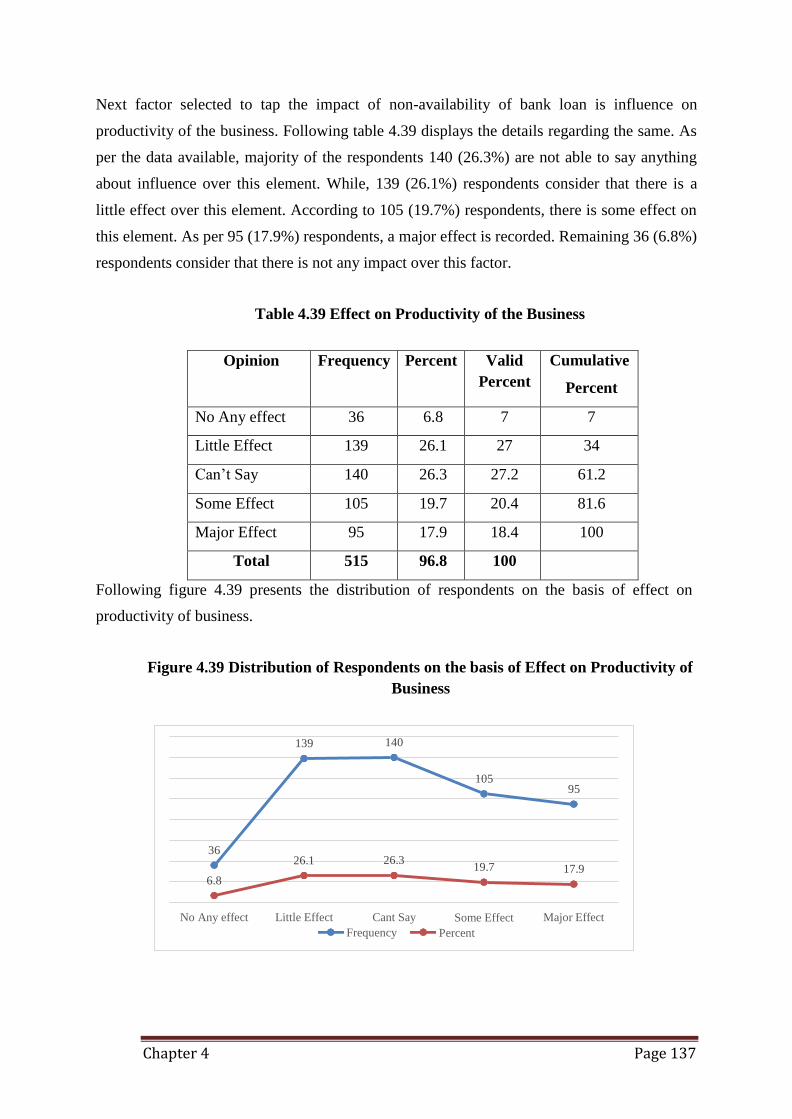
Chapter 4 Page 137
139 140
105 95
36 26.1 26.3
19.7 17.9 6.8
No Any effect Little Effect Cant Say
Frequency
Some Effect
Percent
Major Effect
Next factor selected to tap the impact of non-availability of bank loan is influence on
productivity of the business. Following table 4.39 displays the details regarding the same. As
per the data available, majority of the respondents 140 (26.3%) are not able to say anything
about influence over this element. While, 139 (26.1%) respondents consider that there is a
little effect over this element. According to 105 (19.7%) respondents, there is some effect on
this element. As per 95 (17.9%) respondents, a major effect is recorded. Remaining 36 (6.8%)
respondents consider that there is not any impact over this factor.
Table 4.39 Effect on Productivity of the Business
Opinion Frequency Percent Valid
Percent
Cumulative
Percent
No Any effect 36 6.8 7 7
Little Effect 139 26.1 27 34
Can’t Say 140 26.3 27.2 61.2
Some Effect 105 19.7 20.4 81.6
Major Effect 95 17.9 18.4 100
Total 515 96.8 100
Following figure 4.39 presents the distribution of respondents on the basis of effect on
productivity of business.
Figure 4.39 Distribution of Respondents on the basis of Effect on Productivity of
Business
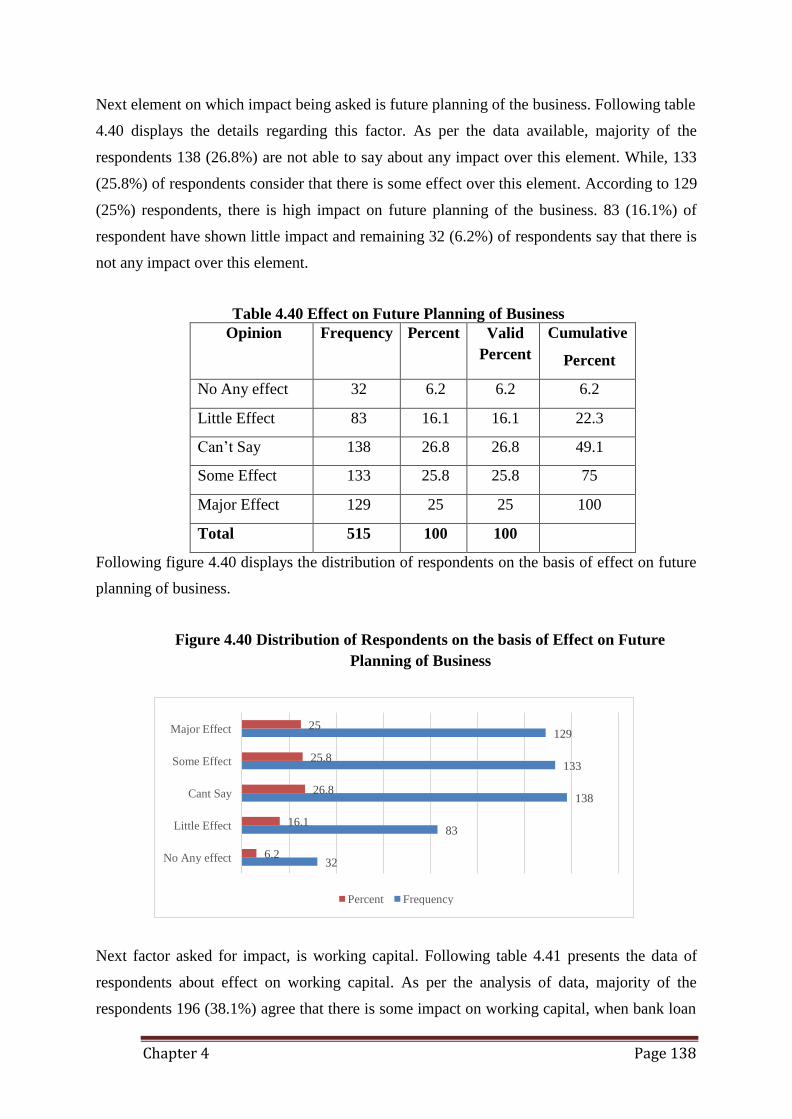
Chapter 4 Page 138
Major Effect 25 129
Some Effect 25.8 133
Cant Say 26.8 138
Little Effect 16.1 83
No Any effect 6.2 32
Percent Frequency
Next element on which impact being asked is future planning of the business. Following table
4.40 displays the details regarding this factor. As per the data available, majority of the
respondents 138 (26.8%) are not able to say about any impact over this element. While, 133
(25.8%) of respondents consider that there is some effect over this element. According to 129
(25%) respondents, there is high impact on future planning of the business. 83 (16.1%) of
respondent have shown little impact and remaining 32 (6.2%) of respondents say that there is
not any impact over this element.
Table 4.40 Effect on Future Planning of Business
Opinion Frequency Percent Valid
Percent
Cumulative
Percent
No Any effect 32 6.2 6.2 6.2
Little Effect 83 16.1 16.1 22.3
Can’t Say 138 26.8 26.8 49.1
Some Effect 133 25.8 25.8 75
Major Effect 129 25 25 100
Total 515 100 100
Following figure 4.40 displays the distribution of respondents on the basis of effect on future
planning of business.
Figure 4.40 Distribution of Respondents on the basis of Effect on Future
Planning of Business
Next factor asked for impact, is working capital. Following table 4.41 presents the data of
respondents about effect on working capital. As per the analysis of data, majority of the
respondents 196 (38.1%) agree that there is some impact on working capital, when bank loan
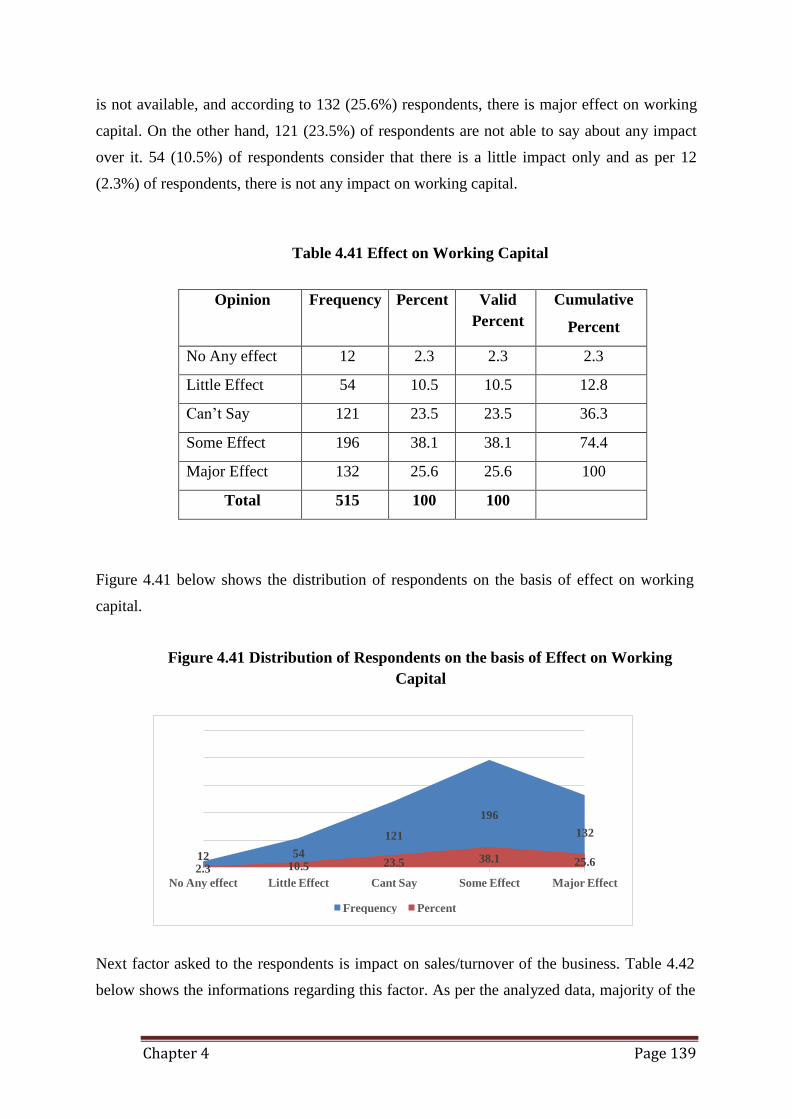
Chapter 4 Page 139
196
121 132
12 2.3
No Any effect
54 10.5
Little Effect
23.5
Cant Say
38.1
Some Effect
25.6
Major Effect
Frequency Percent
is not available, and according to 132 (25.6%) respondents, there is major effect on working
capital. On the other hand, 121 (23.5%) of respondents are not able to say about any impact
over it. 54 (10.5%) of respondents consider that there is a little impact only and as per 12
(2.3%) of respondents, there is not any impact on working capital.
Table 4.41 Effect on Working Capital
Opinion Frequency Percent Valid
Percent
Cumulative
Percent
No Any effect 12 2.3 2.3 2.3
Little Effect 54 10.5 10.5 12.8
Can’t Say 121 23.5 23.5 36.3
Some Effect 196 38.1 38.1 74.4
Major Effect 132 25.6 25.6 100
Total 515 100 100
Figure 4.41 below shows the distribution of respondents on the basis of effect on working
capital.
Figure 4.41 Distribution of Respondents on the basis of Effect on Working
Capital
Next factor asked to the respondents is impact on sales/turnover of the business. Table 4.42
below shows the informations regarding this factor. As per the analyzed data, majority of the
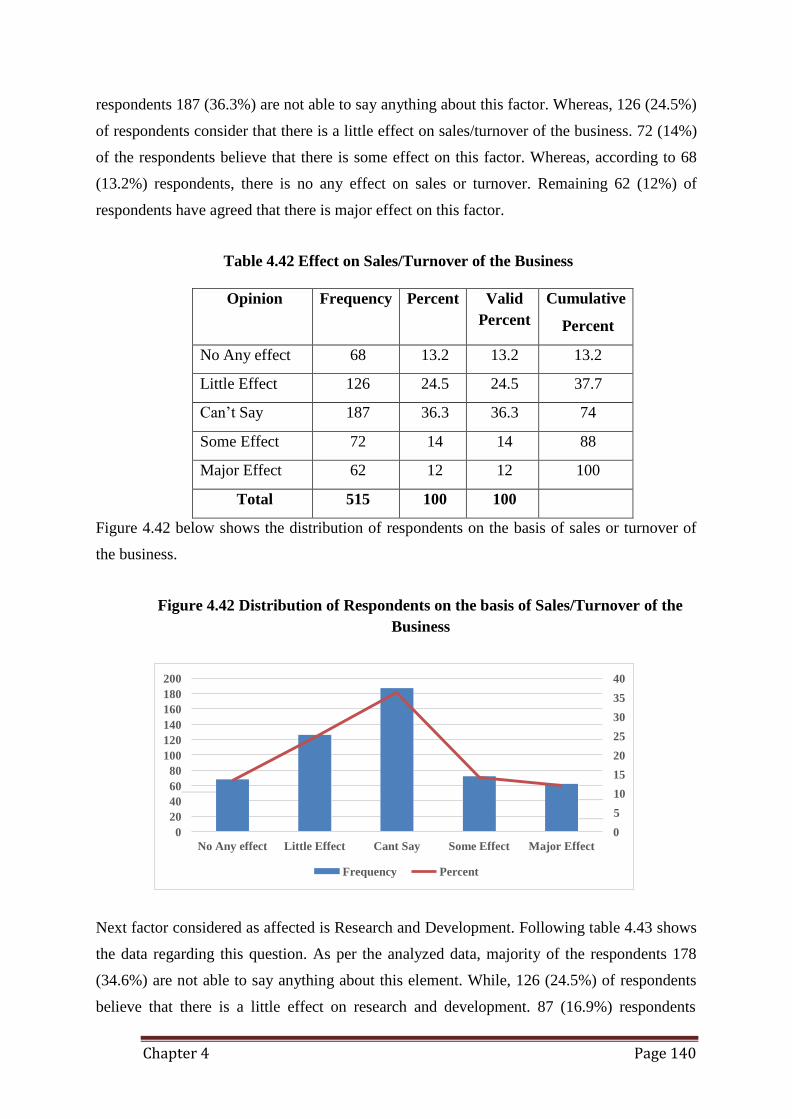
Chapter 4 Page 140
200
180
160
140
120
100
80
60
40
20
0
40
35
30
25
20
15
10
5
0
No Any effect Little Effect Cant Say Some Effect Major Effect
Frequency Percent
respondents 187 (36.3%) are not able to say anything about this factor. Whereas, 126 (24.5%)
of respondents consider that there is a little effect on sales/turnover of the business. 72 (14%)
of the respondents believe that there is some effect on this factor. Whereas, according to 68
(13.2%) respondents, there is no any effect on sales or turnover. Remaining 62 (12%) of
respondents have agreed that there is major effect on this factor.
Table 4.42 Effect on Sales/Turnover of the Business
Opinion Frequency Percent Valid
Percent
Cumulative
Percent
No Any effect 68 13.2 13.2 13.2
Little Effect 126 24.5 24.5 37.7
Can’t Say 187 36.3 36.3 74
Some Effect 72 14 14 88
Major Effect 62 12 12 100
Total 515 100 100
Figure 4.42 below shows the distribution of respondents on the basis of sales or turnover of
the business.
Figure 4.42 Distribution of Respondents on the basis of Sales/Turnover of the
Business
Next factor considered as affected is Research and Development. Following table 4.43 shows
the data regarding this question. As per the analyzed data, majority of the respondents 178
(34.6%) are not able to say anything about this element. While, 126 (24.5%) of respondents
believe that there is a little effect on research and development. 87 (16.9%) respondents
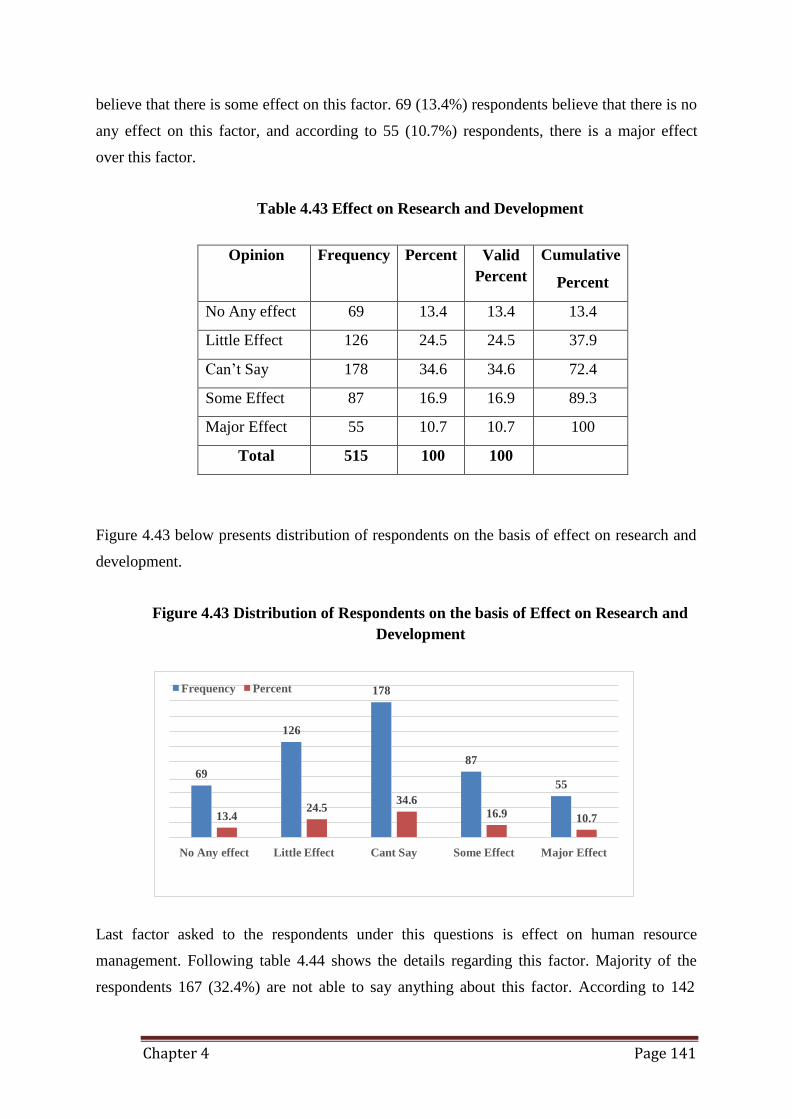
Chapter 4 Page 141
Frequency Percent 178
126
87
69 55
34.6
13.4 24.5
16.9 10.7
No Any effect Little Effect Cant Say Some Effect Major Effect
believe that there is some effect on this factor. 69 (13.4%) respondents believe that there is no
any effect on this factor, and according to 55 (10.7%) respondents, there is a major effect
over this factor.
Table 4.43 Effect on Research and Development
Opinion Frequency Percent Valid
Percent
Cumulative
Percent
No Any effect 69 13.4 13.4 13.4
Little Effect 126 24.5 24.5 37.9
Can’t Say 178 34.6 34.6 72.4
Some Effect 87 16.9 16.9 89.3
Major Effect 55 10.7 10.7 100
Total 515 100 100
Figure 4.43 below presents distribution of respondents on the basis of effect on research and
development.
Figure 4.43 Distribution of Respondents on the basis of Effect on Research and
Development
Last factor asked to the respondents under this questions is effect on human resource
management. Following table 4.44 shows the details regarding this factor. Majority of the
respondents 167 (32.4%) are not able to say anything about this factor. According to 142
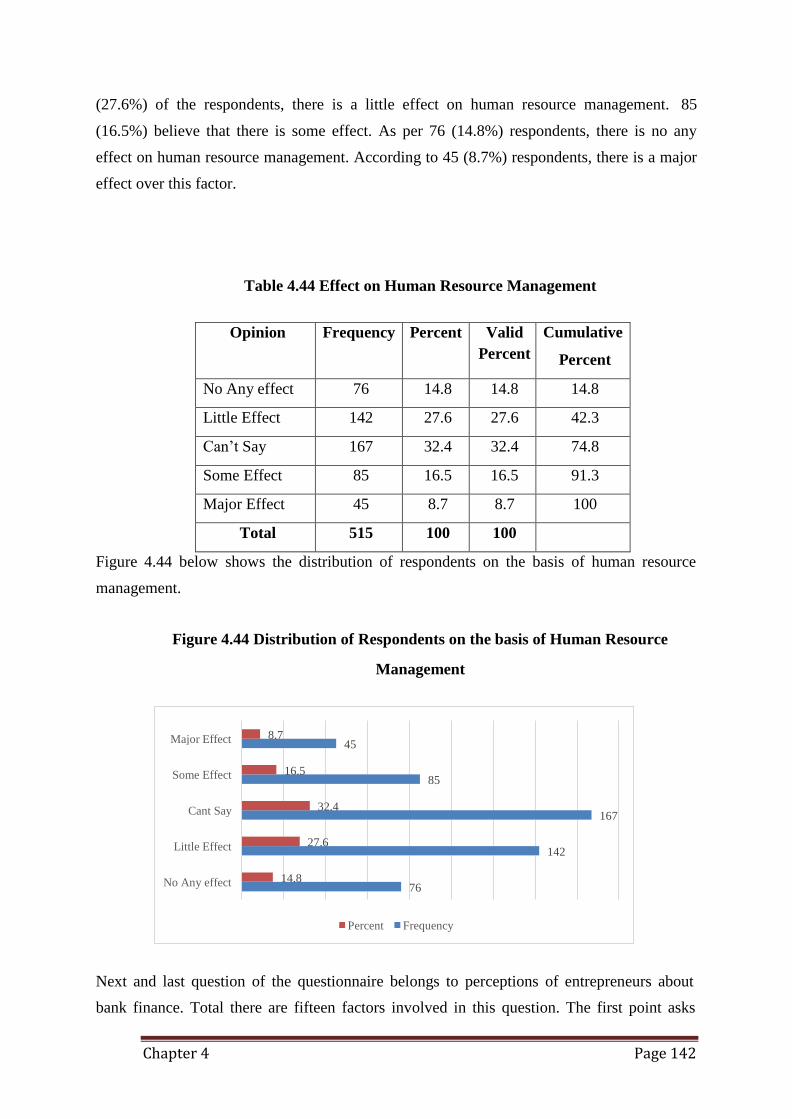
Chapter 4 Page 142
Major Effect 8.7 45
Some Effect 16.5 85
Cant Say 32.4 167
Little Effect 27.6 142
No Any effect 14.8 76
Percent Frequency
(27.6%) of the respondents, there is a little effect on human resource management. 85
(16.5%) believe that there is some effect. As per 76 (14.8%) respondents, there is no any
effect on human resource management. According to 45 (8.7%) respondents, there is a major
effect over this factor.
Table 4.44 Effect on Human Resource Management
Opinion Frequency Percent Valid
Percent
Cumulative
Percent
No Any effect 76 14.8 14.8 14.8
Little Effect 142 27.6 27.6 42.3
Can’t Say 167 32.4 32.4 74.8
Some Effect 85 16.5 16.5 91.3
Major Effect 45 8.7 8.7 100
Total 515 100 100
Figure 4.44 below shows the distribution of respondents on the basis of human resource
management.
Figure 4.44 Distribution of Respondents on the basis of Human Resource
Management
Next and last question of the questionnaire belongs to perceptions of entrepreneurs about
bank finance. Total there are fifteen factors involved in this question. The first point asks
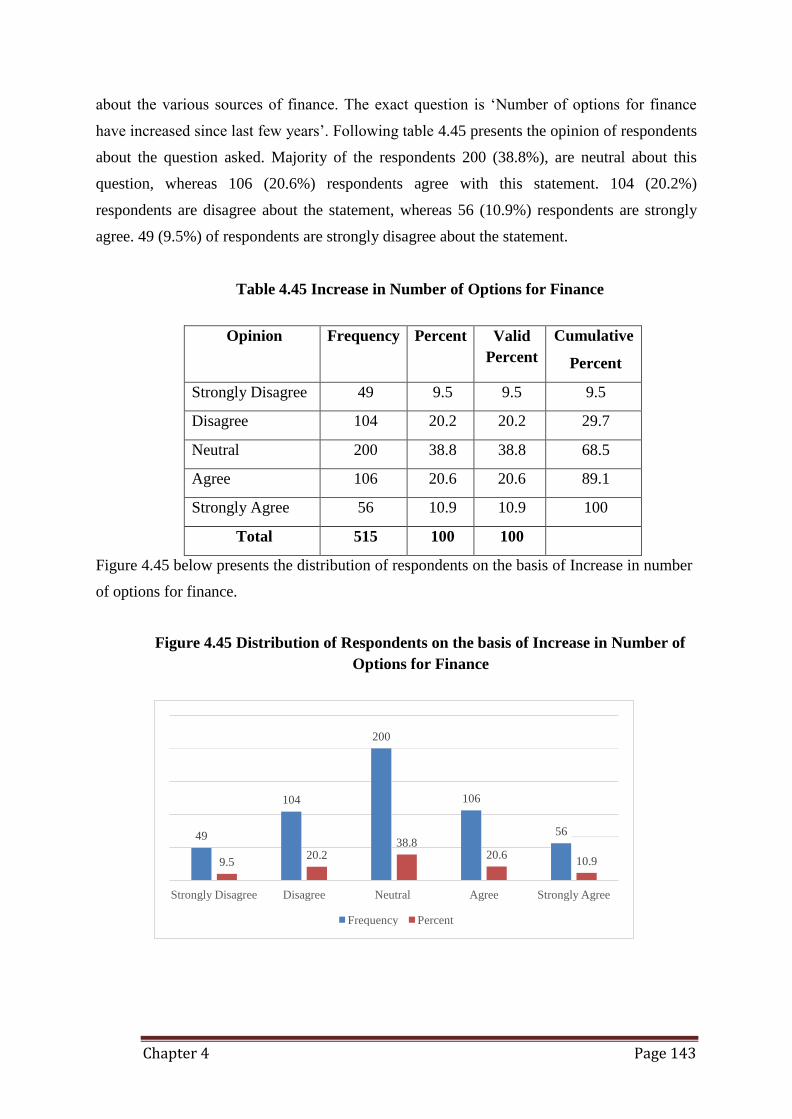
Chapter 4 Page 143
200
104 106
49 56 38.8
9.5 20.2 20.6
10.9
Strongly Disagree Disagree Neutral Agree Strongly Agree
Frequency Percent
about the various sources of finance. The exact question is ‘Number of options for finance
have increased since last few years’. Following table 4.45 presents the opinion of respondents
about the question asked. Majority of the respondents 200 (38.8%), are neutral about this
question, whereas 106 (20.6%) respondents agree with this statement. 104 (20.2%)
respondents are disagree about the statement, whereas 56 (10.9%) respondents are strongly
agree. 49 (9.5%) of respondents are strongly disagree about the statement.
Table 4.45 Increase in Number of Options for Finance
Opinion Frequency Percent Valid
Percent
Cumulative
Percent
Strongly Disagree 49 9.5 9.5 9.5
Disagree 104 20.2 20.2 29.7
Neutral 200 38.8 38.8 68.5
Agree 106 20.6 20.6 89.1
Strongly Agree 56 10.9 10.9 100
Total 515 100 100
Figure 4.45 below presents the distribution of respondents on the basis of Increase in number
of options for finance.
Figure 4.45 Distribution of Respondents on the basis of Increase in Number of
Options for Finance
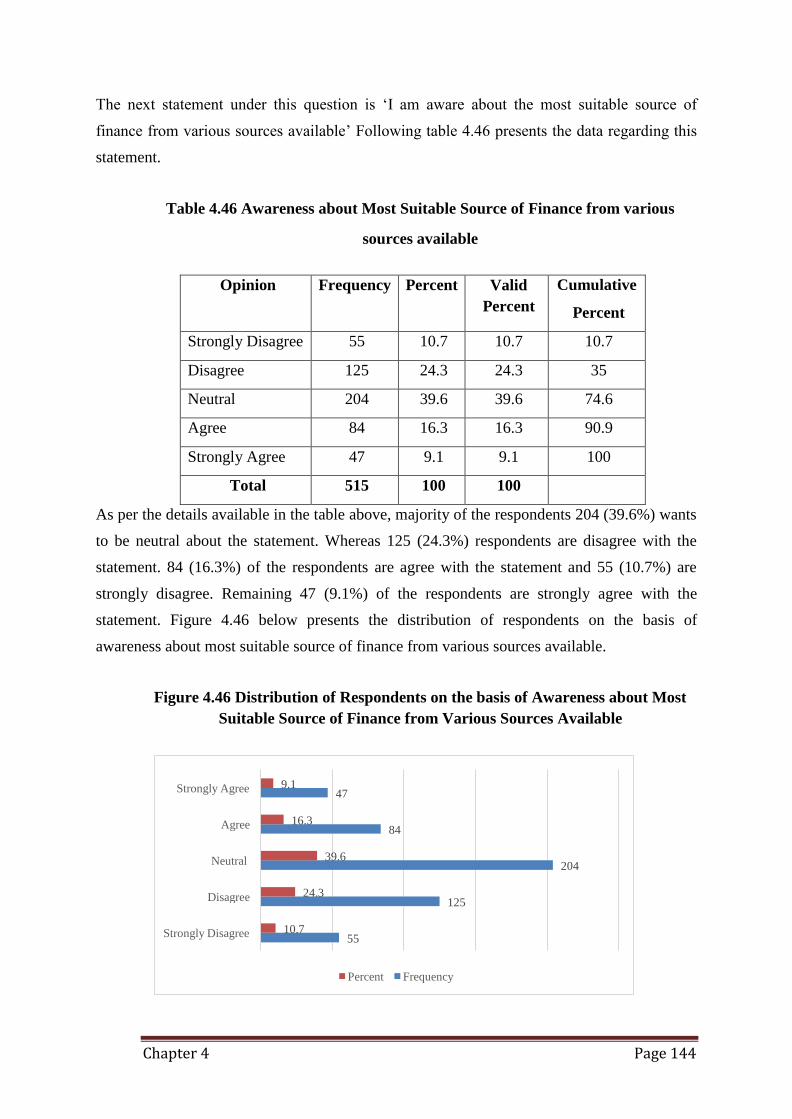
Chapter 4 Page 144
Strongly Agree 9.1 47
Agree 16.3 84
Neutral 39.6 204
Disagree 24.3 125
Strongly Disagree 10.7 55
Percent Frequency
The next statement under this question is ‘I am aware about the most suitable source of
finance from various sources available’ Following table 4.46 presents the data regarding this
statement.
Table 4.46 Awareness about Most Suitable Source of Finance from various
sources available
Opinion Frequency Percent Valid
Percent
Cumulative
Percent
Strongly Disagree 55 10.7 10.7 10.7
Disagree 125 24.3 24.3 35
Neutral 204 39.6 39.6 74.6
Agree 84 16.3 16.3 90.9
Strongly Agree 47 9.1 9.1 100
Total 515 100 100
As per the details available in the table above, majority of the respondents 204 (39.6%) wants
to be neutral about the statement. Whereas 125 (24.3%) respondents are disagree with the
statement. 84 (16.3%) of the respondents are agree with the statement and 55 (10.7%) are
strongly disagree. Remaining 47 (9.1%) of the respondents are strongly agree with the
statement. Figure 4.46 below presents the distribution of respondents on the basis of
awareness about most suitable source of finance from various sources available.
Figure 4.46 Distribution of Respondents on the basis of Awareness about Most
Suitable Source of Finance from Various Sources Available
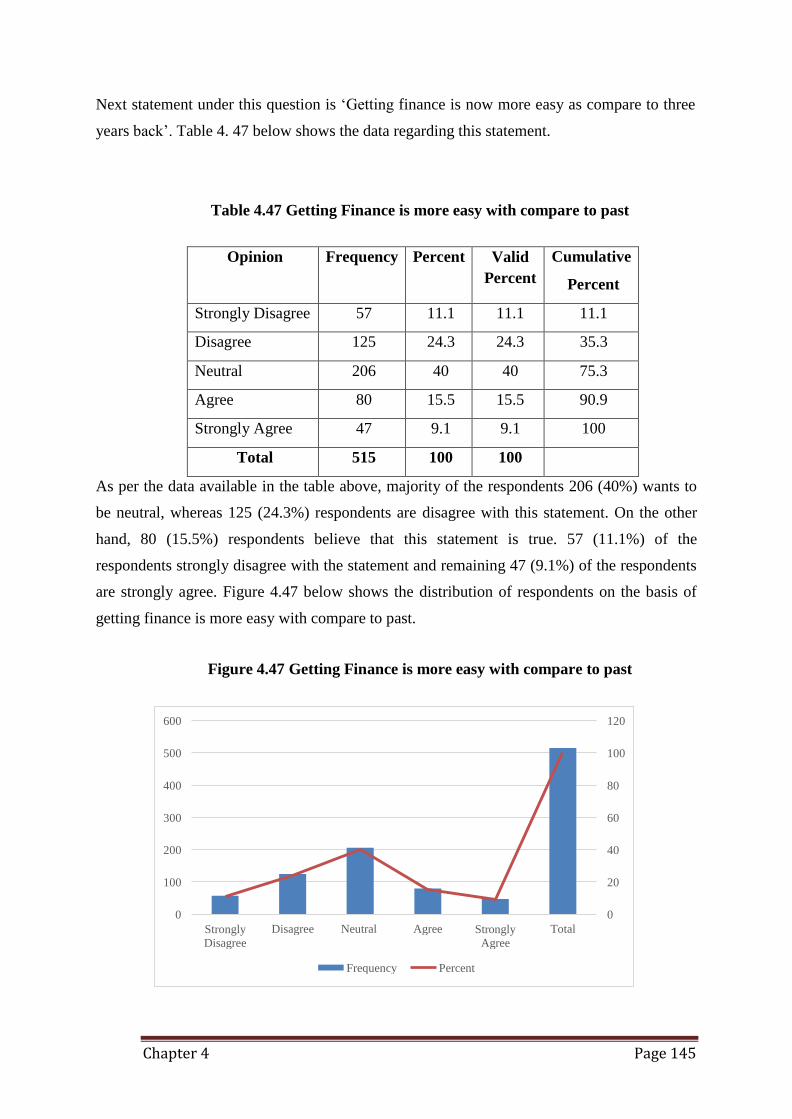
Chapter 4 Page 145
600 120
500 100
400 80
300 60
200 40
100 20
0 0
Strongly
Disagree
Disagree Neutral Agree Strongly
Agree
Total
Frequency Percent
Next statement under this question is ‘Getting finance is now more easy as compare to three
years back’. Table 4. 47 below shows the data regarding this statement.
Table 4.47 Getting Finance is more easy with compare to past
Opinion Frequency Percent Valid
Percent
Cumulative
Percent
Strongly Disagree 57 11.1 11.1 11.1
Disagree 125 24.3 24.3 35.3
Neutral 206 40 40 75.3
Agree 80 15.5 15.5 90.9
Strongly Agree 47 9.1 9.1 100
Total 515 100 100
As per the data available in the table above, majority of the respondents 206 (40%) wants to
be neutral, whereas 125 (24.3%) respondents are disagree with this statement. On the other
hand, 80 (15.5%) respondents believe that this statement is true. 57 (11.1%) of the
respondents strongly disagree with the statement and remaining 47 (9.1%) of the respondents
are strongly agree. Figure 4.47 below shows the distribution of respondents on the basis of
getting finance is more easy with compare to past.
Figure 4.47 Getting Finance is more easy with compare to past
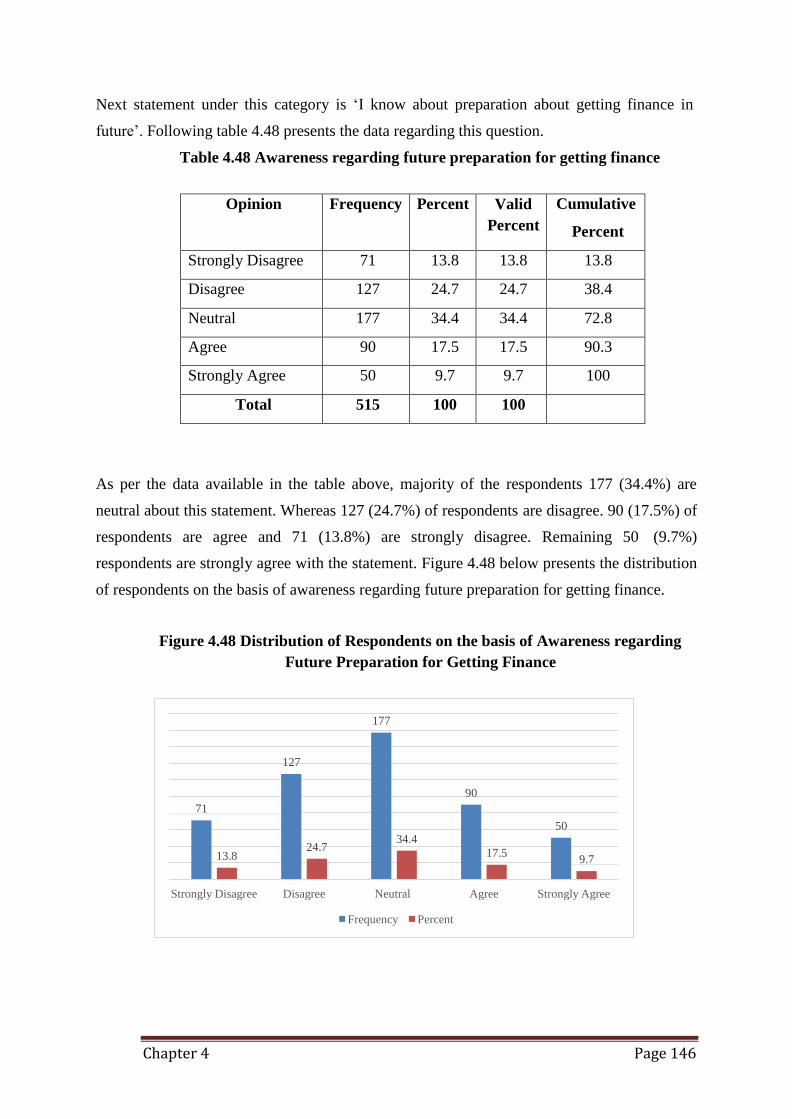
Chapter 4 Page 146
177
127
90
71
50
13.8 24.7
34.4
17.5 9.7
Strongly Disagree Disagree Neutral Agree Strongly Agree
Frequency Percent
Next statement under this category is ‘I know about preparation about getting finance in
future’. Following table 4.48 presents the data regarding this question.
Table 4.48 Awareness regarding future preparation for getting finance
Opinion Frequency Percent Valid
Percent
Cumulative
Percent
Strongly Disagree 71 13.8 13.8 13.8
Disagree 127 24.7 24.7 38.4
Neutral 177 34.4 34.4 72.8
Agree 90 17.5 17.5 90.3
Strongly Agree 50 9.7 9.7 100
Total 515 100 100
As per the data available in the table above, majority of the respondents 177 (34.4%) are
neutral about this statement. Whereas 127 (24.7%) of respondents are disagree. 90 (17.5%) of
respondents are agree and 71 (13.8%) are strongly disagree. Remaining 50 (9.7%)
respondents are strongly agree with the statement. Figure 4.48 below presents the distribution
of respondents on the basis of awareness regarding future preparation for getting finance.
Figure 4.48 Distribution of Respondents on the basis of Awareness regarding
Future Preparation for Getting Finance
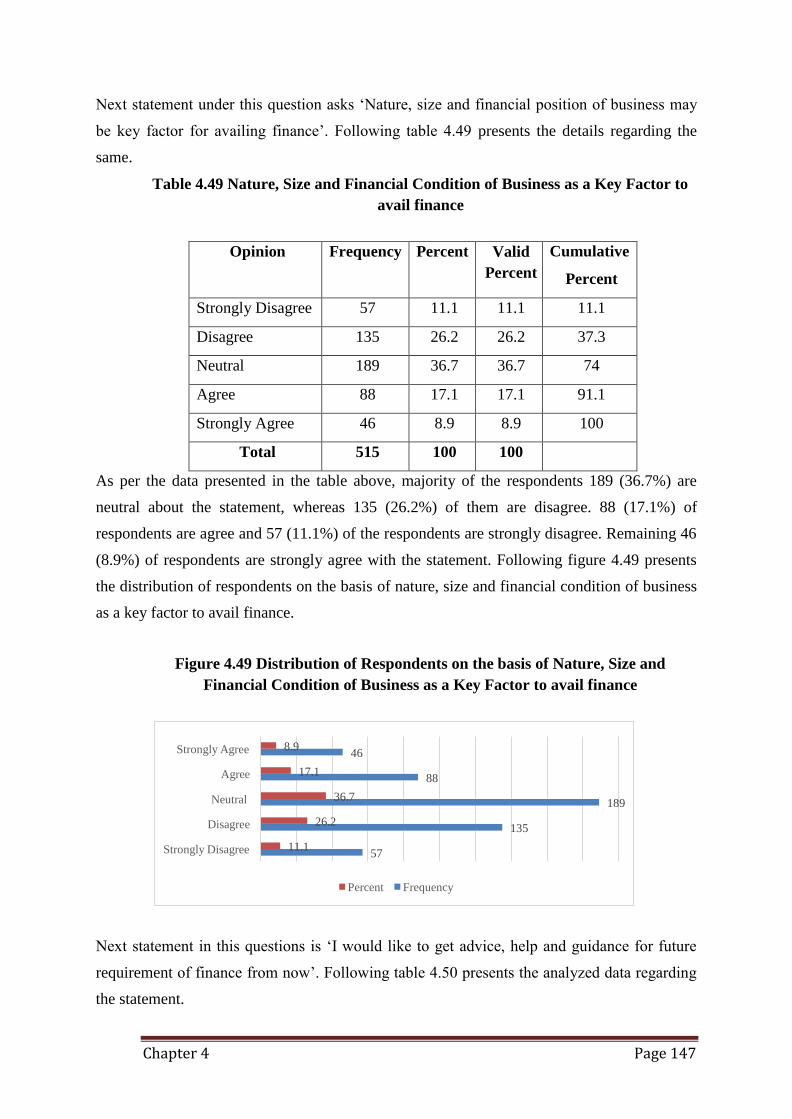
Chapter 4 Page 147
Strongly Agree
Agree
8.9 46
17.1 88
Neutral 36.7 189
Disagree 26.2 135
Strongly Disagree 11.1 57
Percent Frequency
Next statement under this question asks ‘Nature, size and financial position of business may
be key factor for availing finance’. Following table 4.49 presents the details regarding the
same.
Table 4.49 Nature, Size and Financial Condition of Business as a Key Factor to
avail finance
Opinion Frequency Percent Valid
Percent
Cumulative
Percent
Strongly Disagree 57 11.1 11.1 11.1
Disagree 135 26.2 26.2 37.3
Neutral 189 36.7 36.7 74
Agree 88 17.1 17.1 91.1
Strongly Agree 46 8.9 8.9 100
Total 515 100 100
As per the data presented in the table above, majority of the respondents 189 (36.7%) are
neutral about the statement, whereas 135 (26.2%) of them are disagree. 88 (17.1%) of
respondents are agree and 57 (11.1%) of the respondents are strongly disagree. Remaining 46
(8.9%) of respondents are strongly agree with the statement. Following figure 4.49 presents
the distribution of respondents on the basis of nature, size and financial condition of business
as a key factor to avail finance.
Figure 4.49 Distribution of Respondents on the basis of Nature, Size and
Financial Condition of Business as a Key Factor to avail finance
Next statement in this questions is ‘I would like to get advice, help and guidance for future
requirement of finance from now’. Following table 4.50 presents the analyzed data regarding
the statement.
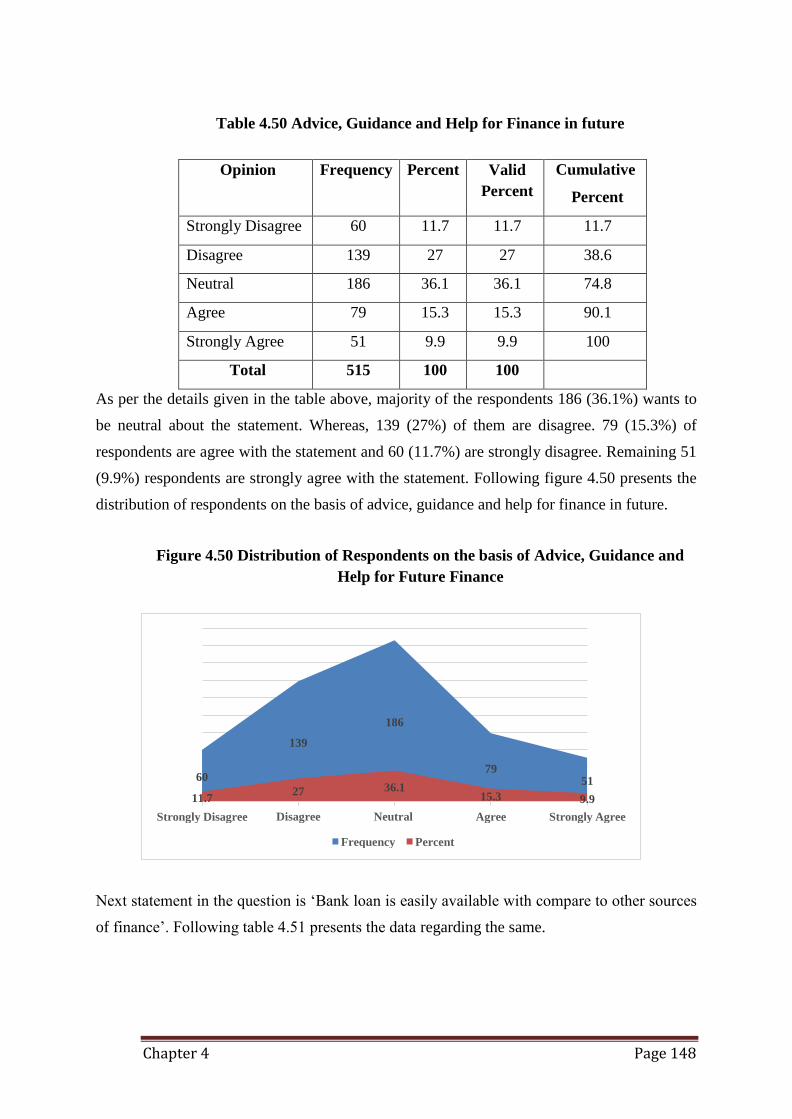
Chapter 4 Page 148
186
139
60
11.7
Strongly Disagree
79
27 36.1
Disagree Neutral
15.3
Agree
51
9.9
Strongly Agree
Frequency Percent
Table 4.50 Advice, Guidance and Help for Finance in future
Opinion Frequency Percent Valid
Percent
Cumulative
Percent
Strongly Disagree 60 11.7 11.7 11.7
Disagree 139 27 27 38.6
Neutral 186 36.1 36.1 74.8
Agree 79 15.3 15.3 90.1
Strongly Agree 51 9.9 9.9 100
Total 515 100 100
As per the details given in the table above, majority of the respondents 186 (36.1%) wants to
be neutral about the statement. Whereas, 139 (27%) of them are disagree. 79 (15.3%) of
respondents are agree with the statement and 60 (11.7%) are strongly disagree. Remaining 51
(9.9%) respondents are strongly agree with the statement. Following figure 4.50 presents the
distribution of respondents on the basis of advice, guidance and help for finance in future.
Figure 4.50 Distribution of Respondents on the basis of Advice, Guidance and
Help for Future Finance
Next statement in the question is ‘Bank loan is easily available with compare to other sources
of finance’. Following table 4.51 presents the data regarding the same.
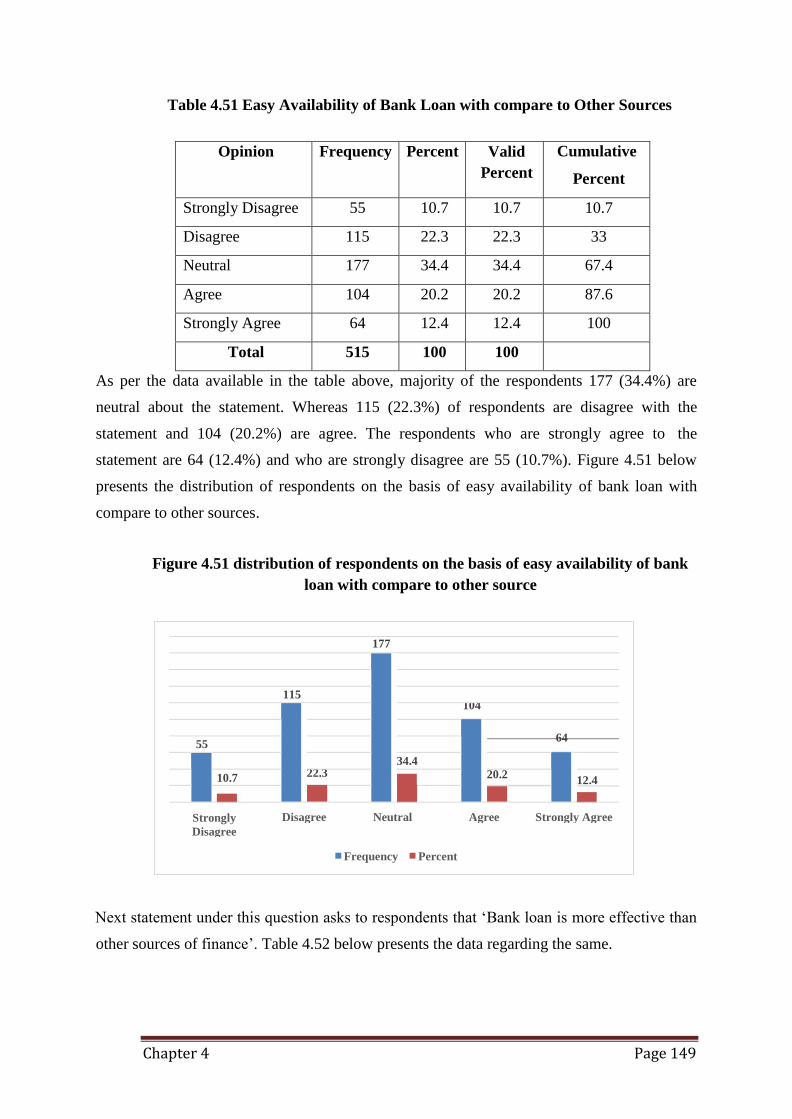
Chapter 4 Page 149
177
Strongly
Disagree
Disagree Neutral Agree Strongly Agree
Frequency Percent
Table 4.51 Easy Availability of Bank Loan with compare to Other Sources
Opinion Frequency Percent Valid
Percent
Cumulative
Percent
Strongly Disagree 55 10.7 10.7 10.7
Disagree 115 22.3 22.3 33
Neutral 177 34.4 34.4 67.4
Agree 104 20.2 20.2 87.6
Strongly Agree 64 12.4 12.4 100
Total 515 100 100
As per the data available in the table above, majority of the respondents 177 (34.4%) are
neutral about the statement. Whereas 115 (22.3%) of respondents are disagree with the
statement and 104 (20.2%) are agree. The respondents who are strongly agree to the
statement are 64 (12.4%) and who are strongly disagree are 55 (10.7%). Figure 4.51 below
presents the distribution of respondents on the basis of easy availability of bank loan with
compare to other sources.
Figure 4.51 distribution of respondents on the basis of easy availability of bank
loan with compare to other source
115
104
64
55
34.4
10.7 22.3 20.2 12.4
Next statement under this question asks to respondents that ‘Bank loan is more effective than
other sources of finance’. Table 4.52 below presents the data regarding the same.
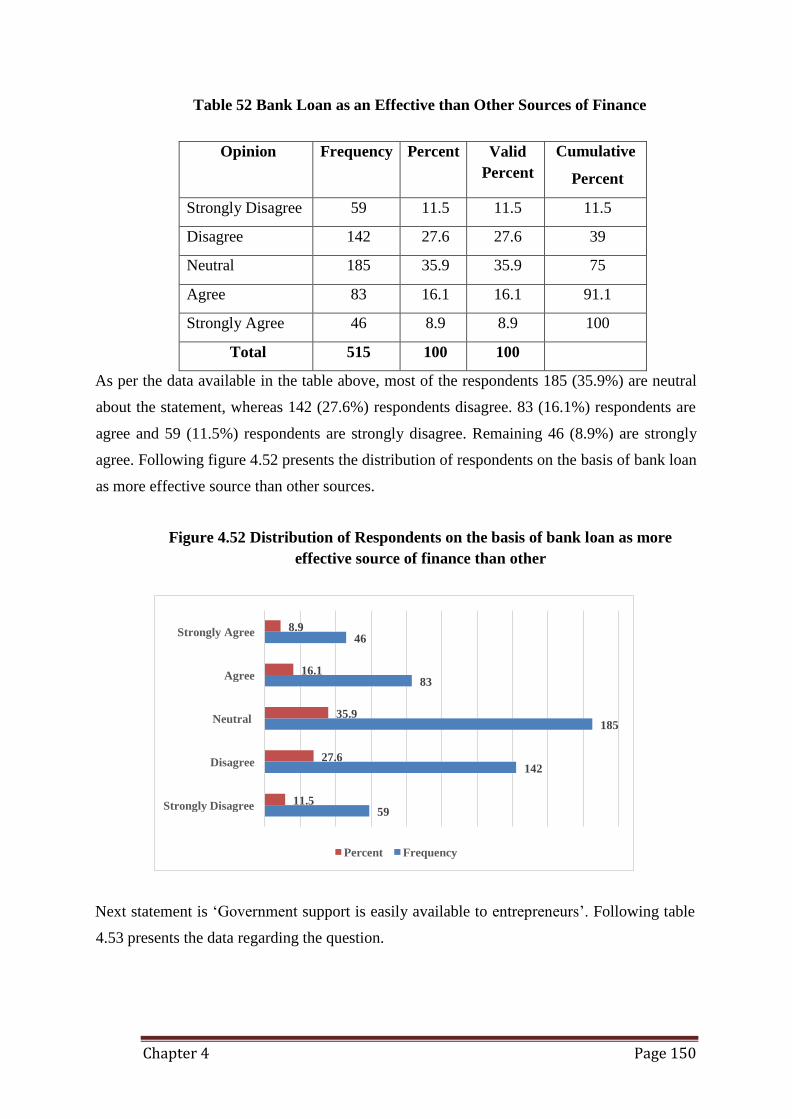
Chapter 4 Page 150
Strongly Agree 8.9 46
Agree 16.1 83
Neutral 35.9 185
Disagree 27.6 142
Strongly Disagree 11.5 59
Percent Frequency
Table 52 Bank Loan as an Effective than Other Sources of Finance
Opinion Frequency Percent Valid
Percent
Cumulative
Percent
Strongly Disagree 59 11.5 11.5 11.5
Disagree 142 27.6 27.6 39
Neutral 185 35.9 35.9 75
Agree 83 16.1 16.1 91.1
Strongly Agree 46 8.9 8.9 100
Total 515 100 100
As per the data available in the table above, most of the respondents 185 (35.9%) are neutral
about the statement, whereas 142 (27.6%) respondents disagree. 83 (16.1%) respondents are
agree and 59 (11.5%) respondents are strongly disagree. Remaining 46 (8.9%) are strongly
agree. Following figure 4.52 presents the distribution of respondents on the basis of bank loan
as more effective source than other sources.
Figure 4.52 Distribution of Respondents on the basis of bank loan as more
effective source of finance than other
Next statement is ‘Government support is easily available to entrepreneurs’. Following table
4.53 presents the data regarding the question.
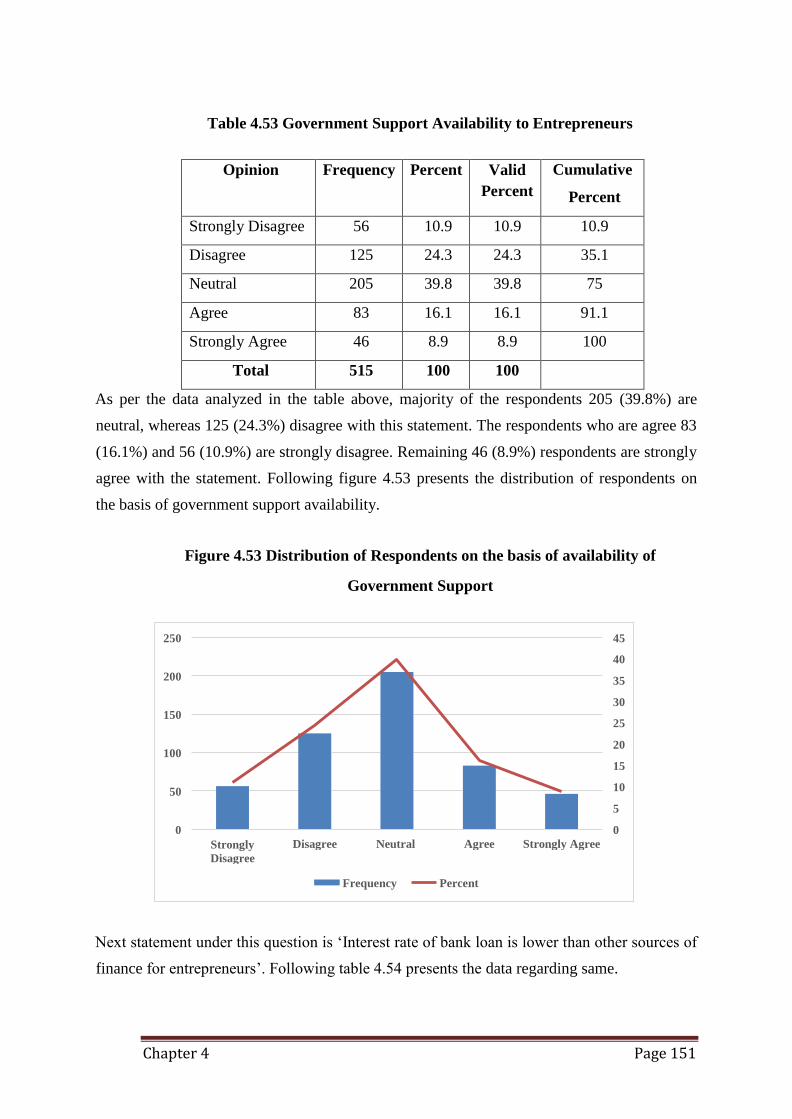
Chapter 4 Page 151
250
200
150
100
50
0
45
40
35
30
25
20
15
10
5
0
Strongly
Disagree
Disagree Neutral Agree Strongly Agree
Frequency Percent
Table 4.53 Government Support Availability to Entrepreneurs
Opinion Frequency Percent Valid
Percent
Cumulative
Percent
Strongly Disagree 56 10.9 10.9 10.9
Disagree 125 24.3 24.3 35.1
Neutral 205 39.8 39.8 75
Agree 83 16.1 16.1 91.1
Strongly Agree 46 8.9 8.9 100
Total 515 100 100
As per the data analyzed in the table above, majority of the respondents 205 (39.8%) are
neutral, whereas 125 (24.3%) disagree with this statement. The respondents who are agree 83
(16.1%) and 56 (10.9%) are strongly disagree. Remaining 46 (8.9%) respondents are strongly
agree with the statement. Following figure 4.53 presents the distribution of respondents on
the basis of government support availability.
Figure 4.53 Distribution of Respondents on the basis of availability of
Government Support
Next statement under this question is ‘Interest rate of bank loan is lower than other sources of
finance for entrepreneurs’. Following table 4.54 presents the data regarding same.
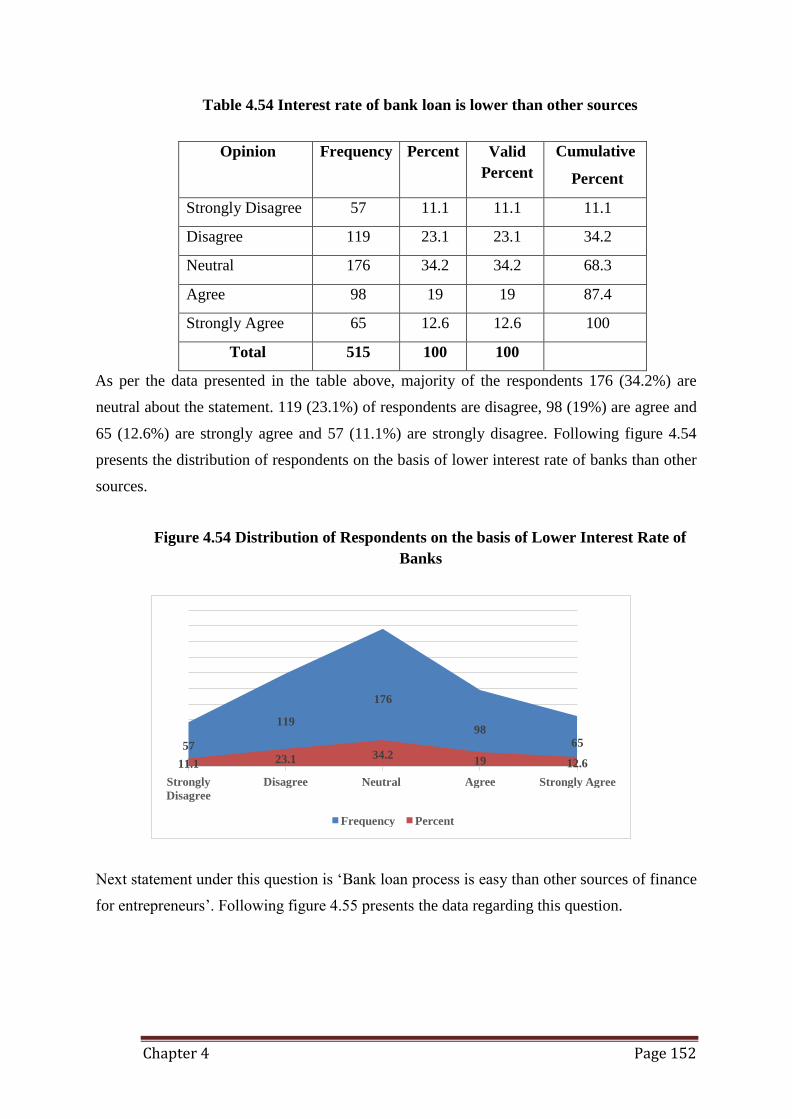
Chapter 4 Page 152
176
119 98
57
11.1
Strongly
Disagree
23.1
Disagree
34.2
Neutral
19
Agree
65
12.6
Strongly Agree
Frequency Percent
Table 4.54 Interest rate of bank loan is lower than other sources
Opinion Frequency Percent Valid
Percent
Cumulative
Percent
Strongly Disagree 57 11.1 11.1 11.1
Disagree 119 23.1 23.1 34.2
Neutral 176 34.2 34.2 68.3
Agree 98 19 19 87.4
Strongly Agree 65 12.6 12.6 100
Total 515 100 100
As per the data presented in the table above, majority of the respondents 176 (34.2%) are
neutral about the statement. 119 (23.1%) of respondents are disagree, 98 (19%) are agree and
65 (12.6%) are strongly agree and 57 (11.1%) are strongly disagree. Following figure 4.54
presents the distribution of respondents on the basis of lower interest rate of banks than other
sources.
Figure 4.54 Distribution of Respondents on the basis of Lower Interest Rate of
Banks
Next statement under this question is ‘Bank loan process is easy than other sources of finance
for entrepreneurs’. Following figure 4.55 presents the data regarding this question.
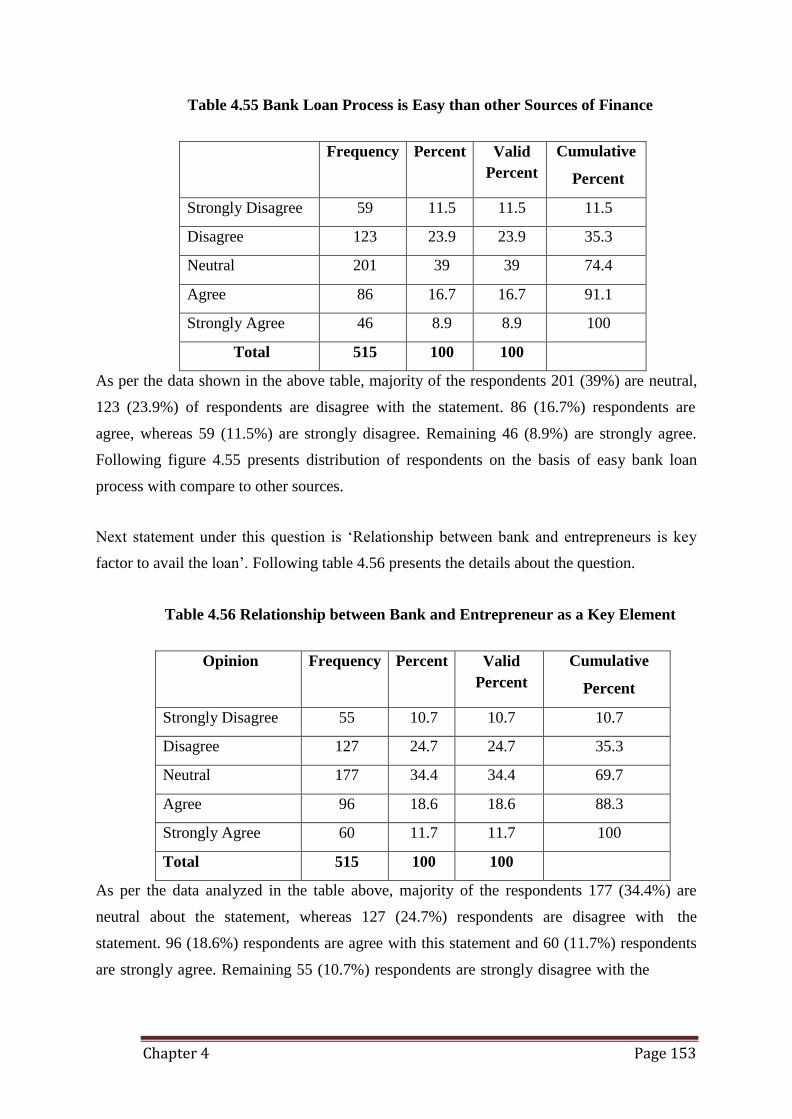
Chapter 4 Page 153
Table 4.55 Bank Loan Process is Easy than other Sources of Finance
Frequency Percent Valid
Percent
Cumulative
Percent
Strongly Disagree 59 11.5 11.5 11.5
Disagree 123 23.9 23.9 35.3
Neutral 201 39 39 74.4
Agree 86 16.7 16.7 91.1
Strongly Agree 46 8.9 8.9 100
Total 515 100 100
As per the data shown in the above table, majority of the respondents 201 (39%) are neutral,
123 (23.9%) of respondents are disagree with the statement. 86 (16.7%) respondents are
agree, whereas 59 (11.5%) are strongly disagree. Remaining 46 (8.9%) are strongly agree.
Following figure 4.55 presents distribution of respondents on the basis of easy bank loan
process with compare to other sources.
Next statement under this question is ‘Relationship between bank and entrepreneurs is key
factor to avail the loan’. Following table 4.56 presents the details about the question.
Table 4.56 Relationship between Bank and Entrepreneur as a Key Element
Opinion Frequency Percent Valid
Percent
Cumulative
Percent
Strongly Disagree 55 10.7 10.7 10.7
Disagree 127 24.7 24.7 35.3
Neutral 177 34.4 34.4 69.7
Agree 96 18.6 18.6 88.3
Strongly Agree 60 11.7 11.7 100
Total 515 100 100
As per the data analyzed in the table above, majority of the respondents 177 (34.4%) are
neutral about the statement, whereas 127 (24.7%) respondents are disagree with the
statement. 96 (18.6%) respondents are agree with this statement and 60 (11.7%) respondents
are strongly agree. Remaining 55 (10.7%) respondents are strongly disagree with the
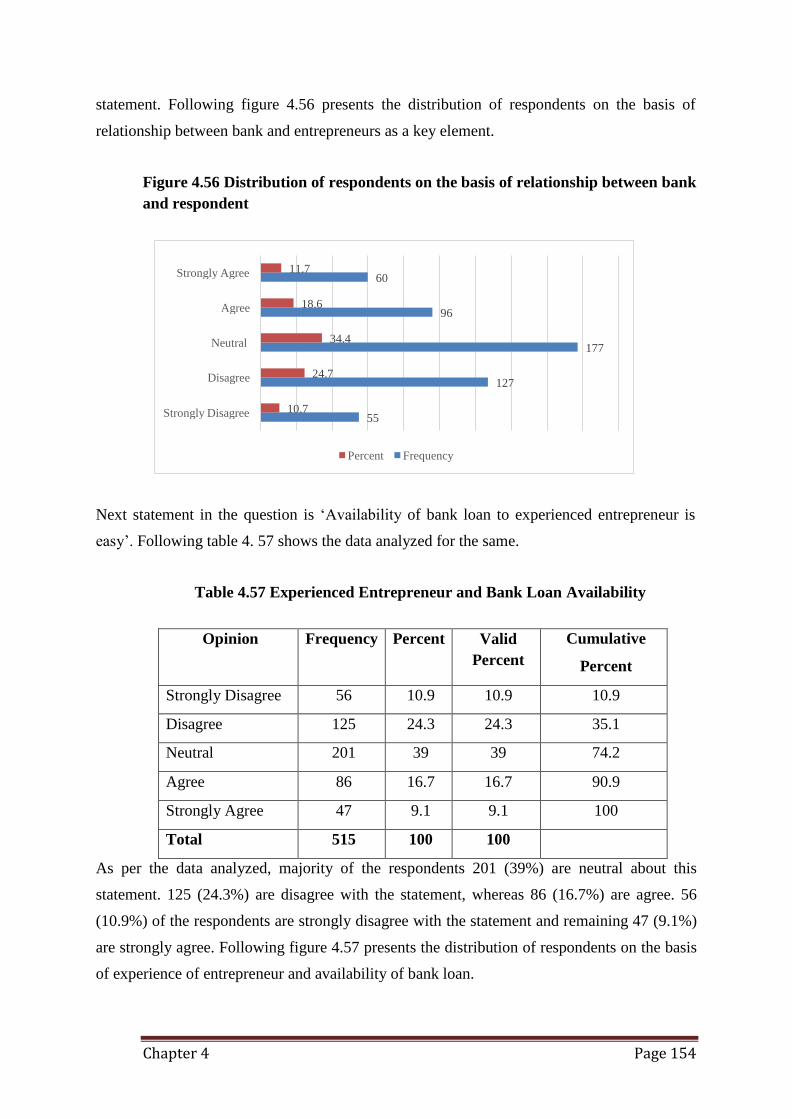
Chapter 4 Page 154
Strongly Agree 11.7 60
Agree 18.6 96
Neutral 34.4 177
Disagree 24.7 127
Strongly Disagree 10.7 55
Percent Frequency
statement. Following figure 4.56 presents the distribution of respondents on the basis of
relationship between bank and entrepreneurs as a key element.
Figure 4.56 Distribution of respondents on the basis of relationship between bank
and respondent
Next statement in the question is ‘Availability of bank loan to experienced entrepreneur is
easy’. Following table 4. 57 shows the data analyzed for the same.
Table 4.57 Experienced Entrepreneur and Bank Loan Availability
Opinion Frequency Percent Valid
Percent
Cumulative
Percent
Strongly Disagree 56 10.9 10.9 10.9
Disagree 125 24.3 24.3 35.1
Neutral 201 39 39 74.2
Agree 86 16.7 16.7 90.9
Strongly Agree 47 9.1 9.1 100
Total 515 100 100
As per the data analyzed, majority of the respondents 201 (39%) are neutral about this
statement. 125 (24.3%) are disagree with the statement, whereas 86 (16.7%) are agree. 56
(10.9%) of the respondents are strongly disagree with the statement and remaining 47 (9.1%)
are strongly agree. Following figure 4.57 presents the distribution of respondents on the basis
of experience of entrepreneur and availability of bank loan.
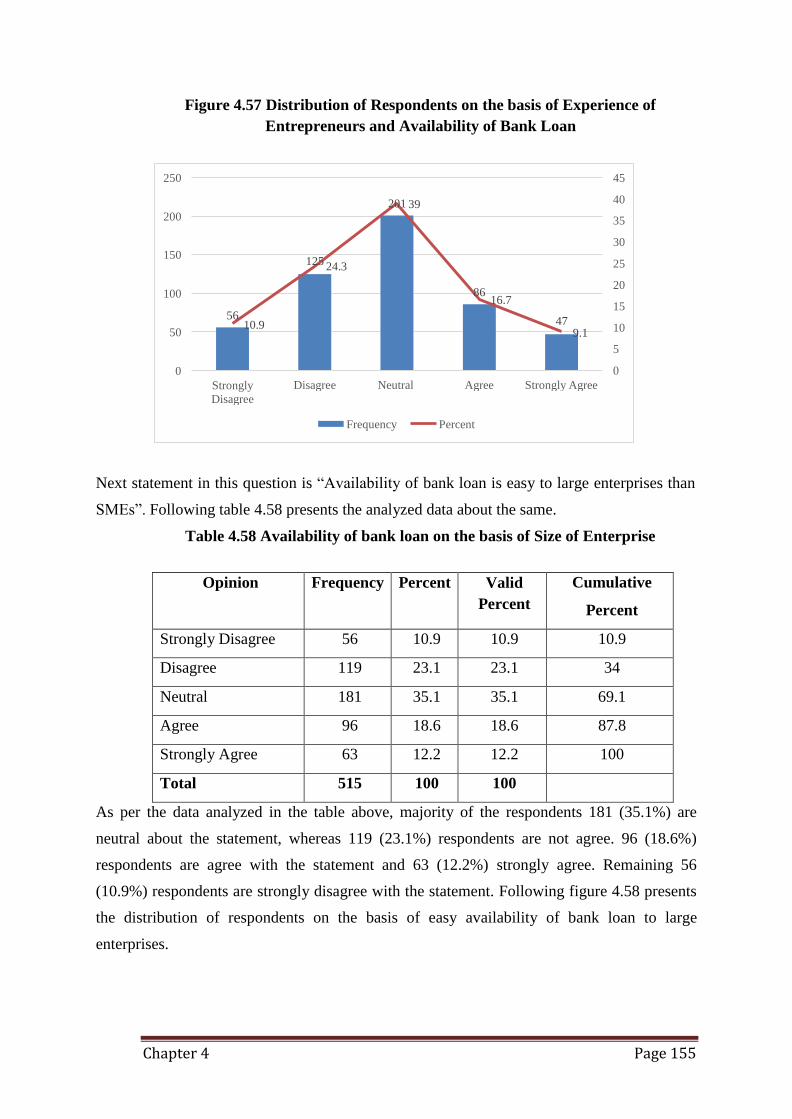
Chapter 4 Page 155
250 45
201 39 200
150 125 24.3
40
35
30
25
100 86 16.7
56
50 10.9 47
9.1
0
20
15
10
5
0
Strongly
Disagree
Disagree Neutral Agree Strongly Agree
Frequency Percent
Figure 4.57 Distribution of Respondents on the basis of Experience of
Entrepreneurs and Availability of Bank Loan
Next statement in this question is “Availability of bank loan is easy to large enterprises than
SMEs”. Following table 4.58 presents the analyzed data about the same.
Table 4.58 Availability of bank loan on the basis of Size of Enterprise
Opinion Frequency Percent Valid
Percent
Cumulative
Percent
Strongly Disagree 56 10.9 10.9 10.9
Disagree 119 23.1 23.1 34
Neutral 181 35.1 35.1 69.1
Agree 96 18.6 18.6 87.8
Strongly Agree 63 12.2 12.2 100
Total 515 100 100
As per the data analyzed in the table above, majority of the respondents 181 (35.1%) are
neutral about the statement, whereas 119 (23.1%) respondents are not agree. 96 (18.6%)
respondents are agree with the statement and 63 (12.2%) strongly agree. Remaining 56
(10.9%) respondents are strongly disagree with the statement. Following figure 4.58 presents
the distribution of respondents on the basis of easy availability of bank loan to large
enterprises.
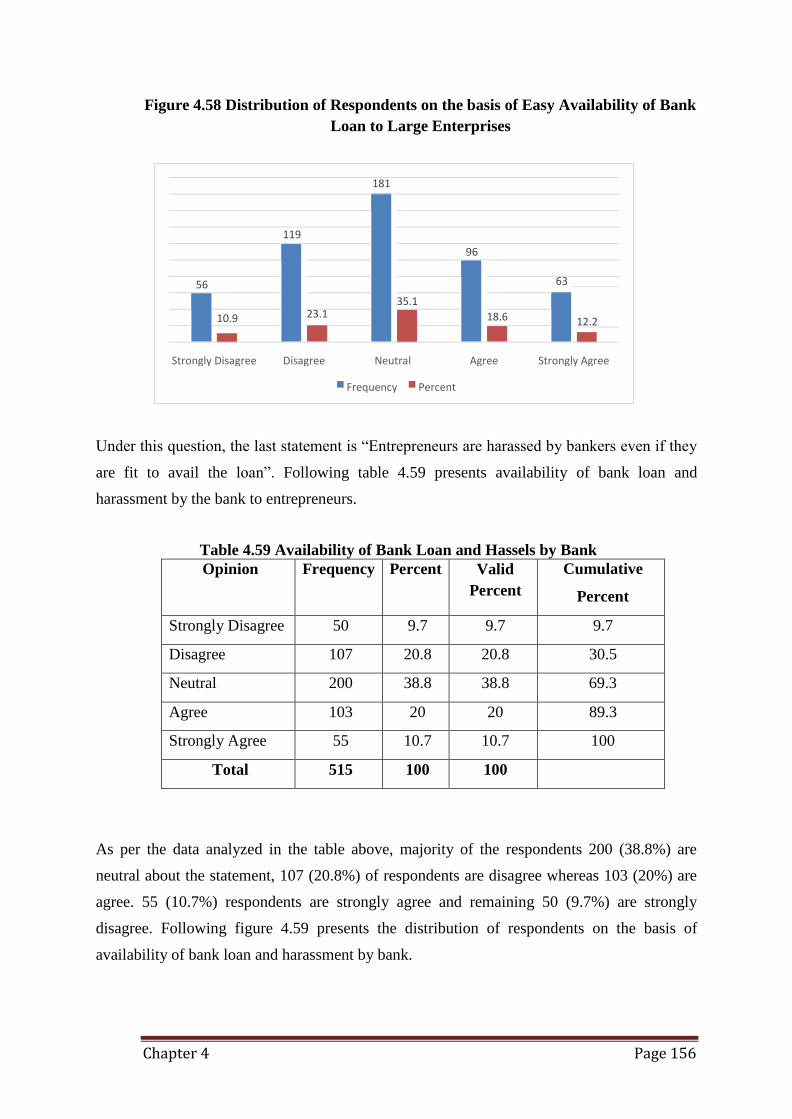
Chapter 4 Page 156
181
Strongly Disagree Disagree Neutral Agree Strongly Agree
Frequency Percent
Figure 4.58 Distribution of Respondents on the basis of Easy Availability of Bank
Loan to Large Enterprises
119
96
56 63
35.1 12.2
10.9 23.1 18.6
Under this question, the last statement is “Entrepreneurs are harassed by bankers even if they
are fit to avail the loan”. Following table 4.59 presents availability of bank loan and
harassment by the bank to entrepreneurs.
Table 4.59 Availability of Bank Loan and Hassels by Bank
Opinion Frequency Percent Valid
Percent
Cumulative
Percent
Strongly Disagree 50 9.7 9.7 9.7
Disagree 107 20.8 20.8 30.5
Neutral 200 38.8 38.8 69.3
Agree 103 20 20 89.3
Strongly Agree 55 10.7 10.7 100
Total 515 100 100
As per the data analyzed in the table above, majority of the respondents 200 (38.8%) are
neutral about the statement, 107 (20.8%) of respondents are disagree whereas 103 (20%) are
agree. 55 (10.7%) respondents are strongly agree and remaining 50 (9.7%) are strongly
disagree. Following figure 4.59 presents the distribution of respondents on the basis of
availability of bank loan and harassment by bank.
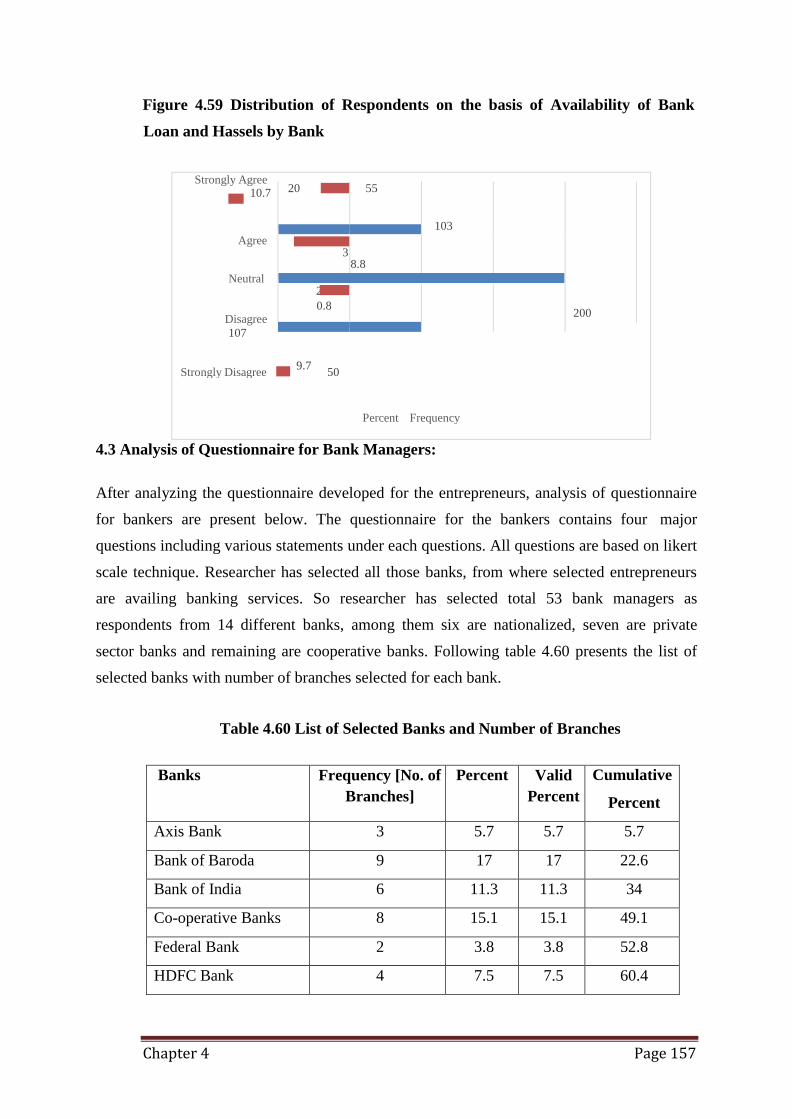
Chapter 4 Page 157
2
Strongly Agree 10.7
Agree
Neutral
Disagree
107
200
Strongly Disagree 9.7
50
Percent Frequency
Figure 4.59 Distribution of Respondents on the basis of Availability of Bank
Loan and Hassels by Bank
20 55
103
3 8.8
0.8
4.3 Analysis of Questionnaire for Bank Managers:
After analyzing the questionnaire developed for the entrepreneurs, analysis of questionnaire
for bankers are present below. The questionnaire for the bankers contains four major
questions including various statements under each questions. All questions are based on likert
scale technique. Researcher has selected all those banks, from where selected entrepreneurs
are availing banking services. So researcher has selected total 53 bank managers as
respondents from 14 different banks, among them six are nationalized, seven are private
sector banks and remaining are cooperative banks. Following table 4.60 presents the list of
selected banks with number of branches selected for each bank.
Table 4.60 List of Selected Banks and Number of Branches
Banks Frequency [No. of
Branches]
Percent Valid
Percent
Cumulative
Percent
Axis Bank 3 5.7 5.7 5.7
Bank of Baroda 9 17 17 22.6
Bank of India 6 11.3 11.3 34
Co-operative Banks 8 15.1 15.1 49.1
Federal Bank 2 3.8 3.8 52.8
HDFC Bank 4 7.5 7.5 60.4
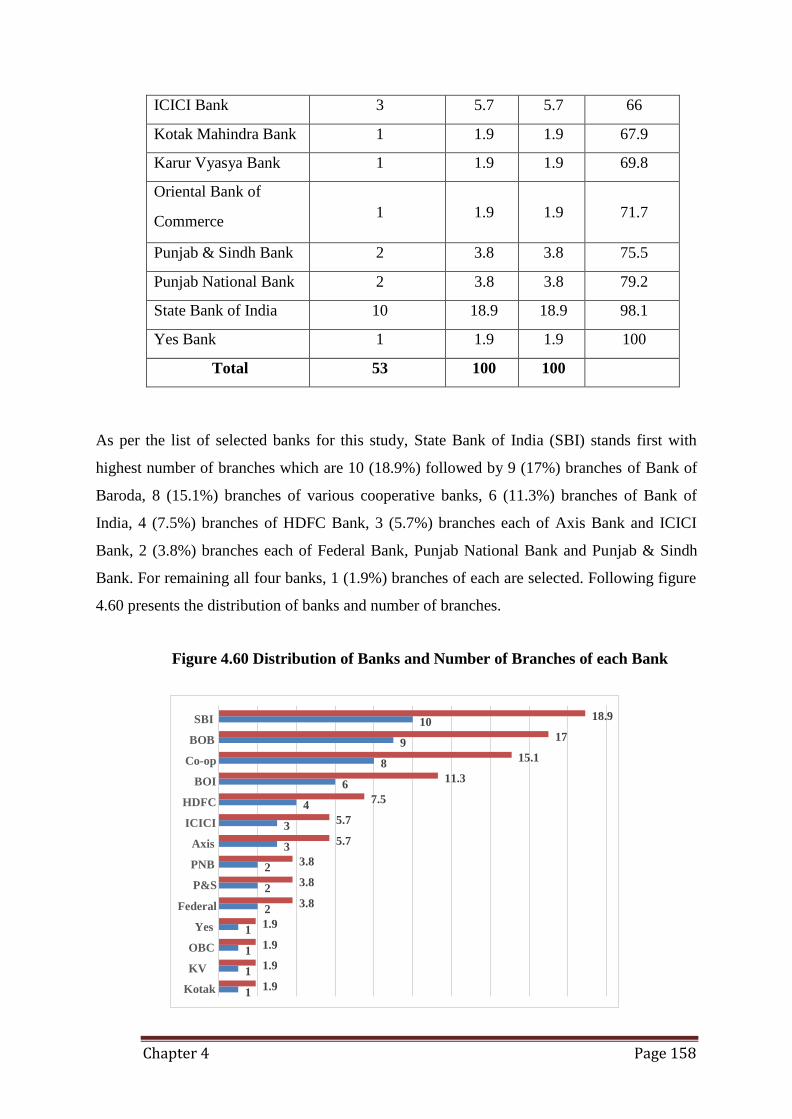
Chapter 4 Page 158
SBI
BOB
Co-op
BOI
HDFC
ICICI
Axis
PNB
P&S
Federal
Yes
OBC
KV
Kotak
10 18.9
9 17
8 15.1
6 11.3
4 7.5
3
3
5.7
5.7
3.8
3.8
3.8
1
1
1
1
2
2
2
1.9
1.9
1.9
1.9
ICICI Bank 3 5.7 5.7 66
Kotak Mahindra Bank 1 1.9 1.9 67.9
Karur Vyasya Bank 1 1.9 1.9 69.8
Oriental Bank of
Commerce
1
1.9
1.9
71.7
Punjab & Sindh Bank 2 3.8 3.8 75.5
Punjab National Bank 2 3.8 3.8 79.2
State Bank of India 10 18.9 18.9 98.1
Yes Bank 1 1.9 1.9 100
Total 53 100 100
As per the list of selected banks for this study, State Bank of India (SBI) stands first with
highest number of branches which are 10 (18.9%) followed by 9 (17%) branches of Bank of
Baroda, 8 (15.1%) branches of various cooperative banks, 6 (11.3%) branches of Bank of
India, 4 (7.5%) branches of HDFC Bank, 3 (5.7%) branches each of Axis Bank and ICICI
Bank, 2 (3.8%) branches each of Federal Bank, Punjab National Bank and Punjab & Sindh
Bank. For remaining all four banks, 1 (1.9%) branches of each are selected. Following figure
4.60 presents the distribution of banks and number of branches.
Figure 4.60 Distribution of Banks and Number of Branches of each Bank
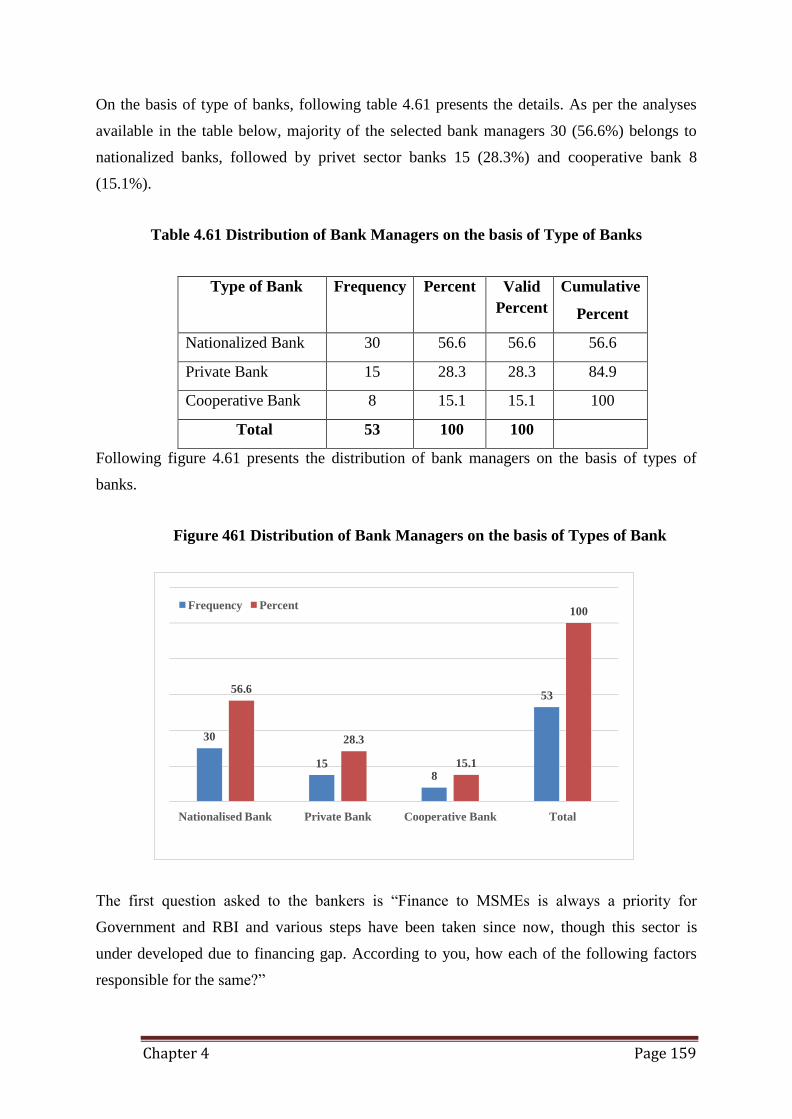
Chapter 4 Page 159
Frequency Percent 100
56.6 53
30 28.3
15 15.1 8
Nationalised Bank Private Bank Cooperative Bank Total
On the basis of type of banks, following table 4.61 presents the details. As per the analyses
available in the table below, majority of the selected bank managers 30 (56.6%) belongs to
nationalized banks, followed by privet sector banks 15 (28.3%) and cooperative bank 8
(15.1%).
Table 4.61 Distribution of Bank Managers on the basis of Type of Banks
Type of Bank Frequency Percent Valid
Percent
Cumulative
Percent
Nationalized Bank 30 56.6 56.6 56.6
Private Bank 15 28.3 28.3 84.9
Cooperative Bank 8 15.1 15.1 100
Total 53 100 100
Following figure 4.61 presents the distribution of bank managers on the basis of types of
banks.
Figure 461 Distribution of Bank Managers on the basis of Types of Bank
The first question asked to the bankers is “Finance to MSMEs is always a priority for
Government and RBI and various steps have been taken since now, though this sector is
under developed due to financing gap. According to you, how each of the following factors
responsible for the same?”
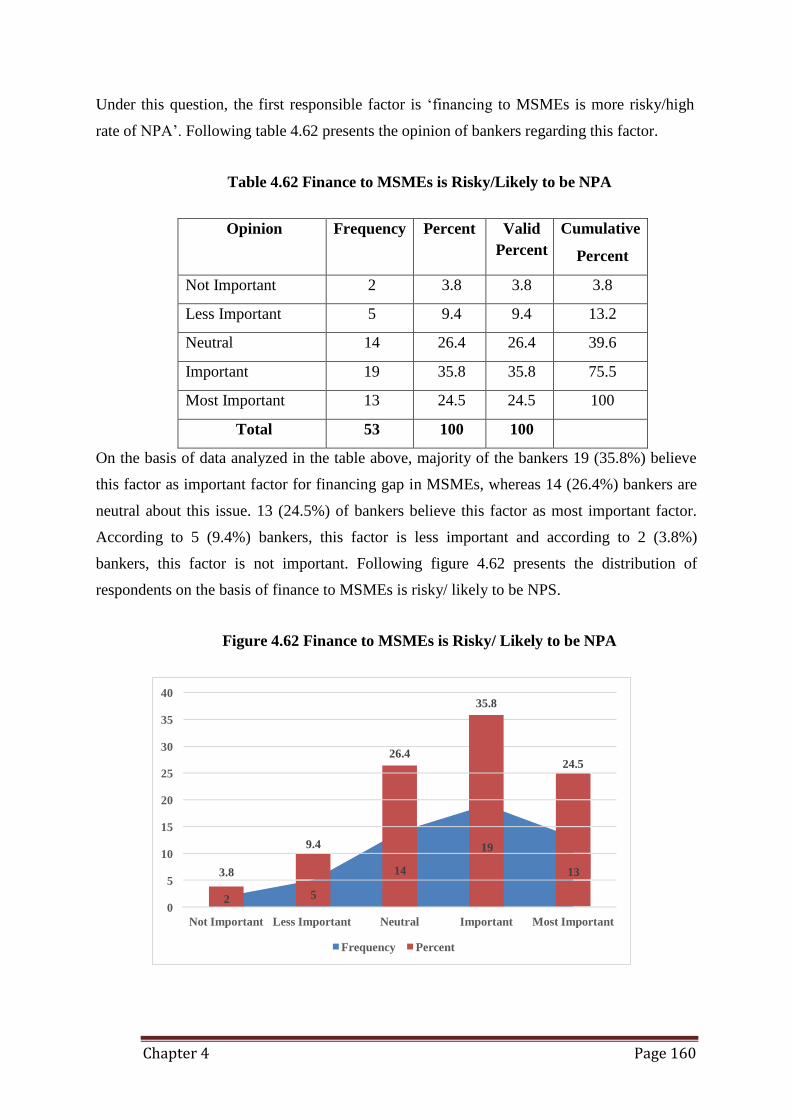
Chapter 4 Page 160
40 35.8
35
30 26.4
25 24.5
20
15
10
5
0
Not Important Less Important Neutral Important Most Important
Frequency Percent
Under this question, the first responsible factor is ‘financing to MSMEs is more risky/high
rate of NPA’. Following table 4.62 presents the opinion of bankers regarding this factor.
Table 4.62 Finance to MSMEs is Risky/Likely to be NPA
Opinion Frequency Percent Valid
Percent
Cumulative
Percent
Not Important 2 3.8 3.8 3.8
Less Important 5 9.4 9.4 13.2
Neutral 14 26.4 26.4 39.6
Important 19 35.8 35.8 75.5
Most Important 13 24.5 24.5 100
Total 53 100 100
On the basis of data analyzed in the table above, majority of the bankers 19 (35.8%) believe
this factor as important factor for financing gap in MSMEs, whereas 14 (26.4%) bankers are
neutral about this issue. 13 (24.5%) of bankers believe this factor as most important factor.
According to 5 (9.4%) bankers, this factor is less important and according to 2 (3.8%)
bankers, this factor is not important. Following figure 4.62 presents the distribution of
respondents on the basis of finance to MSMEs is risky/ likely to be NPS.
Figure 4.62 Finance to MSMEs is Risky/ Likely to be NPA
9.4 19
3.8
14
13
2 5
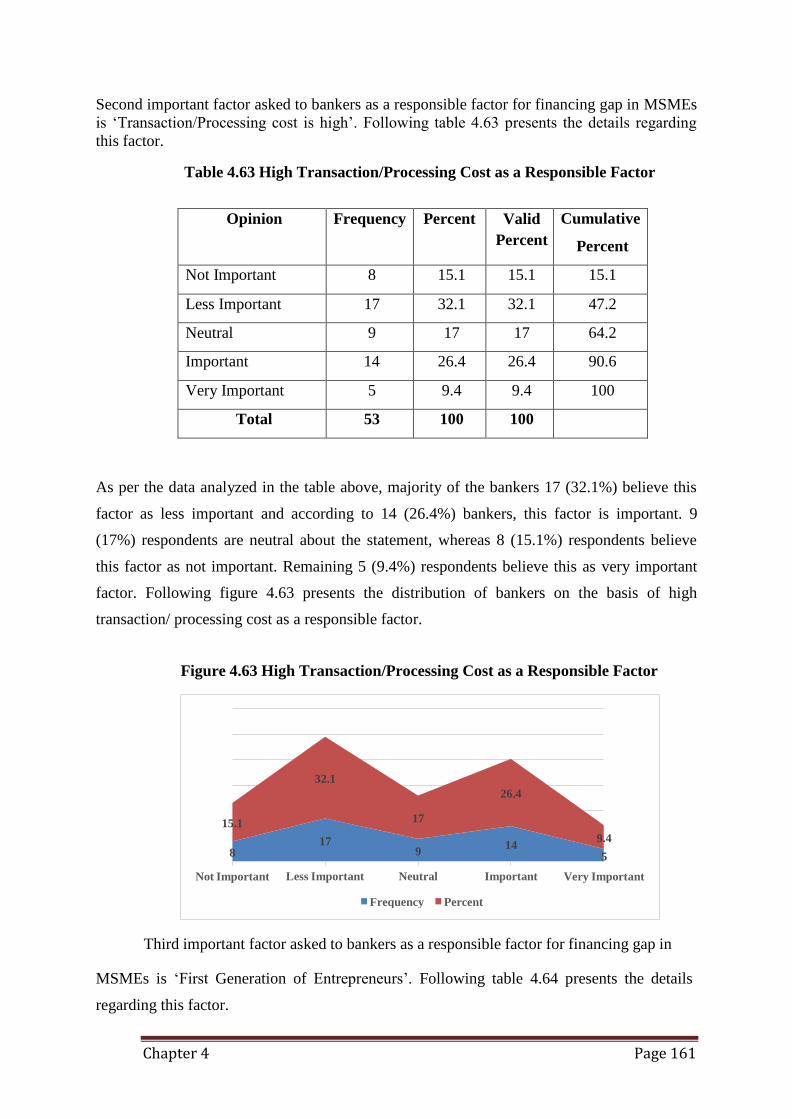
Chapter 4 Page 161
32.1
26.4
15.1 17
17 8
Not Important
9 14
Less Important Neutral Important
9.4
5
Very Important
Frequency Percent
Second important factor asked to bankers as a responsible factor for financing gap in MSMEs
is ‘Transaction/Processing cost is high’. Following table 4.63 presents the details regarding
this factor.
Table 4.63 High Transaction/Processing Cost as a Responsible Factor
Opinion Frequency Percent Valid
Percent
Cumulative
Percent
Not Important 8 15.1 15.1 15.1
Less Important 17 32.1 32.1 47.2
Neutral 9 17 17 64.2
Important 14 26.4 26.4 90.6
Very Important 5 9.4 9.4 100
Total 53 100 100
As per the data analyzed in the table above, majority of the bankers 17 (32.1%) believe this
factor as less important and according to 14 (26.4%) bankers, this factor is important. 9
(17%) respondents are neutral about the statement, whereas 8 (15.1%) respondents believe
this factor as not important. Remaining 5 (9.4%) respondents believe this as very important
factor. Following figure 4.63 presents the distribution of bankers on the basis of high
transaction/ processing cost as a responsible factor.
Figure 4.63 High Transaction/Processing Cost as a Responsible Factor
Third important factor asked to bankers as a responsible factor for financing gap in
MSMEs is ‘First Generation of Entrepreneurs’. Following table 4.64 presents the details
regarding this factor.
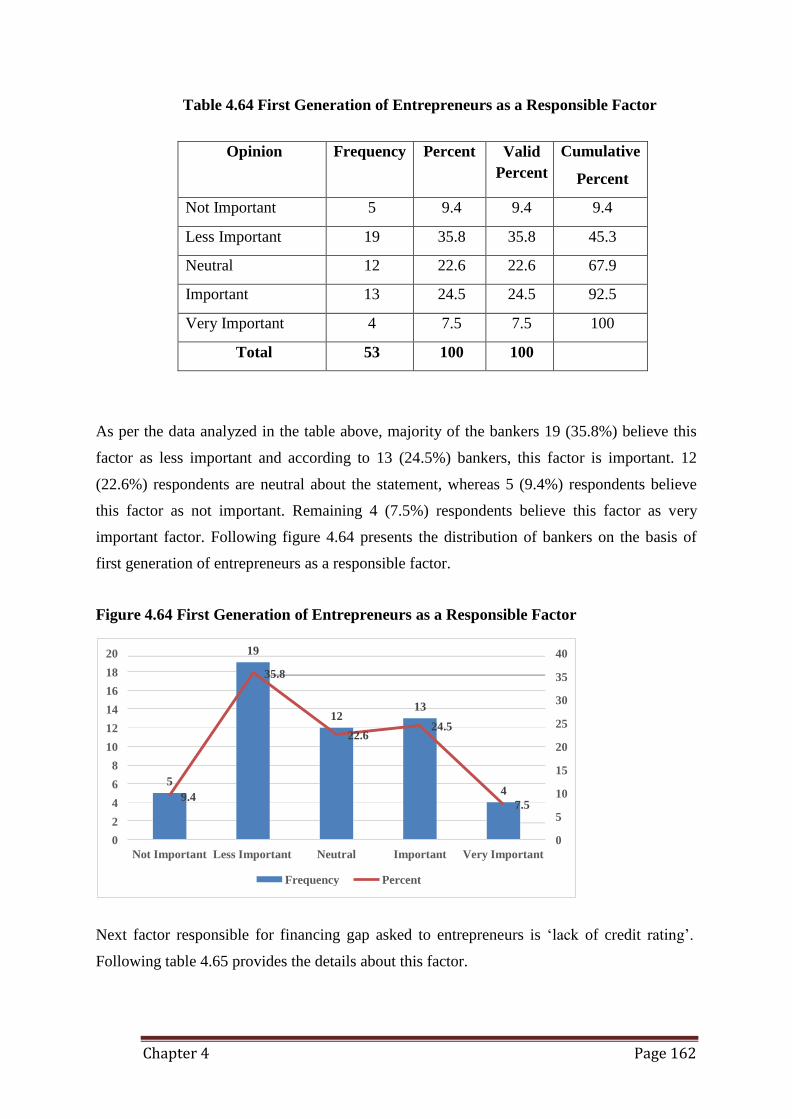
Chapter 4 Page 162
20
18
16
14
12
10
8
6
4
2
0
19
35.8
12 13
22.6 24.5
5
9.4 4
7.5
40
35
30
25
20
15
10
5
0
Not Important Less Important Neutral Important Very Important
Frequency Percent
Table 4.64 First Generation of Entrepreneurs as a Responsible Factor
Opinion Frequency Percent Valid
Percent
Cumulative
Percent
Not Important 5 9.4 9.4 9.4
Less Important 19 35.8 35.8 45.3
Neutral 12 22.6 22.6 67.9
Important 13 24.5 24.5 92.5
Very Important 4 7.5 7.5 100
Total 53 100 100
As per the data analyzed in the table above, majority of the bankers 19 (35.8%) believe this
factor as less important and according to 13 (24.5%) bankers, this factor is important. 12
(22.6%) respondents are neutral about the statement, whereas 5 (9.4%) respondents believe
this factor as not important. Remaining 4 (7.5%) respondents believe this factor as very
important factor. Following figure 4.64 presents the distribution of bankers on the basis of
first generation of entrepreneurs as a responsible factor.
Figure 4.64 First Generation of Entrepreneurs as a Responsible Factor
Next factor responsible for financing gap asked to entrepreneurs is ‘lack of credit rating’.
Following table 4.65 provides the details about this factor.
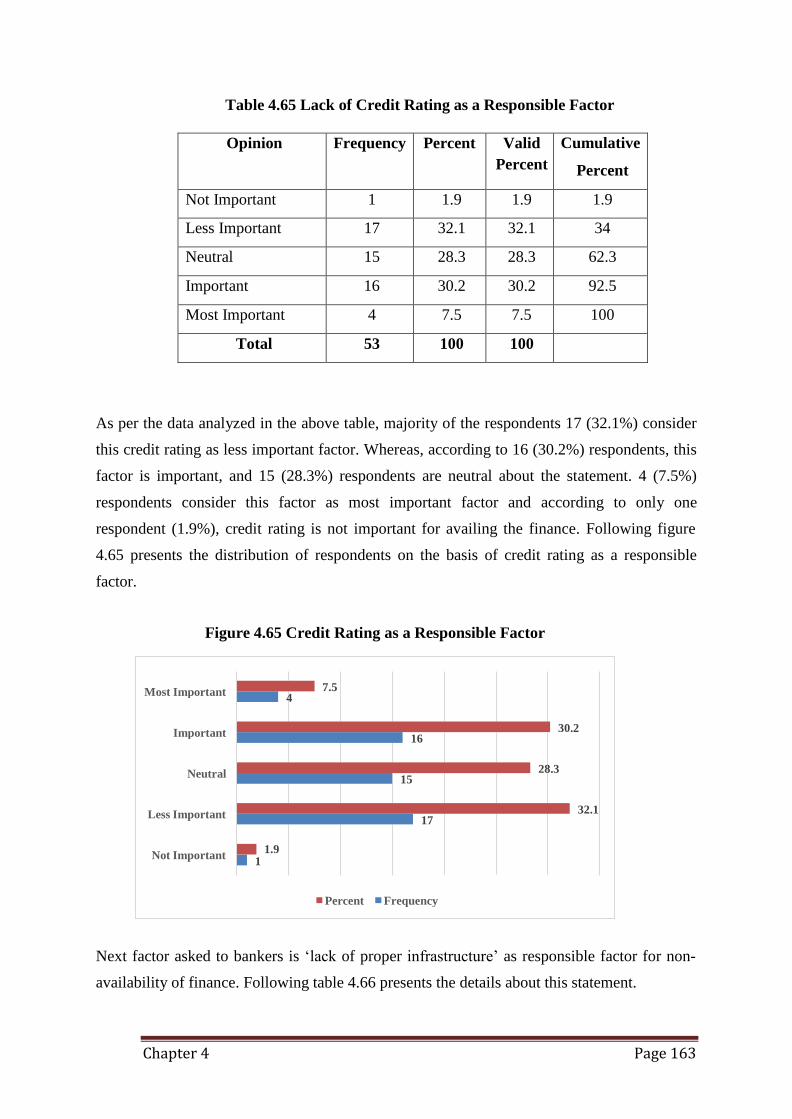
Chapter 4 Page 163
Most Important 7.5 4
Important 30.2 16
Neutral 28.3 15
Less Important 32.1 17
Not Important 1.9
1
Percent Frequency
Table 4.65 Lack of Credit Rating as a Responsible Factor
Opinion Frequency Percent Valid
Percent
Cumulative
Percent
Not Important 1 1.9 1.9 1.9
Less Important 17 32.1 32.1 34
Neutral 15 28.3 28.3 62.3
Important 16 30.2 30.2 92.5
Most Important 4 7.5 7.5 100
Total 53 100 100
As per the data analyzed in the above table, majority of the respondents 17 (32.1%) consider
this credit rating as less important factor. Whereas, according to 16 (30.2%) respondents, this
factor is important, and 15 (28.3%) respondents are neutral about the statement. 4 (7.5%)
respondents consider this factor as most important factor and according to only one
respondent (1.9%), credit rating is not important for availing the finance. Following figure
4.65 presents the distribution of respondents on the basis of credit rating as a responsible
factor.
Figure 4.65 Credit Rating as a Responsible Factor
Next factor asked to bankers is ‘lack of proper infrastructure’ as responsible factor for non-
availability of finance. Following table 4.66 presents the details about this statement.
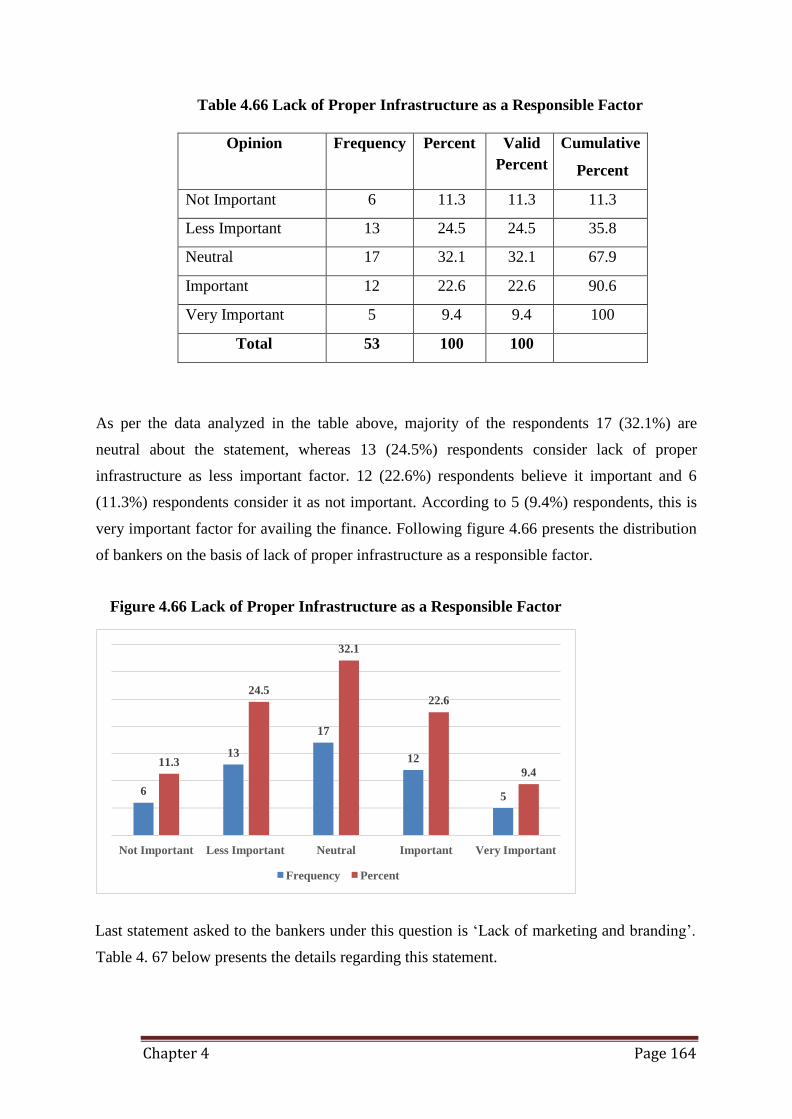
Chapter 4 Page 164
32.1
24.5 22.6
17
11.3 13
12
9.4
6 5
Not Important Less Important Neutral Important Very Important
Frequency Percent
Table 4.66 Lack of Proper Infrastructure as a Responsible Factor
Opinion Frequency Percent Valid
Percent
Cumulative
Percent
Not Important 6 11.3 11.3 11.3
Less Important 13 24.5 24.5 35.8
Neutral 17 32.1 32.1 67.9
Important 12 22.6 22.6 90.6
Very Important 5 9.4 9.4 100
Total 53 100 100
As per the data analyzed in the table above, majority of the respondents 17 (32.1%) are
neutral about the statement, whereas 13 (24.5%) respondents consider lack of proper
infrastructure as less important factor. 12 (22.6%) respondents believe it important and 6
(11.3%) respondents consider it as not important. According to 5 (9.4%) respondents, this is
very important factor for availing the finance. Following figure 4.66 presents the distribution
of bankers on the basis of lack of proper infrastructure as a responsible factor.
Figure 4.66 Lack of Proper Infrastructure as a Responsible Factor
Last statement asked to the bankers under this question is ‘Lack of marketing and branding’.
Table 4. 67 below presents the details regarding this statement.
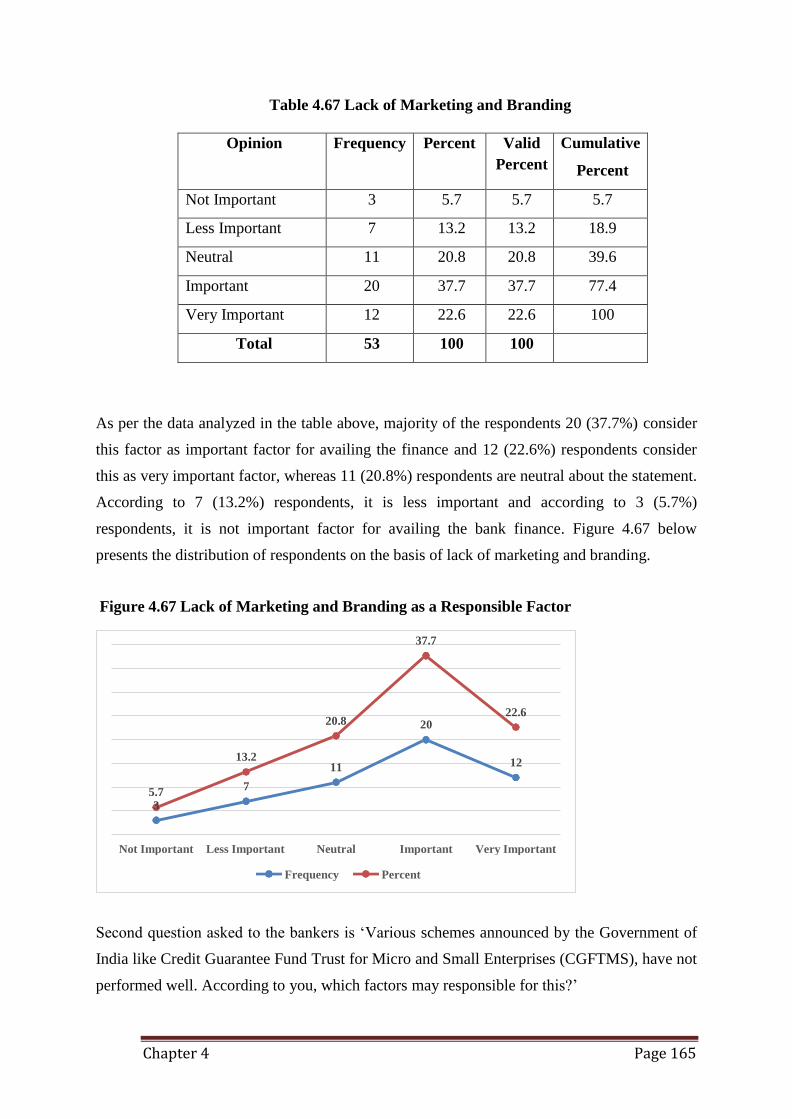
Chapter 4 Page 165
37.7
20.8 22.6
20
13.2 11 12
5.7 3
7
Not Important Less Important Neutral Important Very Important
Frequency Percent
Table 4.67 Lack of Marketing and Branding
Opinion Frequency Percent Valid
Percent
Cumulative
Percent
Not Important 3 5.7 5.7 5.7
Less Important 7 13.2 13.2 18.9
Neutral 11 20.8 20.8 39.6
Important 20 37.7 37.7 77.4
Very Important 12 22.6 22.6 100
Total 53 100 100
As per the data analyzed in the table above, majority of the respondents 20 (37.7%) consider
this factor as important factor for availing the finance and 12 (22.6%) respondents consider
this as very important factor, whereas 11 (20.8%) respondents are neutral about the statement.
According to 7 (13.2%) respondents, it is less important and according to 3 (5.7%)
respondents, it is not important factor for availing the bank finance. Figure 4.67 below
presents the distribution of respondents on the basis of lack of marketing and branding.
Figure 4.67 Lack of Marketing and Branding as a Responsible Factor
Second question asked to the bankers is ‘Various schemes announced by the Government of
India like Credit Guarantee Fund Trust for Micro and Small Enterprises (CGFTMS), have not
performed well. According to you, which factors may responsible for this?’
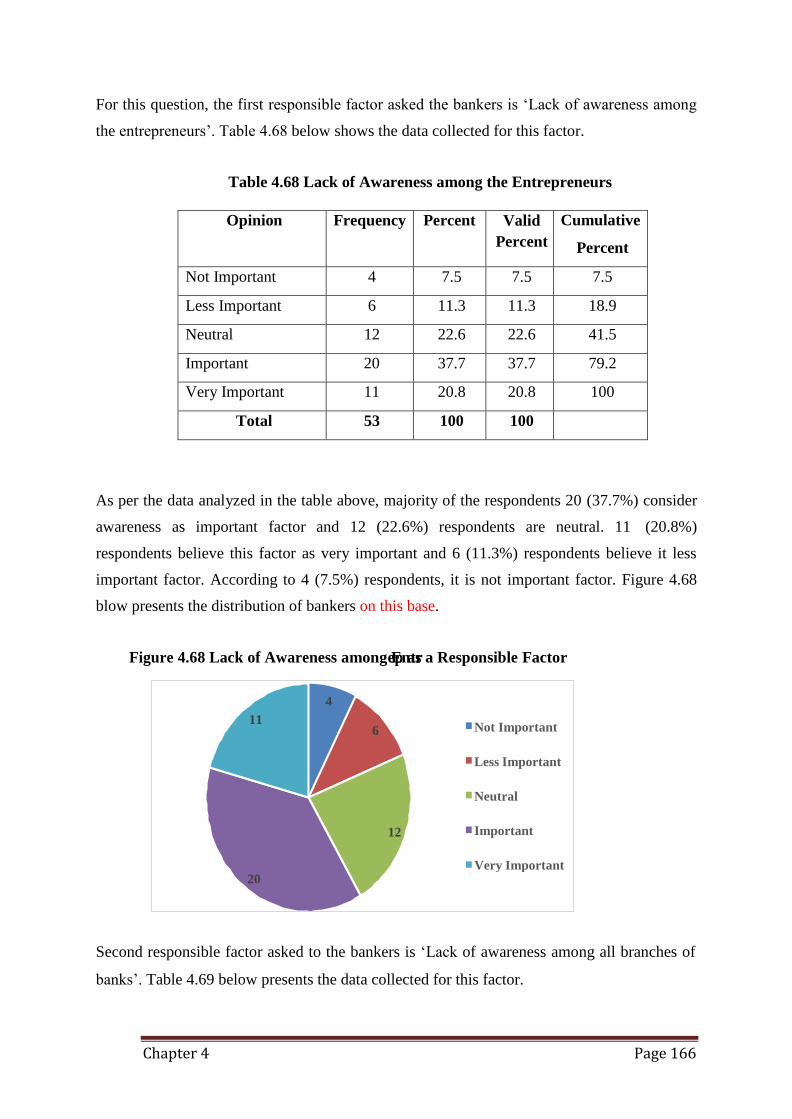
Chapter 4 Page 166
4
11 6 Not Important
Less Important
Neutral
12 Important
Very Important
20
For this question, the first responsible factor asked the bankers is ‘Lack of awareness among
the entrepreneurs’. Table 4.68 below shows the data collected for this factor.
Table 4.68 Lack of Awareness among the Entrepreneurs
Opinion Frequency Percent Valid
Percent
Cumulative
Percent
Not Important 4 7.5 7.5 7.5
Less Important 6 11.3 11.3 18.9
Neutral 12 22.6 22.6 41.5
Important 20 37.7 37.7 79.2
Very Important 11 20.8 20.8 100
Total 53 100 100
As per the data analyzed in the table above, majority of the respondents 20 (37.7%) consider
awareness as important factor and 12 (22.6%) respondents are neutral. 11 (20.8%)
respondents believe this factor as very important and 6 (11.3%) respondents believe it less
important factor. According to 4 (7.5%) respondents, it is not important factor. Figure 4.68
blow presents the distribution of bankers on this base.
Figure 4.68 Lack of Awareness amongeEpnatsr a Responsible Factor
Second responsible factor asked to the bankers is ‘Lack of awareness among all branches of
banks’. Table 4.69 below presents the data collected for this factor.
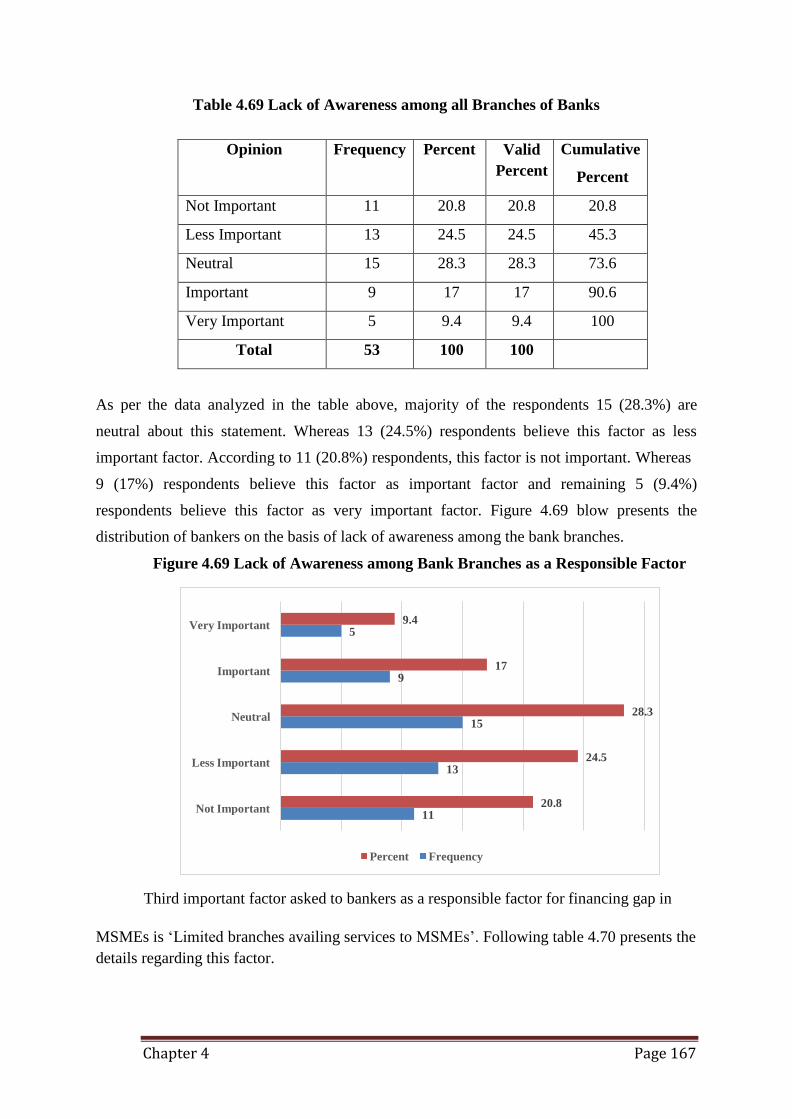
Chapter 4 Page 167
Very Important 9.4
5
Important 17
9
Neutral 28.3 15
Less Important 24.5
13
Not Important 20.8
11
Percent Frequency
Table 4.69 Lack of Awareness among all Branches of Banks
Opinion Frequency Percent Valid
Percent
Cumulative
Percent
Not Important 11 20.8 20.8 20.8
Less Important 13 24.5 24.5 45.3
Neutral 15 28.3 28.3 73.6
Important 9 17 17 90.6
Very Important 5 9.4 9.4 100
Total 53 100 100
As per the data analyzed in the table above, majority of the respondents 15 (28.3%) are
neutral about this statement. Whereas 13 (24.5%) respondents believe this factor as less
important factor. According to 11 (20.8%) respondents, this factor is not important. Whereas
9 (17%) respondents believe this factor as important factor and remaining 5 (9.4%)
respondents believe this factor as very important factor. Figure 4.69 blow presents the
distribution of bankers on the basis of lack of awareness among the bank branches.
Figure 4.69 Lack of Awareness among Bank Branches as a Responsible Factor
Third important factor asked to bankers as a responsible factor for financing gap in
MSMEs is ‘Limited branches availing services to MSMEs’. Following table 4.70 presents the
details regarding this factor.
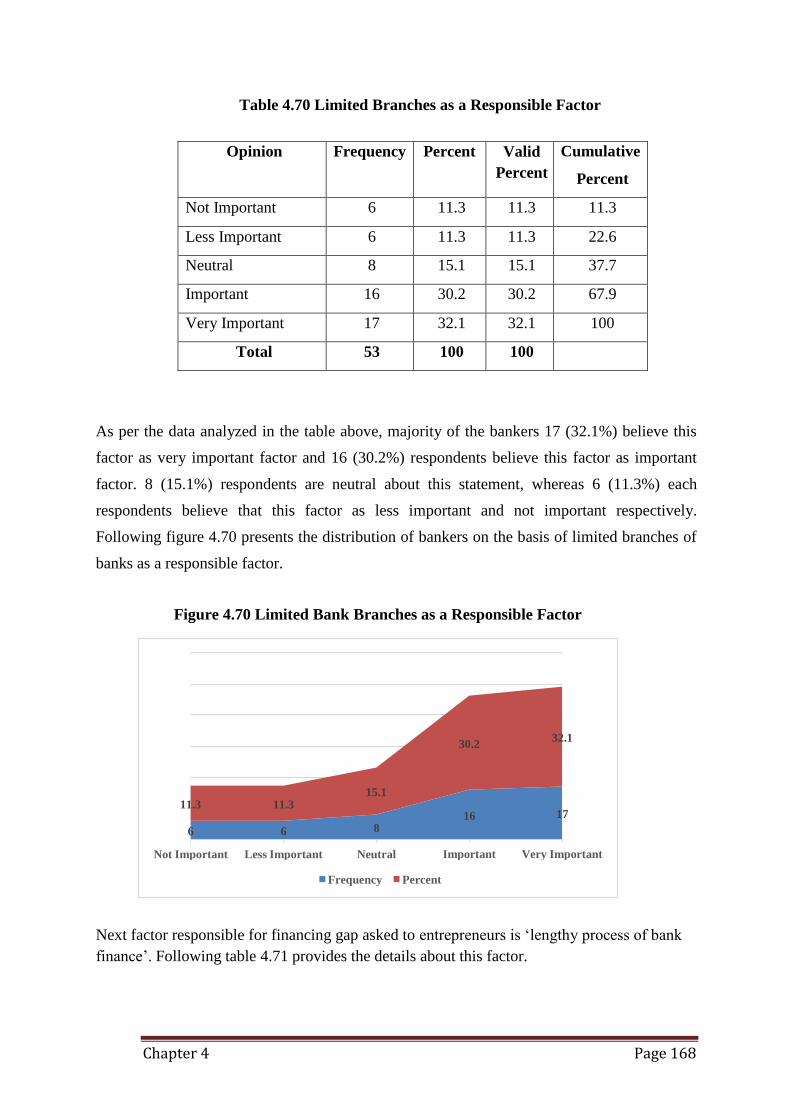
Chapter 4 Page 168
30.2 32.1
15.1 11.3 11.3
16 17
6 6
Not Important Less Important
8
Neutral Important Very Important
Frequency Percent
Table 4.70 Limited Branches as a Responsible Factor
Opinion Frequency Percent Valid
Percent
Cumulative
Percent
Not Important 6 11.3 11.3 11.3
Less Important 6 11.3 11.3 22.6
Neutral 8 15.1 15.1 37.7
Important 16 30.2 30.2 67.9
Very Important 17 32.1 32.1 100
Total 53 100 100
As per the data analyzed in the table above, majority of the bankers 17 (32.1%) believe this
factor as very important factor and 16 (30.2%) respondents believe this factor as important
factor. 8 (15.1%) respondents are neutral about this statement, whereas 6 (11.3%) each
respondents believe that this factor as less important and not important respectively.
Following figure 4.70 presents the distribution of bankers on the basis of limited branches of
banks as a responsible factor.
Figure 4.70 Limited Bank Branches as a Responsible Factor
Next factor responsible for financing gap asked to entrepreneurs is ‘lengthy process of bank
finance’. Following table 4.71 provides the details about this factor.
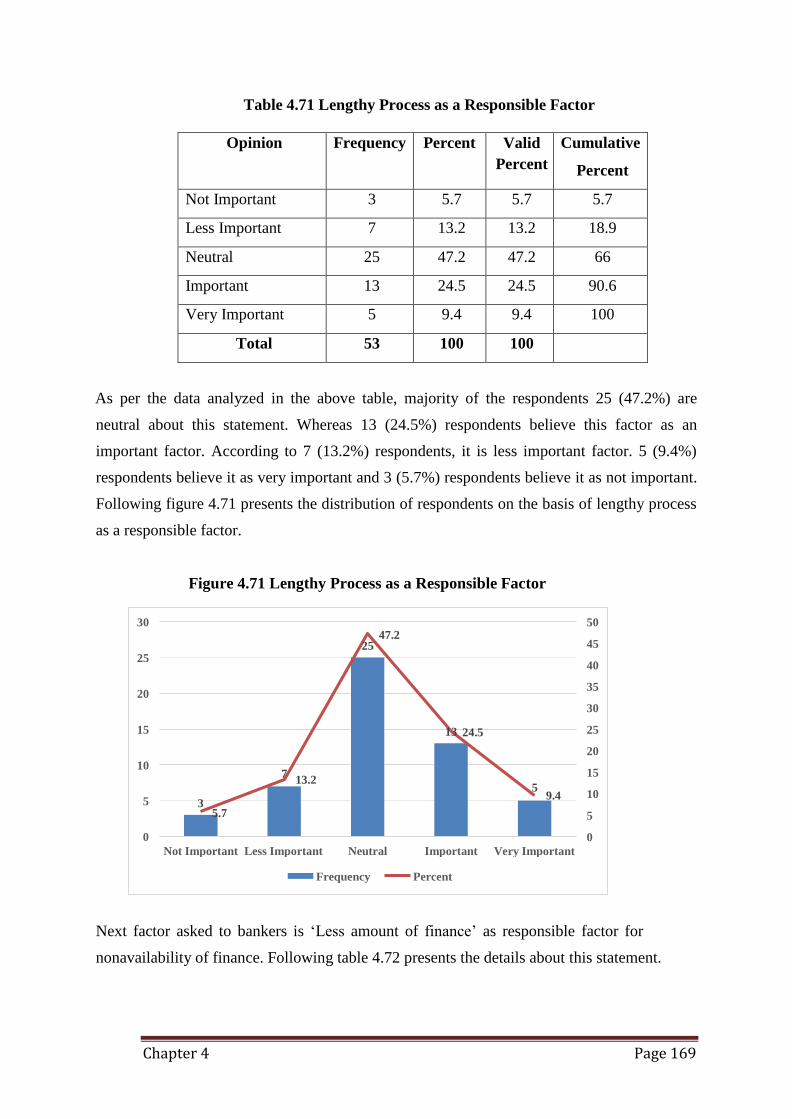
Chapter 4 Page 169
30 47.2
25 25
20
15 13 24.5
10 7
13.2
5 3
5 9.4
5.7
0
50
45
40
35
30
25
20
15
10
5
0
Not Important Less Important Neutral Important Very Important
Frequency Percent
Table 4.71 Lengthy Process as a Responsible Factor
Opinion Frequency Percent Valid
Percent
Cumulative
Percent
Not Important 3 5.7 5.7 5.7
Less Important 7 13.2 13.2 18.9
Neutral 25 47.2 47.2 66
Important 13 24.5 24.5 90.6
Very Important 5 9.4 9.4 100
Total 53 100 100
As per the data analyzed in the above table, majority of the respondents 25 (47.2%) are
neutral about this statement. Whereas 13 (24.5%) respondents believe this factor as an
important factor. According to 7 (13.2%) respondents, it is less important factor. 5 (9.4%)
respondents believe it as very important and 3 (5.7%) respondents believe it as not important.
Following figure 4.71 presents the distribution of respondents on the basis of lengthy process
as a responsible factor.
Figure 4.71 Lengthy Process as a Responsible Factor
Next factor asked to bankers is ‘Less amount of finance’ as responsible factor for
nonavailability of finance. Following table 4.72 presents the details about this statement.
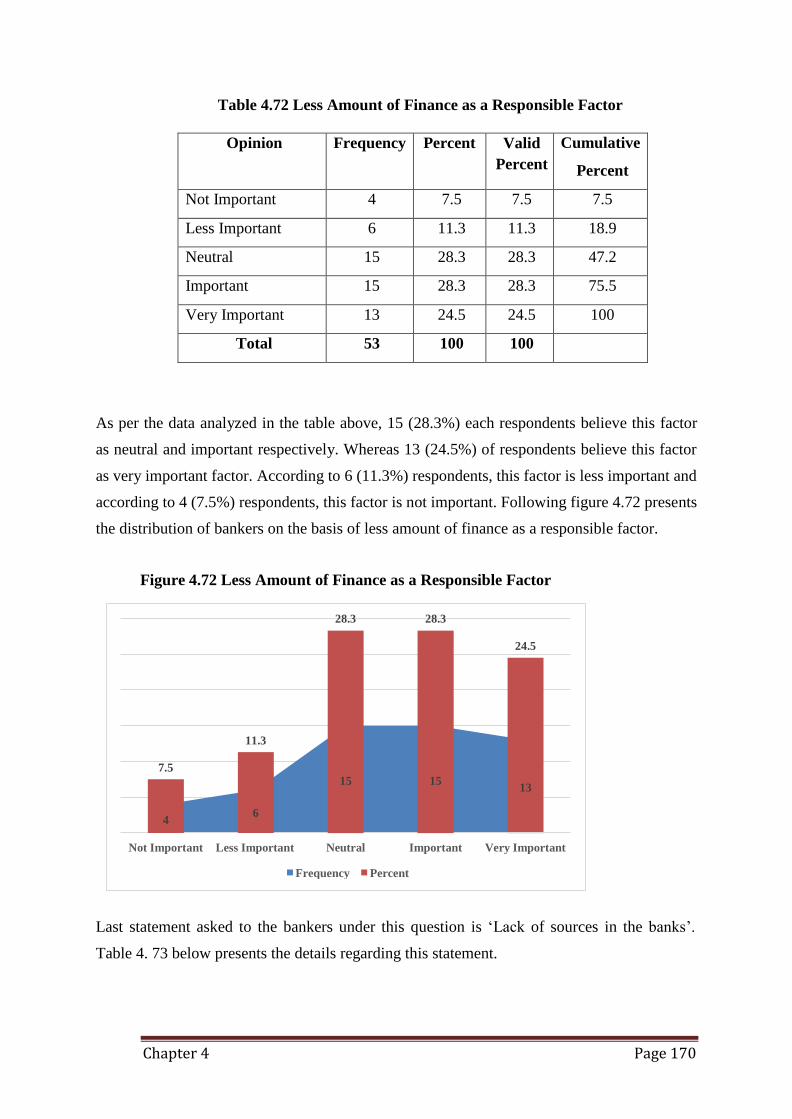
Chapter 4 Page 170
28.3 28.3
24.5
11.3
7.5
13
Not Important Less Important Neutral Important Very Important
Frequency Percent
15
15
4
6
Table 4.72 Less Amount of Finance as a Responsible Factor
Opinion Frequency Percent Valid
Percent
Cumulative
Percent
Not Important 4 7.5 7.5 7.5
Less Important 6 11.3 11.3 18.9
Neutral 15 28.3 28.3 47.2
Important 15 28.3 28.3 75.5
Very Important 13 24.5 24.5 100
Total 53 100 100
As per the data analyzed in the table above, 15 (28.3%) each respondents believe this factor
as neutral and important respectively. Whereas 13 (24.5%) of respondents believe this factor
as very important factor. According to 6 (11.3%) respondents, this factor is less important and
according to 4 (7.5%) respondents, this factor is not important. Following figure 4.72 presents
the distribution of bankers on the basis of less amount of finance as a responsible factor.
Figure 4.72 Less Amount of Finance as a Responsible Factor
Last statement asked to the bankers under this question is ‘Lack of sources in the banks’.
Table 4. 73 below presents the details regarding this statement.
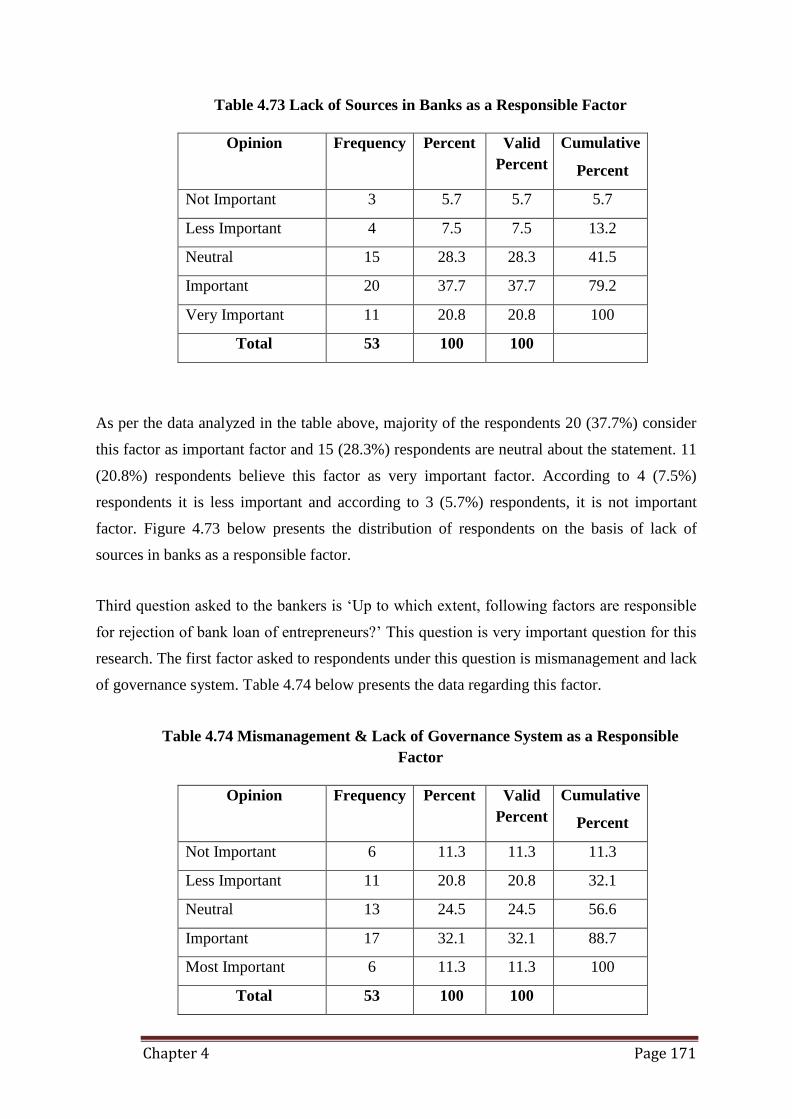
Chapter 4 Page 171
Table 4.73 Lack of Sources in Banks as a Responsible Factor
Opinion Frequency Percent Valid
Percent
Cumulative
Percent
Not Important 3 5.7 5.7 5.7
Less Important 4 7.5 7.5 13.2
Neutral 15 28.3 28.3 41.5
Important 20 37.7 37.7 79.2
Very Important 11 20.8 20.8 100
Total 53 100 100
As per the data analyzed in the table above, majority of the respondents 20 (37.7%) consider
this factor as important factor and 15 (28.3%) respondents are neutral about the statement. 11
(20.8%) respondents believe this factor as very important factor. According to 4 (7.5%)
respondents it is less important and according to 3 (5.7%) respondents, it is not important
factor. Figure 4.73 below presents the distribution of respondents on the basis of lack of
sources in banks as a responsible factor.
Third question asked to the bankers is ‘Up to which extent, following factors are responsible
for rejection of bank loan of entrepreneurs?’ This question is very important question for this
research. The first factor asked to respondents under this question is mismanagement and lack
of governance system. Table 4.74 below presents the data regarding this factor.
Table 4.74 Mismanagement & Lack of Governance System as a Responsible
Factor
Opinion Frequency Percent Valid
Percent
Cumulative
Percent
Not Important 6 11.3 11.3 11.3
Less Important 11 20.8 20.8 32.1
Neutral 13 24.5 24.5 56.6
Important 17 32.1 32.1 88.7
Most Important 6 11.3 11.3 100
Total 53 100 100
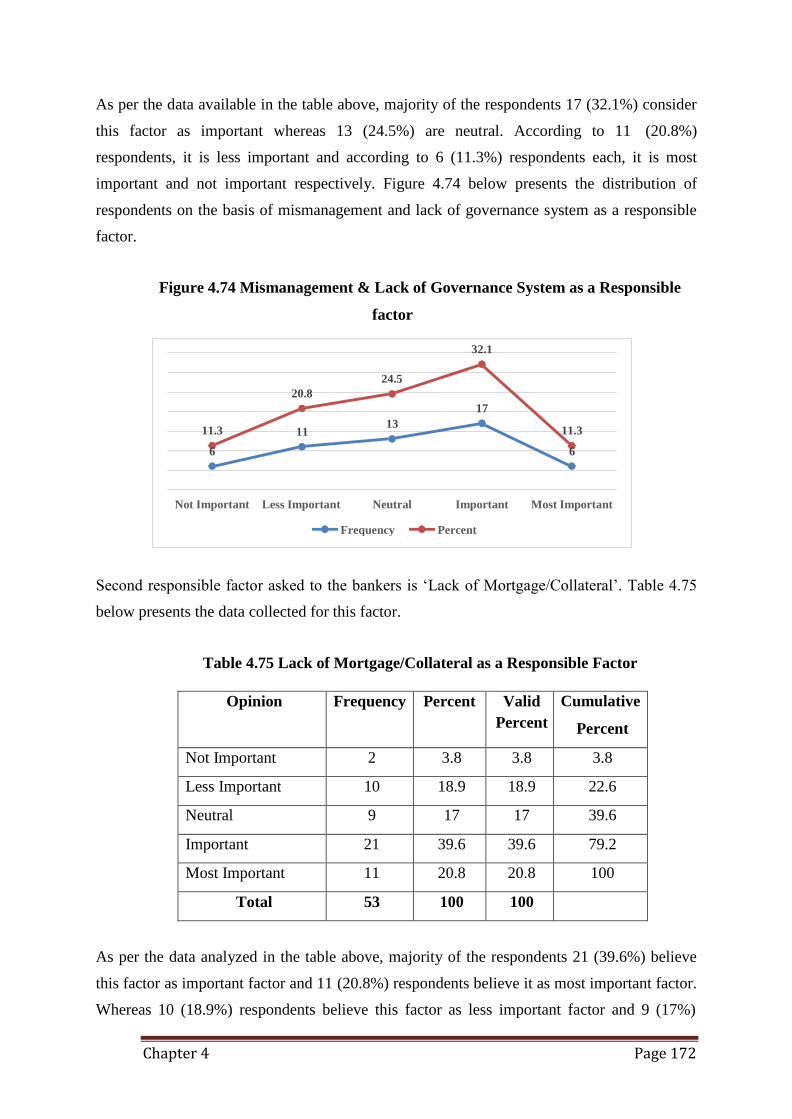
Chapter 4 Page 172
32.1
24.5
20.8
17
11.3
6
11 13
11.3
6
Not Important Less Important Neutral Important Most Important
Frequency Percent
As per the data available in the table above, majority of the respondents 17 (32.1%) consider
this factor as important whereas 13 (24.5%) are neutral. According to 11 (20.8%)
respondents, it is less important and according to 6 (11.3%) respondents each, it is most
important and not important respectively. Figure 4.74 below presents the distribution of
respondents on the basis of mismanagement and lack of governance system as a responsible
factor.
Figure 4.74 Mismanagement & Lack of Governance System as a Responsible
factor
Second responsible factor asked to the bankers is ‘Lack of Mortgage/Collateral’. Table 4.75
below presents the data collected for this factor.
Table 4.75 Lack of Mortgage/Collateral as a Responsible Factor
Opinion Frequency Percent Valid
Percent
Cumulative
Percent
Not Important 2 3.8 3.8 3.8
Less Important 10 18.9 18.9 22.6
Neutral 9 17 17 39.6
Important 21 39.6 39.6 79.2
Most Important 11 20.8 20.8 100
Total 53 100 100
As per the data analyzed in the table above, majority of the respondents 21 (39.6%) believe
this factor as important factor and 11 (20.8%) respondents believe it as most important factor.
Whereas 10 (18.9%) respondents believe this factor as less important factor and 9 (17%)
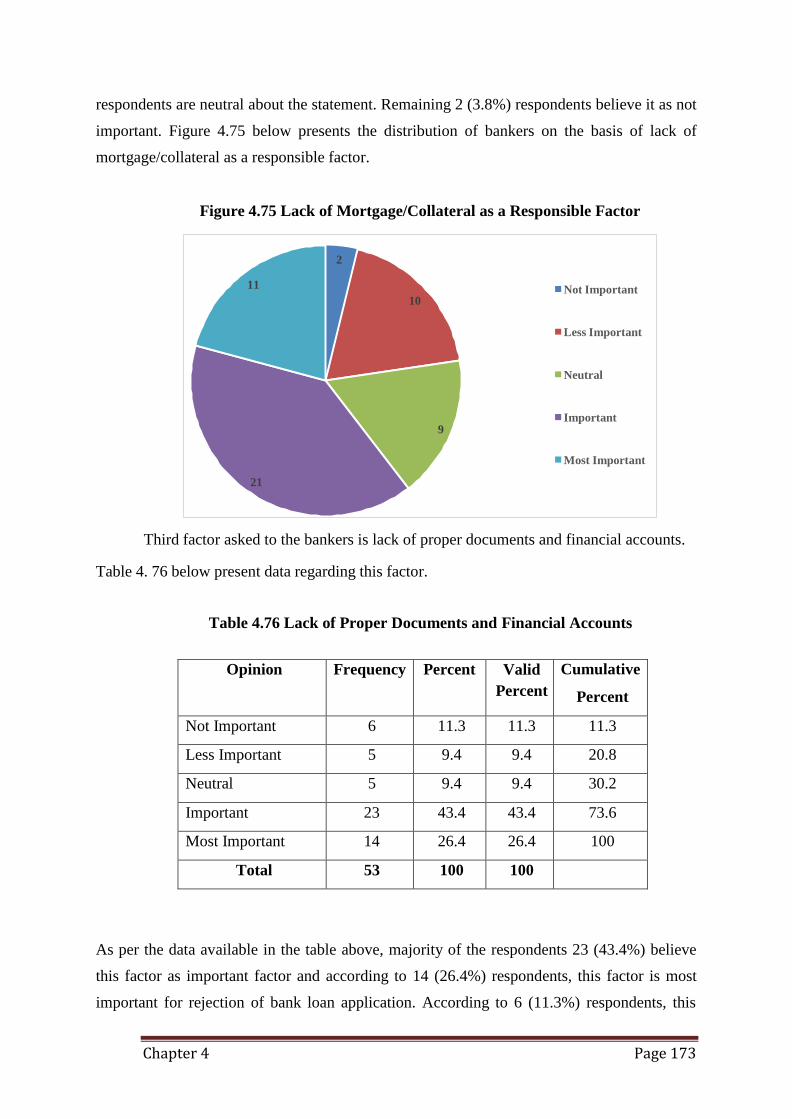
Chapter 4 Page 173
2
11 Not Important 10
Less Important
Neutral
Important 9
Most Important
21
respondents are neutral about the statement. Remaining 2 (3.8%) respondents believe it as not
important. Figure 4.75 below presents the distribution of bankers on the basis of lack of
mortgage/collateral as a responsible factor.
Figure 4.75 Lack of Mortgage/Collateral as a Responsible Factor
Third factor asked to the bankers is lack of proper documents and financial accounts.
Table 4. 76 below present data regarding this factor.
Table 4.76 Lack of Proper Documents and Financial Accounts
Opinion Frequency Percent Valid
Percent
Cumulative
Percent
Not Important 6 11.3 11.3 11.3
Less Important 5 9.4 9.4 20.8
Neutral 5 9.4 9.4 30.2
Important 23 43.4 43.4 73.6
Most Important 14 26.4 26.4 100
Total 53 100 100
As per the data available in the table above, majority of the respondents 23 (43.4%) believe
this factor as important factor and according to 14 (26.4%) respondents, this factor is most
important for rejection of bank loan application. According to 6 (11.3%) respondents, this
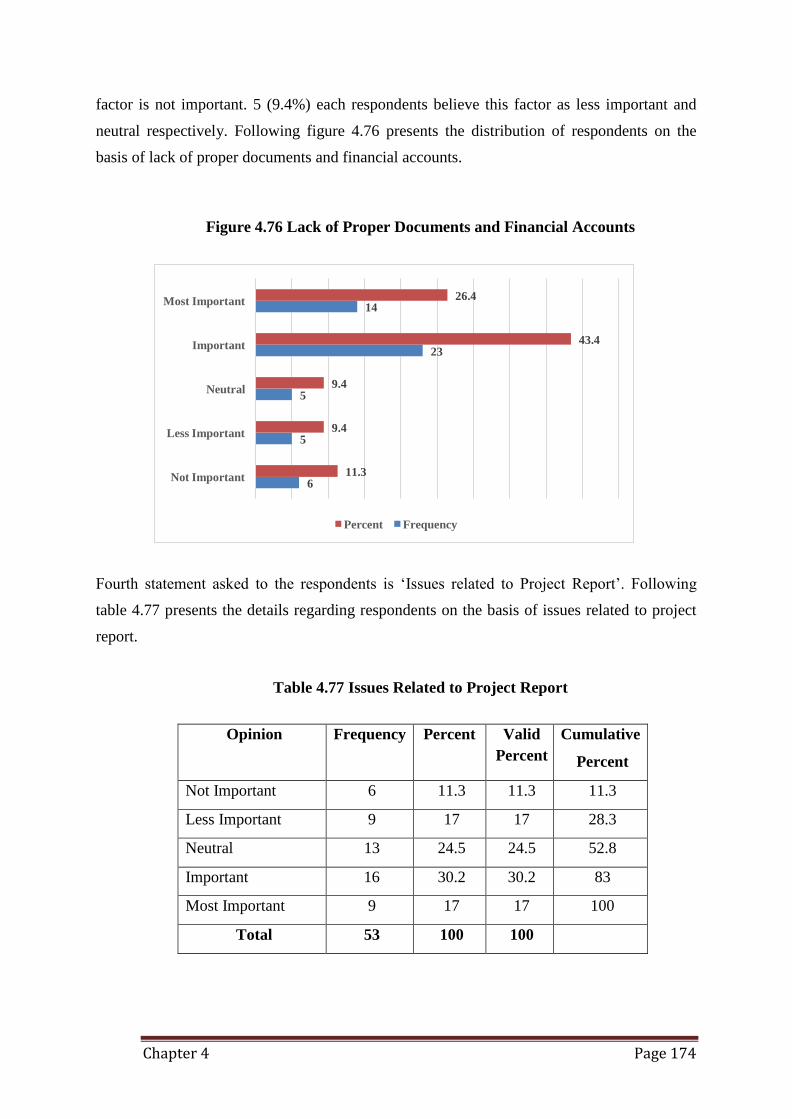
Chapter 4 Page 174
Most Important 26.4 14
Important 43.4 23
Neutral 9.4
5
Less Important 9.4 5
Not Important 11.3 6
Percent Frequency
factor is not important. 5 (9.4%) each respondents believe this factor as less important and
neutral respectively. Following figure 4.76 presents the distribution of respondents on the
basis of lack of proper documents and financial accounts.
Figure 4.76 Lack of Proper Documents and Financial Accounts
Fourth statement asked to the respondents is ‘Issues related to Project Report’. Following
table 4.77 presents the details regarding respondents on the basis of issues related to project
report.
Table 4.77 Issues Related to Project Report
Opinion Frequency Percent Valid
Percent
Cumulative
Percent
Not Important 6 11.3 11.3 11.3
Less Important 9 17 17 28.3
Neutral 13 24.5 24.5 52.8
Important 16 30.2 30.2 83
Most Important 9 17 17 100
Total 53 100 100
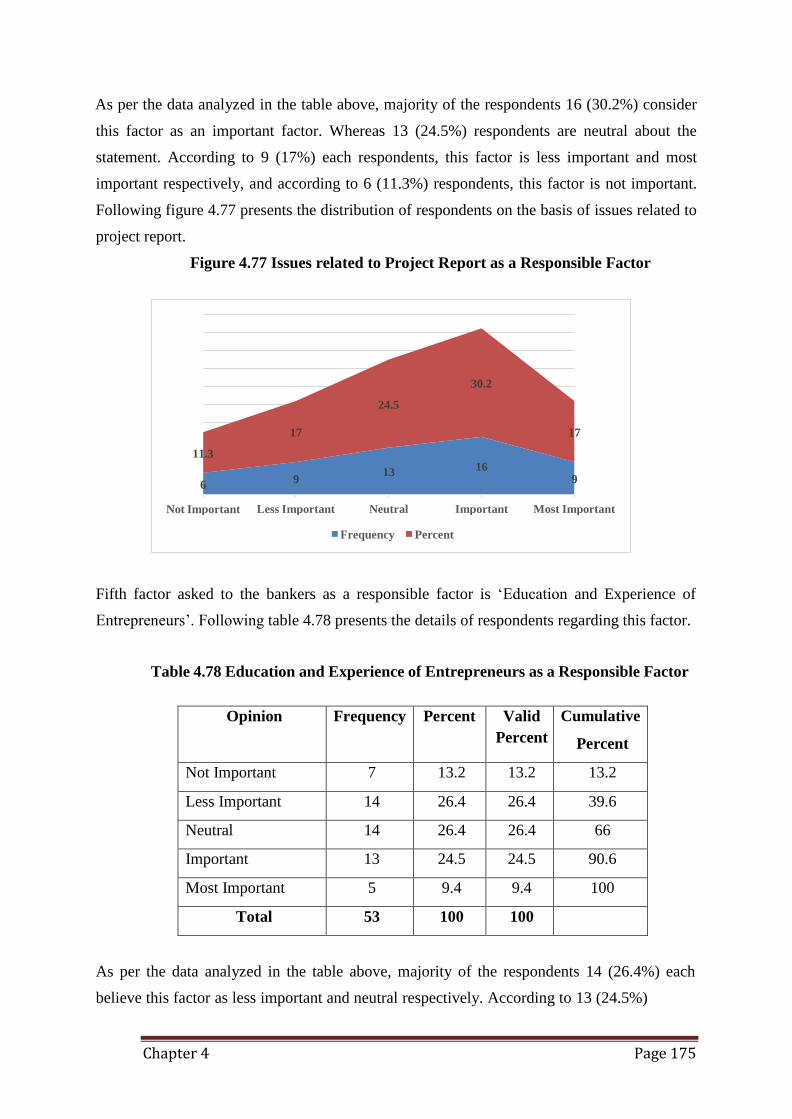
Chapter 4 Page 175
30.2
24.5
17 17
11.3 16
6
Not Important
9 13
9
Less Important Neutral Important Most Important
Frequency Percent
As per the data analyzed in the table above, majority of the respondents 16 (30.2%) consider
this factor as an important factor. Whereas 13 (24.5%) respondents are neutral about the
statement. According to 9 (17%) each respondents, this factor is less important and most
important respectively, and according to 6 (11.3%) respondents, this factor is not important.
Following figure 4.77 presents the distribution of respondents on the basis of issues related to
project report.
Figure 4.77 Issues related to Project Report as a Responsible Factor
Fifth factor asked to the bankers as a responsible factor is ‘Education and Experience of
Entrepreneurs’. Following table 4.78 presents the details of respondents regarding this factor.
Table 4.78 Education and Experience of Entrepreneurs as a Responsible Factor
Opinion Frequency Percent Valid
Percent
Cumulative
Percent
Not Important 7 13.2 13.2 13.2
Less Important 14 26.4 26.4 39.6
Neutral 14 26.4 26.4 66
Important 13 24.5 24.5 90.6
Most Important 5 9.4 9.4 100
Total 53 100 100
As per the data analyzed in the table above, majority of the respondents 14 (26.4%) each
believe this factor as less important and neutral respectively. According to 13 (24.5%)
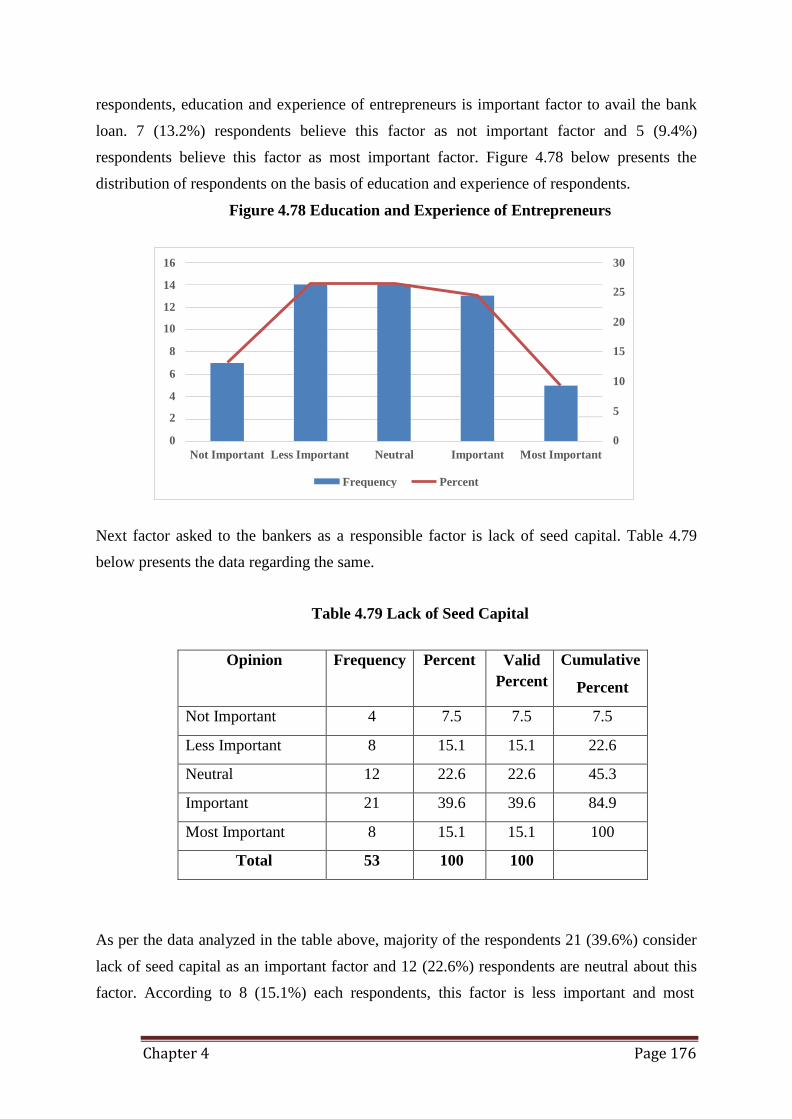
Chapter 4 Page 176
16 30
14 25
12
10 20
8 15
6 10
4
2 5
0 0
Not Important Less Important Neutral Important Most Important
Frequency Percent
respondents, education and experience of entrepreneurs is important factor to avail the bank
loan. 7 (13.2%) respondents believe this factor as not important factor and 5 (9.4%)
respondents believe this factor as most important factor. Figure 4.78 below presents the
distribution of respondents on the basis of education and experience of respondents.
Figure 4.78 Education and Experience of Entrepreneurs
Next factor asked to the bankers as a responsible factor is lack of seed capital. Table 4.79
below presents the data regarding the same.
Table 4.79 Lack of Seed Capital
Opinion Frequency Percent Valid
Percent
Cumulative
Percent
Not Important 4 7.5 7.5 7.5
Less Important 8 15.1 15.1 22.6
Neutral 12 22.6 22.6 45.3
Important 21 39.6 39.6 84.9
Most Important 8 15.1 15.1 100
Total 53 100 100
As per the data analyzed in the table above, majority of the respondents 21 (39.6%) consider
lack of seed capital as an important factor and 12 (22.6%) respondents are neutral about this
factor. According to 8 (15.1%) each respondents, this factor is less important and most
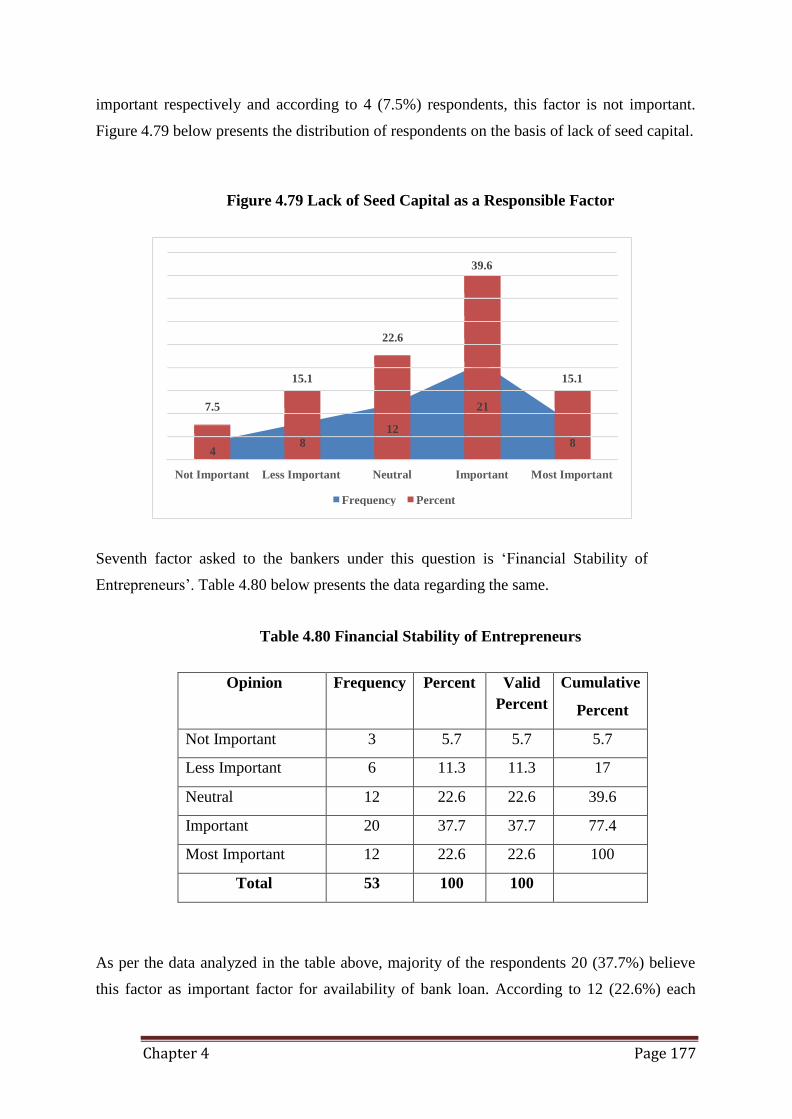
Chapter 4 Page 177
39.6
Not Important Less Important Neutral Important Most Important
Frequency Percent
important respectively and according to 4 (7.5%) respondents, this factor is not important.
Figure 4.79 below presents the distribution of respondents on the basis of lack of seed capital.
Figure 4.79 Lack of Seed Capital as a Responsible Factor
22.6
15.1 15.1
7.5
21
12
4 8 8
Seventh factor asked to the bankers under this question is ‘Financial Stability of
Entrepreneurs’. Table 4.80 below presents the data regarding the same.
Table 4.80 Financial Stability of Entrepreneurs
Opinion Frequency Percent Valid
Percent
Cumulative
Percent
Not Important 3 5.7 5.7 5.7
Less Important 6 11.3 11.3 17
Neutral 12 22.6 22.6 39.6
Important 20 37.7 37.7 77.4
Most Important 12 22.6 22.6 100
Total 53 100 100
As per the data analyzed in the table above, majority of the respondents 20 (37.7%) believe
this factor as important factor for availability of bank loan. According to 12 (22.6%) each
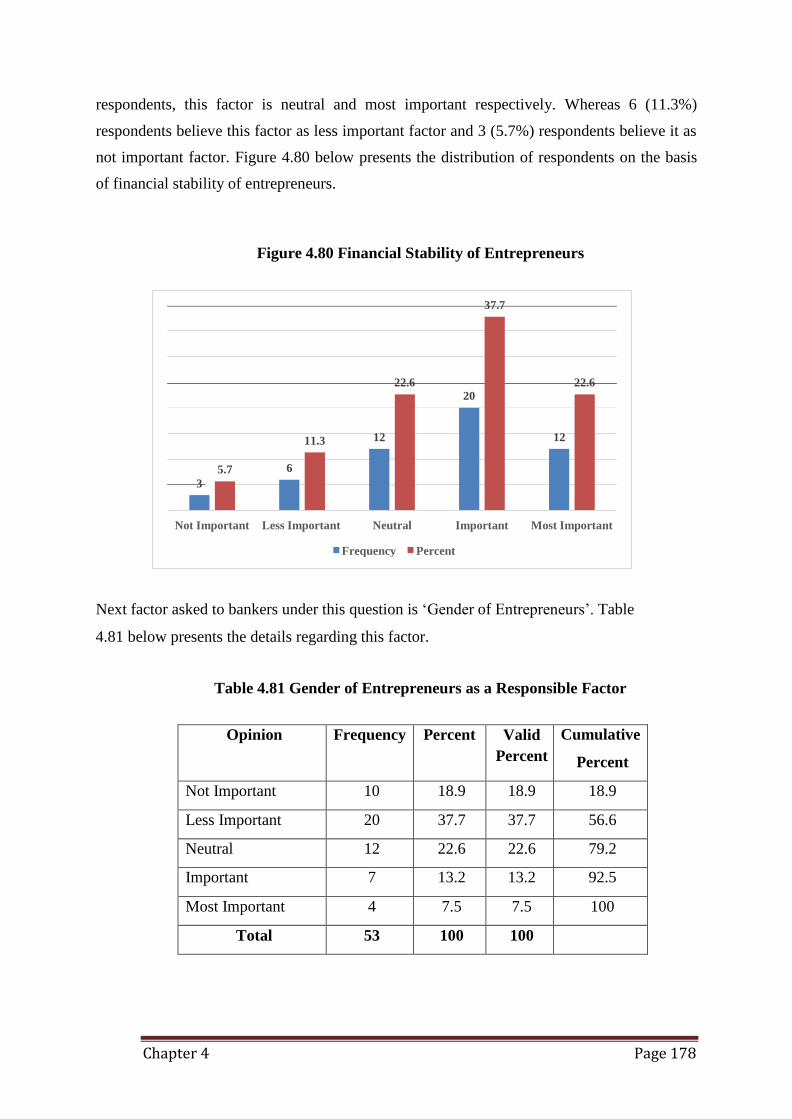
Chapter 4 Page 178
37.7
22.6 22.6
20
11.3 12 12
5.7 6
3
Not Important Less Important Neutral Important Most Important
Frequency Percent
respondents, this factor is neutral and most important respectively. Whereas 6 (11.3%)
respondents believe this factor as less important factor and 3 (5.7%) respondents believe it as
not important factor. Figure 4.80 below presents the distribution of respondents on the basis
of financial stability of entrepreneurs.
Figure 4.80 Financial Stability of Entrepreneurs
Next factor asked to bankers under this question is ‘Gender of Entrepreneurs’. Table
4.81 below presents the details regarding this factor.
Table 4.81 Gender of Entrepreneurs as a Responsible Factor
Opinion Frequency Percent Valid
Percent
Cumulative
Percent
Not Important 10 18.9 18.9 18.9
Less Important 20 37.7 37.7 56.6
Neutral 12 22.6 22.6 79.2
Important 7 13.2 13.2 92.5
Most Important 4 7.5 7.5 100
Total 53 100 100
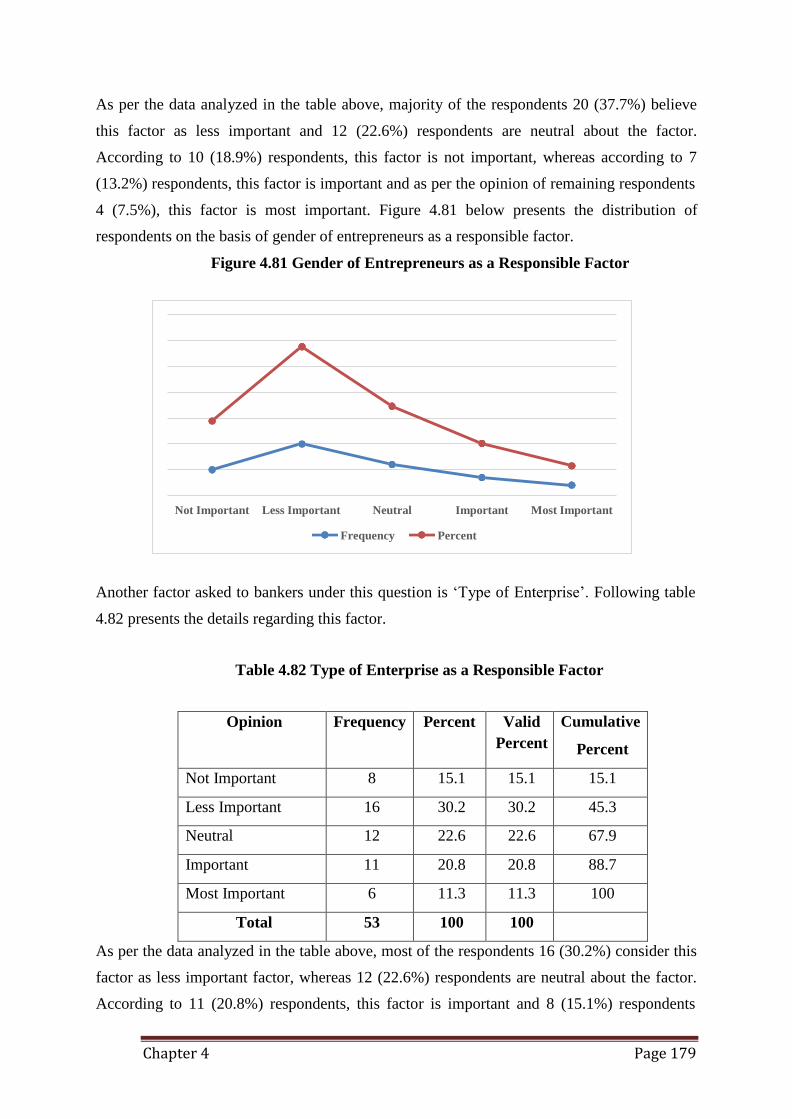
Chapter 4 Page 179
Not Important Less Important Neutral Important Most Important
Frequency Percent
As per the data analyzed in the table above, majority of the respondents 20 (37.7%) believe
this factor as less important and 12 (22.6%) respondents are neutral about the factor.
According to 10 (18.9%) respondents, this factor is not important, whereas according to 7
(13.2%) respondents, this factor is important and as per the opinion of remaining respondents
4 (7.5%), this factor is most important. Figure 4.81 below presents the distribution of
respondents on the basis of gender of entrepreneurs as a responsible factor.
Figure 4.81 Gender of Entrepreneurs as a Responsible Factor
Another factor asked to bankers under this question is ‘Type of Enterprise’. Following table
4.82 presents the details regarding this factor.
Table 4.82 Type of Enterprise as a Responsible Factor
Opinion Frequency Percent Valid
Percent
Cumulative
Percent
Not Important 8 15.1 15.1 15.1
Less Important 16 30.2 30.2 45.3
Neutral 12 22.6 22.6 67.9
Important 11 20.8 20.8 88.7
Most Important 6 11.3 11.3 100
Total 53 100 100
As per the data analyzed in the table above, most of the respondents 16 (30.2%) consider this
factor as less important factor, whereas 12 (22.6%) respondents are neutral about the factor.
According to 11 (20.8%) respondents, this factor is important and 8 (15.1%) respondents
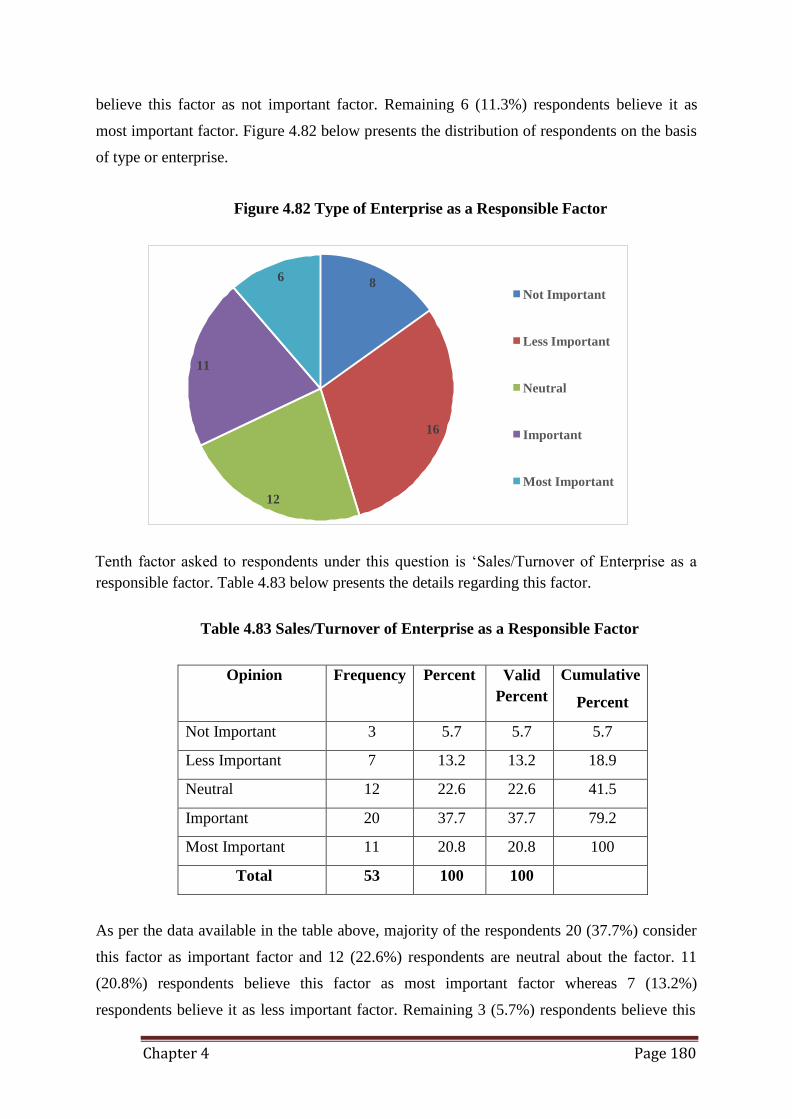
Chapter 4 Page 180
6 8 Not Important
Less Important
11
Neutral
16 Important
Most Important
12
believe this factor as not important factor. Remaining 6 (11.3%) respondents believe it as
most important factor. Figure 4.82 below presents the distribution of respondents on the basis
of type or enterprise.
Figure 4.82 Type of Enterprise as a Responsible Factor
Tenth factor asked to respondents under this question is ‘Sales/Turnover of Enterprise as a
responsible factor. Table 4.83 below presents the details regarding this factor.
Table 4.83 Sales/Turnover of Enterprise as a Responsible Factor
Opinion Frequency Percent Valid
Percent
Cumulative
Percent
Not Important 3 5.7 5.7 5.7
Less Important 7 13.2 13.2 18.9
Neutral 12 22.6 22.6 41.5
Important 20 37.7 37.7 79.2
Most Important 11 20.8 20.8 100
Total 53 100 100
As per the data available in the table above, majority of the respondents 20 (37.7%) consider
this factor as important factor and 12 (22.6%) respondents are neutral about the factor. 11
(20.8%) respondents believe this factor as most important factor whereas 7 (13.2%)
respondents believe it as less important factor. Remaining 3 (5.7%) respondents believe this
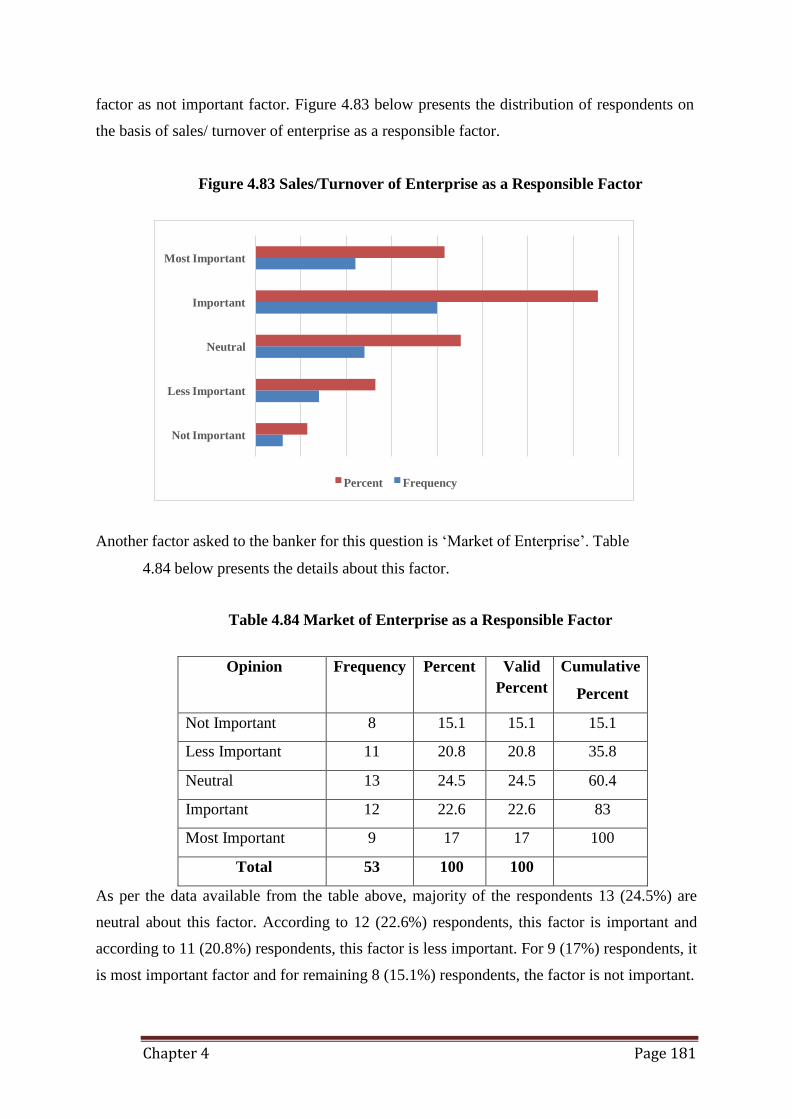
Chapter 4 Page 181
Most Important
Important
Neutral
Less Important
Not Important
Percent Frequency
factor as not important factor. Figure 4.83 below presents the distribution of respondents on
the basis of sales/ turnover of enterprise as a responsible factor.
Figure 4.83 Sales/Turnover of Enterprise as a Responsible Factor
Another factor asked to the banker for this question is ‘Market of Enterprise’. Table
4.84 below presents the details about this factor.
Table 4.84 Market of Enterprise as a Responsible Factor
Opinion Frequency Percent Valid
Percent
Cumulative
Percent
Not Important 8 15.1 15.1 15.1
Less Important 11 20.8 20.8 35.8
Neutral 13 24.5 24.5 60.4
Important 12 22.6 22.6 83
Most Important 9 17 17 100
Total 53 100 100
As per the data available from the table above, majority of the respondents 13 (24.5%) are
neutral about this factor. According to 12 (22.6%) respondents, this factor is important and
according to 11 (20.8%) respondents, this factor is less important. For 9 (17%) respondents, it
is most important factor and for remaining 8 (15.1%) respondents, the factor is not important.
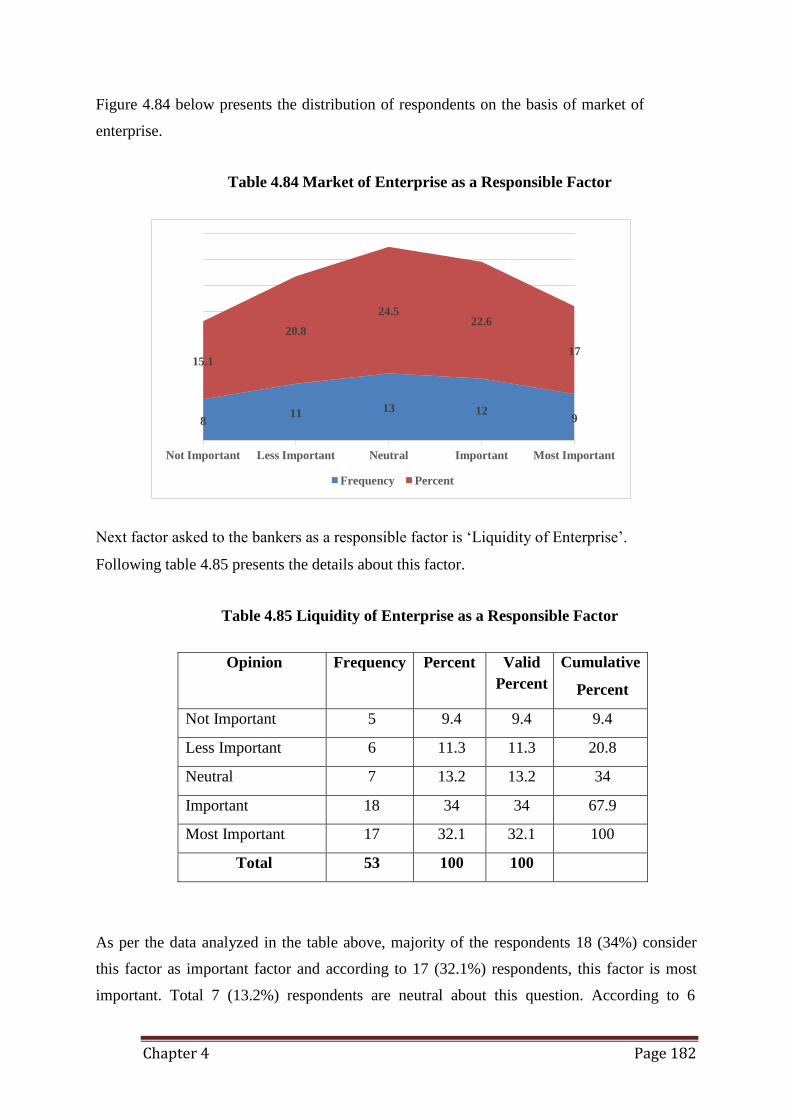
Chapter 4 Page 182
24.5
20.8 22.6
15.1 17
8 11 13 12
9
Not Important Less Important Neutral Important Most Important
Frequency Percent
Figure 4.84 below presents the distribution of respondents on the basis of market of
enterprise.
Table 4.84 Market of Enterprise as a Responsible Factor
Next factor asked to the bankers as a responsible factor is ‘Liquidity of Enterprise’.
Following table 4.85 presents the details about this factor.
Table 4.85 Liquidity of Enterprise as a Responsible Factor
Opinion Frequency Percent Valid
Percent
Cumulative
Percent
Not Important 5 9.4 9.4 9.4
Less Important 6 11.3 11.3 20.8
Neutral 7 13.2 13.2 34
Important 18 34 34 67.9
Most Important 17 32.1 32.1 100
Total 53 100 100
As per the data analyzed in the table above, majority of the respondents 18 (34%) consider
this factor as important factor and according to 17 (32.1%) respondents, this factor is most
important. Total 7 (13.2%) respondents are neutral about this question. According to 6
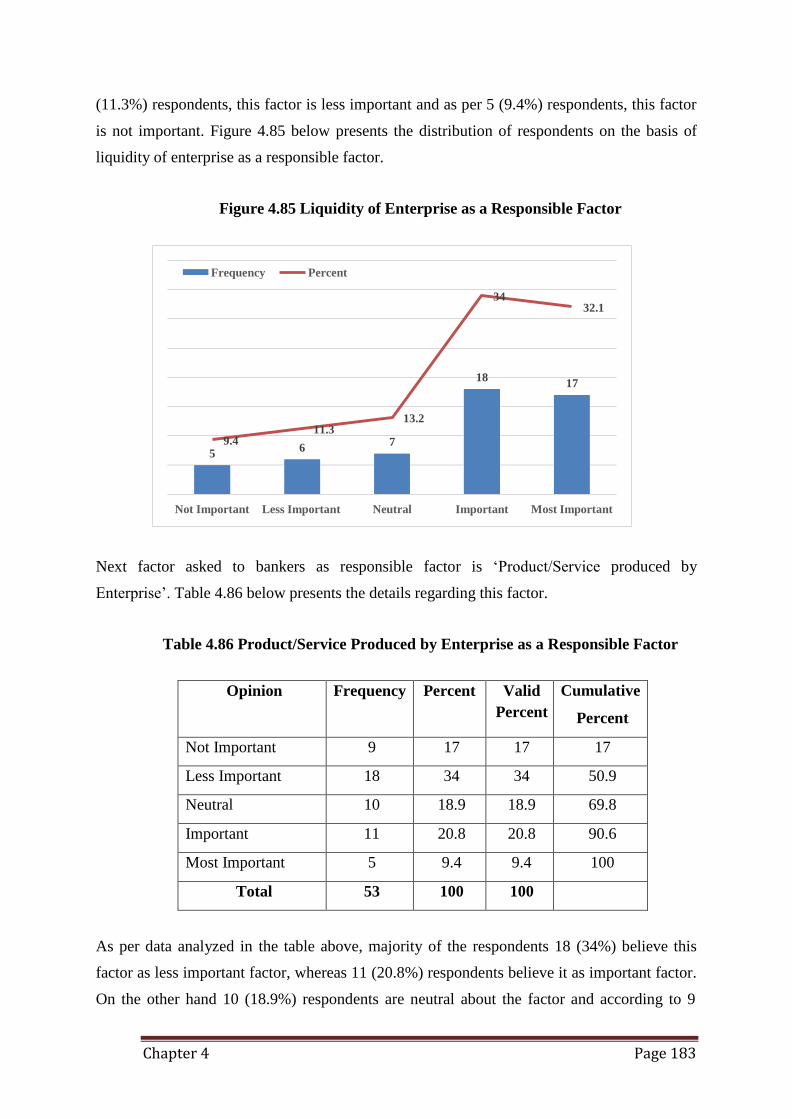
Chapter 4 Page 183
Frequency Percent
34 32.1
18 17
13.2 11.3
9.4 7 5
6
Not Important Less Important Neutral Important Most Important
(11.3%) respondents, this factor is less important and as per 5 (9.4%) respondents, this factor
is not important. Figure 4.85 below presents the distribution of respondents on the basis of
liquidity of enterprise as a responsible factor.
Figure 4.85 Liquidity of Enterprise as a Responsible Factor
Next factor asked to bankers as responsible factor is ‘Product/Service produced by
Enterprise’. Table 4.86 below presents the details regarding this factor.
Table 4.86 Product/Service Produced by Enterprise as a Responsible Factor
Opinion Frequency Percent Valid
Percent
Cumulative
Percent
Not Important 9 17 17 17
Less Important 18 34 34 50.9
Neutral 10 18.9 18.9 69.8
Important 11 20.8 20.8 90.6
Most Important 5 9.4 9.4 100
Total 53 100 100
As per data analyzed in the table above, majority of the respondents 18 (34%) believe this
factor as less important factor, whereas 11 (20.8%) respondents believe it as important factor.
On the other hand 10 (18.9%) respondents are neutral about the factor and according to 9
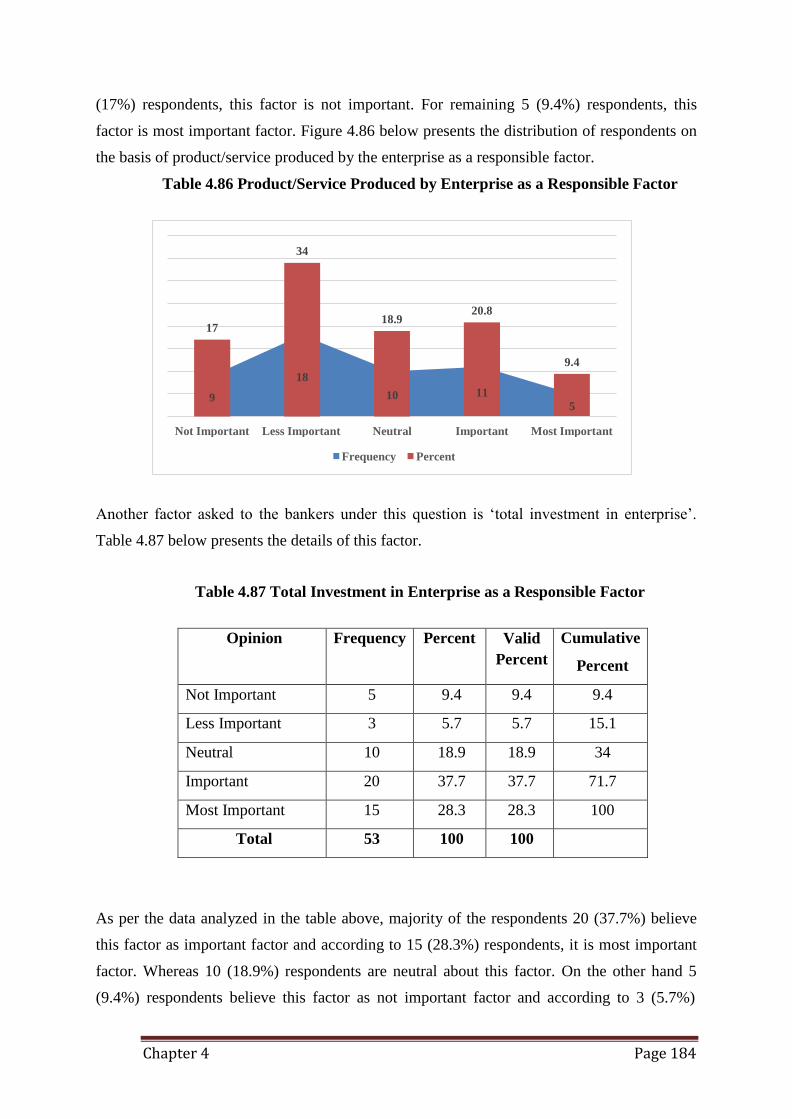
Chapter 4 Page 184
34
20.8
17 18.9
9.4
11
5
Not Important Less Important Neutral Important Most Important
Frequency Percent
18
9
10
(17%) respondents, this factor is not important. For remaining 5 (9.4%) respondents, this
factor is most important factor. Figure 4.86 below presents the distribution of respondents on
the basis of product/service produced by the enterprise as a responsible factor.
Table 4.86 Product/Service Produced by Enterprise as a Responsible Factor
Another factor asked to the bankers under this question is ‘total investment in enterprise’.
Table 4.87 below presents the details of this factor.
Table 4.87 Total Investment in Enterprise as a Responsible Factor
Opinion Frequency Percent Valid
Percent
Cumulative
Percent
Not Important 5 9.4 9.4 9.4
Less Important 3 5.7 5.7 15.1
Neutral 10 18.9 18.9 34
Important 20 37.7 37.7 71.7
Most Important 15 28.3 28.3 100
Total 53 100 100
As per the data analyzed in the table above, majority of the respondents 20 (37.7%) believe
this factor as important factor and according to 15 (28.3%) respondents, it is most important
factor. Whereas 10 (18.9%) respondents are neutral about this factor. On the other hand 5
(9.4%) respondents believe this factor as not important factor and according to 3 (5.7%)
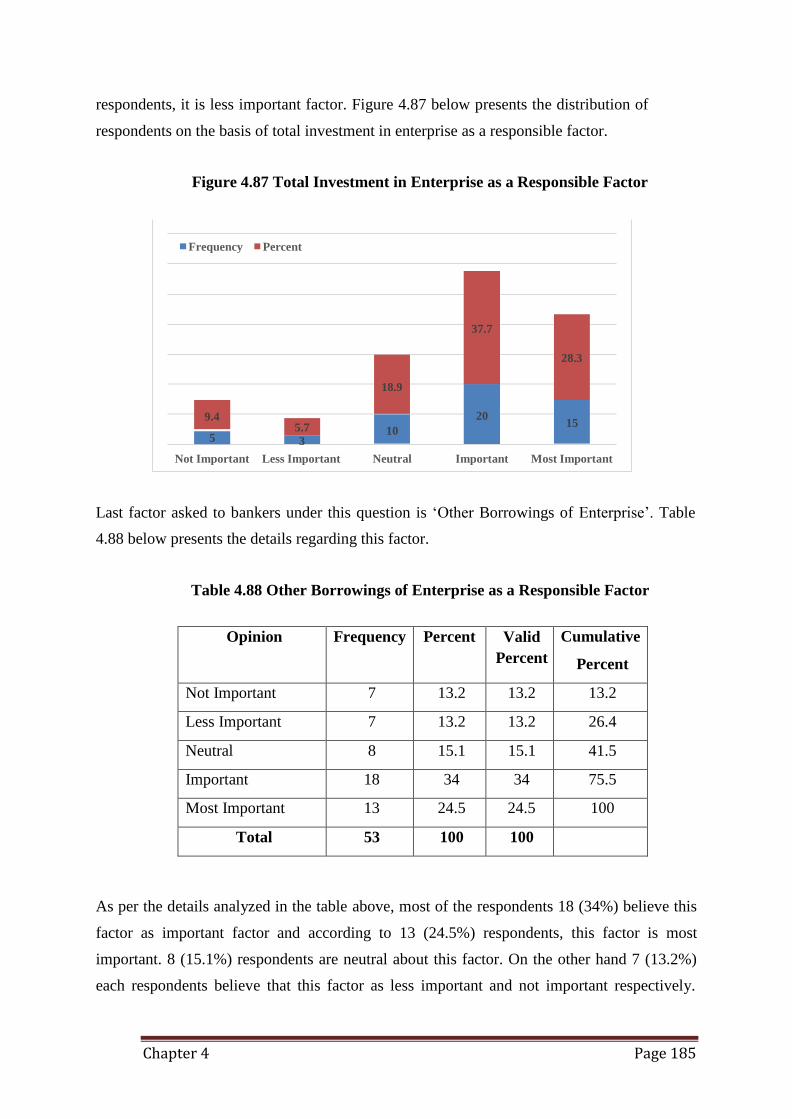
Chapter 4 Page 185
Frequency Percent
5 5.7
3
Not Important Less Important Neutral Important Most Important
10
15
9.4
20
18.9
28.3
37.7
respondents, it is less important factor. Figure 4.87 below presents the distribution of
respondents on the basis of total investment in enterprise as a responsible factor.
Figure 4.87 Total Investment in Enterprise as a Responsible Factor
Last factor asked to bankers under this question is ‘Other Borrowings of Enterprise’. Table
4.88 below presents the details regarding this factor.
Table 4.88 Other Borrowings of Enterprise as a Responsible Factor
Opinion Frequency Percent Valid
Percent
Cumulative
Percent
Not Important 7 13.2 13.2 13.2
Less Important 7 13.2 13.2 26.4
Neutral 8 15.1 15.1 41.5
Important 18 34 34 75.5
Most Important 13 24.5 24.5 100
Total 53 100 100
As per the details analyzed in the table above, most of the respondents 18 (34%) believe this
factor as important factor and according to 13 (24.5%) respondents, this factor is most
important. 8 (15.1%) respondents are neutral about this factor. On the other hand 7 (13.2%)
each respondents believe that this factor as less important and not important respectively.
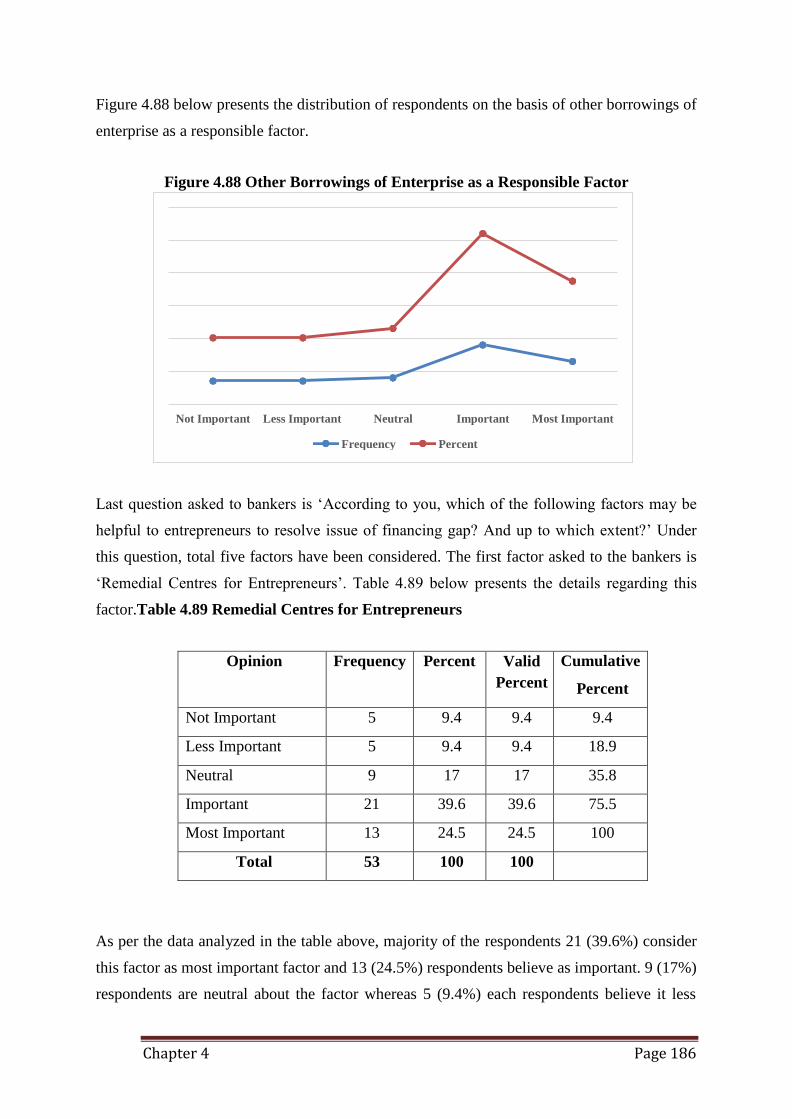
Chapter 4 Page 186
Figure 4.88 below presents the distribution of respondents on the basis of other borrowings of
enterprise as a responsible factor.
Figure 4.88 Other Borrowings of Enterprise as a Responsible Factor
Last question asked to bankers is ‘According to you, which of the following factors may be
helpful to entrepreneurs to resolve issue of financing gap? And up to which extent?’ Under
this question, total five factors have been considered. The first factor asked to the bankers is
‘Remedial Centres for Entrepreneurs’. Table 4.89 below presents the details regarding this
factor.Table 4.89 Remedial Centres for Entrepreneurs
Opinion Frequency Percent Valid
Percent
Cumulative
Percent
Not Important 5 9.4 9.4 9.4
Less Important 5 9.4 9.4 18.9
Neutral 9 17 17 35.8
Important 21 39.6 39.6 75.5
Most Important 13 24.5 24.5 100
Total 53 100 100
As per the data analyzed in the table above, majority of the respondents 21 (39.6%) consider
this factor as most important factor and 13 (24.5%) respondents believe as important. 9 (17%)
respondents are neutral about the factor whereas 5 (9.4%) each respondents believe it less
Not Important Less Important Neutral Important Most Important
Frequency Percent
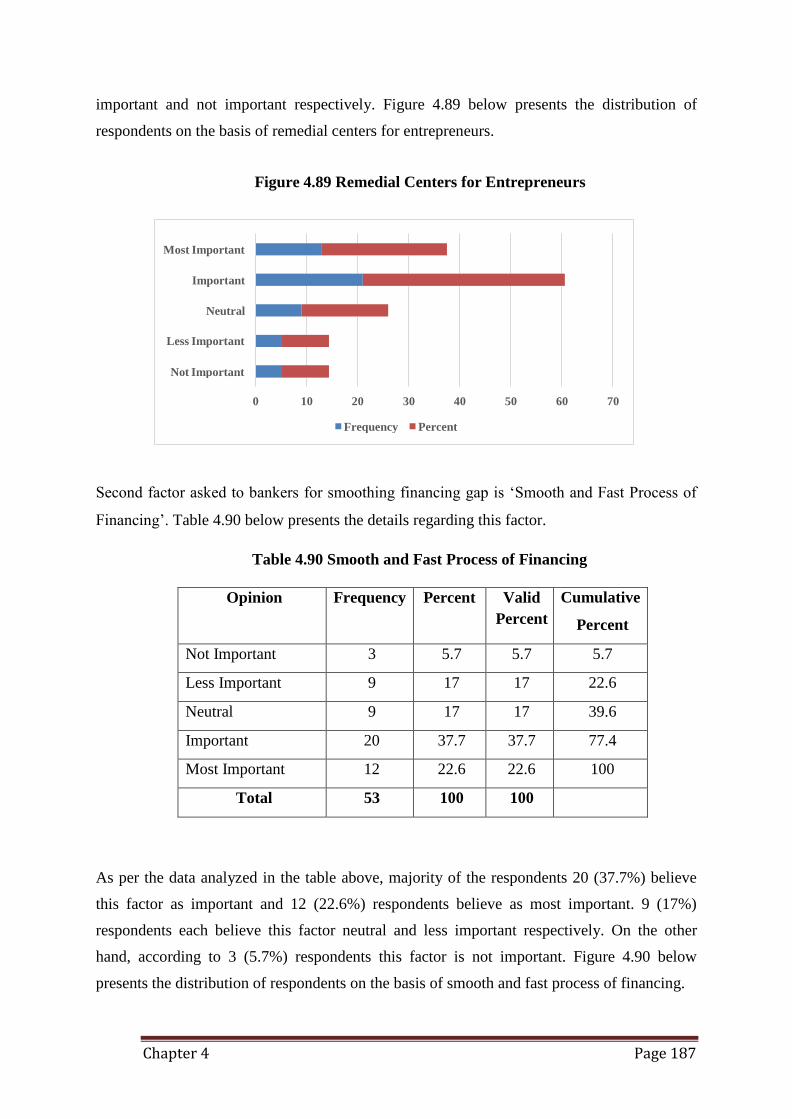
Chapter 4 Page 187
Most Important
Important
Neutral
Less Important
Not Important
0 10 20 30 40 50 60 70
Frequency Percent
important and not important respectively. Figure 4.89 below presents the distribution of
respondents on the basis of remedial centers for entrepreneurs.
Figure 4.89 Remedial Centers for Entrepreneurs
Second factor asked to bankers for smoothing financing gap is ‘Smooth and Fast Process of
Financing’. Table 4.90 below presents the details regarding this factor.
Table 4.90 Smooth and Fast Process of Financing
Opinion Frequency Percent Valid
Percent
Cumulative
Percent
Not Important 3 5.7 5.7 5.7
Less Important 9 17 17 22.6
Neutral 9 17 17 39.6
Important 20 37.7 37.7 77.4
Most Important 12 22.6 22.6 100
Total 53 100 100
As per the data analyzed in the table above, majority of the respondents 20 (37.7%) believe
this factor as important and 12 (22.6%) respondents believe as most important. 9 (17%)
respondents each believe this factor neutral and less important respectively. On the other
hand, according to 3 (5.7%) respondents this factor is not important. Figure 4.90 below
presents the distribution of respondents on the basis of smooth and fast process of financing.
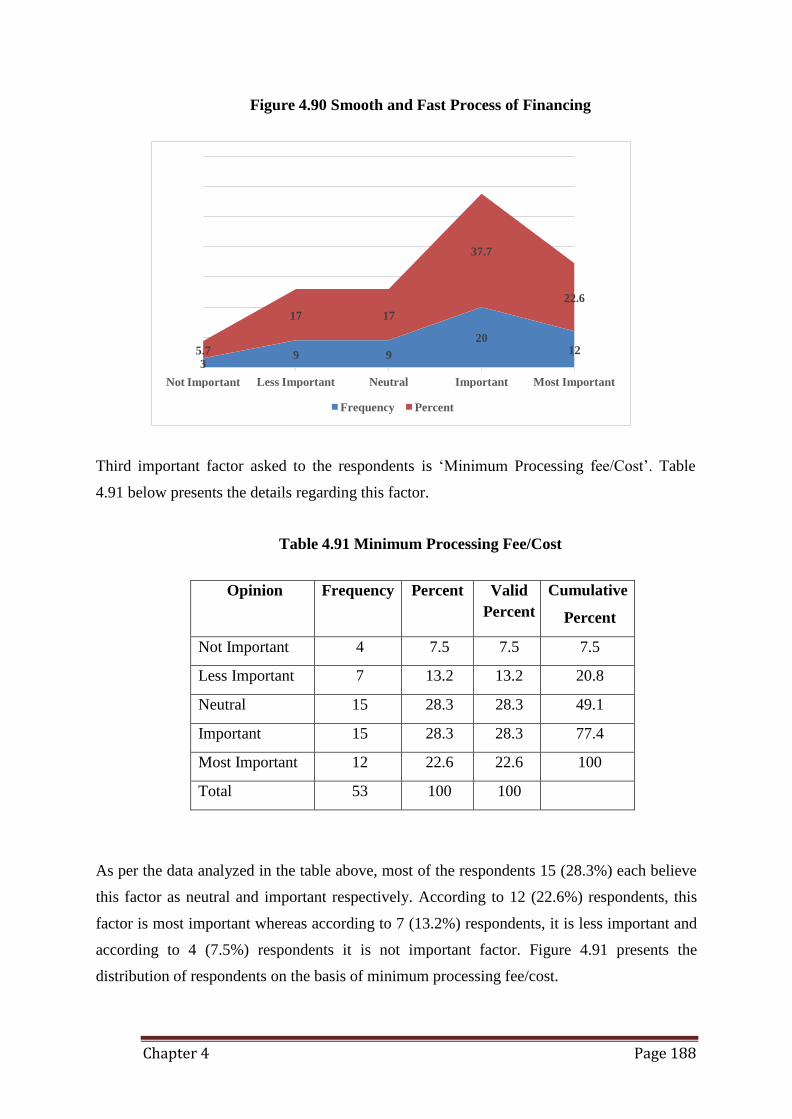
Chapter 4 Page 188
37.7
22.6
17 17
20 5.7
3
Not Important
9 9 12
Less Important Neutral Important Most Important
Frequency Percent
Figure 4.90 Smooth and Fast Process of Financing
Third important factor asked to the respondents is ‘Minimum Processing fee/Cost’. Table
4.91 below presents the details regarding this factor.
Table 4.91 Minimum Processing Fee/Cost
Opinion Frequency Percent Valid
Percent
Cumulative
Percent
Not Important 4 7.5 7.5 7.5
Less Important 7 13.2 13.2 20.8
Neutral 15 28.3 28.3 49.1
Important 15 28.3 28.3 77.4
Most Important 12 22.6 22.6 100
Total 53 100 100
As per the data analyzed in the table above, most of the respondents 15 (28.3%) each believe
this factor as neutral and important respectively. According to 12 (22.6%) respondents, this
factor is most important whereas according to 7 (13.2%) respondents, it is less important and
according to 4 (7.5%) respondents it is not important factor. Figure 4.91 presents the
distribution of respondents on the basis of minimum processing fee/cost.
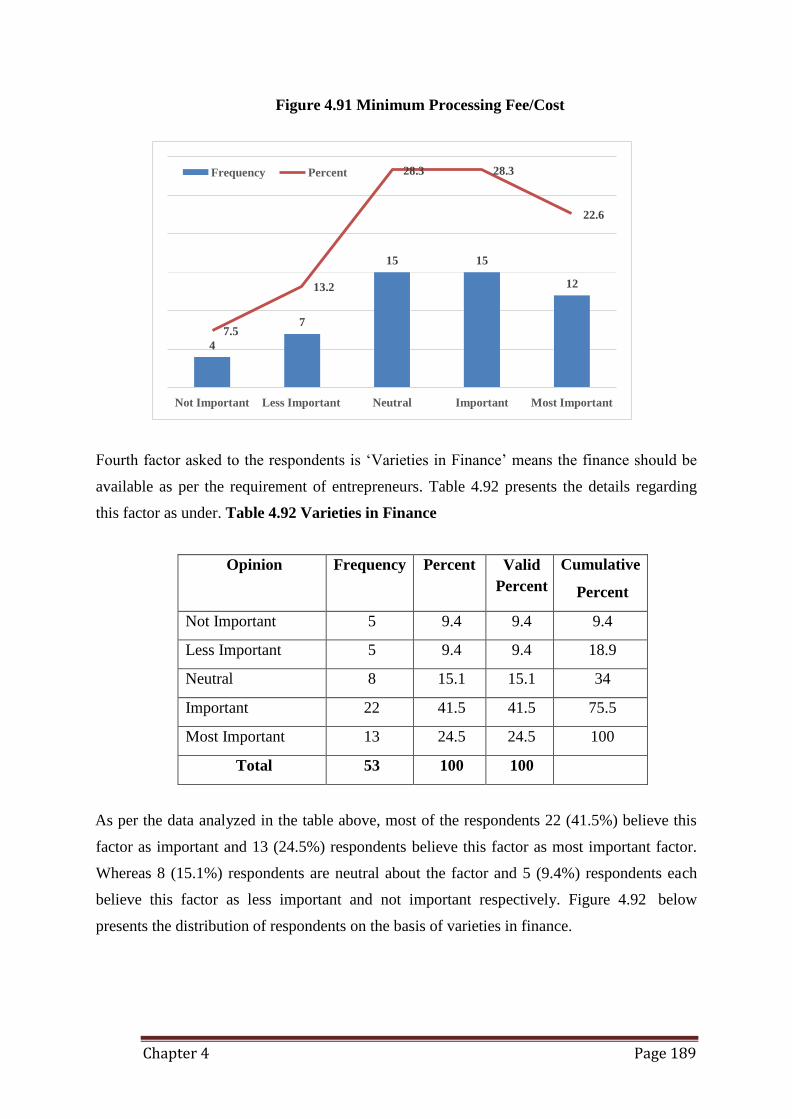
Chapter 4 Page 189
Frequency Percent 28.3 28.3
22.6
15 15
13.2 12
7.5 7
4
Not Important Less Important Neutral Important Most Important
Figure 4.91 Minimum Processing Fee/Cost
Fourth factor asked to the respondents is ‘Varieties in Finance’ means the finance should be
available as per the requirement of entrepreneurs. Table 4.92 presents the details regarding
this factor as under. Table 4.92 Varieties in Finance
Opinion Frequency Percent Valid
Percent
Cumulative
Percent
Not Important 5 9.4 9.4 9.4
Less Important 5 9.4 9.4 18.9
Neutral 8 15.1 15.1 34
Important 22 41.5 41.5 75.5
Most Important 13 24.5 24.5 100
Total 53 100 100
As per the data analyzed in the table above, most of the respondents 22 (41.5%) believe this
factor as important and 13 (24.5%) respondents believe this factor as most important factor.
Whereas 8 (15.1%) respondents are neutral about the factor and 5 (9.4%) respondents each
believe this factor as less important and not important respectively. Figure 4.92 below
presents the distribution of respondents on the basis of varieties in finance.
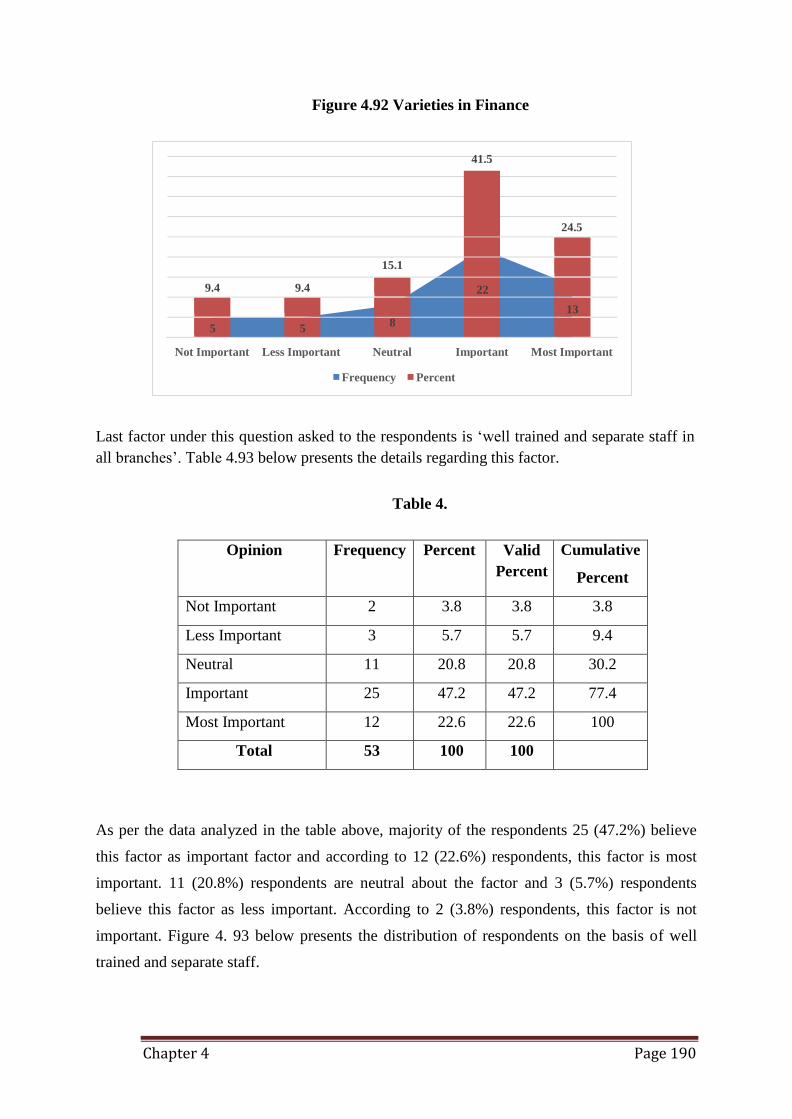
Chapter 4 Page 190
41.5
24.5
Not Important Less Important Neutral Important Most Important
Frequency Percent
Figure 4.92 Varieties in Finance
15.1
9.4 9.4 22
13
5 5 8
Last factor under this question asked to the respondents is ‘well trained and separate staff in
all branches’. Table 4.93 below presents the details regarding this factor.
Table 4.
Opinion Frequency Percent Valid
Percent
Cumulative
Percent
Not Important 2 3.8 3.8 3.8
Less Important 3 5.7 5.7 9.4
Neutral 11 20.8 20.8 30.2
Important 25 47.2 47.2 77.4
Most Important 12 22.6 22.6 100
Total 53 100 100
As per the data analyzed in the table above, majority of the respondents 25 (47.2%) believe
this factor as important factor and according to 12 (22.6%) respondents, this factor is most
important. 11 (20.8%) respondents are neutral about the factor and 3 (5.7%) respondents
believe this factor as less important. According to 2 (3.8%) respondents, this factor is not
important. Figure 4. 93 below presents the distribution of respondents on the basis of well
trained and separate staff.
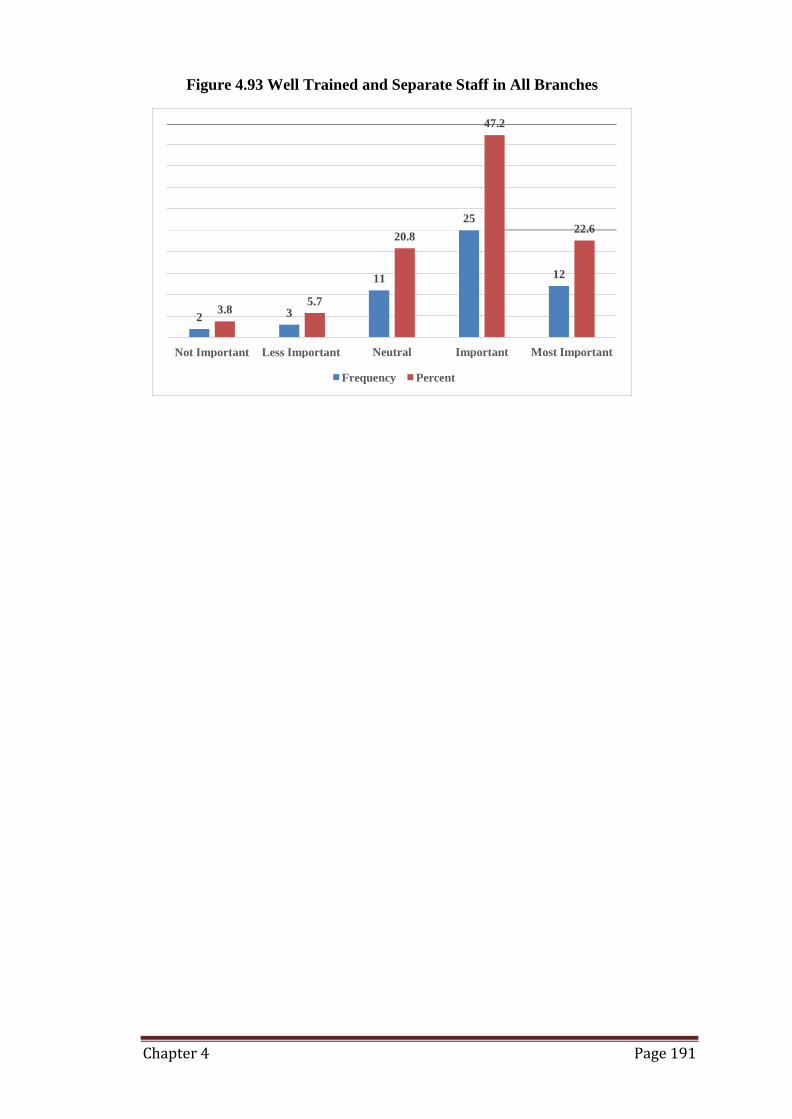
Chapter 4 Page 191
47.2
25
20.8 22.6
11 12
2 3.8
5.7 3
Not Important Less Important Neutral Important Most Important
Frequency Percent
Figure 4.93 Well Trained and Separate Staff in All Branches
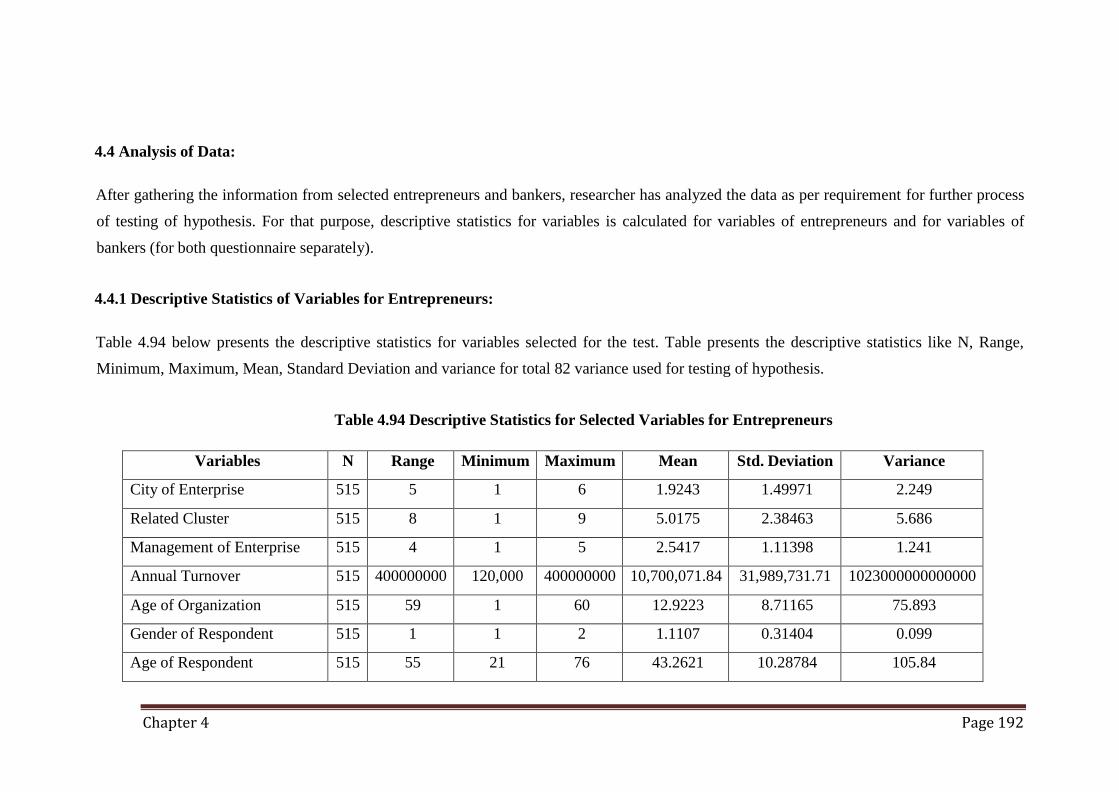
Chapter 4 Page 192
4.4 Analysis of Data:
After gathering the information from selected entrepreneurs and bankers, researcher has analyzed the data as per requirement for further process
of testing of hypothesis. For that purpose, descriptive statistics for variables is calculated for variables of entrepreneurs and for variables of
bankers (for both questionnaire separately).
4.4.1 Descriptive Statistics of Variables for Entrepreneurs:
Table 4.94 below presents the descriptive statistics for variables selected for the test. Table presents the descriptive statistics like N, Range,
Minimum, Maximum, Mean, Standard Deviation and variance for total 82 variance used for testing of hypothesis.
Table 4.94 Descriptive Statistics for Selected Variables for Entrepreneurs
Variables N Range Minimum Maximum Mean Std. Deviation Variance
City of Enterprise 515 5 1 6 1.9243 1.49971 2.249
Related Cluster 515 8 1 9 5.0175 2.38463 5.686
Management of Enterprise 515 4 1 5 2.5417 1.11398 1.241
Annual Turnover 515 400000000 120,000 400000000 10,700,071.84 31,989,731.71 1023000000000000
Age of Organization 515 59 1 60 12.9223 8.71165 75.893
Gender of Respondent 515 1 1 2 1.1107 0.31404 0.099
Age of Respondent 515 55 21 76 43.2621 10.28784 105.84
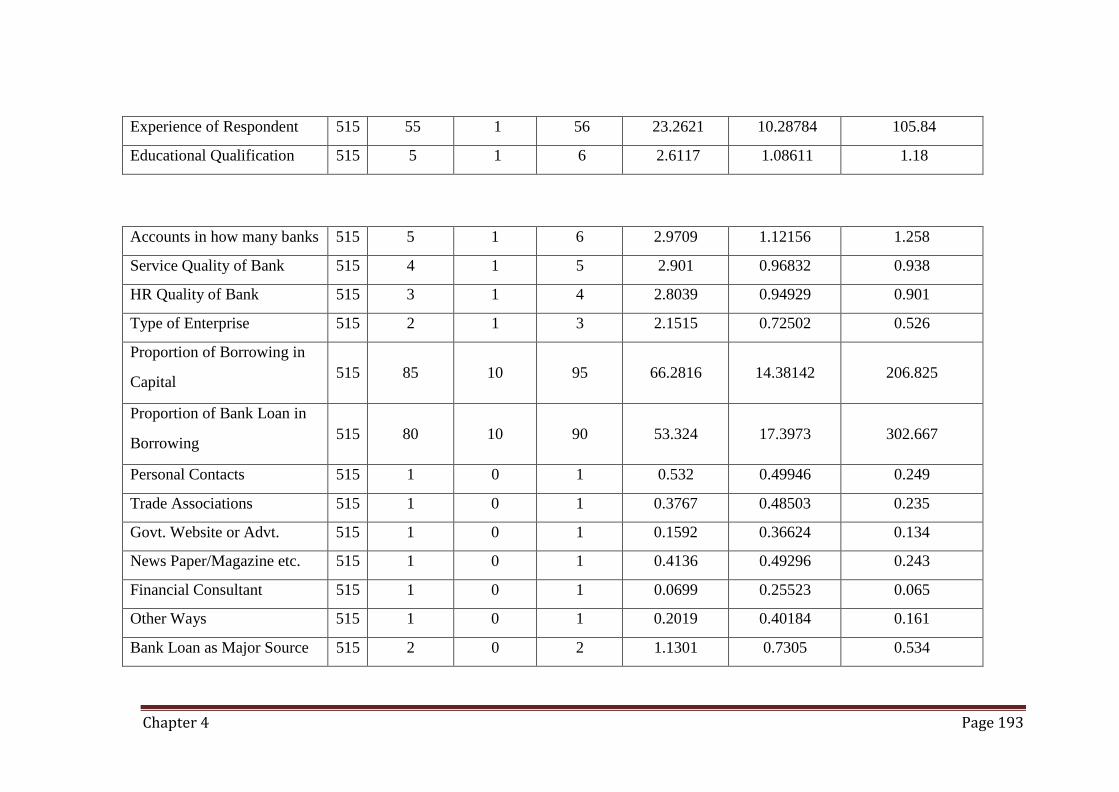
Chapter 4 Page 193
Experience of Respondent 515 55 1 56 23.2621 10.28784 105.84
Educational Qualification 515 5 1 6 2.6117 1.08611 1.18
Accounts in how many banks 515 5 1 6 2.9709 1.12156 1.258
Service Quality of Bank 515 4 1 5 2.901 0.96832 0.938
HR Quality of Bank 515 3 1 4 2.8039 0.94929 0.901
Type of Enterprise 515 2 1 3 2.1515 0.72502 0.526
Proportion of Borrowing in
Capital
515
85
10
95
66.2816
14.38142
206.825
Proportion of Bank Loan in
Borrowing
515
80
10
90
53.324
17.3973
302.667
Personal Contacts 515 1 0 1 0.532 0.49946 0.249
Trade Associations 515 1 0 1 0.3767 0.48503 0.235
Govt. Website or Advt. 515 1 0 1 0.1592 0.36624 0.134
News Paper/Magazine etc. 515 1 0 1 0.4136 0.49296 0.243
Financial Consultant 515 1 0 1 0.0699 0.25523 0.065
Other Ways 515 1 0 1 0.2019 0.40184 0.161
Bank Loan as Major Source 515 2 0 2 1.1301 0.7305 0.534
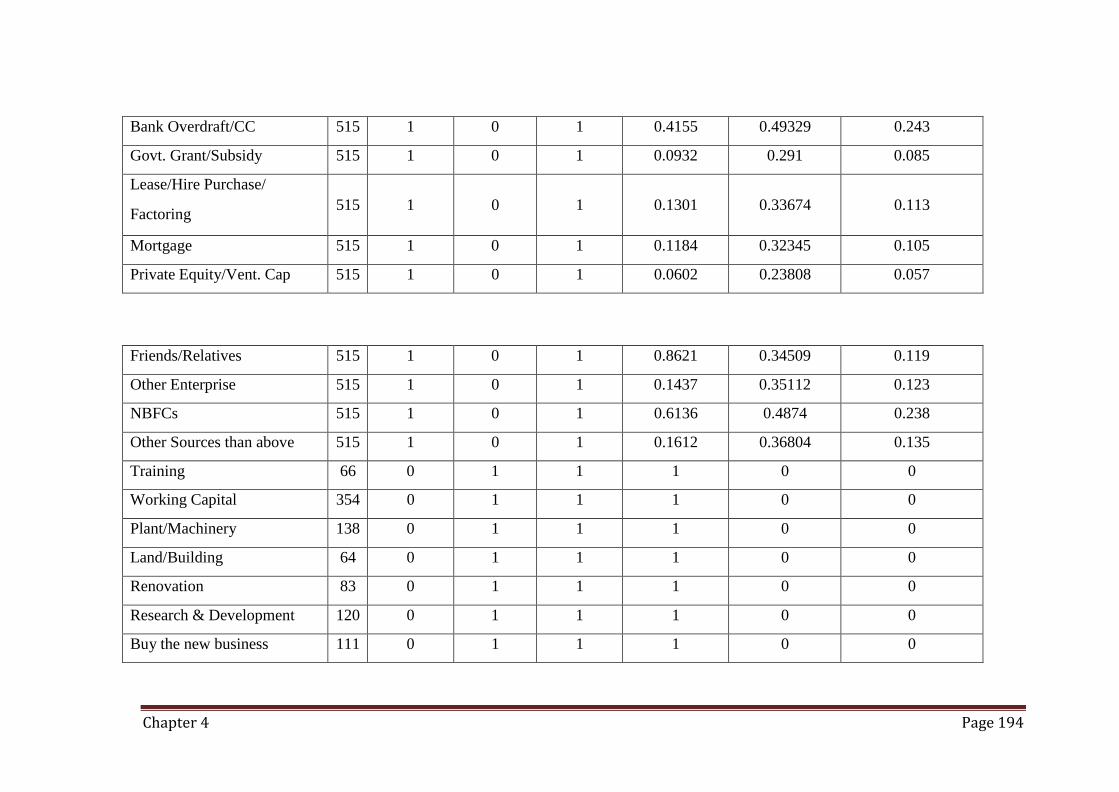
Chapter 4 Page 194
Bank Overdraft/CC 515 1 0 1 0.4155 0.49329 0.243
Govt. Grant/Subsidy 515 1 0 1 0.0932 0.291 0.085
Lease/Hire Purchase/
Factoring
515
1
0
1
0.1301
0.33674
0.113
Mortgage 515 1 0 1 0.1184 0.32345 0.105
Private Equity/Vent. Cap 515 1 0 1 0.0602 0.23808 0.057
Friends/Relatives 515 1 0 1 0.8621 0.34509 0.119
Other Enterprise 515 1 0 1 0.1437 0.35112 0.123
NBFCs 515 1 0 1 0.6136 0.4874 0.238
Other Sources than above 515 1 0 1 0.1612 0.36804 0.135
Training 66 0 1 1 1 0 0
Working Capital 354 0 1 1 1 0 0
Plant/Machinery 138 0 1 1 1 0 0
Land/Building 64 0 1 1 1 0 0
Renovation 83 0 1 1 1 0 0
Research & Development 120 0 1 1 1 0 0
Buy the new business 111 0 1 1 1 0 0
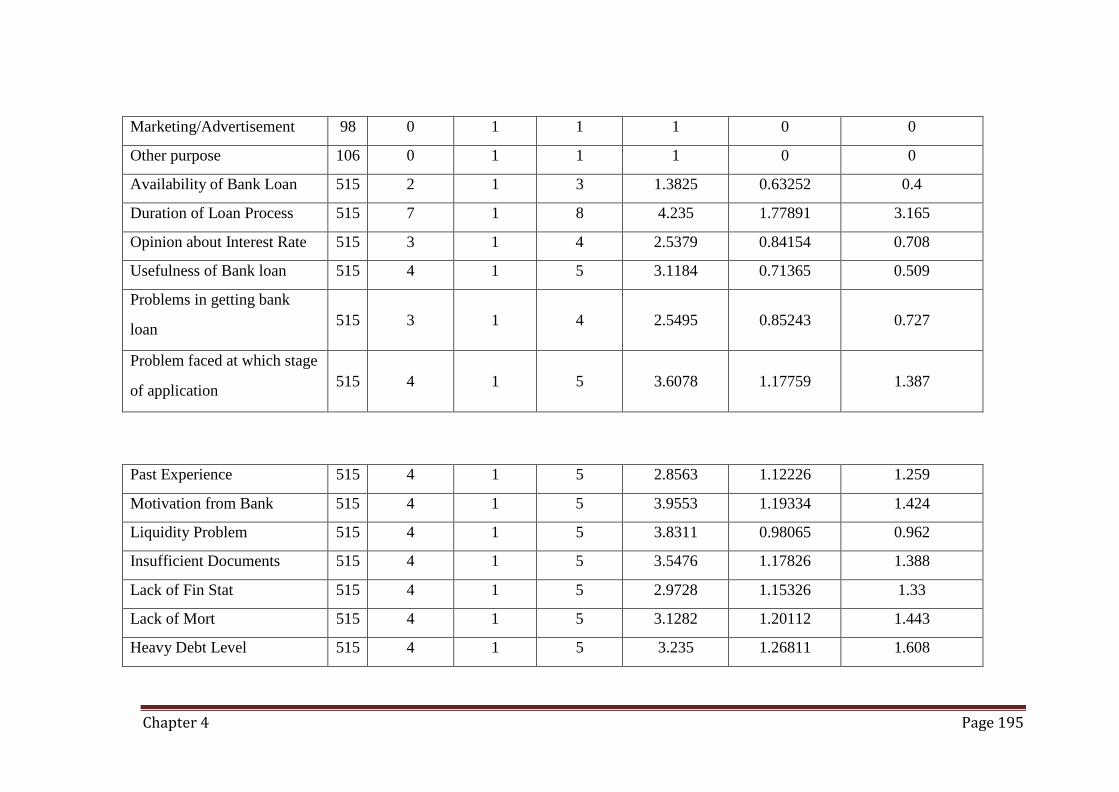
Chapter 4 Page 195
Marketing/Advertisement 98 0 1 1 1 0 0
Other purpose 106 0 1 1 1 0 0
Availability of Bank Loan 515 2 1 3 1.3825 0.63252 0.4
Duration of Loan Process 515 7 1 8 4.235 1.77891 3.165
Opinion about Interest Rate 515 3 1 4 2.5379 0.84154 0.708
Usefulness of Bank loan 515 4 1 5 3.1184 0.71365 0.509
Problems in getting bank
loan
515
3
1
4
2.5495
0.85243
0.727
Problem faced at which stage
of application
515
4
1
5
3.6078
1.17759
1.387
Past Experience 515 4 1 5 2.8563 1.12226 1.259
Motivation from Bank 515 4 1 5 3.9553 1.19334 1.424
Liquidity Problem 515 4 1 5 3.8311 0.98065 0.962
Insufficient Documents 515 4 1 5 3.5476 1.17826 1.388
Lack of Fin Stat 515 4 1 5 2.9728 1.15326 1.33
Lack of Mort 515 4 1 5 3.1282 1.20112 1.443
Heavy Debt Level 515 4 1 5 3.235 1.26811 1.608
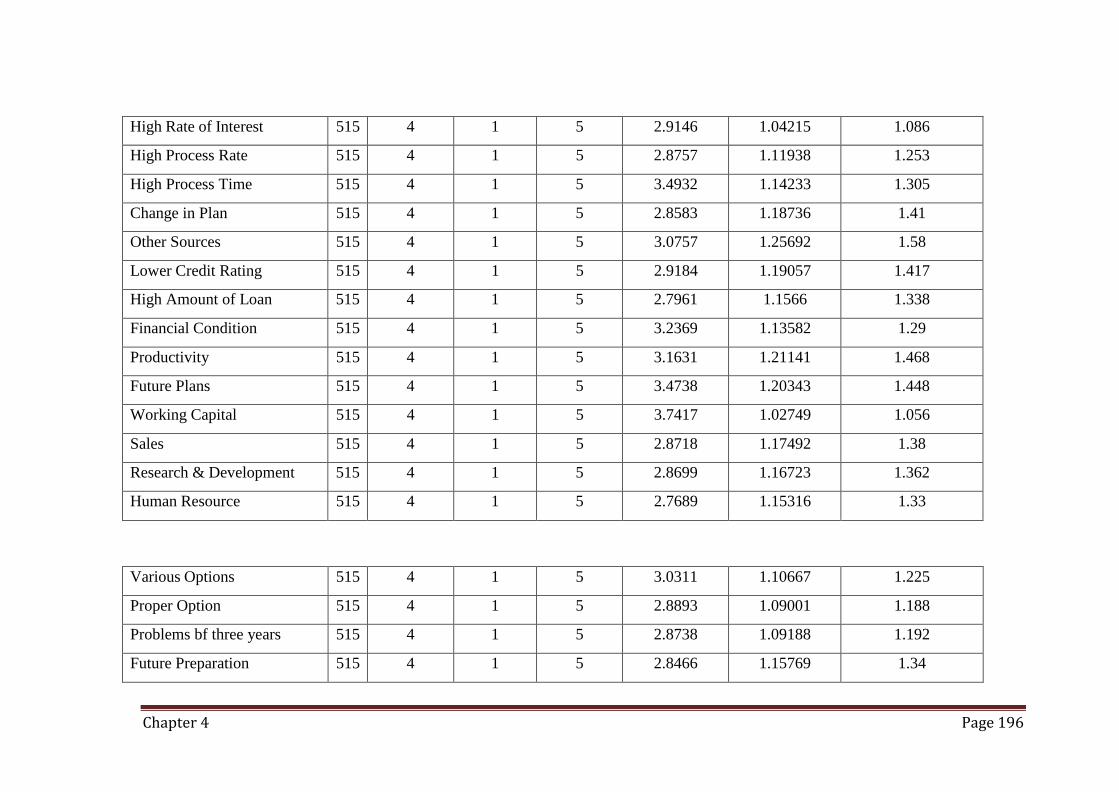
Chapter 4 Page 196
High Rate of Interest 515 4 1 5 2.9146 1.04215 1.086
High Process Rate 515 4 1 5 2.8757 1.11938 1.253
High Process Time 515 4 1 5 3.4932 1.14233 1.305
Change in Plan 515 4 1 5 2.8583 1.18736 1.41
Other Sources 515 4 1 5 3.0757 1.25692 1.58
Lower Credit Rating 515 4 1 5 2.9184 1.19057 1.417
High Amount of Loan 515 4 1 5 2.7961 1.1566 1.338
Financial Condition 515 4 1 5 3.2369 1.13582 1.29
Productivity 515 4 1 5 3.1631 1.21141 1.468
Future Plans 515 4 1 5 3.4738 1.20343 1.448
Working Capital 515 4 1 5 3.7417 1.02749 1.056
Sales 515 4 1 5 2.8718 1.17492 1.38
Research & Development 515 4 1 5 2.8699 1.16723 1.362
Human Resource 515 4 1 5 2.7689 1.15316 1.33
Various Options 515 4 1 5 3.0311 1.10667 1.225
Proper Option 515 4 1 5 2.8893 1.09001 1.188
Problems bf three years 515 4 1 5 2.8738 1.09188 1.192
Future Preparation 515 4 1 5 2.8466 1.15769 1.34
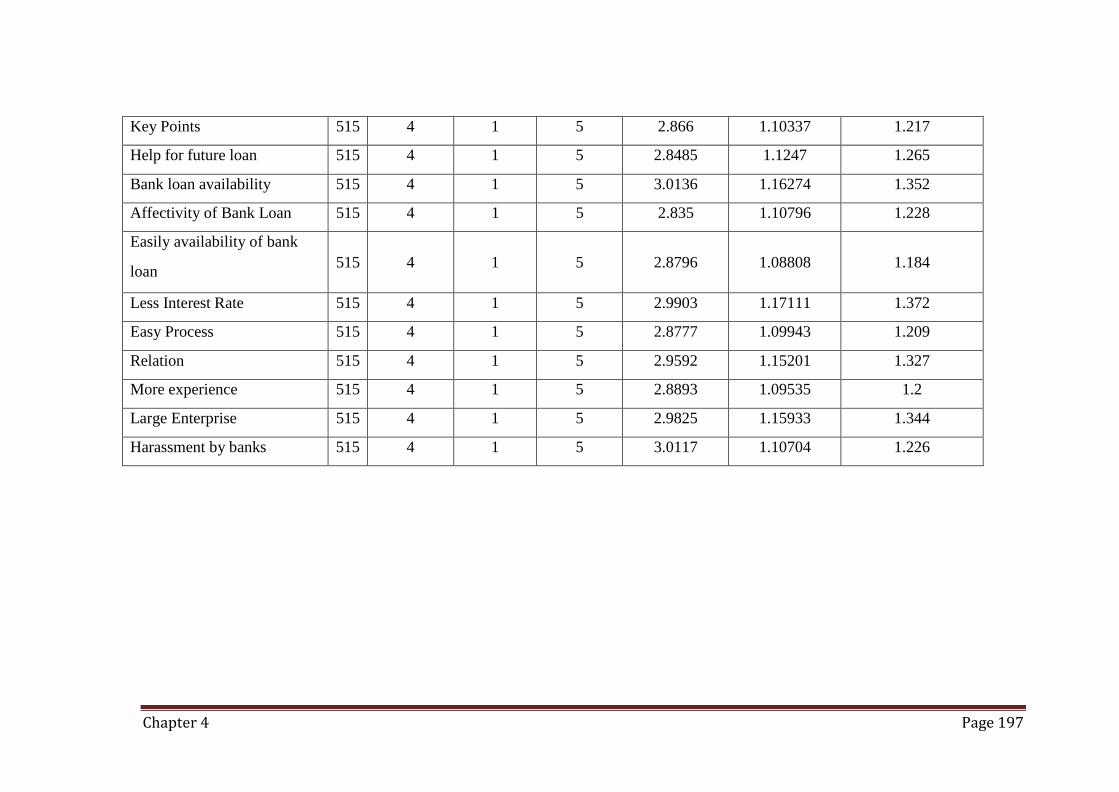
Chapter 4 Page 197
Key Points 515 4 1 5 2.866 1.10337 1.217
Help for future loan 515 4 1 5 2.8485 1.1247 1.265
Bank loan availability 515 4 1 5 3.0136 1.16274 1.352
Affectivity of Bank Loan 515 4 1 5 2.835 1.10796 1.228
Easily availability of bank
loan
515
4
1
5
2.8796
1.08808
1.184
Less Interest Rate 515 4 1 5 2.9903 1.17111 1.372
Easy Process 515 4 1 5 2.8777 1.09943 1.209
Relation 515 4 1 5 2.9592 1.15201 1.327
More experience 515 4 1 5 2.8893 1.09535 1.2
Large Enterprise 515 4 1 5 2.9825 1.15933 1.344
Harassment by banks 515 4 1 5 3.0117 1.10704 1.226
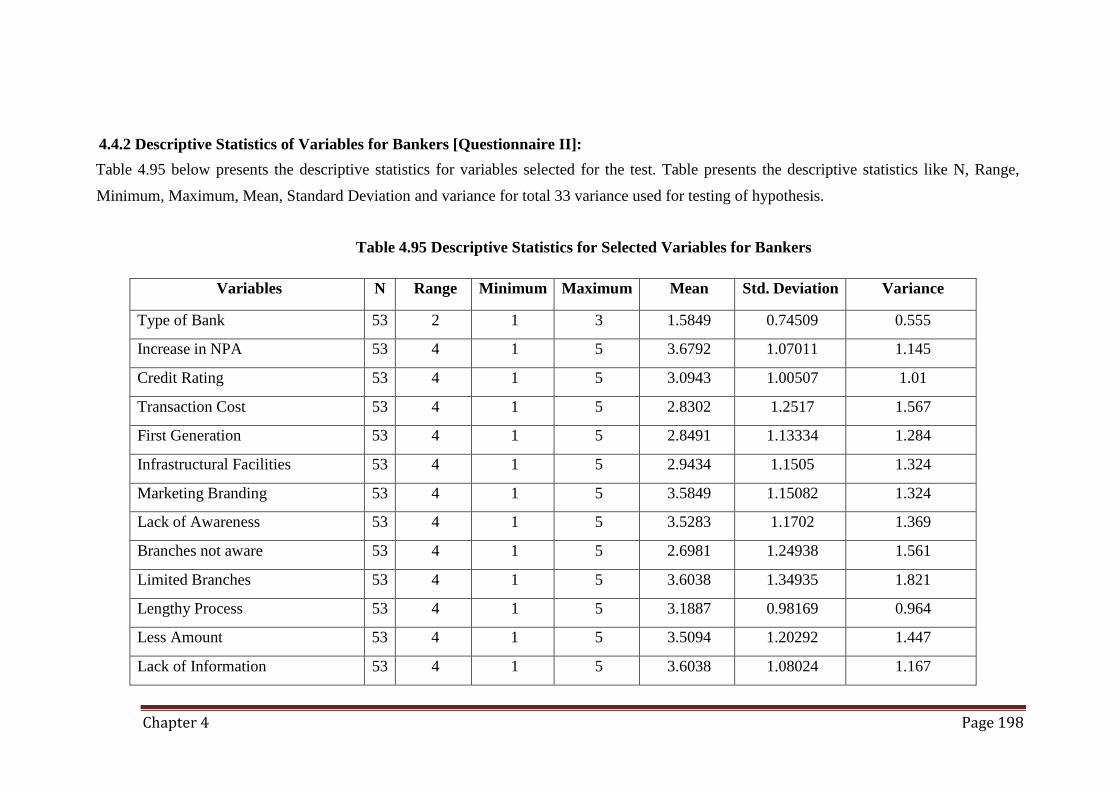
Chapter 4 Page 198
4.4.2 Descriptive Statistics of Variables for Bankers [Questionnaire II]:
Table 4.95 below presents the descriptive statistics for variables selected for the test. Table presents the descriptive statistics like N, Range,
Minimum, Maximum, Mean, Standard Deviation and variance for total 33 variance used for testing of hypothesis.
Table 4.95 Descriptive Statistics for Selected Variables for Bankers
Variables N Range Minimum Maximum Mean Std. Deviation Variance
Type of Bank 53 2 1 3 1.5849 0.74509 0.555
Increase in NPA 53 4 1 5 3.6792 1.07011 1.145
Credit Rating 53 4 1 5 3.0943 1.00507 1.01
Transaction Cost 53 4 1 5 2.8302 1.2517 1.567
First Generation 53 4 1 5 2.8491 1.13334 1.284
Infrastructural Facilities 53 4 1 5 2.9434 1.1505 1.324
Marketing Branding 53 4 1 5 3.5849 1.15082 1.324
Lack of Awareness 53 4 1 5 3.5283 1.1702 1.369
Branches not aware 53 4 1 5 2.6981 1.24938 1.561
Limited Branches 53 4 1 5 3.6038 1.34935 1.821
Lengthy Process 53 4 1 5 3.1887 0.98169 0.964
Less Amount 53 4 1 5 3.5094 1.20292 1.447
Lack of Information 53 4 1 5 3.6038 1.08024 1.167
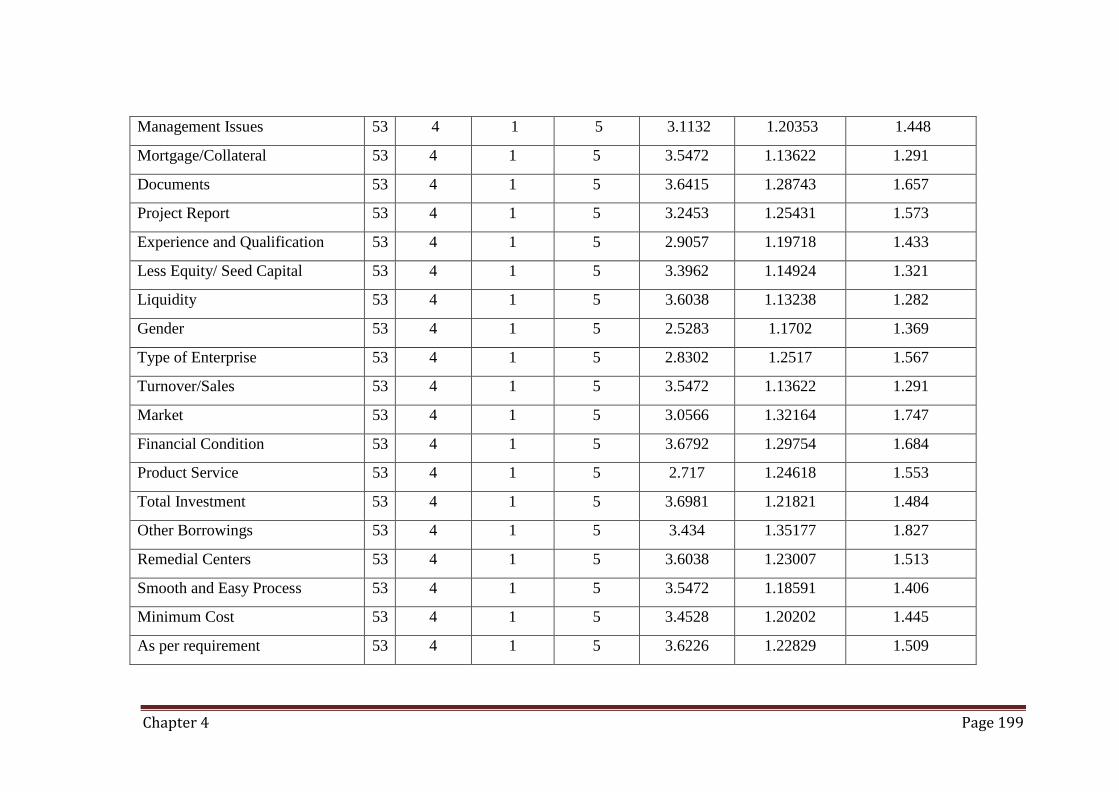
Chapter 4 Page 199
Management Issues 53 4 1 5 3.1132 1.20353 1.448
Mortgage/Collateral 53 4 1 5 3.5472 1.13622 1.291
Documents 53 4 1 5 3.6415 1.28743 1.657
Project Report 53 4 1 5 3.2453 1.25431 1.573
Experience and Qualification 53 4 1 5 2.9057 1.19718 1.433
Less Equity/ Seed Capital 53 4 1 5 3.3962 1.14924 1.321
Liquidity 53 4 1 5 3.6038 1.13238 1.282
Gender 53 4 1 5 2.5283 1.1702 1.369
Type of Enterprise 53 4 1 5 2.8302 1.2517 1.567
Turnover/Sales 53 4 1 5 3.5472 1.13622 1.291
Market 53 4 1 5 3.0566 1.32164 1.747
Financial Condition 53 4 1 5 3.6792 1.29754 1.684
Product Service 53 4 1 5 2.717 1.24618 1.553
Total Investment 53 4 1 5 3.6981 1.21821 1.484
Other Borrowings 53 4 1 5 3.434 1.35177 1.827
Remedial Centers 53 4 1 5 3.6038 1.23007 1.513
Smooth and Easy Process 53 4 1 5 3.5472 1.18591 1.406
Minimum Cost 53 4 1 5 3.4528 1.20202 1.445
As per requirement 53 4 1 5 3.6226 1.22829 1.509
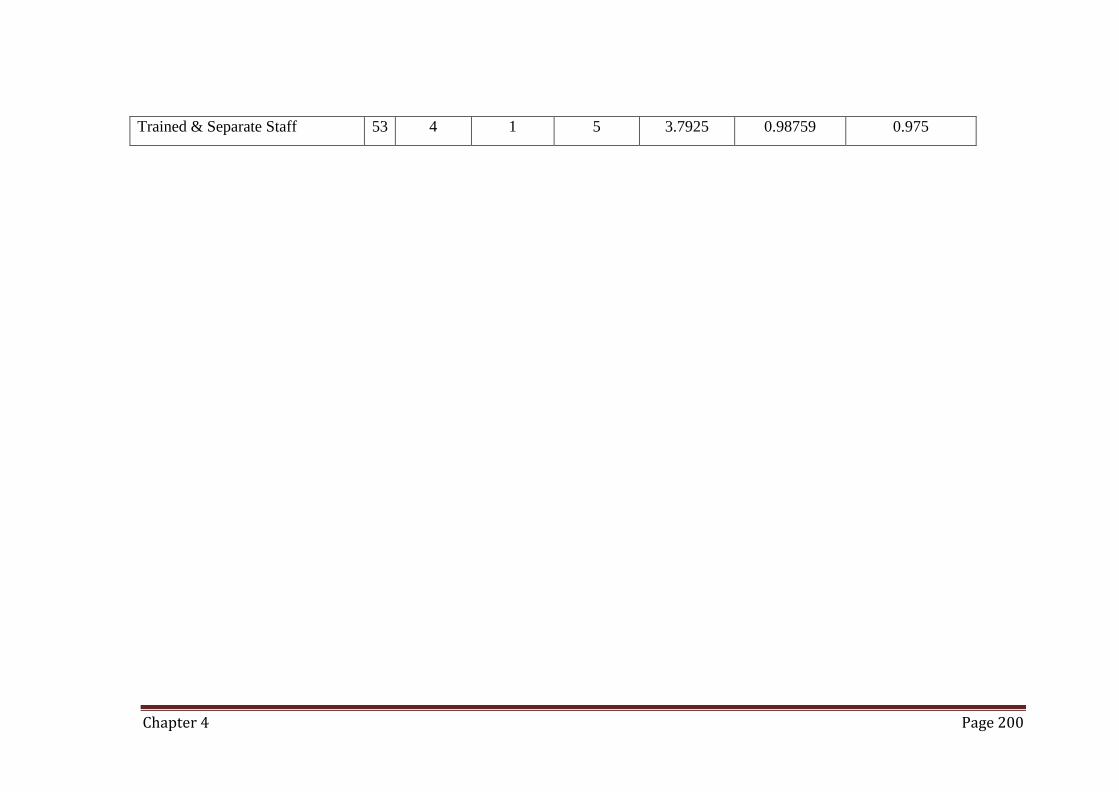
Chapter 4 Page 200
Trained & Separate Staff 53 4 1 5 3.7925 0.98759 0.975
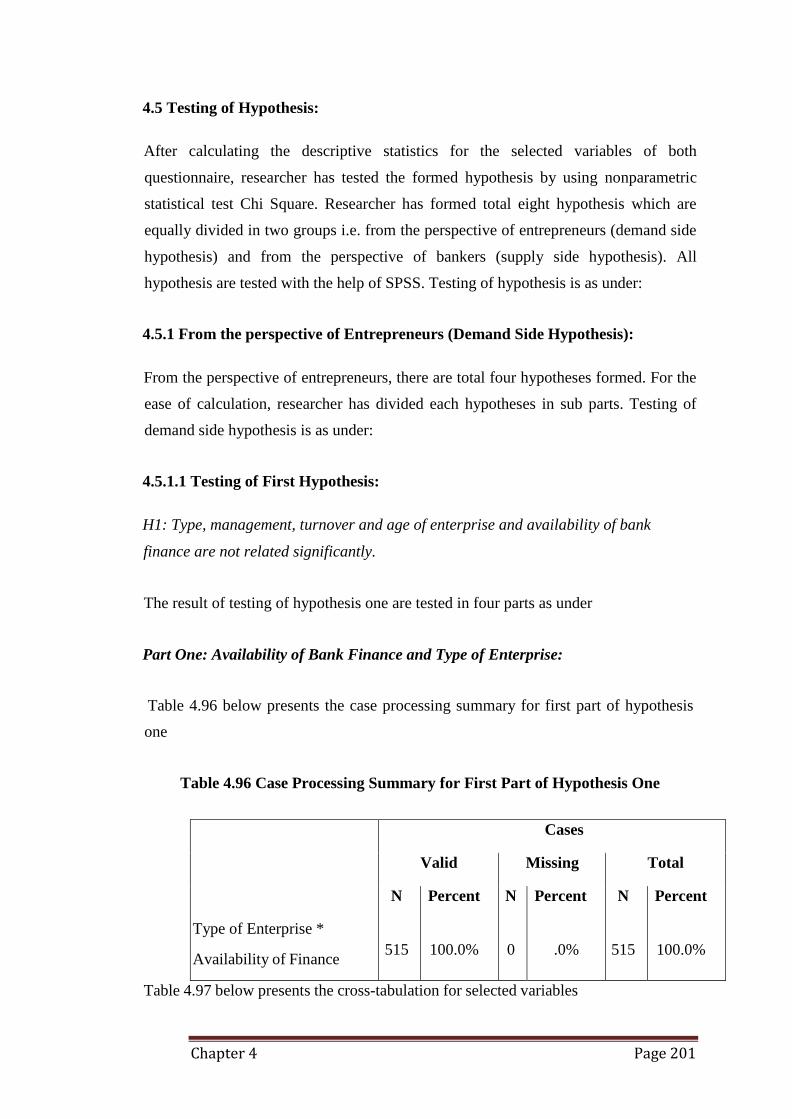
Chapter 4 Page 201
4.5 Testing of Hypothesis:
After calculating the descriptive statistics for the selected variables of both
questionnaire, researcher has tested the formed hypothesis by using nonparametric
statistical test Chi Square. Researcher has formed total eight hypothesis which are
equally divided in two groups i.e. from the perspective of entrepreneurs (demand side
hypothesis) and from the perspective of bankers (supply side hypothesis). All
hypothesis are tested with the help of SPSS. Testing of hypothesis is as under:
4.5.1 From the perspective of Entrepreneurs (Demand Side Hypothesis):
From the perspective of entrepreneurs, there are total four hypotheses formed. For the
ease of calculation, researcher has divided each hypotheses in sub parts. Testing of
demand side hypothesis is as under:
4.5.1.1 Testing of First Hypothesis:
H1: Type, management, turnover and age of enterprise and availability of bank
finance are not related significantly.
The result of testing of hypothesis one are tested in four parts as under
Part One: Availability of Bank Finance and Type of Enterprise:
Table 4.96 below presents the case processing summary for first part of hypothesis
one
Table 4.96 Case Processing Summary for First Part of Hypothesis One
Type of Enterprise *
Availability of Finance
Cases
Valid Missing Total
N
515
Percent
100.0%
N
0
Percent
.0%
N
515
Percent
100.0%
Table 4.97 below presents the cross-tabulation for selected variables
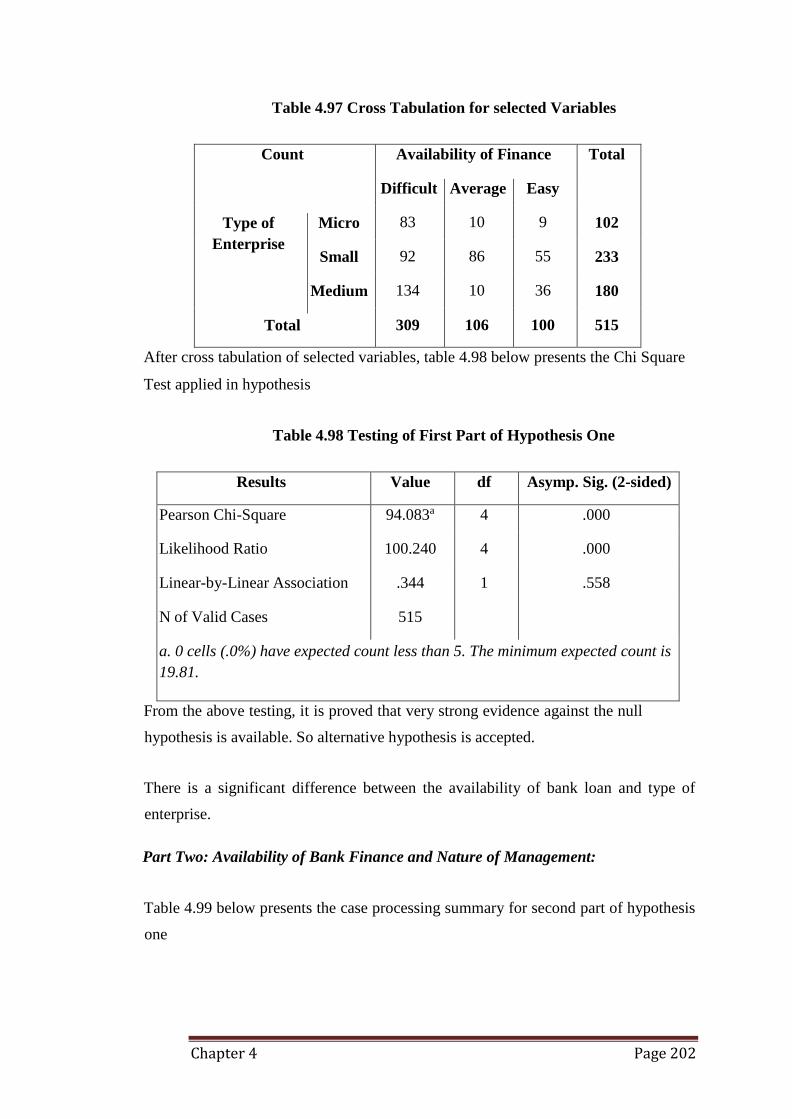
Chapter 4 Page 202
Table 4.97 Cross Tabulation for selected Variables
Count Availability of Finance Total
Type of
Enterprise
Total
Micro
Small
Medium
Difficult Average Easy
83 10 9 102
92 86 55 233
134 10 36 180
309 106 100 515
After cross tabulation of selected variables, table 4.98 below presents the Chi Square
Test applied in hypothesis
Table 4.98 Testing of First Part of Hypothesis One
Results Value df Asymp. Sig. (2-sided)
Pearson Chi-Square 94.083a 4 .000
Likelihood Ratio 100.240 4 .000
Linear-by-Linear Association .344 1 .558
N of Valid Cases 515
a. 0 cells (.0%) have expected count less than 5. The minimum expected count is
19.81.
From the above testing, it is proved that very strong evidence against the null
hypothesis is available. So alternative hypothesis is accepted.
There is a significant difference between the availability of bank loan and type of
enterprise.
Part Two: Availability of Bank Finance and Nature of Management:
Table 4.99 below presents the case processing summary for second part of hypothesis
one
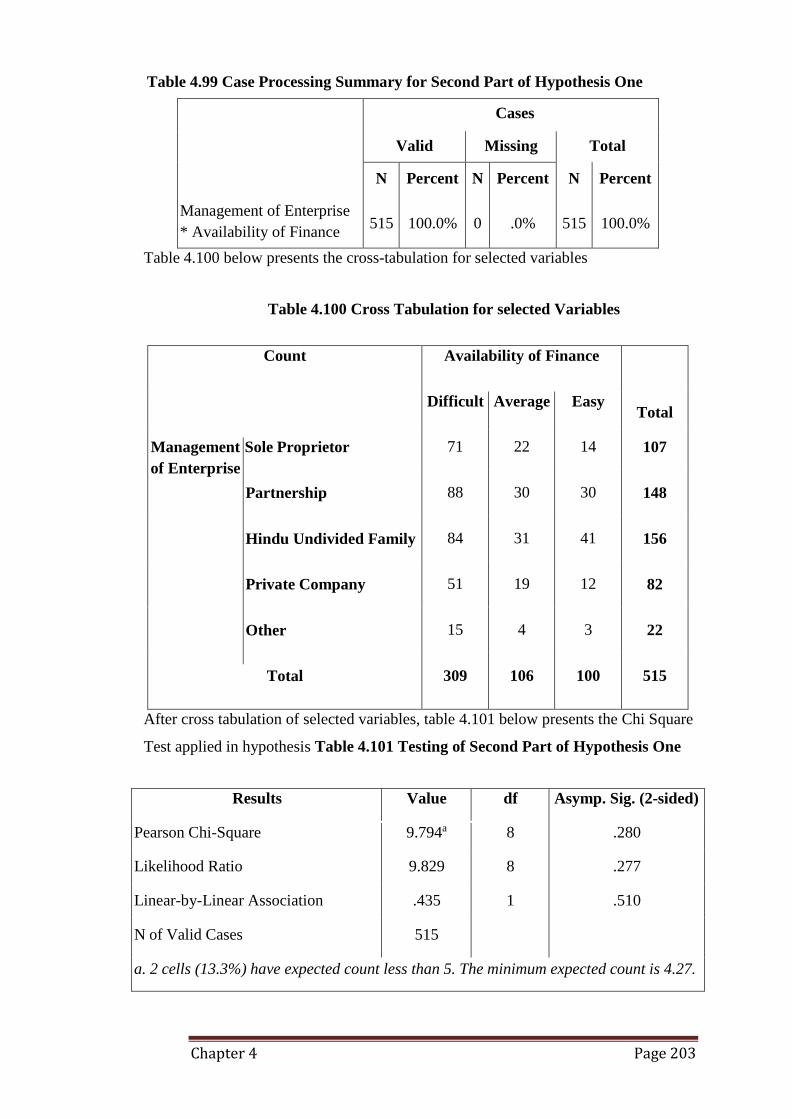
Chapter 4 Page 203
Table 4.99 Case Processing Summary for Second Part of Hypothesis One
Management of Enterprise
* Availability of Finance
Cases
Valid Missing Total
N
515
Percent
100.0%
N
0
Percent
.0%
N
515
Percent
100.0%
Table 4.100 below presents the cross-tabulation for selected variables
Table 4.100 Cross Tabulation for selected Variables
Count
Management Sole Proprietor
of Enterprise
Partnership
Hindu Undivided Family
Private Company
Other
Total
Availability of Finance
Difficult Average Easy Total
71 22 14 107
88 30 30 148
84 31 41 156
51 19 12 82
15 4 3 22
309 106 100 515
After cross tabulation of selected variables, table 4.101 below presents the Chi Square
Test applied in hypothesis Table 4.101 Testing of Second Part of Hypothesis One
Results Value df Asymp. Sig. (2-sided)
Pearson Chi-Square 9.794a 8 .280
Likelihood Ratio 9.829 8 .277
Linear-by-Linear Association .435 1 .510
N of Valid Cases 515
a. 2 cells (13.3%) have expected count less than 5. The minimum expected count is 4.27.
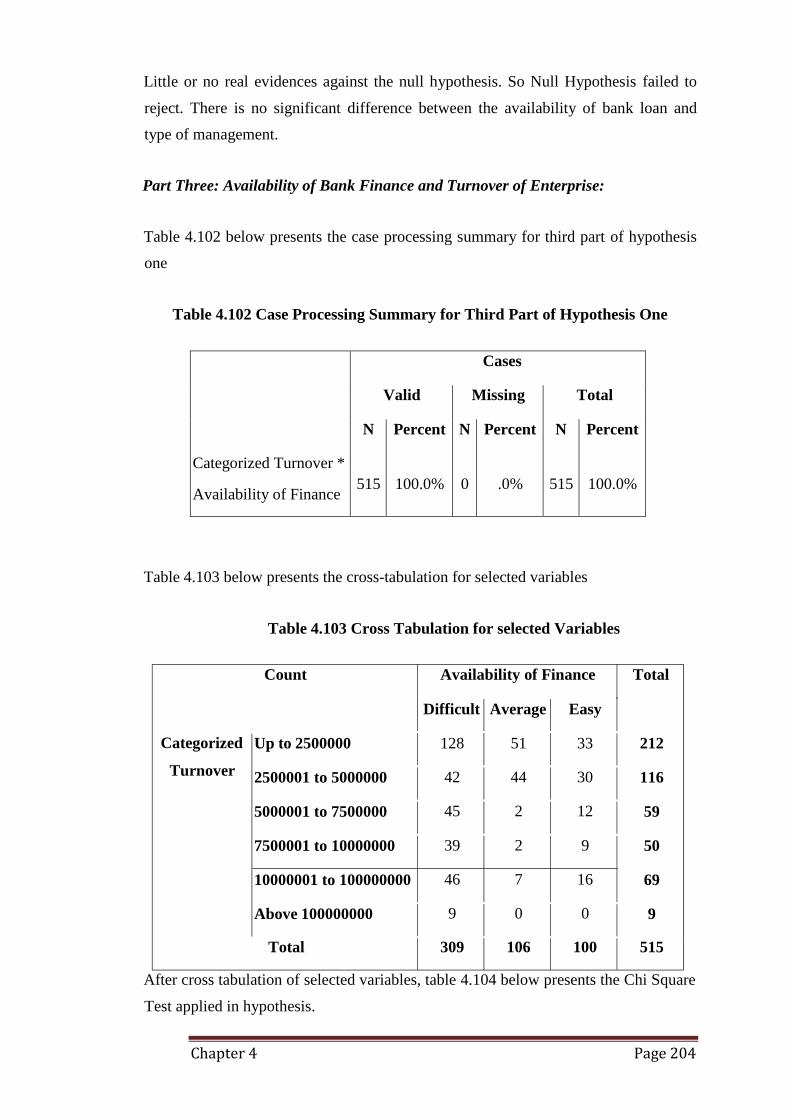
Chapter 4 Page 204
Count Availability of Finance Total
Categorized
Turnover
Little or no real evidences against the null hypothesis. So Null Hypothesis failed to
reject. There is no significant difference between the availability of bank loan and
type of management.
Part Three: Availability of Bank Finance and Turnover of Enterprise:
Table 4.102 below presents the case processing summary for third part of hypothesis
one
Table 4.102 Case Processing Summary for Third Part of Hypothesis One
Categorized Turnover *
Availability of Finance
Cases
Valid Missing Total
N
515
Percent
100.0%
N
0
Percent
.0%
N
515
Percent
100.0%
Table 4.103 below presents the cross-tabulation for selected variables
Table 4.103 Cross Tabulation for selected Variables
Difficult Average Easy
Up to 2500000 128 51 33 212
2500001 to 5000000 42 44 30 116
5000001 to 7500000 45 2 12 59
7500001 to 10000000 39 2 9 50
10000001 to 100000000 46 7 16 69
Above 100000000 9 0 0 9
Total 309 106 100 515
After cross tabulation of selected variables, table 4.104 below presents the Chi Square
Test applied in hypothesis.
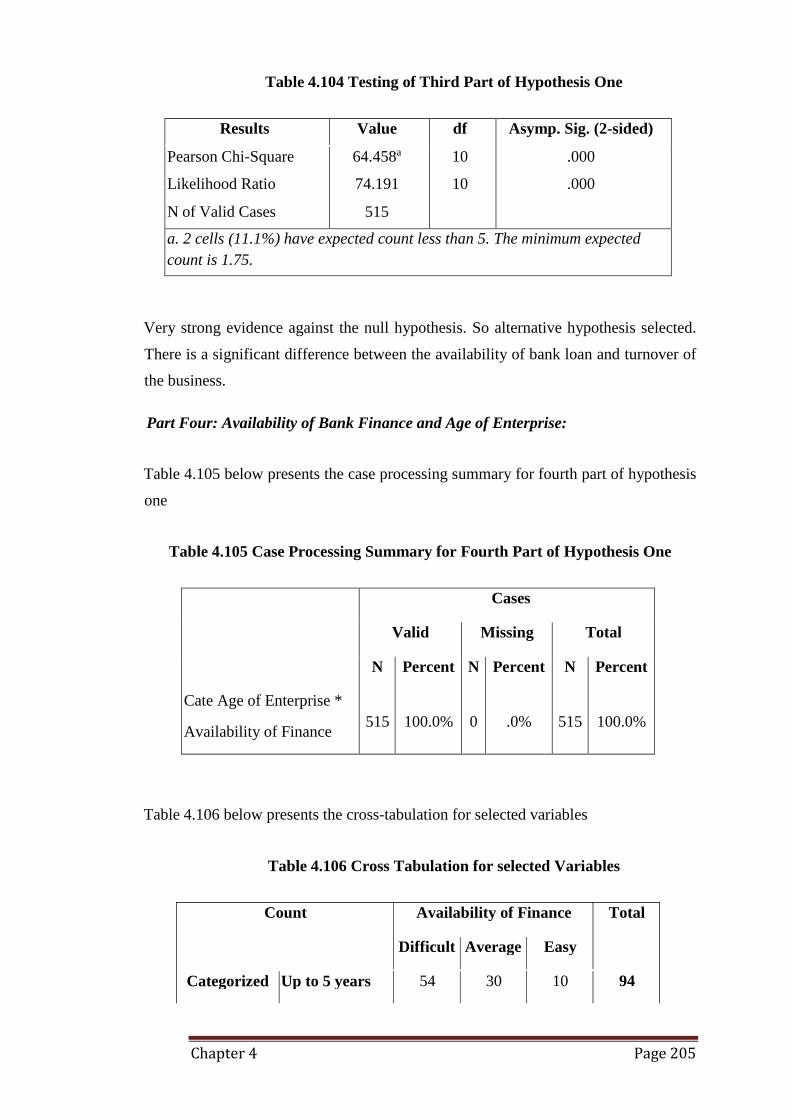
Chapter 4 Page 205
Count Availability of Finance Total
Difficult Average Easy
Categorized Up to 5 years 54 30 10 94
Table 4.104 Testing of Third Part of Hypothesis One
Results Value df Asymp. Sig. (2-sided)
Pearson Chi-Square 64.458a 10 .000
Likelihood Ratio 74.191 10 .000
N of Valid Cases 515
a. 2 cells (11.1%) have expected count less than 5. The minimum expected
count is 1.75.
Very strong evidence against the null hypothesis. So alternative hypothesis selected.
There is a significant difference between the availability of bank loan and turnover of
the business.
Part Four: Availability of Bank Finance and Age of Enterprise:
Table 4.105 below presents the case processing summary for fourth part of hypothesis
one
Table 4.105 Case Processing Summary for Fourth Part of Hypothesis One
Cate Age of Enterprise *
Availability of Finance
Cases
Valid Missing Total
N
515
Percent
100.0%
N
0
Percent
.0%
N
515
Percent
100.0%
Table 4.106 below presents the cross-tabulation for selected variables
Table 4.106 Cross Tabulation for selected Variables
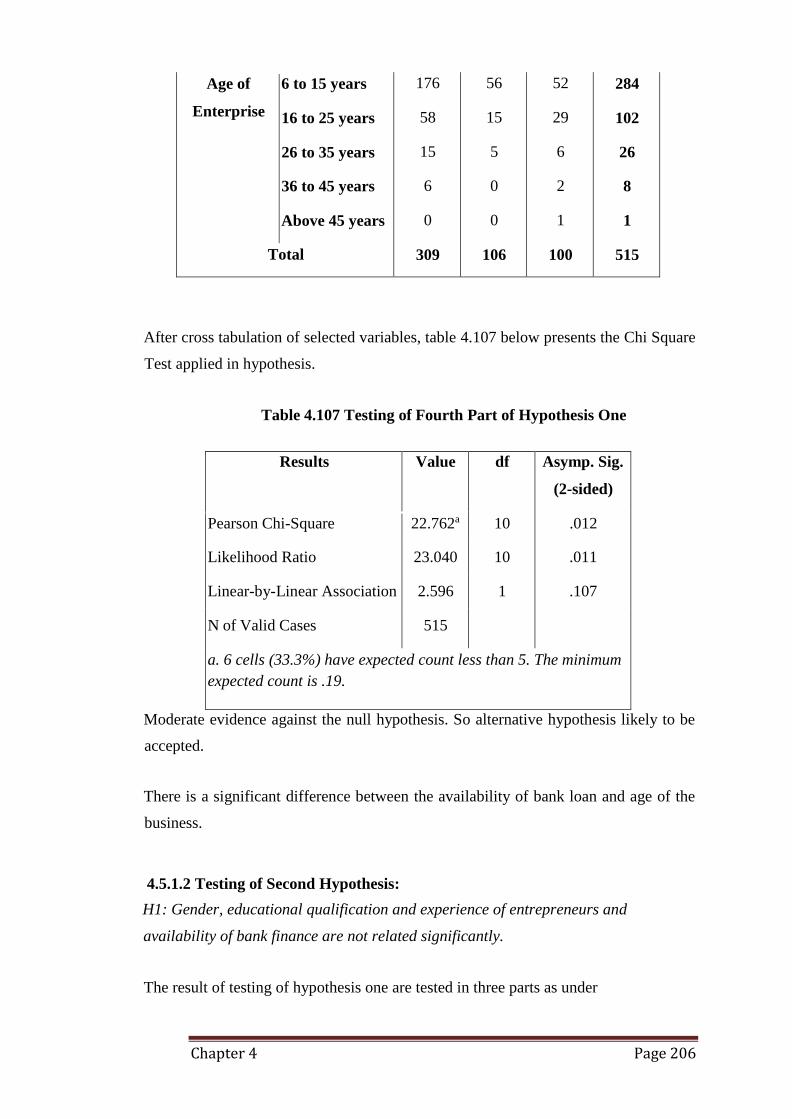
Chapter 4 Page 206
Age of 6 to 15 years
Enterprise 16 to 25 years
26 to 35 years
36 to 45 years
Above 45 years
Total
176
58
15
6
0
309
56
15
5
0
0
106
52
29
6
2
1
100
284
102
26
8
1
515
After cross tabulation of selected variables, table 4.107 below presents the Chi Square
Test applied in hypothesis.
Table 4.107 Testing of Fourth Part of Hypothesis One
Results Value df Asymp. Sig.
(2-sided)
Pearson Chi-Square 22.762a 10 .012
Likelihood Ratio 23.040 10 .011
Linear-by-Linear Association 2.596 1 .107
N of Valid Cases 515
a. 6 cells (33.3%) have expected count less than 5. The minimum
expected count is .19.
Moderate evidence against the null hypothesis. So alternative hypothesis likely to be
accepted.
There is a significant difference between the availability of bank loan and age of the
business.
4.5.1.2 Testing of Second Hypothesis:
H1: Gender, educational qualification and experience of entrepreneurs and
availability of bank finance are not related significantly.
The result of testing of hypothesis one are tested in three parts as under
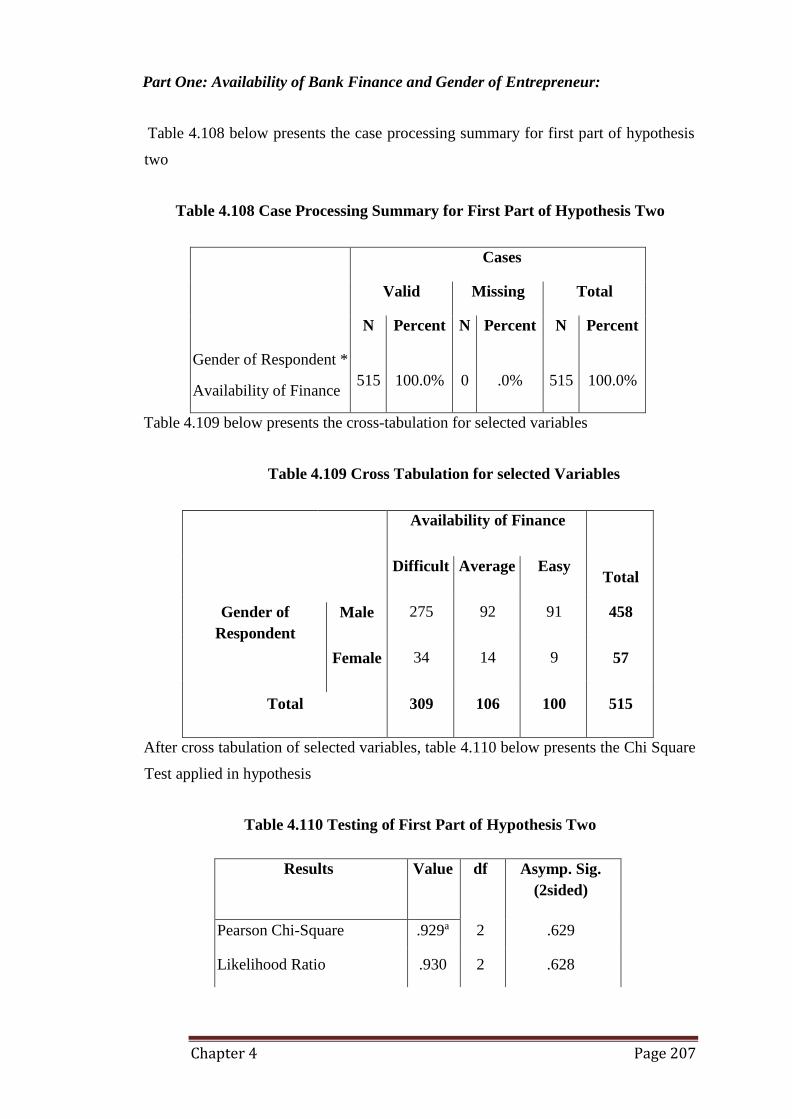
Chapter 4 Page 207
Part One: Availability of Bank Finance and Gender of Entrepreneur:
Table 4.108 below presents the case processing summary for first part of hypothesis
two
Table 4.108 Case Processing Summary for First Part of Hypothesis Two
Gender of Respondent *
Availability of Finance
Cases
Valid Missing Total
N
515
Percent
100.0%
N
0
Percent
.0%
N
515
Percent
100.0%
Table 4.109 below presents the cross-tabulation for selected variables
Table 4.109 Cross Tabulation for selected Variables
Gender of
Respondent
Total
Male
Female
Availability of Finance
Difficult Average Easy Total
275 92 91 458
34 14 9 57
309 106 100 515
After cross tabulation of selected variables, table 4.110 below presents the Chi Square
Test applied in hypothesis
Table 4.110 Testing of First Part of Hypothesis Two
Results Value df Asymp. Sig.
(2sided)
Pearson Chi-Square .929a 2 .629
Likelihood Ratio .930 2 .628
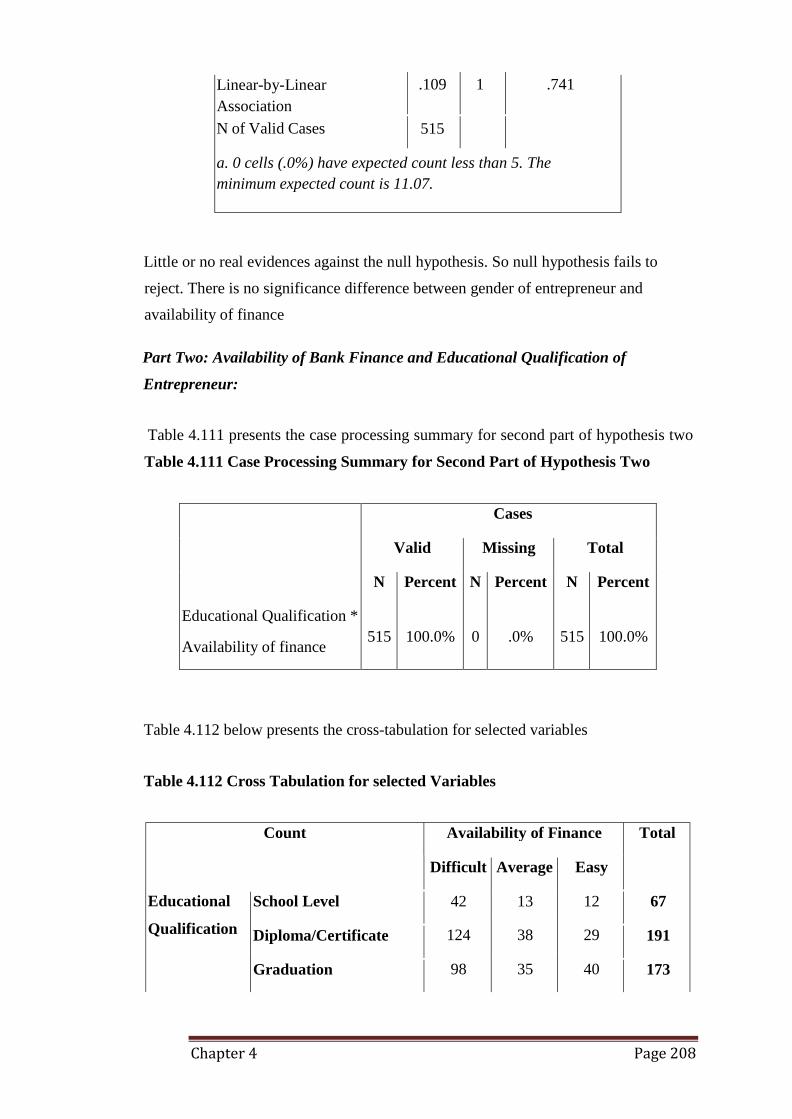
Chapter 4 Page 208
Count Availability of Finance Total
Educational
Qualification
Little or no real evidences against the null hypothesis. So null hypothesis fails to
reject. There is no significance difference between gender of entrepreneur and
availability of finance
Part Two: Availability of Bank Finance and Educational Qualification of
Entrepreneur:
Table 4.111 presents the case processing summary for second part of hypothesis two
Table 4.111 Case Processing Summary for Second Part of Hypothesis Two
Educational Qualification *
Availability of finance
Cases
Valid Missing Total
N
515
Percent
100.0%
N
0
Percent
.0%
N
515
Percent
100.0%
Table 4.112 below presents the cross-tabulation for selected variables
Table 4.112 Cross Tabulation for selected Variables
Difficult Average Easy
School Level 42 13 12 67
Diploma/Certificate 124 38 29 191
Graduation 98 35 40 173
Linear-by-Linear
Association
N of Valid Cases
.109 1 .741
515
a. 0 cells (.0%) have expected count less than 5. The
minimum expected count is 11.07.
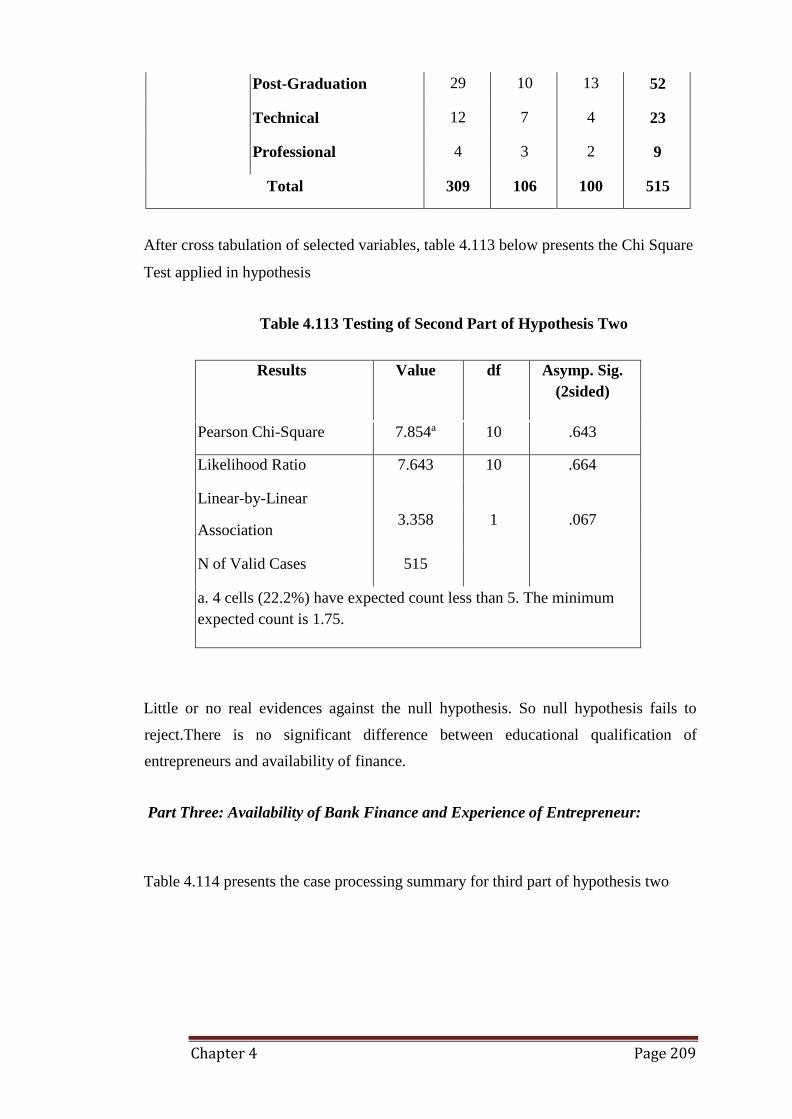
Chapter 4 Page 209
Post-Graduation 29 10 13 52
Technical 12 7 4 23
Professional 4 3 2 9
Total 309 106 100 515
After cross tabulation of selected variables, table 4.113 below presents the Chi Square
Test applied in hypothesis
Table 4.113 Testing of Second Part of Hypothesis Two
Results Value df Asymp. Sig.
(2sided)
Pearson Chi-Square 7.854a 10 .643
Likelihood Ratio 7.643 10 .664
Linear-by-Linear
Association 3.358 1 .067
N of Valid Cases 515
a. 4 cells (22.2%) have expected count less than 5. The minimum
expected count is 1.75.
Little or no real evidences against the null hypothesis. So null hypothesis fails to
reject.There is no significant difference between educational qualification of
entrepreneurs and availability of finance.
Part Three: Availability of Bank Finance and Experience of Entrepreneur:
Table 4.114 presents the case processing summary for third part of hypothesis two
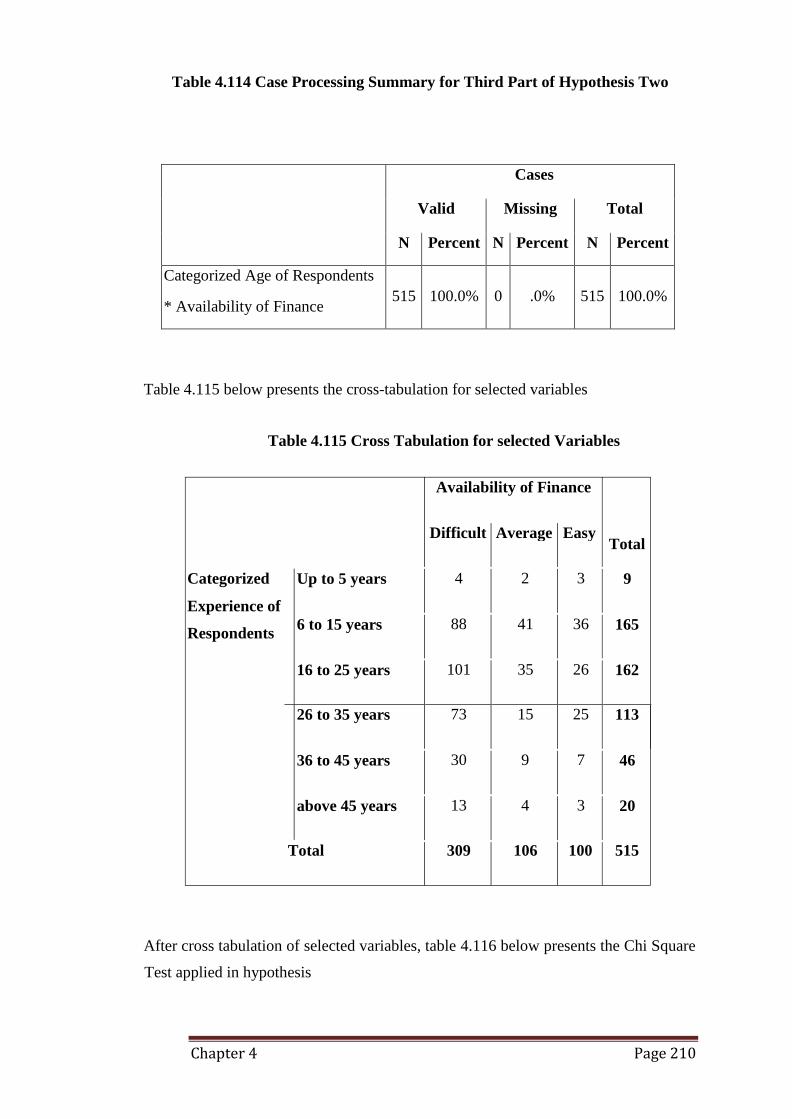
Chapter 4 Page 210
Availability of Finance
Difficult Average Easy
Categorized
Experience of
Respondents
Table 4.114 Case Processing Summary for Third Part of Hypothesis Two
Cases
Valid Missing Total
N Percent N Percent N Percent
Categorized Age of Respondents
* Availability of Finance
515
100.0%
0
.0%
515
100.0%
Table 4.115 below presents the cross-tabulation for selected variables
Table 4.115 Cross Tabulation for selected Variables
Total
Up to 5 years 4 2 3 9
6 to 15 years 88 41 36 165
16 to 25 years 101 35 26 162
26 to 35 years 73 15 25 113
36 to 45 years 30 9 7 46
above 45 years 13 4 3 20
Total 309 106 100 515
After cross tabulation of selected variables, table 4.116 below presents the Chi Square
Test applied in hypothesis
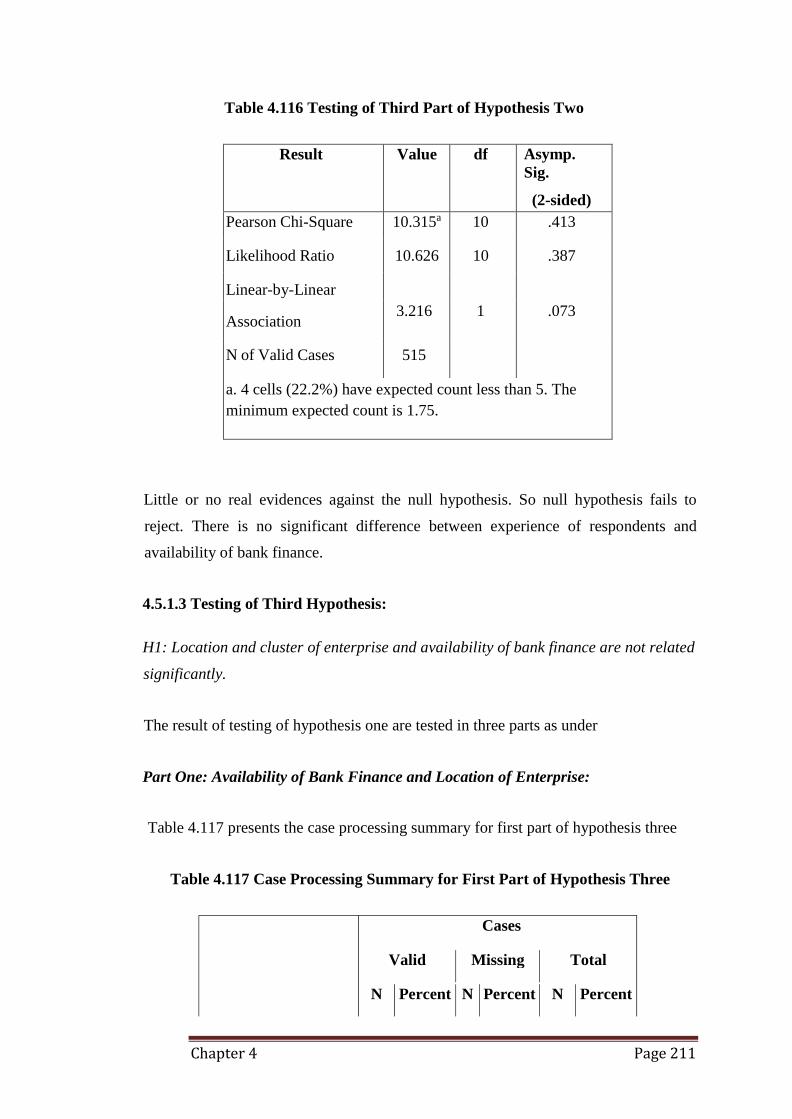
Chapter 4 Page 211
Cases
Valid Missing Total
N Percent N Percent N Percent
Table 4.116 Testing of Third Part of Hypothesis Two
Result Value df Asymp.
Sig.
(2-sided)
Pearson Chi-Square 10.315a 10 .413
Likelihood Ratio 10.626 10 .387
Linear-by-Linear
Association 3.216 1 .073
N of Valid Cases 515
a. 4 cells (22.2%) have expected count less than 5. The
minimum expected count is 1.75.
Little or no real evidences against the null hypothesis. So null hypothesis fails to
reject. There is no significant difference between experience of respondents and
availability of bank finance.
4.5.1.3 Testing of Third Hypothesis:
H1: Location and cluster of enterprise and availability of bank finance are not related
significantly.
The result of testing of hypothesis one are tested in three parts as under
Part One: Availability of Bank Finance and Location of Enterprise:
Table 4.117 presents the case processing summary for first part of hypothesis three
Table 4.117 Case Processing Summary for First Part of Hypothesis Three
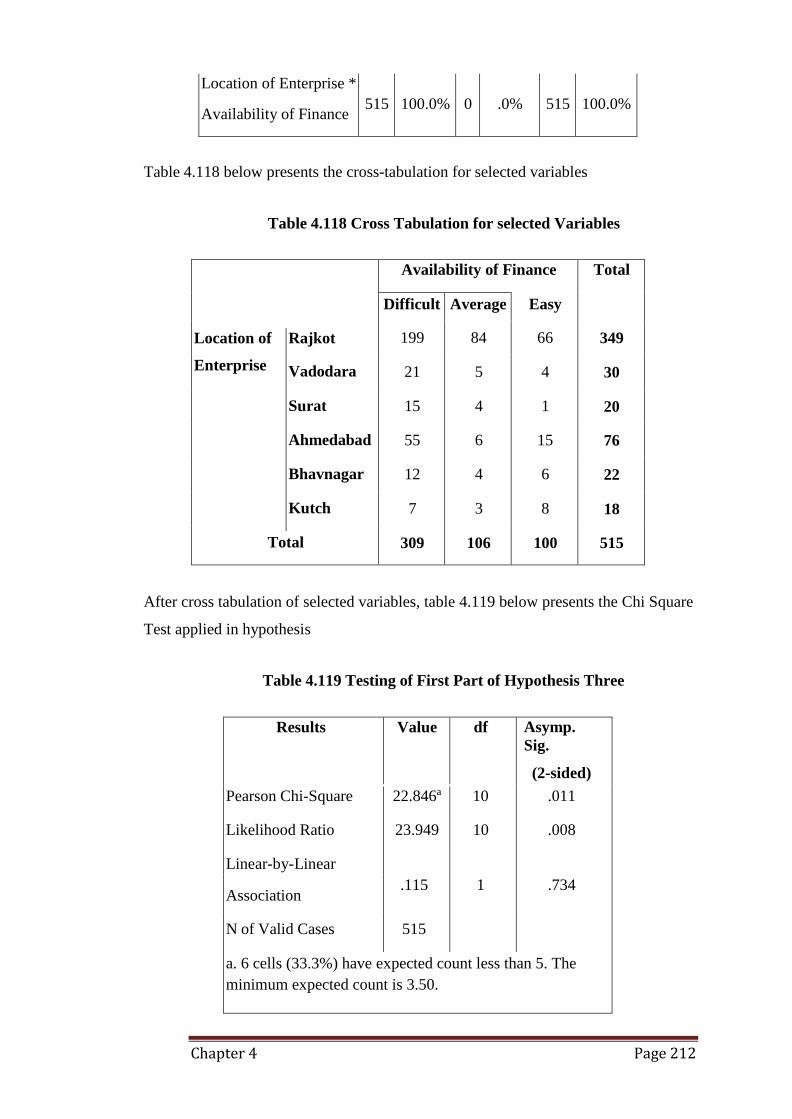
Chapter 4 Page 212
Location of Enterprise *
Availability of Finance
515
100.0%
0
.0%
515
100.0%
Table 4.118 below presents the cross-tabulation for selected variables
Table 4.118 Cross Tabulation for selected Variables
Location of Rajkot
Enterprise Vadodara
Surat
Ahmedabad
Bhavnagar
Kutch
Total
Availability of Finance Total
Difficult Average Easy
199 84 66 349
21 5 4 30
15 4 1 20
55 6 15 76
12 4 6 22
7 3 8 18
309 106 100 515
After cross tabulation of selected variables, table 4.119 below presents the Chi Square
Test applied in hypothesis
Table 4.119 Testing of First Part of Hypothesis Three
Results Value df Asymp.
Sig.
(2-sided)
Pearson Chi-Square 22.846a 10 .011
Likelihood Ratio 23.949 10 .008
Linear-by-Linear
Association .115 1 .734
N of Valid Cases 515
a. 6 cells (33.3%) have expected count less than 5. The
minimum expected count is 3.50.
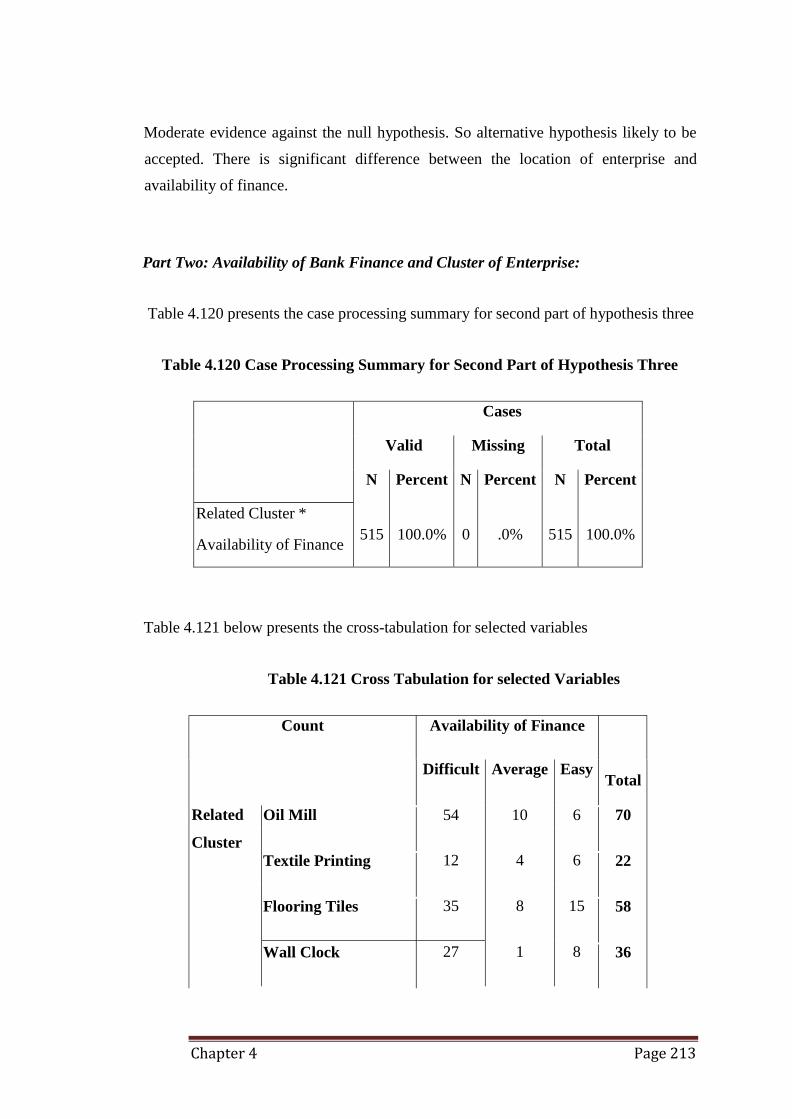
Chapter 4 Page 213
Count Availability of Finance
Moderate evidence against the null hypothesis. So alternative hypothesis likely to be
accepted. There is significant difference between the location of enterprise and
availability of finance.
Part Two: Availability of Bank Finance and Cluster of Enterprise:
Table 4.120 presents the case processing summary for second part of hypothesis three
Table 4.120 Case Processing Summary for Second Part of Hypothesis Three
Cases
Valid Missing Total
N
515
Percent
100.0%
N
0
Percent
.0%
N
515
Percent
100.0%
Related Cluster *
Availability of Finance
Table 4.121 below presents the cross-tabulation for selected variables
Table 4.121 Cross Tabulation for selected Variables
Difficult Average Easy Total
Related Oil Mill 54 10 6 70
Cluster Textile Printing
12
4
6
22
Flooring Tiles 35 8 15 58
Wall Clock 27 1 8 36
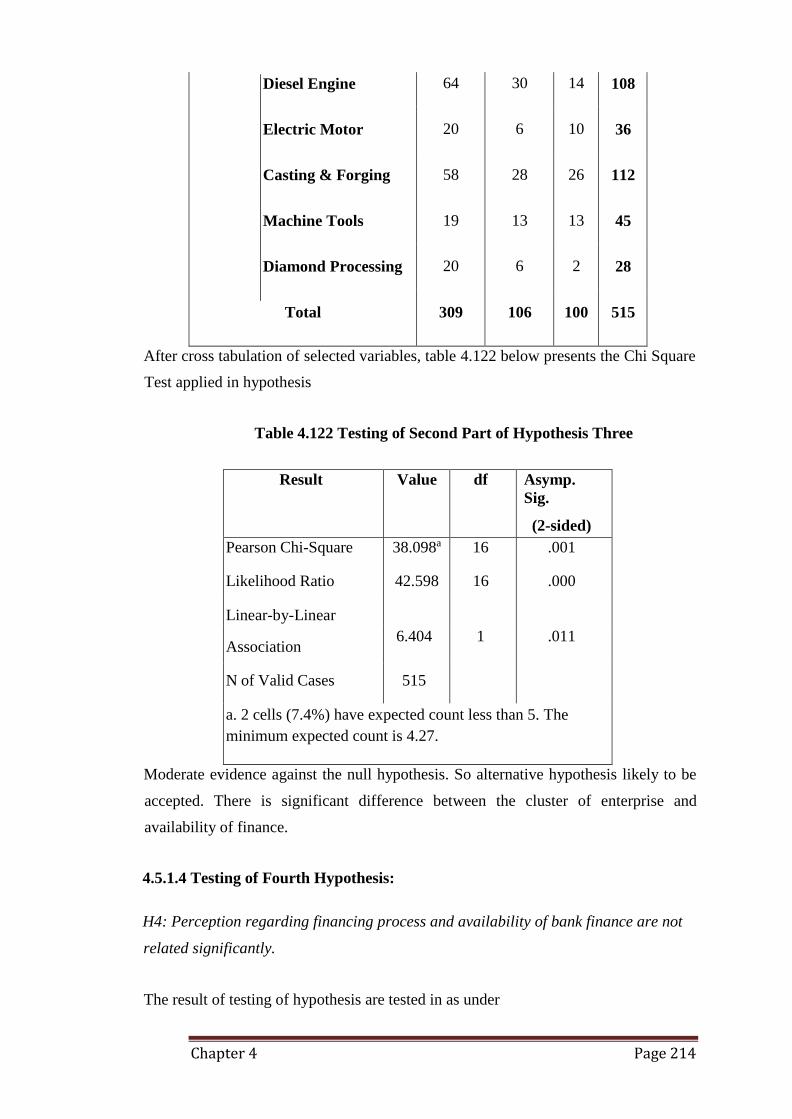
Chapter 4 Page 214
Diesel Engine 64 30 14 108
Electric Motor 20 6 10 36
Casting & Forging 58 28 26 112
Machine Tools 19 13 13 45
Diamond Processing 20 6 2 28
Total 309 106 100 515
After cross tabulation of selected variables, table 4.122 below presents the Chi Square
Test applied in hypothesis
Table 4.122 Testing of Second Part of Hypothesis Three
Result Value df Asymp.
Sig.
(2-sided)
Pearson Chi-Square 38.098a 16 .001
Likelihood Ratio 42.598 16 .000
Linear-by-Linear
Association 6.404 1 .011
N of Valid Cases 515
a. 2 cells (7.4%) have expected count less than 5. The
minimum expected count is 4.27.
Moderate evidence against the null hypothesis. So alternative hypothesis likely to be
accepted. There is significant difference between the cluster of enterprise and
availability of finance.
4.5.1.4 Testing of Fourth Hypothesis:
H4: Perception regarding financing process and availability of bank finance are not
related significantly.
The result of testing of hypothesis are tested in as under
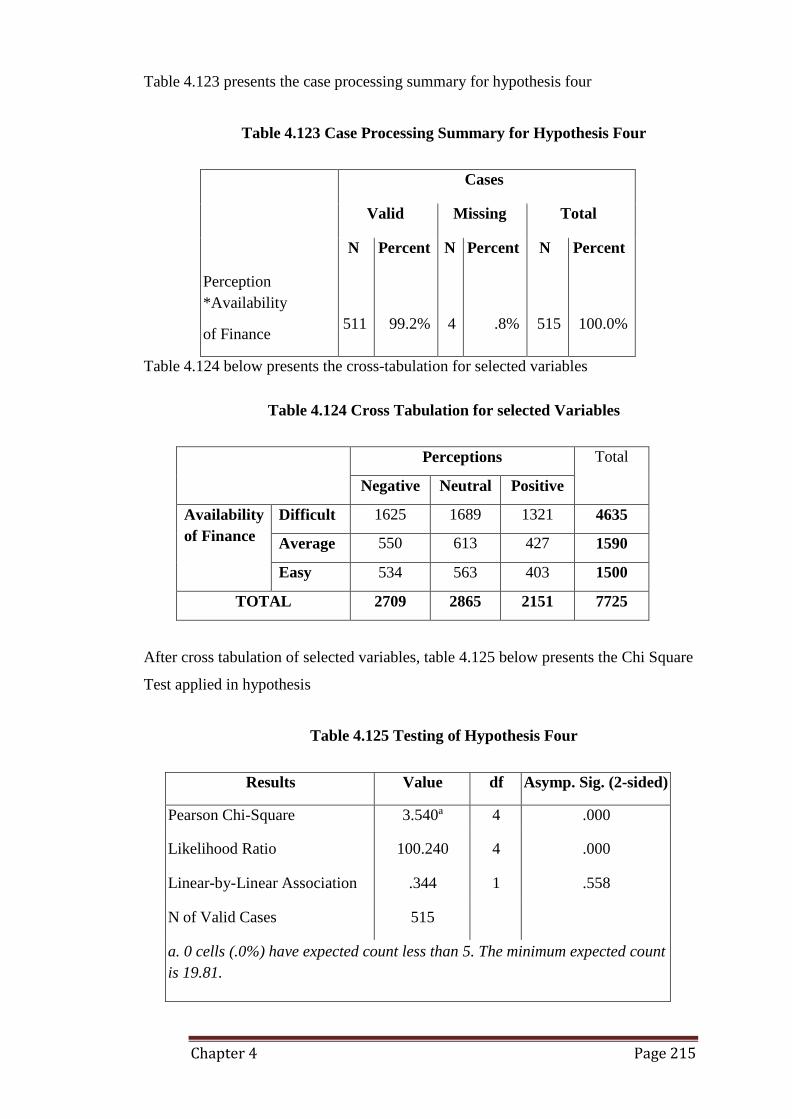
Chapter 4 Page 215
Table 4.123 presents the case processing summary for hypothesis four
Table 4.123 Case Processing Summary for Hypothesis Four
Perception
*Availability
of Finance
Cases
Valid Missing Total
N
511
Percent
99.2%
N
4
Percent
.8%
N
515
Percent
100.0%
Table 4.124 below presents the cross-tabulation for selected variables
Table 4.124 Cross Tabulation for selected Variables
Perceptions Total
Negative Neutral Positive
Availability
of Finance
Difficult 1625 1689 1321 4635
Average 550 613 427 1590
Easy 534 563 403 1500
TOTAL 2709 2865 2151 7725
After cross tabulation of selected variables, table 4.125 below presents the Chi Square
Test applied in hypothesis
Table 4.125 Testing of Hypothesis Four
Results Value df Asymp. Sig. (2-sided)
Pearson Chi-Square 3.540a 4 .000
Likelihood Ratio 100.240 4 .000
Linear-by-Linear Association .344 1 .558
N of Valid Cases 515
a. 0 cells (.0%) have expected count less than 5. The minimum expected count
is 19.81.
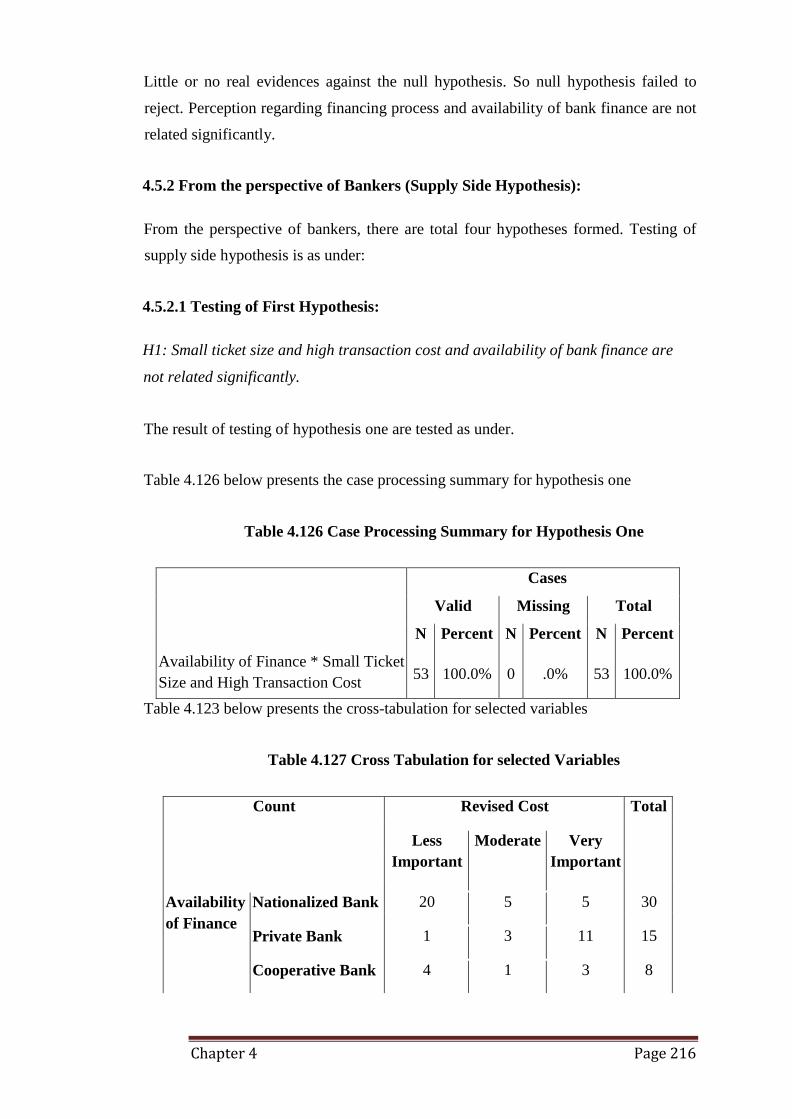
Chapter 4 Page 216
Little or no real evidences against the null hypothesis. So null hypothesis failed to
reject. Perception regarding financing process and availability of bank finance are not
related significantly.
4.5.2 From the perspective of Bankers (Supply Side Hypothesis):
From the perspective of bankers, there are total four hypotheses formed. Testing of
supply side hypothesis is as under:
4.5.2.1 Testing of First Hypothesis:
H1: Small ticket size and high transaction cost and availability of bank finance are
not related significantly.
The result of testing of hypothesis one are tested as under.
Table 4.126 below presents the case processing summary for hypothesis one
Table 4.126 Case Processing Summary for Hypothesis One
Availability of Finance * Small Ticket
Size and High Transaction Cost
Cases
Valid Missing Total
N
53
Percent
100.0%
N
0
Percent
.0%
N
53
Percent
100.0%
Table 4.123 below presents the cross-tabulation for selected variables
Table 4.127 Cross Tabulation for selected Variables
Count Revised Cost Total
Less Moderate Very
Important Important
Availability Nationalized Bank 20 5 5 30
of Finance Private Bank 1 3 11 15
Cooperative Bank 4 1 3 8
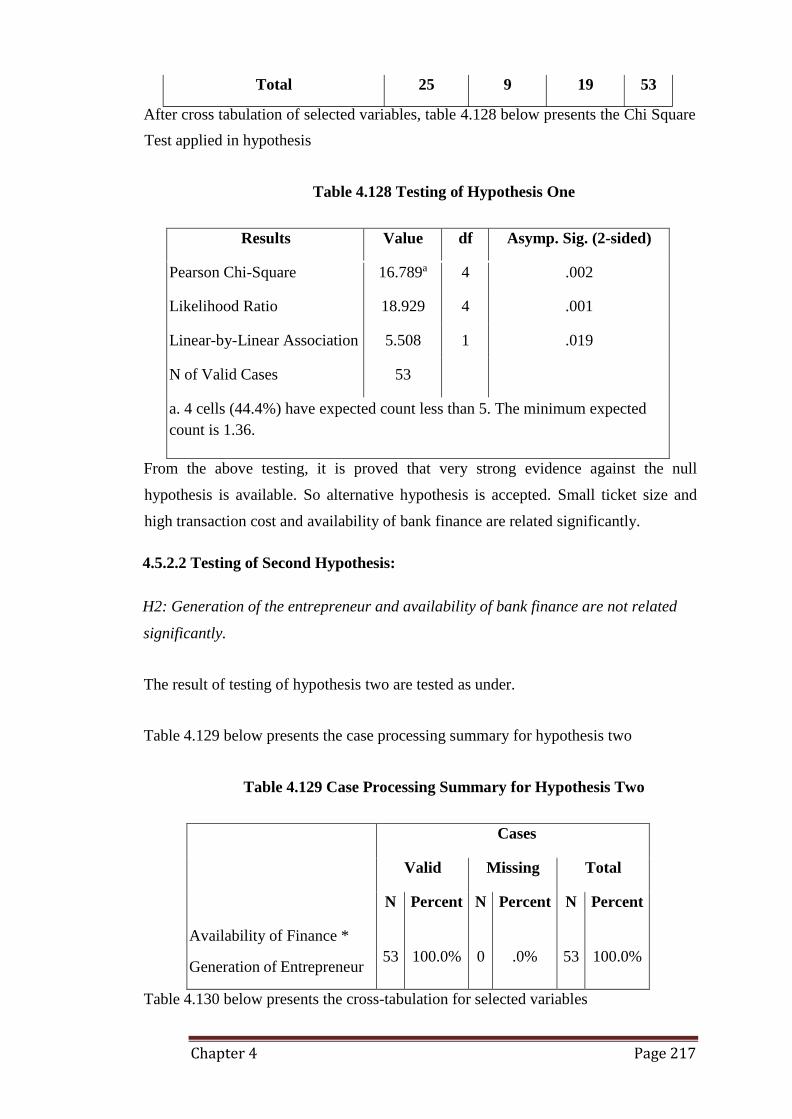
Chapter 4 Page 217
After cross tabulation of selected variables, table 4.128 below presents the Chi Square
Test applied in hypothesis
Table 4.128 Testing of Hypothesis One
Results Value df Asymp. Sig. (2-sided)
Pearson Chi-Square 16.789a 4 .002
Likelihood Ratio 18.929 4 .001
Linear-by-Linear Association 5.508 1 .019
N of Valid Cases 53
a. 4 cells (44.4%) have expected count less than 5. The minimum expected
count is 1.36.
From the above testing, it is proved that very strong evidence against the null
hypothesis is available. So alternative hypothesis is accepted. Small ticket size and
high transaction cost and availability of bank finance are related significantly.
4.5.2.2 Testing of Second Hypothesis:
H2: Generation of the entrepreneur and availability of bank finance are not related
significantly.
The result of testing of hypothesis two are tested as under.
Table 4.129 below presents the case processing summary for hypothesis two
Table 4.129 Case Processing Summary for Hypothesis Two
Availability of Finance *
Generation of Entrepreneur
Cases
Valid Missing Total
N
53
Percent
100.0%
N
0
Percent
.0%
N
53
Percent
100.0%
Table 4.130 below presents the cross-tabulation for selected variables
Total 25 9 19 53
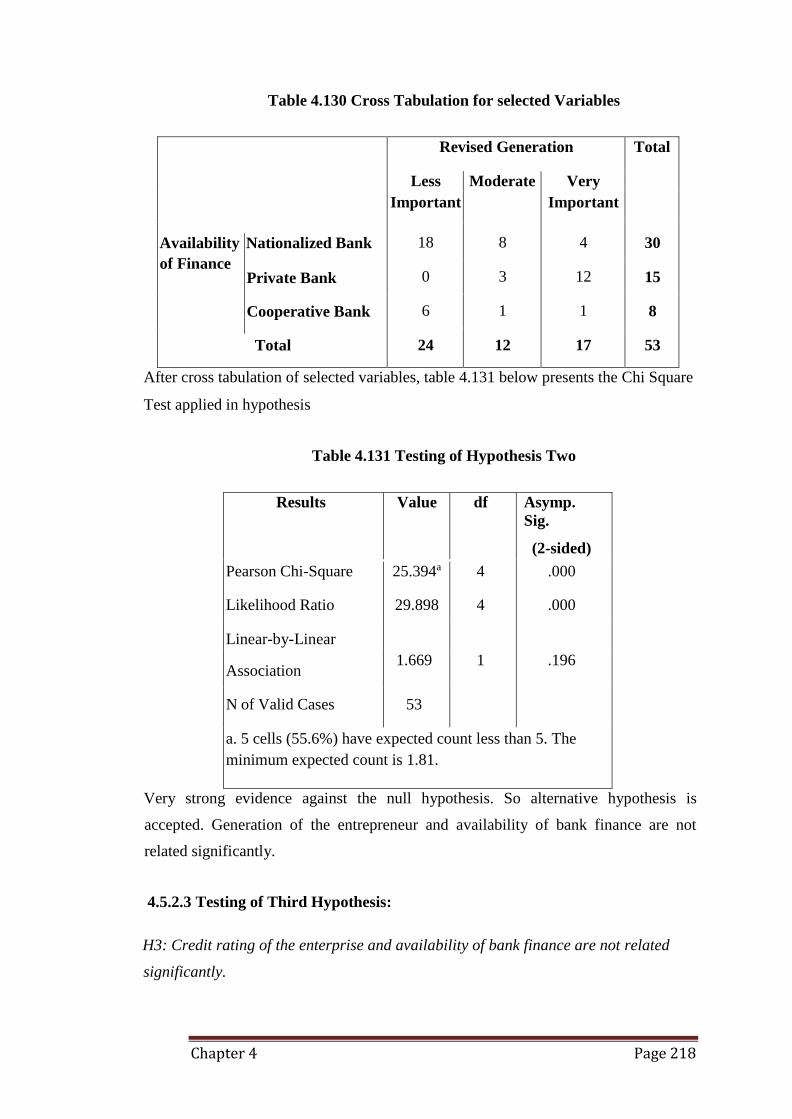
Chapter 4 Page 218
Table 4.130 Cross Tabulation for selected Variables
Availability Nationalized Bank
of Finance Private Bank
Cooperative Bank
Total
Revised Generation Total
Less Moderate Very
Important Important
18 8 4 30
0 3 12 15
6 1 1 8
24 12 17 53
After cross tabulation of selected variables, table 4.131 below presents the Chi Square
Test applied in hypothesis
Table 4.131 Testing of Hypothesis Two
Results Value df Asymp.
Sig.
(2-sided)
Pearson Chi-Square 25.394a 4 .000
Likelihood Ratio 29.898 4 .000
Linear-by-Linear
Association 1.669 1 .196
N of Valid Cases 53
a. 5 cells (55.6%) have expected count less than 5. The
minimum expected count is 1.81.
Very strong evidence against the null hypothesis. So alternative hypothesis is
accepted. Generation of the entrepreneur and availability of bank finance are not
related significantly.
4.5.2.3 Testing of Third Hypothesis:
H3: Credit rating of the enterprise and availability of bank finance are not related
significantly.
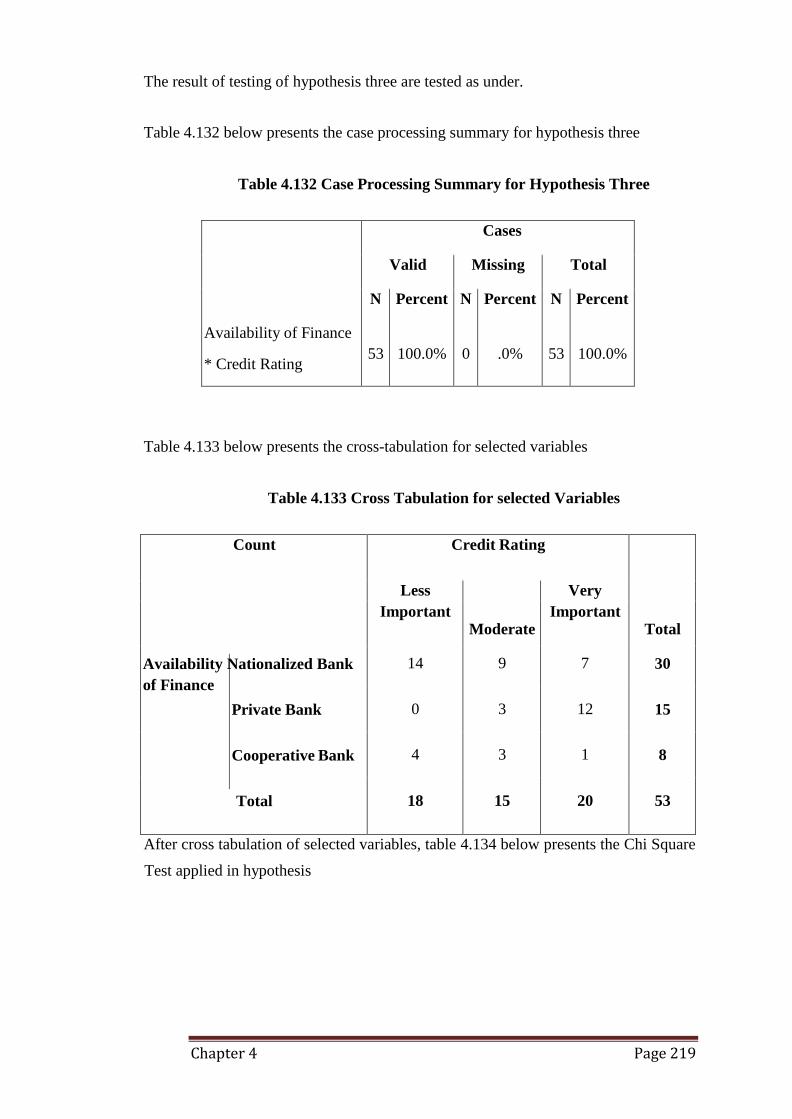
Chapter 4 Page 219
The result of testing of hypothesis three are tested as under.
Table 4.132 below presents the case processing summary for hypothesis three
Table 4.132 Case Processing Summary for Hypothesis Three
Availability of Finance
* Credit Rating
Cases
Valid Missing Total
N
53
Percent
100.0%
N
0
Percent
.0%
N
53
Percent
100.0%
Table 4.133 below presents the cross-tabulation for selected variables
Table 4.133 Cross Tabulation for selected Variables
Count
Availability Nationalized Bank
of Finance
Private Bank
Cooperative Bank
Total
Credit Rating
Less Very
Important
Moderate Important
Total
14 9 7 30
0 3 12 15
4 3 1 8
18 15 20 53
After cross tabulation of selected variables, table 4.134 below presents the Chi Square
Test applied in hypothesis
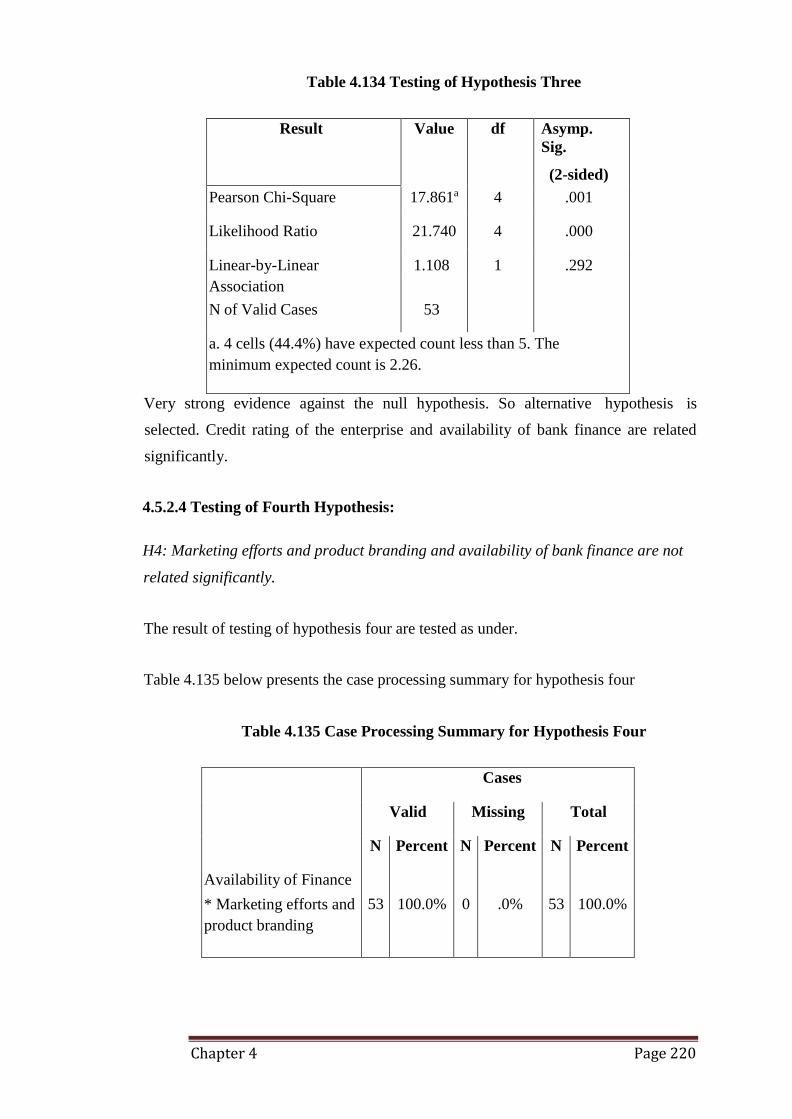
Chapter 4 Page 220
Table 4.134 Testing of Hypothesis Three
Result Value df Asymp.
Sig.
(2-sided)
Pearson Chi-Square 17.861a 4 .001
Likelihood Ratio 21.740 4 .000
Linear-by-Linear 1.108 1 .292
Association
N of Valid Cases 53
a. 4 cells (44.4%) have expected count less than 5. The
minimum expected count is 2.26.
Very strong evidence against the null hypothesis. So alternative hypothesis is
selected. Credit rating of the enterprise and availability of bank finance are related
significantly.
4.5.2.4 Testing of Fourth Hypothesis:
H4: Marketing efforts and product branding and availability of bank finance are not
related significantly.
The result of testing of hypothesis four are tested as under.
Table 4.135 below presents the case processing summary for hypothesis four
Table 4.135 Case Processing Summary for Hypothesis Four
Availability of Finance
* Marketing efforts and
product branding
Cases
Valid Missing Total
N
53
Percent
100.0%
N
0
Percent
.0%
N
53
Percent
100.0%
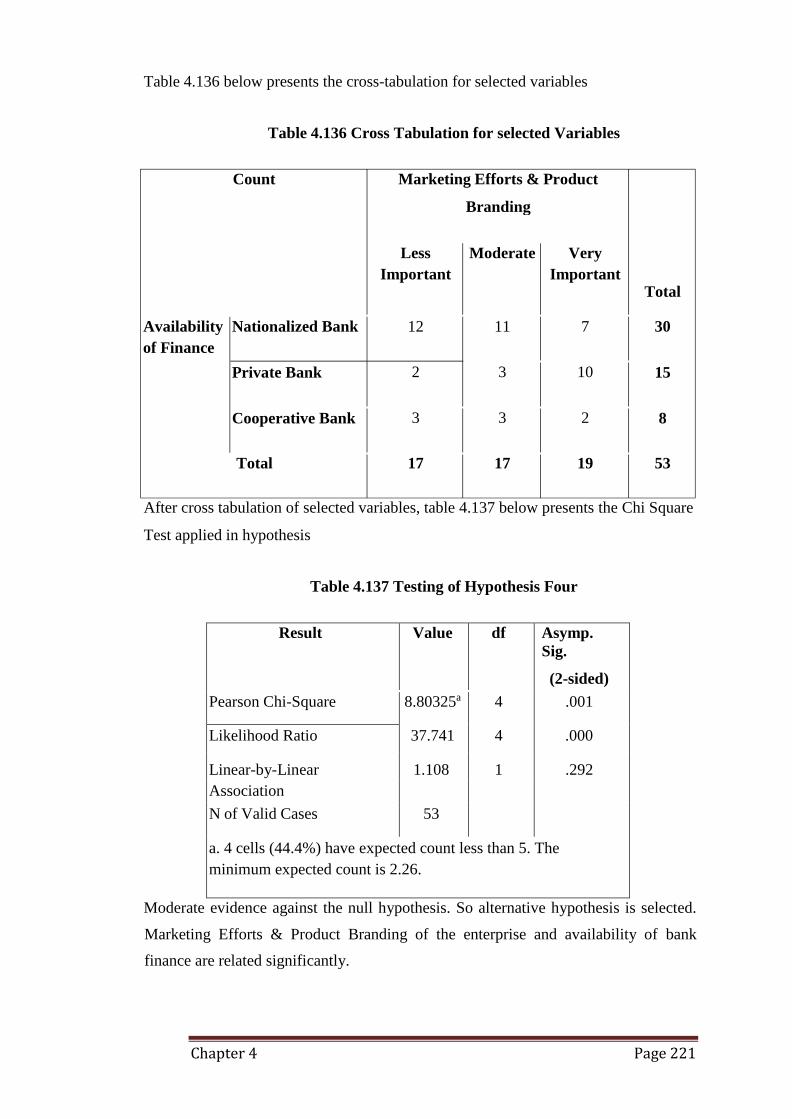
Chapter 4 Page 221
Count Marketing Efforts & Product
Branding
Table 4.136 below presents the cross-tabulation for selected variables
Table 4.136 Cross Tabulation for selected Variables
Less Moderate Very
Important Important
Total
Availability Nationalized Bank 12 11 7 30
of Finance
Private Bank 2 3 10 15
Cooperative Bank 3 3 2 8
Total 17 17 19 53
After cross tabulation of selected variables, table 4.137 below presents the Chi Square
Test applied in hypothesis
Table 4.137 Testing of Hypothesis Four
Result Value df Asymp.
Sig.
(2-sided)
Pearson Chi-Square 8.80325a 4 .001
Likelihood Ratio 37.741 4 .000
Linear-by-Linear 1.108 1 .292
Association
N of Valid Cases 53
a. 4 cells (44.4%) have expected count less than 5. The
minimum expected count is 2.26.
Moderate evidence against the null hypothesis. So alternative hypothesis is selected.
Marketing Efforts & Product Branding of the enterprise and availability of bank
finance are related significantly.
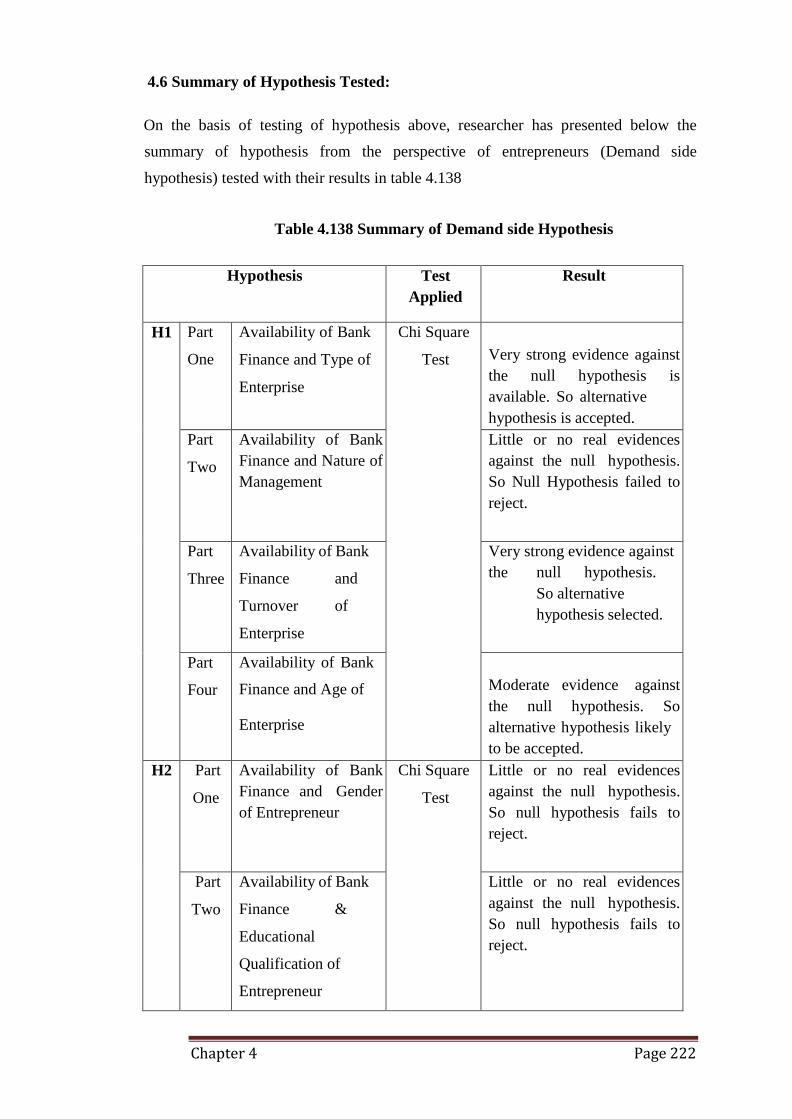
Chapter 4 Page 222
4.6 Summary of Hypothesis Tested:
On the basis of testing of hypothesis above, researcher has presented below the
summary of hypothesis from the perspective of entrepreneurs (Demand side
hypothesis) tested with their results in table 4.138
Table 4.138 Summary of Demand side Hypothesis
Hypothesis Test
Applied
Result
H1 Part
One
Availability of Bank
Finance and Type of
Enterprise
Chi Square
Test
Very strong evidence against
the null hypothesis is
available. So alternative
hypothesis is accepted.
Part
Two
Availability of Bank
Finance and Nature of
Management
Little or no real evidences
against the null hypothesis.
So Null Hypothesis failed to
reject.
Part
Three
Availability of Bank
Finance and
Turnover of
Enterprise
Very strong evidence against
the null hypothesis.
So alternative
hypothesis selected.
Part
Four
Availability of Bank
Finance and Age of
Enterprise
Moderate evidence against
the null hypothesis. So
alternative hypothesis likely
to be accepted.
H2 Part
One
Availability of Bank
Finance and Gender
of Entrepreneur
Chi Square
Test
Little or no real evidences
against the null hypothesis.
So null hypothesis fails to
reject.
Part
Two
Availability of Bank
Finance &
Educational
Qualification of
Entrepreneur
Little or no real evidences
against the null hypothesis.
So null hypothesis fails to
reject.
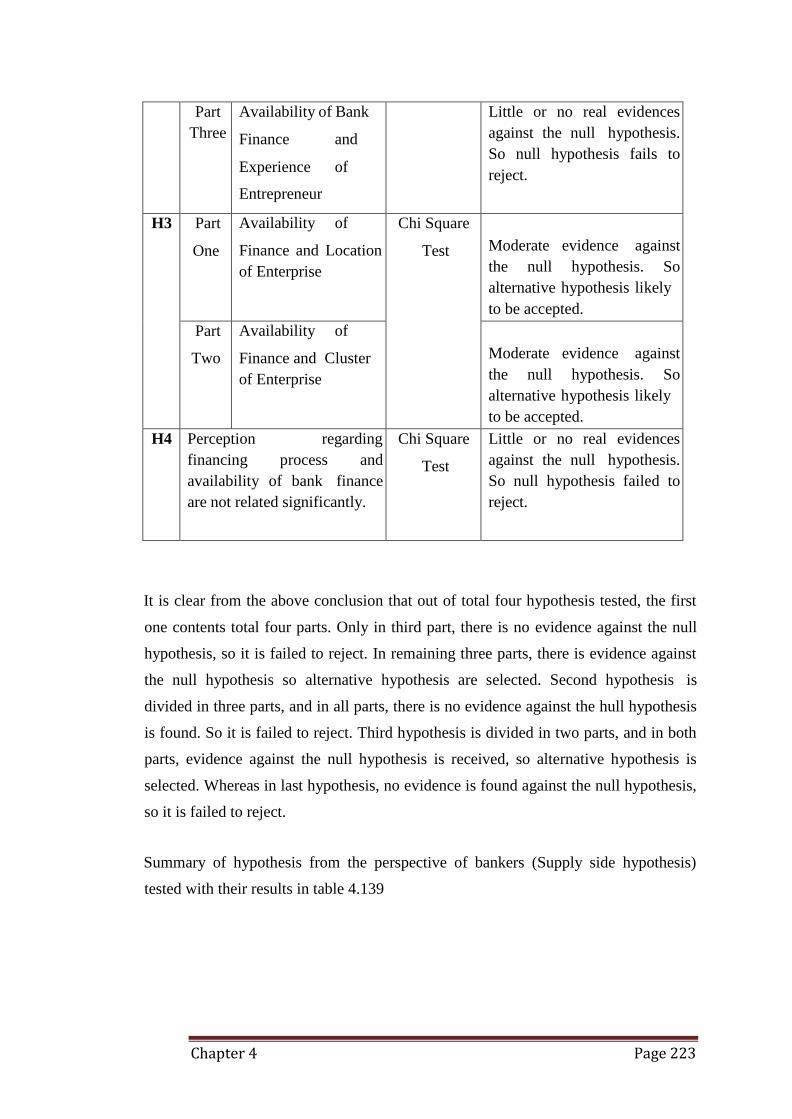
Chapter 4 Page 223
Part
Three
Availability of Bank
Finance and
Experience of
Entrepreneur
Little or no real evidences
against the null hypothesis.
So null hypothesis fails to
reject.
H3 Part
One
Availability of
Finance and Location
of Enterprise
Chi Square
Test
Moderate evidence against
the null hypothesis. So
alternative hypothesis likely
to be accepted.
Part
Two
Availability of
Finance and Cluster
of Enterprise
Moderate evidence against
the null hypothesis. So
alternative hypothesis likely
to be accepted.
H4 Perception regarding
financing process and
availability of bank finance
are not related significantly.
Chi Square
Test
Little or no real evidences
against the null hypothesis.
So null hypothesis failed to
reject.
It is clear from the above conclusion that out of total four hypothesis tested, the first
one contents total four parts. Only in third part, there is no evidence against the null
hypothesis, so it is failed to reject. In remaining three parts, there is evidence against
the null hypothesis so alternative hypothesis are selected. Second hypothesis is
divided in three parts, and in all parts, there is no evidence against the hull hypothesis
is found. So it is failed to reject. Third hypothesis is divided in two parts, and in both
parts, evidence against the null hypothesis is received, so alternative hypothesis is
selected. Whereas in last hypothesis, no evidence is found against the null hypothesis,
so it is failed to reject.
Summary of hypothesis from the perspective of bankers (Supply side hypothesis)
tested with their results in table 4.139
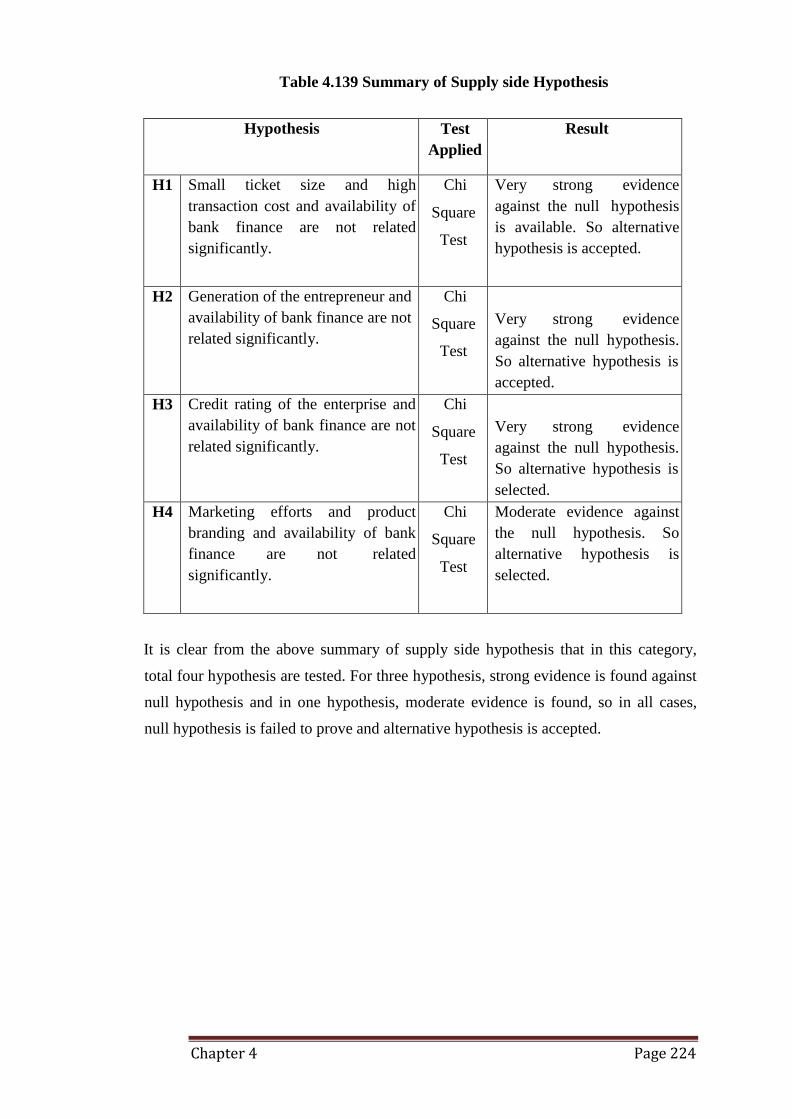
Chapter 4 Page 224
Table 4.139 Summary of Supply side Hypothesis
Hypothesis Test
Applied
Result
H1 Small ticket size and high
transaction cost and availability of
bank finance are not related
significantly.
Chi
Square
Test
Very strong evidence
against the null hypothesis
is available. So alternative
hypothesis is accepted.
H2 Generation of the entrepreneur and
availability of bank finance are not
related significantly.
Chi
Square
Test
Very strong evidence
against the null hypothesis.
So alternative hypothesis is
accepted.
H3 Credit rating of the enterprise and
availability of bank finance are not
related significantly.
Chi
Square
Test
Very strong evidence
against the null hypothesis.
So alternative hypothesis is
selected.
H4 Marketing efforts and product
branding and availability of bank
finance are not related
significantly.
Chi
Square
Test
Moderate evidence against
the null hypothesis. So
alternative hypothesis is
selected.
It is clear from the above summary of supply side hypothesis that in this category,
total four hypothesis are tested. For three hypothesis, strong evidence is found against
null hypothesis and in one hypothesis, moderate evidence is found, so in all cases,
null hypothesis is failed to prove and alternative hypothesis is accepted.
Chapter 5 Page 225
Chapter - 5
Findings, Conclusion and future scope
Chapter contents:
5.1 Findings
5.2 Conclusions and future scope
Chapter 5 Page 226
5.1 Findings:
After analysis and interpretation of data collected through questionnaire and hypothesis
testing, researcher has come out with some major findings. Findings are categorized as
from the perspective of entrepreneurs and from the perspective of bankers. Findings are as
under:
5.1.1 From the perspective of Entrepreneurs:
Availability of finance to entrepreneurs is an important issue raised since many years and it
contains the problems which are quite unique in nature such as access to capital,
technology, skill, market, awareness etc. Among all the factors, access of adequate finance
at correct time resolves most of these critical issues. The major reasons for unavailability
of adequate finance to entrepreneurs may be the high risk perception among bankers about
the sector and the high transaction cost for loan appraisal. From the perspective of
entrepreneurs, following are some major findings:
Out of 515 entrepreneurs selected, majority of them belongs to HUF (156, 30.3%)
followed by partnership (148, 28.7%) , sole proprietor (107.20.8%) and private
company (82, 15.9%) and remaining belongs to other category (22, 4.3%).
Turnover or sales of the business is one of the most important factor for
availability of finance. As per the analysis only 9 (1.7%) enterprises have turnover
above 10 crore and 69 (13.4%) enterprise have turnover above 1 crore. Remaining
all enterprises have turnover less than 1 crore annually.
Age of enterprise is not so important, but it shows the credibility of enterprise. In
the analysis, oldest enterprise is one which has age above 50 years, 7 (1.4%)
belongs to 41 to 50 years, 14 (2.7%) belongs to 31 to 40 years. New
entrepreneurs, which are also known as first generation entrepreneurs who started
their enterprise in last five years are 94 (18.3%).
If we analyze entrepreneurs on the basis of gender, a high level of inequality is
still derived. Out of total 515 respondents selected, majority of them 88.9% are
male and female are only 11.1%. Thus, it shows that the sector is dominated by
male entrepreneurs.
Chapter 5 Page 227
If we make age wise distribution of respondents there are no minor respondents up
to 18 years. Age of majority of respondents 165 (32%) falls in the category of 26
to 35 years. Second highest category includes the age group of 36 to 45 years with
162 respondents (31.5%). 113 respondents (21.9%) falls under category of 46 to
55 years, followed by 48 respondents (9.3%) in the age group of 56 to 65 years,
18 (3.5%) in the senior age group of more than 65 years. The least respondents 9
(1.7%) belongs to the age group of 19 to 25 years. So overall we can say that
maximum number of respondents are having some experience.
Experience of entrepreneurs is also considered as an important factor for
availability of bank finance. As per the data analyzed, maximum number of
respondents 197 (38.3%) have the experience of 11 to 20 years. Second highest
experience category is of 21 to 30 years with total 169 (32.8%) respondents,
followed by 94 (18.3%) in 31 to 40 years’ experience, 32 (6.2%) in the category of
41 to 50 year experience, 13 (2.5%) in the category of 6 to 10 year experience and only 9
(1.7%) in the category of least experience up to 5 years. Only 1 respondent (0.20%) is
recorded with highest experience above 50 years.
On the basis of educational qualification of respondents, most of them are
educated. If we analyse category wise, 191 (37.1%) have either diploma or
certification. Second highest category consist 173 (33.6%) respondents with
graduation degree. Whereas the respondents with education up to school level are
67 (13%), followed by 52 (10.1%) post graduates and 23 (4.5%) with technical
education. Only 9 (1.7%) respondents have professional qualification.
On the basis of category of the enterprise, maximum number of enterprises
belongs to small enterprises 233 (45.2%). Second largest category is medium
enterprises which are 180 (35%) and the category with the least enterprises is
micro enterprises which are 102 (19.8%).
Information regarding obtaining finance also plays an important role in
availability of finance. As per the data derived, most of the respondents - 274
obtains information for financial sources from their personal contacts. Whereas
213 respondents obtains information from newspapers/magazine etc. 204
respondents obtain information from other ways and 82 of them obtains from
government websites or advertisements. Only 36 respondents take the help of
financial consultants regarding this.
Chapter 5 Page 228
Finance received from other sources is also an important factor for availability of
bank finance. On this base, maximum respondents 444 (33.20%) have favored the
source of finance is from friends or relatives. Another most preferred source of
finance is finance from non-banking finance companies which is adopted by 316
[23.60%] of respondents. Bank Overdraft or Cash Credit is also one of the
attractive sources, as it is adopted by the 214 (16%) respondents. Other less
preferred sources includes finance from other sources than mentioned here which
are 83 (6.20%), finance from other enterprises 74 (5.50%), modern sources like
lease/hire purchase/factoring are adopted by 67 (5%), mortgage by 61 (4.60%),
government grants/subsidy is adopted by 48 (3.60%) and the least preferred
source is private equity/venture capital which is adopted by only 31 respondents
(2.30%).
Purpose of obtaining finance or utilization of bank finance is also an important
factor for availability of finance. As per the information derived, majority of
respondents 354 (31.10%) requires the finance for working capital. Second
highest purpose of finance is for purchase of plant and machinery 138 (12.10%),
followed by research and development 120 (10.50%), to buy the new business 111
(9.70%), for other purpose 106 (9.30%), for marketing and advertisement 98
(8.60%), for renovation 83 (7.30%), for training and development of employees
66 (5.80%) and to purchase of fixed assets like land and building are least 64
(5.60%).
After applying for the bank finance, it is interested to study that at which stage
majority of the entrepreneurs face problems. As per the analysis of data, most of
the respondents 297 (57.5%) have faced problems during last stage of application.
85 (16.5%) of respondents are not able to say their opinion. On the other hand,
respondents who have faced problems at the first stage before application are 56
(10.9%). Followed by the beginning stage after application where respondents are
42 (8.2%). The phase where respondents have faced minimum problems is mid
stage after application where respondents are 35 (6.8%).
One of the most common complain of entrepreneurs with regard to failure in
obtaining the loan is not availability of proper guidance from the bank. On this
base, majority of the respondents 222 (43.10%) consider lack of guidance
regarding bank loan procedure as a main responsible factor. 166 (32.20%) of
Chapter 5 Page 229
respondents believe this factor responsible in some extent. According to 88
(17.10%) respondents, this factor is not so responsible. There are 24 (4.70%)
respondents who are not able to say about the question. As per the 15 (2.9%)
respondents this reason is not at all responsible towards availability of bank loan.
Due to unavailability of finance, majority of entrepreneurs are facing problems in
various issues, like effect on financial position of the enterprise, effect on
productivity, effect on future planning of the business, worst effect on working
capital related transactions, effect on sales or turnover, effects on research and
development issues and issues related to human resources like training, salary,
wages, welfare activities etc.
As per the results of the hypothesis tested, in first part of first hypothesis, it clear
that availability of bank finance and type of enterprise are significantly related to
each other. So with compare to medium enterprise, small enterprise will face
difficulties in obtaining finance. Greater the size of business or type of enterprise,
availability of finance is easy.
By testing the second part of hypothesis one, the result prove that there is no
significant relation between the availability of bank finance and nature of
management. So one can say that whether the enterprise is self-managed,
partnership, HUF or any other type, it does not affect to availability of finance.
Third part of hypothesis one is tested to check the significant relation between the
turnover of the enterprise and availability of finance. As per the result of test,
there is high level of relationship is found. So it said that higher the turnover of the
business, higher chances of availability of bank finance.
Fourth part of the hypothesis one presents the relationship between the availability
of bank finance and age of enterprise. As per the result of hypothesis testing, it is
proved that there is significant relation between the age of enterprise and
availability of finance. Older the enterprise, higher chance of availability of
finance.
Second hypothesis is divided in three parts. First part of the second hypothesis
presents the significant relation between the availability of bank finance and
gender of entrepreneur. As per the result of hypothesis tested, little or no real
evidence against the null hypothesis is obtained so null hypothesis failed to reject.
So it clear that gender of the entrepreneur and availability of bank finance are not
related significantly.
Chapter 5 Page 230
Part two of the second hypothesis analyze the significant relation between
availability of bank finance and educational qualification of enterprise. As per the
result of hypothesis, null hypothesis is failed to reject. So we can say that there is
no significant relation between the availability of bank finance and educational
qualification of entrepreneur.
Third part of hypothesis two presents the significant relation between availability
of bank finance and experience of entrepreneur. As per the result of hypothesis, no
evidence against null hypothesis. So it is clear that availability of finance and
experience of entrepreneurs are not related significantly.
Third hypothesis is divided in two parts. The first part of hypothesis three has
derived the result that there is moderate evidence against the null hypothesis. So
alternative hypothesis likely to be accepted. Thus availability of finance and
location of enterprise are related significantly.
Second part of third hypothesis three has received the outcome that there is
moderate evidence against the null hypothesis. So alternative hypothesis likely to
be accepted. Thus, availability of bank finance and cluster of enterprise are related
significantly.
Fourth hypothesis tests the significant relation between the perceptions of
entrepreneurs regarding availability of bank finance and availability of bank
finance. As per the result of hypothesis four, there is no evidence against the null
hypothesis. Thus there is no significant relation between the perception regarding
financing process and availability of bank finance.
Thus overall analysis of entrepreneurs’ perception regarding availability of bank
finance presents the various results. Not only one factor but many factors are
responsible for unavailability of finance to them and most of them are issues
which can be resolved with proper guidance and committed efforts towards the
issue. Now it’s time for the government to focus on such issues and resolve them
for fast growth and development of entrepreneurs and MSME sector.
5.1.2 From the perspective of Bankers:
After analysing the questionnaire developed for the entrepreneurs, analysis of
questionnaire for bankers is undertaken. Issue of unavailability of finance is bilateral issue
and one cannot blame only one side. That is the reason, for this study, researcher has
analysed this issue with the help of bankers’ perception also. Bankers – bank managers are
Chapter 5 Page 231
the person who are very right people to say anything about this and they, being the
authorized person for approval of finance, have weighted in their answers. Following are
some major findings of unavailability of finance from the perspective of bankers:
One of the most important reason for unavailability of finance to entrepreneurs is
their risky status. As per the data analyzed about the finance to MSMEs is likely
to be NAP, majority of the bankers 19 (35.8%) believe this factor as important
factor for financing gap in MSMEs, whereas 14 (26.4%) bankers are neutral about
this issue. 13 (24.5%) of bankers believe this factor as most important factor.
According to 5 (9.4%) bankers, this factor is less important and according to 2
(3.8%) bankers, this factor is not important.
Another important factor considered for negligence of MSMEs for finance is high
transaction cost of the finance. As per the analysis of this question, majority of the
bankers 17 (32.1%) believe this factor as less important and according to 14
(26.4%) bankers, this factor is important. 9 (17%) respondents are neutral about the
statement, whereas 8 (15.1%) respondents believe this factor as not important. Remaining
5 (9.4%) respondents believe this as very important factor.
Whether generation of entrepreneurs play any role regarding availability of bank
finance or not is also asked in the analysis. As per most of the bankers 19 (35.8%)
believe this factor as less important and according to 13 (24.5%) bankers, this
factor is important. 12 (22.6%) respondents are neutral about the statement,
whereas 5 (9.4%) respondents believe this factor as not important. Remaining 4
(7.5%) respondents believe this factor as very important factor.
Nowadays credit rating is considered as most important factor for availability of
bank finance from the bankers’ point of view. In answer of this statement,
majority of the respondents 17 (32.1%) consider this credit rating as less
important factor. Whereas, according to 16 (30.2%) respondents, this factor is
important, and 15 (28.3%) respondents are neutral about the statement. 4 (7.5%)
respondents consider this factor as most important factor and according to only
one respondent (1.9%), credit rating is not important for availing the finance.
Lack of proper infrastructure is considered for availability of bank loan or not is
also asked to the bankers. According to majority of the respondents 17 (32.1%)
are neutral about the statement, whereas 13 (24.5%) respondents consider lack of
proper infrastructure as less important factor. 12 (22.6%) respondents believe it
important and 6 (11.3%) respondents consider it as not important. According to 5
Chapter 5 Page 232
(9.4%) respondents, this is very important factor for availing the finance.
Most of the entrepreneurs are having lack of marketing and branding efforts for
their products or services with compare to large organizations. As per majority of
the respondents 20 (37.7%) consider this factor as important factor for availing the
finance and 12 (22.6%) respondents consider this as very important factor,
whereas 11 (20.8%) respondents are neutral about the statement. According to 7
(13.2%) respondents, it is less important and according to 3 (5.7%) respondents, it
is not important factor for availing the bank finance.
Central government has announced the various schemes for the welfare of
entrepreneurs and MSME sector, but all these schemes are utilized in very less
proportion. Among the responsible factors for this, majority of respondents have
claimed lack of awareness among entrepreneurs about such schemes, lack of
awareness among all bank branches, branches which are providing this type of
special services are limited, lengthy process for the same and less amount of loan is also
considered.
Another important missing element according to bankers from entrepreneurs are
lack of proper documents, lack of proper maintenance of financial accounts,
financial reports, lack of mortgage or collateral for loan when the amount
demanded is high, lack of proper project report required for bank loan, education
and experience of entrepreneurs, seed capital invested by them etc.
On the other hand, banks are also facing various issues like lack of proper and
committed staff towards this function, absence of branches in key areas and rural
areas, lack of information among the staff, less number of employees pressurized
with heavy work load etc. Banks should focus on these issues also to resolve the
problem of bank finance to entrepreneurs.
From the perspective of bankers, total four hypothesis are tested with the help of
chi square test. As per the result of the hypothesis one, small ticket size and high
transaction cost and availability of bank finance are related significantly. So bank
should focus to make the process more efficient and less costly.
As per the second hypothesis tested, again very strong evidence in found against
the null hypothesis and on the basis of same, one can say that Generation of the
entrepreneur and availability of bank finance are related significantly. If there is
first generation of entrepreneur, more difficulties in getting finance are predicted.
According to the results of hypothesis three, very strong evidence against the null
hypothesis. So we can say that credit rating of the enterprise and availability of
Chapter 5 Page 233
bank finance are related significantly. So MSMEs should be made aware about
same to avail the finance and other benefits easily with the help of credit rating.
Fourth and last hypothesis of supply side is also against the null hypothesis and it
prove that marketing efforts and product branding and availability of bank finance
are related significantly. So the entrepreneurs who are more conscious about the
product marketing and branding have great chances of getting finance from the
bank easily.
5.4 Conclusion and future scope:
After conducting the survey and analyzing the data collected through questionnaire and
testing them with the help of statistical tools, researcher has derived some findings which
are mentioned above and on the basis of entire work and findings and experience during
the research work, researcher has narrated some suggestions which may be helpful to the
entrepreneurs, bankers, policy makers and all those stakeholders which are related to
finance directly or indirectly. These suggestion are feasible up to which extent or are result
oriented or not is the practical issue, as all these suggestions are based on limited work
done in particular region and clusters and samples.
5.4.1 For Bankers:
Improvement in Human Resource in Banks:
Human capital is the key driver of finance in banking. Banks should focus on
recruitment of trained and committed staff in their all branches for this purpose.
Banks may also develop the longtime relationship with entrepreneurs and can help
and guide them in nurturing the enterprise till it make profit.
Improvement in procedures and policies:
Another important aspect is lengthy process of bank finance and difficult policies
of credit. Normally entrepreneurs are not able to take help of any experts or
professionals of finance so they face maximum difficulties at this stage. Banks
should focus on make their procedures more customer friendly so that they can
contact and follow the procedures without any hesitation.
Less or No Collateral from entrepreneurs:
Many entrepreneurs facing problem of bank finance due to lack of collateral or
mortgage. At this moment, it should be responsibility of banks to resolve this issue
Chapter 5 Page 234
to promote the entrepreneurs. For large enterprises, it is easy to provide the
collateral but it is very difficult for small and first generation entrepreneurs to cop
up with the collateral. So banks should efforts towards less or no collateral from
first generation entrepreneurs.
Make the finance Cost Effective:
Another most important challenge and issue for the bankers is to make the finance
to MSMEs more cost effective. As per the data analyzed, most of the bankers
believe this factor as important factor for non-availability of bank finance. So it
proves that the current procedures of bank finance are not cost effective. If banks
resolve this issue, entrepreneurs can get loan easily without any lengthy process
and at the lowest cost.
Change the perception regarding MSMEs:
It is noted that majority of bankers considers finance to MSMEs as increase in
NPA. It may be true in some extent but by considering the contribution of this
sector in Indian economy and GDP, they should avoid this type of mindset.
Instead of that, bankers should work with entrepreneurs of MSMEs with the mind
set of development partners. This sector is the backbone of large enterprises so
without accelerating them, it is not possible to boost the large organizations also.
So bankers should change their perceptions regarding MSMEs.
Remedial Centers:
Bank should think about to open some remedial centers for MSMEs and
entrepreneurs. In such remedial centers, experienced staff should be appointed
who guide and help to entrepreneurs in all aspects for getting the finance. With the
help of such remedial centers, bank can resolve the maximum number of issues
which they are facing in providing finance.
5.4.2 For Entrepreneurs:
Need to Increase Competitiveness:
Entrepreneurs belongs to MSME sector in India are facing various issues due to
lack of finance, proper guidance, lack of infrastructural facilities, lack of expertise
knowledge, marketing, advertisement, branding etc. Due to that, they are not able
to compete with the large organizations or multinational companies or foreign
companies. So it is advice to entrepreneurs that guidance of expert professional
and research and development are also important like other factors in any
Chapter 5 Page 235
business. They should focus to improve competitiveness by considering all these
issues. Initially they may cost high but at the long run, it may convert in cost
efficiency and saving and due to that improvement in competitiveness.
Proper Documentation:
Another important aspect for lacking in finance for entrepreneurs is lack of proper
documentation. As per the data analyzed, most of the respondents have proven
that their loans are rejected due to lack of proper documentation and improper
final accounts. Entrepreneurs should focus on this issue with due diligence and
should be serious about the finance and accounting work of the enterprise. Due to
proper documentation, they will able to get finance easily.
Marketing/Branding Efforts:
Only production of service or product is not only important factor. But
advertisement, after sale service or branding are also important. Most of the
Entrepreneurs do not consider this as important factors. As per the tradition their
trade is limited till selling only. But nowadays marketing and branding effectors
are also very important aspects in any business. Entrepreneurs should focus on
this to boost their business.
Seed Capital:
Seed capital or startup capital which is also known as equity plays an important
role to avail the bank finance also. Any bank will not issue loan of entire amount
but it will wish that some proportion of amount should be backed by the
entrepreneurs. So considering this requirement, entrepreneurs’ always should be
ready to arrange specific initial proportion of finance from their sources and
should be depended on bank for the remaining portion of finance.
Careful selection of Other Sources of Finance:
It is obvious that no entrepreneur or business uses only one source of finance but
they are dependent on various sources. Entrepreneurs should be very careful while
they are choosing other sources of finance. It should be noted that the sources
selected should be legal and formal sources of finance and obtained in the manner
so that debt equity ratio of the enterprise should be balanced.
Expertise Knowledge and Professional Help:
It is noted that very few entrepreneurs are getting professional services regarding
finance and financial management. In India, most of the entrepreneur takes
financial decision their own. Actually this trend in very dangerous for them. It is
Chapter 5 Page 236
not necessary that a good entrepreneurs may good in financial decisions also. So
instead of taking this type of decisions their own, they should avail facilities of
financial experts who are working professionally.
Innovative and Modern Sources of Finance:
Nowadays apart from the traditional sources of finance, entrepreneurs should
think about the innovative and modern sources of finance. Like venture capital,
private equity, factoring, foreign direct investment etc. By use of innovative
sources of finance, enterprise also can get the advantage of their advice and
expertise knowledge.
Innovations and Technology:
It is believed that Indian MAME sector is mainly dependent on traditional sources
of production say manual production and there is lack of innovative technology.
Entrepreneurs should try to avoid this type of image by investing enough amount
in innovative technologies. They can also take advantage of internet in this regard.
With the help of social networking sites, they can make marketing and branding of
their products and services.
Research and Development:
Another important aspect where Indian entrepreneurs are required to improve their
image is research and development. It is believed that Indian entrepreneurs and
MSME sector spends very less amount for research and development and
designing of products. By spending more amount after research and innovation,
Indian entrepreneurs can improve their image and can attract the bankers.
Credit Rating
Credit rating is a very essential requirement for any type of business nowadays.
Various credit rating companies are providing their services in India and it is
available for all type of business. Due to credit rating, bank will find it very easy
to put trust on any enterprise. So credit rating initially may be costly for any
enterprise, but it may be profitable for them.
5.4.3 For Policy Makers:
To boost the MSME sector and entrepreneurs, role of policy makers is also very
critical. Various policy makers play vital role in availability of finance to MSMEs like
central government, state government, ministry of finance, Reserve Bank of India,
Banking companies, NBFCs etc. Following are some recommendations for policy
makers:
Chapter 5 Page 237
Easy and Timely access of credit:
Major problem of Indian SMEs is adequate and timely access of credit from banks
for growth and development. To overcome this issue, the Prime Minister’s Task
Force on MSMEs (Chairman: Shri T.K.A. Nair, Principal Secretary, Government
of India) constituted by the Government of India. According to the
recommendations of the task force, banks are required to achieve a 20% year on
year growth in credit to micro and small enterprises; the allocation of 60% of the
MSE advances to the micro enterprises is to be achieved in stages and then 10%
annual growth in number of micro enterprise accounts. The RBI is closely
monitoring the achievement of targets by banks on quarterly basis. Though only
policy recommendations are not enough, banks have to work on them with their
great efforts to achieve the target of empowerment of SMES.
Open the sector for Venture/ Risk Capital:
Normally banks consider the SMEs very risky as in initial stages, there are high
chances of failure of default. So at this stage venture/ risk capital is considered as
more appropriate financing instrument for high growth potential and startup
SMEs. During the starting face, firms need finance to study, access and develop
an initial concept or for product development and initial marketing. Venture
capitalists or angel investors not only provides them finance, but also provides the
guidance and help in managerial decision making. For this purpose, removing
fiscal and regulatory impediments to the use of such funds by the SMEs should be
considered on priority. The Government of India, in terms of the
recommendations of the PM’s Task Force on MSMEs, is looking into the area.
Access of equity capital through stock exchanges:
For Indian SMEs, access of equity capital is a genuine problem. There is
negligible flow of equity capital is noted in this sector. Due to lack of equity
funds, SMEs suffers with great issues of growth, research, development, market
expansion, technology etc. There is a demand for a dedicated exchanges for
MSMEs and SEBI has permitted BSE and NSE for the same. Even BSE has
already started a special exchange on MSMEs i.e. BSE SME, but very few SMEs
are listed in it till date. So it also requires awareness among the SMEs in this
regard.
Chapter 5 Page 238
Need for Skilled Labour:
India is considered as the youngest nation in the world, but on the other hand,
SME sector is facing large problem for skilled labour. As per the report of the
National Commission on Population, by 2016, approximately 50% of the total
population will be in the age group of 15 – 25 years. On in average, it is estimated
that around 1.5 crore persons per annum would enter the employment market
during the next 30 years. Thus Government has very vast opportunity to convert
this youth in skilled labour and to avail them for SMEs and corporate sector.
Though the Rural Self Employment Training Institutes (RSETIs) are working in
this direction. There is, however, a need to examine the impact of it.
Access of Information Technology:
In the recent research undertaken by Google and FICCI regarding usage of
information technology and internet by SMEs, very shocking outcome have been
founded. Out of total registered SMEs in India, only 5% of them having their own
website and access of internet. In other words, 95% SMEs are not connected with
the world market though internet facilities and not using the information
technology for the interest of their business. It is also founded in research that the
firms those are having their own website, enjoying 8 to 9 times more net profit
then who do not have access of it. So it proves that there is a keen need to include
maximum SMEs with internet and information technology. In this regard, recently
MSME Ministry has started Project Baadal to avail the benefits of cloud
computing, though it is just in introductory face, but it may prove as miracle in
growth of SMEs if implement properly.
Services of Factoring:
One of the serious credit issue for SMEs is working capital. Due to the credit
norms in the industry, delay in settlements of dues or bills etc. effects adversely to
SMEs. At this moment factoring services to SMEs may help. Factoring provides
liquidity to SMEs against their receivables from customers and is regarded as a
cash management tool. To facilitate factoring services, the Government has
recently passed the Factoring Regulation Bill that would address delays in
payment and liquidity problems of SMEs.
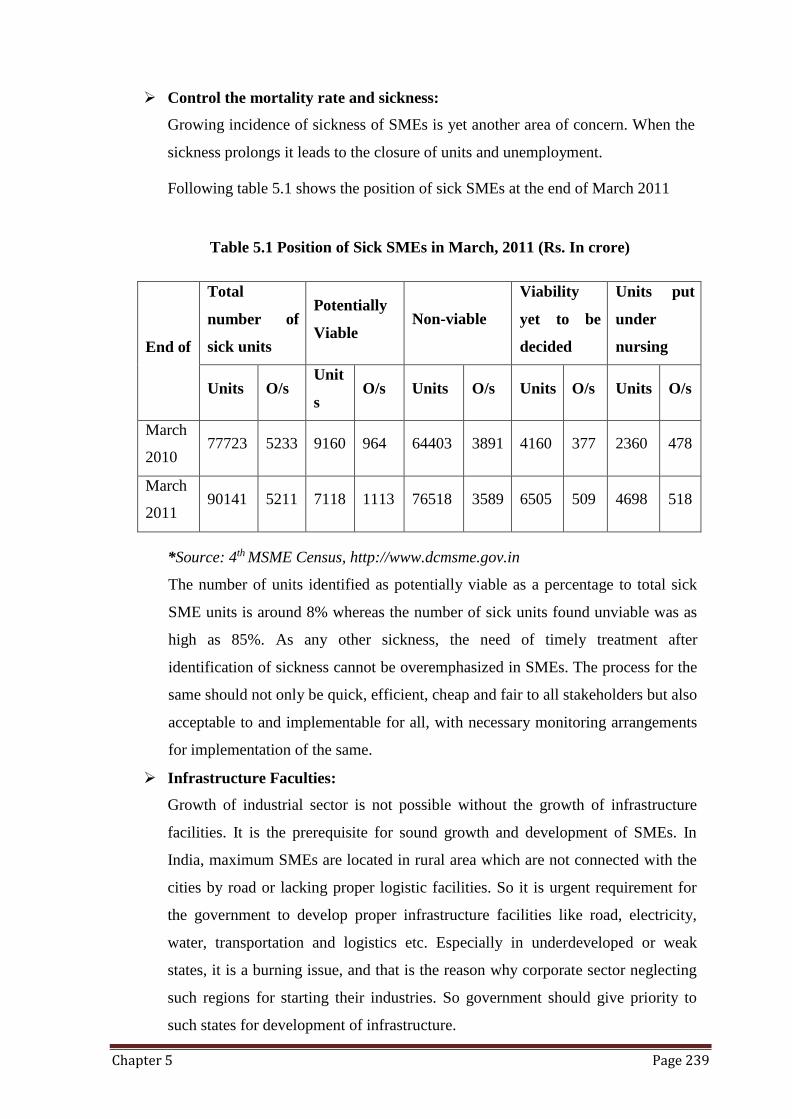
Chapter 5 Page 239
Control the mortality rate and sickness:
Growing incidence of sickness of SMEs is yet another area of concern. When the
sickness prolongs it leads to the closure of units and unemployment.
Following table 5.1 shows the position of sick SMEs at the end of March 2011
Table 5.1 Position of Sick SMEs in March, 2011 (Rs. In crore)
End of
Total
number of
sick units
Potentially
Viable
Non-viable
Viability
yet to be
decided
Units put
under
nursing
Units O/s Unit
s O/s Units O/s Units O/s Units O/s
March
2010 77723 5233 9160 964 64403 3891 4160 377 2360 478
March
2011 90141 5211 7118 1113 76518 3589 6505 509 4698 518
*Source: 4th MSME Census, http://www.dcmsme.gov.in
The number of units identified as potentially viable as a percentage to total sick
SME units is around 8% whereas the number of sick units found unviable was as
high as 85%. As any other sickness, the need of timely treatment after
identification of sickness cannot be overemphasized in SMEs. The process for the
same should not only be quick, efficient, cheap and fair to all stakeholders but also
acceptable to and implementable for all, with necessary monitoring arrangements
for implementation of the same.
Infrastructure Faculties:
Growth of industrial sector is not possible without the growth of infrastructure
facilities. It is the prerequisite for sound growth and development of SMEs. In
India, maximum SMEs are located in rural area which are not connected with the
cities by road or lacking proper logistic facilities. So it is urgent requirement for
the government to develop proper infrastructure facilities like road, electricity,
water, transportation and logistics etc. Especially in underdeveloped or weak
states, it is a burning issue, and that is the reason why corporate sector neglecting
such regions for starting their industries. So government should give priority to
such states for development of infrastructure.
Chapter 5 Page 240
Proper Exit Policy for SMEs:
With compare to other sector, the failure rate of SMEs, especially for first
generation entrepreneur is always high, because such enterprises are started on the
basis of newly innovated ideas or thoughts. Keeping this in view, most of the
countries have put in place mechanism to handle insolvencies and bankruptcies.
The present mechanism available in India for SMEs in archaic. Business failure in
India is viewed as stigma, which adversely impacts individual creativity and
development in the country. So there is a keen need to change in this system and
refined it.
7. Achievements with respect to the objectives:
–To know the problems faced by the marginal entrepreneurs: Here, the actual
problems of the marginal entrepreneurs are pondered upon. It is known that the
marginal entrepreneurs are facing critical problems at every stage of their business
that can be broadly categorized as marketing, production, human resources,
management and specially finance.
–To identify the sources of finance available to marginal entrepreneur: while
identifying the sources of finance to marginal entrepreneurs, it is known that the
marginal entrepreneurs are having mainly formal and informal sources of finances.
In informal sources, it includes, the private borrowings, own savings, finances from
friends and relatives etc. whereas, in, formal sources, it includes, the funding from
banks, institutions etc.
–To assess the impact of the schemes / programs offered to marginal entrepreneurs
by bank: Among the various sources available to the marginal entrepreneurs,
finances from the banks considered as one of the formal sources. Here, in this study
there was an aim to assess the impact of the bank finance to the marginal
entrepreneurs as the available informal sources are risky and almost charging higher
rate of interest on private borrowing. So for marginal entrepreneurs, it is very much
necessary that banks finances be adequately available in right time. And it is known
that if bank finances are readily available to the marginal entrepreneurs in required
quantity in right time then the potential of the marginal entrepreneurs can be
leveraged.
Chapter 5 Page 241
Thus, bank finances have the positive impact on the productivity and performances
of the marginal entrepreneurs.
–To identify major issues in bank financing - from demand side constraints and
supply side constraints: As bank finances are an important source of finance to the
marginal entrepreneurs, so the availability of finances has to be made by the formal
sources of finance i.e. by banks. For banks, it is also an important and crucial
decision to finance marginal entrepreneurs as their status for the repayment remains
questionable and risky. And banks already have huge burden of NPAs to deal with.
In such condition, it becomes tough for banks to finance without proper and
adequate guarantees, while marginal entrepreneurs are sometimes unable to provide
the same as per the norms of the bank. Proper documentations, filing of the returns
etc. are necessary while releasing the finances but in case of marginal entrepreneurs,
it becomes difficult to produce as per the requirement. So, there are certain major
issues from the bank side i.e. supply side too to be considered while financing to the
marginal entrepreneurs.
–To analyze responses sought from entrepreneurs and bank officials in regard to the
problems being faced and related issues in bank finance and ascertain viability of
measures suggested by them to overcome from the constraints: to release the finance
to the marginal entrepreneurs, it takes policies and people involvement. The policies
are there to show the requirements to be filled up by the marginal entrepreneurs. It
shows the necessary documentations to be made, procedures to be followed, and
guarantees to be taken in the process of making finances available to the marginal
entrepreneurs. People are involved in the process of sanctioning and releasing the
finances to the marginal involvement. Here, the knowledge, services and behavior of
the staff involved in the process play vital role as they directly deal with the end user
of the banking services provided by the banks. The responses from the bank officials
were mixed. Highly dedicated and committed bank officials were there and the same
time the opposite kind of people also found. They have provided essential responses
in the form of suggestions from their side on the basis of their work experience that
was found crucial.
This research undertakes the analytical study of availability of bank finance to
entrepreneurs from selected banks. In the study, it has been found that MSMEs are
Chapter 5 Page 242
considered as the backbone of the economy, and that is the reason, responsibility of banks
increases. This is the right time when banks have to view themselves not just as providers
of credit but as partners in the growth of these enterprises, especially for first generation
entrepreneurs. All commercial banks need to ensure greater participation in the affairs of
their SME clients by convergence of credit services and non-credit services. But for this
bank staff also should be trained for customized training programs to meet the specific
needs of SMEs such as knowledge of markets, both domestic and global, use of
technology, etc. Banks also need to create products specifically suited to the requirements
of SMES and should take a longer term view of its relationship with such entities while
pricing such products. Thus, if India were to have a growth rate of 8 – 10% for the next
couple of decades, it needs a strong SME sector. SMEs themselves have to be on their toes,
in this rapidly changing environment, and keep evolving to stay clear of all the potential
pitfalls that confront them in their progress from SME to large corporations.
To Conclude:
– Entrepreneurs are the integral part of the economy
– Banks have to view themselves not just as providers of credit but as partners in the growth
of these enterprises.
– Banks also need to create products specifically suited to the requirements of marginal
entrepreneurs and should take a longer term view of its relationship with such entities while
pricing such products.
– Whereas the entrepreneurs have to increase their competitiveness and awareness regarding
the schemes designed by the Government and offered by the banks.
With the above findings and conclusions, expressing them both in the light of limitations
and scope of the study, the present study would like to rest its thoughts with a positive
hope of touching the untapped aspects in the present study in form of future continuous
research. Ending a thesis is not the end of research, but actually a beginning for
forthcoming researches.
Chapter 6 Page 246
References:
Swami Vivekananda ―Entrepreneurship on Focus
Scribd, History of entrepreneurship, entrepreneurship and SME Management.
Ozgurzan, ―Peter Drucker on Entrepreneurship
The economist, Indian Entrepreneurs: 10 Greatest Businessman from History
C.K.Prahlad, Entrepreneurs to Explore domestic opportunities,2008.
Daniel Priestley, “The Future Of Entrepreneurship”
Banerjee, A., Cole, S., and Duflo, E. (2003). Bank financing in India. Mimeo: MIT.
Carbo, S., Rodrı ́guez, F., and Udell, G. (2008). Bank lending, financing constraints and SME
investment.
Haselmann, R., and Wachtel, P. 2007. Institutions and bank behavior, NYU Stern Economics
Working Paper No. 06e16.
Morris, S., Basant, R., Das, K., Ramachandran, K., and Koshy, A. (2001). The growth and
transformation of small firms in India. New Delhi: Oxford University Press.
Petersen, M. A., and Rajan, R. G. (2002). Does distance still matter? The information
revolution in small business lending. Journal of Finance, 57, 2533e2570.
Entrepreneurial Development by S.S.Khanka
Cohoon, J. McGrath, Wadhwa, Vivek & Mitchell Lesa, (2010), The Anatomy of an
Entrepreneur- Are Successful Entrepreneurs Different from Men Kauffman, The foundation
of entrepreneurship.
Deshpande S, Sethi S.(2009) ,Women Entrepreneurship In India (Problems, Solutions &
Future Prospects of Development),Shodh, Samiksha and Mulyankan,International Research
Journal, Vol-2 ,issue-9-10
Dilip kumar, M. (2006), Problems of Entrepreneurs in India. Retrieved 3 December 2010.
Hisrich, R. (1986) The Woman Entrepreneur: Characteristics, Skills, Problems, and
Prescriptions for Success. In Sexton, D. and Smilor, R, ed, The Art and Science
Entrepreneurship, Cambridge.
Chapter 6 Page 247
Hisrich, R.D. & Peters, M.P. (1989) Entrepreneurship, Starting, Developing and Managing a
New Enterprise. Richard D. Irwin, Boston.
Kothari. C.R., Research Methodology (2004) - Methods & Techniques, New Delhi, New Age
International (P) Ltd., publishers, second edition,16
Poornima M.charantimath (2006) Entrepreneurship Development and Small Business
Enterprise, Person Education of India.
Shahidi, A.Smagulova The challenges of entrepreneurship in dynamic society 1 (1) 34-45
S. Varghese Antony Jesurajan & Dr. M. Edwin Gnanadhas (2011), Study on the factors
motivating women to become entrepreneurs in Tirunelveli district, Asian Journal of Business
and Economics, Vol.1, No.1.pp. 2231-3699.
Sivasankar.P.R, Ekambaram. K (2005), “Role of public sector Banks in the development of
small scale sector in India”, Journal of Banking finance, vol. 30, pp.3-5.
Basakar. A (2006), Survey of India’s small and medium enterprises’, Business Today,
September 10, p.15.
Parimalam. M (2006), “Commercial Banks performance towards SSI sectors in Erode
District”, M.Phil dissertation, Periyar University, p.108.
Prasain.G.P, Nixon singh.E.N, Sharat Singh. N (2006), ‘Financing Pattern of Small scale
Industries’, The Indian Journal of Commerce, Vol. 59, No.4,p.123.
Rajan Kumar, Subhashchander (2005), “Financing of fixed assets in Small scale industries”,
Journal of Accounting and Finance, Vol 19: No.1, pp.186-188.
Ram Chandra Rao.K.S, Abhiman Das, aravidn Kumar Singh. (2006), “Commercial bank
lending to Small scale Industry”, Economic and Political weekly, March 18, p.368.
Ruddar Datt and Sundharam. K.P.M (2002), Indian Economy, ‘Policies and Programmes to
remove Disabilities’, S. Chand and Company Limited, New Delhi, p.362.
Sindhu Vijayakumar (2007), “Sources of finance for small scale units”, Facts for you, p.28.
Thingalaya.N.K (2006), “Who is financing the SME segment” Industrial economist, 15-29
January, p.24.
Chapter 6 Page 248
Edward I. Altman, Gabriele Sabato, Effects of the new basel capital accord on bank capital
requirement for SMEs, Journal of Financial Services Research, 28 (2005)
Banerjee et al., 2003, A. Banerjee, S. Cole, E. Duflo, Bank financing in India
Banerjee, E. Duflo, What do banks (not) do? Berger, G. Udell, A more complete conceptual
framework for SME finance, Journal of Banking & Finance,
S. Carbo, F. Rodríguez, G. Udell, Bank lending, financing constraints and SME investment
K. Das, SMEs in India: issues and possibilities in times of globalization
Banerjee, A., Cole, S., and Duflo, E. (2003). Bank financing in India. Mimeo: MIT.
Carbo, S., Rodrı´guez, F., and Udell, G. (2008). Bank lending, financing constraints and SME
investment. Federal Reserve Bank of Chicago, WP 2008e2004.
Haselmann, R., and Wachtel, P. 2007. Institutions and bank behavior, NYU Stern Economics
Working Paper No. 06e16.
Morris, S., Basant, R., Das, K., Ramachandran, K., and Koshy, A. (2001). The growth and
transformation of small firms in India. New Delhi: Oxford University Press.
MSME Definition taken from the below mentioned
weblinkhttp://www.dcmsme.gov.in/ssiindia/defination_msme.htm
Petersen, M. A., and Rajan, R. G. (2002). Does distance still matter? The information
revolution in small business lending. Journal of Finance, 57, 2533e2570.
Credit Flow of SMEs in India: A Study Conducted at Bank of Baroda by Samta Chaudhary
and Shweta Ahalawat published in IRACST – International Journal of Commerce, Business
and Management (IJCBM),ISSN: 2319–2828 Vol. 3, No. 3, June 2014
DR.P.Uma:Role of SMEs in Economic Development of India: Asia Pacific Journal of
Marketing & Management Review ISSN 2319-2836 Vol.2 (6), June (2013)
Mali, D.D. (1998), ‘Development of Micro, Small and Medium Enterprises of India: Current
Scenario and Challenges’, SEDME (Small Enterprises Development, Management and
Extension) Journal, Vol.25, No.4.
Bala Subrahmanya, M. H. (2004), ‘Small Industry and Globalization: Implications,
Performance
Chapter 6 Page 249
and Prospects’, Economic and Political Weekly, Volume XXXIX, No.18, pp 1826-1834.
Bargal, H., Dashmishra, M., and Sharma, A. (2009), ‘Performance Analysis of Small Scale
Industries - A Study of Pre-liberalization and Post-liberalization period’, International Journal
of Business and Management, Vol 1, No 2.
Dixit, A. and Pandey, A.K. (2011), ‘SMEs and Economic Growth in India: Cointegration
Analysis’, The IUPJournal of Financial Economics, Vol. IX, No. 2, PP. 41-59
Singh, R., Verma, O.P., and Anjum, B. (2012), ‘Small Scale Industry: An Engine of Growth’,
Zenith International Journal of Business Economics & Management Research, Vol.2 Issue 5.
Online available at http://www.zenithresearch.org.in
Venkatesh, S. and Muthiah, K. (2012), ‘SMEs in India: Importance and Contribution’, Asian
Journal of Management Research, Vol. 2, No. 2.
Lubina Zaidi, Problems affecting the growth of small and Medium Enterprises (SMEs) in
India, International Conference on Technology and Business Management March 18-20,
2013, pp.413-422
Raju, Dr. B. Yerram and Nataraj, P.R. Mohan (2008): Small and Medium Enterprises in India
(Indian Institute of Banking and Finance) Small medium business development chamber of
India Annual Report on MSME, Government of India, 2011-12 & 2012-13.
Gupta, R.N., (2012). Role of Industrial Associations in Development of the MSME Sector in
Thane.
Shihabudheen, N. (2013). Role MSME Act 2006 in Promoting SSIs in Malappuram: An
empirical study of Manjeri Municipality, Kerala, India, International Research Journal of
Social Sciences, ISSN 2319–356 2(9),11-18, September.
Suresh, P., & Dr. Mohideen M. Akbar. (2012). Small Medium Enterprises in IndiaIssues and
Prospects. (February), 2, Issue 2. Article No-4/247-255. ISSN: 2249-7196.
Kumar, N.B.K., &Dr.Gugloth.S.(2012). Financial Management in MSMEs in India. IJEMR,
(September), 2, Issue 9, ISSN 2249–2585 - Print - ISSN 2249-8672.
Chapter 6 Page 250
List of Publications:
1. Ms. Jahnavi K. Dubal, (2015), Financing of SME firms in India, Indian Journal of
Research – Paripex, ISSN No: 2250-1991, Impact factor: 3.4163
2. Ms. Jahnavi K. Dubal, (2015), A Pivotal Role of SMEs in India, Global Journal for
Research Analysis – International – ISSN No: 2277-8160, Impact Factor: 3.1218
3. Ms. Jahnavi K. Dubal, (2015), MSMEs in India: Issues and Challenges – The Way Ahead,
Academic Discovery Review – The Refereed International Journal, ISSN – 2395-3136
4. Prof. Jahnavi K. Dubal, (2015), Trafficking in persons as a human rights issue, Journal of
Indian legal Philosophy and Social Changes, ISSN: 2319-3816
5. Jahnavi K. Dubal, (2013), Corporate Governance in banks, Sankalpa: Jpurnal of
Management & Research, ISSN No. 2231-1904


![A Critical Evaluation of Random Copolymer Mimesis of ...wonglab.seas.ucla.edu/pdf/2013 Macromolecules [Hu, Yang] A Critical... · A Critical Evaluation of Random Copolymer Mimesis](https://img.pdfslide.us/doc/110x75/5c69db2009d3f25e418b8bb8/a-critical-evaluation-of-random-copolymer-mimesis-of-macromolecules-hu-yang.jpg)