Embed Size (px)
Citation preview
Critical Care Canada ForumToronto
October 31, 2016
Setting Tidal Volumes in ARDS
PBW, DeltaP, or Pes?
Roy Brower, MD
Johns Hopkins University
Case Presentation
• 27 year old M with alcoholic hepatitis and pneumonia
• Height 193 cm (6’4”). Predicted Body Wt = 87 kg
• 6 ml/kg = 520 mL PEEP = 10.
Pplat = 34
Driving Pressure (Pplat – PEEP, ΔP) = 24
Case Presentation
• 27 year old M with alcoholic hepatitis and pneumonia
• Height 193 cm (6’4”). Predicted Body Wt = 87 kg
• 6 ml/kg = 520 mL. PEEP = 10. Pplat = 34. ΔP = 24
• Chest volumes not large
• PaCO2 = 36, pH = 7.38
Case Presentation
• 27 year old M with alcoholic hepatitis and pneumonia
• Height 193 cm (6’4”). Predicted Body Wt = 87 kg
• 6 ml/kg = 520 mL. PEEP = 10
– Pplat = 34. Driving Pressure (ΔP) = 24
• Chest volumes not large
• PaCO2 = 36, pH = 7.38
• Tidal volume decreased to 5, 4 mL/kg PBW
– Pplat = 28, Driving Pressure (ΔP) = 18
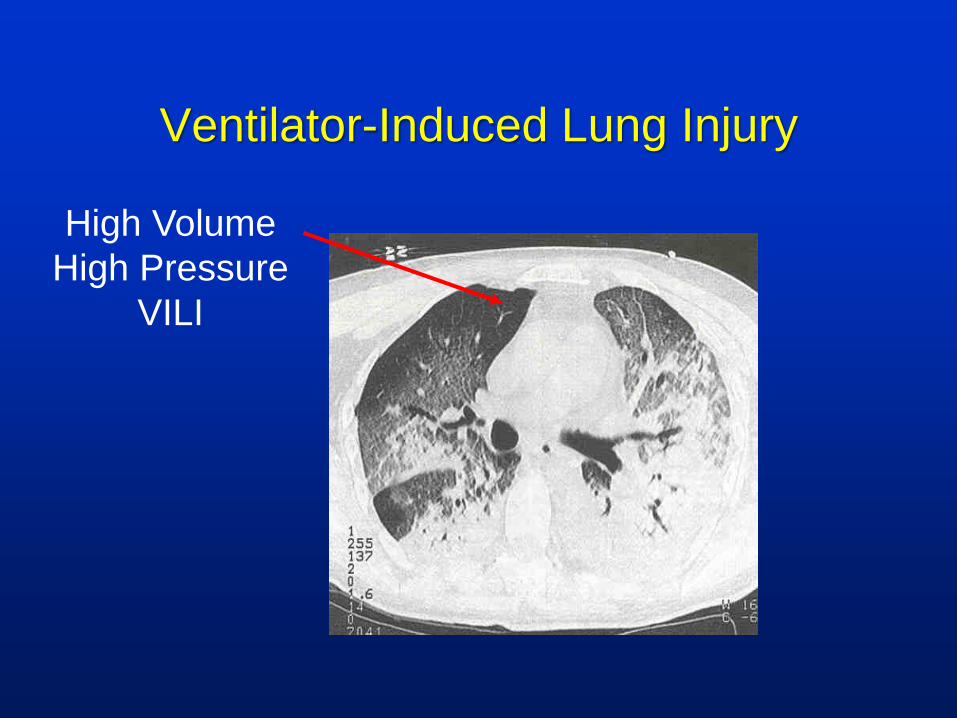
Ventilator-Induced Lung Injury
High Volume
High Pressure
VILI
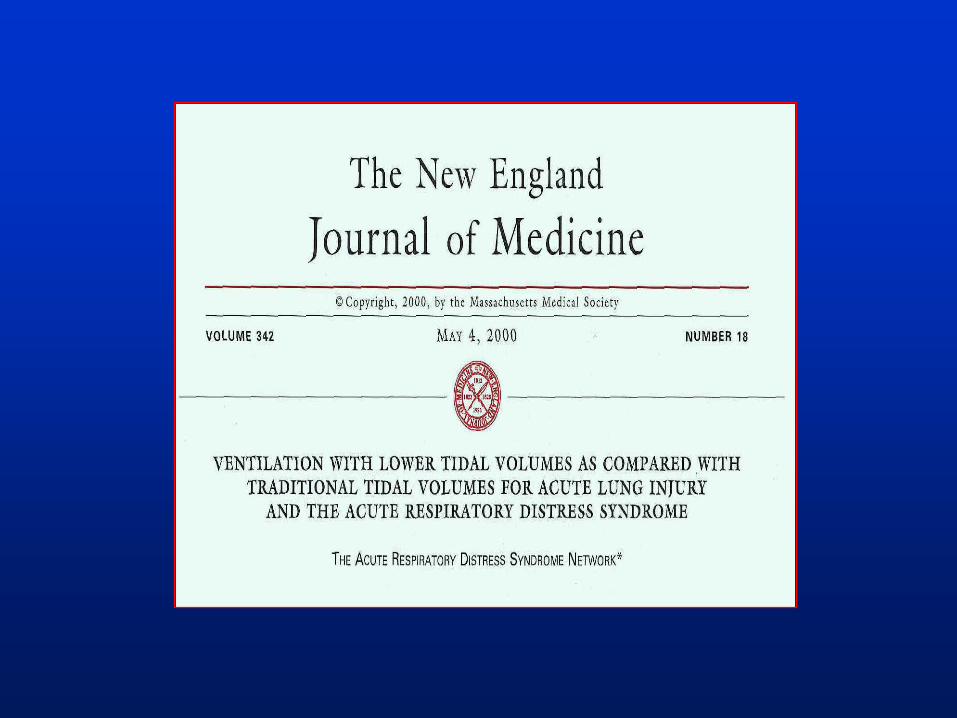
VT Recommendation
NIH ARDS Network
VT Goal = 6 mL/kg Predicted Body Weight
PBW based on gender, height
Intended as a guide to lung size
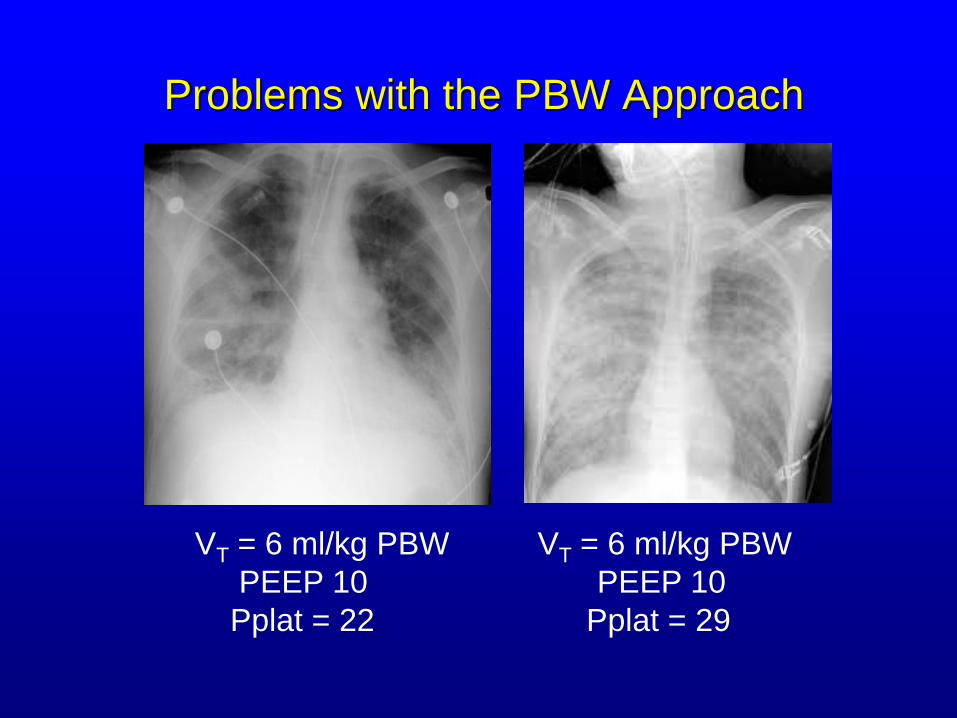
Problems with the PBW Approach
VT = 6 ml/kg PBW VT = 6 ml/kg PBW
PEEP 10 PEEP 10
Pplat = 22 Pplat = 29
Clinical Recommendation
VT Goal = 6 mL/kg PBW
If Pplat > 30 cm H2O,
decrease VT to 5 or 4 mL/kg PBW.
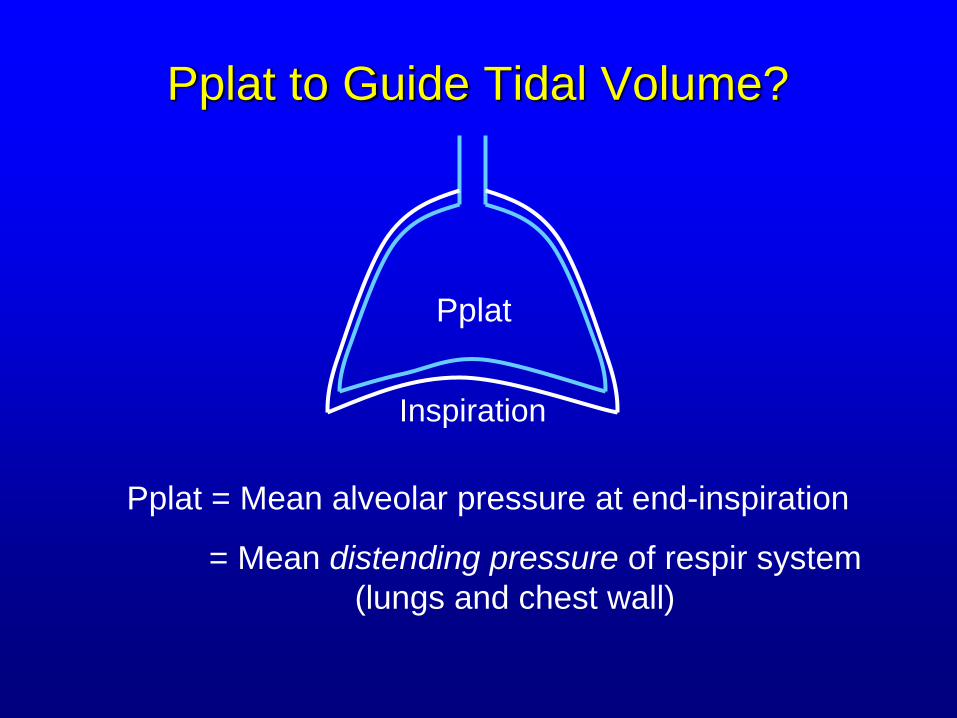
Pplat to Guide Tidal Volume?
Pplat = Mean alveolar pressure at end-inspiration
= Mean distending pressure of respir system
(lungs and chest wall)
Inspiration
Pplat
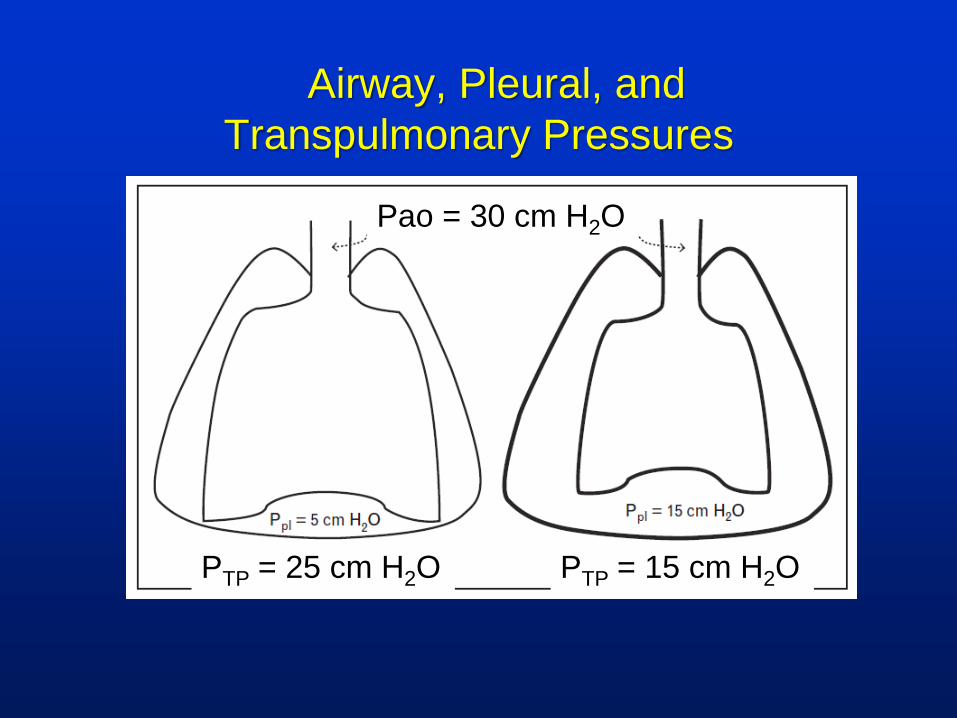
Airway, Pleural, and
Transpulmonary Pressures
Pao = 30 cm H2O
PTP = 25 cm H2O PTP = 15 cm H2O
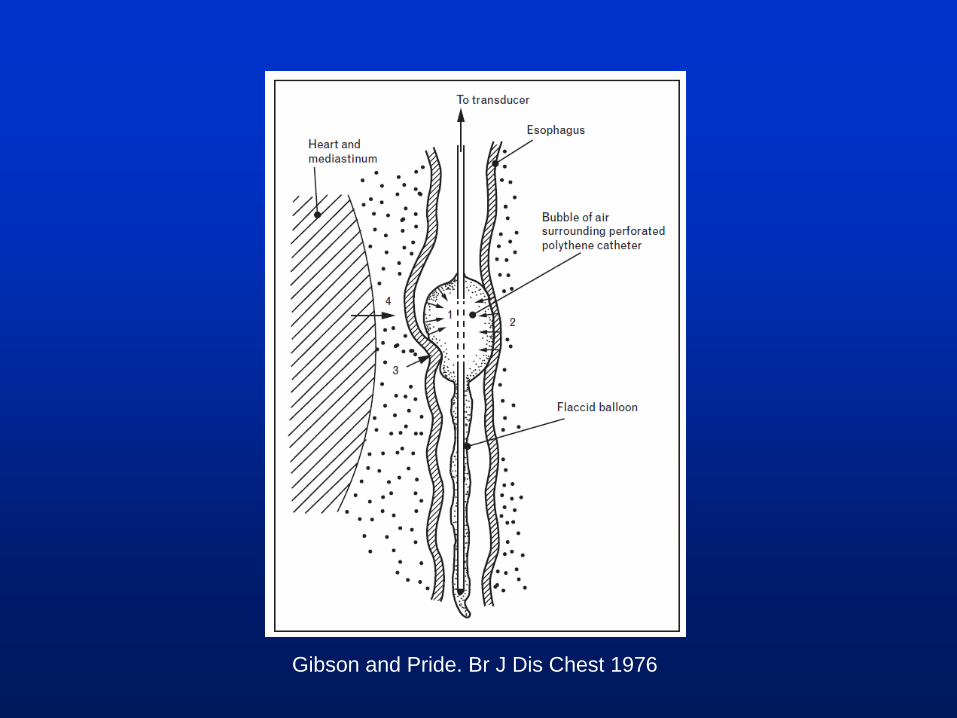
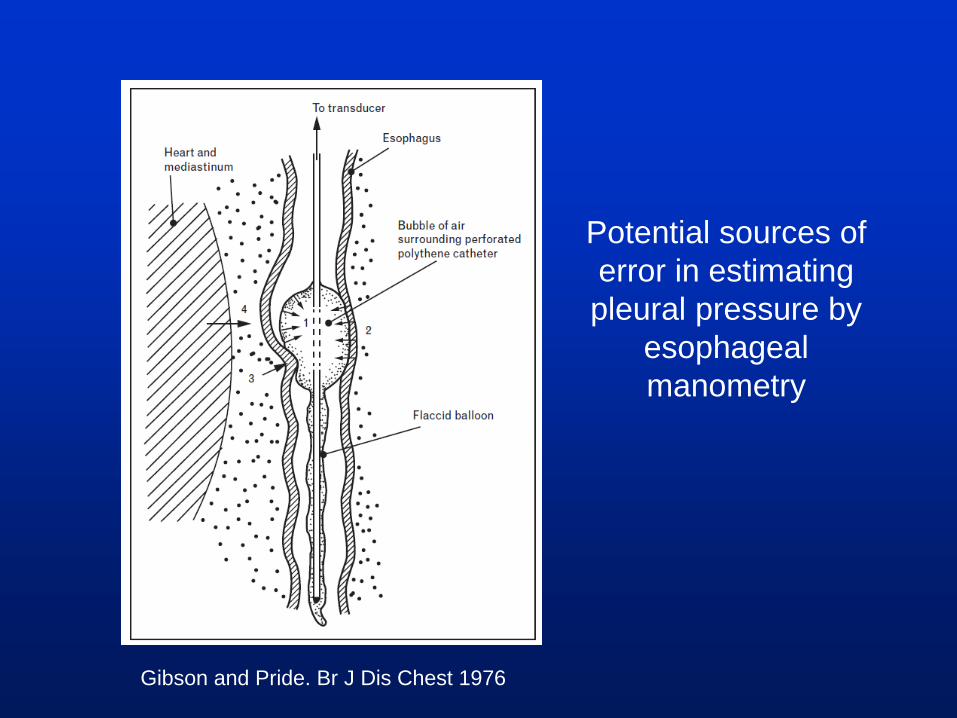
Gibson and Pride. Br J Dis Chest 1976
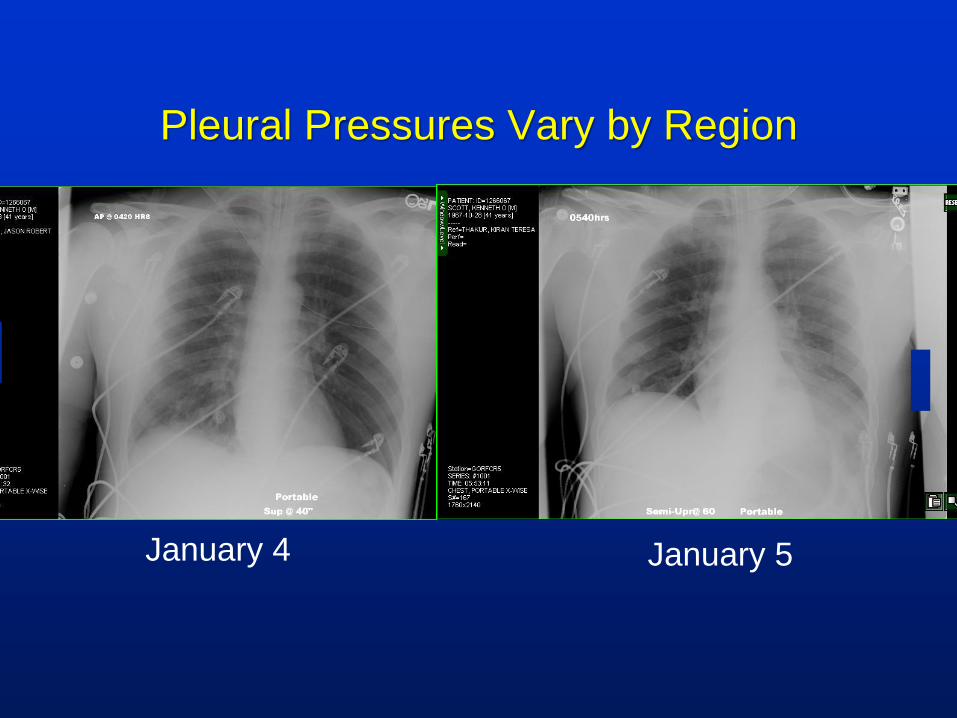
Pleural Pressures Vary by Region
January 4 January 5
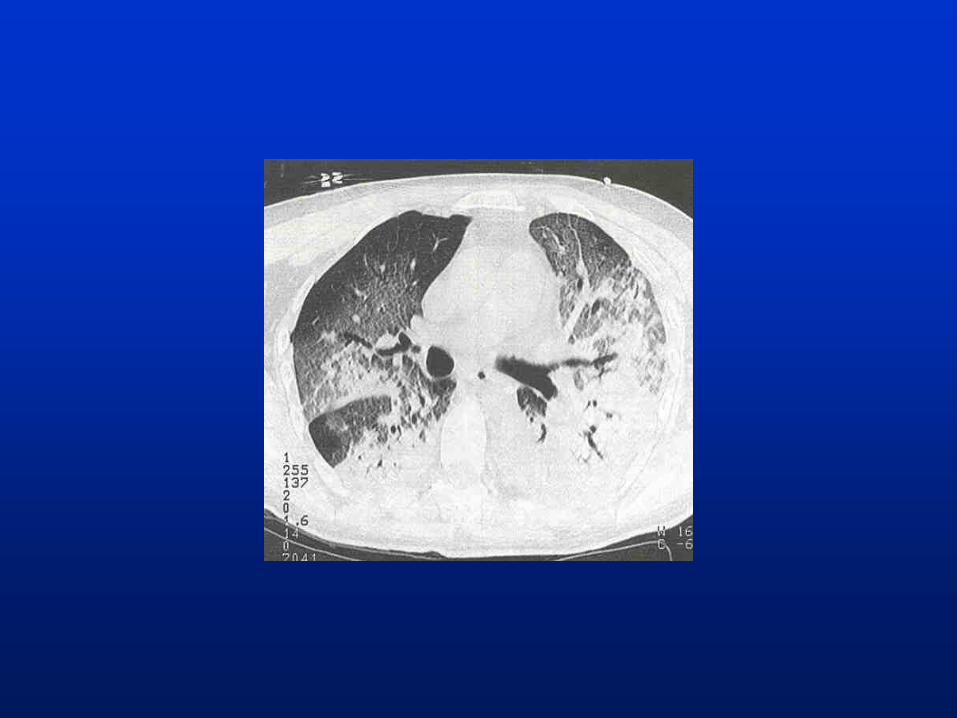
Gibson and Pride. Br J Dis Chest 1976
Potential sources of
error in estimating
pleural pressure by
esophageal
manometry
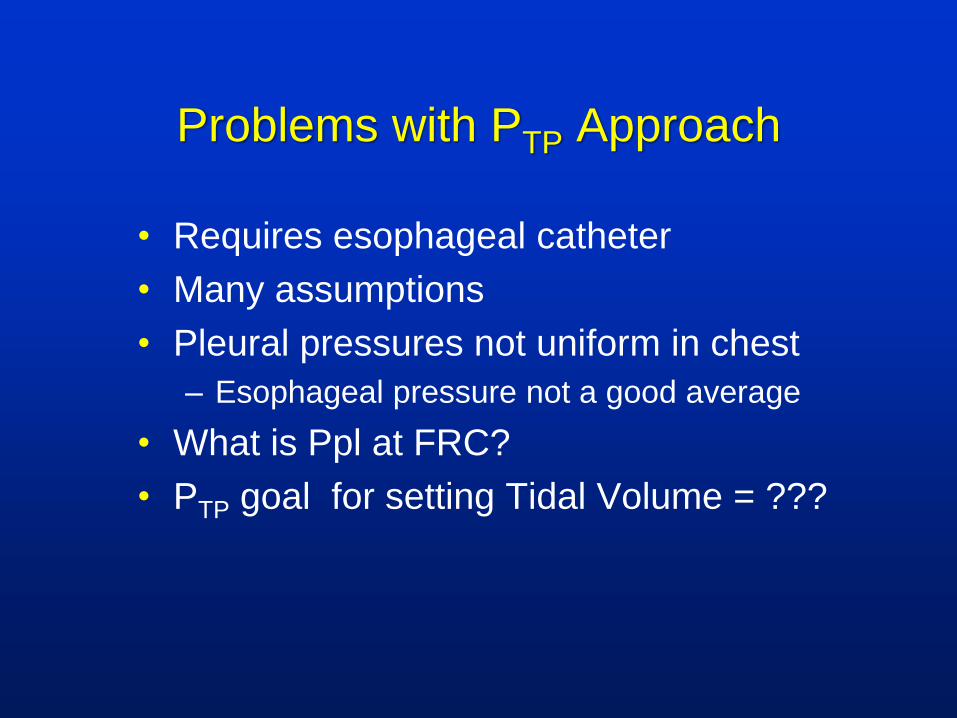
Problems with PTP Approach
• Requires esophageal catheter
• Many assumptions
• Pleural pressures not uniform in chest
– Esophageal pressure not a good average
• What is Ppl at FRC?
• PTP goal for setting Tidal Volume = ???
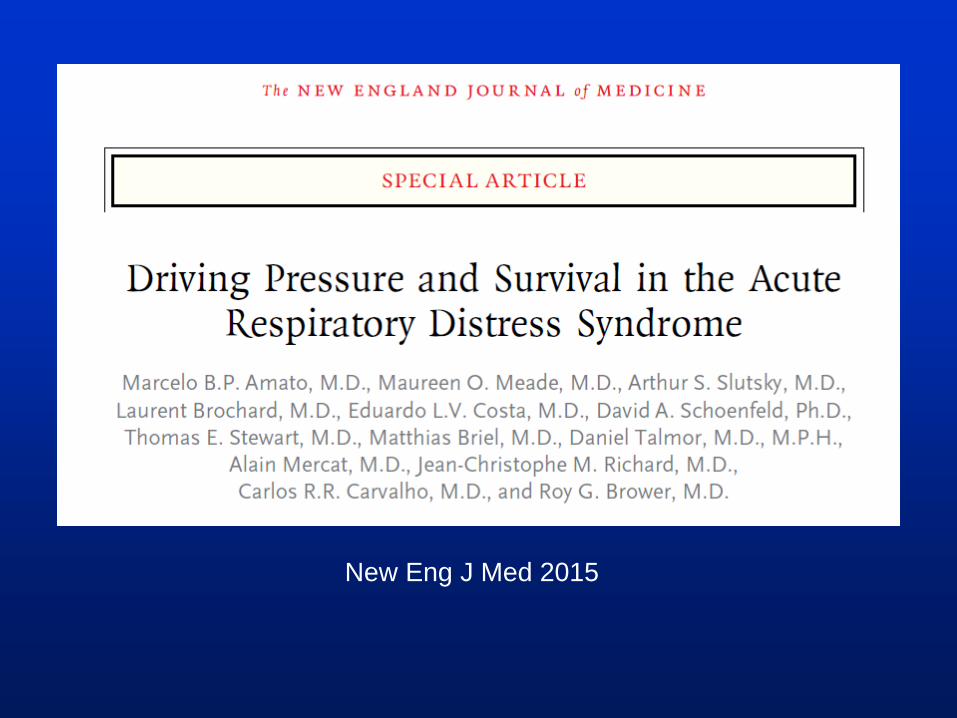
New Eng J Med 2015
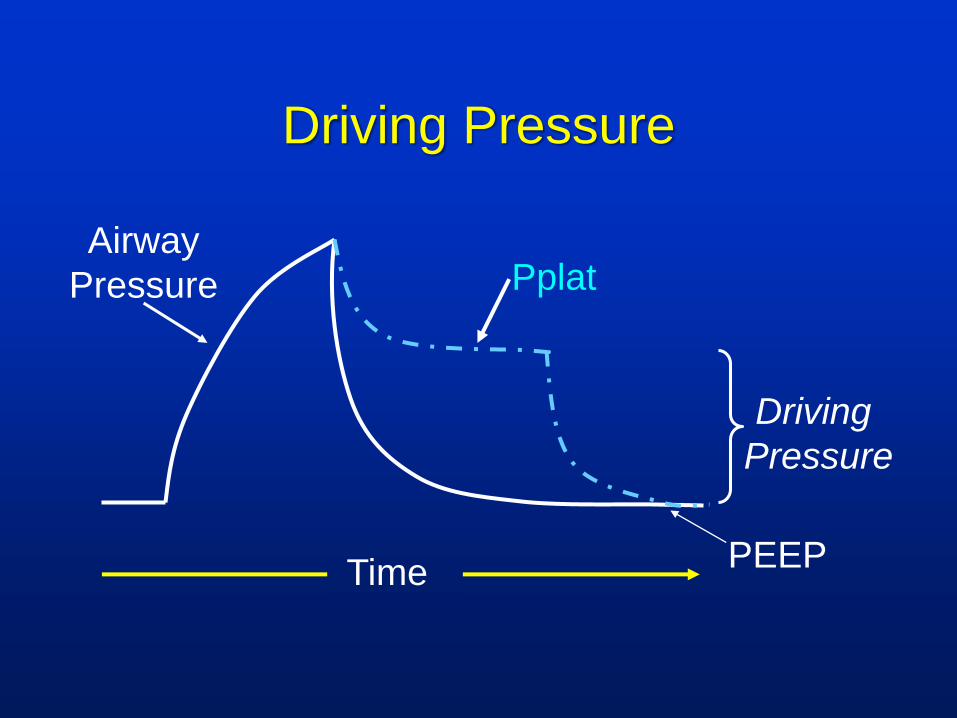
Driving Pressure
PEEP
Pplat
Time
Driving
Pressure
Airway
Pressure
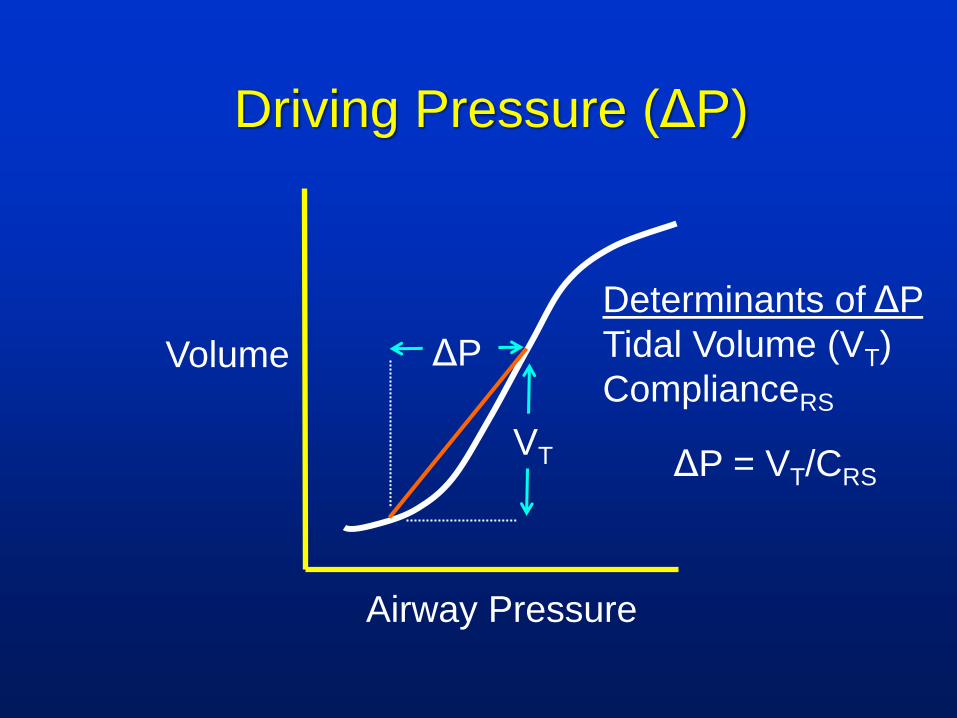
Driving Pressure (ΔP)
Volume
Airway Pressure
ΔP
Determinants of ΔP
Tidal Volume (VT)
ComplianceRS
ΔP = VT/CRS
VT
Driving-pressure (cmH2O)
Mo
rtal
ity-
Ris
k
(ad
just
ed*)
Figure 2b: Combined sample of patients with ARDS
*: adjusted according to Model-1
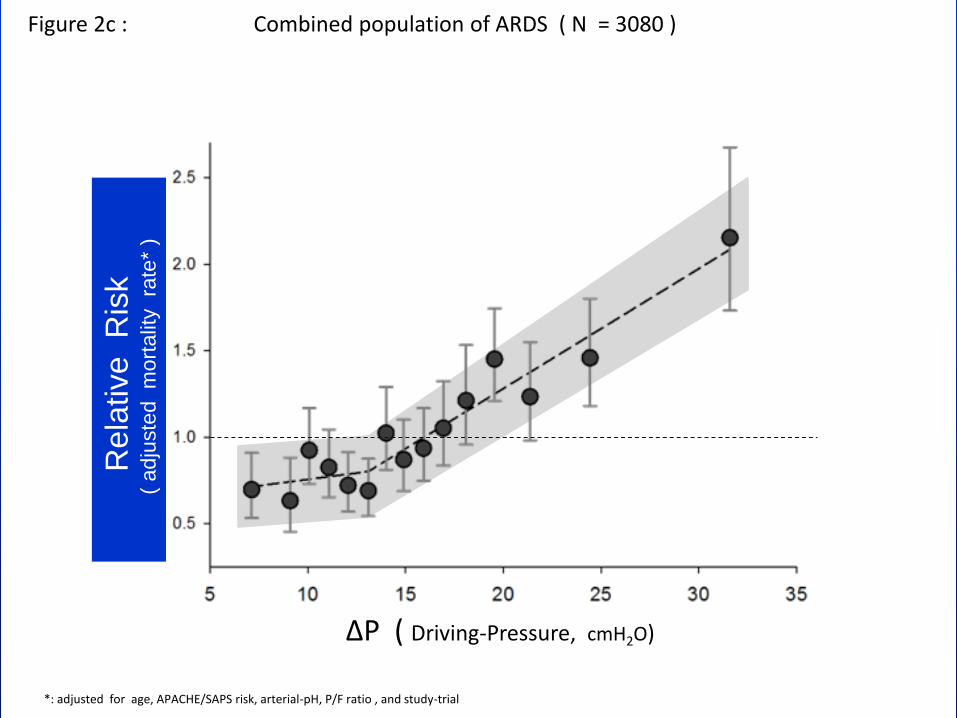
Figure 2c:
∆P ( Driving-Pressure, cmH2O)
Figure 2c : Combined population of ARDS ( N = 3080 )
*: adjusted for age, APACHE/SAPS risk, arterial-pH, P/F ratio , and study-trial
Rela
tive
Ris
k
( a
dju
ste
d
mo
rta
lity
rate
* )
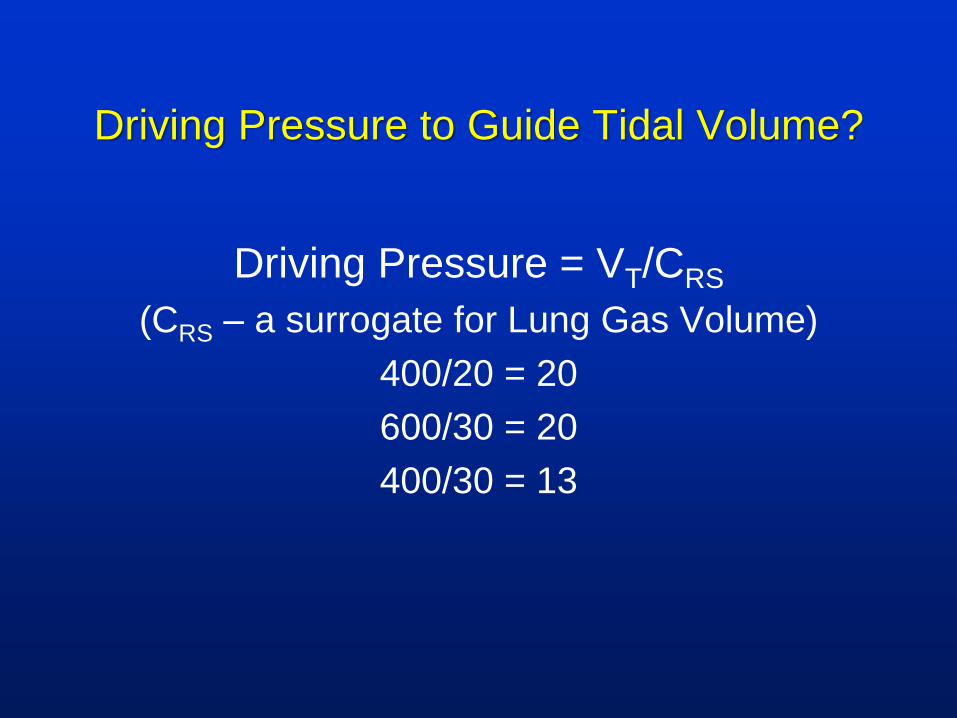
Driving Pressure to Guide Tidal Volume?
Driving Pressure = VT/CRS
(CRS – a surrogate for Lung Gas Volume)
400/20 = 20
600/30 = 20
400/30 = 13
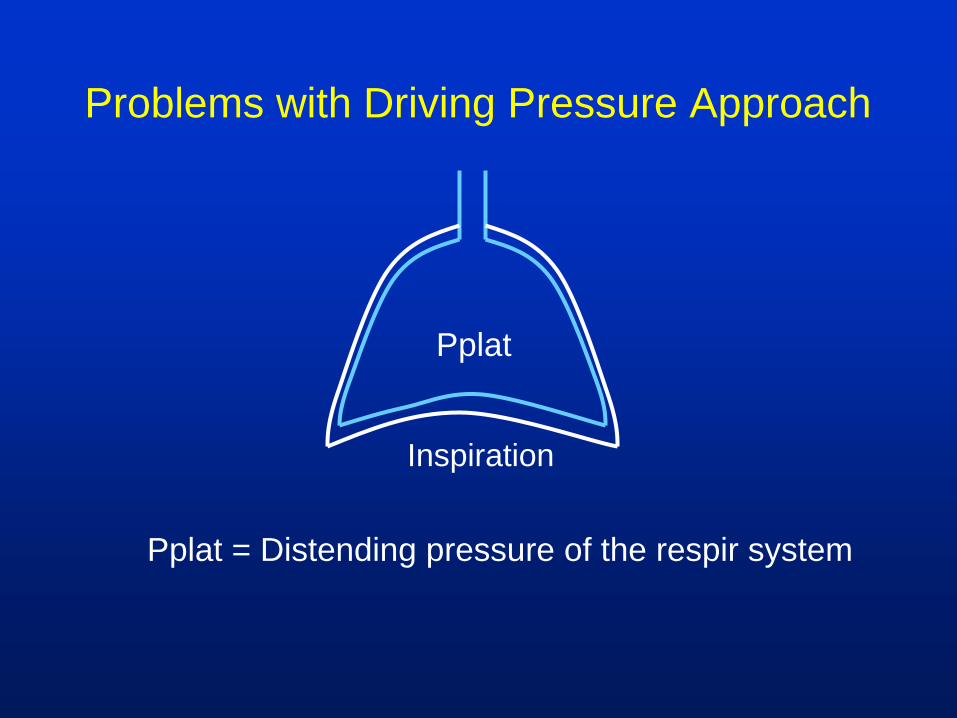
Problems with Driving Pressure Approach
Pplat = Distending pressure of the respir system
Inspiration
Pplat
Case Presentation
• 27 year old M with alcoholic hepatitis and pneumonia
• Height 193 cm (6’4”). Predicted Body Wt = 87 kg
• 6 ml/kg = 520 mL. PEEP = 10
– Pplat = 34. ΔP = 24
• Chest volumes not large
• PaCO2 = 36, pH = 7.38
• Tidal volume decreased to 5, 4 mL/kg PBW
– Pplat = 28, ΔP = 18
• PaCO2 = 44, pH = 7.33
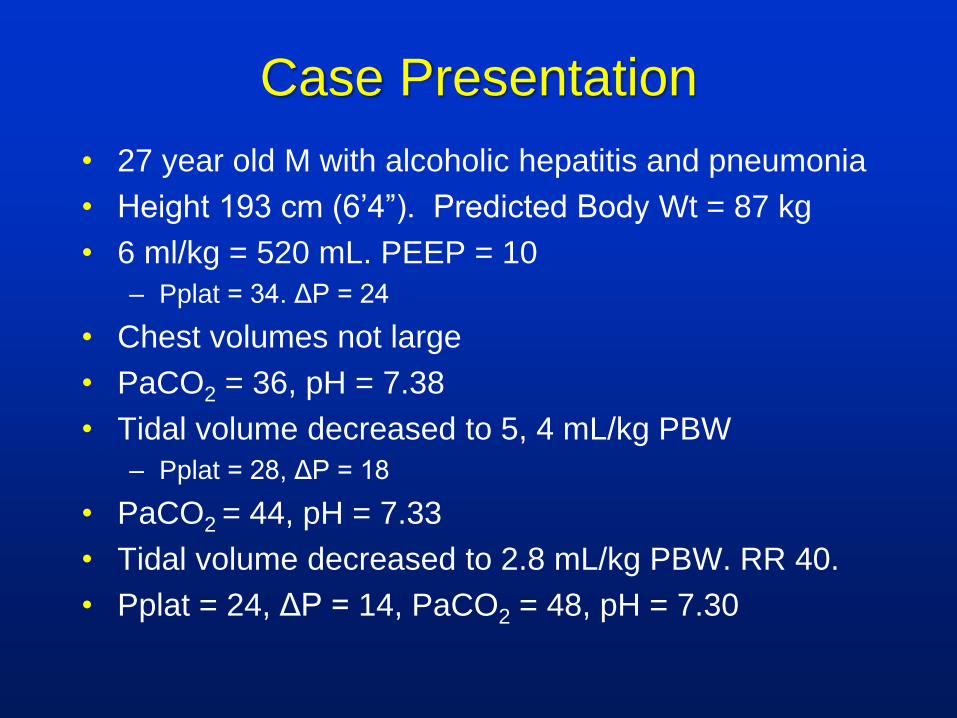
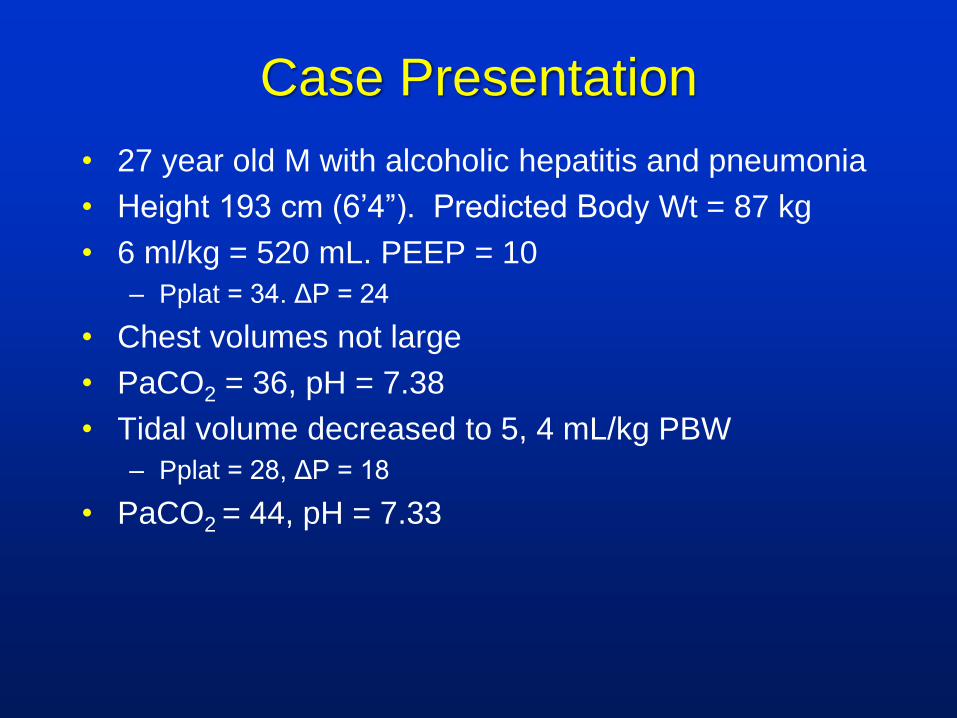
• Tidal volume decreased to 2.8 mL/kg PBW. RR 40.
• Pplat = 24, ΔP = 14, PaCO2 = 48, pH = 7.30
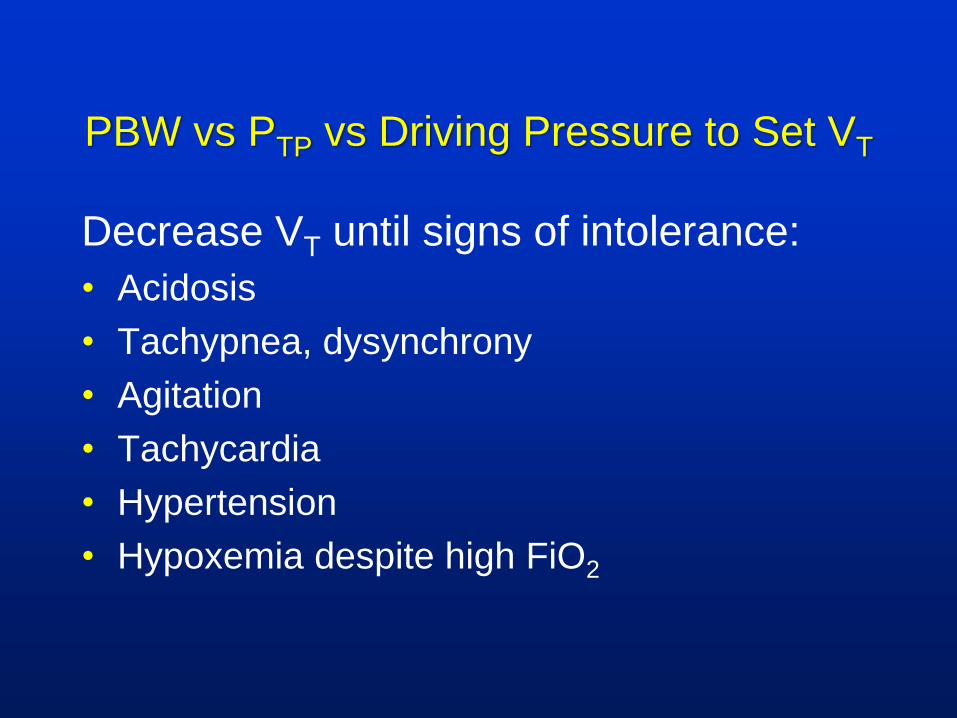
PBW vs PTP vs Driving Pressure to Set VT
Decrease VT until signs of intolerance:
• Acidosis
• Tachypnea, dysynchrony
• Agitation
• Tachycardia
• Hypertension
• Hypoxemia despite high FiO2
Merci