Embed Size (px)
Citation preview

CHAPTER 4 Criterion III: Maintenance of Rangeland Productive Capacity
G.R. Evans,1 R.A. Washington-Allen,2 R.D Child,3 J.E. Mitchell,4 B.R. Bobowski,5 R.V. Loper,6 B.H. Allen-Diaz,7 D.W. Thompson,8 G.R. Welling,9 and T.B. Reuwsaat10
Keywords: sustainable management, phytomass, livestock, wildlife, non-forage products, Sustainable Rangelands Roundtable
Abstract: Maintenance of rangeland productive capacity is one of five criteria established by the Sustainable Rangelands Roundtable (SRR) to monitor and assess rangeland sustainable manage-ment. Within this criterion, six indicators were developed through the Delphi Process and the expert opinions of academicians, rangeland scientists, rangeland management agency personnel, non-governmental organization representatives, and other interested stakeholders. The indicators are standing aboveground biomass; annual net primary productivity; percent of suitable range-land grazed by livestock; number of livestock on rangeland; presence and densities of wildlife functional groups on rangeland; and annual removal of native hay and non-forage plant materi-als, landscaping materials, edible and medicinal plants, and wood products from rangeland. A rationale for these six indicators is made.
Authors are 1Director (retired), Natural Resource Distance Learning Consortium, Northern Virginia Campus, Virginia Tech, Alexandria, VA, 22314, USA; 2Assistant Professor, Dept of Ecosystem Science and Management, Texas A&M University, College Station, TX, 77843-2138, USA; 3Professor (deceased), College of Natural Resources, Colorado State University, Fort Collins, CO, 80523, USA; 4Rangeland Scientist Emeritus, Rocky Mountain Research Station, USDA Forest Service, Fort Collins, CO, 80526, USA; 6Resource Manager, USDI National Park Service, Grant-Kohrs Ranch National Historic Site, Deer Lodge, MT, 59722, USA (presently stationed at Rocky Mountain National Park, CO, USA); 7Rangeland Consultant, Wyoming State Grazing Board, Lander, WY, 82520, USA; 8Associate Dean for Research, University of California, Berkeley, CA, 94720, USA; 9National Grazing Lands Ecologist, USDA Natural Resources Conservation Service, Washington, DC, 20250, USA; 5Research Support Manager, Ridley Block Operations, Vaughn, MT, 59487, USA; and 10District Manager (retired), USDI Bureau of Land Management, Medford, OR, 97504, USA.
Research was funded in part by USDA Forest Service, Natural Resources Conservation Service, and Agricultural Research Service; USDI Bureau of Land Management and U.S. Geological Survey; Colorado State University.
Correspondence: Dr. Gary Evans, 47503 Coldspring Place, Potomac Falls, VA, 20165; email: [email protected].
139
140
Chapter Four | Criterion 3: Maintenance of Rangeland Productive Capacity
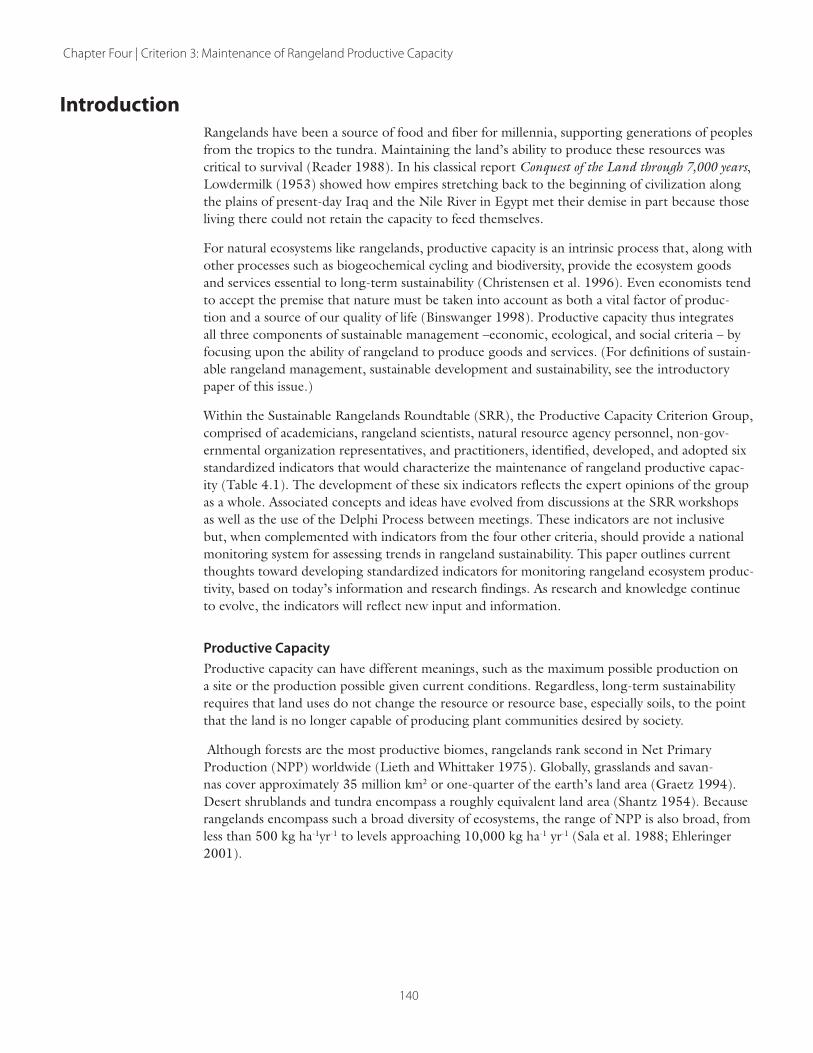
IntroductionRangelands have been a source of food and fiber for millennia, supporting generations of peoples from the tropics to the tundra. Maintaining the land’s ability to produce these resources was critical to survival (Reader 1988). In his classical report Conquest of the Land through 7,000 years, Lowdermilk (1953) showed how empires stretching back to the beginning of civilization along the plains of present-day Iraq and the Nile River in Egypt met their demise in part because those living there could not retain the capacity to feed themselves.
For natural ecosystems like rangelands, productive capacity is an intrinsic process that, along with other processes such as biogeochemical cycling and biodiversity, provide the ecosystem goods and services essential to long-term sustainability (Christensen et al. 1996). Even economists tend to accept the premise that nature must be taken into account as both a vital factor of produc-tion and a source of our quality of life (Binswanger 1998). Productive capacity thus integrates all three components of sustainable management –economic, ecological, and social criteria – by focusing upon the ability of rangeland to produce goods and services. (For definitions of sustain-able rangeland management, sustainable development and sustainability, see the introductory paper of this issue.)
Within the Sustainable Rangelands Roundtable (SRR), the Productive Capacity Criterion Group, comprised of academicians, rangeland scientists, natural resource agency personnel, non-gov-ernmental organization representatives, and practitioners, identified, developed, and adopted six standardized indicators that would characterize the maintenance of rangeland productive capac-ity (Table 4.1). The development of these six indicators reflects the expert opinions of the group as a whole. Associated concepts and ideas have evolved from discussions at the SRR workshops as well as the use of the Delphi Process between meetings. These indicators are not inclusive but, when complemented with indicators from the four other criteria, should provide a national monitoring system for assessing trends in rangeland sustainability. This paper outlines current thoughts toward developing standardized indicators for monitoring rangeland ecosystem produc-tivity, based on today’s information and research findings. As research and knowledge continue to evolve, the indicators will reflect new input and information.
Productive CapacityProductive capacity can have different meanings, such as the maximum possible production on a site or the production possible given current conditions. Regardless, long-term sustainability requires that land uses do not change the resource or resource base, especially soils, to the point that the land is no longer capable of producing plant communities desired by society.
Although forests are the most productive biomes, rangelands rank second in Net Primary Production (NPP) worldwide (Lieth and Whittaker 1975). Globally, grasslands and savan-nas cover approximately 35 million km2 or one-quarter of the earth’s land area (Graetz 1994). Desert shrublands and tundra encompass a roughly equivalent land area (Shantz 1954). Because rangelands encompass such a broad diversity of ecosystems, the range of NPP is also broad, from less than 500 kg ha-1yr-1 to levels approaching 10,000 kg ha-1 yr-1 (Sala et al. 1988; Ehleringer 2001).

Chapter Four | Criterion 3: Maintenance of Rangeland Productive Capacity
141
Table 4.1. The six productive capacity indicators and applicable data set.
Indicator What the Indicator Describes DS Title of Data Set
Rangeland aboveground phytomass
A direct measure of total standing (aboveground) plant material.
1 VegBank
2 NatureServe Explorer
3 Ecological Site Description System
4 Ecological Site Inventory System for Rangeland
5 USGS/NPS Mapping
6 USGS Gap Analysis Program
7 Potential Natural Vegetation Groups, Version 2000
8 USFS - NRIS (FSVEG Module)
9 BLM - SVIM (Soil Vegetation Inventory Monitoring)
10 NRCS - NRI
11IDS (Inventory Data System) - Ecological Status Inventory
12 NASA Earth Observing System
Rangeland annual primary productivity
A direct measure of the rate of rangeland annual primary production.
1 U.S. Environmental Protection Agency
2 NASA Earth Observing System (e.g., MODIS)
3 DAAC - Distributive Active Archive Center
4 AmeriFlux (part of DAAC)
5 USGS/NPS Mapping
7 Potential Natural Vegetation Groups, Version 2000
Percentage of available range-land grazed by livestock
Information on use patterns of rangeland that could be grazed by livestock. Shows the shift in produc-tion from one commodity to an-other, based on climate, economic, and other variables.
Number of domestic livestock on rangeland
A direct measure of rangeland sec-ondary production.
Presence and density of wildlife functional groups on rangeland
The presence and density of wildlife functional groups; provides an addi-tional direct secondary production measure of rangeland.
Annual removal of native hay and non-forage plant materi-als, landscaping materials, edible and medicinal plants, wood products
The removal of native hay and non-forage products are additional measures of rangeland productive capacity, as well as sustainability and biodiversity.

142
Chapter Four | Criterion 3: Maintenance of Rangeland Productive Capacity
Productive capacity includes more than primary production, however. To some extent, livestock and wildlife population sizes represent measures of secondary production. Even though they are secondary production, herbivore biomass and herbivore consumption of biomass are closely correlated with primary production in some ecosystems (McNaughton et al. 1989). Indicators tracking production and/or removals of other resources have been shown to be important for assessing sustainable management (USDA Forest Service 2004; Imhoff et al. 2000 and 2004).
We currently define productive capacity as the yield of plant and animal biomass (net annual primary and secondary productivity minus losses due to death and harvest) in response to abiotic and biotic factors such as climate and land uses (Reeves et al. 2001; Running et al. 2004). Other measures of productive capacity are manifested in other SRR criteria indicators, particularly rangeland area by plant community. Climatic phenomena, such as the periodic El Niño and La Niña events, cause changes in primary and secondary production having proximal and evolution-ary implications that can be tracked over the long-term (Diaz and Markgraf 1992; Holmgren et al. 2006; Washington-Allen et al. 2006). For example, Craine et al. (2010) demonstrated in a recent 14-year study of 21,000 cattle fecal samples that forage quality, a factor in second-ary productivity, declined nationally with temperature increases occurring since the mid-1990s. Projected “mega-droughts” due to warming and a lack of rainfall in the western U.S. range-land states have the potential to deleteriously impact future productivity and water availability (Overpeck and Udall 2010). Drought, a product of these phenomena, will be considered in each of the indicators presented below.
Maintaining rangeland productive capacity implies that future generations will also obtain a mix of desired market and non-market goods and services. Thus, estimates for this criterion must consider both temporal and spatial scales across a wide variety of goods and services. It is impor-tant to understand that productive capacity ultimately embodies more than forage and livestock. It also impacts amenity and consumptive goods and services (e.g., wildlife habitat, landscape values, medicinal plants, and wood products).
Some components of productive capacity are mutually exclusive (competitive) while others are compatible (co-existing or mutualistic). This, however, is a fundamental principle of ecol-ogy. Seldom are different uses mutually exchangeable. For example, tradeoffs exist between the amount of forage available for use by livestock and by wildlife in critical areas such as elk winter range, as well as between forage grazed versus forage harvested through haying.
Identifying and monitoring key goods and services over long time frames requires monitoring capabilities at multiple geographic scales. Data must also be compatible over a relatively long time series in relation to natural fluctuations (Miles 1979; Magnuson 1990; Washington-Allen et al. 2006). While the need for long-term data has been identified, a set of solutions has not. As the six indicators to be presented reflect, some data do not exist or exist in such a disparate form that they provide little information about trends or changes. In order to understand the produc-tive capacity indicators at the national scale, one must describe their dynamics at a regional level. As described in Criterion I, the mechanism of a system’s function at one scale is manifested at the next finer scale of measurement. Consequently, data supporting the following indicators must be adequate to monitor and explain how they change regionally. By regionally, we mean an area equivalent to the Division level of an Ecoregion classification system (e.g., Fenneman 1928; Bailey 1998; or Comer et al. 2003).
Interpreting trends in productive capacity requires long-term data sets that provide information about the stability or degradation of the land base. Terrestrial ecologists generally define physical rangeland degradation in terms of parameters related to vegetation and soil. Land degradation includes (Behnke and Scoones 1993; NRC 1994):

Chapter Four | Criterion 3: Maintenance of Rangeland Productive Capacity
143
1. A change in plant species or life-form composition that is contrary to management goals associated with sustainable rangeland health.
2. A decrease in plant productivity, cover, density, or other plant parameters or measure-ment of attributes that adversely affect rangeland health.
3. A reduction in soil quality, for example, nutrient loss.
4. Accelerated soil erosion.
5. Changes in landscapes that adversely affect ecosystem function at the landscape/water-shed level.
While U.S. rangeland health has been slowly but steadily improving since the 1930s (Mitchell 2000), there can be little doubt that its productive capacity is still less than desired. An assess-ment by the U.S. Department of Agriculture (USDA) Natural Resources Conservation Service (USDA NRCS 1997) estimated that 60 percent of non-federal rangelands were in need of man-agement or practices to remedy the effects of disturbances impacting productive capacity.
ThresholdsRelating productivity to sustainable management requires an understanding of thresholds. Thresholds, or discontinuities, are manifested in a number of ecological indicators of rangeland sustainability (Archer 1989; Lockwood and Lockwood 1993; Rietkerk et al. 1996; Peters et al. 2004 and 2006; Briske et al. 2005; Rietkerk et al. 2004; Washington-Allen et al. 2006 and 2009). The concept of thresholds declares that the state of an ecological system can change abruptly, and sometimes irreversibly, in response to a change in some driving variable (Lockwood and Lockwood 1993; Scheffer et al. 2001; Briske et al. 2010). Relating threshold values to sustainable management is difficult, at best, because of a number of uncertainties and limitations. Perhaps foremost, the delimitation of a threshold depends upon the spatial and temporal scale in which it is considered (Levin 1992; Gosz 1993; Briske et al. 2005; Briske et al. 2010).
Thresholds for rangeland community and ecosystem processes have been advanced by both theoreticians (Noy-Meir 1975; Hanley 1979; Lockwood and Lockwood 1993; Rietkerk et al. 1996; Scheffer et al. 2001; Beisner et al. 2003,) and empirical studies in rangelands (Archer 1989; Westoby et al. 1989; Tilman et al. 1996; Allen and Breshears 1998; Peters et al. 2004 and 2006; Washington-Allen et al. 2006, 2008, and 2009). For example, catastrophic shifts to lower biomass, physiognomic composition, vegetation pattern, and greater erosion state in response to repeated droughts and intensive domestic livestock grazing was observed over a 27-year period by Zimmermann et al. (2007) and Washington-Allen et al. (2004 and 2009). A meta-analysis of 171 studies showed both nonlinear and positive patterns between species richness and produc-tivity to be more or less prevalent, depending upon scale (Mittelbach et al. 2001). However, no studies have verified an unmistakable discontinuity in ecosystem stability or function in relation to changing diversity, in part because the science of ecology is too complex to enable predictions of ecosystem-level outcomes of changing biodiversity. In addition, the idea of ecosystem resil-ience is imprecise at best, relating to two general concepts: the ability to recover to a pre-existing state following a disturbance and the ability to exist in the form of alternate ecosystem states (Grimm and Wissel 1997).
Nearly a decade ago, a Society for Range Management task group reported upon its work for evaluating rangeland sustainability at the management unit level (Task Group on Unity in Concepts and Terminology 1995). The group highlighted the importance of ground cover thresholds, below which unacceptable soil erosion rates will occur. O’Brien et al. (2003) proposed ground cover thresholds for aspen, alpine, mountain big sagebrush, and tall forb

144
Chapter Four | Criterion 3: Maintenance of Rangeland Productive Capacity
communities in the Intermountain United States. A correlation between ground cover and actual soil erosion has been shown at a regional scale (Hardy 2002).
Models evaluating the risk of crossing thresholds have demonstrated that ecological consider-ations are not the only factors to be considered; for example, profitability of livestock production and technology can also be primary factors to consider when assessing trends in desertification (Ibáűez et al. 2008).
Remote Sensing ApplicationsThe first two, and perhaps the third, of the six Productive Capacity indicators lend themselves to be remotely monitored using sensors (Hunt et al. 2003; Running et al. 2004; Kulawardhana et al. 2009). Specific tools are described in their respective sections.
Aboveground Phytomass
Description and Importance of the IndicatorPhytomass is the mass of plants, including dead attached parts, per unit area at a given time. Phytomass is commonly measured in units of kilograms per hectare (or pounds per acre). It is a direct measure of biomass production, carbon storage, energy availability, and available forage for potential grazers and users of rangelands. It also serves as a fuel source for rangeland fire. Phytomass is not to be confused with the next indicator, primary productivity, which describes rates of biomass accumulation.
The measurement of aboveground phytomass, when separated into live and dead plant material, provides an acceptable estimate for NPP (above and belowground), particularly for ecosystems dominated by species having a single growing season. Most of the data available (Table 4.1) have been collected in terms of peak standing crop estimates of herbaceous and shrub vegetation. These data provide a valuable tie to past management actions, giving trends in biomass produc-tion through space and time (Scurlock et al. 1999).
Phytomass can be used to estimate residual forage supplies in regions where browsing and graz-ing by livestock or wildlife are not in equilibrium with NPP because of a lack of grazing or burn-ing, such as on lands set aside for national parks and the Conservation Reserve Program (e.g., Stoms and Hargrove 2001). As a result, these lands often contain excessive standing dead mate-rial, often at levels that curtail primary productivity and cause decadence (Weaver and Rowland 1952).
Spatially explicit maps of biomass and standing dead material are becoming extremely useful for providing inputs into wildfire behavior models (Keane et al. 2001). Moreover, under the increased impacts of stressors like plant invasions and climate change, wildfires are collectively posing one of the largest challenges facing rangeland managers.
In a world with continuously increasing demands for energy, some scientists and policymakers see the possible use of biomass, including that from tallgrass species, as a substitute for fossil fuels (Ramsey 1985). Such an outcome is more likely in developing countries; however, research in the U.S. tallgrass prairie has shown that native grasslands have the potential as an energy source while not impacting cropland food production or biodiversity (Tilman et al. 2006). The actual indicator pertaining to biofuels is described below (Annual Removal of Native and Non-forage Biomass).

Chapter Four | Criterion 3: Maintenance of Rangeland Productive Capacity
145
Geographic VariationRangeland vegetation types are highly variable in annual phytomass production because of varia-tion in precipitation, temperature, soil quality, and other factors. For broad scale assessments, not only is the average amount of phytomass important, so is the spatial distribution within ecologi-cal or physiographic regions.
Scale in Time and SpacePhytomass information is generally collected at the management-unit level using plot data. Aggregating local data to a regional scale for the purpose of national reporting is problematic. Vegetation indices derived from historical remote sensing data archives from the early 1970s, particularly the Landsat (30-m to 80-m pixel resolution) and Advanced Very High Resolution Radiometer (AVHRR) archives, can be calibrated with properly scaled field calibration data and used as proxies for local to national biomass estimates and annual phenology tracking (Sellers 1985). Another approach for detecting significant regional changes in phytomass for national reporting might be to employ meta-analysis techniques (Glass 1976).
Data Collection and AvailabilityBecause of the time and cost of obtaining phytomass estimates, data collection, analysis, and reporting occurs at local, regional, and national levels. Data collection methods are not stan-dardized among or within scales (Scurlock et al. 1999). In addition, agencies can have intrinsic inconsistencies at a given scale (i.e., an organization may have protocols that are not followed or interpreted the same way throughout the organization). In recent years, federal agencies have become much more consistent in collecting data, so this problem is rapidly diminishing. For example, phytomass sampling is incorporated into two national plot-based monitoring systems: the NRCS’s National Resources Inventory (NRI [Nusser and Goebel 1997]) program and the USDA Forest Service’s Forest Inventory and Analysis (FIA [USDA Forest Service 1990]) pro-gram. It has become necessary for these two systems to jointly monitor federal rangelands more comprehensively, and this is the case in the Landscape Fire and Resource Management Planning Tools Project (LANDFIRE), where vegetation plots from a number of federal agencies and NGOs were used to generate different vegetation parameter maps (Rollins and Frame 2006). For example, national forest biomass was predicted from FIA plots and satellite reflectance data by Blackard et al. (2008) and NRI data of more than 800,000 field plots in five years has shown the same potential (Herrick et al. 2010).
The Global Index of Vegetation-Plot Databases (GIVD) consists of 78 databases from around the world, representing more than 1,500,000 relevés that have uploaded their metadata. With an average of 20 species per plot, GIVD presently represents approximately 30 million species records, all with compositional data and most of them with precise location, with environmental and structural data (http://www.botanik.uni-greifswald.de/givd.html).
However, data collection of phytomass at the state and local levels can still be incomplete, but an effort has been made to collect and standardize historical U.S. and global NPP data sets for validation/calibration of satellite derived data sets, e.g., the data archive of the grasslands NPP data with the NASA Distributive Active Archive Center for biogeochemical cycling at Oak Ridge National Laboratory (Scurlock et al. 1999), and the National Phenology Network, which has a goal to archive plant and animal data related to phenology (Morisette et al. 2009). Further, a na-tional network of eddy covariance flux towers, called AmeriFlux, has been established for estima-tion of the large-scale carbon cycle and calibration/validation of estimates derived from satellite imagery (Heinsch et al. 2006; Xiao et al. 2008).

146
Chapter Four | Criterion 3: Maintenance of Rangeland Productive Capacity
Aboveground phytomass data are collected both directly and indirectly. Direct methods require destructive sampling of aboveground biomass through clipping and weighing plant material. Indirect methods involve weight-estimate procedures, where mass per unit area is estimated visually or in some other manner, such as correlating it with canopy cover (Mitchell et al. 1987; Scurlock et al. 1999). Double sampling techniques utilize both approaches in combination with regression techniques for developing correction factors (Scurlock et al. 1999). Indirect methods using satellite data for biomass estimates are discussed in the section, Annual Primary Productivity. Figure 4.1 estimates aboveground biomass in U.S. rangelands from 1982 to 2009 (Unpublished data, R.A. Washington-Allen, Texas A&M University). The 8-km pixel resolution map time series was derived from the annual summed normalized difference vegetation index (NDVI), Advanced Very High Resolution Radiometer (AVHRR), Global Inventory Modeling and Mapping Studies (GIMMS) data set from 1982-2006 (Nemani et al. 2003; Tucker et al. 2004 and 2005; Bai et al. 2008), and the 1-km pixel resolution Moderate Resolution Imaging Spectroradiometer (MODIS) Collection 5 net primary productivity (NPP) data set from 2000-2009 (Zhao et al. 2005; Zhao and Running 2010). The annual sum of NDVI approximates NPP and is equal to it when combined with a production efficiency model (PEM) (Potter et al. 1993; Prince and Goward 1995; Running et al. 2004; Zhao et al. 2005; Zhao and Running 2010). A calibrated NPP time series from 1982 to 2009 is produced by conducting a time series regression between the temporal overlap of the Annual Sum NDVI AVHRR GIMMS and the 8-km resampled MODIS NPP for the period 2000-2006 of the rangeland portion of the conterminous U.S. Calibrated NPP is then converted to aboveground biomass (Kulawardhana et al. 2009) (Fig. 4.1).
Figure 4.1. Aboveground biomass from 1982 to 2009 that was derived from calibrated NPP. Calibrated NPP was derived from the time series regression between MODIS NPP from 2000 to 2006 and annual sum NDVI AVHRR GIMMS for the same period.

Chapter Four | Criterion 3: Maintenance of Rangeland Productive Capacity
147
Clarity to StakeholdersThis indicator can be understood by stakeholders, particularly the public, because amounts or states are more intuitive than rate processes like productivity. Thus, phytomass is important for understanding rangeland sustainability and maintenance of productive capacity on rangelands for two reasons: (1) its value as a measure of accumulated phytomass, and (2) its usefulness as a measure that most people can easily understand.
Annual Primary Productivity
Description and Importance of the IndicatorNPP is the rate (on an annual basis) at which CO2 is converted to biomass (all plant life-forms) through photosynthesis. Thus, it is the first critical step in the carbon cycle on earth. Productivity is a flow or ecosystem process measured in terms of mass per unit area per time. NPP takes place in both above- and belowground biomass (i.e., plant shoots and roots). However, the reality is that, with the exception of a few local studies, little data exist on belowground productivity, even though the proportion and turnover of belowground biomass varies among ecosystems (Reeder et al. 2001). Annual aboveground net primary productivity (ANPP) is the ecosystem measure of the rate at which aboveground biomass is produced annually. Although ANPP and aboveground phytomass (Indicator 1) are two separate measures, represented by two different units, they are often used interchangeably to describe rangeland production (Sala 2001; Rambal 2001).
Primary productivity is the foundation for measuring the productive capacity of terrestrial eco-systems, both terrestrial and aquatic, and is key to understanding ecosystem sustainability. As an essential component of the carbon cycle, NPP will always be a critical indicator for monitoring and assessing interrelationships between the atmosphere, natural ecosystems, and human popula-tions. Thus, changes in terrestrial primary productivity affect the kind, amount, and distribution of life on the planet (Roy et al. 2001).
Our focus is on rangeland ecosystems. Joyce (1989) estimated that forests and rangelands support approximately 70 million cattle, 8 million sheep, and 45,000 wild horses and burros. Wildlife populations found on rangelands have increased substantially over the past quarter of the 20th century to 500,000 elk, 630,000 pronghorn antelope, and 5.5 million wild turkeys (Flather et al. 2009), along with smaller numbers of goats, bison, wild sheep, and moose, plus unknown numbers of rodents, rabbits, insects, and other creatures. All life in rangeland ecosys-tems is sustained through primary productivity. Plant material derived from NPP is then available for consumption by herbivores (secondary productivity or primary consumption) and carnivores (secondary consumption). After plants and animals die, the activities of microflora and microfau-na on rangelands are important in the mineralization of organic compounds within and upon the surface of the soil. Microorganisms allow nutrient cycles to function properly and keep phyto-mass from accumulating.
Geographic VariationAnnual rangeland NPP has high spatial variability, ranging from near zero to around 3,000 g m-2 (Running et al. 2004). Savannas, for example, can produce as much biomass annually as conifer-ous forests. This variability occurs for a variety of reasons in which one variable can seemingly “drive” the system or a combination of variables collectively control the environment. Below are some sample explanations.

148
Chapter Four | Criterion 3: Maintenance of Rangeland Productive Capacity
The principal change drivers that affect primary productivity on rangelands include 1) land-use change (including changes that affect soil), 2) climate change (precipitation and temperature), 3) change in composition of the atmosphere (CO2), and 4) changes in biodiversity. Early estimates of global NPP, made 30 years ago, were based primarily upon evapotranspiration data converted from air temperature data (Lieth and Whittaker 1975). Recent research using an ecosystem pro-ductivity model has shown that input temperature data must be within 2° to 3° C to accurately predict NPP (Matsushita et al. 2004).
In most cases, NPP declines with changes in land use (Burke et al. 1991; Alcamo 1994). In some cases, NPP may be increased with land-use changes that include high energy inputs such as irri-gation and fertilizer. Similarly, as precipitation decreases and temperature increases, NPP gener-ally declines (Sala 2001). This may or may not be the case with global warming, since climate change models indicate that changes may include increasing precipitation, as well as declining precipitation, in different global regions. With increasing CO2 in the atmosphere, NPP often increases (Field et al. 1995a; Owensby et al. 1999). In some regions like the tallgrass prairie, researchers have found a positive correlation between biodiversity and NPP (Mooney et al. 1995; Tilman et al. 1996). Sufficient monitoring does not exist to determine if this will be true across all rangelands.
Rangelands in the mostly arid or semiarid western U.S. occur in ecosystems that can experi-ence prolonged periods of water shortage. As a result, water tends to be a dominant factor affecting productivity. It is not surprising then that the major effects of climate change on such ecosystems are experienced primarily through changes in soil/plant water dynamics (Morgan 2005; Heisler-White et al. 2009). However, the degree to which climate change impacts these rangelands is likely to differ considerably due to their present ecology, how climate change will manifest in specific regions, and the resulting consequences for each regions’ economic and social structures and conditions.
In U.S. Mediterranean shrublands and woodlands, timing and amount of precipitation and soil nutrients are the major environmental variables controlling plant productivity (Rambal 2001). A drying climate is a primary global climate change driver in the Mediterranean system, which, when coupled with fire and intermittent heavy rain events, fosters flushes of annual grass bio-mass, thus fueling more potential fires.
The main controls on primary productivity in desert ecosystems are precipitation and soil fertility (Ehleringer 2001) and to some extent soil texture. The ability of desert plants to convert pre-cipitation to NPP varies by season, growth form (shrub/herb), and ability to utilize deep soil moisture (mainly shrubs) versus shallow soil moisture. Crypto-biotic crusts play a critical role in maintaining productivity in desert ecosystems through the regulation of input and loss of nitro-gen (Dregne 1983), by limiting soil erosion, and by affecting soil water infiltration.
Scale in Time and SpaceRangeland productivity is highly variable, spatially and temporally. The indicators are meaningful when sample sizes are large enough to provide the necessary statistical power to detect change. Further interpretation can be enhanced through an understanding of climate and land-use changes. Different approaches for estimating NPP apply at different scales. This is discussed below.

Chapter Four | Criterion 3: Maintenance of Rangeland Productive Capacity
149
Data Collection and AvailabilityAlthough NPP and annual aboveground biomass production are two different concepts, the most common way to estimate NPP is to equate peak aboveground biomass with annual pro-ductivity (Sala and Austin 2000). Data are available for all rangelands although quality and quantity vary widely, making assessments difficult (Rotenberg and Yakir 2010; Schimel 2010). Belowground biomass has only been broadly estimated across biomes, adding to the uncertain-ties in data sets describing rangeland productive capacity (Jackson et al. 1996 and 1997).
NPP is measured in three ways. The first method is field-based direct, destructive sampling of above and belowground biomass over time. For example, in temperate grasslands, the annual turnover of biomass approximates unity. Therefore, the most common way to estimate NPP in grasslands is by estimating aboveground biomass only, often by directly clipping and weighing the biomass, or using weight-estimate procedures (Bonham 1989). It should be noted that sev-eral methods are available for directly measuring or estimating productivity. The most effective methods to meet long-term monitoring goals have yet to be agreed upon.
A second approach to measuring, calibrating, and validating NPP is provided by the AmeriFlux network that involves a network of eddy covariance flux towers that measure the CO2 flux in an ecosystem (Running et al. 1999).
The third method for monitoring NPP is through modeling its amount and spatial distribution. A number of modeling approaches have been developed, particularly remote sensing-based, physiological-based, or a combination of both. Remote sensing-based models interpret the light spectrum reflected by the land surface, converting known relationships developed from direct measurements, while physiological-based models simulate NPP from environmental variables.
The use of remote sensing-based models is becoming more widespread, advancing from pio-neering global analyses involving the Advanced Very High Resolution Radiometer (AVHRR) by Tucker et al. (1985) and research by Potter et al. (1993). Advances since that period include:
• PrinceandGoward’s(1995)GlobalProductionEfficiencyModel(GLOPEM)dataset(http://glcf.umiacs.umd.edu/data/glopem/) showing that time series of NPP can be generated.
• Fieldsetal.’s(1995b),andNemanietal.’s(2003)useoftheAVHRRGlobalInventoryModeling and Mapping Studies (GIMMS) data set.
• CurrentresearchusingdatafromtheModerateResolutionImagingSpectroradiometer(MODIS) on both the Terra and Aqua satellite platforms that produce a low-cost Global NPP product at 1-km resolution from 2000 to the present (Reeves et al. 2001; Running et al. 2004; Zhao et al. 2005; Zhao and Running 2010).
Clearly, the best potential for monitoring NPP at various temporal and spatial scales lies with re-motely sensed data (Lutz et al. 2008). In fact, the AmeriFlux network coupled with NPP derived from MODIS has been used to estimate both NPP and Net Ecosystem Production across the entire continental U.S. (Xiao et al. 2008).
As indicated at the start of this section, critical review and comparison of various data methods are essential. This is critical for correlating remotely sensed data with ground validation. The two other types of NPP measurements – direct biomass measurement and CO2 flux estimates – no single one can match the spatial and temporal extent and grain of current satellite data (Running et al. 2004).

150
Chapter Four | Criterion 3: Maintenance of Rangeland Productive Capacity
Clarity to StakeholdersNPP can be understood by those who understand basic ecosystem processes. It is probably the key indicator of the “Maintenance of Productive Capacity on Rangelands” criterion. Many of the indirect measurement and estimation techniques, on the other hand, involve complex data sets and sophisticated analysis procedures that are beyond the comprehension of average citizens. Fortunately, most rangeland stakeholders have learned to accept information coming from high technology monitoring, so the complexity of the data collection and analysis process should not be problematic.
Percent of Available Rangeland Grazed by Livestock
Description and Importance of the IndicatorThis indicator is a measure of the availability of suitable rangeland that is grazed annually by domestic livestock, such as cattle, sheep, goats, and horses. This indicator does not intrinsically represent a biological capacity. Rather, it is an administrative and economic capacity, limited by the definition of rangelands, market forces, management decisions, laws, regulations, and plan-ning documents. The land area involved will always be a subset of the indicator, Extent of Land Area in Rangeland, described in Chapter 3.
The area of rangeland grazed by livestock provides information on rangeland use patterns and is influenced by wildlife and other non-livestock commodity demands, as well as changing social and economic values. The indicator may be used separately or with other indicators reporting livestock numbers to quantify primary production consumed by livestock. It describes the net land area used to produce livestock forage in proportion to total rangeland. As long as livestock forage use is not limiting demand for red meat, and as long as land management agencies keep sustainable management as a strategic goal, the percentage of available rangeland grazed by live-stock will remain primarily a socio-economic measure. However, where demand for meat exceeds supply or high value is placed on livestock grazing, this indicator could reflect changes in range-land health.
Geographic VariationThis indicator provides consistent information across geographic regions because domestic live-stock numbers are used in tax valuations, in estimates of current and future market needs, and for assessing range livestock needs in association with non-grazing rangeland needs. The area of rangeland grazed by livestock is obviously correlated with national and regional herd sizes.
Scale in Time and SpaceThe percentage of available rangeland grazed by livestock is meaningful at different scales and provides a measure that is aggregated from public and private land management records to mul-tiple scales – states, by federal agency, by ecoregion or physiographic region (Bailey 1998), and for the nation as a whole.
Data Collection and AvailabilityObtaining data on the percentage of available rangeland grazed by livestock is feasible us-ing habitat suitability approaches (Wade et al. 1998). However, crucial data on livestock water availability are currently not available, and would be labor intensive to develop. This indicator

Chapter Four | Criterion 3: Maintenance of Rangeland Productive Capacity
151
requires two kinds of data by ecoregion or physiographic region: (1) area of rangeland available for livestock grazing, and (2) area of rangeland actually grazed. Kulawardhana et al. (2009) have estimated that the area grazed in the conterminous U.S. to be 236 million ha by using a climatic definition, the aridity index (mean annual precipitation [MAP] divided by the mean annual potential evapotranspiration [MAPET]) (UNEP 1992). Ungrazed suitable areas were estimated using a National Wilderness Preservation Areas mask acquired from the USGS National Atlas (http://www.nationalatlas.gov/). Urban areas and other non-rangeland classes were also masked out (Fig. 4.2).
Figure 4.2. The National Land Cover Dataset (NLCD, A) is converted to a shrubland and grassland cover map and combined with the aridity index climatic map to delineate the land area grazed by livestock. This area was further defined by subtraction of the National Wilderness Preservation System areas.

152
Chapter Four | Criterion 3: Maintenance of Rangeland Productive Capacity
Two factors can keep rangeland from being available for livestock grazing, one relatively simple and one difficult to discern. The first includes legal statutes, covenants, land-use restrictions, etc., that prohibit livestock grazing for policy and social reasons. Although keeping a current database of rangelands excluded from livestock grazing is conceptually feasible, the practical implementa-tion of such monitoring protocols is anything but simple. Regardless, the more complicated fac-tor, if included in the definition of available rangeland, is the employment of suitability criteria. Suitability criteria provide parameters that demarcate the extent of primary rangeland and sec-ondary rangeland. Primary rangeland is the area that livestock normally use under proper man-agement. When primary rangeland is overused, livestock tend to move onto secondary range-land. Unsuitable rangeland often results from physiographic and soils features like steep slopes, highly erodible soils, and lack of water. At regional or national scales, it may be difficult to derive suitability criteria that match the grain and extent of the rangeland base. If this problem proves insurmountable, the available rangeland would be defined only on the basis of the first factor.
The area of privately owned rangeland actually grazed is a sensitive issue with many private landowners and will require proprietary protections for data to be collected. Federal and state lands leased for grazing in any given year will seldom be released in a formal published form that provides ratios of grazed to ungrazed lands. While the potential for such information is available, policies do not exist for these publications.
Clarity to StakeholdersThe indicator is understandable. However, it requires a clear and accepted definition of the term “available rangeland.” Within the rangeland community, different perceptions by various stake-holder groups about the availability of rangeland on any given year will vary until such time as clear definitions are developed.
Number of Livestock on Rangeland
Description and Importance of the IndicatorThis indicator measures the quantity of livestock (cattle, sheep, horses, and goats) that spend part or all of the year on rangeland. It is an index of secondary productive capacity by a major catego-ry of primary consumer. Livestock do not spend their entire life on rangeland, so an inventory at any one time will underestimate the total extent of rangeland use by livestock.
The indicator, linked with other indicators, represents rangeland grazing and browsing use by domestic animals. It accounts for short-term management strategies by individual graziers, as well as more long-term strategies followed by land management agencies. It also accounts for laws restricting livestock use on rangelands. Clearly, a positive relationship exists between the per-centage of suitable rangeland grazed by livestock and this indicator.
Livestock numbers can be reported in several ways. Actual numbers, expressed as herd sizes at county, state, and national levels, are already reported by USDA National Agricultural Statistics Service (NASS) (Fig. 4.1). Livestock and other grazing herbivores can also be reported in terms of Animal Units (AU), an approach that normalizes different classes of grazing animals into a standardized AU, typically a 1,000-lb. cow (Holechek 1988). The Animal Unit Day, Month, or Year (e.g., AUM) expresses the amount of dry weight of forage consumed by an AU for that time period. Addition of the time dimension enables economic valuation of rangeland products. Grazing pressure or density is the AU per unit land area, most often hectares in the scientific

Chapter Four | Criterion 3: Maintenance of Rangeland Productive Capacity
153
literature. The rate of grazing or stocking rate is grazing pressure over time calculated for a year as AU ha-1 yr-1. Domestic livestock found upon rangelands include cattle, sheep, goats, horses, and mules, along with a number of minor grazing animals like donkeys, llamas, and alpacas.
In the United States, cattle numbers (including calves) rose steadily from when records were kept in the mid-19th century until 1975, when they peaked at 132 million head (Mitchell 2000). Over the next decade, the number of cattle declined to about 100 million head, where it has maintained a somewhat dynamic equilibrium. U.S. cattle numbers have undergone cycles lasting roughly 10 years since the 1880s, primarily because time constraints prevent producers from quickly responding to price changes (Fig. 4.4). The latest national cattle cycle troughed in 2004 and peaked only three years later at roughly 97 million head (Haley 2008). Cattle cycles are affected by droughts, feed costs, and import/export restrictions. Extended droughts can cause animal numbers to be cut dramatically. Trends toward larger-framed cattle are resulting in heavier slaughter weights, a factor that can offset the tendency of the national herd size to decrease from historical highs.
The number of sheep has slowly declined from nearly 50 million head to less than 8 million head over the past half-century (Mitchell 2000). NASS sets a herd size threshold for reporting goat and other livestock numbers; consequently, only Texas has goat herd sizes sufficient to report. Sheep and goats may be more important to society from a sustainability point of view than mere numbers on rangeland imply. This is because sheep, as well as goats, are often used as a tool for prescribed grazing to manage invasive weeds and to reduce fire hazard at the urban/rural interface.
Equine species (horses, mules, and donkeys) are now primarily used for various forms of recre-ation. Their numbers appear to be insensitive to agricultural and other land-use economic forces, resulting in a fairly constant national herd size over the last 50 years (Mitchell 2000).
Figure 4.3. Total U.S. cattle numbers from 1980-2003 (A) and a preliminary map of the spatial distribution of livestock (cattle, sheep, and goats) forage demand (Mg km-2) for a 6-month period at the state level. Livestock data are from the National Agricultural Statistics Service, Washington, DC.

154
Chapter Four | Criterion 3: Maintenance of Rangeland Productive Capacity
Measuring the number of livestock grazing on rangelands annually, as well as the cyclical varia-tions in this number, provides a way to assess the extent to which natural vegetation is supplying the nation’s forage needs (Fig. 4.1). Droughts, land-use changes, and reservation of public lands for biodiversity, wilderness, and watershed stabilization constitute mechanisms that negatively influence the availability and quality of our nation’s rangeland forage supply, and thus livestock numbers. Above-normal precipitation, investments in rangeland improvement practices (restora-tion/rehabilitation), public policies that promote grazing, and other policies can increase the supply of forage.
Estimates of aboveground biomass (Fig. 4.1) can be viewed as the forage available (FA) to live-stock, and livestock numbers can be converted to forage demand (FD, Fig. 4.3), consequently FA – FD is equal to the impact of livestock appropriation of biomass and can be used to detect hotspots where FD > FA and bright spots where FD < FA (Kulawardhana et al. 2009, Fig. 4.5). This study found that 0.01 percent to 2.7 percent (and a mean of 0.7 percent) of rangeland was impacted by domestic livestock at the state level from 2000 to 2009 (Washington-Allen et al., unpublished data).
Figure 4.4. Cattle inventory cycles in the United States, 1896-1996. Adapted from Hughes (1997).

Chapter Four | Criterion 3: Maintenance of Rangeland Productive Capacity
155
The Heinz Center report (Heinz 2008) included cattle numbers on “grassland and shrubland” as one of 14 ecological indicators (plus 13 additional core indicators) that characterize U.S. rangelands. The Heinz Center report recognizes that cattle production is one of the most impor-tant economic uses of rangelands, and it remains a vital element of the economic and social fabric of many parts of the United States, particularly west of the 100th Meridian.
Geographic VariationThe number of livestock grazing upon rangelands is equally meaningful in all geographic regions. Geographic variations exist due to the timing of grazing, with southern regions having much longer grazing seasons than northern or higher elevation regions.
Scale in Time and SpaceCattle, sheep, and goat numbers are meaningful at all scales. They can be aggregated across scales. The numbers of livestock on privately owned rangeland may be inadequate to provide statistically valid estimates of herd size at the county level and for some states. At the regional and national scales, herd sizes would be adequate to provide valid estimates if such data were collected.
Figure 4.5. Livestock appropriation of biomass in the western U.S.: forage available (FA) minus the forage demand (FD) from 2000 to 2009 of livestock grazing on U.S. dryland productive capacity. Red areas are hotspots where FD > FA.

156
Chapter Four | Criterion 3: Maintenance of Rangeland Productive Capacity
Data Collection and AvailabilityThe number of grazing livestock may be determined at a scale necessary for county, regional, state, and national assessments. We recommend that appropriate questions be incorporated into surveys used by the USDA NASS for developing these estimates. To date, the USDA NASS does not request information about where livestock are grazed (i.e., whether on rangeland, improved pasture, or grazed cropland) in developing agricultural statistics and reports of livestock surveys. Indirect estimates (total number of cattle less cattle on feed) require unacceptable assumptions concerning inadequate and incompatible datasets. Data on cattle numbers can be reviewed at http://www.nass.usda.gov.
This indicator will be most useful with both cattle and sheep numbers on rangeland. It will be necessary to work closely with USDA NASS to acquire the requisite data for both.
Clarity to StakeholdersCattle and sheep numbers on rangeland are clearly understood by nearly all people. Expressing these two classes of livestock in terms of animal units, particularly when describing the joint sig-nificance of cattle and sheep, will require some explanation. The additional data for goats, horses, mules, donkeys, llamas, alpacas, and others will also be clearly understood.
Presence and Density of Wildlife Functional Groups on Rangeland
Description and Importance of the IndicatorThis indicator measures both presence and density of representative species within functional groups of wildlife and within ecoregions or physiographic regions. Examples of functional groups for purposes of measuring this indicator may be: large herbivores, small herbivores, large preda-tors, small predators, avian foragers, avian predators, burrowing reptiles, surface reptiles, insect grazers, amphibians, fish, and pollinators. The concept of functional groups continues to evolve, primarily in discussion among wildlife biologists and wildlife policymakers.
Rangeland ecosystems provide all or a critical portion of many wildlife species annual habitat requirements. Habitat components include mating components, rearing young components, forage or food components, and resting components. Depending on the species, these may or may not be available or required in the same space. The components provide the critical factors to sustain population dynamics and species diversity. It is demonstrated that population densities of some wildlife species are affected by changes in rangeland habitat components (changes in the state of the ecological site and/or landscape) and/or changes in land uses (Winter and Faaborg 1999). A loss of one habitat component may result in the loss of that species’ contribution to rangeland biodiversity for the entire area, whether an ecological site or the ecoregion.
Since the mid-19th century, the historic extent of rangelands has been dramatically reduced by other land uses. A study by Noss et al. (1995) found rangelands to be disproportionately repre-sented among ecosystems they identified as critically endangered for wildlife, i.e., more than 98 percent of their area had been converted to other uses. Flather et al. (1999) identified 11 critical western rangeland ecosystems considered to be endangered according to this definition, more than half of which were found in the Pacific Coast states of Washington, Oregon, and California. They determined that a high proportion of the endangered rangeland ecosystems recognized by Noss et al. (1995) were located east of the 95th Meridian, where natural grasslands and shrub-lands have always been rare. In other words, the disproportionate representation of endangered

Chapter Four | Criterion 3: Maintenance of Rangeland Productive Capacity
157
grassland/shrubland ecosystems in the East was likely a consequence of their rarity (Flather et al. 1999). Nonetheless, there are precarious wildlife habitats in western rangelands in need of restoration through a multiplicity of management practices (Crawford et al. 2004).
The State of the Nation’s Ecosystems (Heinz 2008) utilizes a similar indicator called At-Risk Native Grassland and Shrubland Species. This indicator uses a combination of factors, including the relative risk of extinction of native rangeland species, both plants and animals, and population trends of at-risk native rangeland species. The report concluded that 18 percent of native range-land animals are at risk, although this number included lands in Hawaii, which has a much higher percentage of rangeland at-risk species than any other state. It also suggests that this indicator is not yet useful, and will not be so until population trend data become more widely available.
Geographic VariationSome indicator wildlife species transcend ecoregion boundaries, while the home range of other species do not; for example, barren-ground caribou and ptarmigan only occur in the grass and brush tundra (Bailey 1998). It may be beneficial to include both kinds of wildlife species to rep-resent dynamics of this indicator. These representative species can be identified through a collab-orative selection process involving the various governmental agencies, particularly state wildlife management agencies and groups that collect wildlife population data within each ecoregion.
Scale in Time and SpaceThe indicator is meaningful at different spatial and temporal scales. However, as described above, representative species must be selected at the ecoregion level to be useful at the national level. This does not preclude data collected at local levels from being aggregated upward as long as there is consistent data collection protocol for the representative species that recognizes the effect of vegetation in sampling population size and extent. It is recognized that all species will never be adequately monitored at a national level.
Temporal scale trends are important when combined with other indicators to evaluate rangeland sustainability. This indicator should show both short-term and long-term trends in presence and density. This is particularly important because many wildlife species densities can be influenced by normal cyclical climate changes that can cause populations to fluctuate up and down, sometimes year to year. Therefore, longer-term trends will typically be representative of productive capacity changes. The evaluation of these changes becomes the role of policymakers.
Data Collection and AvailabilityWildlife species numbers (spatial and temporal) can provide both species presence and species density at various scales. Surveys of animal numbers that collect count data are, intrinsically, only indices of population size, so interpretations of changes in population are subject to error (Link and Sauer 1998). Moreover, most wildlife species data are collected by state wildlife agencies, and both the species monitored and the collection methodologies followed lack consistency for regional/national assessments. Perhaps the most uniform national wildlife survey is the North American Breeding Bird Survey (BBS). The BBS has collected data for nearly 50 years, and it now monitors several hundred species of birds along more than 3,500 survey routes across the 48 conterminous states (Peterjohn 1994). The USDI Fish and Wildlife Service has responsibility for keeping track of threatened and endangered species.
At a broad landscape scale, Gap analysis species maps portray distributions of numerous vertebrates, including wildlife species found on rangelands, based upon field samples and

158
Chapter Four | Criterion 3: Maintenance of Rangeland Productive Capacity
species-habitat models (Jennings 2000). These maps, which are validated for accuracy, provide an alternative to monitoring actual wildlife numbers.
Clarity to StakeholdersRangeland stakeholders and, for the most part, the general public usually understand the indica-tor and indicator units with little explanation. However, rangelands provide habitat for such a variety of wildlife species that clarity might be promoted by selecting representative species by functional groups and ecoregion for monitoring.
Annual Removal of Native and Non-Forage Biomass
Description and Importance of the IndicatorThis indicator measures the annual harvest from rangelands of 1) native hay and non-forage plant materials, including landscaping and decorative plant materials, 2) edible and medicinal plants, 3) wood products, and 4) biomass for biofuels.
Traditional non-forage biomass products have relatively high local value and may have exceedingly high international value (Lazaroff 2003). Under some conditions, the net effect of recurring har-vests and/or removals of non-forage products could significantly impact ecosystem properties and processes at a broader scale than the activities themselves. During droughts, the value of native hay significantly increases, even in adjoining regions not suffering from drought. While annual produc-tion may or may not be altered due to these commodity removals, excessive removal may deplete biodiversity and alter habitats, thus reducing sustainable productive capacity of rangelands.
BiofuelsInterest in biofuels as a form of renewable energy rapidly increased during the late 20th century, both domestically and internationally (Ramsey 1985). Presently, most of the energy produced from biomass comes from corn starch (for ethanol added to gasoline), along with wood and wood products for heating commercial and residential buildings. If biofuels are to substantially replace liquid fossil fuels, the resulting expansion will require breakthroughs that allow the com-mercial production of cellulosic crops for bioenergy (Walsh et al. 2003). Some scientists are calling for a national strategy of burning biomass for electricity generation, instead of converting it to liquid fuels, as matter of efficiency (Ohlrogge et al. 2009). Regardless, if rangeland grasses and woody material are produced for biofuels, monitoring mechanisms should be expected to be put in place by agencies such as NASS and/or the National Renewable Energy Laboratory.
Oak Ridge National Laboratory, in conjunction with the departments of Agriculture and Energy, produced a landmark report on biofuels availability that became commonly known as the “Billion Ton” study (Perlack et al. 2005). The report lumps perennial grass biomass from rangeland with pastureland and agricultural lands in its projection that agricultural lands can produce 377 mil-lion dry tons of perennial crop biomass from 55 million acres by 2030. Switchgrass (Panicum virgatum L.) in particular has attracted considerable attention for biofuels production due to its considerable energy production potential with lower fertilizer and fossil fuel inputs on marginal croplands than corn (Walsh et al. 2003). However, there are concerns over conversion of large swaths of native rangelands to biofuels monocultures (Fargione et al. 2008). These include increased agri-chemical pollution, loss of diverse forage resources, and loss of landscape and as-sociated biological diversity (Groom et al. 2008).

Chapter Four | Criterion 3: Maintenance of Rangeland Productive Capacity
159
Geographic VariationThis indicator is important and meaningful to completely characterize the productive capacity of rangelands. The ecosystems that have evolved and produce these important economic products are as variable as the plant species that are produced in those ecosystems. Ecoregion sampling designs will be required to reflect the unique cultural and biological differences and temporal product demand shifts in several of these commodities. Preliminary searches at the state level indicate that data on native hay harvests are not now available, but agricultural statistic agencies may collect such data if additional funds become available. There are currently no statistics con-cerning the plants discussed below.
Desert rangelands produce some of the highest valued commodities in the form of cacti and yuc-ca (Lazaroff 2003), which are physically removed for transplanting, often illegally, to urban areas throughout the country. Many of these landscape-valued plants have highly evolved adaptability to desert ecosystems, including unique photosynthesis pathways, slow growth, and survival in the most severe conditions. Medicinal and ceremonial plants valued by American indigenous cultures also have high market value throughout North America. This has led to significant over-harvest-ing and the loss of large areas where production previously occurred.
Temperate tall and midgrass prairies and subirrigated native meadows have historically been harvested for hay. Since the late 19th century, these meadows have assured livestock producers of hay availability during winters and dry seasons. During settlement times prior to 1890, the lack of harvested hay could lead to rangeland overgrazing (Mitchell and Hart 1987). The recent development of “grass banks” by some grazing associations in cooperation with federal agen-cies represents a non-harvested form of forage available during droughts and other times when rangeland forage is not available for livestock grazing. However, rangeland set aside for grass banks is not considered in this indicator.
Southern savannas and pinyon-juniper woodlands contain species that are highly valued for es-sential oils distilled from root masses, as well as aboveground trunks for fence posts and fire-wood, particularly the juniper species (Conner et al. 1990). Pinyon pine communities provide a highly valued pine nut used for cooking and consumption. Pinyon nuts are now used in gour-met food recipes throughout the world. Properly managed, this resource provides a significant income to some American Indian tribes.
Pinyon and juniper species are distributed throughout North America with different juniper spe-cies unique to various ecosystems. When kept in balance by periodic fires and properly managed grazing, the junipers provide habitat for many species of birds and small mammals. It is com-monly perceived, however, that pinyon-juniper woodlands have widely expanded into adjoining ecosystems over the past 150 years, primarily because of overgrazing in the late 19th and early 20th centuries, and the resulting decrease in fires following the loss of fine fuels (Springfield 1976). However, evidence of extensive invasions of pinyon-juniper into grassland ecosystems is not necessarily conclusive. Some scientists believe these ecosystems have primarily increased in abundance by changing from savanna types to dense woodlands and have re-established on sites previously occupied (Samuels and Betancourt 1982). It is likely that the answer lies somewhere between these extremes, and pinyon-juniper woodlands have fluctuated within recent geologic time. However, recent expansions are primarily the result of decreasing fire intervals and under-story fine fuels (Miller and Wigand 1994; Van Auken 2000).
In addition to the previously listed plants, several herbs that grow in natural prairies in the east-ern United States along with the more arid rangeland regions also provide the modern herbalist with materials for homeopathic remedies.

160
Chapter Four | Criterion 3: Maintenance of Rangeland Productive Capacity
Scale in Time and SpaceThe distribution of native and non-native harvested biomass is highly variable, geographically. Spatially, most data will be most relevant at the ecoregion or physiographic region level. In some instances, the species have very long (multi-century) growth and reproduction cycles and, due to the distribution characteristics, have very long time frames.
Data Collection and AvailabilityData describing non-forage biomass and related products are conceptually feasible, but no regional-national methods, procedures, or datasets currently exist. Most existing data are lo-cal in scale and associated with site-specific biodiversity issues, such as removal and depletion of landscaping yucca and cacti (Lazaroff 2003), high-value juniper (cedar), golden cheeked warbler (Juniperus ashei) habitat, and medicinal herbs. Public lands seed collection permit numbers is one source of data that has yet to be developed.
Native hay production data can conceivably be obtained at the state level if adequate fund-ing is found. Statistics could then be aggregated to regional and national levels for recurring assessments.
Clarity to StakeholdersThis indicator is understandable to broad audiences at relevant scales. While the information appears to be isolated in some instances to specific regions, (such as the north central prairie or southwestern desert states), the concepts involved in the use of and the loss of these unique com-ponents of rangeland are understandable by a very broad audience, as witnessed by the recent reports on loss of cacti for ornamental uses (Lazaroff 2003).
SummaryProductive capacity is a trait of ecological systems that science has identified as an important measure of sustainable management. Declines in ecosystem productivity often go together with reductions in ecosystem goods and services important to society (Committee to Evaluate Indicators for Monitoring Aquatic and Terrestrial Environments 2000). While this concept is reasonably understood by the general public, there appears to be little connection between un-derstanding the relationship between delivery of goods and services and the capacity to produce these goods and services through sustainable management. Recent surveys of objectives and beliefs of people living in the United States show a strong agreement with statements that natural resources and biodiversity should be preserved by restricting timber harvest, grazing, and mining (Shields et al. 2002). Yet there is an apparent lack of public understanding regarding the linkage between productivity on one hand and ecosystem health and biodiversity on the other (Tilman et al. 1996).
In earlier decades, when more people lived closer to agriculture, we suspect public attitudes were more accepting of productivity indicators as central for monitoring sustainable management. For example, forest visitors coming from rural communities tend to be somewhat more agreeable to livestock grazing than visitors from more urban environments (Mitchell et al. 1996). Thus, out-reach activities may be needed to show the place of productive capacity as an essential criterion of rangeland sustainable management.

Chapter Four | Criterion 3: Maintenance of Rangeland Productive Capacity
161
Indicator development for the productive capacity criterion focuses on quantifying primary (pho-tosynthesis) production and secondary (consumption by herbivores) production levels of energy flow in an ecosystem. The first emphasis is on primary productivity, both total biomass (produc-tion) as well as rates of production (productivity). The secondary production focus is on long-term trends in utilization by domestic and wild grazers and the associated communities, both human and wildlife, that are dependent upon these ecosystems. A final focus examines other biodiversity effects from utilization of non-forge rangeland products. Collectively, the indicators measure and characterize energy flow through the ecosystem from photosynthesis through graz-ing animals.
Rangelands comprise a wide spectrum of ecological communities, from deserts and prairies, to coastal grasslands and savannas, to cold desert shrub-steppes. The need to assess total productive capacity, therefore, must include both remotely sensed imagery and direct estimates of biomass utilizing a variety of measurement techniques suited to the type of ecosystem being monitored.
Many of the data sets required to assess productive capacity are available in disparate forms, which reside within different public, state, and local entities and non-government organizations. One continuing objective of the SRR is to promote the collection of data that can be aggregated across political and agency boundaries, as well as over time. Monitoring productive capacity, like working toward a goal of sustainable rangeland management, is itself a journey – a long-term endeavor that will hopefully benefit from collaboration among data collectors and advances in monitoring technology.
ReferencesAlcamo, J. (ed.). 1994. IMAGE 2: Integrated modeling of global climate change. Dordrecht,
The Netherlands: Kluwer Academic Publishers.
Allen, C.D. and D.D. Breshears. 1998. Drought-induced shift of a forest–woodland ecotone: Rapid landscape response to climate variation. Proceedings of the National Academy of Sciences 95:14839-14842
Archer, S. 1989. Have southern Texas savannas been converted to woodlands in recent history? American Naturalist 134:545-561.
Bai, Z.G., D.L. Dent, L. Olsson, and M.E. Schaepman. 2008. Proxy global assessment of land degradation. Soil Use and Management 24:223-234.
Bailey, R.G. 1998. Ecoregions: the ecosystem geography of the oceans and continents. New York, NY, USA: Springer-Verlag.
Behnke, R.H. and I. Scoones. 1993. Rethinking range ecology: implications for rangeland management in Africa, p.1-30. In: R.H. Behnke, I. Scoones, and C. Kerven (eds.). Range ecology at disequilibrium. London, UK: Overseas Development Institute.
Beisner, B.E., D.T. Haydon, and K. Cuddington. 2003. Alternative stable states in ecology. Frontiers in Ecology and the Environment 1:376-382.
Binswanger, H.C. 1998. Making sustainability work. Ecological Economics 27:3-11.

162
Chapter Four | Criterion 3: Maintenance of Rangeland Productive Capacity
Blackard, J.A., M.V. Finco, E.H. Helmer, G.R. Holden, M.L. Hoppus, D.M. Jacobs, A.J. Lister, G.G. Moisen, M.D. Nelson, R. Riemann, B. Ruefenacht, M.D. Salajanu, D.L Weyermann, K.C. Winterberger, T.J. Brandeis, R.L. Czaplewski, R.E. McRoberts, P.L. Patterson, R.P. Tymcio. 2008. Mapping U.S. forest biomass using nationwide forest inventory data and moderate resolution information. Remote Sensing of Environment 112:1658-1677.
Bonham, C.D. 1989. Measurements for terrestrial vegetation. New York, NY, USA: John Wiley & Sons.
Briske, D.D., S.D. Fuhlendorf, and F.E. Smeins. 2005. State-and-transition models, thresholds, and rangeland health: a synthesis of ecological concepts and perspectives. Rangeland Ecology & Management 58:1-10.
Briske, D., R.A. Washington-Allen, C. Johnson, T. Stringham, D. Lockwood, J. Lockwood, and H.H. Shugart. 2010. Catastrophic thresholds, perspectives, definitions, and applications: A synthesis. Ecology and Society 15:37. [online] URL: http://www.ecolog-yandsociety.org/vol15/iss3/art37/
Burke, I.C., T.G.F. Kittel, W.K. Lauenroth, P. Snook, C.M. Yonker, and W.J. Parton. 1991. Regional analysis of the Central Great Plains. BioScience 41:685-692.
Christensen, N.L., A.M. Bartuska, J.H. Brown, S. Carpenter, C. D’Amato, R. Francis, J.F. Franklin, J.A. MacMahon, R.F. Noss, D.J. Parsons, C.H. Peterson, M.G. Turner, and R.G. Woodmansee. 1996. The report of the Ecological Society of America Committee on the Scientific Basis for Ecosystem Management. Ecological Applications 6:665-691.
Comer, P., D. Faber-Langendoen, R. Evans, S. Gawler, C. Josse, G. Kittel, S. Menard, M. Pyne, M. Reid, K. Schulz, K. Snow, and J. Teague. 2003. Ecological Systems of the United States: A Working Classification of U.S. Terrestrial Systems. NatureServe, Arlington, VA, USA.
Committee to Evaluate Indicators for Monitoring Aquatic and Terrestrial Environments. 2000. Ecological indicators for the Nation. Washington, DC, USA: National Academy Press.
Conner, R.C., J.D. Born, A.W. Green, and R.A. O’Brien. 1990. Forest resources of Arizona. Resource Bulletin INT-69. Ogden, UT, USA: USDA Forest Service Rocky Mountain Research Station.
Craine, J.M., A.J. Elmore, K.C. Olson, and D. Tolleson. 2010. Climate change and cattle nutri-tional stress. Global Change Biology 16:2901-2911.
Crawford, J.A., R.A. Olson, N.E. West, J.C. Mosley, M.A. Schroeder, T.D. Whitson, R.F. Miller, M.A. Gregg, and C.S. Boyd. 2004. Ecology and management of sage-grouse and sage-grouse habitat. Journal of Range Management 57:2-19.
Diaz, H.F. and V. Markgraf. 1992. El Niño: historical and paleoclimatic aspects of the southern oscillation. Cambridge, UK: Press syndicate of the University of Cambridge.
Dregne, H.E. 1983. Desertification of arid lands. New York, NY, USA: Harwood Academic Publishers.
Ehleringer, J.R. 2001. Productivity of deserts, p.345-362. In: J. Roy, B. Saugier, and H.A. Mooney (eds.). Terrestrial Global Productivity. San Diego, CA, USA: Academic Press.

Chapter Four | Criterion 3: Maintenance of Rangeland Productive Capacity
163
Fargione, J., J. Hill, D. Tilman, S. Polasky, and P. Hawthorne. 2008. Land clearing and the bio-fuel carbon debt. Science 319:1235-1238.
Fenneman, N.M. 1928. Physiographic divisions of the United States. Annals of the Association of American Geographers 18:261-353.
Field, C.B., F.S. Chapin III, N.R. Chiariello, E.A. Holland, and H.A. Mooney. 1995a. The Jasper Ridge CO2 experiment: design and motivation, p. 121-145. In: G. Koch and H. Mooney (eds.). Carbon dioxide and terrestrial ecosystems. New York, NY, USA: Academic Press.
Field, C.B., J.T. Randerson, and C.M. Malstrom. 1995b. Global net primary production: Combining ecology and remote sensing. Remote Sensing of the Environment 51:74-88.
Flather, C.H., S.J. Brady, and M.S. Knowles. 1999. Wildlife resource trends in the United States: a technical document supporting the 2000 RPA Assessment. General Technical Report RMRS-GTR-33. Fort Collins CO, USA: USDA Forest Service Rocky Mountain Research Station.
Flather, C.H., M.S. Knowles, and S.J. Brady. 2009. Population and harvest trends of big game and small game species: a technical document supporting the USDA Forest Service Interim Update of the 2000 RPA Assessment. General Technical Report RMRS-GTR-219. Fort Collins, CO, USA: USDA Forest Service Rocky Mountain Research Station.
Glass, G.V. 1976. Primary, secondary, and meta-analysis of research. Educational Research 5(10):3-8.
Gosz, J.R. 1993. Ecotone hierarchies. Ecological Applications 3:369-376.
Graetz, D. 1994. Grasslands, p.125-147. In: W.B. Mayer and B.L. Turner (eds.). Changes in land use and land cover: a global perspective. New York, NY, USA: Cambridge University Press.
Grimm, V. and C. Wissel. 1997. Babel, or the ecological stability discussions: an inventory and analysis of terminology and a guide for avoiding confusion. Oecologia 109:323-334.
Groom, M.J., E.M. Gray, and P.A. Townsend. 2008. Biofuels and biodiversity: principles for creating better policies for biofuel production. Conservation Biology 22:602-609.
Haley, M.M. 2008. Livestock, dairy, and poultry outlook. LDM-M-164/February 15, 2008. Washington, DC, USA: USDA Economic Research Service.
Hanley, T.A. 1979. Application of an herbivore-plant model to rest rotation grazing manage-ment on shrub-steppe rangeland. Journal of Range Management 32:115-118.
Hardy, E. M. 2002. Cover, soil, and physiographic variables useful in predicting erosion con-dition class for mountain sagebrush and mountain grassland communities [thesis]. Fort Collins, CO, USA: Colorado State University.
Heinsch, F.A., M. Zhao, S.W. Running, J.S. Kimball, R.R. Nemani, K.J. Davis, P.V. Bolstad, B.D. Cook, A.R. Desai, D.M. Ricciuto, B.E. Law, W.C. Oechel, H.J. Kwon, H. Luo, S.C. Wofsy, A.L. Dunn, J.W. Munger, D.D. Baldocchi, L. Xu, D.Y. Hollinger, A.D. Richardson, P.C. Stoy, M.B.S. Siqueira, R.K. Monson, S.P. Burns, and L.B. Flanagan. 2006. Evaluation of remote sensing based terrestrial productivity from MODIS using regional tower eddy flux network observations. IEEE Transactions on Geoscience and Remote Sensing. 44:1908-1925

164
Chapter Four | Criterion 3: Maintenance of Rangeland Productive Capacity
[Heinz] The H. John Heinz III Center for Science, Economics, and the Environment. 2008. The state of our nation’s ecosystems 2008: measuring the lands, waters, and living resources of the United States. Washington, DC, USA: Island Press.
Heisler-White, J.L., J.M. Blair, E.F. Kelly, K. Harmoney, and A.K. Knapp. 2009. Contingent productivity responses to more extreme rainfall regimes across a grassland biome. Global Change Biology 15:2894-2904.
Herrick, J.E., V.C. Lessard, K.E. Spaeth, P.L. Shaver, R.S. Dayton, D.A. Pyke, L. Jolley, and J.J. Goebel. 2010. National ecosystem assessments supported by scientific and local knowledge. Frontiers in Ecology and the Environment 8:403-408.
Holechek, J.L. 1988. An approach to setting the stocking rate. Rangelands 10:10-14.
Holmgren, M., P. Strapp, C.R. Dickman, C. Gracia, S. Graham, J.R. Gutiérrez, C. Hice, F. Jaksic, D.A. Kelt, M. Lima, B.C. López, P.L. Meserve, W.B. Milstead, G.A. Polis, M.A. Previtali, M. Richter, S. Sabaté, and F.A.Squeo. 2006. Extreme climateic events shape arid and semiarid ecosystems. Frontiers in Ecology and the Environment 4:87-95.
Hughes, H. 1997. The market advisor: maybe just accept that cattle cycles exist and get on with it. Fargo, ND, USA: North Dakota Cooperative Extension Service.
Hunt, E.R., Jr., J.H. Everitt, J.C. Ritchie, M.S. Moran, D.T. Booth, G.L. Anderson, P.E. Clark, and M.S. Seyfried. 2003. Applications and research using remote sensing for rangeland man-agement. Photogrammetric Engineering and Remote Sensing 69:675-693.
Ibáez, J., J.M. Valderrama, and J. Puigdefábregas. 2008. Assessing desertification risk using sys-tem stability condition analysis. Ecological Modelling 213:180-190.
Imhoff, M.L., L. Bounoua, T. Ricketts, C. Loucks, R. Harriss and W.T. Lawrence. 2004. Global patterns in human consumption of net primary production. Nature 429:870-873.
Imhoff, M.L., C.J. Tucker, W.T. Lawrence, and D.C. Stutzer. 2000. The use of multisource satellite and geospatial data to study the effect of urbanization on primary productivity in the United States. IEEE Transactions in Geosciences and Remote Sensing 38:2549-2556.
Jackson, R.B., J. Canadell, J.R. Ehleringer, H.A. Mooney, O.E. Sala, and E.D. Schulze. 1996. A global analysis of root distributions for terrestrial biomes. Oecologia 108:389-411.
Jackson, R.B., H.A. Mooney, and E.D. Schulze. 1997. A global budget for fine root bio-mass, surface area, and nutrient contents. Proceedings of the National Academy of Sciences 94:7362-7366.
Jennings, M.D. 2000. Gap analysis: concepts, methods, and recent results. Landscape Ecology 15:5-20.
Joyce, L.A. 1989. An analysis of the range forage situation in the United States: 1989-2040. General Technical Report RM-180. Fort Collins, CO, USA: USDA Forest Service Rocky Mountain Research Station.

Chapter Four | Criterion 3: Maintenance of Rangeland Productive Capacity
165
Keane, R.E., R. Burgan, and J.V. Wagtendonk. 2001. Mapping wildland fuels for fire man-agement across multiple scales: integrating remote sensing, GIS and biophysical modeling. International Journal of Wildland Fire 10:301-319.
Kulawardhana, R.W., R.A. Washington-Allen, J.E. Mitchell, and M.C. Reeves. 2009. Regional and national scale assessment of the impact of the U.S. livestock footprint on dryland pro-ductive capacity. American Geophysical Union, Fall Meeting 2009, Abstract #GC23A-0751.
Lazaroff, C. 2003. Cactus rustling threatens Chihuahuan Desert. Environmental News Service, 20 January 2003.
Levin, S.A. 1992. The problem of pattern and scale in ecology. Ecology 73:1943-1967.
Lieth, H. and R. Whittaker. 1975. Primary productivity of the biosphere. New York, NY, USA: Springer-Verlag.
Link, W.A. and J.R. Sauer. 1998. Estimating population change from count data: application to the North American Breeding Bird Survey. Ecological Applications 8:258-268.
Lockwood, J.A. and D.R. Lockwood. 1993. Catastrophe theory: A unified paradigm for range-land ecosystem dynamics. Journal of Range Management 46:282-288.
Lutz, D.A., R.A. Washington-Allen, and H.H. Shugart. 2008. Remote sensing of boreal for-est biophysical and inventory parameters: a review. Canadian Journal of Remote Sensing 34(Suppl. 2):S286-S313.
Lowdermilk, W.C. 1953. Conquest of the land through 7,000 years. Agriculture Information Bulletin No. 99. Washington, DC, USA: U.S. Government Printing Office.
Magnuson, J.J. 1990. Long-term ecological research and the invisible present. BioScience 40:495-501.
Matsushita, B., M. Xu, J. Chen, S. Kameyama, and M. Tamura. 2004. Estimation of regional net primary productivity (NPP) using a process-based ecosystem model: how important is the accuracy of climate data? Ecological Modelling 178:371-388.
McNaughton, S.J., M. Oesterheld, D.A. Frank, and K.J. Williams. 1989. Ecosystem-level pat-terns of primary productivity and herbivory in terrestrial habitats. Nature 341:142-144.
Miles, J. 1979. Vegetation dynamics. London, UK: Chapman and Hall.
Miller, R.F. and P.E. Wigand. 1994. Holocene changes in semiarid pinyon-juniper woodlands: response to climate, fire, and human activities in the U.S. Great Basin. BioScience 7:465-474.
Mitchell, J.E. 2000. Rangeland resource trends in the United States. RMRS-GTR-68. Fort Collins, CO, USA: USDA Forest Service Rocky Mountain Research Station.
Mitchell, J.E., P.N.S. Bartling, and R. O’Brien. 1987. Understory cover-biomass relationships in the Front Range ponderosa pine zone. Research Note RM 471. Fort Collins, CO, USA: USDA Forest Service Rocky Mountain Research Station.
Mitchell, J.E. and R.H. Hart. 1987. Winter of 1886-87: the death knell of open range. Rangelands 9(1):3-8.

166
Chapter Four | Criterion 3: Maintenance of Rangeland Productive Capacity
Mitchell, J.E., G.N. Wallace, and M.D. Wells. 1996. Visitor perceptions about cattle grazing on National Forest land. Journal of Range Management 49:81-86.
Mittelbach, G.G., C.F. Steiner, S.M. Scheiner, K.L. Gross, H.L. Reynolds, R.B. Waide, M.R. Willig, S.I. Dodson, and L. Gough. 2001. What is the observed relationship between species richness and productivity? Ecology 82: 2381-2396.
Mooney, H.A., J. Lubchenco, R. Dirzo, and O.E. Sala. 1995. Biodiversity and ecosystem func-tioning: ecosystem analyses. Cambridge, UK: Cambridge University Press.
Morgan, J.A. 2005. Rising atmospheric CO2 and global climate change: Management impli-cations for grazing lands, p.245-272. In: S.G. Reynolds and J. Frame (eds.) Grasslands: Developments Opportunities Perspectives. FAO and Science Pub., Inc.
Morisette, J.T., A.D. Richardson, A.K. Knapp, J.I. Fisher, E. Graham, J. Abatzoglou, B.E. Wilson, D.D. Breshears, G.M. Henebry, J.M. Hanes, and L. Liang. 2009. Learning the rhythm of the seasons in the face of global change: phenological research in the 21st century. Frontiers in Ecology and the Environment 7:253-260.
Nemani, R.R., C.D. Keeling, H. Hashimoto, W.M. Jolly, S.C. Piper, C.J. Tucker, R.B. Myneni, and S.W. Running. 2003. Climate-driven increases in global terrestrial net primary produc-tion from 1982 to 1999. Science 300:1560-1563.
Noss, R.F., E.T. LaRoe, and J.M. Scott. 1995. Endangered ecosystems of the United States: a preliminary assessment of loss and degradation. Biological Report 28. Washington, DC, USA: USDI National Biological Service.
Noy-Meir, I. 1975. Stability of grazing systems: An approach of predator-prey graphs. Journal of Ecology 63:459-481.
[NRC] National Research Council. 1994. Rangeland health: new methods to classify, inventory, and monitor rangelands. Washington, DC, USA: National Academy Press.
Nusser, S.M. and J.J. Goebel. 1997. The National Resources Inventory: a long-term multi-re-source monitoring programme. Environmental and Ecological Statistics 4:181-204.
O’Brien, R.A., C.M. Johnson, A.M. Wilson, and V.C. Elsbernd. 2003. Indicators of rangeland health and functionality in the Intermountain West. RMRS-GTR-104. Ogden, UT, USA: USDA Forest Service Rocky Mountain Research Station.
Ohlrogge, J., D. Allen, B. Berguson, D. DellaPenna, Y. Shachar-Hill, and S. Stymne. 2009. Driving on biomass. Science 324:1019-1020.
Overpeck, J. and B. Udall. 2010. Dry times ahead. Science 328:1642-1643.
Owensby, C.E., J.M. Ham, A.K. Knapp, and L.M. Auen. 1999. Biomass production and spe-cies composition change in a tallgrass prairie ecosystem after long-term exposure to elevated atmospheric CO2. Global Change Biology 5:497-506.
Perlack, R.D., L.L. Wright, A.F. Turhollow, R.L. Graham, B.J. Stokes, and D.C. Erbach. 2005. Biomass as feedstock for a bioenergy and bioproducts industry: the technical feasibility of a billion-ton annual supply. ORNL/TM-2005/66. Oak Ridge National Laboratory, Oak Ridge, TN, USA. Available at: http://www.osti.gov/bridge/

Chapter Four | Criterion 3: Maintenance of Rangeland Productive Capacity
167
Peterjohn, B.G. 1994. The North American Breeding Bird Survey. Birding 26:386-398.
Peters, D., B. Bestelmeyer, E. Fredrickson, J. Herrick, C. Monger, and K. Havstad. 2006. Disentangling complex landscapes: new insights to forecasting arid and semiarid system dynamics. Bioscience 56:491-501.
Peters, D., R. Pielke, B. Bestelmeyer, C. Allen, S. Munson-McGee, and K. Havstad. 2004. Cross-scale interactions, nonlinearities, and forecasting catastrophic events. Proceedings of the National Academy of Sciences 101:15130-15135.
Potter, C.S., J.T. Randerson, C.B. Field, P.A. Matson, P.M. Vitousek, H.A. Mooney, and S.A. Klooster. 1993. Terrestrial ecosystem production: A process model based on global satellite and surface data. Global Biogeochemical Cycles 7:811-841.
Prince, S.D. and S.N. Goward. 1995. Global Primary Production: A Remote Sensing Approach. Journal of Biogeography 22:815-835.
Rambal, S. 2001. Hierarchy and productivity of Mediterranean-type ecosystems, p.315-344. In: J. Roy, B. Saugier, and H.A. Mooney (eds.).Terrestrial Global Productivity. San Diego, CA, USA: Academic Press.
Ramsey, W. 1985. Bioenergy and economic development: planning for biomass energy programs in the Third World. Boulder, CO, USA: Westview Press.
Reader, J. 1988. Man on Earth. Austin, TX, USA: University of Texas Press.
Reeder, J.D., C.D. Franks, and D.G. Milchunas. 2001. Root biomass and microbial processes, p.139-166. In: R.F. Follett, J.M. Kimble, and R. Lal (eds.). The potential of U.S. grazing lands to sequester carbon and mitigate the greenhouse effect. Boca Raton, FL, USA: Lewis Publishers.
Reeves, M.C., J.C. Winslow, and S.W. Running. 2001. Mapping weekly rangeland vegetation productivity using MODIS algorithms. Journal of Range Management 54:A90-A105.
Rietkerk, M., S.C. Dekker, P.C. Rutler, and J. van de Koppel. 2004. Self-organized patchiness and catastrophic shifts in ecosystems. Science 305:1926-1929.
Rietkerk, M., P. Ketner, L. Stroosnijder, and H.H.T. Prins. 1996. Sahelian rangeland develop-ment; a catastrophe? Journal of Range Management 49:512-519.
Rollins, M.G. and C.K. Frame. 2006. The LANDFIRE Prototype Project: nationally consistent and locally relevant geospatial data for wildland fire management. General Technical Report RMRS-GTR-175. Rocky Mountain Research Station, Fort Collins, CO, USA: USDA Forest Service Rocky Mountain Research Station.
Rotenberg, E. and D. Yakir. 2010. Contribution of semi-arid forests to the climate system. Science 327:451-454.
Roy, J., B. Saugier, and H.A. Mooney (eds.). 2001. Terrestrial global productivity. San Diego, CA, USA: Academic Press.
Running, S.W., D.D. Baldocchi, D.P. Turner, S.T. Gower, P.S. Bakwin, and K.A. Hibbard. 1999. A global terrestrial monitoring network integrating tower fluxes, flask sampling, ecosystem modeling and EOS satellite data. Remote Sensing of Environment 70:1:108-127.

168
Chapter Four | Criterion 3: Maintenance of Rangeland Productive Capacity
Running, S.W., N.R. Ramakrishna, F.A. Heinsch, M. Zahao, M. Reeves, and H. Hashimoto. 2004. A continuous satellite-derived measure of global terrestrial primary production. BioScience 54:547-560.
Sala, O. 2001. Productivity of temperate grasslands, p.285-300. In: J. Roy, B. Saugier, and H.A. Mooney (eds.). Terrestrial Global Productivity. San Diego, CA, USA: Academic Press.
Sala, O. and A. Austin. 2000. Methods of estimating aboveground net primary production, p.31-43. In: O. Sala, R. Jackson, H. Mooney, and R. Howarth (eds.). Methods in ecosystem science. New York, NY, USA: Springer-Verlag.
Sala, O.E., W.J. Parton, L.A. Joyce, and W.K. Lauenroth. 1988. Primary production of the central grassland region of the United States: spatial pattern and major controls. Ecology 69:40-45.
Samuels, M.L. and J.L. Betancourt. 1982. Modeling the long-term effects of fuelwood harvests on pinyon-juniper woodlands. Environmental Management 6:505-515.
Scheffer, M., S.C. Carpenter, J. Foley, C. Folke, and B.H. Walker. 2001. Catastrophic shifts in ecosystems. Nature 413:591-596
Schimel, D. 2010. Drylands in the earth system. Science 327:418-419.
Scurlock, J.M.O., W. Cramer, R.J. Olsen, W.J. Parton, and S.D. Prince, 1999. Terrestrial NPP: Towards a consistent data set for global model evaluation. Ecological Applications 9:913-919.
Sellers, P.J. 1985. Canopy reflectance, photosynthesis and transpiration. International Journal of Remote Sensing 6:1335-1372.
Shantz, H. 1954. The place of grasslands in the earth’s cover. Ecology 35:143-145.
Shields, D.J., I.M. Martin, and M.A. Haefle. 2002. Survey results of the American public’s val-ues, objectives, beliefs, and attitudes regarding forests and grasslands: a technical document supporting the 2000 USDA Forest Service RPA Assessment. RMRS-GTR-95. Fort Collins, CO, USA: USDA Forest Service Rocky Mountain Research Station.
Springfield, H.W. 1976. Characteristics and management of southwestern pinyon-juniper ranges: the status of our knowledge. Research Paper RM-160. Fort Collins, CO, USA: USDA Forest Service Rocky Mountain Research Station.
Stoms, D.M. and W.W. Hargrove. 2001. Potential NDVI as a baseline for monitoring ecosystem functioning. International Journal of Remote Sensing 21:401-407.
Task Group on Unity in Concepts and Terminology. 1995. New concepts for assessment of rangeland condition. Journal of Range Management 48:271-282.
Tilman, D., J. Hill, and C. Lehman. 2006. Carbon-negative biofuels form low-input high-diver-sity grassland biomass. Science 314:1598-1600.
Tilman, D., D. Wedin, and J. Knops. 1996. Productivity and sustainability influenced by biodi-versity in grassland ecosystems. Nature 379:718-720.
Tucker, C.J., C.L. Vanpraet, M.J. Sharman, and G. Van Ittersum. 1985. Satellite remote sensing of total herbaceous biomass production in the Senegalese Sahel: 1980-1984. Remote Sensing of Environment 17:233-249.

Chapter Four | Criterion 3: Maintenance of Rangeland Productive Capacity
169
Tucker, C.J., J.E. Pinzon, and M.E. Brown. 2004. Global Inventory Modeling and Mapping Studies (GIMMS) satellite drift corrected and NOAA-16 incorporated normalized difference vegetation index (NDVI), Monthly 1981-2003. Global Land Cover Facility, University of Maryland, College Park, MD, USA.
Tucker, C.J., J.E. Pinzon, M.E. Brown, D. Slayback, E.W. Pak, R. Mahoney, E. Vermote, and N. El Saleous. 2005. An extended AVHRR 8-km NDVI data set compatible with MODIS and SPOT Vegetation NDVI data. International Journal of Remote Sensing 26:4485-5598.
[UNEP] United Nations Environment Programme. 1992. World Atlas of Desertification. London, UK: Edward Arnold.
USDA Forest Service. 1990. Resource inventory handbook. FSH 1909.14. Washington, DC, USA: USDA Forest Service.
USDA Forest Service. 2004. National report on sustainable forests: 2003. FS-766. Washington, DC, USA: USDA Forest Service.
[USDA NRCS] USDA Natural Resources Conservation Service. 1997. America’s private land: a geography of hope. Washington, DC, USA: Government Printing Office.
Van Auken, O.W. 2000. Shrub invasions of North American semiarid grasslands. Annual Review of Ecology and Systematics 31:197-215.
Wade, T.G., B.W. Schultz, J.D. Wickham, and D.F. Bradford. 1998. Modeling the potential spatial distribution of beef cattle grazing using a Geographic Information System. Journal of Arid Environments 38:325-334.
Walsh, M.E., D.G. De La Torre Ugarte, H. Shapouri, and S.P. Slinsky. 2003. Bioenergy crop production in the United States. Environmental and Resource Economics 24:313-333.
Washington-Allen, R.A., R.D. Ramsey, and N.E. West. 2004. Spatiotemporal mapping of the dry season vegetation response of sagebrush steppe. Community Ecology 5:69-79.
Washington-Allen, R.A., R.D. Ramsey, N.E. West, and R.A. Efroymson. 2006. A remote sensing-based protocol for assessing rangeland condition and trend. Rangeland Ecology & Management 59:19-29.
Washington-Allen, R.A., R.D. Ramsey, N.E. West, and B.E. Norton. 2008. Quantification of the ecological resilience of drylands using digital remote sensing. Ecology and Society 13(1): 33. [online] URL: http://www.ecologyandsociety.org/vol13/iss1/art33/
Washington-Allen, R.A., N.E. West, R. Douglas Ramsey, D.K. Phillips, and H.H. Shugart. 2009. Retrospective assessment of soil stability on a landscape subject to commercial grazing. Environmental Monitoring and Assessment: [online] DOI 10.1007/s10661-008-0661-3
Weaver, J.E. and N.W. Rowland. 1952. Effects of excessive mulch on development, yield and structure of native grassland. Botanical Gazette 114:1-19.
Westoby, M., B.H. Walker, and I. Noy-Meir, 1989. Opportunistic management for rangelands not at equilibrium. Journal of Range Management 42:265-273.
Winter, M. and J. Faaborg. 1999. Patterns of area sensitivity in grassland-nesting birds. Conservation Biology 13:1424-1436.

170
Chapter Four | Criterion 3: Maintenance of Rangeland Productive Capacity
Xiao, J., Q. Zhuang, D.D. Baldocchi, B.E. Law, A.D. Richardson, J. Chen, R. Oren, G. Starr, A. Noormets, S. Ma, S.B. Verma, S. Wharton, S.C. Wofsy, P.V. Bolstad, S.P. Burns, D.R. Cook, P.S. Curtis, B.G. Drake, M. Falk, M.L. Fischer, D.R. Foster, L. Gu, J.L. Hadley, D.Y. Hollinger, G.G. Katul, M. Litvak, T.A. Martin, R. Matamala, S. McNulty, T.P. Meyers, R.K. Monson, J.W. Munger, W.C. Oechel, K.T.P. U, H.P. Schmid, R.L. Scott, G. Sun, A.E. Suyker, and M.S. Torn. 2008. Estimation of net ecosystem carbon exchange for the conter-minous United States by combining MODIS and AmeriFlux data. Agricultural and Forest Meteorology 148:1827-1847.
Zhao, M. and S.W. Running. 2010. Drought-indiced reduction in global terrestrial net primary productivity production from 2000 to 2009. Science 329:940-943.
Zhao, M., F.A. Heinsch, R.R. Nemani, and S.W. Running. 2005. Improvements of the MODIS terrestrial gross and net primary production global data set. Remote Sensing of Environment 95:164-175.
Zimmermann, N.E., R.A. Washington-Allen, R.D. Ramsey, M.E. Schaepman, L. Mathys, B. Koetz, M. Kneubuehler, T.C. Edwards. 2007. Modern remote sensing for environmental monitoring of landscape states and trajectories, p. 65-91. In: F. Kienast, O. Wildi, and S. Ghosh (eds.). A changing world: challenges for landscape research. Landscape Series, Vol. 8. Springer, New York, NY, USA.