Embed Size (px)
Citation preview

Criteria, potentials and costs of forestry activities to sequester carbon within theframework of the clean development mechanism

2 Alterra-rapport 777
Criteria, potentials and costs of forestry activities to sequestercarbon within the framework of the clean developmentmechanism
M.J. WaterlooP.H. SpiertzH. DiemontI. EmmerE. AaldersR. Wichink-KruitP. Kabat
Alterra-rapport 777
Alterra, Green World Research, Wageningen, 2003

4 Alterra-rapport 777
ABSTRACT
Waterloo, M.J., P.H. Spiertz, H. Diemont, I. Emmer, E. Aalders, R. Wichink-Kruit & P. Kabat,2003. Criteria, potentials and costs of forestry activities to sequester carbon within the framework of the cleandevelopment mechanism. Wageningen, Alterra, Green World Research. Alterra-rapport 777. 136pp.; 12 figs.; 60 tables; 13 refs.
Forest activities in developing countries can be used to sequester carbon for gaining emissionreductions within the Clean Development Mechanism of the Kyoto Protocol. This study hasassessed the potentials and costs for carbon sequestration through afforestation, reforestationand deforestation activities and how these are affected when certain criteria for eligibility areapplied. The criteria address issues of additionality, permanence, socio-economic andenvironmental sustainability, compliance and verification, which are of major importance forthe successful implementation of forestry projects in the Clean Development Mechanism.Application of the criteria results in a substantial decrease in the carbon sequestration potentialand an increase in the project costs.
Keywords: CDM, carbon, sink, afforestation, deforestation, additionality, permanence, leakage
ISSN 1566-7197
This report can be ordered by paying € 26,- into bank account number 36 70 54 612 in thename of Alterra, Wageningen, the Netherlands, with reference to rapport 777. This amount isinclusive of VAT and postage.
© 2003 Alterra, Green World Research,P.O. Box 47, NL-6700 AA Wageningen (The Netherlands).Phone: +31 317 474700; fax: +31 317 419000; e-mail: [email protected]
No part of this publication may be reproduced or published in any form or by any means, or storedin a data base or retrieval system, without the written permission of Alterra.
Alterra assumes no liability for any losses resulting from the use of this document.
Project 11566.01 [Alterra-rapport 777/HM/07-2003]

Contents
1 Executive summary 71.1 Introduction 71.2 Definition of criteria and their impact on sinks and costs 81.3 Calculation procedures and assumptions 111.4 Af-/reforestation 121.5 Forest conservation 161.6 Conclusions 19
2 Background 21
3 Methods and data sources 253.1 Definitions 253.2 Area assumptions for the calculation of Carbon fixation. 26
3.2.1 Af-/reforestation projects 26Region 26
3.2.2 Forest conservation projects 273.2.3 Forest conservation scenarios 29
3.3 Influence of criteria on available areas 333.4 Project success rates and sink potentials 343.5 Carbon sequestration and emission calculations 343.6 Cost calculation procedures 37
3.6.1 Operational costs 373.6.2 Transaction costs 393.6.3 Certification costs 393.6.4 Projection of present costs estimates to the future 40
4 Principles and criteria inventory for CDM projects 414.1 Selection of principles and criteria 41
4.1.1 Climate Convention and the Kyoto Protocol 424.1.2 Forestry Institutes 434.1.3 Other institutes 44
4.1.3.1 Sinks and GHG abatement project criteria 444.1.3.2 National (Dutch) criteria 454.1.3.3 International organisations 45
4.2 Generic set of criteria 464.2.1 Project framework 464.2.2 Additionality 474.2.3 Verifiability 484.2.4 Compliance 484.2.5 Environmental sustainability 494.2.6 Socio-economic sustainability 494.2.7 Sustainable forest management 494.2.8 Transparency 50
4.3 Overview of generic criteria 50
5 In-depth project and case studies. 535.1 Introduction 53

6 Alterra-rapport 777
5.2 Cost calculations 535.3 Certification 555.4 Eligibility criteria as cost factors 565.5 Effect of criteria on potential project area 565.6 Programa FACE de Forestacíon project (PROFAFOR), Ecuador. 575.7 Uganda, UWA-Face project titled Rehabilitation of Mt. Elgon and Kibale
National Parks. 595.8 Malaysia 61
5.8.1 Cost scenarios for carbon storage by preventing deforestation inMalaysia 61
5.8.1.1 Introduction 615.8.1.2 Forest categories in Malaysia 615.8.1.3 Forest areas in Malaysia 625.8.1.4 Sustainable Forest Management third party certification 635.8.1.5 Costs of sustainable forest management certification 635.8.1.6 Scenario`s 645.8.1.7 Conclusions 65
6 Carbon sequestration and costs. 676.1 Af-/reforestation 676.2 Forest conservation. 72
7 Conclusions 79
Literature 83

Alterra-rapport 777 7
1 Executive summary
1.1 Introduction
The Clean Development Mechanism (CDM) has been defined in Article 12 of theKyoto Protocol to promote sustainable development in non-Annex I countries(mostly developing countries) and to assist Annex I Parties to achieve compliancewith their emission limitation and reduction commitments. Terrestrial sink activitiesmay be implemented in the form of af-, reforestation and deforestation (ARD)projects or forest conservation projects. It is yet uncertain if the use of terrestrial sinkprojects in non-Annex 1 countries to reduce or offset carbon emissions from landuse change may be included in the CDM. A decision on this issue will presumably betaken at COP6-bis in Bonn, July 2001. Allowing such terrestrial sink activities couldstimulate environmental protection and forest conservation measures through privateinvestments in developing countries and have positive effects on biodiversity, waterresources, erosion control and local and regional climate. However, it is often voicedthat the large potential for C-sequestration and the relatively low costs may lead to adevaluation of the Kyoto Protocol, especially for the first commitment period withit’s low target reductions (5% decrease as compared to 1990 emission levels). Otherobjections against implementation of sink activities within the CDM to obtain CERsrelate to:• Permanence and risks of sink activities• Uncertainties and scale: sink capacity and socio-economic processes• Definition of baselines and additionality requirements• Leakage across project, regional and country boundaries• Accounting and accounting methods: monitoring and verifiability.• Sustainable development: environmental and socio-economic,• Capacity-building and technology transfer• Political stability and liability factors• Sovereignty issues
Some of the concerns surrounding these issues may be addressed by defining criteriato which sink projects need to adhere in order to become eligible. The present studydefines such a set of criteria and provides information on how these criteria andconditions may affect Carbon sequestration rates and project costs. Strict applicationof such criteria to sink activities may provide an instrument to reduce or eliminatenegative effects of the inclusion of sink activities in the CDM.
The goal of this study was:
1. to develop a set of criteria and conditions for terrestrial sink projects within theCDM, based on existing international guidelines
2. to study the effect of the adoption of such criteria on C-sequestration potentialsand costs of several existing projects.
8 Alterra-rapport 777
3. to estimate C-sequestration potentials and costs of sink projects in a limitednumber of developing countries for a number of afforestation, reforestation andforest conservation scenarios and with and without adoption of criteria.
This study deals with Afforestation, Reforestation and Deforestation (ARD)activities only. The country list includes results for 68 developing countries, as well asinformation on the following regions: Central America/Caribbean, Africa, Asia,South America and Oceania.
1.2 Definition of criteria and their impact on sinks and costs
Eight generic criteria were derived after studying 14 sets of guidelines and criteriaused by international organisations for forestry related projects. These sets included:the United Nations Framework Convention on Climate Change, Kyoto Protocol,Center for International Forestry Research, International Tropical TimberOrganisation, Forest Stewardship Council, Pan European Forest Certification,Carbon Offset Verification, Federation Internationale Pour L’Isolmente du Carbone,Montreal Process Working Group, World Wildlife Fund, Convention on BiologicalDiversity, Global Environment Facility, Intergovernmental Panel on Climate Changeand several Dutch policy papers. The criteria are described briefly below.
1. Project framework. This defines a comprehensive policy, planning andinstitutional framework in place throughout the project lifetime. The frameworkincludes a management plan, details on funding, project duration, team and staffcomposition, implementation of measuring, accounting, monitoring and verifyingsystems, compliance, use rights and responsibilities, etc. It also forms the basisfor the implementation of other criteria.
2. Additionality. Additionality is a key criterion for CDM projects due to the factthat the host countries do not have emission reduction targets themselves. Assuch, CDM projects can create new emission allowances for Annex 1 countries,which should be balanced by reductions in the non-Annex I host country forcarbon neutrality reasons. Enforcing the additionality criterion should guaranteethat projects can not claim certified emission reductions unless demonstratedthat the claimed project’s emission reductions are indeed ‘additional’ to the‘business as usual’ scenario in the host country. CDM projects should perhapsalso be additional in financial terms to ensure that they would not have happenedin the ‘business as usual’ scenario and to avoid subsidising commercially viablebusiness activities.
3. Verifiability. The verification and monitoring of CDM sink projects requireseffective monitoring and control systems. Special emphasis should be placed onthe determination of leakage and the risks and uncertainties at project level(permanence issue). The verifiability criterion guarantees a successfulimplementation of verification and monitoring methodology that is able tomeasure and determine the actual sequestered carbon, uncertainties, leakage andassociated impacts.
Alterra-rapport 777 9
4. Compliance. The projects should be compliant with international, national andlocal regulations and treaties and should be accepted voluntarily by the hostcountries. This criterion may also be used to solve sovereignty issues (i.e.compliance with national laws regarding landownership).
5. Environmental sustainability. The project activities should be environmentallysustainable, i.e. negative impacts on the ecosystem and its functioning should beavoided. This implies that an environmental management plan should be in place(part of project framework in point 1) that ensures that the activities undertakenby the project do not cause a deterioration of the soil structure and fertility, waterresources and biological activity (fauna, flora) within or outside the project area.Environmentla sustainability may also involve the use of native tree species andavoiding monocultures.
6. Socio-economic sustainability. The project should minimise negative effectson local communities, their activities, their resources and their cultural values.Projects should encourage employment and training of local people and promotetechnology/knowledge transfer and capacity building.
7. Sustainable forest management. Sustainable forest management aims for theprotection, conservation and restoration of natural forests and sustainablemanagement of plantations. Furthermore it should conserve or contribute tobiological diversity and strive toward economic viability.
8. Transparency. This should guarantee reproducible results from measurementand monitoring methods and give insight into the methodology. It should alsoguarantee insight into project progress, project impacts and results, managementand funding to the UNFCCC, the concerned parties and everyone who isinterested.
The criteria deal with key project elements such as project formulation, riskreduction, knowledge transfer and capacity building, competence, infrastructure,socio-economic, political, sovereignty and environmental factors, accounting andverification methods, leakage, permanence and credit sharing. Strict adherence tothese criteria by projects would therefore:- minimise the risk of project failure- provide guarantees relating to the permanence of the sink (e.g. through socio-
economic and environmental sustainability)- affect the scale of the sink capacity- ensure additionality and eligibility for receiving CERs- ensure proper project management- provide technology transfer, training and capacity building- minimise and account for leakage at the project level and to a lesser extend on a
regional level- resolve sovereignty issues
Two projects of the Dutch FACE Foundation in Uganda and Ecuador were selectedfor studying the impact of criteria on their performance and costs.
In our study, the adoption of criteria has a large impact on both the sink capacity(through the land available for sink activities) and on the costs of carbon

10 Alterra-rapport 777
sequestration. The criteria reduce the scale of potential forestry sector CDM projectsby a magnitude of about 10. In view of the high failure rates of World Bank projectsin developing countries (20-90%; Niles, 2000) we believe that adopting the presentlydefined set of criteria for CDM projects may reduce the risk of failure, increase thechances of projects being eligible for receiving CERs and may go a long way intoproviding some guarantees for the permanence of the sinks. One of theconsequences of adhering to the set of criteria is that projects become moreexpensive. The risk of failure can be minimised further by only allowing projects thatare explicitly requested by the local community.
The adoption of criteria affects both the potentially available area and project costs.For instance, the FACE Foundation has visited 14 countries to assess their potentialfor hosting projects. Criteria adopted for the identification of projects includedadditionality, cost-efficiency and social acceptability. In addition, projects had to fit inthe regional planning. Only 36% of the potential projects passed these criteria andwere implemented. Socio-economic factors dominate the area reduction associatedwith the application of criteria. For instance, land tenure appears as a major factoraffecting implementation of projects because land titles are often not in the hands ofpeople using the land. Furthermore, there are often pressures on the use of the landfor food production or more profitable cash crops than trees. For af-/reforestationactivities, the conditions of sustainable forest management and environmentalsustainability put further constraints on the area available to projects. With the moreelaborate set of criteria developed in the present study, a further reduction in thepotential project area, and therefore in the Carbon sink capacity, can be expected.However, as said before, the application of these criteria will also improve upon theproject failure rates, which may be as high as 90% in some of the developingcountries (Niles, 2000).
Three factors determine the project costs for C sequestration, i.e. 1) the costs perhectare for af-/reforestation or forest conservation, 2) the capacity and rate ofsequestration as compared to the baseline and 3) the method used for the accountingof the certified offset. If based on the maximum C sequestration capacity of theforests, the afforestation costs for the various FACE projects range from 2.2 to 25.7US$ per tonne C. The length of the accounting period influences project costs, asshown in Table 1 for five FACE projects in The Netherlands, Czech Republic,Uganda, Ecuador and Malaysia.
Table 1. Cost assessment in US$ per tonne C of FACE sequestration forests, in relation to the length of theaccounting period. (values based on reforestation achieved until the end of 1999)
Capacity-based A 1991-2012 2008-2012 B 2001 C-2012All projects 5.50 14.70 18.35Tropics (CDM) 3.70 33.05 9.20
A: Quotient of total costs over end-capacity; B: Commitment period; C: start date forCDM accountability.
Project costs include Preparation cost (launch of implementing body, host country andproject identification, monitoring system), Operational costs (planting, infrastructure,
Alterra-rapport 777 11
project framework, research and training), Transaction costs (preparation, certificationand sale) and Certification costs (monitoring, costs incurred by the certifyingorganisation, supervision by implementing body). The operational costs aredominated by the project framework costs, whereas the Compliance, Verification andTransparency criteria dominate the transaction costs. Certification costs aredependent on the precision level required and may vary depending on the size andhomogeneity of the area.
1.3 Calculation procedures and assumptions
The CDMFSM model (Version 2.01; Waterloo et al., 2001), developed by Alterrawithin the scope of this study, was used to estimate the area available to projects,total carbon sequestration potentials and costs for a number of developing countries.A short overview of the procedures used is given below. A more extensive overviewcan be found in the manual to the CDMFSM model (Waterloo et al., 2001).
For af-/reforestation, the potential planting area for CDM af-/reforestation activitiesis assumed to be between 3-4% of the agricultural area (Nilsson and Schopfhauser,1995). However, for additionality reasons CDM projects should result in an increasein the current planting rates on land available for CDM projects (i.e. excludingplanting on land deforested after 1990 which cannot be used under the Kyotoprotocol). The following assumptions were made:- The current planting rates on for CDM available land (i.e. not including planting on
land deforested after 1990) amount to 35% of the overall country planting rates(FAO, 2000).
- The biomass (and therefore carbon content) of the forest was assumed to follow anS-shaped growing curve over the period of a rotation (Cooper, 1983).
- The maximum plantation biomass was assumed to be double the country forestbiomass (average 146 t ha -1; FAO, 2000).
- Increase in soil carbon assumed at 30% of that in biomass (Nilsson andSchopfhauser, 1995).
- The rotation length was assumed to be 35 years.- Harvesting at the end of the rotation would result in a return of 80% of the carbon
stored to the atmosphere.- The current country planting rate (FAO, 2000) would increase by 25% as a result of
CDM activities.- Planting would have started in 2000.
The sink value is calculated by multiplying the biomass at a certain time with a factorfor conversion of dry weight to carbon (0.5: IPCC/OECD/IEA, 1996) andcorrecting for storage in soil and losses to the atmosphere during harvesting. Theresult is multiplied with a cost factor to obtain total costs. Criteria and countryproject success rates influence both the potential areas and costs.
Forest conservation projects in CDM should result in a lowering of local, regionaland country-wide deforestation rates. The maximum area available for forest
12 Alterra-rapport 777
conservation projects is therefore represented by the annual deforestation rate.However, it is not realistic to assume under the present political and socio-economical conditions that the deforestation rate can be reduced to zero. Wetherefore assume that a certain percentage of the annualy deforested area would beavailable for conservation. The following options are used:- A deforestation reduction efficiency is calculated form the GNP, the deforestation
rate and the population density (see CDMFSM V2.01 user manual for details) witha maximum of 20%. The regional reductions obtained range from 0.6% for Asia to4.7% for Oceania.
- The deforestation rate is assumed to be reduced by a fixed percentage (1% and 5%of the deforestation rate).
The sink created by reducing deforestation is calculated as the avoided loss of carbonin the biomass and soil. Both area and sink are affected by adoption of the criteria orproject success rates. The starting year for CDM activities was taken as 2000.
1.4 Af-/reforestation
The total area under plantations in the selected countries amounts to 115 Mha. Thecurrent regional planting rates range between 0.01 Mha in Oceania to 3.4 Mha inAsia, with the largest planting occurring in India (1.5 Mha) and China (1.1 Mha). Thecombined annual planting rate for all selected countries is 4.1 Mha (worldwide=4.5Mha yr-1). This planting rate can be considered a baseline level with respect toadditionality. The present study estimates that the area potentially available forafforestation is 3-4% of the agricultural area. For our 70 countries this amounts to 86Mha without adopting any criteria and is reduced to 7 Mha when all criteria areadopted. Taking the current rate of planting into account and assuming a 25%increase of the current planting rate due to CDM, the potential area for ‘additional’af-/reforestation is 24 Mha over a 100-year period or 10 Mha for the first 12 years.This results in a potential sink of 95 Mt C in the first commitment period withbanking from 2002 onwards, or 61 Mt C without banking. This sink, however, hasthen to be corrected for project failures, reducing it to 45 Mt C and 29 Mt C for thefirst commitment period, respectively.
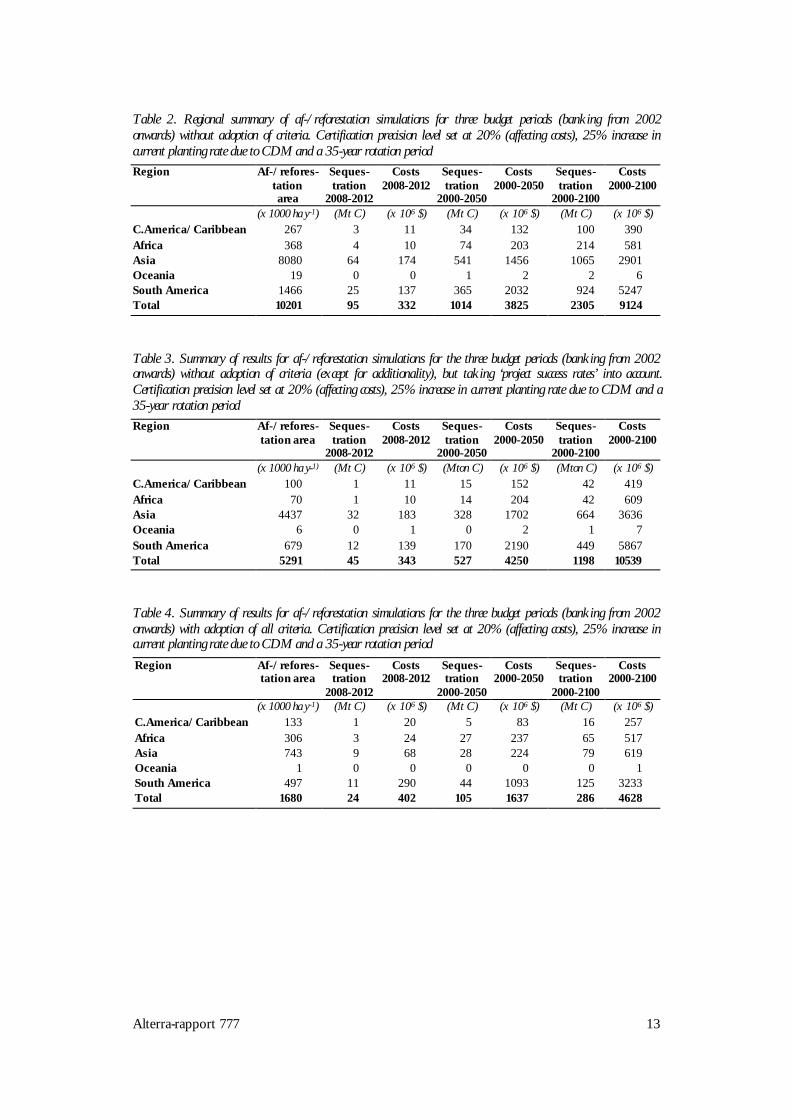
In the simulations, of which only the regional values are presented below, we used amaximum of 1 Mha yr-1 planting rate (corresponding with a 25% increase in planting)within the framework of CDM projects (no criteria selected and only until potentialarea is planted). Overviews of the results for several simulations are given in Table 2– Table 8, whereas a plot of the carbon sequestration pattern over a 100-year periodis shown in Figure 1.
Alterra-rapport 777 13
Table 2. Regional summary of af-/reforestation simulations for three budget periods (banking from 2002onwards) without adoption of criteria. Certification precision level set at 20% (affecting costs), 25% increase incurrent planting rate due to CDM and a 35-year rotation periodRegion Af-/refores-
tationarea
Seques-tration
2008-2012
Costs2008-2012
Seques-tration
2000-2050
Costs2000-2050
Seques-tration
2000-2100
Costs2000-2100
(x 1000 ha y -1) (Mt C) (x 106 $) (Mt C) (x 106 $) (Mt C) (x 106 $)C.America/Caribbean 267 3 11 34 132 100 390Africa 368 4 10 74 203 214 581Asia 8080 64 174 541 1456 1065 2901Oceania 19 0 0 1 2 2 6South America 1466 25 137 365 2032 924 5247Total 10201 95 332 1014 3825 2305 9124
Table 3. Summary of results for af-/reforestation simulations for the three budget periods (banking from 2002onwards) without adoption of criteria (except for additionality), but taking ‘project success rates’ into account.Certification precision level set at 20% (affecting costs), 25% increase in current planting rate due to CDM and a35-year rotation periodRegion Af-/refores-
tation areaSeques-tration
2008-2012
Costs2008-2012
Seques-tration
2000-2050
Costs2000-2050
Seques-tration
2000-2100
Costs2000-2100
(x 1000 ha y-1) (Mt C) (x 106 $) (Mton C) (x 106 $) (Mton C) (x 106 $)C.America/Caribbean 100 1 11 15 152 42 419Africa 70 1 10 14 204 42 609Asia 4437 32 183 328 1702 664 3636Oceania 6 0 1 0 2 1 7South America 679 12 139 170 2190 449 5867Total 5291 45 343 527 4250 1198 10539
Table 4. Summary of results for af-/reforestation simulations for the three budget periods (banking from 2002onwards) with adoption of all criteria. Certification precision level set at 20% (affecting costs), 25% increase incurrent planting rate due to CDM and a 35-year rotation periodRegion Af-/refores-
tation areaSeques-tration
2008-2012
Costs2008-2012
Seques-tration
2000-2050
Costs2000-2050
Seques-tration
2000-2100
Costs2000-2100
(x 1000 ha y -1) (Mt C) (x 106 $) (Mt C) (x 106 $) (Mt C) (x 106 $)C.America/Caribbean 133 1 20 5 83 16 257Africa 306 3 24 27 237 65 517Asia 743 9 68 28 224 79 619Oceania 1 0 0 0 0 0 1South America 497 11 290 44 1093 125 3233Total 1680 24 402 105 1637 286 4628

14 Alterra-rapport 777
Table 5. Summary of results for af-/reforestation simulations for the three budget periods (no banking) withadoption of all criteria. Certification precision level set at 20% (affecting costs), 25% increase in current plantingrate due to CDM and a 35-year rotation periodRegion Af-/refores-
tation areaSeques-tration
2008-2012
Costs2008-2012
Seques-tration
2000-2050
Costs2000-2050
Seques-tration
2000-2100
Costs2000-2100
(x 1000 ha y -1) (Mt C) (x 106 $) (Mt C) (x 106 $) (Mt C) (x 106 $)C.America/Caribbean 133 1 13 5 83 16 257Africa 306 2 15 27 237 65 517Asia 743 5 42 28 224 79 619Oceania 1 0 0 0 0 0 1South America 497 6 167 44 1093 125 3233Total 1680 14 237 105 1637 286 4628
Figure 1. Carbon sequestration of af-/reforestation projects for different regions. Assuming a 25% increase inplanting rates, a 35-year rotation period and all criteria adopted
Table 6. Summary of results for af-/reforestation simulations for the three budget periods (banking from 2002onwards) with adoption of all criteria. Certification precision level set at 20% (affecting costs), 10% increase incurrent planting rate due to CDM instead of 25% and a 35-year rotation periodRegion Af-/refores-
tation areaSeques-tration
2008-2012
Costs2008-2012
Seques-tration
2000-2050
Costs2000-2050
Seques-tration
2000-2100
Costs2000-2100
(x 1000 ha y -1) (Mt C) (x 106 $) (Mt C) (x 106 $) (Mt C) (x 106 $)C.America/Caribbean 55 1 9 3 42 8 124Africa 128 1 10 15 118 31 254Asia 464 5 39 17 129 49 365Oceania 1 0 0 0 0 0 0South America 264 5 143 23 565 65 1697Total 912 12 200 57 854 153 2439
0
50
100
150
200
250
300
1 6 11 16 21 26 31 36 41 46 51 56 61 66 71 76 81 86 91 96
Time (years)
Car
bo
n s
equ
este
red
(Mt)
South AmericaOceaniaAsiaAfricaC. America/Caribbean

Alterra-rapport 777 15
Table 7. Summary of results for af-/reforestation simulations for the three budget periods (banking from 2002onwards) with adoption of all criteria. Certification precision level set at 20% (affecting costs), 25% increase incurrent planting rate due to CDM instead of 25% and a 10-year rotation periodRegion Af-/refores-
tation areaSeques-tration
2008-2012
Costs2008-2012
Seques-tration
2000-2050
Costs2000-2050
Seques-tration
2000-2100
Costs2000-2100
(x 1000 ha y -1) (Mt C) (x 106 $) (Mt C) (x 106 $) (Mt C) (x 106 $)C.America/Caribbean 133 2 29 6 92 12 187Africa 306 5 36 23 185 48 382Asia 743 5 41 27 207 69 550Oceania 1 0 0 0 0 0 1South America 497 15 402 44 1145 92 2339Total 1680 27 508 100 1630 221 3458
Table 8. Summary of results for af-/reforestation simulations for the three budget periods (banking from 2002onwards) with adoption of all criteria. Certification precision level set at 20% (affecting costs), 25% increase incurrent planting rate due to CDM instead of 25% and a 60-year rotation periodRegion Af-/refores-
tation areaSeques-tration
2008-2012
Costs2008-2012
Seques-tration
2000-2050
Costs2000-2050
Seques-tration
2000-2100
Costs2000-2100
(x 1000 ha y -1) (Mt C) (x 106 $) (Mt C) (x 106 $) (Mt C) (x 106 $)C.America/Caribbean 133 1 14 15 242 15 240Africa 306 2 17 55 423 59 441Asia 743 5 42 71 559 76 594Oceania 1 0 0 0 1 0 1South America 497 7 197 112 2909 116 2978Total 1680 16 270 253 4134 265 4254
From the results presented above, it becomes clear that the potential sink for af-/reforestation (Tabel 2) is reduced to a large part when project success rates (Table3) or CDM criteria (Table 4) are taken into account (from a potential 95 Mt C to 24Mt C for the first budget period, including banking). Taking a 10% increase inplanting rates instead of 25% results in a further reduction to 8 Mt C (Table 6),whereas changing rotation lengths results in estimates between 27 Mt C (10-yearrotation) to 16 Mt C (60 year rotation) for the first commitment period (Table 7,Table 8). However, the longer rotation period does lead to higher sequestration inthe long-term (100 Mt C vs. 253 Mt C in 2050) and sustainable forestry will also beeasier to demonstrate than for a short-rotation forest. The relatively lowsequestration rates for the first commitment period reflect the slow growth ofplantations during the first years after planting.
Due to the large size of their agricultural areas and their relatively high planting rates,India, Brazil, Argentina and China have the largest potentials for carbonsequestration through af-/reforestation activities. China also has a positive annualchange in forest (no net deforestation within the country) and may thereforeencounter less problems with accounting for leakage. As a region, Asia seems tooffer the largest potential, followed by South America.

16 Alterra-rapport 777
The costs range from 2.22 (Democratic Republic of Congo) – 8.76 US$ per tonne C(Argentina) (no criteria adopted) to 4.27-46.73 US$ per t C (all criteria adopted). Theregional costs in the latter case range from 7.31 USD per t C for Africa to 28.25 Usdper t C in South America, respectively, using a 20% buffer.
1.5 Forest conservation
During COP6-bis the decision was made that forest conservation projects would notbe eligible for inclusion in the CDM during the first commitment period. Thefollowing may therefore be less relevant to CDM at present than it was when thisreport was written. The annual deforestation rate is 9.5 Mha y-1 for the 70 developingcountries selected in our study. Regional deforestation rates range between 0.1 Mhay-1 for Oceania to 4.7 Mha y -1 for Africa. Deforestation in the South American regionamounts to 3.7 Mha y-1, of which 2.3 Mha y-1 occurs in Brazil alone. The mainproblem with defining a sink potential for forest conservation projects is inestimating how much deforestation rates can be reduced by CDM projects.Additionality (as expressed on a country level) would imply that all CDM forestconservation projects combined would result in reduced deforestation rates for aregion/country as compared to a certain baseline level (e.g. current deforestationrates). For countries with increasing deforestation rates (e.g. Brazil), this would behard to demonstrate.
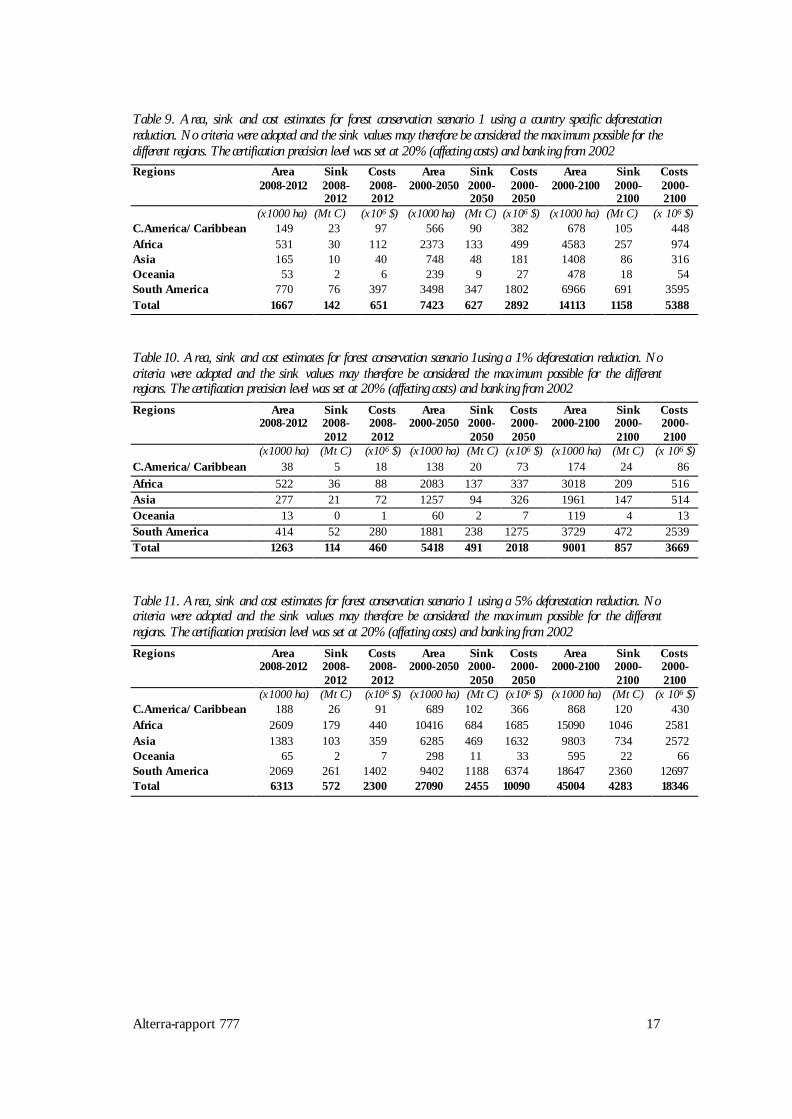
Country specific estimations of the sink and costs are presented in this report for fivedifferent forest conservation scenarios. In this summary, only the regional sink andcost estimates are given for different reductions in deforestation rates (1%, 5% andan assumed, country specific reduction rate), using forest conservation 1 scenario,which is presumably the most realistic. For the calculations it was assumed that afixed percentage of the initial deforestation rate, and therefore a fixed forest area, issaved annually. Relative to the Business As Usual (BAU0) scenario, i.e. the initialdeforestation rate, the total forest area saved is linearly growing each year. Thismeans that the area saved each year is the sum of that saved in the previous year andthe fixed percentage of last year's deforestation rate. The regional country specificdeforestation reduction rate values used in the calculations range from 0.56% forAsia to 4.72% for Oceania. The values used for Brazil and Indonesia, which have thehighest deforestation rates, are 0.39% and 0.03%, respectively. The results ofdifferent options are given in Table 9 – Table 14.
Alterra-rapport 777 17
Table 9. Area, sink and cost estimates for forest conservation scenario 1 using a country specific deforestationreduction. No criteria were adopted and the sink values may therefore be considered the maximum possible for thedifferent regions. The certification precision level was set at 20% (affecting costs) and banking from 2002Regions Area
2008-2012Sink2008-2012
Costs2008-2012
Area2000-2050
Sink2000-2050
Costs2000-2050
Area2000-2100
Sink2000-2100
Costs2000-2100
(x1000 ha) (Mt C) (x106 $) (x1000 ha) (Mt C) (x106 $) (x1000 ha) (Mt C) (x 106 $)C.America/Caribbean 149 23 97 566 90 382 678 105 448Africa 531 30 112 2373 133 499 4583 257 974Asia 165 10 40 748 48 181 1408 86 316Oceania 53 2 6 239 9 27 478 18 54South America 770 76 397 3498 347 1802 6966 691 3595Total 1667 142 651 7423 627 2892 14113 1158 5388
Table 10. Area, sink and cost estimates for forest conservation scenario 1using a 1% deforestation reduction. Nocriteria were adopted and the sink values may therefore be considered the maximum possible for the differentregions. The certification precision level was set at 20% (affecting costs) and banking from 2002Regions Area
2008-2012Sink2008-2012
Costs2008-2012
Area2000-2050
Sink2000-2050
Costs2000-2050
Area2000-2100
Sink2000-2100
Costs2000-2100
(x1000 ha) (Mt C) (x106 $) (x1000 ha) (Mt C) (x106 $) (x1000 ha) (Mt C) (x 106 $)C.America/Caribbean 38 5 18 138 20 73 174 24 86Africa 522 36 88 2083 137 337 3018 209 516Asia 277 21 72 1257 94 326 1961 147 514Oceania 13 0 1 60 2 7 119 4 13South America 414 52 280 1881 238 1275 3729 472 2539Total 1263 114 460 5418 491 2018 9001 857 3669
Table 11. Area, sink and cost estimates for forest conservation scenario 1 using a 5% deforestation reduction. Nocriteria were adopted and the sink values may therefore be considered the maximum possible for the differentregions. The certification precision level was set at 20% (affecting costs) and banking from 2002Regions Area
2008-2012Sink2008-2012
Costs2008-2012
Area2000-2050
Sink2000-2050
Costs2000-2050
Area2000-2100
Sink2000-2100
Costs2000-2100
(x1000 ha) (Mt C) (x106 $) (x1000 ha) (Mt C) (x106 $) (x1000 ha) (Mt C) (x 106 $)C.America/Caribbean 188 26 91 689 102 366 868 120 430Africa 2609 179 440 10416 684 1685 15090 1046 2581Asia 1383 103 359 6285 469 1632 9803 734 2572Oceania 65 2 7 298 11 33 595 22 66South America 2069 261 1402 9402 1188 6374 18647 2360 12697Total 6313 572 2300 27090 2455 10090 45004 4283 18346
18 Alterra-rapport 777
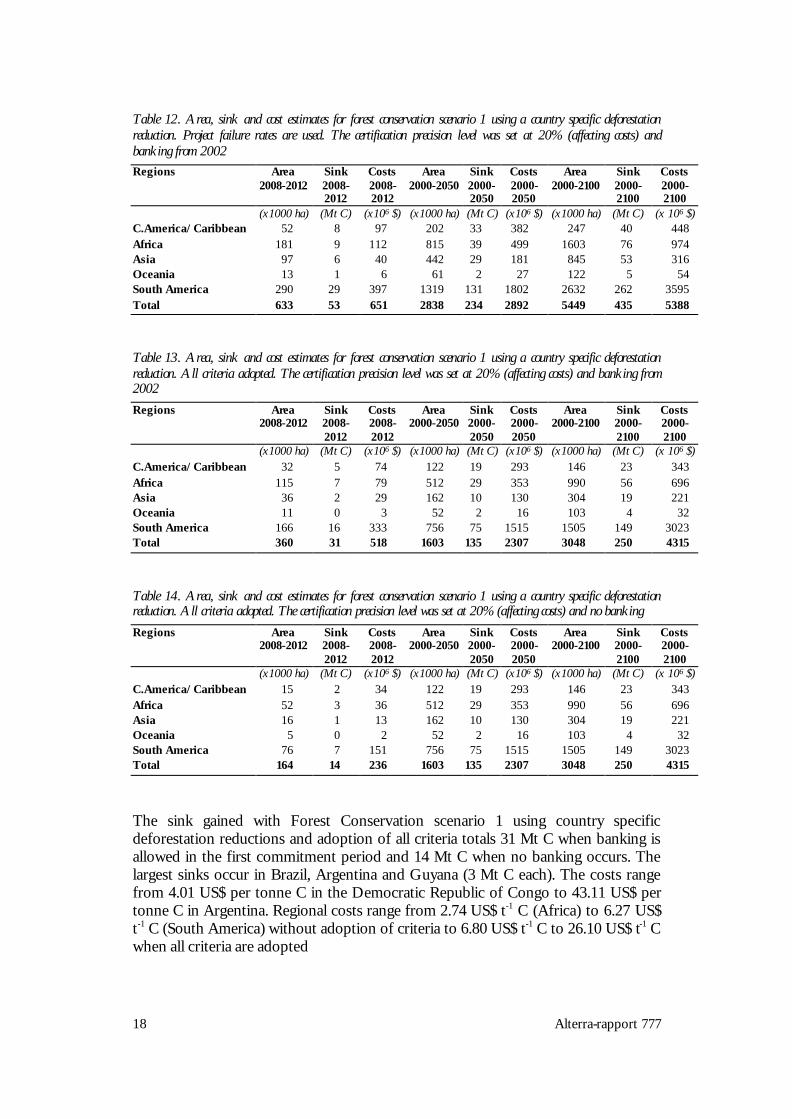
Table 12. Area, sink and cost estimates for forest conservation scenario 1 using a country specific deforestationreduction. Project failure rates are used. The certification precision level was set at 20% (affecting costs) andbanking from 2002Regions Area
2008-2012Sink2008-2012
Costs2008-2012
Area2000-2050
Sink2000-2050
Costs2000-2050
Area2000-2100
Sink2000-2100
Costs2000-2100
(x1000 ha) (Mt C) (x106 $) (x1000 ha) (Mt C) (x106 $) (x1000 ha) (Mt C) (x 106 $)C.America/Caribbean 52 8 97 202 33 382 247 40 448Africa 181 9 112 815 39 499 1603 76 974Asia 97 6 40 442 29 181 845 53 316Oceania 13 1 6 61 2 27 122 5 54South America 290 29 397 1319 131 1802 2632 262 3595Total 633 53 651 2838 234 2892 5449 435 5388
Table 13. Area, sink and cost estimates for forest conservation scenario 1 using a country specific deforestationreduction. All criteria adopted. The certification precision level was set at 20% (affecting costs) and banking from2002Regions Area
2008-2012Sink2008-2012
Costs2008-2012
Area2000-2050
Sink2000-2050
Costs2000-2050
Area2000-2100
Sink2000-2100
Costs2000-2100
(x1000 ha) (Mt C) (x106 $) (x1000 ha) (Mt C) (x106 $) (x1000 ha) (Mt C) (x 106 $)C.America/Caribbean 32 5 74 122 19 293 146 23 343Africa 115 7 79 512 29 353 990 56 696Asia 36 2 29 162 10 130 304 19 221Oceania 11 0 3 52 2 16 103 4 32South America 166 16 333 756 75 1515 1505 149 3023Total 360 31 518 1603 135 2307 3048 250 4315
Table 14. Area, sink and cost estimates for forest conservation scenario 1 using a country specific deforestationreduction. All criteria adopted. The certification precision level was set at 20% (affecting costs) and no bankingRegions Area
2008-2012Sink2008-2012
Costs2008-2012
Area2000-2050
Sink2000-2050
Costs2000-2050
Area2000-2100
Sink2000-2100
Costs2000-2100
(x1000 ha) (Mt C) (x106 $) (x1000 ha) (Mt C) (x106 $) (x1000 ha) (Mt C) (x 106 $)C.America/Caribbean 15 2 34 122 19 293 146 23 343Africa 52 3 36 512 29 353 990 56 696Asia 16 1 13 162 10 130 304 19 221Oceania 5 0 2 52 2 16 103 4 32South America 76 7 151 756 75 1515 1505 149 3023Total 164 14 236 1603 135 2307 3048 250 4315
The sink gained with Forest Conservation scenario 1 using country specificdeforestation reductions and adoption of all criteria totals 31 Mt C when banking isallowed in the first commitment period and 14 Mt C when no banking occurs. Thelargest sinks occur in Brazil, Argentina and Guyana (3 Mt C each). The costs rangefrom 4.01 US$ per tonne C in the Democratic Republic of Congo to 43.11 US$ pertonne C in Argentina. Regional costs range from 2.74 US$ t-1 C (Africa) to 6.27 US$t-1 C (South America) without adoption of criteria to 6.80 US$ t-1 C to 26.10 US$ t-1 Cwhen all criteria are adopted
Alterra-rapport 777 19
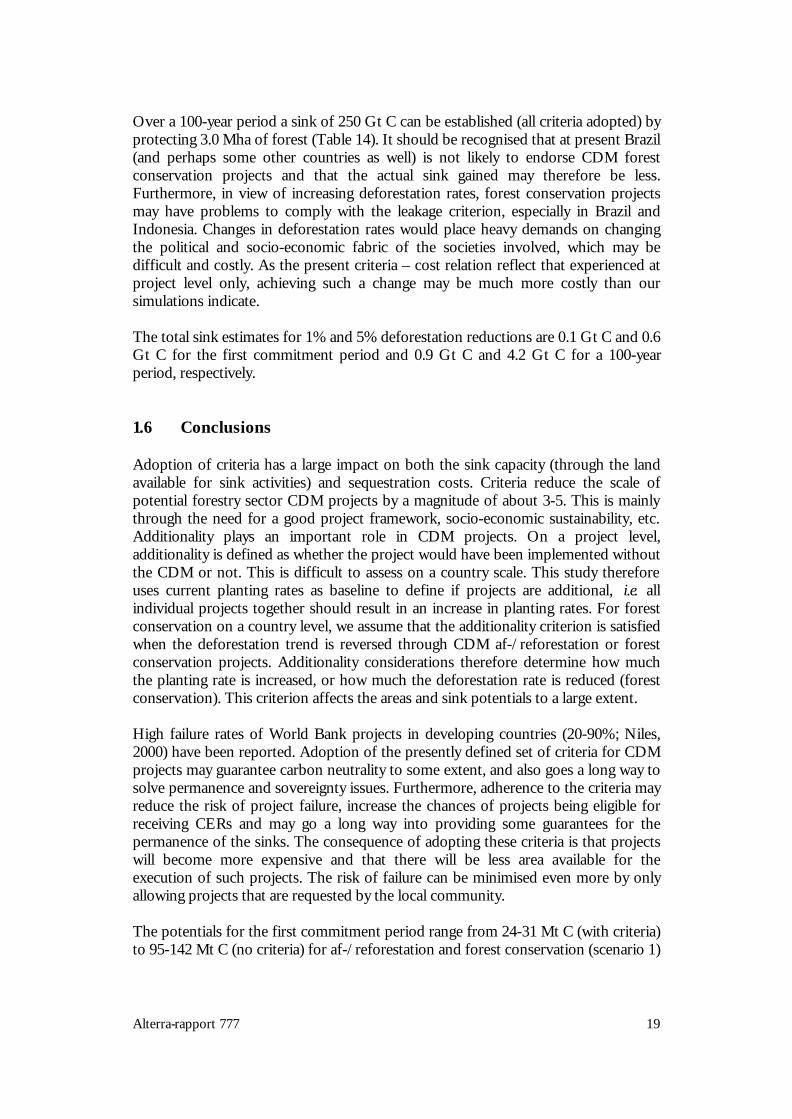
Over a 100-year period a sink of 250 Gt C can be established (all criteria adopted) byprotecting 3.0 Mha of forest (Table 14). It should be recognised that at present Brazil(and perhaps some other countries as well) is not likely to endorse CDM forestconservation projects and that the actual sink gained may therefore be less.Furthermore, in view of increasing deforestation rates, forest conservation projectsmay have problems to comply with the leakage criterion, especially in Brazil andIndonesia. Changes in deforestation rates would place heavy demands on changingthe political and socio-economic fabric of the societies involved, which may bedifficult and costly. As the present criteria – cost relation reflect that experienced atproject level only, achieving such a change may be much more costly than oursimulations indicate.
The total sink estimates for 1% and 5% deforestation reductions are 0.1 Gt C and 0.6Gt C for the first commitment period and 0.9 Gt C and 4.2 Gt C for a 100-yearperiod, respectively.
1.6 Conclusions
Adoption of criteria has a large impact on both the sink capacity (through the landavailable for sink activities) and sequestration costs. Criteria reduce the scale ofpotential forestry sector CDM projects by a magnitude of about 3-5. This is mainlythrough the need for a good project framework, socio-economic sustainability, etc.Additionality plays an important role in CDM projects. On a project level,additionality is defined as whether the project would have been implemented withoutthe CDM or not. This is difficult to assess on a country scale. This study thereforeuses current planting rates as baseline to define if projects are additional, i.e. allindividual projects together should result in an increase in planting rates. For forestconservation on a country level, we assume that the additionality criterion is satisfiedwhen the deforestation trend is reversed through CDM af-/reforestation or forestconservation projects. Additionality considerations therefore determine how muchthe planting rate is increased, or how much the deforestation rate is reduced (forestconservation). This criterion affects the areas and sink potentials to a large extent.
High failure rates of World Bank projects in developing countries (20-90%; Niles,2000) have been reported. Adoption of the presently defined set of criteria for CDMprojects may guarantee carbon neutrality to some extent, and also goes a long way tosolve permanence and sovereignty issues. Furthermore, adherence to the criteria mayreduce the risk of project failure, increase the chances of projects being eligible forreceiving CERs and may go a long way into providing some guarantees for thepermanence of the sinks. The consequence of adopting these criteria is that projectswill become more expensive and that there will be less area available for theexecution of such projects. The risk of failure can be minimised even more by onlyallowing projects that are requested by the local community.
The potentials for the first commitment period range from 24-31 Mt C (with criteria)to 95-142 Mt C (no criteria) for af-/reforestation and forest conservation (scenario 1)
20 Alterra-rapport 777
projects, respectively. The most optimistic forest conservation scenario (scenario 3)would yield 172–655 Mt C for this budget period.
The costs of CDM af-/reforestation projects and forest conservation projects showvariation between countries but range generally between 4-10 US$ tonne-1 C when nocriteria are adopted and 8-32 US$ tonne-1 C when criteria are enforced. The costs arelowest in African and some Asian countries, and highest in South Americancountries.

Alterra-rapport 777 21
2 Background
In 1997, at the third Conference of the Parties of the UNFCCC, the Kyoto Protocolintroduced the principle of a Clean Development Mechanism (CDM). The CDM isone of three mechanisms1 that could contribute to the goal of the climate conventionto reduce Carbon emissions and help Annex I countries achieving theircommitments in a cost-effective way.
The objectives of the CDM are to support non-Annex I Parties to the UNFCCC, topromote sustainable development, and to assist Annex I Parties to achievecompliance with their emission limitation and reduction commitments under theClimate Convention. In exchange for the realised emission reductions, the Annex IParty may receive credits for CDM projects, the so-called certified emissionreductions (CERs). CER units can be created at any time from the beginning of theyear 2000 onwards and can be used to achieve Annex I compliance in 2008.Emission reductions from project activities conducted within the context of CDMwill be certified on the basis of the items stated in article 12.5 of the Kyoto Protocol2.
Ever since COP3, the CDM has been a subject for debate. Several issues are stillunder discussion and remain firmly on the policy agenda. One of these issues is theinclusion of certain potential CDM activities, with the use of so-called carbon sinksto obtain emission reductions receiving attention in particular. Such sink activitiescould include forest conservation or other forest based emission reduction activities(e.g. slowing down deforestation rates) and other certified sink activities (e.g.reforestation or afforestation). At present, the CDM remains largely undefinedbecause it is not yet clear which activities may be included and which criteria willapply to CDM projects. At COP6b in 2001 (Bonn, Germany) decisions may be madeabout the inclusion of certain activities within the CDM.
The rate of deforestation in the tropics amounts to about 12.6 Mha y-1 (FAO, 1999),resulting in CO2 emissions to the atmosphere in the order of 2.0 Gt C yr-1 (IPCC,2000). These emissions form about 20% of all anthropogenic C emissions and 30%of all fossil fuel C emissions to the atmosphere in 1990 (Trexler and Haugen, 1995).To put things further into perspective, it should be noted that these emissions areover two times larger than those from fossil fuel burning in Western Europe (about0.9 Gt C in 1996). This illustrates the importance of the contribution of deforestationin tropical regions to global carbon emissions. The emissions from deforestation inthe tropics are offset by the sequestration of Carbon by terrestrial ecosystems, mainlythrough fertilisation processes (increased C and N deposition) and land use andmanagement changes in the developed world (IPCC, 2000). Hence, changes in the
1 In addition to the CDM (art. 12 KP), there are the Joint Implementation (Art. 6 KP) and International
Emission Trading (art. 17 KP) mechanisms.2 These items are (a) voluntary participation approved by each Party involved, (b) real, measurable, and long-term
benefits related to the mitigation of climate change and (c) reductions in emissions that are additional to anythat would occur in the absence of the certified project activity. (art 15.2, Kyoto Protocol, UNFCCC 1997).
22 Alterra-rapport 777
emissions from deforestation or in the sink strengths of terrestrial ecosystems areimportant to environmental and climate policies. The ‘Noordwijk Declaration’,signed by 68 environmental ministers around the world in 1989, already proposed foran increase in the global forest cover by 12 Mha yr-1 for climate change mitigationpurposes. This contrasts sharply with the current deforestation rate, which is ofsimilar magnitude.
Terrestrial sink activities under CDM remain controversial. Article 12 of the KyotoProtocol does not explicitly include carbon sequestration projects as eligible CDMprojects. The main argument against including sink activities in the CDM is that theirpermanence cannot be guaranteed. In contrast to other potential CDM activities (e.g.energy projects), it is inherent to sink activities that the carbon sequestered canpotentially be released again by destruction of the carbon stock through fire, diseaseand pests, extreme climatic events or socio-economic pressures (e.g. illegal logging).This could be a legitimate reason to exclude forest sink activities from the CDM. Onthe other hand, sink activities are already permitted in Article 3, through whichAnnex 1 Parties may meet their emission reduction targets. Several Annex I countriesfavour the inclusion of Carbon sink projects within the CDM. In their view,accepting sink activities within CDM would extend the use of Article 3 measures forAnnex 1 countries to non-Annex I countries. Furthermore, well-designed forestryprojects may benefit developing countries in many ways, including the protection oftheir biotic wealth, protection of the soil and water resources and by providing acontinuous supply of forest products (Trexler and Haugen, 1995). The mainobjections against the implementation of sink activities within the CDM to obtainCERs are summarised below3:• Permanence and risks: project duration and responsibility issues• Baselines and additionality• Leakage across project, regional and national boundaries• Accounting and accounting methods: monitoring and verifiability.• Sustainable development: environmentally and socio-economic,• Capacity-building and technology transfer• Uncertainties and scale: sink capacity and socio-economic factors• Political stability and liability• Sovereignty issues
The inclusion of Carbon sink activities within the CDM has also been perceived tobe a favourable option by Annex 1 countries due to the large potential for Carbonsequestration in non-Annex 1 countries and the favourable cost-effectiveness.However, for more or less the same reasons, it can been argued that the acceptanceof low-cost Carbon sequestration projects (with their large potential of Csequestration) within the CDM may lead to a decreased commitment of developedcountries to implement more expensive C-emission reduction measures in their owncountry. In view of the low emission reduction targets set for the first commitmentperiod (i.e. 8% reduction for the European Union), inclusion of sinks into the CDM
3 To a large extent also mentioned by the IPCC as technical issues in the LULUCF Special Report (2000)

Alterra-rapport 777 23
is perceived to undermine the core principle of the Kyoto Protocol. In addition,some of the developing countries are reluctant to approve the use of Carbonsequestration projects as these may withdraw focus from renewable sources andcutting-edge technology-oriented CDM projects. A better insight into the objectionsagainst sinks in the CDM outlined above is required to assess which criteria andconditions should be posed on sink activities to allow inclusion within the CDM, andhow these criteria and conditions affect C-sequestration rates and project costs. Strictapplication of certain criteria and guidelines to sink activities may provide aninstrument to reduce or eliminate negative effects of the inclusion of sink activities inthe CDM.
In January 2000, a first, orientating study was carried out by Alterra, at the request ofthe Dutch Ministry of Agriculture, Nature Management and Fisheries (LNV). Thesubject of this study was to assess the potential for C-sequestration through af-,reforestation and forest conservation projects in a limited number of developingcountries short-listed to receive aid from the Dutch government (Waterloo et al.,2000). The C-sequestration and cost-effectiveness estimates in this report containlarge uncertainty margins. These are due to lack of reliable data on available areas forsink projects, storage capacity in biomass and soil, project costs, etc. Furthermore,any criteria or conditions that may be posed on sink activities in the CDM do notaffect the estimates given in this report. This leads to very high potentialsequestration rates and low cost estimates. Sink projects implemented under the‘Activities Implemented Jointly’ (AIJ) may provide better insight into criteria used toset-up sink projects in developing countries and problems encountered in theprojects. This insight should result in the development of a set of criteria, conditionsand responsibility guaranties to ensure the eligibility of sink projects for receivingCERs within the CDM. The set of criteria should also include criteria set by theUNFCCC Climate Convention and Kyoto Protocol, forestry institutes and other(non-forestry) institutes. These criteria and conditions should therefore aim toaddress the uncertainties and objections to sink activities in the CDM listed above.
The aim of this study is threefold:1) to develop a set of criteria and conditions for sink projects within the CDM.2) to study the effect of the adoption of such criteria on C-sequestration potentials
and costs of several JI/AIJ projects.3) to estimate C-sequestration potentials and costs of sink projects for 70
developing countries using a number of afforestation, reforestation and forestconservation scenarios with and without adoption of criteria.
Most of the criteria and conditions presented in this report may also be applied tosink projects within Joint Implementation (JI), or to non-sink activities within theCDM. However, discussion of this topic falls outside the scope of this project. Thesame applies for the application of sink projects for ‘adaptation’ measures indeveloping countries. This study deals with Afforestation, Reforestation andDeforestation (ARD) activities only and is restricted to 70 developing countries infive regions.

24 Alterra-rapport 777

Alterra-rapport 777 25
3 Methods and data sources
Alterra developed the Clean Development Mechanism Forest Sink Model(CDMFSM Ver. 2.01; Waterloo et al., 2001) at the request of the Dutch Ministries ofAgriculture, Nature and the Environment (LNV) and of Housing, Spatial Planningand the Environment (VROM). The model was developed to assess different sinkactivities (e.g. afforestation/reforestation and forest conservation) in terms of theirpotential C sequestration over different budget periods and the costs associated tothese activities. Both the sink capacities and costs are influenced by the adoption ofcriteria.
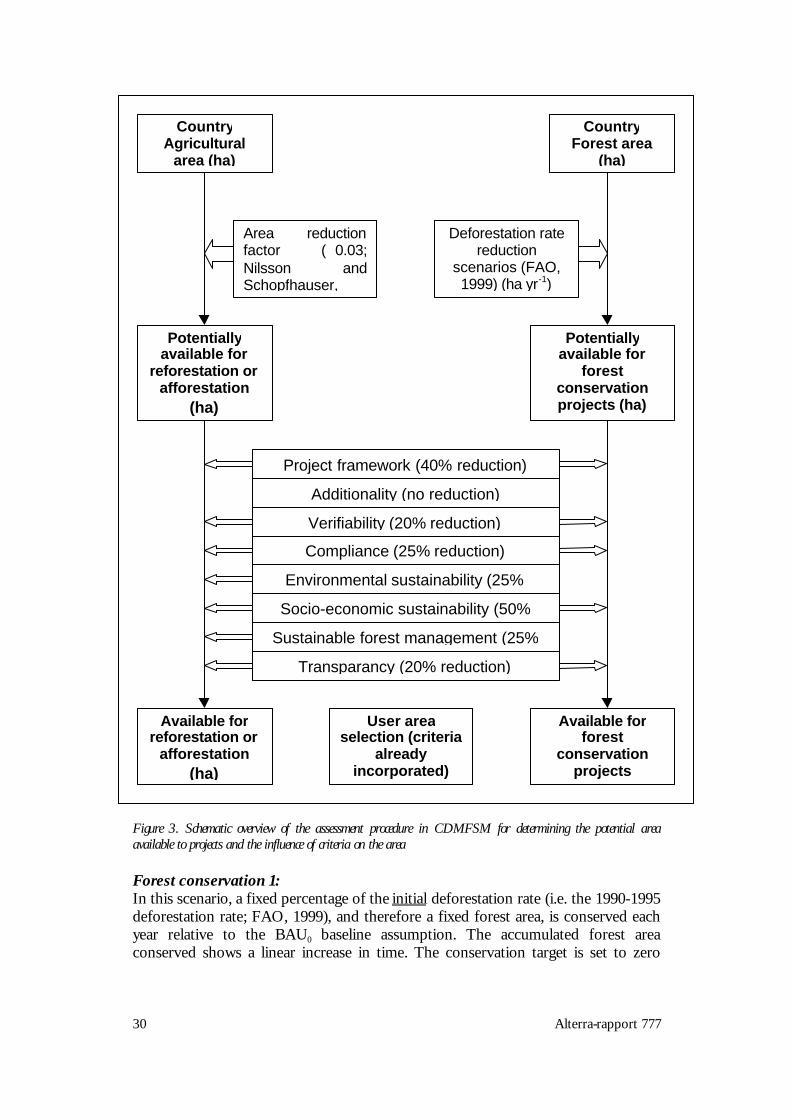
Version 2.01 of the model has an extended country list (69 developing countriesincluded) as compared to Version 1.0 and provides regional overviews for CentralAmerica/Caribbean, Africa, Asia, Oceania and South America. In addition, thecountry information has been updated, the af-reforestation calculations now use agrowth model and a ‘project success rate’ factor has been incorporated to estimatepotentials and costs taking into account that a certain percentage of projects will fail.Schematic overviews of the model calculation procedures are given in Figure 3 andFigure 7.
3.1 Definitions
For the purpose of this study, forests are defined in the sense of their biomass (FAO,1999). Values for the average biomass of forests for each country have beenpublished by the FAO (1995, 1999, 2001). It is assumed that deforestation involves acomplete removal of the forest biomass (i.e. conversion to pasture or some otherlow-biomass vegetation cover). Afforestation or reforestation is defined as a gradualchange from pasture (or some other form of low-biomass vegetation type) to foreston land that has been without forest prior to 1990. Forest conservation projects aredefined as projects, which protect existing natural forest from deforestation, thuskeeping the biomass at a level equal to that of undisturbed forest. This implies thatthere is no timber extraction from these forests (e.g. National Park status).
In reality, afforestation/reforestation can occur on land that already has a significanttree cover and the intensity of deforestation may range from low impact activities(shifting cultivation) to high impact activities such as permanent conversion topasture.
Hence, with the definitions presently used, the estimates given for carbonsequestration must be considered as high impact changes (i.e. conversion to pastureor reforestation of pasture). The actual sink capacity must therefore be consideredlower, depending on the type of deforestation and the biomass of the vegetation ondeforested lands.

26 Alterra-rapport 777
The definition of agro-forestry includes a change from an agricultural practise to acombination of agriculture and forestry. If we ignore the changes in carbon stockscaused by changes in the agricultural crop management practises in this system, itmay be viewed as ‘very low intensity’ plantation forestry, with associated low biomassaccumulation rates.
3.2 Area assumptions for the calculation of Carbon fixation.
The forest carbon sink potential of a country is strongly dependent on the land areathat is available for af-/reforestation projects, or on the natural forest area forconservation projects. As such there is a need for realistic estimates of the areaavailable to projects for a proper estimation of the carbon sequestration potentials.CDMFSM V2.0 was developed to calculate the sink potential, as well as ‘actual’sequestration rates, by CDM projects using different sets of criteria. A schematicdiagram of how potential and actual project available areas are assessed in thisspreadsheet model is given in Figure 3.
3.2.1 Af-/reforestation projects
At present, forest plantations cover about 112 Mha globally, which is about 2.3% ofthe global agricultural area (4,938 Mha). There is no information readiliy available forthe current selection of countries on the actual area being available (and physically)suitable for af-/reforestation projects. As such, we followed the assumptions of Nilssonand Schopfhauser (1995) that 3-4% of the agricultural land (source: FAOSTATdatabase) would be potentially available and physically suitable for such projects. Theactual percentages used for countries in different regions are given in Table 1.
Table 15. Fraction of agricultural land in tropical regions that would be available and physically suitable forafforestation or reforestation projects (Nilsson and Schopfhauser, 1995)
Region Available and suitable land / totalagricultural land
Tropical Latin America 0.030Tropical Africa 0.036Tropical Asia 0.040
The potential area (85.7 Mha) is affected by the selection of criteria (Figure 3), withthe exception of the additionality criterion. Additionality requires that a project needsto demonstrate that it is additional to the ‘business as usual’ in order to receivecredits. To account for this criterion, it is assumed that the current planting rate(FAO, 2001) may be taken as a baseline value (i.e. 4.1 Mha yr-1). However, asignificant part of the current planting is on land that was deforested after 1990. Inview of the fact that such land cannot be used for CDM af-/reforest projects, thisarea should not be taken fully into account in the baseline. The model thereforedefines a factor (0<Fa<1) by which the current country annual planting rate is

Alterra-rapport 777 27
multiplied to define the baseline planting rate on the area available for CDM projects.At present, this value is set to 0.35 as a default.
The potential area to be reforested annually, taking additionality into account, can beexpressed as a percentage of the current annual planting rate. For instance, if thepercentage is set at 100%, the planting rate becomes double the current annualplanting rate. The sum of the area planted annually is checked against the potentialavailable area for af-/reforestation and cannot exceed this area. If the potential areais fully planted, the annual planting rates for CDM projects are set to zero. A plot ofthe total area planted over 100 years is shown in Figure 2.
Figure 2. Plot of the total area planted assuming a 100% increase in the current planting rate due to CDMprojects and no criteria applied
3.2.2 Forest conservation projects
In principle, the maximum area available for forest conservation projects could berepresented by the area presently under forest cover (FAO, 2001). However,conservation projects should be aiming at reducing ongoing deforestation foradditionality reasons. This implies that the area for such conservation projects isactually limited to current deforestation rates, assuming that this represents amaximum that could be used in (future) baseline scenarios. To arrive at an estimationfor the obtainable reduction in the deforestation rate, we made the assumption thatthe reduction would be dependent on the country’s Gross National Product (GNP),the deforestation rate (DFR) and the population density (PD, defining pressures onthe land). The assumed potential reduction (in % of deforestation rate) wascalculated according to:
0
10000
20000
30000
40000
50000
60000
1 8 15 22 29 36 43 50 57 64 71 78 85 92 99Time (years)
Are
a pl
ante
d ((
x100
0 ha
)
28 Alterra-rapport 777
PDDFRGNP
*100*
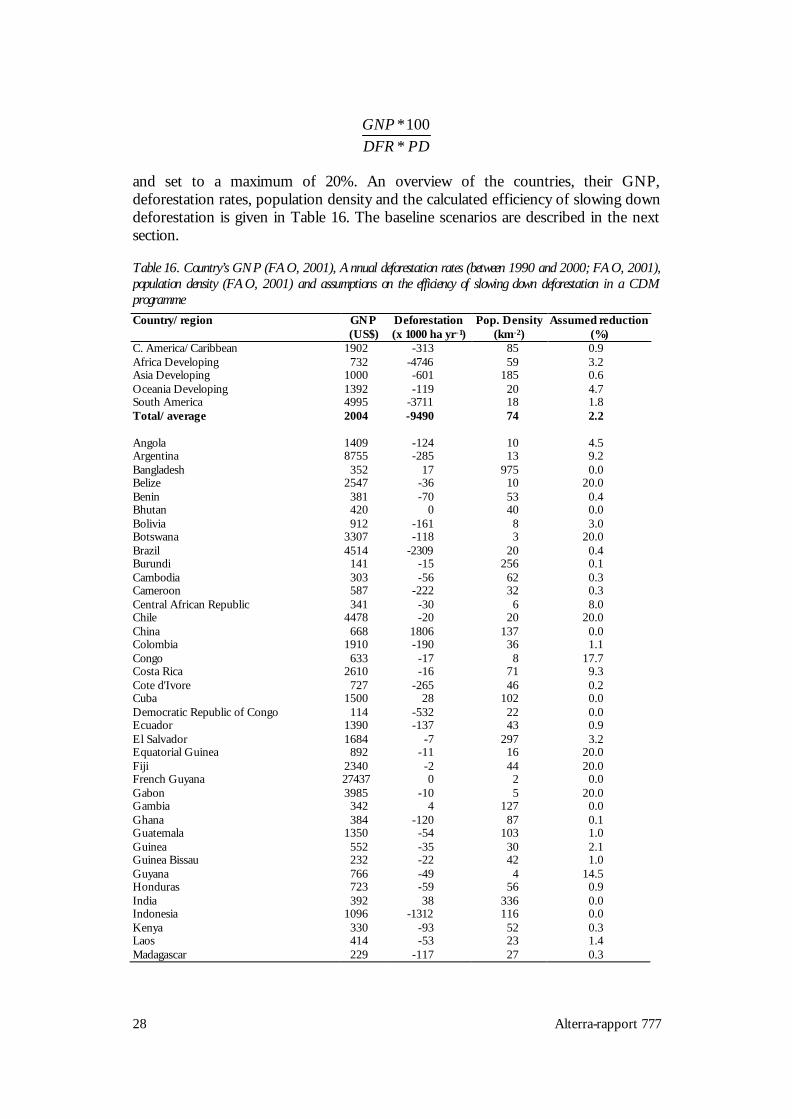
and set to a maximum of 20%. An overview of the countries, their GNP,deforestation rates, population density and the calculated efficiency of slowing downdeforestation is given in Table 16. The baseline scenarios are described in the nextsection.
Table 16. Country’s GNP (FAO, 2001), Annual deforestation rates (between 1990 and 2000; FAO, 2001),population density (FAO, 2001) and assumptions on the efficiency of slowing down deforestation in a CDMprogrammeCountry/region GNP
(US$)Deforestation(x 1000 ha yr -1)
Pop. Density(km-2)
Assumed reduction(%)
C. America/Caribbean 1902 -313 85 0.9Africa Developing 732 -4746 59 3.2Asia Developing 1000 -601 185 0.6Oceania Developing 1392 -119 20 4.7South America 4995 -3711 18 1.8Total/average 2004 -9490 74 2.2
Angola 1409 -124 10 4.5Argentina 8755 -285 13 9.2Bangladesh 352 17 975 0.0Belize 2547 -36 10 20.0Benin 381 -70 53 0.4Bhutan 420 0 40 0.0Bolivia 912 -161 8 3.0Botswana 3307 -118 3 20.0Brazil 4514 -2309 20 0.4Burundi 141 -15 256 0.1Cambodia 303 -56 62 0.3Cameroon 587 -222 32 0.3Central African Republic 341 -30 6 8.0Chile 4478 -20 20 20.0China 668 1806 137 0.0Colombia 1910 -190 36 1.1Congo 633 -17 8 17.7Costa Rica 2610 -16 71 9.3Cote d'Ivore 727 -265 46 0.2Cuba 1500 28 102 0.0Democratic Republic of Congo 114 -532 22 0.0Ecuador 1390 -137 43 0.9El Salvador 1684 -7 297 3.2Equatorial Guinea 892 -11 16 20.0Fiji 2340 -2 44 20.0French Guyana 27437 0 2 0.0Gabon 3985 -10 5 20.0Gambia 342 4 127 0.0Ghana 384 -120 87 0.1Guatemala 1350 -54 103 1.0Guinea 552 -35 30 2.1Guinea Bissau 232 -22 42 1.0Guyana 766 -49 4 14.5Honduras 723 -59 56 0.9India 392 38 336 0.0Indonesia 1096 -1312 116 0.0Kenya 330 -93 52 0.3Laos 414 -53 23 1.4Madagascar 229 -117 27 0.3

Alterra-rapport 777 29
Country/region GNP(US$)
Deforestation(x 1000 ha yr -1)
Pop. Density(km-2)
Assumed reduction(%)
Macedonia 1053 0 79 0.0Malawi 163 -71 113 0.1Malaysia 4469 -237 66 1.1Mexico 3304 0 51 0.0Mongolia 391 -60 2 15.3Mozambique 131 -64 25 0.3Myanmar 1000 -517 69 0.1Nepal 200 -78 158 0.1New Caledonia 1500 0 12 0.0Nicaragua 408 -117 41 0.3Nigeria 239 -398 120 0.0Panama 2993 -52 38 6.1Papua New Guinea 931 -113 10 3.2Paraguay 1946 -123 14 4.7Peru 2310 -269 19 1.8Philippines 1170 -89 250 0.2Rwanda 207 -15 293 0.2Senegal 554 -45 48 1.0Sierra Leone 150 -36 66 0.3Solomon Islands 797 -4 15 20.0South Africa 3377 -8 33 20.0Sudan 255 -959 12 0.1Surinam 940 0 3 0.0Thailand 2821 -112 119 0.8Tanzania 183 -91 37 0.2Uganda 326 -91 106 0.1Uruguay 6076 50 19 0.0Venezuela 3499 -218 30 2.2Vietnam 299 52 242 0.0Zambia 387 -851 12 0.2Zimbabwe 656 -320 30 0.3
Total/average 1715 -135.5 68 3.8
3.2.3 Forest conservation scenarios
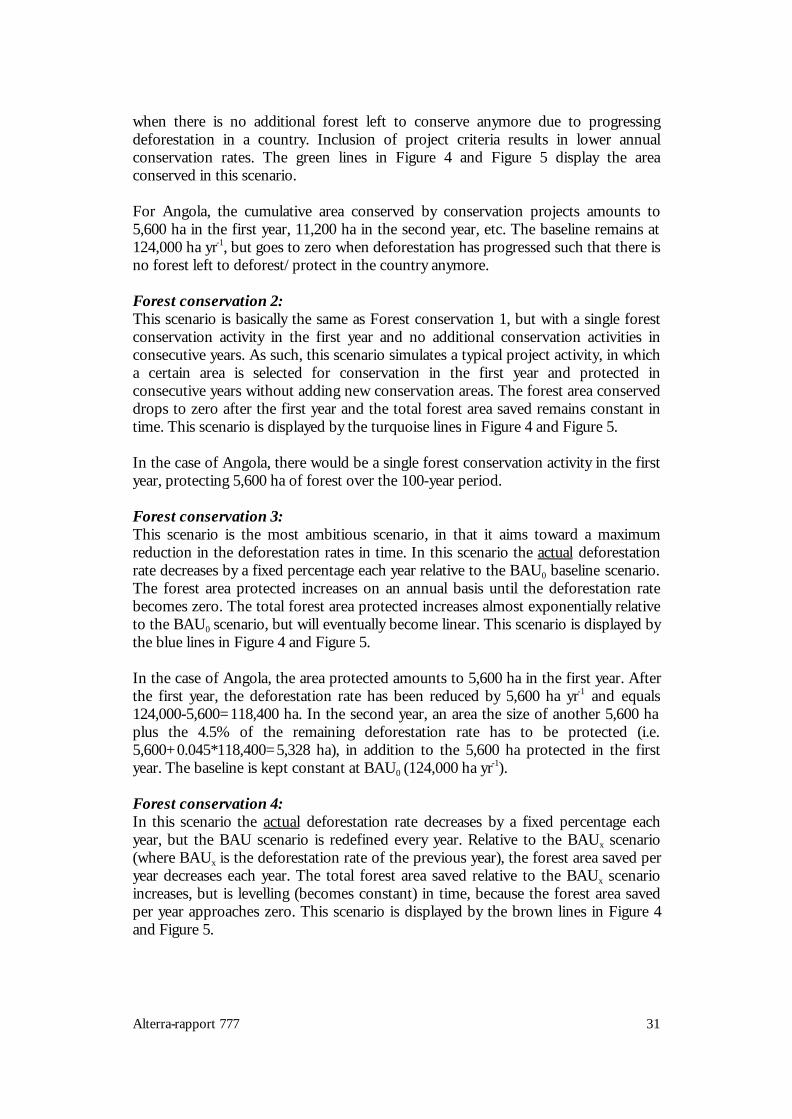
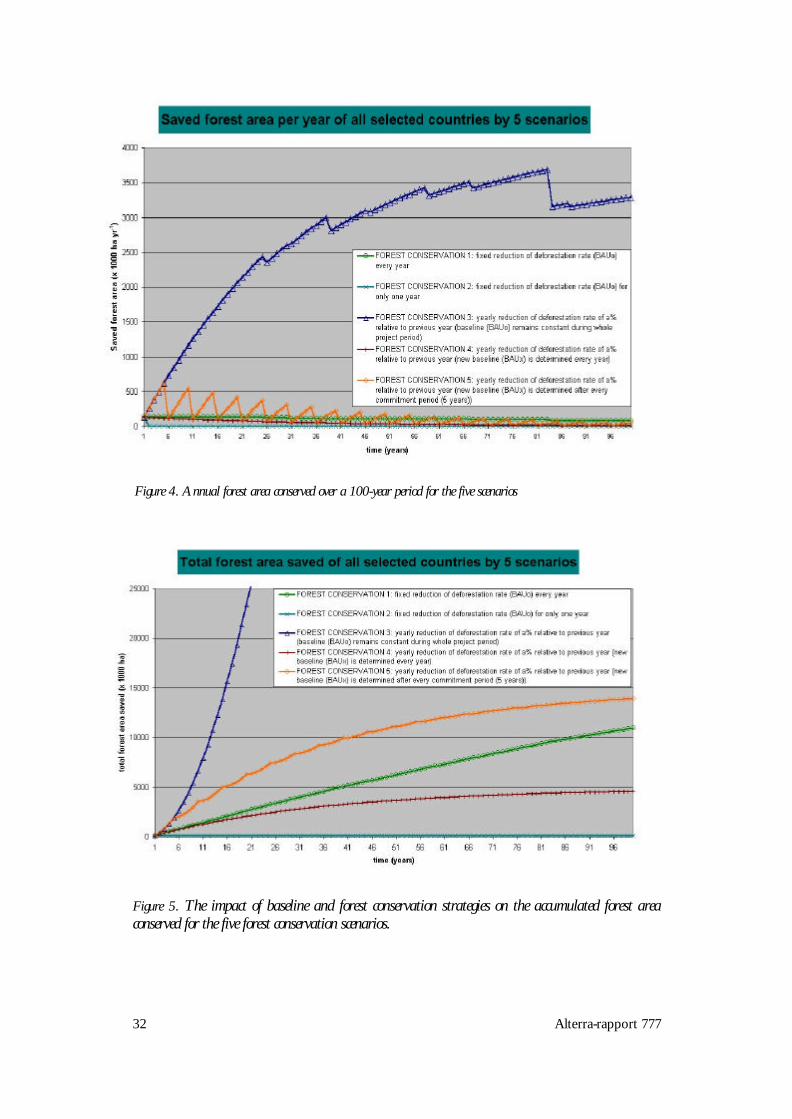
There are many possibilities for formulating combinations of baseline scenarios andproject implementation schemes for forest conservation simulation studies and it isdifficult to say which would be the most realistic. We have composed five more orless realistic scenarios. To explain the differences between the five scenarios, weadded two figures (see end of section) and a description of their characteristics.Figure 4 shows the annual forest area conserved for the five scenarios, whereas thetotal forest area saved is displayed in Figure 5 for the 5 scenarios. The scenarios aredescribed below and examples of their implementation are included for furtherillustration. The case of Angola will be used as an example for each scenario. The1990-2000 deforestation rate is used as the Business as Usual (BAU0) baseline forAngola (FAO, 2001) and amounts to 124,000 ha yr-1. The deforestation ratereduction target for this country is set to 4.5% of BAU0 (see Table 16). Allcalculations cover a period of 100 years maximum.
30 Alterra-rapport 777
Figure 3. Schematic overview of the assessment procedure in CDMFSM for determining the potential areaavailable to projects and the influence of criteria on the area
Forest conservation 1:In this scenario, a fixed percentage of the initial deforestation rate (i.e. the 1990-1995deforestation rate; FAO, 1999), and therefore a fixed forest area, is conserved eachyear relative to the BAU0 baseline assumption. The accumulated forest areaconserved shows a linear increase in time. The conservation target is set to zero
CountryAgricultural
area (ha)
Potentiallyavailable for
forestconservationprojects (ha)
(ha)
Potentiallyavailable for
reforestation orafforestation
(ha)
CountryForest area
(ha)
Area reductionfactor (≅0.03;Nilsson andSchopfhauser,
Deforestation ratereduction
scenarios (FAO,1999) (ha yr-1)
Available forreforestation or
afforestation(ha)
Available forforest
conservationprojects
Project framework (40% reduction)
Additionality (no reduction)
Compliance (25% reduction)
Verifiability (20% reduction)
Environmental sustainability (25%
Socio-economic sustainability (50%
Sustainable forest management (25%
Transparancy (20% reduction)
User areaselection (criteria
alreadyincorporated)
Alterra-rapport 777 31
when there is no additional forest left to conserve anymore due to progressingdeforestation in a country. Inclusion of project criteria results in lower annualconservation rates. The green lines in Figure 4 and Figure 5 display the areaconserved in this scenario.
For Angola, the cumulative area conserved by conservation projects amounts to5,600 ha in the first year, 11,200 ha in the second year, etc. The baseline remains at124,000 ha yr-1, but goes to zero when deforestation has progressed such that there isno forest left to deforest/protect in the country anymore.
Forest conservation 2:This scenario is basically the same as Forest conservation 1, but with a single forestconservation activity in the first year and no additional conservation activities inconsecutive years. As such, this scenario simulates a typical project activity, in whicha certain area is selected for conservation in the first year and protected inconsecutive years without adding new conservation areas. The forest area conserveddrops to zero after the first year and the total forest area saved remains constant intime. This scenario is displayed by the turquoise lines in Figure 4 and Figure 5.
In the case of Angola, there would be a single forest conservation activity in the firstyear, protecting 5,600 ha of forest over the 100-year period.
Forest conservation 3:This scenario is the most ambitious scenario, in that it aims toward a maximumreduction in the deforestation rates in time. In this scenario the actual deforestationrate decreases by a fixed percentage each year relative to the BAU0 baseline scenario.The forest area protected increases on an annual basis until the deforestation ratebecomes zero. The total forest area protected increases almost exponentially relativeto the BAU0 scenario, but will eventually become linear. This scenario is displayed bythe blue lines in Figure 4 and Figure 5.
In the case of Angola, the area protected amounts to 5,600 ha in the first year. Afterthe first year, the deforestation rate has been reduced by 5,600 ha yr-1 and equals124,000-5,600=118,400 ha. In the second year, an area the size of another 5,600 haplus the 4.5% of the remaining deforestation rate has to be protected (i.e.5,600+0.045*118,400=5,328 ha), in addition to the 5,600 ha protected in the firstyear. The baseline is kept constant at BAU0 (124,000 ha yr-1).
Forest conservation 4:In this scenario the actual deforestation rate decreases by a fixed percentage eachyear, but the BAU scenario is redefined every year. Relative to the BAUx scenario(where BAUx is the deforestation rate of the previous year), the forest area saved peryear decreases each year. The total forest area saved relative to the BAUx scenarioincreases, but is levelling (becomes constant) in time, because the forest area savedper year approaches zero. This scenario is displayed by the brown lines in Figure 4and Figure 5.
32 Alterra-rapport 777
Figure 5. The impact of baseline and forest conservation strategies on the accumulated forest areaconserved for the five forest conservation scenarios.
Figure 4. Annual forest area conserved over a 100-year period for the five scenarios

Alterra-rapport 777 33
With an initial deforestation rate of 124,000 ha yr-1 in Angola, this means that in thefirst year 5,600 ha of forest is protected. We then assume that the deforestation ratehas decreased to 124,000 – 5,600 = 118,400 ha yr-1 and the baseline scenario isadjusted accordingly. In the second year, 4.5% of the new baseline (= 5,328 ha) isprotected and the baseline is reduced to 118,400-5,328 = 113,072 ha yr-1. Thisprocess continues until deforestation reaches zero and the total area conserved intime is thus equal to the initial deforestation rate (124,000 ha in this case).
Forest conservation 5:In this scenario the actual deforestation rate decreases by a fixed percentage eachyear as in scenario 4, but the BAU scenario is redefined after every commitmentperiod (5 years). Relative to the BAUx scenario (where BAUx is now the deforestationrate at the end of the former commitment period), the forest area saved per yearincreases within a commitment period. After this commitment period the BAUscenario is redefined and the forest area saved per year becomes the forest area savedper year relative to the new BAU scenario. On long term the forest area saved peryear approaches zero. The total forest area saved increases in time and becomesconstant on the long term. The increase of the total area saved is largest at the end ofeach commitment period. This scenario is displayed by the orange lines in Figure 5and Figure 6.
For Angola, this means that the first five years, the baseline is set at 124,000 ha yr-1
and the area protected annually ranges from 5,600 ha in the first year to 25,700 ha inthe 5th year. The baseline is then adjusted to 124,000-4,700=119,300 ha yr-1 and thearea protected annually ranges from 4,500 ha in the 6th year to 20,400 ha in the 10 th
year. The new baseline then becomes 119,300-3,700=115,600 ha yr-1 and the processcontinues until the deforestation rate becomes zero.
3.3 Influence of criteria on available areas
The area available for af-/reforestation or for forest conservation projects is notstatic, but is strongly influenced by the adoption of certain criteria in a project. Theadoption of criteria has a negative impact on the slowing down of the deforestationrate because only a fraction of the potential area can then be used for CDM projects.For example, sustainable forestry may not be feasible on all available land andadopting this criterion in a project will therefore have a negative effect on theavailable area. A similar reasoning can be made for other criteria and these criteria alltend to have negative impacts on the available area. Specific weights for areareduction have been assigned to each of the criteria, based on experience from theDutch FACE projects. Our calculations are such that adoption of a criterion willresult in a reduced area equal to multiplication by the weight factor assigned to thatcriterion. The area reduction factors are given in Table 17.

34 Alterra-rapport 777
Table 17. Area reductions per criterionProject criteria Area reduction factor (%) RemarksProject framework 40Additionality 0 Implemented separately in baselinesVerifiability 20Compliance 25Environmental sustainability 50 0% for forest conservationSocio-economic sustainability 25Sustainable forest management 25 0% for forest conservationTransparancy 20
As additionality is a key-element of any CDM project, we suppose that all CDMproject initiatives will have to comply with this criterion to be eligible and it cantherefore not be switched off in the spreadsheet model. Projects that would notcomply with this criterion would not pass the identification phase. Additionality hasbeen included in the baseline planting rates for af-/reforestation.
Per definition, existing natural forests satisfy the criteria of environmentalsustainability and sustainable forest management. We therefore assume these twocriteria to have no impact on the potential project area in case of forest conservationprojects. This means that these two criteria are always set to zero (although notexplicitly visible for the user in the model) for forest conservation projects.
Criteria only influence the potentially available project area when the option of usingpotential areas is selected. If the user opts to define his own area for the simulations,we assume that the criteria have been taken into account during selection of the areaand there is therefore no need for further reduction of the area through criteria.
3.4 Project success rates and sink potentials
The Country Credit Ratings list published by the Institutional Investors Magazine(2001) has been used as a measure of the success rates of projects. When this factoris selected, the potential sink is multiplied by the credit rating (its value rangesbetween 0.95 for Switzerland to 0.078 for Afghanistan) to account for failed projects(which do not receive CERs). The area and total costs are not affected. However,when this factor is selected, the cost per ton C sequestered increases inversely withthe value of the credit rating.
3.5 Carbon sequestration and emission calculations
This section describes the procedures for carbon sequestration calculations. Allvalues of Carbon sequestration, emission or stocks are given in units of C. Units ofCO2 and associated costs can also be provided by setting a parameter in theparameter sheet to 3.67 (i.e. the ratio of the molecular weights of CO2 and C).
Alterra-rapport 777 35
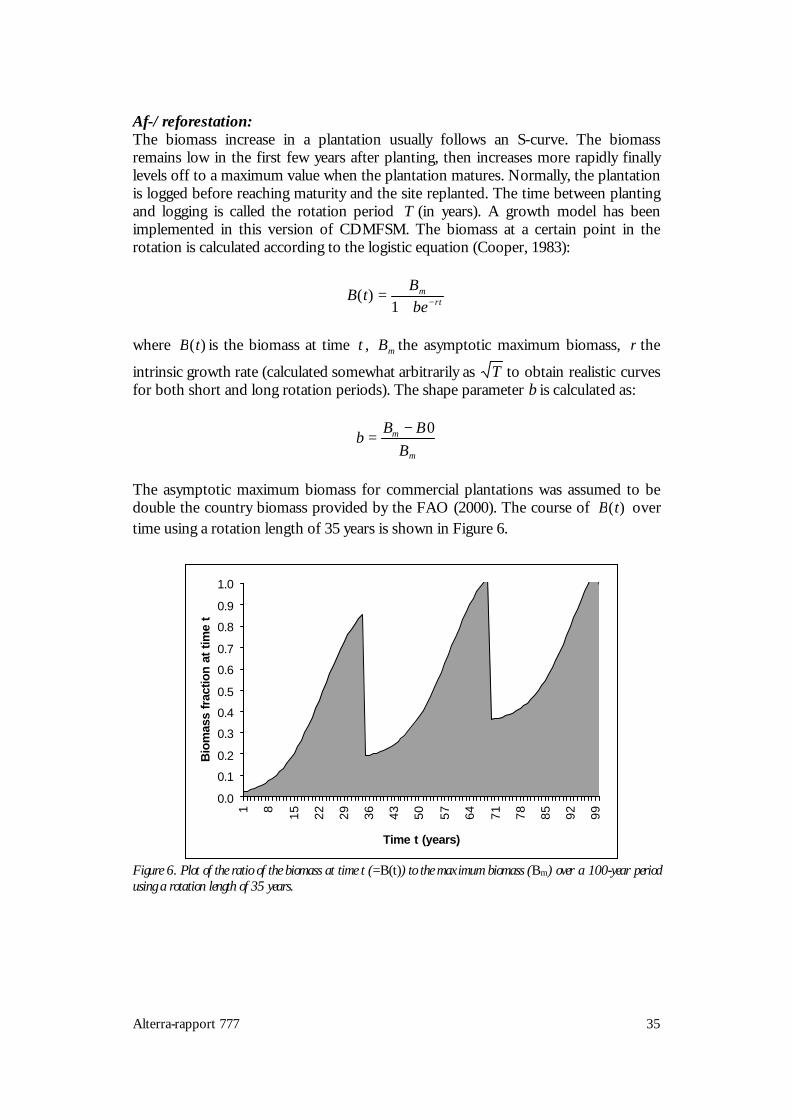
Af-/reforestation:The biomass increase in a plantation usually follows an S-curve. The biomassremains low in the first few years after planting, then increases more rapidly finallylevels off to a maximum value when the plantation matures. Normally, the plantationis logged before reaching maturity and the site replanted. The time between plantingand logging is called the rotation period T (in years). A growth model has beenimplemented in this version of CDMFSM. The biomass at a certain point in therotation is calculated according to the logistic equation (Cooper, 1983):
rtm
beB
tB −+=
1)(
where )(tB is the biomass at time t , mB the asymptotic maximum biomass, r the
intrinsic growth rate (calculated somewhat arbitrarily as T to obtain realistic curvesfor both short and long rotation periods). The shape parameter b is calculated as:
m
m
BBB
b0−
=
The asymptotic maximum biomass for commercial plantations was assumed to bedouble the country biomass provided by the FAO (2000). The course of )(tB overtime using a rotation length of 35 years is shown in Figure 6.
Figure 6. Plot of the ratio of the biomass at time t (=B(t)) to the maximum biomass (Bm) over a 100-year periodusing a rotation length of 35 years.
0.0
0.1
0.2
0.3
0.4
0.5
0.6
0.7
0.8
0.9
1.0
1 8 15 22 29 36 43 50 57 64 71 78 85 92 99
Time t (years)
Bio
mas
s fr
actio
n at
tim
e t
36 Alterra-rapport 777
The carbon sink ( CF , Mt y-1) resulting can be calculated from:
2***)(* COsoilrefC KKCCtBAF ∆=
where:- refA∆ is the size of the afforested or reforested area (ha),- soilK is a correction factor for losses of carbon from the soil and litter layer (1.3;
Nilsson and Schopfhauser, 1995),-
2COK is a conversion factor to account for the conversion from C units to CO2
units (KCO2 =3.67),)(tB is biomass at time t (Cooper, 1983) and
- CC is the fraction of carbon in the biomass (assumed to be 0.5;IPCC/OECD/IEA, 1996).
For the calculation of the carbon sequestration over periods longer than the rotationlength, a factor (set at 0.20 by default) was used to account for the return of carbonto the atmosphere after harvesting. As such, only 20% of the carbon stored at theend of a rotation is assumed to be permanently sequestered and is added to thesequestration in the next rotation.
Calculations were made for three budget periods, i.e. for the first commitment period(2000-2008, with or without banking) and for longer periods, being from 2000-2050and 2000-2100. The calculations all started for the year 2000.
Forest conservation:The C emissions as a consequence of deforestation can have been calculated as:
EC = BMS * CC * ∆Adef * Ksoil * KCO2
where:- EC is the C emission (Mt yr-1) as a result of deforestation,- BMS is the forest biomass (ton ha -1; FAO, 1995),- CC is the fraction of carbon in the biomass (assumed to be 0.5;
IPCC/OECD/IEA, 1996),- ∆Adef represents the size of the deforested area (ha),- Ksoil is a correction factor for losses of carbon from the soil and litter layer (1.3;
Nilsson and Schopfhauser, 1995) and- KCO2 is a conversion factor to account for the conversion from C units to CO2
units (KCO2 =1 or 3.67).
In case of forest conservation a part of ∆Adef will be saved. How large this part of∆Adef will be, is dependent of the scenario chosen.
Alterra-rapport 777 37
3.6 Cost calculation procedures
The cost calculation procedure is represented schematically in Figure 5. Three kindsof costs can be distinguished for sink projects within CDM. These are:a) operational costsb) transaction costsc) certification costs
The distinction made between costs for forest conservation and af-/reforestationprojects is based on the assumption that for forest conservation the environmentalsustainability and sustainable forest management have no amount in the (operationaland transaction) costs, because they are naturally ‘present’. Though the operationalcosts and the transaction costs are calculated on the basis of af-/reforestationprojects, the forest conservation project costs per ton C are lower than the af-/reforestation project costs per ton C.
3.6.1 Operational costs
The operational costs are the costs of project implementation, including promotion,nurseries, technical assistance, training and overhead. The operational costs (OC) of theFACE and Noel Kempf projects were related to the Gross National Products (GNP) ofthe host countries using linear regression. This resulted in the following equation, whichwas used to calculate the basic operational costs for projects in different countries:
OC = 0.36 + 0.00019*GNP n=6, r2=0.94
The operational costs are influenced by adoption of criteria in CDM projects. Factorsrelating the increase in costs to adoption of a certain criterion are given in Table 18.
Table 18. Project criteria and their weight factors influencing operational costsProject criteria Operational costs factorsProject framework 0.525Additionality 0.000Verifiability 0.095Compliance 0.090Environmental sustainability 0.060 0.000 for forest conservationSocio-economic sustainability 0.055Sustainable forest management 0.090 0.000 for forest conservationTransparancy 0.085Total factor 1.000 0.850 for forest conservation

38 Alterra-rapport 777
Figure 7. Schematic diagram of the cost calculation procedures in CDMFSM
Gross NationalProduct of
selected Countries(US$)
Total cost estimate per countryCountry specific cost estimate, as influenced by criteria applied, desiredprecision level of verification, size of the area used and budget period
length.-1
Detailed project studies (FACE, Noel Kempf, Peugeot)
Operationalcosts
(US$ ton-1 C)
Project framework
Additionality
Compliance
Verifiability
Environmental sustainability
Socio-economic sustainability
Sustainable forest
Transparancy
Certificationcosts
(US$ ton-1 C)
ProjectCountryGross
NationalProduct (US$)
Desired precision level (%)
Transactioncosts
(US$ ton-1 C)

Alterra-rapport 777 39
3.6.2 Transaction costs
Transaction costs represent the running costs of projects and include the expensesmade for preparation, certification and sale. The preparation cost for the FACEprojects were the costs relating to the launch of the Face Foundation, thedevelopment of the contracts and the (internal) monitoring system MONIS,identification of the project countries as well as the projects themselves. Our presentestimates are based on the transaction costs (TC) of the two FACE projects only andwere also related to GNP:
TC = 0.07 + 0.00096*GNP n=2, r2=1.00
The transaction costs are also influenced by the adoption of criteria in CDMprojects. Their weight factors are given in Table 19.
Table 19. Weight factors used to calculate the influence of adoption of criteria on the transaction costsProject criteria Transaction costsProject framework 0.055Additionality 0.020Verifiability 0.345Compliance 0.230Environmental sustainability 0.050 0.000 for forest conservationSocio-economic sustainability 0.045Sustainable forest management 0.050 0.000 for forest conservationTransparancy 0.205Total factor 1.000 0.900 for forest conservation
3.6.3 Certification costs
Certification costs depend partly on the level of uncertainty that is required for aproject. Certification costs include a) monitoring (remote sensing, field work andreporting), b) costs incurred by the certifying agency, and c) in the case of the FACEprojects, supervision by Face Foundation. If a low uncertainty level is needed, moresample plots will be required, which increases the costs. One way of dealing with theuncertainties is by creating a buffer, which accounts for these uncertainties. In thespreadsheet model, the level of precision can be given. The relation for the increaseof certification costs (CC) with the desired precision level (P) was obtained fromPowell (1999) with Noel Kempf project data. Relations between certification costsand gross national product were established for five precision levels, being 5, 10, 20,25 and 30% and the respective equations relating the certification costs to hostcountry GNP are given below.
CC = 0.89 + 0.00032*GNP, P = 5%CC = 0.63 + 0.00022*GNP, P = 10%CC = 0.58 + 0.00021*GNP, P = 20%CC = 0.58 + 0.00021*GNP, P = 25%CC = 0.57 + 0.00020*GNP, P = 30%
40 Alterra-rapport 777
Unlike the operation and transaction costs, the certification costs are not influencedby adoption of the criteria in projects.
3.6.4 Projection of present costs estimates to the future
The cost calculations for the different periods were based on the present costs ofsetting up a CDM project. For long-term financial projections a discount rate isnormally used to correct for inflation, etc. This rate is usually set to a value of around5%. Applying this discount rate would increase the cost estimates presented in thisreport by a factor of 1.8 (i.e. 1.05 to the power of 12) for the first commitmentperiod and 11.5 and 131.5 for the 50- and 100-year periods, respectively.
The projects currently under investigation have not yet provided financial returns onthe investment and may only start doing so after the first commitment period whenplantations are mature. Projected cost estimates over longer periods will have to becorrected with income generated by the projects through future sale of timber, non-forest timber products, eco-tourism, etc. As the returns on the investment arepresumably close to 100% for af-/reforestation projects, and perhaps a bit less forforest conservation projects, the present price level may be a fair indication for thecosts of CDM sink projects in the near future (i.e. first commitment period).
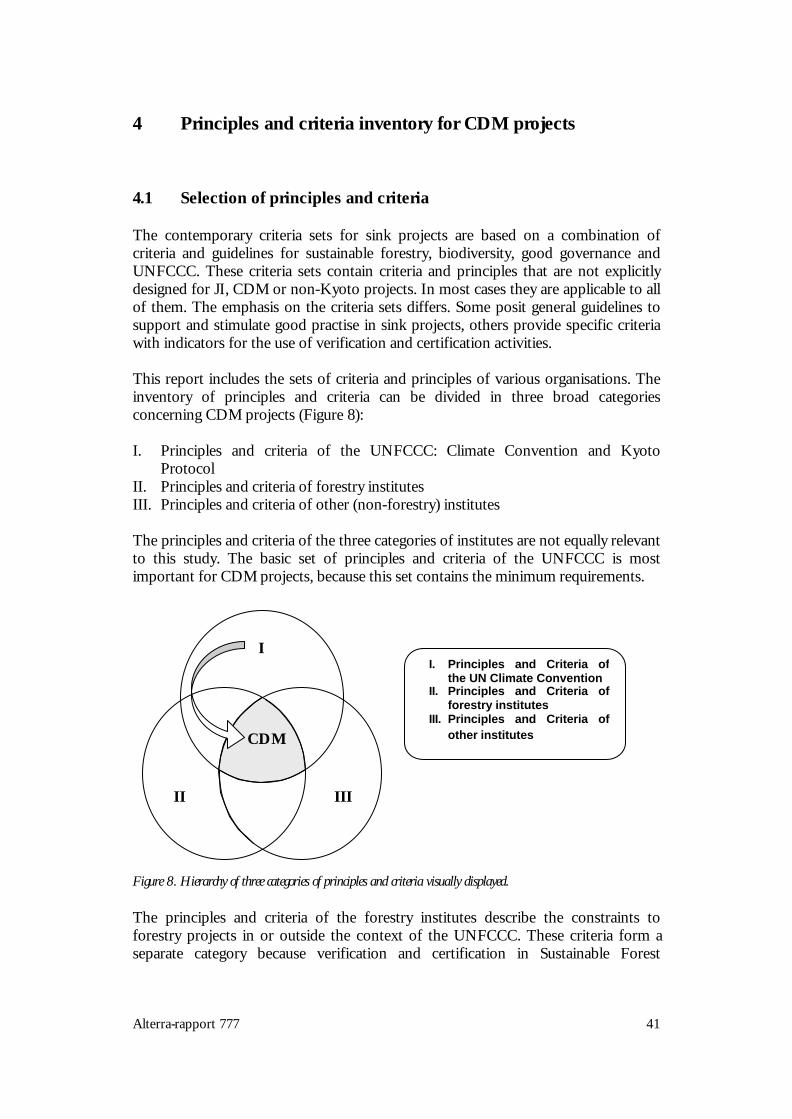
Alterra-rapport 777 41
4 Principles and criteria inventory for CDM projects
4.1 Selection of principles and criteria
The contemporary criteria sets for sink projects are based on a combination ofcriteria and guidelines for sustainable forestry, biodiversity, good governance andUNFCCC. These criteria sets contain criteria and principles that are not explicitlydesigned for JI, CDM or non-Kyoto projects. In most cases they are applicable to allof them. The emphasis on the criteria sets differs. Some posit general guidelines tosupport and stimulate good practise in sink projects, others provide specific criteriawith indicators for the use of verification and certification activities.
This report includes the sets of criteria and principles of various organisations. Theinventory of principles and criteria can be divided in three broad categoriesconcerning CDM projects (Figure 8):
I. Principles and criteria of the UNFCCC: Climate Convention and KyotoProtocol
II. Principles and criteria of forestry institutesIII. Principles and criteria of other (non-forestry) institutes
The principles and criteria of the three categories of institutes are not equally relevantto this study. The basic set of principles and criteria of the UNFCCC is mostimportant for CDM projects, because this set contains the minimum requirements.
Figure 8. Hierarchy of three categories of principles and criteria visually displayed.
The principles and criteria of the forestry institutes describe the constraints toforestry projects in or outside the context of the UNFCCC. These criteria form aseparate category because verification and certification in Sustainable Forest
I. Principles and Criteria ofthe UN Climate Convention
II. Principles and Criteria offorestry institutes
III. Principles and Criteria ofother institutes
IIIII
I
CDM

42 Alterra-rapport 777
Management are operational and are closely related to forest activities under theKyoto Protocol.
The third category consists of ‘criteria and principles’ sets that are additional to thefirst two categories. Some of the criteria and principles are partially enclosed in thosecategories. Other strengthen the categories I and II, making them more extensiveand at the same time harder to realise. This way a path is set out from category I to acombination of all categories. The third category encloses the first initiatives ofcriteria and principle sets for greenhouse gas abatement, sink and CDM projects.
This study only deals with carbon sinks related to the forestry sector, i.e. af-,reforestation and reduced deforestation, and not activities in e.g. the energy sector.Some of the criteria listed below may be to specific for these sectors to be applied.Differences between sectors can lead to revaluation of and change of emphasis oncriteria and principles.
The category index is used to obtain a ranking of criteria sets. This ranking rangesfrom mandatory to additional. In general, additional criteria increase the projectcosts, not taking into account possible side-benefits derived from implementation ofthe criteria.
A total of 14 sets have been used. These are those of the UNFCCC, the KyotoProtocol, CIFOR, ITTO, FSC, PEFC, COV, FIPIC, MPWG, WWF, Convention onBiological Diversity, World Bank, GEF, IPCC4 and several Dutch policy papers. TheUNFCCC and the Kyoto Protocol are part of the first Category. All criteria setsrelated to forestry organisations are included in the second category.
The third category is divided into three sections: 1) Sink and GHG abatement projectcriteria, 2) National (i.e. Dutch) criteria and 3) criteria set by Internationalorganisations. The sink and GHG abatement project criteria are part of those set byCOV/SGS, FIPIC/ECOR and IPCC. The second section includes guidelines andcriteria stated in Dutch policy documents. The World Bank, GEF and theBiodiversity Convention are the enclosed international organisations.
4.1.1 Climate Convention and the Kyoto Protocol
The articles of the UNFCCC under the Climate Convention and the Kyoto Protocolprovide indirect criteria and guidelines for sink projects. Article 12 defines the CleanDevelopment Mechanism and sets conditions on projects that may be eligible underthis article. The following CDM criteria and conditions can be derived from the textson this subject in the Climate Convention and Kyoto Protocol:
4 UNFCCC = United Nations Framework Convention on Climate Change, CIFOR = Center for International
Forestry Research, ITTO = International Tropical Timber Organisation, FSC = Forest Stewardship Council,PEFC = Pan European Forest Certification, COV = Carbon Offset Verification, FIPIC = FederationInternationale Pour L’Isolmente du Carbone, MPWG = Montreal Process Working Group, WWF = WorldWildlife Fund, GEF = Global Environment Facility and IPCC = Intergovernmental Panel on Climate Change.
Alterra-rapport 777 43
• Legal and institutional compliance• Changes in carbon uptake must be real and measurable• Financially and environmentally additional• Technology transfer to non Annex I country• Environmental sustainability• Social sustainability• Sustainable development requirement• No unjustifiable discrimination between host countries• Non-Annex I country will benefit from CDM projects• Carbon sequestration before 2000 can not be accounted• Public as well as private entities can participate• Permanence needs to be ensured• Sovereignty needs to be ensured
However, the texts in these articles provide only a framework for projects carried outunder the Kyoto Protocol and can not be viewed as listing any operational criteria.There are too many possibilities for different interpretations of the same text bydifferent actors. These articles must therefore be viewed only as rough guidelines forCDM projects. Decisions to be made at future sessions of the UNFCCC andspecially developed criteria for sink projects or other types of CDM projects areconsidered to be the next step. Annex A provides a full description of the differentcriteria mentioned above and also includes literature references.
4.1.2 Forestry Institutes
A set of eight generic criteria is given in Table 20. This set of generic criteria isderived from principles and criteria guidelines defined by several internationalforestry, timber and certifying organisation (CIFOR5, ITTO6, FSC7, PEFC8, MPWG9
and). However, not all the criteria listed in Table 20 are mentioned explicitly in theguidelines of these organisations. Some criteria are a logical consequence of othercriteria listed in the certification guidelines, whereas some certificates and guidelineslack certain generic criteria. This does not imply that those guidelines are of lesserimportance. The choice of the eight criteria listed in Table 20 is somewhat subjective.This means that other subdivisions, which would also include the same eight criteria,are possible.
The principles and criteria of the different organisations are given in Annex B. Thenumbers (À through Ç) in this annex (separate column) correspond with thenumbers (À through Ç) in the column before the criteria in Table 20.
5 Center for International Forestry Research6 International Tropical Timber Organisation7 Forest Stewardship Council8 Pan European Forest Certification9 Montreal Process Working Group
44 Alterra-rapport 777
4.1.3 Other institutes
Criteria and principles for CDM and sink projects can be expanded with criteria setsfrom outside the climate and forestry organisations. New sets are derived fromregulations and guidelines of development aid on national and international level.The selection includes the GAVIM principles of the Dutch Ministry ofDevelopment, PCF criteria of the World Bank, general GEF criteria and UNDPprinciples. A description of the above documents is included in Annex C. Thecriteria and guidelines are linked with the generic criteria under paragraph 4.2.
4.1.3.1 Sinks and GHG abatement project criteria
For the purpose of this study, the selected criteria sets of COV/SGS10, FIPIC 11 andWWF12 have been assessed. The COV certification system was the most complete setassessed in this study. The system is already in practise and can be, in principle,applied to both greenhouse gas abatement and sink projects. The COV system doesnot include sustainable forest management criteria. These criteria are indirectlycovered by environmental and socio-economic sustainability. Requirements forforestry activities are therefore specific included.
The FIPIC criteria set covers the same aspects as the COV, though the system is notas thorough and can only be referred to as a set of general guidelines.
The WWF criteria aim at CDM projects in general. The accent is on environmentalsustainability, monitoring and verification. The forest management practises arecompletely left aside.
The IPCC criteria set is direct related to the UNFCCC, but only provides advisoryguidelines and no binding criteria. When these guidelines are translated intooperational criteria, they will be part of the first category. In the Special Report onLand Use, Land Use Change and Forestry by the IPCC five technical issues wereexplicitly addressed:• Permanence and risks• Baselines and additionality• Leakage• Accounting• Associated impacts
A summary of the chapter on sink projects in the IPCC Special Report is provided inAnnex E.
10 Carbon Offset Verification/Société Génerale de Surveillance11 Féderation Internationale Pour L’Isolemente du Carbone12 World Wildlife Fund

Alterra-rapport 777 45
4.1.3.2 National (Dutch) criteria
Several Dutch policy papers have stated criteria that could be applied to sink projectunder the CDM. The papers and guidelines come primarily from the Ministry ofAgriculture, Nature Management and Fisheries and the Ministry of Development.These criteria, or a combination of them, are not sufficient to construct a practicalcriteria set for sink project under the CDM. The following documents and criteriahave been assessed:• The Dutch Government Policy Paper on tropical rainforests, 1992, The Hague• Forest policy act; international forestry policy, 1993, The Hague• National criteria as a result from the Pan European Ministerial Conference on the protection of
forests in Europe, 1993, Helsinki• GAVIM principles of the Dutch Ministry of Development Co-operation
Current policies primarily deal with non-sink aspects of potential sequestrationprojects. The emphasis is on environmental sustainability, socio-economicsustainability, management practises, sustainable forest management, politicalcircumstances and compliance. The documents lack criteria or guidelines onverifiability of results, measurement requirements and additionality. The GAVIMprinciple approaches the criteria for CDM projects but the principles are not yetspecific enough to be of immediate use in sink projects.
4.1.3.3 International organisations
The criteria of the GEF, World Bank, the Convention on Biological Diversity andUNCED have been assessed as well. The UNCED criteria are the result of theStortenbeker working group in 1992 and can be considered to be the first set ofcriteria for sustainable forest management. The criteria set focuses on thecontinuation of functions of the forest ecosystem.
The GEF and World Bank have extended experience and knowledge with(environmental) projects in developing countries. About 40% of the GEF money isassigned for climate change projects and activities. Both organisations focus onconsistency, fund additionality and quality (such as best practises, cost-effectivenessand local benefits). The principles and criteria of the World Bank and the GlobalEnvironmental Facility (GEF) are covered by the eight generic criteria defined in thisstudy.
The Convention on Biological Diversity has a diverse set of criteria. The Primaryfocus is on conservation and sustainable use of resources. Identification, monitoring,education, training, adjusted decision-making and technology transfer are tools tofulfil these goals.
Adoption of criteria listed by international organisations is not a guarantee againstproject failure. This has been illustrated by Niles (2000), who calculated such failure

46 Alterra-rapport 777
rates13 of World Bank projects across the world. The world average failure rate is66%, varying between 90%14 and 20% (Malaysia).
4.2 Generic set of criteria
Table 20 gives an overview of the criteria sets used by eight different internationalorganisations dealing with forestry and sink-related organisations projects. A genericcriteria set has been derived from this overview. Each criteria set mentioned in thisstudy has been compared to the generic criteria set to detect overlap or supplements.The criteria are applicable to sink projects under CDM but must defined in moredetail before being implemented. The criteria do not exclude plantation forests.Plantations can be managed sustainable if appropriate measures are taken. The eightgeneric criteria aim at sink projects under CDM. But the criteria, except thesustainable forestry management criterion, or also applicable to other CDM projects.The criteria address common principles that also apply to non-forestry projects.
Annex A to Annex C contain full descriptions of all criteria assessed in this study.Each criteria set is linked to the generic criteria set with the numbers À through Çstated in Table 20. A more extensive description of the generic criteria can be foundin Annex D.
4.2.1 Project framework
The project framework should contain a policy, planning and institutionalframework, in which the following issues are dealt with:• management plan, management team and staff• measuring, accounting, monitoring and verifying system• project duration• funding• compliance, use rights and responsibilities
The project framework criterion also includes the organisational activities throughoutthe project lifetime that are described in a work plan.
13 The estimates were derived by multiplying the percent of World Bank projects in a country that were evaluatedas successful times the percent of projects in a country that were judged to be sustainable.14 Failure rates for Angola, Cambodia, CAR, Congo, Madagascar, Nicaragua, Nigeria, Paraguay and Zambia. The10% succeeding rate resembles a rate lower than 10% or absent of data.

Alterra-rapport 777 47
Table 20. Set of eight generic criteria derived from eight international forestry, timber and certifying organisations
Organisation →
Criteria ↓ CIFO
R
ITTO
FSC
PEFC
CO
V /
SG
S
FIPI
C
MPW
G
WW
F
À Project framework 3 3 3 3 3 3 3 3
Á Additionality 3 3
 Verifiability 3 3 3 3
à Compliance 3 3 3 3 3
Ä Environmental sustainability 3 3 3 3 3 3 3 3
Å Socio-economic sustainability 3 3 3 3 3 3 3
Æ Sustainable forest management 3 3 3 3 1 3
Ç Transparency 3 3 3 3
1: indirectly includes in  and Ã
The framework provides a solid base to secure the successful implementation of theproject. It also provides a basis for implementation of additional criteria.
This criterion contributes to all objections and concerns, but especially to:permanence enhancement and risk reduction, knowledge transfer, competence andinfrastructure, avoids political instability.
4.2.2 Additionality
Projects can not claim certified emission reductions unless project proponents makereasonable demonstration that the project’s practices for emission reductions are‘additional’ to the ‘business as usual’ (also called the ‘reference case’ or ‘baseline’).Additionality is a key criterion for CDM projects due to the fact that the hostcountries do not have emission reduction targets themselves. As such, CDM projectscan create new emission allowances for Annex 1 countries, which should be balancedby reductions in the non-Annex I host country for carbon neutrality reasons.Enforcing the additionality criterion should guarantee that projects can not claimcertified emission reductions unless demonstrated that the claimed project’s emissionreductions are indeed ‘additional’ to the ‘business as usual’ scenario in the hostcountry. CDM projects should, at least to some extent, be additional in financialterms to ensure that they would not have happened in the ‘business as usual’ scenarioand to avoid subsidising commercially viable business activities. Additionality iscrucial for the acquisition of CERs for sequestered carbon under the UNFCCC. The

48 Alterra-rapport 777
criterion demands evidence that the project would not have occurred otherwise. Theadditionality should be corrected for ‘slippage and leakage’15. There are threecategories of leakage: project, regional and national. Verifiability and additionalitycriteria should contain a framework to reduce leakage. Project and regional leakagecan be controlled for a large part through measures on the project level. Nationalleakage should be controlled on both national and project levels. Hence, withoutnational co-operation, leakage on a national level cannot be controlled properly.
This criterion contributes to: accounting, additionality, leakage, permanence andrisks.
4.2.3 Verifiability
The verification and monitoring of CDM sink projects requires effective monitoringand control systems. Monitoring procedures should be consistent and replicable overtime. Furthermore, the scale and intensity of forest management operations as well asthe relative complexity and fragility of the affected environment should determinethe frequency and intensity of monitoring. Special care is needed to determineleakage, risks and uncertainties of sink projects. The verifiability criterion guaranteesa successful implementation of verification and monitoring methodology that is ableto measure and determine the actual sequestered carbon, uncertainties, leakage andassociated impacts.
This criterion contributes to: monitoring, accounting, additionality, leakage,permanence and risks.
4.2.4 Compliance
There should be compliance with international, national and local regulations andtreaties. All applicable and legally prescribed fees, royalties, taxes and other chargesshould be paid. The host country should voluntary accept the CDM project, withoutany external intimidation or economic retaliation. This criterion could be used tosolve sovereignty issues, as projects have to comply with national laws concerninglandownership, etc.
Compliance contributes to: avoiding political instability, credit sharing, additionalityand permanence.
15 Slippage is the geographic relocation of GHG emission causing activities, as a result of the project’s
implementation. Leakage is increased GHG emissions indirectly incentivised by the project: e.g. increaseddown-stream processing activities.
Alterra-rapport 777 49
4.2.5 Environmental sustainability
Maintenance, conservation and enhancement of biological diversity should reachenvironmental sustainability. Impacts on the ecosystem and its function should beprevented or reduced. Furthermore, the soil structure, fertility, water quality andbiological activity should be maintained or improved.
Contributes to: environmental sustainability, additionality, leakage, monitoring andknowledge transfer.
4.2.6 Socio-economic sustainability
Socio-economic sustainability should be reached by preventing or reducing impacton local communities, their activities, their resources and their cultural values.Projects should encourage employment by indigenous people and promotetechnology/knowledge transfer, training and capacity building.
Contributes to: socio-economic sustainability, political sustainability, knowledgetransfer, infrastructure and capacity building,
4.2.7 Sustainable forest management
The sustainable forest management (SFM) criterion is a derivative of the criteria forenvironmental and socio-economic sustainability. This criterion is enclosed becauseit addresses the issue of forest management more specifically.
Sustainable forest management should aim for protection, conservation andrestoration of natural forests and sustainable management of plantations.Furthermore it should conserve or contribute to biological diversity. It should alsostrive toward economic viability, which means that yield and quality shall besustained and the local economy be strengthened and diversified.
Contributes to: social and environmental sustainability and monitoring.

50 Alterra-rapport 777
Need Want
CriteriaObjections � � � � � � � �
Permanence andrisks • • • • • •
Baselines andadditionality • • • • • •
Leakage:project and land-
based• • • • •
Accounting andaccounting methods • • • • •
Uncertainty in sinkcapacity and socio-
economic processes• • • •
Sustainabledevelopment:
environmentally• • •
Sustainabledevelopment:
Socio-economic• • •
Capacity-buildingand technology
transfer• • • •
Political stability andliability • • •
4.2.8 Transparency
Transparency shouldguarantee reproducibleresults from measurementand monitoring methodsand give insight into themethodology. It shouldalso guarantee insight intoproject progress, projectimpacts and results,management and fundingto the UNFCCC, theconcerned parties andeveryone who isinterested. Direct pro-ducts of transparency arepublications that arepublicly accessible (hard-copy or through theInternet).
Contributes to: insight inleakage, additionality,monitoring, accountingand knowledge transfer.
Table 21. Indicators of the eight generic criteria subdivided into eleven elements.
4.3 Overview of generic criteria
The generic criteria selected from the criteria sets are listed in Table 21. The criteriaare listed in hierarchical order. The first criteria are essential for a successfulimplementation of carbon sequestration projects. The other criteria are desirable toexpand the reach of these sink projects and limit negative any impacts. The order is,to some extent, subject to change due to changes in objections to sinks in the CDM.The effect on costs and potential of sink projects in the CDM does affect the order.
The major objections to sinks in the CDM (i.e. scale, permanence and risk) are notcovered by each criterion. The general criteria set can be utilised to deal with thetechnical issues, to which the objections are related. Table 21 links the criteria withthe objections against sink projects in CDM.

Alterra-rapport 777 51
Each criterion has its own set of indicators, which determine the extension of thecriterion. The indicators concretise criteria, providing a detailed description of thecriteria. Annex D provides a general overview of the indicators and elements of thecriteria. These indicators are distilled from the criteria sets provided and used byrelevant international organisations.
The criteria ‘additionality’and ‘project framework’ are crucial for the implementationof any sink project. Without these criteria, the framework for proper and effectivemanagement and implementation of other criteria lacks and one of most importantcriteria for accepting sink activities under the UNFCCC is not fulfilled.
Sustainable development is embedded in several criteria. It can be argued thatsustainable development does not only add extra value to sink projects, but also dealswith several of the technical issues. By providing substitution for local communities,a large part of the leakage can be prevented. In addition, sustainable development canbe an incentive for capacity-building and technology transfer.
Implementation of sink activities under the CDM will, for a large part, depend on theinclusion of the incentive of industrialised countries to support developing countriesin achieving sustainable development.
The lesser important criteria (see Table 21) will affect the costs and potential ofcarbon sequestration to some extend. Adopting these criteria increases project costsand the pressure on available land for sink activities. However, implementing thesecriteria is of great importance to minimise any negative effects of sinks under theCDM.

52 Alterra-rapport 777
Alterra-rapport 777 53
5 In-depth project and case studies.
5.1 Introduction
In-depth and case studies of existing projects were made to assess the impact ofadoption of one or more criteria in CDM projects on project volume (i.e. potentialarea) and costs. For the in-depth studies, two FACE were selected. For Malaysia, aseparate case study was made to see how sink projects could, in practice, beimplemented in a political and legal framework.
5.2 Cost calculations
In a previous report (Waterloo et al., 2000) cost estimates of the FACE projects (Holet al., 1999) were used to obtain estimates for the costs of carbon sequestration. Thevalues used, however, were the quotient of the end capacity of the planted forestsand the investment of FACE. This approach was one of the pre-Kyoto accountingoptions, which can now be regarded as obsolete. Moreover, in the calculations ofHol et al. (1999), the costs for certification and long-term monitoring, which are partof the transaction costs, were not taken into account. As a result, their cost estimateswere only indicative for operational costs and do not reflect the total costs incurredby carbon sequestration projects.
Three factors determine the costs of C sequestration, i.e. 1) the costs per hectare forafforestation, 2) the capacity and rate of sequestration as compared to the baselineand 3) the method used for the accounting of the certified offset. If based on themaximum C sequestration capacity of the forests, the afforestation costs for thevarious FACE projects will range from 2.2 to 25.7 Euro per tonne C. Some 85% ofall costs incurred by Face involve operational costs. Because the majority ofpreparation costs, including the costs relating to the launch of the Face Foundation,the development of the contracts and the monitoring system, the identification of theproject countries as well as the projects themselves, were one-off in nature, theoverhead is set to decrease substantially in time. Operational costs comprise plantingcosts (including the construction of infrastructure) as well as costs of supplementaryresearch and training. At year-end 1997 the latter represented an average of 7% ofaggregate costs, a percentage which is set to decrease as the projects progress.
Costs can be calculated on a per-hectare or a per tonne C basis. The latter requiresthe following data:1. Costs per hectare2. Sequestration of C per ha as compared to the baseline3. Length of accounting period
54 Alterra-rapport 777
Presently, the costs include:• Operational costs: planting costs, the construction and maintenance of the infra-
structural facilities and the project framework, and costs of supplementary researchand training. Overheads of the FACE Foundation headquarters are allocated to thevarious projects with equal shares
• Transaction costs: the expenses made for preparation, certification and sale.• Preparation cost: these are the costs related to the launch of the Face Foundation,
the development of the contracts and the (internal) monitoring system ‘MONIS’,the identification of host countries and potential projects. Within the FACEFoundation, preparation costs are allocated to the different projects with equalshares.
• Certification costs include a) monitoring (remote sensing, fieldwork andreporting), b) costs incurred by the certifying organisation, and c) supervision ofthe certification process by the FACE Foundation.
The financial analysis requires the selection of an inflation and interest rate fordiscounting purposes. At present, the FACE Foundation uses 2% inflation and 6%discount rates to deduce NPVs.
Carbon accounting requires the selection of a suitable time frame. For Carbonsequestration projects this may be:• the first commitment period (2008-2012),• a number of consecutive budget periods,• the project lifetime,• the project lifetime after the start of the first budget period,• any other time frame regarded as appropriate for the analysis, e.g. 25 or 50 years
economic lifetime.
The determination of the costs per tonne C also depends on how the sequestrationwill be offset internationally. At the Kyoto Climate Conference, agreements weremade on the timetable for achieving compliance with the greenhouse gas reductionobligations. The same timetable has been set for the settlement of JI projects. Notimetable has as yet been set for projects coming under the CDM banner. At the finalsettlement date of 2012 about 45,000 ha of FACE projects, implemented until theend of 1999, will have resulted in the sequestration of some 2.2 million tonnes of C,as a very conservative estimate. Accumulating offsets from 1990 until the end of2012, the approximately 33 million US$ of expenses will by that time result in costsof about 15 US$ per tonne C (see Table 22). If calculations are made for the offsetduring the commitment period 2008-2012, the costs per tonne C will beapproximately 33 US$. In CDM (if at all applicable to sinks), accounting of certifiedemission reductions will be from the year 2000 towards the end of the commitmentperiod (‘banking’), yielding average costs for FACE of 9.2 US$ per tonne C. Itshould be noted that, as sequestration continues, the subsequent costs per tonne of Cwould drop considerably, as they will by then consist of nothing other thanmonitoring and reporting. There is quite a difference among FACE projects in terms
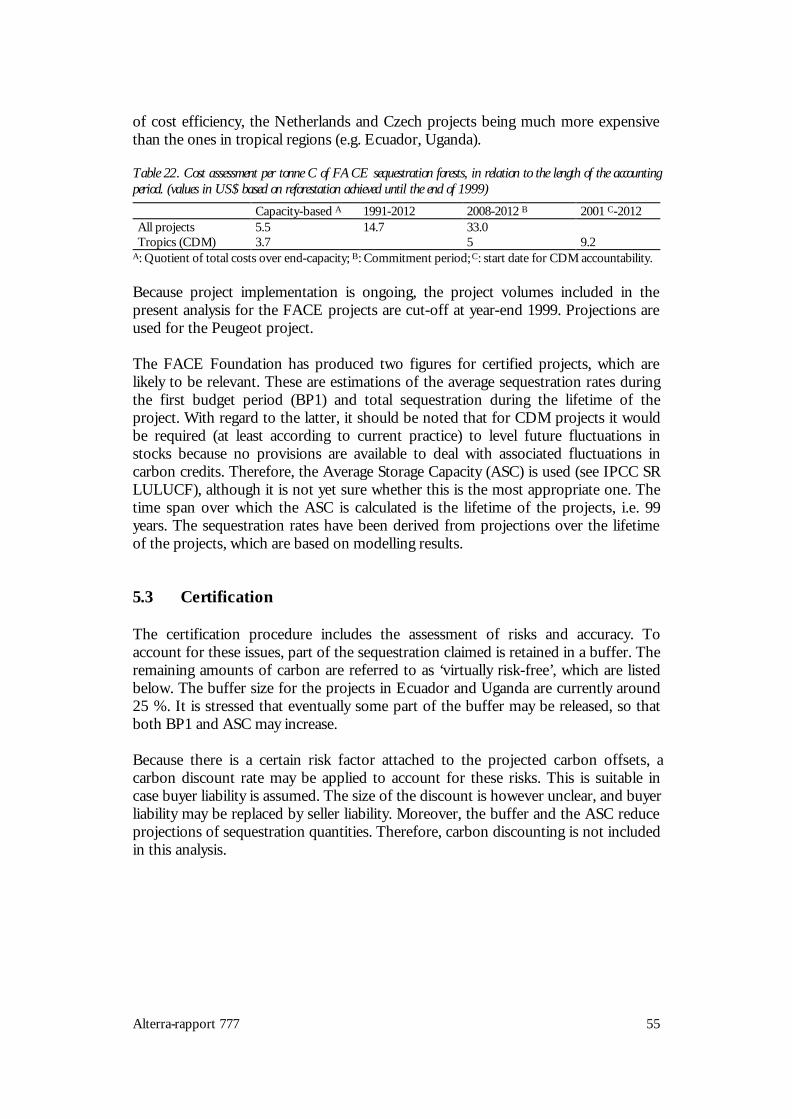
Alterra-rapport 777 55
of cost efficiency, the Netherlands and Czech projects being much more expensivethan the ones in tropical regions (e.g. Ecuador, Uganda).
Table 22. Cost assessment per tonne C of FACE sequestration forests, in relation to the length of the accountingperiod. (values in US$ based on reforestation achieved until the end of 1999)
Capacity-based A 1991-2012 2008-2012 B 2001 C-2012All projects 5.5 14.7 33.0Tropics (CDM) 3.7 5 9.2
A: Quotient of total costs over end-capacity; B: Commitment period; C: start date for CDM accountability.
Because project implementation is ongoing, the project volumes included in thepresent analysis for the FACE projects are cut-off at year-end 1999. Projections areused for the Peugeot project.
The FACE Foundation has produced two figures for certified projects, which arelikely to be relevant. These are estimations of the average sequestration rates duringthe first budget period (BP1) and total sequestration during the lifetime of theproject. With regard to the latter, it should be noted that for CDM projects it wouldbe required (at least according to current practice) to level future fluctuations instocks because no provisions are available to deal with associated fluctuations incarbon credits. Therefore, the Average Storage Capacity (ASC) is used (see IPCC SRLULUCF), although it is not yet sure whether this is the most appropriate one. Thetime span over which the ASC is calculated is the lifetime of the projects, i.e. 99years. The sequestration rates have been derived from projections over the lifetimeof the projects, which are based on modelling results.
5.3 Certification
The certification procedure includes the assessment of risks and accuracy. Toaccount for these issues, part of the sequestration claimed is retained in a buffer. Theremaining amounts of carbon are referred to as ‘virtually risk-free’, which are listedbelow. The buffer size for the projects in Ecuador and Uganda are currently around25 %. It is stressed that eventually some part of the buffer may be released, so thatboth BP1 and ASC may increase.
Because there is a certain risk factor attached to the projected carbon offsets, acarbon discount rate may be applied to account for these risks. This is suitable incase buyer liability is assumed. The size of the discount is however unclear, and buyerliability may be replaced by seller liability. Moreover, the buffer and the ASC reduceprojections of sequestration quantities. Therefore, carbon discounting is not includedin this analysis.
56 Alterra-rapport 777
5.4 Eligibility criteria as cost factors
Eligibility criteria and related indicators as listed in Chapter 5 can be regarded as costfactors for individual projects. There are basically 2 approaches to establish thequantitative effect of these criteria, i.e.:• include or exclude sub-sets of criteria or• determine the weight of each criterion with regards to its effect on total costs or
cost items
The advantage of the first approach is strictly methodological. It would assumeproject structures, which have no significance in reality. In fact, the effects of theselected criteria are essentially fuzzy and cannot be attached to a single cost item.Therefore, the second approach seems more appropriate, in spite of the fact that theweighing of criteria is at least partially subjective. The analysis given in the followingsections for the FACE projects is based on the second approach. It should be clearthat the weight factors are based on the experience and judgement of the FACEmanagement team and that it is difficult to provide more objective indications.
The influence of criteria on project costs are given separately for the operationalcosts (i.e. implementation costs, including promotion, nurseries, technical assistance,training and overhead) and the transaction costs. The certification costs are muchless dependent on the adoption of certain criteria in a project. The weights assignedto each criterion, expressed as percentages of total cost, are presented in Table 25 forEcuador and Table 29 for Uganda.
The results indicate that requirements for a proper project framework weighrelatively heavily on operational costs. SFM-related requirements particularly havesome effect on certification costs. This implies that the project will be SFM-compliant mostly due to other requirements, but that in order to demonstrate SFMcompliance certain costs must be absorbed. Environmental sustainability will beassured provided that the identification of the project has been properly conducted.If significant costs are expected, the project may fail in the identification phase.Remaining costs pertain to training, research and monitoring. Socio-economicsustainability relies on an appropriate identification as well. Revenues for thebeneficiaries depend on proper project management, and thus on monitoring,technical assistance and administration. As the projects are embedded in programmesfor regional development and international frameworks, compliance is a significantcost factor particularly in project operation. It is not surprising that transaction costsare affected by the verifiability and transparency criteria. Additionality does not leadto significant project costs since the identification process is supposed to cover thisbefore project implementation.
5.5 Effect of criteria on potential project area
The FACE Foundation has visited 14 countries to assess their potential for hostingprojects. The countries included in this identification phase were Costa Rica,

Alterra-rapport 777 57
Indonesia (2 sites), Russia, Belize, Bhutan, Colombia, Poland, Jamaica, Venezuela,Czech Republic, Ecuador, Uganda, Malaysia and The Netherlands. Criteria adoptedfor the identification of projects included additionality, cost-efficiency and socialacceptability. Furthermore, projects had to fit into the regional planning. Theidentification phase showed that baselines were not always transparent and that insome cases there was lack of faith in project sustainability. If potential projects areassessed against FACE Foundation criteria, land tenure appears as a major factor.FACE only concludes contracts with landowners. In quite a large number ofdeveloping countries, land titles may not be in the hands of people using the land.The capacity of FACE to manage a portfolio of projects is also an important factor.It is believed that in order to assure a good performance, projects should be lean andnot very large. For example, large-scale plantations are excluded for environmentaland ecological reasons, but also for the sake of proper control given the eligibilitycriteria. The quality of sink enhancement depends on verifiability and transparency,so these are also factors. If compliance with these criteria is to be assured, there willbe certain limits to project size. It is however difficult to quantify this accurately. Theresults of the identification phase were that the majority of the potential projects inthe 14 countries failed before implementation. Therefore, project identificationagainst Face Foundation criteria does have a significant effect on project volume. Asan approximation, 9/14th or 64 % of the thoroughly identified projects did not reachthe implementation phase. It is unclear whether a larger number of countries orpotential projects would have led to a higher or lower score. The failure of a projectin a specific country does indicate that non-compliance with the adopted criteria wasobserved on the project level, but this does not reflect in any way on the potential ofthe countries to host other CDM projects.
5.6 Programa FACE de Forestacíon project (PROFAFOR), Ecuador.
Organisations: FACE Foundation and INEFANStart date project: 3 June 1993 (Letter of Intent: 1998)Land area contribution by FACE: 5.000 hectare/yearLand area in period 1993-2000: 34.500 hectareReforested area per 31-12-99: 21.472 hectare
The project aims at afforestation of high-elevation Paramo grasslands in the Andeswith exotic and indigenous trees. The project area is reforested in co-operation withthe local agricultural community. Agricultural activities (mainly cattle breeding) arenot very profitable in the project area. The FACE Foundation collaborates with theEcuadorian Forestry Service (INEFAN) to afforest 75.000 hectare of grassland.Local community organisations (e.g. farmers and village committees) apply forapproval of afforestation projects on their land. The Profafor (Programa FACE deForestacíon) programme was established to assess these community applications andsettle contracts. If approval was gained, financial contributions and planting materialswere provided. Exotic pine and eucalypt species are mainly planted at this momentbecause there is yet little knowledge on the silvicultural aspects of afforestation withindigenous trees. A knowledge base for indigenous species is being developed and
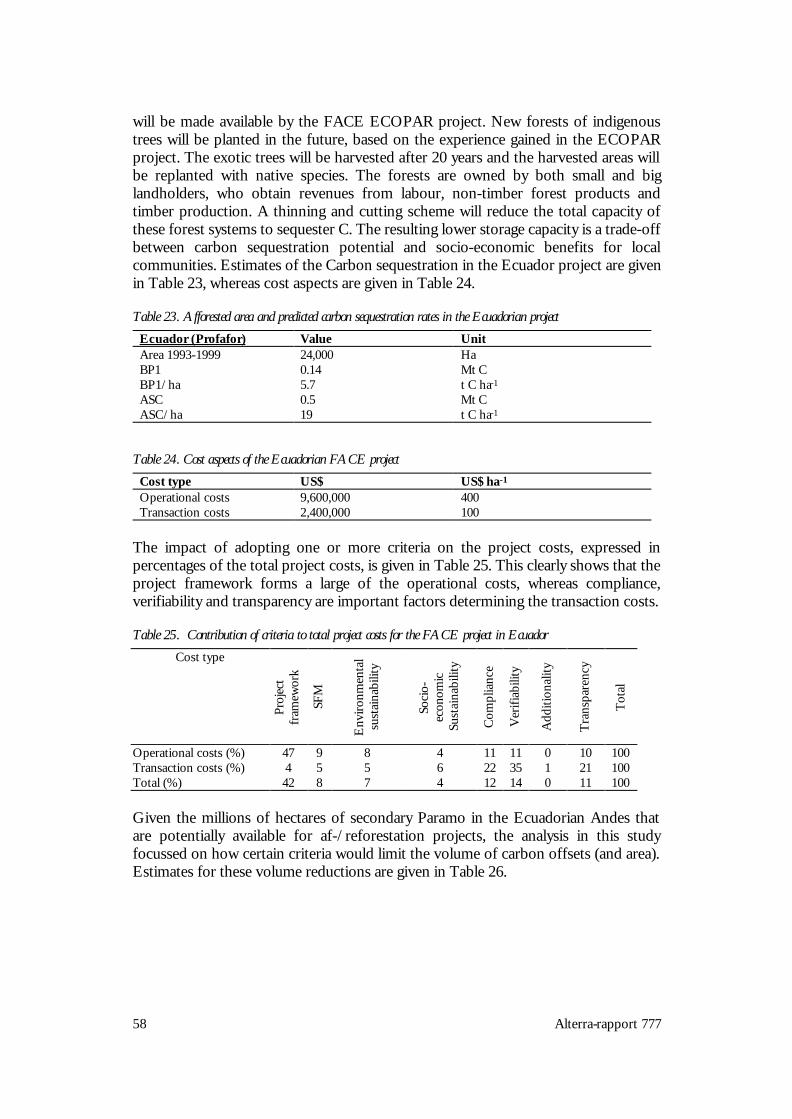
58 Alterra-rapport 777
will be made available by the FACE ECOPAR project. New forests of indigenoustrees will be planted in the future, based on the experience gained in the ECOPARproject. The exotic trees will be harvested after 20 years and the harvested areas willbe replanted with native species. The forests are owned by both small and biglandholders, who obtain revenues from labour, non-timber forest products andtimber production. A thinning and cutting scheme will reduce the total capacity ofthese forest systems to sequester C. The resulting lower storage capacity is a trade-offbetween carbon sequestration potential and socio-economic benefits for localcommunities. Estimates of the Carbon sequestration in the Ecuador project are givenin Table 23, whereas cost aspects are given in Table 24.
Table 23. Afforested area and predicted carbon sequestration rates in the Ecuadorian projectEcuador (Profafor) Value UnitArea 1993-1999 24,000 HaBP1 0.14 Mt CBP1/ha 5.7 t C ha-1
ASC 0.5 Mt CASC/ha 19 t C ha-1
Table 24. Cost aspects of the Ecuadorian FACE projectCost type US$ US$ ha-1
Operational costs 9,600,000 400Transaction costs 2,400,000 100
The impact of adopting one or more criteria on the project costs, expressed inpercentages of the total project costs, is given in Table 25. This clearly shows that theproject framework forms a large of the operational costs, whereas compliance,verifiability and transparency are important factors determining the transaction costs.
Table 25. Contribution of criteria to total project costs for the FACE project in EcuadorCost type
Proj
ect
fram
ewor
k
SFM
Env
ironm
enta
lsu
stai
nabi
lity
Soci
o-ec
onom
icSu
stai
nabi
lity
Com
plia
nce
Ver
ifiab
ility
Add
ition
ality
Tran
spar
ency
Tota
l
Operational costs (%) 47 9 8 4 11 11 0 10 100Transaction costs (%) 4 5 5 6 22 35 1 21 100Total (%) 42 8 7 4 12 14 0 11 100
Given the millions of hectares of secondary Paramo in the Ecuadorian Andes thatare potentially available for af-/reforestation projects, the analysis in this studyfocussed on how certain criteria would limit the volume of carbon offsets (and area).Estimates for these volume reductions are given in Table 26.
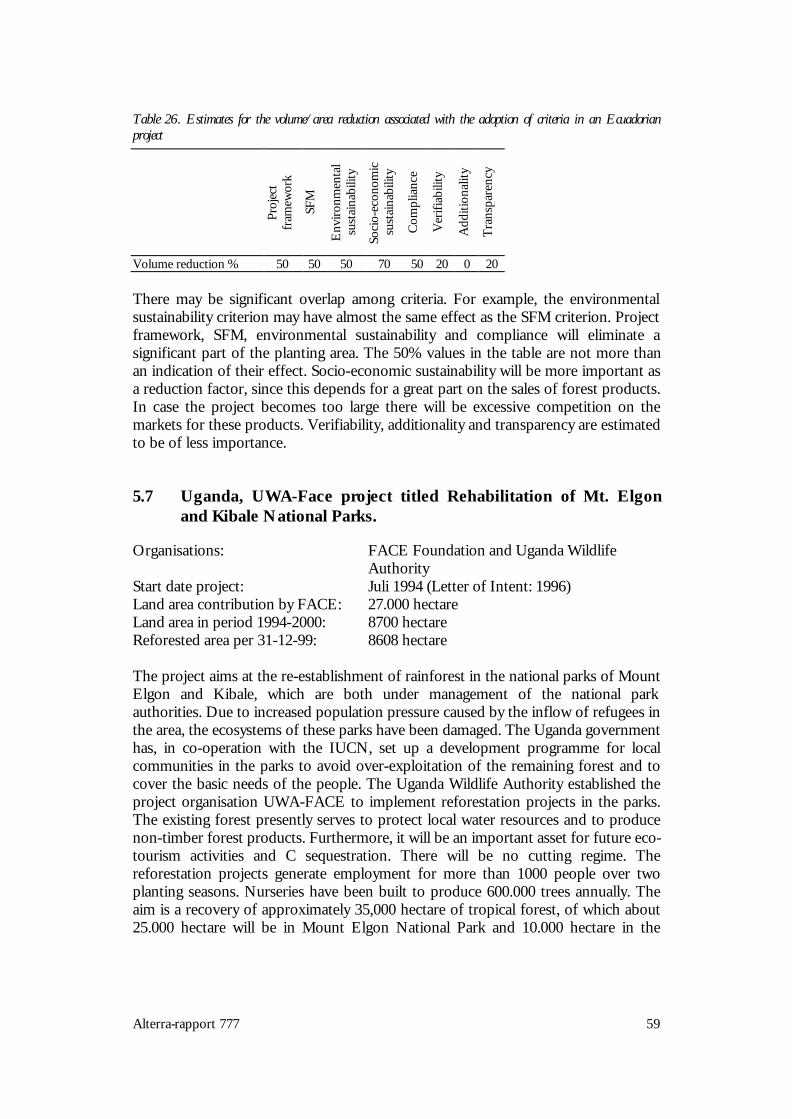
Alterra-rapport 777 59
Table 26. Estimates for the volume/area reduction associated with the adoption of criteria in an Ecuadorianproject
Proj
ect
fram
ewor
k
SFM
Env
ironm
enta
lsu
stai
nabi
lity
Soci
o-ec
onom
icsu
stai
nabi
lity
Com
plia
nce
Ver
ifiab
ility
Add
ition
ality
Tran
spar
ency
Volume reduction % 50 50 50 70 50 20 0 20
There may be significant overlap among criteria. For example, the environmentalsustainability criterion may have almost the same effect as the SFM criterion. Projectframework, SFM, environmental sustainability and compliance will eliminate asignificant part of the planting area. The 50% values in the table are not more thanan indication of their effect. Socio-economic sustainability will be more important asa reduction factor, since this depends for a great part on the sales of forest products.In case the project becomes too large there will be excessive competition on themarkets for these products. Verifiability, additionality and transparency are estimatedto be of less importance.
5.7 Uganda, UWA-Face project titled Rehabilitation of Mt. Elgonand Kibale National Parks.
Organisations: FACE Foundation and Uganda Wildlife AuthorityStart date project: Juli 1994 (Letter of Intent: 1996)Land area contribution by FACE: 27.000 hectareLand area in period 1994-2000: 8700 hectareReforested area per 31-12-99: 8608 hectare
The project aims at the re-establishment of rainforest in the national parks of MountElgon and Kibale, which are both under management of the national parkauthorities. Due to increased population pressure caused by the inflow of refugees inthe area, the ecosystems of these parks have been damaged. The Uganda governmenthas, in co-operation with the IUCN, set up a development programme for localcommunities in the parks to avoid over-exploitation of the remaining forest and tocover the basic needs of the people. The Uganda Wildlife Authority established theproject organisation UWA-FACE to implement reforestation projects in the parks.The existing forest presently serves to protect local water resources and to producenon-timber forest products. Furthermore, it will be an important asset for future eco-tourism activities and C sequestration. There will be no cutting regime. Thereforestation projects generate employment for more than 1000 people over twoplanting seasons. Nurseries have been built to produce 600.000 trees annually. Theaim is a recovery of approximately 35,000 hectare of tropical forest, of which about25.000 hectare will be in Mount Elgon National Park and 10.000 hectare in the

60 Alterra-rapport 777
Kibale National Park. Estimates of the Carbon sequestration in the Uganda projectare given in Table 27, whereas cost aspects are given in Table 28.
Table 27. Afforested area and predicted carbon sequestration rates in the Uganda project (UWA-FACE)Value Unit
Area 1994-1999 8,600 HaBP1 0.2 Mt CBP1 ha-1 20 t C ha-1
ASC 0.9 Mt CASC ha-1 110 t C ha-1
Table 28. Cost aspects of the Uganda FACE projectCost type US$ US$ ha-1
Operational costs 6,450,000 750Transaction costs 1,075,000 125
The impact of adopting one or more criteria on the costs of the project in Uganda,expressed in percentages of the total project costs, is given in Table 29. This againshows that the project framework forms a large of the operational costs, whereascompliance, verifiability and transparency are important factors determining thetransaction costs.
Table 29. Contribution of criteria to total project costs for the FACE project in UgandaCost type
Proj
ect f
ram
ewor
k
SFM
Env
ironm
enta
lsu
stai
nabi
lity
Soci
o-ec
onom
icsu
stai
nabi
lity
Com
plia
nce
Ver
ifiab
ility
Add
ition
ality
Tran
spar
ency
Tota
l
Operational costs 58 9 4 7 7 8 0 7 100Transaction costs 7 5 5 3 24 34 2 20 100Total 49 8 4 6 10 12 0 9 100
The FACE Foundation considers reforestation projects at any significant scale inUganda only feasible in co-operation with national park authorities (UWA). This isbecause of socio-economic factors such as the opportunity cost for land and therequired security about land tenure. Furthermore, national parks can add functionssuch as watershed management and carbon sequestration to forest ecosystemswithout obstructing the livelihoods of large numbers of people. The volume/areareduction numbers in Table 30 therefore pertain to an analysis, which was limited tonational parks in Uganda.
The reduction values attached to the various criteria are generally low. A largenumber of national parks in a portfolio of projects in Uganda would increase thestrain on UWA, which may frustrate project framework, verifiability andtransparency to some degree. It is also expected that local communities living justoutside the parks will be limited in their use of forest resources during therehabilitation stage of the forests, thus affecting the socio-economic sustainability.

Alterra-rapport 777 61
Table 30. Estimates for the volume/area reduction associated with the adoption of criteria in the Uganda project
Proj
ect f
ram
ewor
k
SFM
Env
ironm
enta
lsu
stai
nabi
lity
Soci
o-ec
onom
icsu
stai
nabi
lity
Com
plia
nce
Ver
ifiab
ility
Add
ition
ality
Tran
spar
ency
Volume reduction % 30 0 0 30 0 20 0 20
5.8 Malaysia
5.8.1 Cost scenarios for carbon storage by preventing deforestation inMalaysia
5.8.1.1 Introduction
This section describes how the implementation of sink projects can be incorporatedinto the legal frameworks of a country. The case study is made for Malaysia whereCarbon emissions by deforestation could be avoided through reforestation andconservation projects. It should be noted here that in countries where thedeforestation rate is low or zero as a result of good forest management, theopportunity to gain income from carbon rights will also be limited to zero. Efforts topromote conservation and reforestation are effective means to counteract emissionsfrom land use change and have the added advantage of contributing to theconservation of biodiversity. This case study could be made with the help of theDepartment of Forestry in Kuala Lumpur and their information is appreciated.However, all views expressed in this study are those of the Dutch working grouponly.
In this case study, we shall explore the possible costs and benefits through extraefforts (for additionality) to avoid deforestation in the Permanent Forest categories(scenario 1) and the impact of extra efforts to maintain carbon stocks in State Forests(scenario 2).
5.8.1.2 Forest categories in Malaysia
Land use issues are the responsibility of the State in Malaysia. A number of forestcategories have been recognised. Some of these categories are not counted into thedeforestation rate, such as state land forests, which are earmarked for (urban)development. In this case the term ‘forest loss’ is used, rather than deforestation.Permanent categories of natural forest, which are threatened by deforestation inMalaysia include:• Permanent Forest Estate (PFE),• Wild life reserves,

62 Alterra-rapport 777
• Bird sanctuaries and• National parks.
In the PFE, production forest areas have been identified for selective timberharvesting, whereas protection forests have been declared protected forenvironmental reasons.
In Malaysia, 4.81 million ha of agricultural plantations have been established over theyears. The establishment of rubber plantations in particular is conceived to be a goodalternative to timber harvested in natural forests (Thang, pers. comm.). Theseplantations form a forest category in itself, which will not be considered further here.Another forest category is that of Native Customary Right forest land where, amongothers, traditional agriculture (e.g. shifting cultivation) and agro-forestry activities areallowed. The deforestation activities permitted in this category are not legal in thepermanent forest areas.
5.8.1.3 Forest areas in Malaysia
Estimates from 1998 indicate that the total forest area in Malaysia covers 19.0 Mha,or 58% of the total area. A forest area of 14.3 Mha has been assigned to the PFEcategory. A large part of this area (10.8 Mha) has been assigned Production Forest.The remaining 3.4 Mha has been assigned Protection Forest for water resourcesprotection and soil conservation, whereas 90,400 ha is under protection as VirginJungle Reserves (JVG). These JVG areas represent different forest ecosystems inMalaysia and are used as in-situ arboreta. Another 2.12 Mha serve as wildlife reservesand bird sanctuaries. Finally, 0.5 Mha coincide with the PFE including an area of 0.3Mha in Peninsular Malaysia and 0.1 Mha in Sabah (Thang, pers. comm.).Permanently managed natural forest therefore covers an area of 12,6 million ha.
To meet the purpose of this case study, the following assumption were made just toget an idea of the overall possibilities of CDM projects in Malaysia, withoutrepresenting the actual facts. We assume that there is a deforestation rate in thepermanent forest areas (10.3 Mha) of 1%, which is, for the ease of calculations, set ata loss of 100,000 ha of forest in terms of biomass.
For simulations with the scenarios listed above, we have assumed that thedeforestation rate in Malaysia is 1% of the total forest area per year, and may bedecreased by CDM activities to 0.5. It is a fact that these assumptions may not bebeneficial for countries that have already achieved low deforestation rates throughgood forest management. For instance, the loss of forested areas in PeninsularMalaysia between 1993 and 1998 was 0.1 Mha (from 6.0 Mha to 5.9 Mha), which isequivalent to an annual loss of 15,000 ha, i.e. far less than 1% on an annual base. .
In the scenario for public land (scenario 2), we assume that 50% of the area will beset aside for PFE. There are indeed efforts to add State Forest land to the PFE. In
Alterra-rapport 777 63
Peninsular Malaysia, the PFE covered 4.7 Mha in 1983 and 4.9 Mha in 1998, adding0.2 Mha over the 15-year period.
5.8.1.4 Sustainable Forest Management third party certification
In July 2000, the National Forestry Council in Malaysia agreed with the ‘MalaysianCriteria and Indicators (MC&I)’ for sustainable forest management, responding tomarket conditions for certified timber in the export markets. In 2000, the PFEproduction forests are expected to be in the process of certification under the MC&Iof the National Timber Certification Council Malaysia (NTCC Malaysia). Thesecriteria and indicators cover both national and Forest Management Unit (FMU)levels. The third party auditing is ongoing for all permanent production forest inPeninsular Malaysia and is based on a) the minimum requirements set by the Dutchgovernment as adopted by the Keurhout foundation and b) a sub-set of therequirements of the MC&I. This subset can be considered to comply with all crucialcriteria and indicator requirements for sustainable forest management.
The third party certification will presumably be an extra stimulus to stop intrusion inthe PFE and will help to conserve the forest resources for future generations. Weexpect that in the coming years the States of Sarawak and Sabah will follow theexample set by Peninsular Malaysia. In this respect it may be important that theefforts in COP 6 in the Haque will appreciate the efforts of countries to achievesustainable forest management. It should be avoided that good behaviour ofgovernments with respect to forest conservation and battling deforestation is costlyin terms of achieving carbon credits.
5.8.1.5 Costs of sustainable forest management certification
The present direct costs for certification audits and trekking of the timber to theconsumer (chain of custody) are 2-3 USD per cubic meter of timber. Assuming arotation period of 30 years, a net extraction of 60 m3 ha-1 and a total production areaof 14,3 Mha, the costs on a per hectare basis of production forest land are about 4-6USD. This figure is expected to decrease in response to a higher degree ofcompliance with sustainable forest management criteria, and increased competitors inthe certification business.
The indirect costs of complying with the standards of performance set forsustainable forest management are high. These costs include those for infrastructureimprovement, project management and monitoring costs. We estimated the indirectcosts in Peninsular Malaysia, with 2,83 Mha of production forest (Thang, pers.comm.), at 0.46 billion USD (New Straits Times, 1998; Thang, pers. Comm.) orabout 300 USD per ha over a period of 30 years.
The direct economic returns from sustainably managed forests after regulation arenot impressive. Preliminary calculations indicate that within a rotation period a return

64 Alterra-rapport 777
of 50 USD ha -1 yr-1 can be achieved, which is only one-tenth of the return gainedfrom a well-managed oil palm plantation (Diemont, 2000a). However, when thepublic value of the natural forest is taken into consideration, the return may well behigher than gained from any agricultural use of the area (Diemont 2000a). Thequestion is how to take these public values into account, i.e. who is willing to pay? Inthis respect, the income generated by extra efforts to conserve the carbon poolformed by natural forest is not only interesting from a cost perspective for Annex 1countries, but also as a source of income for Annex 2 countries such as Malaysia.
5.8.1.6 Scenario`s
Two scenarios will be described below. The first deals with the Production Forestarea in the PFE, whereas the second concerns Forest State land.
Scenario 1 ‘PFE’
As sustainable forest management certification does imply that high standards ofperformance must be achieved, there is no reason to assume that the additional costfor carbon credits are high. Sustainable forest management certification impliesalready that no excess logging is allowed, that the boundaries of forest areas remainfixed and that, in principle, carbon fixation can be estimated fairly easily.
Assuming that annually one percent of forest in the PFE (or 100,000 ha) will besaved, the income generated is equivalent to USD 20 per ha, assuming that 200 tonneC per ha is saved and that the price of the carbon will be 10 USD per ton C. Specialattention should be given to peat forests in Malaysia. Because these peat lands storesome 2,500 tonne C ha-1.
For protection forest and national parks, extra costs may have to be made to estimatethe standing biomass and control the park boundaries. The costs of estimatingstanding biomass in protection forest are estimated 2.20 USD per ha using a 1%sampling intensity forest inventory. The costs of cutting and controlling theboundaries are 5,620 per km. No reliable estimates of these costs are yet available,but current estimates converge on a cost lower than 0,25 USD on a per hectare base(Thang, pers. Comm.).
It should also be noted that the carbon content of virgin forest in a forest ecosystemmay be 40 percent higher when compared to regulated natural forest in the samesystem. This in spite of the fact that from a marketable timber perspective theregulated production forests may be much more productive in terms of annualincrements as compared to the virgin forest. If future research confirms thisassumption it may become more profitable in future to convert natural productionforest to Protection forest.
At present, countries in SE Asia, such as Indonesia and Malaysia, are already securingfuture timber demands through the establishment of forest plantations, which are

Alterra-rapport 777 65
thought more cost effective (Worldbank study) than timber harvesting in naturalforest.
Annual average costs for forest management in production forest, includingadministrative and development costs, are 9.9 USD ha -1 and are estimated at 0.6 USDha-1 for protection forest. The costs in case of sustainable forest management arepresumably 1.5–2 times higher than the costs quoted above.
Scenario 2 ‘ state forest’
The State forest area set aside for conversion and land development purposes coversabout 5 Mha. Assuming that Malaysia is willing to make an extra effort to keep thiscarbon pool as it is for the next 25-30 years, Malaysia may not only contributesignificantly to keep global development sustainable, but could also generaterevenues. In this respect it is relevant that already 1 Mha of Forest State land is in theprocess of re-gazettement and will be added to the PFE in Peninsular Malaysia.
Assuming that 50% of the total area will not be converted, this would provide anadditional emission savings of 100 ton C ha-1, which generates revenue of 1000USD, assuming a discount rate of 5%. In the case of peat forest, the savings could beat least a factor 5 to 10 higher. Over a period of 25 years a loss of peat afterdevelopment of to 4 to 8 cm yr-1 could occur, which is equivalent to 500 tot 1000tonnes C loss over the period.
5.8.1.7 Conclusions
An extra effort to conserve part of the Forest State land could mean a significantcontribution to conserving the global carbon pool and therefore generate importantrevenues to the forest owner. For peat forests the revenues from carbonsequestration may be higher then those from conversion to oil palm plantationforest. All conclusions are very sensitive for the revenues to be expected from theCERs.
In Malaysia, a land use planning system exists, which could prevent leakage, andwhen sustainable forest management certification is in place leakage can becontrolled.
It should further be noted that:1. Through sustainable forest management and certification of sustainable forest
management for all production forest it is to be expected that in this forestcategory little deforestation will occur because certificates will be withdrawn.
2. There is a risk that where sustainable forest management is realised, the effortwill not be judged as an extra effort. This would imply that good behaviourcomes with a cost.

66 Alterra-rapport 777
3. Recognising the extra effort where Forest State land is re-gazetted for inclusionin the PFE could substantially reinforce sound management planning andcombat deforestation. Initiatives in progress in Malaysia should be accounted for.
4. A lifetime analysis of harvested timber should also be included to estimate thecontributions made of production forest to sequester carbon. The same shouldbe done to compare the use of wood products and the use of fossil energy foralternatives for wood products.
5. There is a need for a market analysis with respect to carbon rights as to get areasonable price for ‘producers’ which operate in an imperfect market.
The extra costs of conserving carbon in PFE, which is already sustainably managed,will be negligible, but the costs to achieve sustainable forest management are high ascompared of the income generated. With respect to timber no ‘green’ premium canbe expected (de Boer, 1998) and the income from carbon is only 20 USD ha -1. Forpeat forests the annual income from carbon are about 100 USD ha -1 in the PFE.There is a need to estimate the total value of the forest as to see whether investmentsin sustainable forest management are also economically sustainable. If so, it ispossible that non-Annex 1 countries will link the issue of economically sustainableforestry to the costs to achieve sustainable forest management.
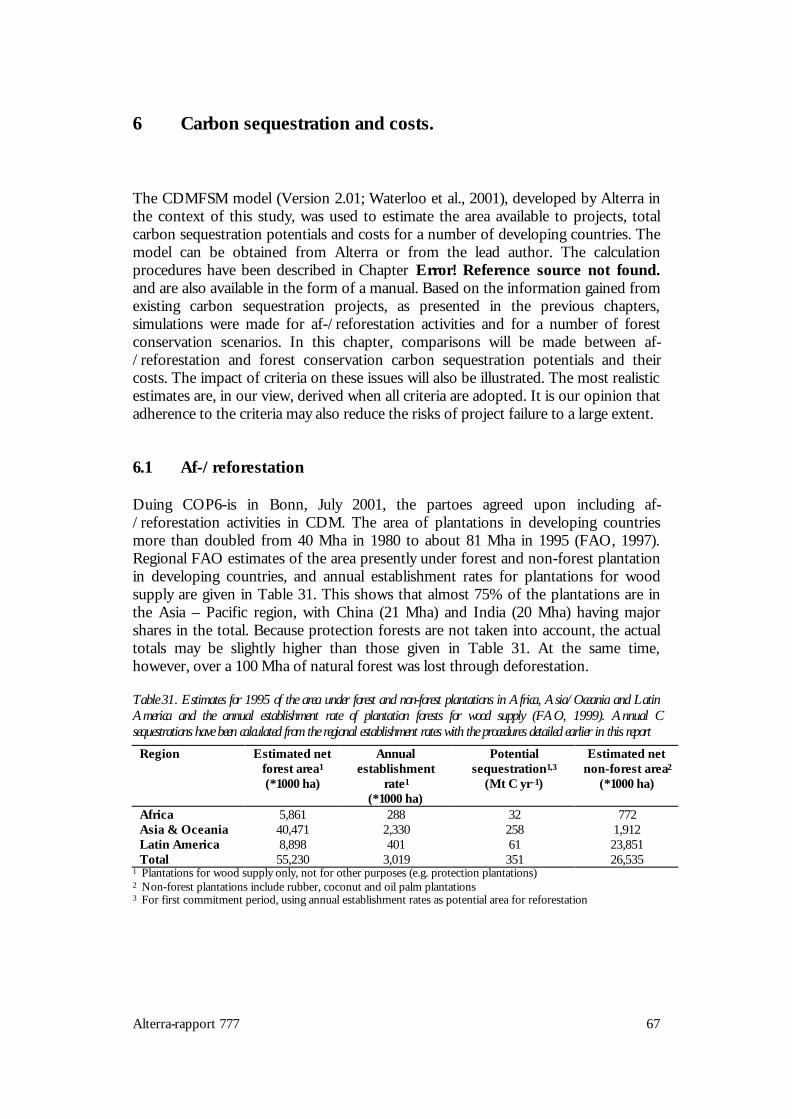
Alterra-rapport 777 67
6 Carbon sequestration and costs.
The CDMFSM model (Version 2.01; Waterloo et al., 2001), developed by Alterra inthe context of this study, was used to estimate the area available to projects, totalcarbon sequestration potentials and costs for a number of developing countries. Themodel can be obtained from Alterra or from the lead author. The calculationprocedures have been described in Chapter Error! Reference source not found.and are also available in the form of a manual. Based on the information gained fromexisting carbon sequestration projects, as presented in the previous chapters,simulations were made for af-/reforestation activities and for a number of forestconservation scenarios. In this chapter, comparisons will be made between af-/reforestation and forest conservation carbon sequestration potentials and theircosts. The impact of criteria on these issues will also be illustrated. The most realisticestimates are, in our view, derived when all criteria are adopted. It is our opinion thatadherence to the criteria may also reduce the risks of project failure to a large extent.
6.1 Af-/reforestation
Duing COP6-is in Bonn, July 2001, the partoes agreed upon including af-/reforestation activities in CDM. The area of plantations in developing countriesmore than doubled from 40 Mha in 1980 to about 81 Mha in 1995 (FAO, 1997).Regional FAO estimates of the area presently under forest and non-forest plantationin developing countries, and annual establishment rates for plantations for woodsupply are given in Table 31. This shows that almost 75% of the plantations are inthe Asia – Pacific region, with China (21 Mha) and India (20 Mha) having majorshares in the total. Because protection forests are not taken into account, the actualtotals may be slightly higher than those given in Table 31. At the same time,however, over a 100 Mha of natural forest was lost through deforestation.
Table 31. Estimates for 1995 of the area under forest and non-forest plantations in Africa, Asia/Oceania and LatinAmerica and the annual establishment rate of plantation forests for wood supply (FAO, 1999). Annual Csequestrations have been calculated from the regional establishment rates with the procedures detailed earlier in this report
Region Estimated netforest area1
(*1000 ha)
Annualestablishment
rate1
(*1000 ha)
Potentialsequestration1,3
(Mt C yr -1)
Estimated netnon-forest area2
(*1000 ha)
Africa 5,861 288 32 772Asia & Oceania 40,471 2,330 258 1,912Latin America 8,898 401 61 23,851Total 55,230 3,019 351 26,535
1 Plantations for wood supply only, not for other purposes (e.g. protection plantations)2 Non-forest plantations include rubber, coconut and oil palm plantations3 For first commitment period, using annual establishment rates as potential area for reforestation
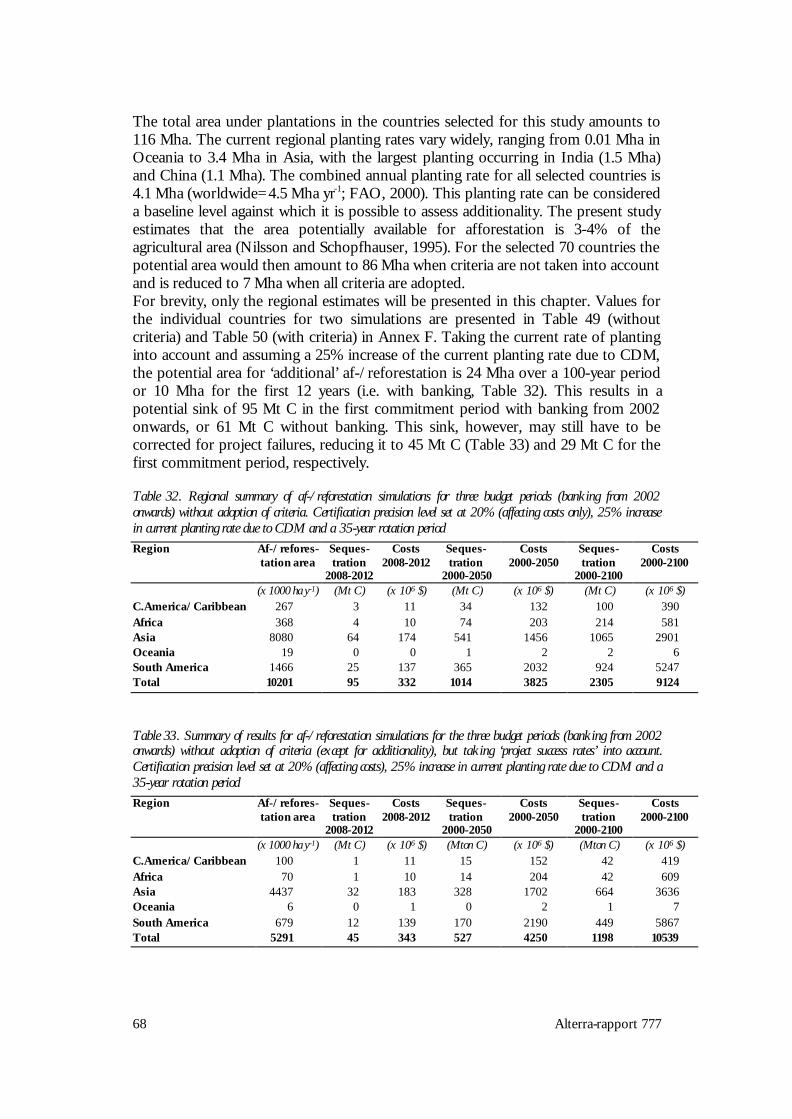
68 Alterra-rapport 777
The total area under plantations in the countries selected for this study amounts to116 Mha. The current regional planting rates vary widely, ranging from 0.01 Mha inOceania to 3.4 Mha in Asia, with the largest planting occurring in India (1.5 Mha)and China (1.1 Mha). The combined annual planting rate for all selected countries is4.1 Mha (worldwide=4.5 Mha yr-1; FAO, 2000). This planting rate can be considereda baseline level against which it is possible to assess additionality. The present studyestimates that the area potentially available for afforestation is 3-4% of theagricultural area (Nilsson and Schopfhauser, 1995). For the selected 70 countries thepotential area would then amount to 86 Mha when criteria are not taken into accountand is reduced to 7 Mha when all criteria are adopted.For brevity, only the regional estimates will be presented in this chapter. Values forthe individual countries for two simulations are presented in Table 49 (withoutcriteria) and Table 50 (with criteria) in Annex F. Taking the current rate of plantinginto account and assuming a 25% increase of the current planting rate due to CDM,the potential area for ‘additional’ af-/reforestation is 24 Mha over a 100-year periodor 10 Mha for the first 12 years (i.e. with banking, Table 32). This results in apotential sink of 95 Mt C in the first commitment period with banking from 2002onwards, or 61 Mt C without banking. This sink, however, may still have to becorrected for project failures, reducing it to 45 Mt C (Table 33) and 29 Mt C for thefirst commitment period, respectively.
Table 32. Regional summary of af-/reforestation simulations for three budget periods (banking from 2002onwards) without adoption of criteria. Certification precision level set at 20% (affecting costs only), 25% increasein current planting rate due to CDM and a 35-year rotation periodRegion Af-/refores-
tation areaSeques-tration
2008-2012
Costs2008-2012
Seques-tration
2000-2050
Costs2000-2050
Seques-tration
2000-2100
Costs2000-2100
(x 1000 ha y -1) (Mt C) (x 106 $) (Mt C) (x 106 $) (Mt C) (x 106 $)C.America/Caribbean 267 3 11 34 132 100 390Africa 368 4 10 74 203 214 581Asia 8080 64 174 541 1456 1065 2901Oceania 19 0 0 1 2 2 6South America 1466 25 137 365 2032 924 5247Total 10201 95 332 1014 3825 2305 9124
Table 33. Summary of results for af-/reforestation simulations for the three budget periods (banking from 2002onwards) without adoption of criteria (except for additionality), but taking ‘project success rates’ into account.Certification precision level set at 20% (affecting costs), 25% increase in current planting rate due to CDM and a35-year rotation periodRegion Af-/refores-
tation areaSeques-tration
2008-2012
Costs2008-2012
Seques-tration
2000-2050
Costs2000-2050
Seques-tration
2000-2100
Costs2000-2100
(x 1000 ha y -1) (Mt C) (x 106 $) (Mton C) (x 106 $) (Mton C) (x 106 $)C.America/Caribbean 100 1 11 15 152 42 419Africa 70 1 10 14 204 42 609Asia 4437 32 183 328 1702 664 3636Oceania 6 0 1 0 2 1 7South America 679 12 139 170 2190 449 5867Total 5291 45 343 527 4250 1198 10539
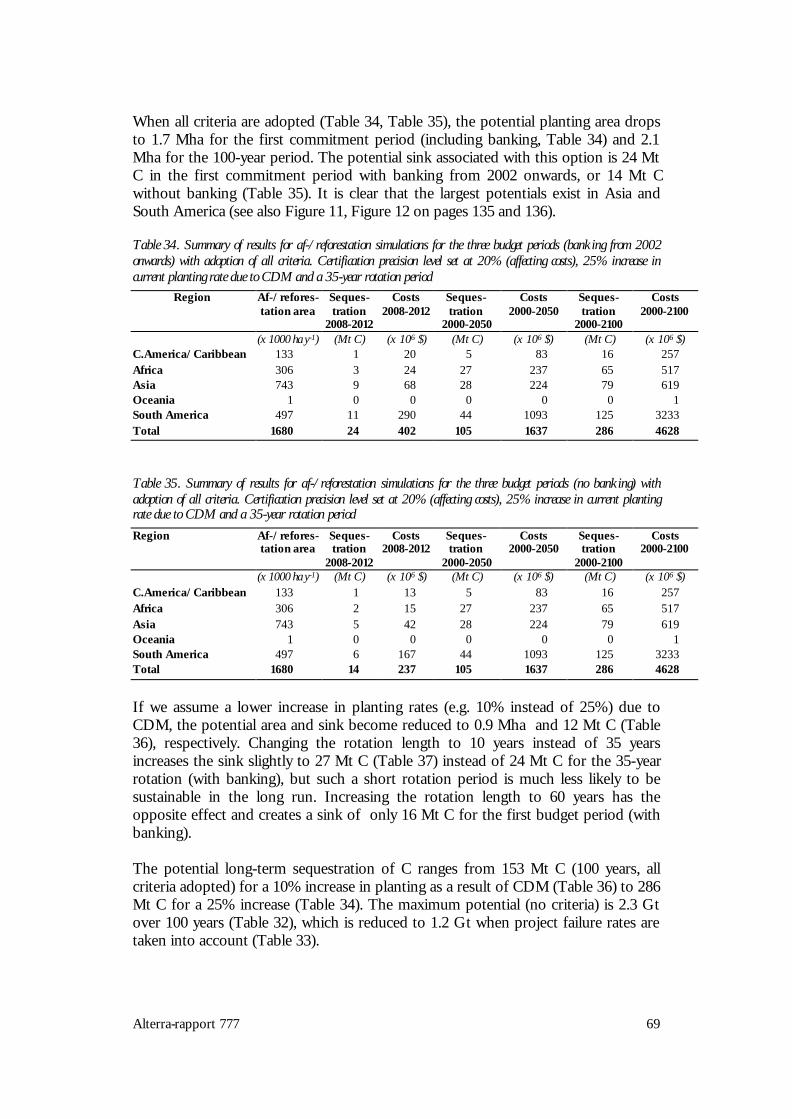
Alterra-rapport 777 69
When all criteria are adopted (Table 34, Table 35), the potential planting area dropsto 1.7 Mha for the first commitment period (including banking, Table 34) and 2.1Mha for the 100-year period. The potential sink associated with this option is 24 MtC in the first commitment period with banking from 2002 onwards, or 14 Mt Cwithout banking (Table 35). It is clear that the largest potentials exist in Asia andSouth America (see also Figure 11, Figure 12 on pages 135 and 136).
Table 34. Summary of results for af-/reforestation simulations for the three budget periods (banking from 2002onwards) with adoption of all criteria. Certification precision level set at 20% (affecting costs), 25% increase incurrent planting rate due to CDM and a 35-year rotation period
Region Af-/refores-tation area
Seques-tration
2008-2012
Costs2008-2012
Seques-tration
2000-2050
Costs2000-2050
Seques-tration
2000-2100
Costs2000-2100
(x 1000 ha y -1) (Mt C) (x 106 $) (Mt C) (x 106 $) (Mt C) (x 106 $)C.America/Caribbean 133 1 20 5 83 16 257Africa 306 3 24 27 237 65 517Asia 743 9 68 28 224 79 619Oceania 1 0 0 0 0 0 1South America 497 11 290 44 1093 125 3233Total 1680 24 402 105 1637 286 4628
Table 35. Summary of results for af-/reforestation simulations for the three budget periods (no banking) withadoption of all criteria. Certification precision level set at 20% (affecting costs), 25% increase in current plantingrate due to CDM and a 35-year rotation periodRegion Af-/refores-
tation areaSeques-tration
2008-2012
Costs2008-2012
Seques-tration
2000-2050
Costs2000-2050
Seques-tration
2000-2100
Costs2000-2100
(x 1000 ha y -1) (Mt C) (x 106 $) (Mt C) (x 106 $) (Mt C) (x 106 $)C.America/Caribbean 133 1 13 5 83 16 257Africa 306 2 15 27 237 65 517Asia 743 5 42 28 224 79 619Oceania 1 0 0 0 0 0 1South America 497 6 167 44 1093 125 3233Total 1680 14 237 105 1637 286 4628
If we assume a lower increase in planting rates (e.g. 10% instead of 25%) due toCDM, the potential area and sink become reduced to 0.9 Mha and 12 Mt C (Table36), respectively. Changing the rotation length to 10 years instead of 35 yearsincreases the sink slightly to 27 Mt C (Table 37) instead of 24 Mt C for the 35-yearrotation (with banking), but such a short rotation period is much less likely to besustainable in the long run. Increasing the rotation length to 60 years has theopposite effect and creates a sink of only 16 Mt C for the first budget period (withbanking).
The potential long-term sequestration of C ranges from 153 Mt C (100 years, allcriteria adopted) for a 10% increase in planting as a result of CDM (Table 36) to 286Mt C for a 25% increase (Table 34). The maximum potential (no criteria) is 2.3 Gtover 100 years (Table 32), which is reduced to 1.2 Gt when project failure rates aretaken into account (Table 33).
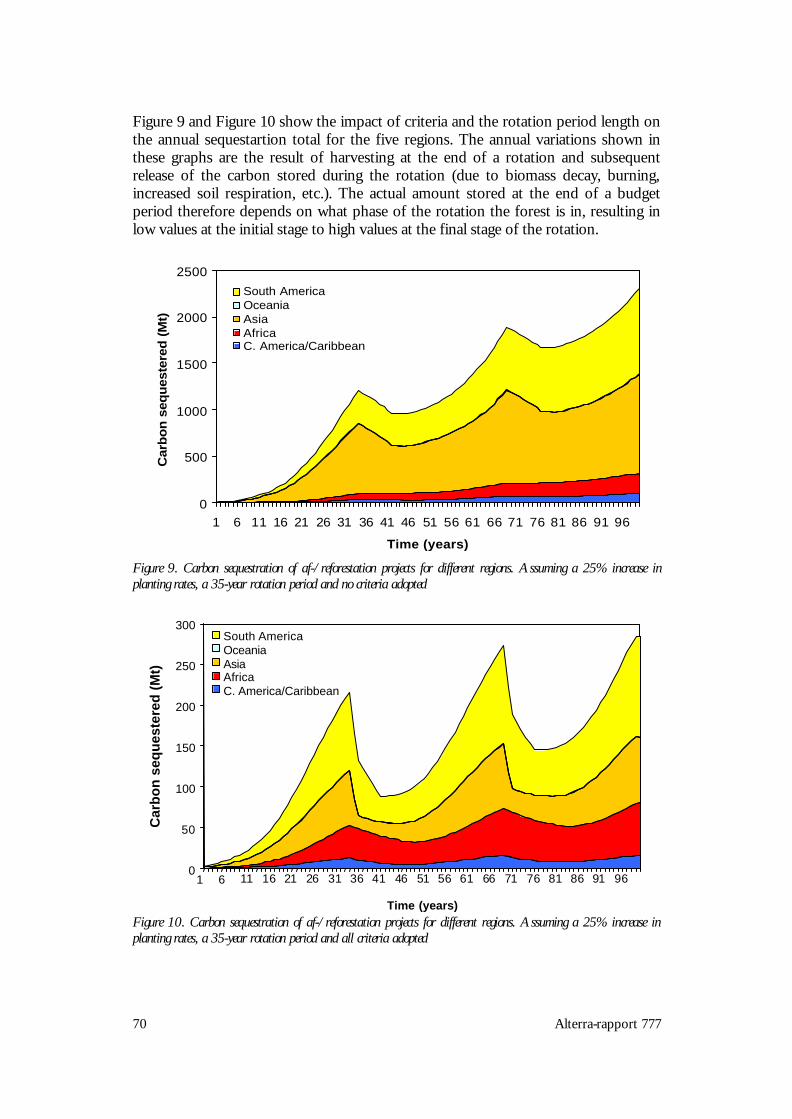
70 Alterra-rapport 777
Figure 9 and Figure 10 show the impact of criteria and the rotation period length onthe annual sequestartion total for the five regions. The annual variations shown inthese graphs are the result of harvesting at the end of a rotation and subsequentrelease of the carbon stored during the rotation (due to biomass decay, burning,increased soil respiration, etc.). The actual amount stored at the end of a budgetperiod therefore depends on what phase of the rotation the forest is in, resulting inlow values at the initial stage to high values at the final stage of the rotation.
Figure 9. Carbon sequestration of af-/reforestation projects for different regions. Assuming a 25% increase inplanting rates, a 35-year rotation period and no criteria adopted
Figure 10. Carbon sequestration of af-/reforestation projects for different regions. Assuming a 25% increase inplanting rates, a 35-year rotation period and all criteria adopted
0
50
100
150
200
250
300
1 6 11 16 21 26 31 36 41 46 51 56 61 66 71 76 81 86 91 96
Time (years)
Car
bo
n s
equ
este
red
(M
t)
South AmericaOceaniaAsiaAfricaC. America/Caribbean
0
500
1000
1500
2000
2500
1 6 11 16 21 26 31 36 41 46 51 56 61 66 71 76 81 86 91 96
Time (years)
Car
bo
n s
equ
este
red
(M
t)
South AmericaOceaniaAsiaAfricaC. America/Caribbean
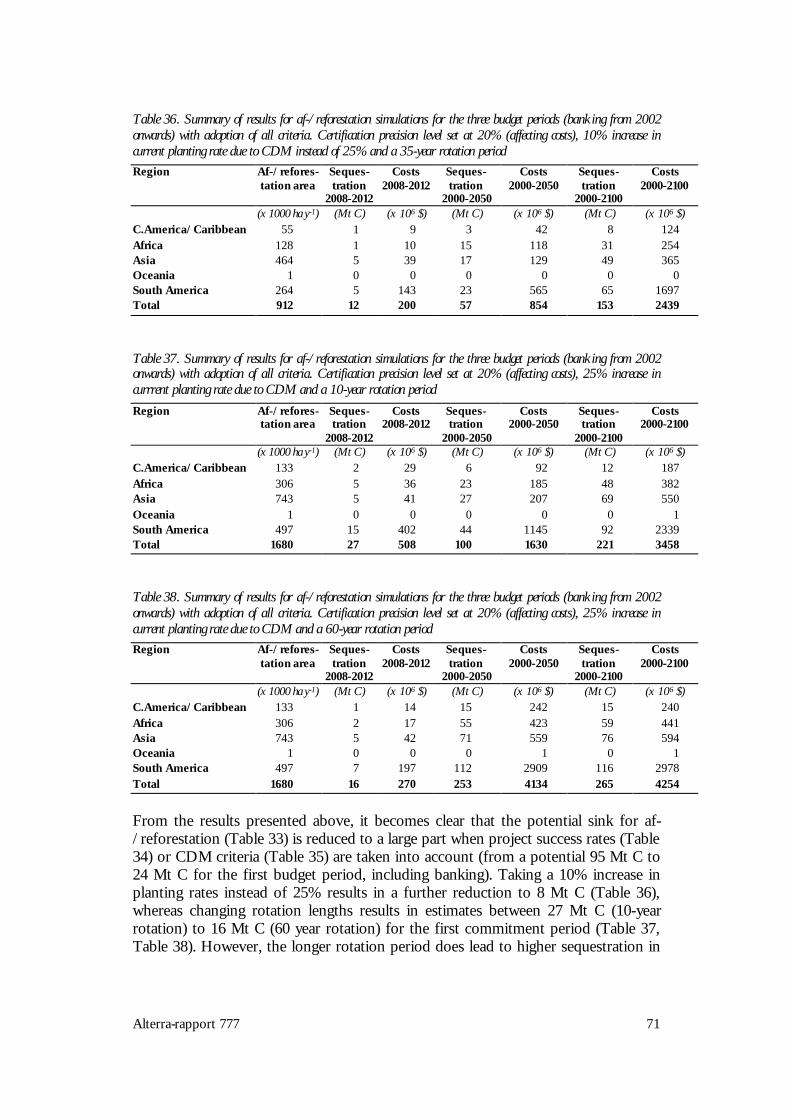
Alterra-rapport 777 71
Table 36. Summary of results for af-/reforestation simulations for the three budget periods (banking from 2002onwards) with adoption of all criteria. Certification precision level set at 20% (affecting costs), 10% increase incurrent planting rate due to CDM instead of 25% and a 35-year rotation periodRegion Af-/refores-
tation areaSeques-tration
2008-2012
Costs2008-2012
Seques-tration
2000-2050
Costs2000-2050
Seques-tration
2000-2100
Costs2000-2100
(x 1000 ha y -1) (Mt C) (x 106 $) (Mt C) (x 106 $) (Mt C) (x 106 $)C.America/Caribbean 55 1 9 3 42 8 124Africa 128 1 10 15 118 31 254Asia 464 5 39 17 129 49 365Oceania 1 0 0 0 0 0 0South America 264 5 143 23 565 65 1697Total 912 12 200 57 854 153 2439
Table 37. Summary of results for af-/reforestation simulations for the three budget periods (banking from 2002onwards) with adoption of all criteria. Certification precision level set at 20% (affecting costs), 25% increase incurrrent planting rate due to CDM and a 10-year rotation periodRegion Af-/refores-
tation areaSeques-tration
2008-2012
Costs2008-2012
Seques-tration
2000-2050
Costs2000-2050
Seques-tration
2000-2100
Costs2000-2100
(x 1000 ha y -1) (Mt C) (x 106 $) (Mt C) (x 106 $) (Mt C) (x 106 $)C.America/Caribbean 133 2 29 6 92 12 187Africa 306 5 36 23 185 48 382Asia 743 5 41 27 207 69 550Oceania 1 0 0 0 0 0 1South America 497 15 402 44 1145 92 2339Total 1680 27 508 100 1630 221 3458
Table 38. Summary of results for af-/reforestation simulations for the three budget periods (banking from 2002onwards) with adoption of all criteria. Certification precision level set at 20% (affecting costs), 25% increase incurrent planting rate due to CDM and a 60-year rotation periodRegion Af-/refores-
tation areaSeques-tration
2008-2012
Costs2008-2012
Seques-tration
2000-2050
Costs2000-2050
Seques-tration
2000-2100
Costs2000-2100
(x 1000 ha y -1) (Mt C) (x 106 $) (Mt C) (x 106 $) (Mt C) (x 106 $)C.America/Caribbean 133 1 14 15 242 15 240Africa 306 2 17 55 423 59 441Asia 743 5 42 71 559 76 594Oceania 1 0 0 0 1 0 1South America 497 7 197 112 2909 116 2978Total 1680 16 270 253 4134 265 4254
From the results presented above, it becomes clear that the potential sink for af-/reforestation (Table 33) is reduced to a large part when project success rates (Table34) or CDM criteria (Table 35) are taken into account (from a potential 95 Mt C to24 Mt C for the first budget period, including banking). Taking a 10% increase inplanting rates instead of 25% results in a further reduction to 8 Mt C (Table 36),whereas changing rotation lengths results in estimates between 27 Mt C (10-yearrotation) to 16 Mt C (60 year rotation) for the first commitment period (Table 37,Table 38). However, the longer rotation period does lead to higher sequestration in

72 Alterra-rapport 777
the long-term (100 Mt C vs. 253 Mt C in 2050) and sustainable forestry will also beeasier to demonstrate than for a short-rotation forest. The relatively low seques-tration rates for the first commitment period reflect the slow growth of plantationsduring the first years after planting.
Due to the large size of their agricultural areas and their relatively high planting rates,India, Brazil, Argentina and China have the largest potentials for carbonsequestration through af-/reforestation activities (Table 49, Table 50, see also Figure11 and Figure 12 on pages 135 – 136). China also has a positive net annual change inforest (no net deforestation within the country) and may therefore encounter lessproblems with accounting for leakage. As a region, Asia seems to offer the largestpotential for af-/reforestation, followed by South America.
The costs of carbon sequestration through af-/reforestation range from 2.2(Democratic Republic of Congo) – 8.8 US$ per tonne C (Argentina) (no criteriaadopted, 20% buffer) to 4.3 - 46.7 US$ per t C (all criteria adopted). The regionalcosts in the latter case range from 7.31 US$ per t C for Africa to 28.25 US$ per t C inSouth America, respectively, using a 20% buffer. The costs for the budget period arein the range of 200 - 508 million US$.
6.2 Forest conservation.
At the time of this study, forest conservation was still an option for carbonsequestration under the CDM in the first commitment period. However, duringCOP6-bis in July 2001, the parties decided that forest conservation projects wouldnot be eligible under CDM for the first commitment period. This has rendered thefollowing section somewhat less relevant as most attention will now be focused onaf-/reforestation projects.
For the 70 developing countries selected for this study the annual deforestation ratetotals 9.5 Mha yr-1. Regional deforestation rates range between 0.1 Mha yr-1 forOceania to 4.7 Mha yr-1 for Africa. Deforestation in the South American regionamounts to 3.7 Mha yr-1, of which 2.3 Mha yr-1 occurs in Brazil alone. The mainproblem with defining a sink potential for forest conservation projects is inestimating how much these deforestation rates could be reduced throughconservation projects. Additionality (as expressed on a country level) would implythat all CDM forest conservation projects combined would result in reduceddeforestation rates for a region/country as compared to a certain baseline level (e.g.current deforestation rates). For projects in countries with increasing deforestationrates (e.g. Brazil), this will be very hard to demonstrate. This is one of the reasons thatforest conservation will not be eligible for CDM in the first commitment period.
Country specific estimations of the sink and costs are presented for the five differentforest conservation scenarios in Table 51 – Table 60 and graphically for the firstbudget period in Figure 11 and Figure 12 on pages 135 and 136. For brevity, onlyregional values of the C sequestration totals and cost estimates will be given in this
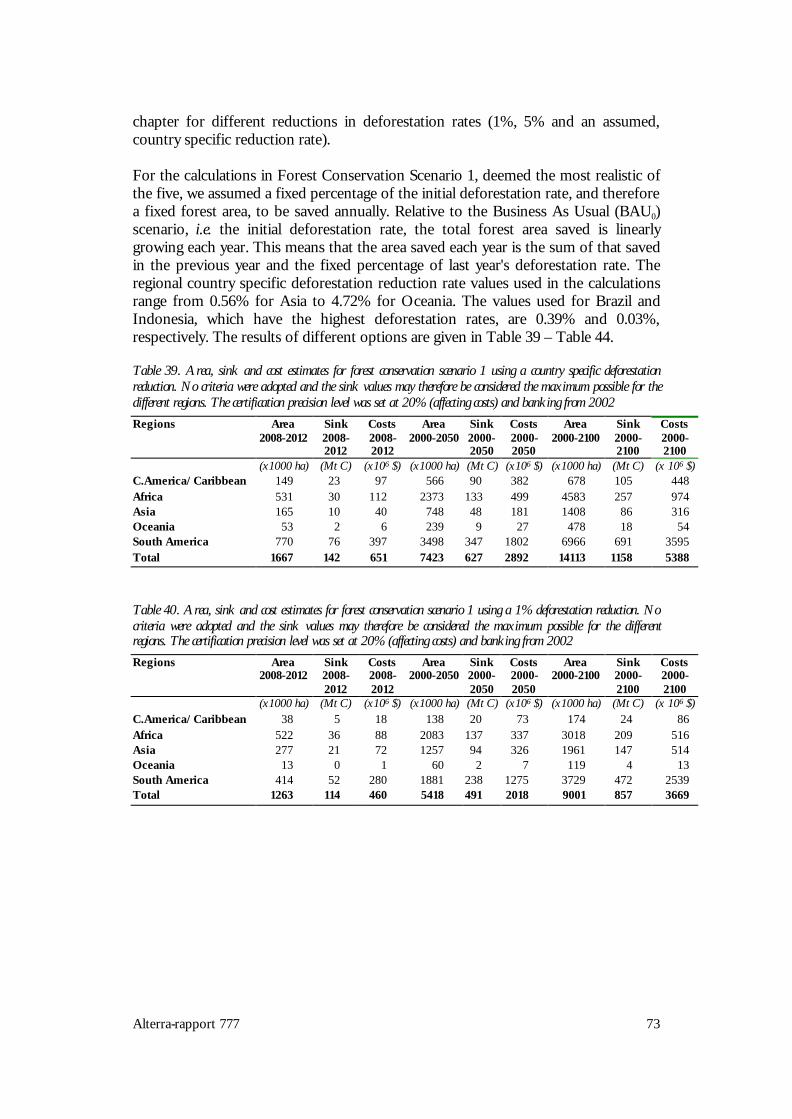
Alterra-rapport 777 73
chapter for different reductions in deforestation rates (1%, 5% and an assumed,country specific reduction rate).
For the calculations in Forest Conservation Scenario 1, deemed the most realistic ofthe five, we assumed a fixed percentage of the initial deforestation rate, and thereforea fixed forest area, to be saved annually. Relative to the Business As Usual (BAU0)scenario, i.e. the initial deforestation rate, the total forest area saved is linearlygrowing each year. This means that the area saved each year is the sum of that savedin the previous year and the fixed percentage of last year's deforestation rate. Theregional country specific deforestation reduction rate values used in the calculationsrange from 0.56% for Asia to 4.72% for Oceania. The values used for Brazil andIndonesia, which have the highest deforestation rates, are 0.39% and 0.03%,respectively. The results of different options are given in Table 39 – Table 44.
Table 39. Area, sink and cost estimates for forest conservation scenario 1 using a country specific deforestationreduction. No criteria were adopted and the sink values may therefore be considered the maximum possible for thedifferent regions. The certification precision level was set at 20% (affecting costs) and banking from 2002Regions Area
2008-2012Sink2008-2012
Costs2008-2012
Area2000-2050
Sink2000-2050
Costs2000-2050
Area2000-2100
Sink2000-2100
Costs2000-2100
(x1000 ha) (Mt C) (x106 $) (x1000 ha) (Mt C) (x106 $) (x1000 ha) (Mt C) (x 106 $)C.America/Caribbean 149 23 97 566 90 382 678 105 448Africa 531 30 112 2373 133 499 4583 257 974Asia 165 10 40 748 48 181 1408 86 316Oceania 53 2 6 239 9 27 478 18 54South America 770 76 397 3498 347 1802 6966 691 3595Total 1667 142 651 7423 627 2892 14113 1158 5388
Table 40. Area, sink and cost estimates for forest conservation scenario 1 using a 1% deforestation reduction. Nocriteria were adopted and the sink values may therefore be considered the maximum possible for the differentregions. The certification precision level was set at 20% (affecting costs) and banking from 2002Regions Area
2008-2012Sink2008-2012
Costs2008-2012
Area2000-2050
Sink2000-2050
Costs2000-2050
Area2000-2100
Sink2000-2100
Costs2000-2100
(x1000 ha) (Mt C) (x106 $) (x1000 ha) (Mt C) (x106 $) (x1000 ha) (Mt C) (x 106 $)C.America/Caribbean 38 5 18 138 20 73 174 24 86Africa 522 36 88 2083 137 337 3018 209 516Asia 277 21 72 1257 94 326 1961 147 514Oceania 13 0 1 60 2 7 119 4 13South America 414 52 280 1881 238 1275 3729 472 2539Total 1263 114 460 5418 491 2018 9001 857 3669
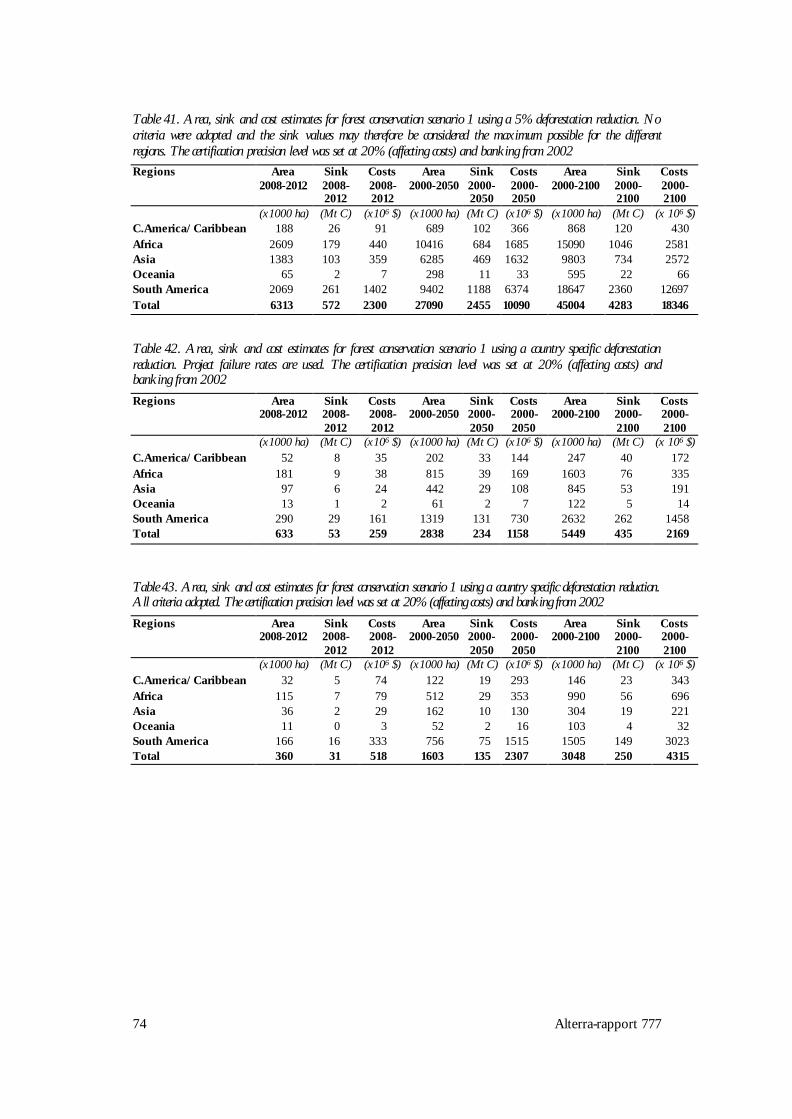
74 Alterra-rapport 777
Table 41. Area, sink and cost estimates for forest conservation scenario 1 using a 5% deforestation reduction. Nocriteria were adopted and the sink values may therefore be considered the maximum possible for the differentregions. The certification precision level was set at 20% (affecting costs) and banking from 2002Regions Area
2008-2012Sink2008-2012
Costs2008-2012
Area2000-2050
Sink2000-2050
Costs2000-2050
Area2000-2100
Sink2000-2100
Costs2000-2100
(x1000 ha) (Mt C) (x106 $) (x1000 ha) (Mt C) (x106 $) (x1000 ha) (Mt C) (x 106 $)C.America/Caribbean 188 26 91 689 102 366 868 120 430Africa 2609 179 440 10416 684 1685 15090 1046 2581Asia 1383 103 359 6285 469 1632 9803 734 2572Oceania 65 2 7 298 11 33 595 22 66South America 2069 261 1402 9402 1188 6374 18647 2360 12697Total 6313 572 2300 27090 2455 10090 45004 4283 18346
Table 42. Area, sink and cost estimates for forest conservation scenario 1 using a country specific deforestationreduction. Project failure rates are used. The certification precision level was set at 20% (affecting costs) andbanking from 2002Regions Area
2008-2012Sink2008-2012
Costs2008-2012
Area2000-2050
Sink2000-2050
Costs2000-2050
Area2000-2100
Sink2000-2100
Costs2000-2100
(x1000 ha) (Mt C) (x106 $) (x1000 ha) (Mt C) (x106 $) (x1000 ha) (Mt C) (x 106 $)C.America/Caribbean 52 8 35 202 33 144 247 40 172Africa 181 9 38 815 39 169 1603 76 335Asia 97 6 24 442 29 108 845 53 191Oceania 13 1 2 61 2 7 122 5 14South America 290 29 161 1319 131 730 2632 262 1458Total 633 53 259 2838 234 1158 5449 435 2169
Table 43. Area, sink and cost estimates for forest conservation scenario 1 using a country specific deforestation reduction.All criteria adopted. The certification precision level was set at 20% (affecting costs) and banking from 2002Regions Area
2008-2012Sink2008-2012
Costs2008-2012
Area2000-2050
Sink2000-2050
Costs2000-2050
Area2000-2100
Sink2000-2100
Costs2000-2100
(x1000 ha) (Mt C) (x106 $) (x1000 ha) (Mt C) (x106 $) (x1000 ha) (Mt C) (x 106 $)C.America/Caribbean 32 5 74 122 19 293 146 23 343Africa 115 7 79 512 29 353 990 56 696Asia 36 2 29 162 10 130 304 19 221Oceania 11 0 3 52 2 16 103 4 32South America 166 16 333 756 75 1515 1505 149 3023Total 360 31 518 1603 135 2307 3048 250 4315
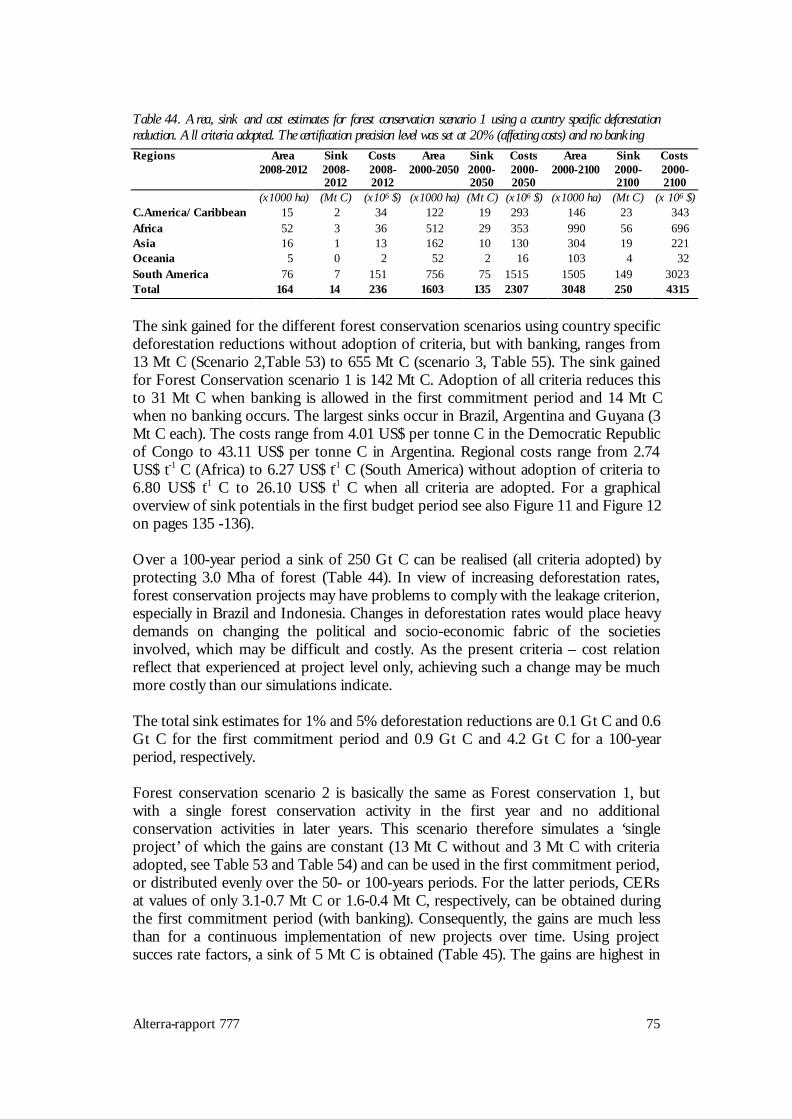
Alterra-rapport 777 75
Table 44. Area, sink and cost estimates for forest conservation scenario 1 using a country specific deforestationreduction. All criteria adopted. The certification precision level was set at 20% (affecting costs) and no bankingRegions Area
2008-2012Sink2008-2012
Costs2008-2012
Area2000-2050
Sink2000-2050
Costs2000-2050
Area2000-2100
Sink2000-2100
Costs2000-2100
(x1000 ha) (Mt C) (x106 $) (x1000 ha) (Mt C) (x106 $) (x1000 ha) (Mt C) (x 106 $)C.America/Caribbean 15 2 34 122 19 293 146 23 343Africa 52 3 36 512 29 353 990 56 696Asia 16 1 13 162 10 130 304 19 221Oceania 5 0 2 52 2 16 103 4 32South America 76 7 151 756 75 1515 1505 149 3023Total 164 14 236 1603 135 2307 3048 250 4315
The sink gained for the different forest conservation scenarios using country specificdeforestation reductions without adoption of criteria, but with banking, ranges from13 Mt C (Scenario 2,Table 53) to 655 Mt C (scenario 3, Table 55). The sink gainedfor Forest Conservation scenario 1 is 142 Mt C. Adoption of all criteria reduces thisto 31 Mt C when banking is allowed in the first commitment period and 14 Mt Cwhen no banking occurs. The largest sinks occur in Brazil, Argentina and Guyana (3Mt C each). The costs range from 4.01 US$ per tonne C in the Democratic Republicof Congo to 43.11 US$ per tonne C in Argentina. Regional costs range from 2.74US$ t-1 C (Africa) to 6.27 US$ t-1 C (South America) without adoption of criteria to6.80 US$ t-1 C to 26.10 US$ t-1 C when all criteria are adopted. For a graphicaloverview of sink potentials in the first budget period see also Figure 11 and Figure 12on pages 135 -136).
Over a 100-year period a sink of 250 Gt C can be realised (all criteria adopted) byprotecting 3.0 Mha of forest (Table 44). In view of increasing deforestation rates,forest conservation projects may have problems to comply with the leakage criterion,especially in Brazil and Indonesia. Changes in deforestation rates would place heavydemands on changing the political and socio-economic fabric of the societiesinvolved, which may be difficult and costly. As the present criteria – cost relationreflect that experienced at project level only, achieving such a change may be muchmore costly than our simulations indicate.
The total sink estimates for 1% and 5% deforestation reductions are 0.1 Gt C and 0.6Gt C for the first commitment period and 0.9 Gt C and 4.2 Gt C for a 100-yearperiod, respectively.
Forest conservation scenario 2 is basically the same as Forest conservation 1, butwith a single forest conservation activity in the first year and no additionalconservation activities in later years. This scenario therefore simulates a ‘singleproject’ of which the gains are constant (13 Mt C without and 3 Mt C with criteriaadopted, see Table 53 and Table 54) and can be used in the first commitment period,or distributed evenly over the 50- or 100-years periods. For the latter periods, CERsat values of only 3.1-0.7 Mt C or 1.6-0.4 Mt C, respectively, can be obtained duringthe first commitment period (with banking). Consequently, the gains are much lessthan for a continuous implementation of new projects over time. Using projectsucces rate factors, a sink of 5 Mt C is obtained (Table 45). The gains are highest in
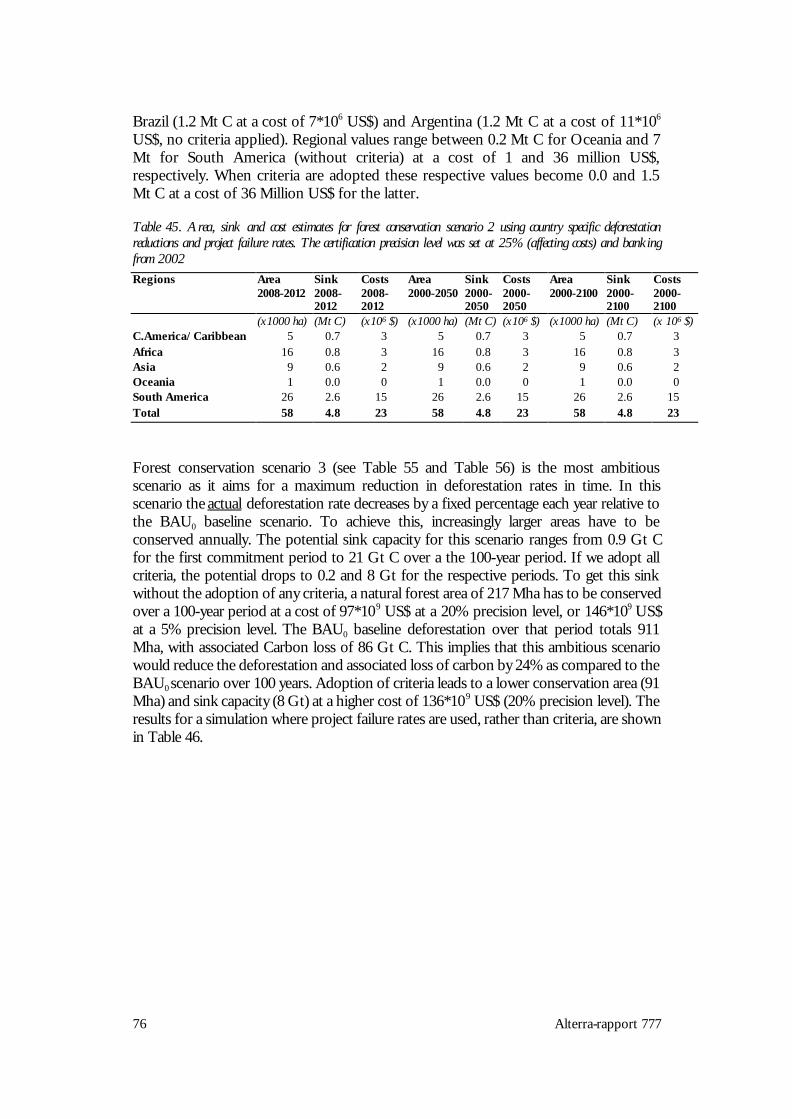
76 Alterra-rapport 777
Brazil (1.2 Mt C at a cost of 7*106 US$) and Argentina (1.2 Mt C at a cost of 11*106
US$, no criteria applied). Regional values range between 0.2 Mt C for Oceania and 7Mt for South America (without criteria) at a cost of 1 and 36 million US$,respectively. When criteria are adopted these respective values become 0.0 and 1.5Mt C at a cost of 36 Million US$ for the latter.
Table 45. Area, sink and cost estimates for forest conservation scenario 2 using country specific deforestationreductions and project failure rates. The certification precision level was set at 25% (affecting costs) and bankingfrom 2002Regions Area
2008-2012Sink2008-2012
Costs2008-2012
Area2000-2050
Sink2000-2050
Costs2000-2050
Area2000-2100
Sink2000-2100
Costs2000-2100
(x1000 ha) (Mt C) (x106 $) (x1000 ha) (Mt C) (x106 $) (x1000 ha) (Mt C) (x 106 $)C.America/Caribbean 5 0.7 3 5 0.7 3 5 0.7 3Africa 16 0.8 3 16 0.8 3 16 0.8 3Asia 9 0.6 2 9 0.6 2 9 0.6 2Oceania 1 0.0 0 1 0.0 0 1 0.0 0South America 26 2.6 15 26 2.6 15 26 2.6 15Total 58 4.8 23 58 4.8 23 58 4.8 23
Forest conservation scenario 3 (see Table 55 and Table 56) is the most ambitiousscenario as it aims for a maximum reduction in deforestation rates in time. In thisscenario the actual deforestation rate decreases by a fixed percentage each year relative tothe BAU0 baseline scenario. To achieve this, increasingly larger areas have to beconserved annually. The potential sink capacity for this scenario ranges from 0.9 Gt Cfor the first commitment period to 21 Gt C over a the 100-year period. If we adopt allcriteria, the potential drops to 0.2 and 8 Gt for the respective periods. To get this sinkwithout the adoption of any criteria, a natural forest area of 217 Mha has to be conservedover a 100-year period at a cost of 97*109 US$ at a 20% precision level, or 146*109 US$at a 5% precision level. The BAU0 baseline deforestation over that period totals 911Mha, with associated Carbon loss of 86 Gt C. This implies that this ambitious scenariowould reduce the deforestation and associated loss of carbon by 24% as compared to theBAU0 scenario over 100 years. Adoption of criteria leads to a lower conservation area (91Mha) and sink capacity (8 Gt) at a higher cost of 136*109 US$ (20% precision level). Theresults for a simulation where project failure rates are used, rather than criteria, are shownin Table 46.

Alterra-rapport 777 77
Table 46. Area, sink and cost estimates for forest conservation scenario 3 using country specific deforestation reductionsand project failure rates. The certification precision level was set at 25% (affecting costs) and banking from 2002Regions Area
2008-2012Sink2008-2012
Costs2008-2012
Area2000-2050
Sink2000-2050
Costs2000-2050
Area2000-2100
Sink2000-2100
Costs2000-2100
(x1000 ha) (Mt C) (x106 $) (x1000 ha) (Mt C) (x106 $) (x1000 ha) (Mt C) (x 106 $)C.America/Caribbean 217 36 152 1827 320 1352 2572 416 1735Africa 659 32 133 5113 250 963 11341 557 2099Asia 422 29 118 4542 359 1668 10828 829 3902Oceania 68 3 8 859 32 94 2341 88 257South America 1411 142 774 17337 1887 9941 50600 5822 30457Total 2777 241 1184 29679 2849 14018 77682 7712 38450
Forest conservation scenarios 1-3 used the BAU0 baseline to calculate the gains incarbon. In scenarios 4 and 5, the baseline is adapted to reflect changes in thedeforestation rate as a result of the CDM sink activities. In Forest conservationscenario 4, the baseline is changed annually on the basis of the area conserved in theprevious year, whereas this is done every five years (reflecting commitment periodlengths) in Forest conservation scenario 5.
The maximum area conserved (no criteria) is 1.1 Mha with the annual adaptation ofthe baseline (scenario 4, Table 57) and 3.4 Mha with the 5-year baseline adaptation(scenario 5, Table 59). The differences in area between these scenarios are the resultof the need to decrease deforestation annually by a fixed percentage. This means thatin scenario 5, the area to be protected has to increase every year, until the baseline ischanged. The sequestration potentials of these scenarios for the first commitmentperiod indicate an increase from 98 Mt to 294 Mt C as a result of changes in thebaseline adaptation (no criteria used). If criteria are adopted, the sink capacity reducesto 28-80 Mt C (Table 58, Table 60). Over a period of 100 years, these scenarioswould sequester 341-1046 Mt (no criteria) or 141-425 Mt C (with criteria),respectively. The costs would amount to 2.4-7.4*109 US$ at a precision level of 25%and all criteria adopted. Both scenarios assume that the reduction in the deforestationrates by conservation measures is real and permanent. Such changes in deforestationrates would place heavy demands on changing the political and socio-economicfabric of the societies involved, which may be difficult and costly. As the presentcriteria – cost relation reflect that experienced at project level, achieving such achange may be much more costly than our simulations indicate. Overviews of theresults for these scenarios using project failure rates rather than criteria are given inTable 47 and Table 48.

78 Alterra-rapport 777
Table 47. Area, sink and cost estimates for forest conservation scenario 4 using country specific deforestationreductions and project failure rates. The certification precision level was set at 25% (affecting costs) and bankingfrom 2002 onwardsRegions Area
2008-2012Sink2008-2012
Costs2008-2012
Area2000-2050
Sink2000-2050
Costs2000-2050
Area2000-2100
Sink2000-2100
Costs2000-2100
(x1000 ha) (Mt C) (x106 $) (x1000 ha) (Mt C) (x106 $) (x1000 ha) (Mt C) (x 106 $)C.America/Caribbean 31 5 22 55 9 39 58 10 40Africa 87 4 17 140 7 25 160 8 28Asia 61 4 18 140 12 57 184 16 78Oceania 10 0 1 26 1 3 31 1 3South America 214 22 117 547 62 325 773 93 486Total 403 36 176 907 92 449 1207 128 635
Table 48. Area, sink and cost estimates for forest conservation scenario 5 using country specific deforestationreductions and project failure rates. The certification precision level was set at 25% (affecting costs) and bankingfrom 2002 onwardsRegions Area
2008-2012Sink2008-2012
Costs2008-2012
Area2000-2050
Sink2000-2050
Costs2000-2050
Area2000-2100
Sink2000-2100
Costs2000-2100
(x1000 ha) (Mt C) (x106 $) (x1000 ha) (Mt C) (x106 $) (x1000 ha) (Mt C) (x 106 $)C.America/Caribbean 96 16 67 174 30 123 183 30 126Africa 283 14 57 451 23 82 513 26 91Asia 187 13 54 434 36 174 566 47 235Oceania 31 1 3 81 3 9 97 4 11South America 637 64 350 1683 191 996 2367 284 1482Total 1234 108 531 2823 283 1384 3725 392 1945
Alterra-rapport 777 79
7 Conclusions
There were a number of issues that needed to be resolved before sink projects couldbe included in the CDM. These issues were related to the reversibility of terrestrialsinks (permanence), the scale of the potential carbon sequestration in sink projectsand uncertainties in baselines, verification methods and sovereignty issues. This studywas initiated to address some of the concerns surrounding the use of sinks in theCDM and to provide better estimates of the potential sink capacity and costs of sinkactivities in developing countries. Draft versions of this report were available to theDutch Government during the negotiations at COP6 and COP6-bis in The Hagueand Bonn, respectively. The final version of this report has only become availableafter COP6-bis, where the decision was made not to include forest conservationprojects in the CDM, but to allow af-/reforestation activities.
Three main topics have been addressed in the study, being:1) Definition of criteria for CDM projects, with the emphasis on sink projects in
the forestry sector2) In-depth studies to see how criteria may affect carbon sequestration potentials
and costs, based on a study of several existing sink projects3) Extrapolation of the results to 70 developing countries to obtain country specific
and regional estimates of sink potentials and cost
A detailed study of the criteria and guidelines used by the UNFCCC ClimateConvention and Kyoto Protocol and several forestry and other (non-forestry)institutes resulted in a set of eight generic criteria. These criteria are formulated suchas to provide specific guidelines for CDM projects and include project framework,additionality, verifiability, compliance, environmental and socio-economicsustainability, transparency and sustainable forest management requirements. Withthe exception of the sustainable forest management criterion, which is relevant tosink projects in the forestry sector only, these criteria may be applied to any CDMproject. The criteria deal with key project elements such as project formulation, riskreduction, knowledge transfer and capacity building, competence, infrastructure,socio-economic, political and environmental factors, accounting and verificationmethods, leakage, permanence and credit sharing. Strict adherence to these criteria byprojects would:- minimise the risk of project failure- provide guarantees relating to the permanence of the sink (e.g. through socio-
economic and environmental sustainability)- affect the scale of the sink capacity- ensure additionality and eligibility eligible for receiving CERs- ensure proper project management- provide technology transfer, training and capacity building- minimise leakage at the project level, and to a lesser extend at the regional level
80 Alterra-rapport 777
The adoption of criteria has a large impact on both the sink capacity (through theland available for sink activities) and on costs. The criteria reduce the scale ofpotential forestry sector CDM projects by a factor 3 or more. This is mainly throughthe need for a project framework, socio-economic sustainability, etc.
Additionality and permanence play important roles in CDM forestry projects. Atproject level, additionality is defined as whether the project would have beenimplemented without the CDM or not. This is difficult to assess on a country scale.This study therefore uses current planting rates as baseline to define if af-/reforestation projects are additional, i.e. all individual projects together should resultin an increase in planting rates. For forest conservation on a country level, we assumethat the additionality criterion is satisfied when the deforestation trend is reversed.Additionality considerations therefore determine how much the planting rate isincreased (AR) or how much the deforestation rate is reduced (forest conservation)and thereby affect the areas and sink potentials to a large extent. Permanence offorest carbon stores cannot be guaranteed as the forest may be affected by fires,diseases, or changing priorities of local landowners. However, using a buffer basedon such risks may ensure some degree of permanence.
In view of the high failure rates of World Bank projects in developing countries (20-90%; Niles, 2000), adoption of the presently defined set of criteria for CDM projectsmay guarantee carbon neutrality to a large extent, and also goes a long way to solvepermanence and sovereignty issues. Furthermore, adherence to the criteria mayreduce the risk of project failure, increase the chances of projects being eligible forreceiving CERs and may go a long way into providing some guarantees for thepermanence of the sinks. The consequence of adopting these criteria is that projectswill become more expensive and that there will be less area available for theexecution of such projects (sustainability issue). The risk of failure can be minimisedeven more by only allowing projects that are requested and initiated by localcommunities.
The estimate for the potential area for af-/reforestation (86 Mha) is much larger thanthe present annual rate of af-/reforestation in all tropical countries (4.5 Mha).However, the additionality criterion requires an extra effort to what is planted now,so that the total area than can be planted by CDM projects is about 12 Mha,assuming that a 25% increase in the present planting rates can be realised throughCDM.
Reducing deforestation rates is a difficult process because of the political and socio-economic drivers acting in favour of development through deforestation. It istherefore very uncertain if the reduction factors (about 1.6%, weighted average) usedin this study can be reached. The forest conservation sink capacity could therefore, inpractice, be somewhat lower than the values presented here.
Estimated sink potentials range from 95 Mt C in the first commitment period for af-/reforestation projects to 13 – 655 Mt C for forest conservation projects.Application of the criteria reduces these potentials to 24 Mt C for af-/reforestation

Alterra-rapport 777 81
projects to 3 – 172 Mt C for forest conservation projects. Due to its large forest andagricultural land area, Brazil has the highest potential for both af-/reforestationprojects (6 Mt with criteria) and forest conservation projects (0 - 18 Mt C) for thefirst budget period. However, in view of the fact that the deforestation rate in Brazilwent up by 15% this year it will be very difficult for projects to demonstratecompliance with the additionality criterion and to avoid leakage. Long-termpotentials (100-year period) range from 0.3 Gt C (with criteria) to 2.3 Gt C (nocriteria) for af-/reforestation sink activities. Corresponding values for forestconservation activities range from 0 – 7.8 Gt (with criteria) to 0.01 – 21Gt C (nocriteria).
Cost calculations indicate that the costs of C sequestration with forest conservationprojects in the different regions range from 8.2 US$ tonne-1 C in Africa to 29.2 US$ t-
1 C in South America when all criteria are adopted (5% precision level). Lower costs(4.2 – 9.1 US$ t-1 C) are obtained without criteria. Af-/reforestation activities aremore expensive as the criteria of sustainable forest management and environmentalsustainability, which are not applied to forest conservation projects, are costly. Thecost ranges for af-/reforestation projects range between 24.8 US$ tonne-1 C in Asiaand 75 US$ tonne-1 C in South America (5% precison level) with all criteria adopted.In case no criteria are posed, these values become 4.1 and 9.0 US$ tonne-1 C,respectively. If project failure rates are used, African projects become the mostexpensive with a regional value of 26.5 US$ t-1 C, whereas Asian projects are leastexpensive at 10.8 US$ t-1 C.
The estimates given for the different activities with criteria adopted are in our viewcloser to reality than those without criteria. The sink potentials are therefore muchlower than previously thought in view of the constraints that should be posed to sinkprojects within the CDM. The fact that the deforestation rate in the tropics is stillincreasing (15.2 Mha, FAO, 2000) suggests that the implementation of forestconservation projects within the CDM will be difficult in view of the uncertaintiesconcerning leakage and additionality. This supports the decision taken at COP6-bisto exclude forest conservation projects from participating in the CDM in the firstcommitment period.
Cost calculations in the present study have not been corrected for inflation, etc. usingdiscount rates for future financial projections. However, this may be balanced by thefact that any future returns on the investment have also not been taken into accountdue to lack of data as the projects investigated in detail have not reached that stageyet. The CDMFSM model, on which the calculations in this report are based, caneasily be extended to include these factors once the data becomes available.

82 Alterra-rapport 777

Alterra-rapport 777 83
Literature
FAO, 1995. Forest Resources Assessment 1990. Report 124.
FAO, 1999. The State of the World’s Forests 1999. 154 p.
FAO, 2000. Global Forest Resources Assessment 2000. FAO publication, Rome,Italy (see http://www.fao.org/forestry/fo/fra)
Hol, P., Sikkema, R., Blom, E., Barendsen, P. en Veening, W. 1999. Privateinvestments in sustainable forest management. I. Final Report. Form EcologyConsultants and Netherlands Committee for IUCN. The Netherlands.
IPCC/OECD/IEA, 1996. IPCC guidelines for National greenhouse gas inventories.Module 5. Land use change and forestry. In: IPCC Guidelines, revised 1996 versions.Reference Manual, Vol 3. 74 p. Workbook, Vol 2, 54 p. Working Group I. TSU.United Kingdom.
IPCC, 2000. Special report on LULUCF.
Kremen, C. et al (2000). Economic Incentives for Rain Forest Conservation AcrossScales. 9 June 2000, Vol 288, p. 1828, Science.
Niles, J.O., 2000. Preliminary estimate of potential forest conservation in the CleanDevelopment Mechanism for 25 nations. ([email protected]).
Nilsson, S. en Schopfhauser, W., 1995. The Carbon-sequestration potential of aglobal afforestation programme. Climatic Change 30: 267-293.
Powell, M.H., 1999. Effect of inventory precision and variance on the estimatednumber of sample and inventory variable cost: The Noel Kempff Mercado ClimateAction Project. Winrock International. (see alsohttp://www.winrock.org/reep/noelkmpff_rpt.html).
Trexler, M.C. and C. Haugen, 1995. Keeping it green: Tropical ForestryOpportunities for Mitigating Climate Change. World Resource Institute, USA.
Waterloo, M.J., P. Kabat, G.J. Nabuurs en R.N. de Graaf, 2000. Potenties voor CO2-sinkaktiviteiten en –emissiereducties via internationale bebossing of bosbescher-mingsmaatregelen.
Waterloo, M.J., Wichink Kruit, R.J. and Spiertz, P.H., 2001. User guideline CDMForest Sink model, version 2.01. Alterra, Wageningen. (contact [email protected]).

84 Alterra-rapport 777

Alterra-rapport 777 85
Annex A Principles and criteria of the Climate Convention andthe Kyoto Protocol
United Nations Framework Convention on Climate ChangeArticle 33.4 The Parties have a right to, and should, promote sustainable development. Policies and measures to
protect the climate system against human-induced change should be appropriate for the specificconditions of each Party and should be integrated with national development programmes, taking intoaccount that economic development is essential for adopting measures to address climate change.
�
3.5 The Parties should cooperate to promote a supportive and open international economic system thatwould lead to sustainable economic growth and development in all Parties, particularly developingcountry Parties, thus enabling them better to address the problems of climate change. Measures takento combat climate change, including unilateral ones, should not constitute a means of arbitrary orunjustifiable discrimination or a disguised restriction on international trade.
�
Article 44.4 The developed country Parties and other developed Parties included in Annex II shall also assist the
developing country Parties that are particularly vulnerable to the adverse effects of climate change inmeeting costs of adaptation to those adverse effects. (art. 4.4)
�
4.5 The developed country Parties and other developed Parties included in Annex II shall take allpracticable steps to promote, facilitate and finance, as appropriate, the transfer of, or access to,environmentally sound technologies and know-how to other Parties, particularly developing countryParties, to enable them to implement the provisions of the Convention. In this process, the developedcountry Parties shall support the development and enhancement of endogenous capacities andtechnologies of developing country Parties. Other Parties and organizations in a position to do so mayalso assist in facilitating the transfer of such technologies. (art 4.5)
�
Kyoto ProtocolArticle 22.1 Protection and enhancement of sinks and reservoirs of greenhouse gases not controlled by the
Montreal Protocol, taking into account its commitments under relevant international environmentalagreements; promotion of sustainable forest management practices, afforestation and reforestation.
� /�
Article 121. A clean development mechanism is hereby defined.2. The purpose of the clean development mechanism shall be to assist Parties not included in Annex I in
achieving sustainable development and in contributing to the ultimate objective of the Convention, andto assist Parties included in Annex I in achieving compliance with their quantified emission limitation andreduction commitments under Article 3.
�
3 Under the clean development mechanism:(a) Parties not included in Annex I will benefit from project activities resulting in certified emission
reductions; and(b) (b) Parties included in Annex I may use the certified emission reductions accruing from such project
activities to contribute to compliance with part of their quantified emission limitation and reductioncommitments under Article 3, as determined by the Conference of the Parties serving as the meetingof the Parties to this Protocol.
� /�
4. The clean development mechanism shall be subject to the authority and guidance of the Conference ofthe Parties serving as the meeting of the Parties to this Protocol and be supervised by an executive boardof the clean development mechanism.
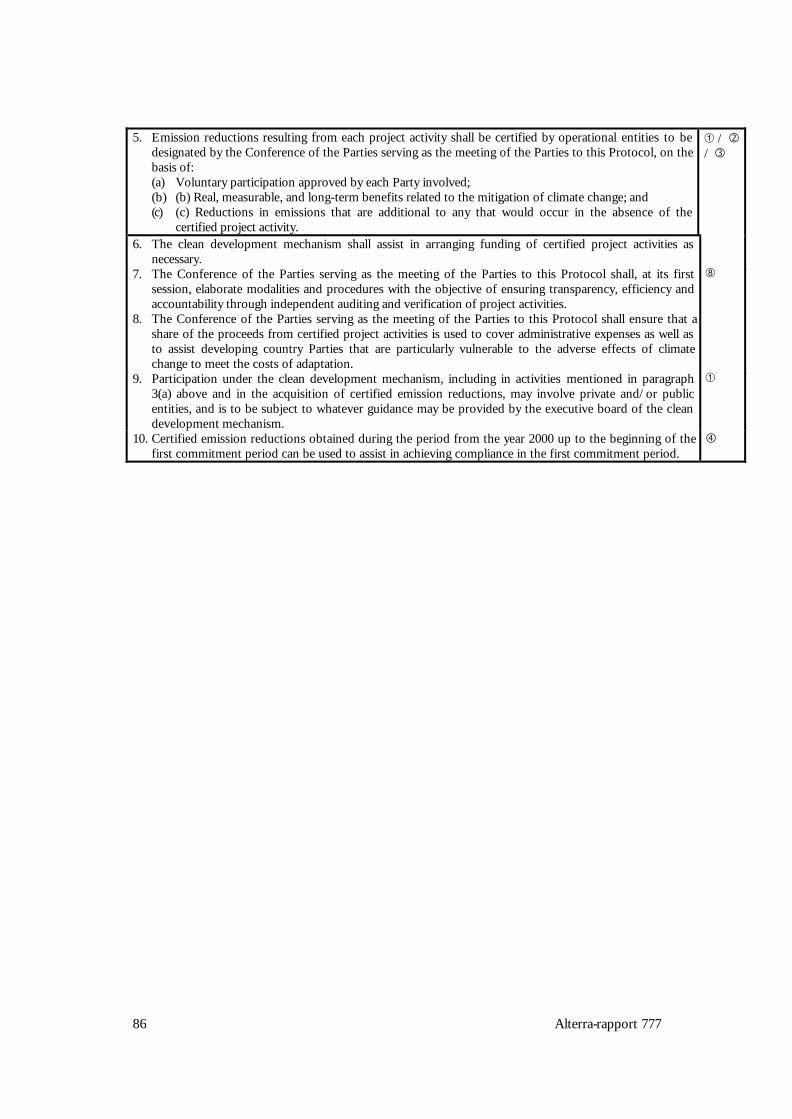
86 Alterra-rapport 777
5. Emission reductions resulting from each project activity shall be certified by operational entities to bedesignated by the Conference of the Parties serving as the meeting of the Parties to this Protocol, on thebasis of:(a) Voluntary participation approved by each Party involved;(b) (b) Real, measurable, and long-term benefits related to the mitigation of climate change; and(c) (c) Reductions in emissions that are additional to any that would occur in the absence of the
certified project activity.
À / �/ �
6. The clean development mechanism shall assist in arranging funding of certified project activities asnecessary.
7. The Conference of the Parties serving as the meeting of the Parties to this Protocol shall, at its firstsession, elaborate modalities and procedures with the objective of ensuring transparency, efficiency andaccountability through independent auditing and verification of project activities.
Ç
8. The Conference of the Parties serving as the meeting of the Parties to this Protocol shall ensure that ashare of the proceeds from certified project activities is used to cover administrative expenses as well asto assist developing country Parties that are particularly vulnerable to the adverse effects of climatechange to meet the costs of adaptation.
9. Participation under the clean development mechanism, including in activities mentioned in paragraph3(a) above and in the acquisition of certified emission reductions, may involve private and/or publicentities, and is to be subject to whatever guidance may be provided by the executive board of the cleandevelopment mechanism.
À
10. Certified emission reductions obtained during the period from the year 2000 up to the beginning of thefirst commitment period can be used to assist in achieving compliance in the first commitment period.
�
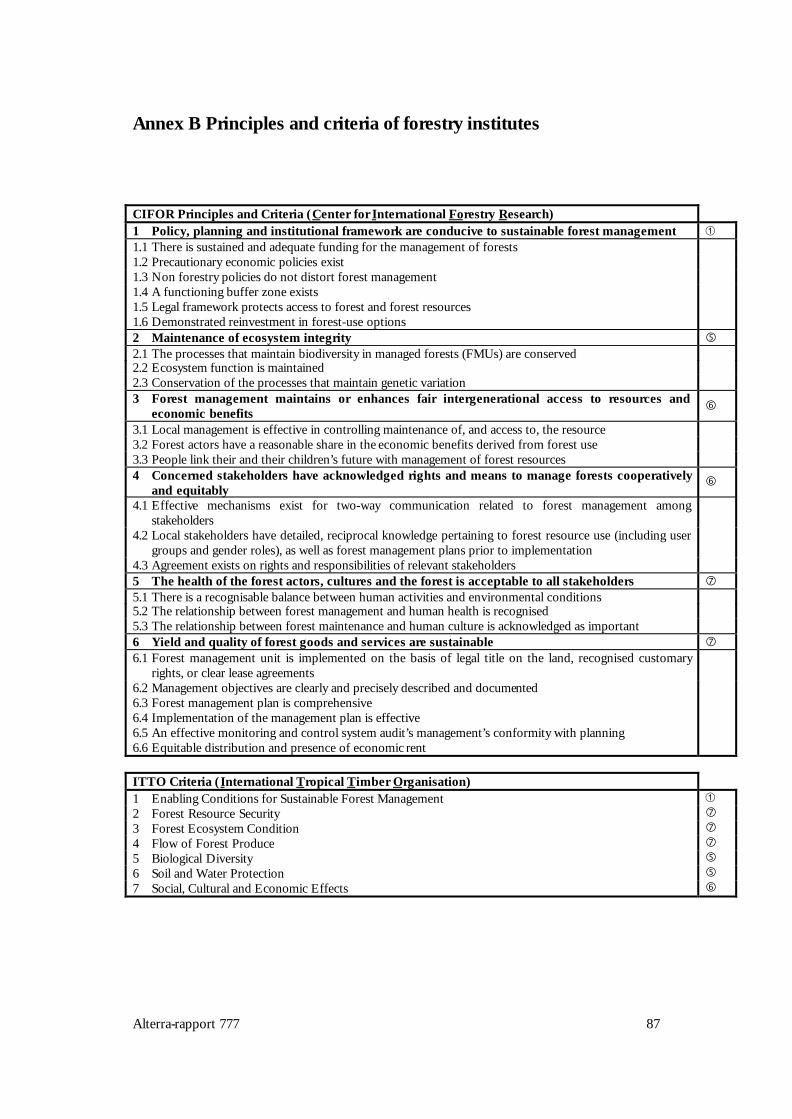
Alterra-rapport 777 87
Annex B Principles and criteria of forestry institutes
CIFOR Principles and Criteria (Center for International Forestry Research)1 Policy, planning and institutional framework are conducive to sustainable forest management À1.1 There is sustained and adequate funding for the management of forests1.2 Precautionary economic policies exist1.3 Non forestry policies do not distort forest management1.4 A functioning buffer zone exists1.5 Legal framework protects access to forest and forest resources1.6 Demonstrated reinvestment in forest-use options2 Maintenance of ecosystem integrity �2.1 The processes that maintain biodiversity in managed forests (FMUs) are conserved2.2 Ecosystem function is maintained2.3 Conservation of the processes that maintain genetic variation3 Forest management maintains or enhances fair intergenerational access to resources and
economic benefits �
3.1 Local management is effective in controlling maintenance of, and access to, the resource3.2 Forest actors have a reasonable share in the economic benefits derived from forest use3.3 People link their and their children’s future with management of forest resources4 Concerned stakeholders have acknowledged rights and means to manage forests cooperatively
and equitably�
4.1 Effective mechanisms exist for two-way communication related to forest management amongstakeholders
4.2 Local stakeholders have detailed, reciprocal knowledge pertaining to forest resource use (including usergroups and gender roles), as well as forest management plans prior to implementation
4.3 Agreement exists on rights and responsibilities of relevant stakeholders5 The health of the forest actors, cultures and the forest is acceptable to all stakeholders �5.1 There is a recognisable balance between human activities and environmental conditions5.2 The relationship between forest management and human health is recognised5.3 The relationship between forest maintenance and human culture is acknowledged as important6 Yield and quality of forest goods and services are sustainable �6.1 Forest management unit is implemented on the basis of legal title on the land, recognised customary
rights, or clear lease agreements6.2 Management objectives are clearly and precisely described and documented6.3 Forest management plan is comprehensive6.4 Implementation of the management plan is effective6.5 An effective monitoring and control system audit’s management’s conformity with planning6.6 Equitable distribution and presence of economic rent
ITTO Criteria (International Tropical Timber Organisation)1 Enabling Conditions for Sustainable Forest Management À2 Forest Resource Security �3 Forest Ecosystem Condition �4 Flow of Forest Produce �5 Biological Diversity �6 Soil and Water Protection �7 Social, Cultural and Economic Effects �

88 Alterra-rapport 777
FSC Principles and Criteria (Forest Stewardship Council)1 Compliance with laws and FSC principles Ã1.1 Forest management shall respect all national and local laws and administrative requirements.1.2 All applicable and legally prescribed fees, royalties, taxes and other charges shall be paid.1.3 In signatory countries, the provisions of all binding international agreements such as CITES, ILO
Conventions, ITTA, and Convention on Biological Diversity, shall be respected.1.4 Conflicts between laws, regulations and the FSC Principles and Criteria shall be evaluated for the
purposes of certification, on a case by case basis, by the certifiers and the involved or affected parties.1.5 Forest management areas should be protected from illegal harvesting, settlement and other unauthorized
activities.1.6 Forest managers shall demonstrate a long-term commitment to adhere to the FSC Principles and Criteria.2 Tenure and use rights and responsibilities À2.1 Clear evidence of long-term forest use rights to the land (e.g. land title, customary rights, or lease
agreements) shall be demonstrated.2.2 Local communities with legal or customary tenure or use rights shall maintain control, to the extent
necessary to protect their rights or resources, over forest2.3 Appropriate mechanisms shall be employed to resolve disputes over tenure claims and use rights. The
circumstances and status of any outstanding disputes will be explicitly considered in the certificationevaluation. Disputes of substantial magnitude involving a significant number of interests will normallydisqualify an operation from being certified.
3 Indigenous people’s rights Å3.1 Indigenous peoples shall control forest management on their lands and territories unless they delegate
control with free and informed consent to other agencies.3.2 Forest management shall not threaten or diminish, either directly or indirectly, the resources or tenure
rights of indigenous peoples.3.3 Sites of special cultural, ecological, economic or religious significance to indigenous peoples shall be
clearly identified in cooperation with such peoples, and recognized and protected by forest managers.3.4 Indigenous peoples shall be compensated for the application of their traditional knowledge regarding the
use of forest species or management systems in forest operations. This compensation shall be formallyagreed upon with their free and informed consent before forest operations commence.
4 Community relations and worker’s rights Å4.1 The communities within, or adjacent to, the forest management area should be given opportunities for
employment, training and other services.4.2 Forest management should meet or exceed all applicable laws and/or regulations covering health and
safety of employees and their families.4.3 The rights of workers to organize and voluntarily negotiate with their employers shall be guaranteed as
outlined in Conventions 87 and 98 of the International Labour Organisation (ILO).4.4 Management planning and operations shall incorporate the results of evaluations of social impact.
Consultations shall be maintained with people and groups directly affected by management operations.4.5 Appropriate mechanisms shall be employed for resolving grievances and for providing fair
compensation in the case of loss or damage affecting the legal or customary rights, property, resources,or livelihoods of local peoples. Measures shall be taken to avoid such loss or damage.
5 Benefits from the forest Æ5.1 Forest management should strive toward economic viability, while taking into account the full
environmental, social and operational costs of production, and ensuring the investments necessary tomaintain the ecological productivity of the forest.
5.2 Forest management and marketing operations should encourage the optimal use and local processing ofthe forest’s diversity of products.
5.3 Forest management should minimize waste associated with harvesting and on-site processing operationsand avoid damage to other forest resources.
5.4 Forest management should strive to strengthen and diversify the local economy, avoiding dependenceon a single forest product.
5.5 Forest management operations shall recognize, maintain and, where appropriate, enhance the value offorest services and resources such as watersheds and fisheries.
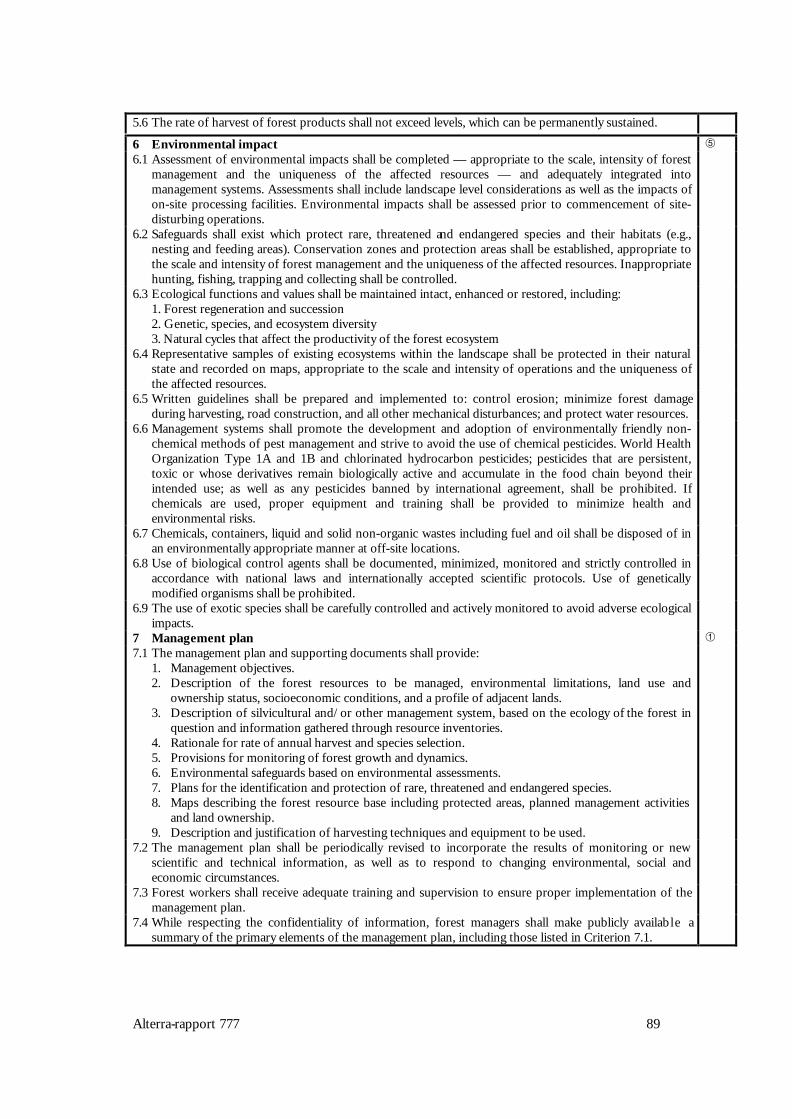
Alterra-rapport 777 89
5.6 The rate of harvest of forest products shall not exceed levels, which can be permanently sustained.
6 Environmental impact Ä6.1 Assessment of environmental impacts shall be completed — appropriate to the scale, intensity of forest
management and the uniqueness of the affected resources — and adequately integrated intomanagement systems. Assessments shall include landscape level considerations as well as the impacts ofon-site processing facilities. Environmental impacts shall be assessed prior to commencement of site-disturbing operations.
6.2 Safeguards shall exist which protect rare, threatened and endangered species and their habitats (e.g.,nesting and feeding areas). Conservation zones and protection areas shall be established, appropriate tothe scale and intensity of forest management and the uniqueness of the affected resources. Inappropriatehunting, fishing, trapping and collecting shall be controlled.
6.3 Ecological functions and values shall be maintained intact, enhanced or restored, including:1. Forest regeneration and succession2. Genetic, species, and ecosystem diversity3. Natural cycles that affect the productivity of the forest ecosystem
6.4 Representative samples of existing ecosystems within the landscape shall be protected in their naturalstate and recorded on maps, appropriate to the scale and intensity of operations and the uniqueness ofthe affected resources.
6.5 Written guidelines shall be prepared and implemented to: control erosion; minimize forest damageduring harvesting, road construction, and all other mechanical disturbances; and protect water resources.
6.6 Management systems shall promote the development and adoption of environmentally friendly non-chemical methods of pest management and strive to avoid the use of chemical pesticides. World HealthOrganization Type 1A and 1B and chlorinated hydrocarbon pesticides; pesticides that are persistent,toxic or whose derivatives remain biologically active and accumulate in the food chain beyond theirintended use; as well as any pesticides banned by international agreement, shall be prohibited. Ifchemicals are used, proper equipment and training shall be provided to minimize health andenvironmental risks.
6.7 Chemicals, containers, liquid and solid non-organic wastes including fuel and oil shall be disposed of inan environmentally appropriate manner at off-site locations.
6.8 Use of biological control agents shall be documented, minimized, monitored and strictly controlled inaccordance with national laws and internationally accepted scientific protocols. Use of geneticallymodified organisms shall be prohibited.
6.9 The use of exotic species shall be carefully controlled and actively monitored to avoid adverse ecologicalimpacts.
7 Management plan À7.1 The management plan and supporting documents shall provide:
1. Management objectives.2. Description of the forest resources to be managed, environmental limitations, land use and
ownership status, socioeconomic conditions, and a profile of adjacent lands.3. Description of silvicultural and/or other management system, based on the ecology of the forest in
question and information gathered through resource inventories.4. Rationale for rate of annual harvest and species selection.5. Provisions for monitoring of forest growth and dynamics.6. Environmental safeguards based on environmental assessments.7. Plans for the identification and protection of rare, threatened and endangered species.8. Maps describing the forest resource base including protected areas, planned management activities
and land ownership.9. Description and justification of harvesting techniques and equipment to be used.
7.2 The management plan shall be periodically revised to incorporate the results of monitoring or newscientific and technical information, as well as to respond to changing environmental, social andeconomic circumstances.
7.3 Forest workers shall receive adequate training and supervision to ensure proper implementation of themanagement plan.
7.4 While respecting the confidentiality of information, forest managers shall make publicly available asummary of the primary elements of the management plan, including those listed in Criterion 7.1.
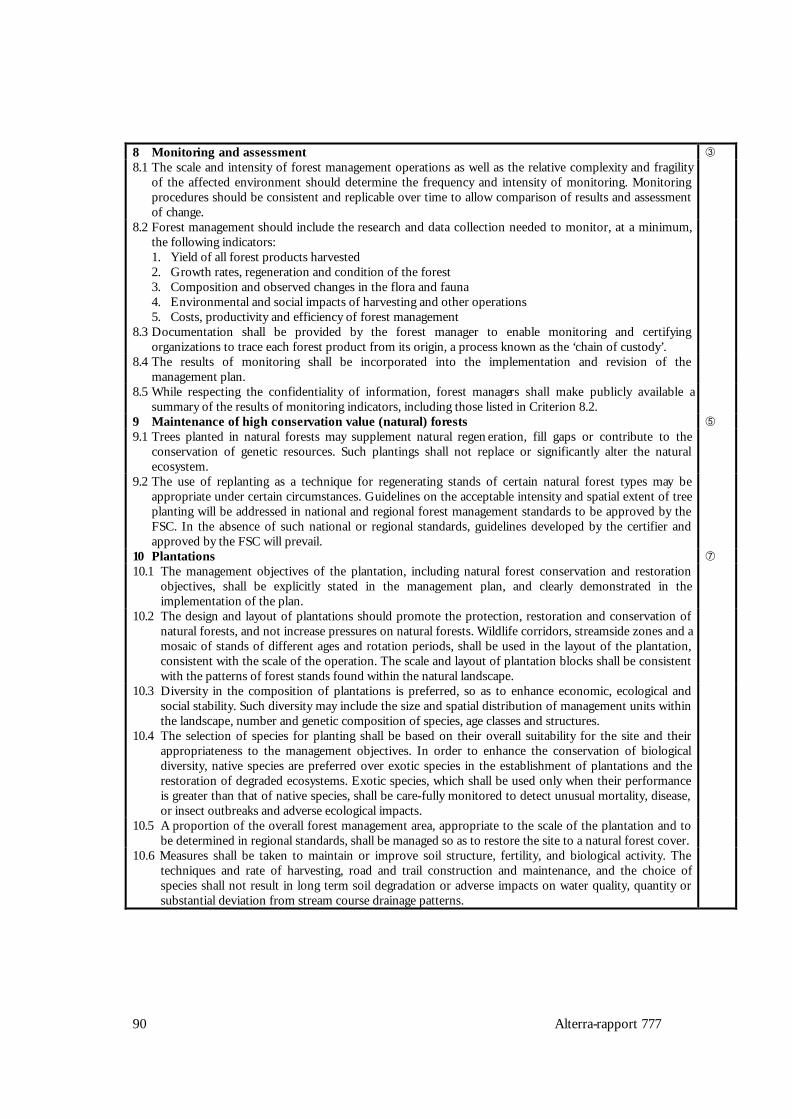
90 Alterra-rapport 777
8 Monitoring and assessment Â8.1 The scale and intensity of forest management operations as well as the relative complexity and fragility
of the affected environment should determine the frequency and intensity of monitoring. Monitoringprocedures should be consistent and replicable over time to allow comparison of results and assessmentof change.
8.2 Forest management should include the research and data collection needed to monitor, at a minimum,the following indicators:1. Yield of all forest products harvested2. Growth rates, regeneration and condition of the forest3. Composition and observed changes in the flora and fauna4. Environmental and social impacts of harvesting and other operations5. Costs, productivity and efficiency of forest management
8.3 Documentation shall be provided by the forest manager to enable monitoring and certifyingorganizations to trace each forest product from its origin, a process known as the ‘chain of custody’.
8.4 The results of monitoring shall be incorporated into the implementation and revision of themanagement plan.
8.5 While respecting the confidentiality of information, forest managers shall make publicly available asummary of the results of monitoring indicators, including those listed in Criterion 8.2.
9 Maintenance of high conservation value (natural) forests Ä9.1 Trees planted in natural forests may supplement natural regen eration, fill gaps or contribute to the
conservation of genetic resources. Such plantings shall not replace or significantly alter the naturalecosystem.
9.2 The use of replanting as a technique for regenerating stands of certain natural forest types may beappropriate under certain circumstances. Guidelines on the acceptable intensity and spatial extent of treeplanting will be addressed in national and regional forest management standards to be approved by theFSC. In the absence of such national or regional standards, guidelines developed by the certifier andapproved by the FSC will prevail.
10 Plantations Æ10.1 The management objectives of the plantation, including natural forest conservation and restoration
objectives, shall be explicitly stated in the management plan, and clearly demonstrated in theimplementation of the plan.
10.2 The design and layout of plantations should promote the protection, restoration and conservation ofnatural forests, and not increase pressures on natural forests. Wildlife corridors, streamside zones and amosaic of stands of different ages and rotation periods, shall be used in the layout of the plantation,consistent with the scale of the operation. The scale and layout of plantation blocks shall be consistentwith the patterns of forest stands found within the natural landscape.
10.3 Diversity in the composition of plantations is preferred, so as to enhance economic, ecological andsocial stability. Such diversity may include the size and spatial distribution of management units withinthe landscape, number and genetic composition of species, age classes and structures.
10.4 The selection of species for planting shall be based on their overall suitability for the site and theirappropriateness to the management objectives. In order to enhance the conservation of biologicaldiversity, native species are preferred over exotic species in the establishment of plantations and therestoration of degraded ecosystems. Exotic species, which shall be used only when their performanceis greater than that of native species, shall be care-fully monitored to detect unusual mortality, disease,or insect outbreaks and adverse ecological impacts.
10.5 A proportion of the overall forest management area, appropriate to the scale of the plantation and tobe determined in regional standards, shall be managed so as to restore the site to a natural forest cover.
10.6 Measures shall be taken to maintain or improve soil structure, fertility, and biological activity. Thetechniques and rate of harvesting, road and trail construction and maintenance, and the choice ofspecies shall not result in long term soil degradation or adverse impacts on water quality, quantity orsubstantial deviation from stream course drainage patterns.

Alterra-rapport 777 91
10.7 Measures shall be taken to prevent and minimize outbreaks of pests, diseases, fire and invasive plantintroductions. Integrated pest management shall form an essential part of the management plan, withprimary reliance on prevention and biological control methods rather than chemical pesticides andfertilizers. Plantation management should make every effort to move away from chemical pesticidesand fertilizers, including their use in nurseries. The use of chemicals is also covered in Criteria 6.6 and6.7.
10.8 Appropriate to the scale and diversity of the operation, monitoring of plantations shall include regularassessment of potential on-site and off-site ecological and social impacts, (e.g. natural regeneration,effects on water resources and soil fertility, and impacts on local welfare and social well-being), inaddition to those elements addressed in principles 8, 6 and 4. No species should be planted on a largescale until local trials and/or experience have shown that they are ecologically well adapted to the site,are not invasive, and do not have significant negative ecological impacts on other ecosystems. Specialattention will be paid to social issues of land acquisition for plantations, especially the protection oflocal rights of ownership, use or access.
PEFC Criteria (Pan European Forest Certification)1 Maintenance and appropriate enhancement of forest resources and their contribution to global carbon
cyclesÄ/Æ
2 Maintenance of forest ecosystem health and vitality Ä3 Maintenance and encouragement of productive functions of forests (wood and non-wood) Æ4 Maintenance, conservation and appropriate enhancement of biological diversity in forest ecosystems Ä5 Maintenance and appropriate enhancement of productive functions in forest management (notably soil
and water) Æ
6 Maintenance of other socio-economic functions and conditions Å
MPWG Criteria (Montreal Process Working Group)1 Conservation of Biological Diversity Ä2 Maintenance of Productive Capacity of Forest Ecosystems Æ3 Maintenance of Forest Ecosystem Health and Vitality Ä4 Conservation and Maintenance of Soil and Water Resources Ä5 Maintenance of Forest Contribution to Global Carbon Cycles Ä6 Maintenance and Enhancement of Long-Term Multiple Socioeconomic Benefits to Meet the Needs of
Societies Å
7 Legal, Institutional and Economic Framework for Forest Conservation and Sustainable Management Ã8 Legal and Institutional Framework À9 Sustainable Forest Production Æ10 Conservation of Forest Ecosystems Ä11 Local Socio-economic Benefits Å

92 Alterra-rapport 777
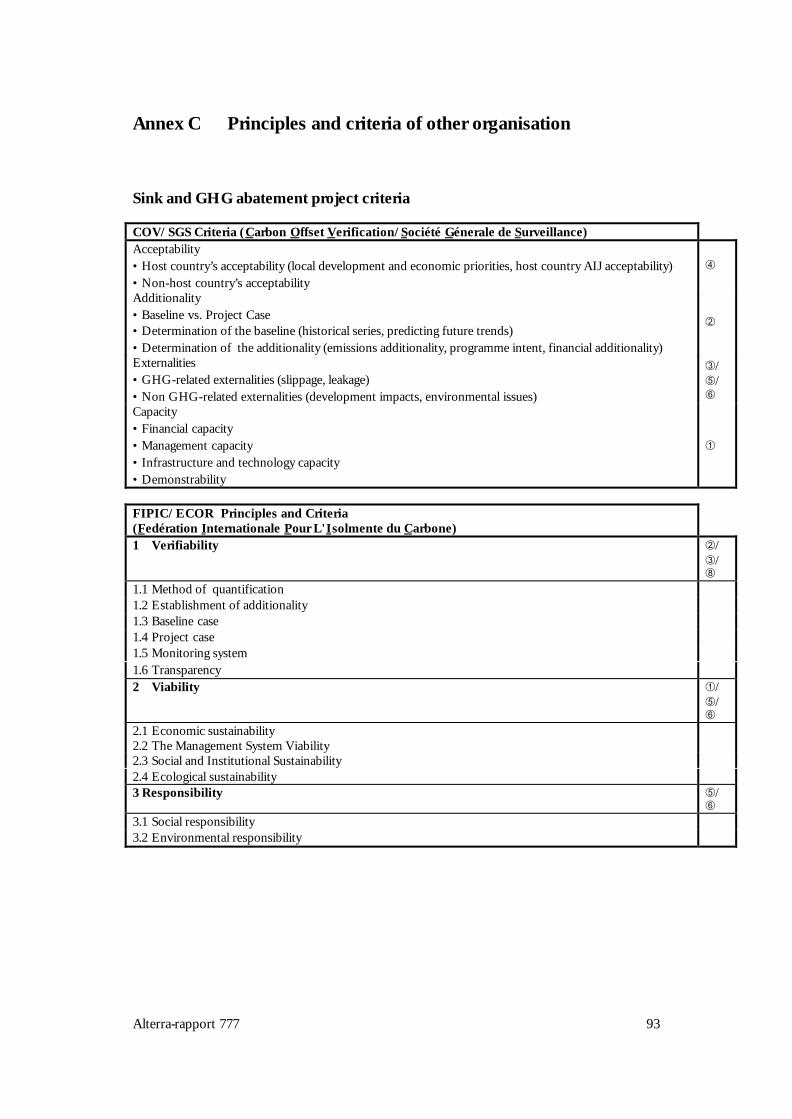
Alterra-rapport 777 93
Annex C Principles and criteria of other organisation
Sink and GHG abatement project criteria
COV/SGS Criteria (Carbon Offset Verification/Société Génerale de Surveillance)Acceptability• Host country’s acceptability (local development and economic priorities, host country AIJ acceptability)• Non-host country’s acceptability
Ã
Additionality• Baseline vs. Project Case• Determination of the baseline (historical series, predicting future trends)• Determination of the additionality (emissions additionality, programme intent, financial additionality)
Á
Externalities• GHG-related externalities (slippage, leakage)• Non GHG-related externalities (development impacts, environmental issues)
Â/Ä/Å
Capacity• Financial capacity• Management capacity• Infrastructure and technology capacity• Demonstrability
À
FIPIC/ECOR Principles and Criteria(Fedération Internationale Pour L'Isolmente du Carbone)1 Verifiability Á/
Â/Ç
1.1 Method of quantification1.2 Establishment of additionality1.3 Baseline case1.4 Project case1.5 Monitoring system1.6 Transparency2 Viability À/
Ä/Å
2.1 Economic sustainability2.2 The Management System Viability2.3 Social and Institutional Sustainability2.4 Ecological sustainability3 Responsibility Ä/
Å3.1 Social responsibility3.2 Environmental responsibility
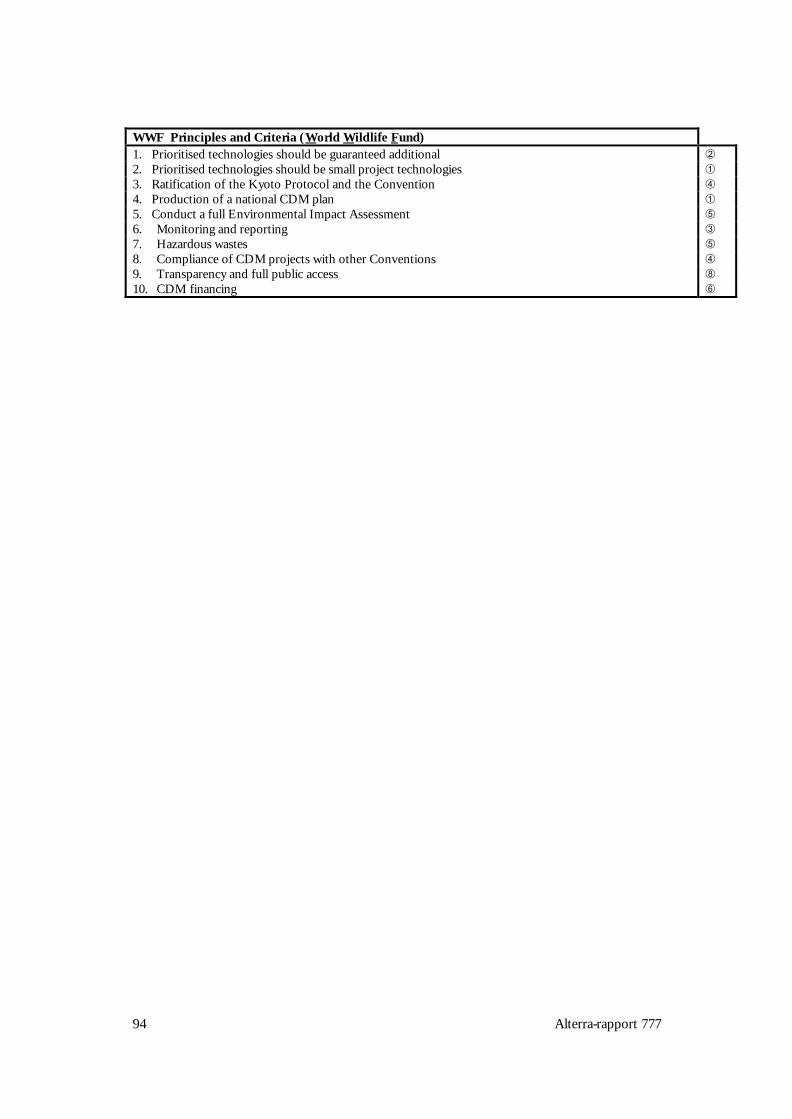
94 Alterra-rapport 777
WWF Principles and Criteria (World Wildlife Fund)1. Prioritised technologies should be guaranteed additional Á2. Prioritised technologies should be small project technologies À3. Ratification of the Kyoto Protocol and the Convention Ã4. Production of a national CDM plan À5. Conduct a full Environmental Impact Assessment Ä6. Monitoring and reporting Â7. Hazardous wastes Ä8. Compliance of CDM projects with other Conventions Ã9. Transparency and full public access Ç10. CDM financing Å

Alterra-rapport 777 95
National (Dutch) criteria
The Dutch Government’s Policy paper on Tropical Forests (1992)Guidelines:1. Efforts to ensure that the existing acreage of tropical rainforests including – both primary and secondary
forest – is preserved�/�
2. The need to set priorities with regard to the protection of primary tropical rainforest and, in this context,to promote the development of a cohesive international network of large areas of primary tropicalrainforests currently protected or to be protected in the future, in order to preserve their natural valueand genetic diversity and the environment in which tribal peoples live
�/�
3. Recognition of the possibilities of economic use being made (in certain cases) of degraded tropicalrainforest, which may contribute to the preservation of a permanent acreage of forest, provided thatsuch use is sustainable
�/�
4. The desirability of rehabilitation areas of tropical rainforest which have already been exploited, so thatthey may again perform their functions, and particularly their regulations and production functions, asforest in the future, of increasing the forest acreage and, where the initial position is favourable, ofrestoring valuable ecosystems
�/�/�
5. The need to develop a scientifically based land-use planning system, which provides for the preservationof the largest possible forest acreage, including that of the country concerned
�/�
6. Support for the activities of countries complying with the above in terms of policy development,planning and implementation, bearing in mind the specific situation as regards the tropical rainforest andsocio-economic factors in the country concerned
�/�
7. The Netherlands’ position on individual activities to be conditional on the link with the domestic policyof the country concerned and to the quality that policy.
�/�
Policy strategies
1. Active protection of surviving virgin rainforest �/�
2. In principle, no collaboration with projects and developments that are harmful or potentially harmful tothe rainforest
�/�
3. Encouraging planned land use and land management along with sustainable agriculture and forestry �/�/�
4. The tropical timber trade: controlled harvesting; encouraging the formulation and implementation oflong-term planned timber production.
�
5. National and international encouragement for afforestation and re-afforestation projects �6. Strengthening institutions and legislation; empowerment local populations �/
�7. Strengthening the political and social base in tropical nations �8. Improving economic relations and relieving the debt burden �9. Increasing scope for national and international tropical rainforest policy by strengthening research and
institutions.�

96 Alterra-rapport 777
National criteria resulted from the Pan European Ministerial Conference on the protection offorests in Europe (Helsinki, 1993)10. Maintenance and appropriate enhancement of forest resources and their contribution to global carbon
cycles�
11. Maintenance of forest ecosystem health and vitality �12. Maintenance and encouragement of productive functions of forests �/
�13. Maintenance and encouragement of productive functions of forests �/
�14. Enhancement of biological diversity in forest ecosystems �15. Enhancement of socio-economic functions of forests �16. Providing adequate institutional frameworks for sustainable forest management �/
�
Forest Policy Act, Netherlands (1993)International forestry policy: conservation, recovering or development of:1. Biological diversity �2. Sustainable forestry for production of timber and other forests products �3. Regulatory functions concerning the climate, water management and soil fertility �4. Living standards of rural population and people depending on forests �
Ministry of Development, GAVIM principle (Netherlands)1 Good Governance À/
Ä2 Poverty Alleviation Ã3 Women Ã4 Institutional Development À5 Local Environment Â
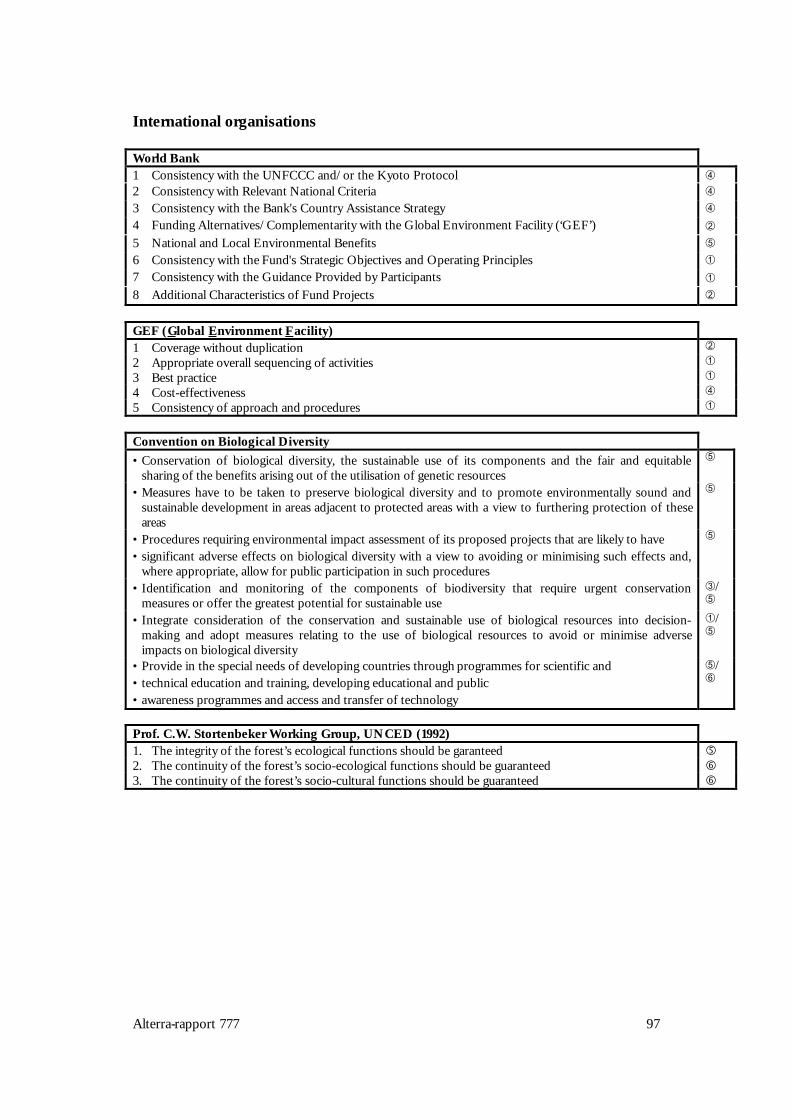
Alterra-rapport 777 97
International organisations
World Bank1 Consistency with the UNFCCC and/or the Kyoto Protocol Ã2 Consistency with Relevant National Criteria Ã3 Consistency with the Bank's Country Assistance Strategy Ã4 Funding Alternatives/Complementarity with the Global Environment Facility (‘GEF’) Á5 National and Local Environmental Benefits Ä6 Consistency with the Fund's Strategic Objectives and Operating Principles À7 Consistency with the Guidance Provided by Participants À8 Additional Characteristics of Fund Projects Á
GEF (Global Environment Facility)1 Coverage without duplication Á2 Appropriate overall sequencing of activities À3 Best practice À4 Cost-effectiveness Ã5 Consistency of approach and procedures À
Convention on Biological Diversity• Conservation of biological diversity, the sustainable use of its components and the fair and equitable
sharing of the benefits arising out of the utilisation of genetic resourcesÄ
• Measures have to be taken to preserve biological diversity and to promote environmentally sound andsustainable development in areas adjacent to protected areas with a view to furthering protection of theseareas
Ä
• Procedures requiring environmental impact assessment of its proposed projects that are likely to have• significant adverse effects on biological diversity with a view to avoiding or minimising such effects and,
where appropriate, allow for public participation in such procedures
Ä
• Identification and monitoring of the components of biodiversity that require urgent conservationmeasures or offer the greatest potential for sustainable use
Â/Ä
• Integrate consideration of the conservation and sustainable use of biological resources into decision-making and adopt measures relating to the use of biological resources to avoid or minimise adverseimpacts on biological diversity
À/Ä
• Provide in the special needs of developing countries through programmes for scientific and• technical education and training, developing educational and public• awareness programmes and access and transfer of technology
Ä/Å
Prof. C.W. Stortenbeker Working Group, UNCED (1992)1. The integrity of the forest’s ecological functions should be garanteed �2. The continuity of the forest’s socio-ecological functions should be guaranteed �3. The continuity of the forest’s socio-cultural functions should be guaranteed �

98 Alterra-rapport 777
Alterra-rapport 777 99
Annex D Criteria and their indicators
Indicator have been added to each criterion to concretise the eight generic criteria.The indicators are copied from several Forest Certification institutes, so the structureof the sentences may vary. The indicators provide also insight in the formulation ofcriteria sets of the institutes. Every criterion has its own set of indicators which vanbe put to use when determining whether a CDM project satisfies the criteria or not.
Criterion 1: Project framework• The project should contain a comprehensive management plan in which the
following issues are arranged: § Management objectives§ Description of the forest resources to be managed, environmental limitations,
land use and ownership status, socio-economic conditions, and a profile ofadjacent lands
§ Description of silvicultural and/or other management system, based on theecology of the forest in question and information gathered through resourceinventories
§ Rationale for rate of annual harvest and species selection§ Provision for monitoring of forest growth and dynamics§ Environmental safeguards based on environmental assessments§ Plans for the identification and protection of rare, threatened and endangered
species§ Maps describing the forest resource base including protected areas, planned
management activities and land ownership§ Description and justification of harvesting techniques and equipment to be
used• The management plan shall be periodically revised to incorporate the results of
monitoring or new scientific and technical information, as well as to respond tochanging environmental, social and economic circumstances.
• Clear evidence of long-term forest use rights to the land (e.g. land title,customary rights, or lease agreements) shall be demonstrated.
• Appropriate mechanisms shall be employed to resolve disputes over tenureclaims and use rights. The circumstances and status of any outstanding disputeswill be explicitly considered in the certification evaluation. Disputes of substantialmagnitude involving a significant number of interests will normally disqualify anoperation from being certified.
• There is sustained and adequate funding for the management of forests.• Reinvestment in forest-use options must be demonstrated.• The on-the-ground (managerial) infrastructure and technological capacity
must be sufficient and appropriate to implement and manage the proposedproject.
• Forest workers shall receive adequate training and supervision to ensureproper implementation of the management plan.
100 Alterra-rapport 777
• Appropriate overall sequencing of activities• Cost-effectiveness• Consistency of approach and procedures
Criterion 2: Additionality• No project can claim emission reductions unless project proponents make
reasonable demonstration that the project’s practices are ‘additional’ to‘business as usual’ (also called the ‘reference case’ or ‘baseline’) circumstances.§ Determination of the baseline should be done on the basis of historical
series and the prediction of future trends, and should remain fixed for theduration of the project.
§ Determination of the additionality should be done by demonstrating thatthe project results in direct impacts on relative emissions in comparison tothe baseline. The specific measures that lead to these reductions must bereadily identifiable and documented.
• The additionality must be corrected for slippage and leakage. Slippage is thegeographic relocation of GHG emission causing activities, as a result of theproject’s implementation. Leakage is increased GHG emissions indirectlyincentivised by the project: e.g. increased down-stream processing activities.
• There must be the element of Intent or Programme Additionality. This meansthat the project was initiated with the specific intent of lowering GHG emissions.
• To ensure that existing projects and behavioural shifts are not simply repackagedas carbon offsets, they must be financial additional.
• Coverage without duplication
Criterion 3: Verifiability• An effective monitoring and control system audits management’s conformity
with planning.• Forest management should include the research and data collection needed to
monitor, at a minimum, the following indicators:§ Emissions and sequestration of carbon and other greenhouse gases.§ Yield of all forest products harvested§ Growth rates, regeneration and condition of the forest§ Composition and observed changes in the flora and fauna§ Environmental and social impacts of harvesting and other operations§ Costs, productivity and efficiency of forest management
• Monitoring procedures should be consistent and replicable over time to allowcomparison of results and assessment of change.
• The scale and intensity of forest management operations as well as therelative complexity and fragility of the affected environment shoulddetermine the frequency and intensity of monitoring.
• The results of monitoring shall be incorporated into the implementation andrevision of the management plan.
Alterra-rapport 777 101
• Documentation shall be provided by the forest manager to enable monitoringand certifying organisations to trace each forest product from its origin (‘chain ofcustody’).
Criterion 4: Compliance• In signatory countries, the provisions of all binding international agreements
such as CITES, ILO Conventions, ITTA, and Convention on BiologicalDiversity, shall be respected.
• Sustainable Forest Management shall respect all national and local laws andadministrative requirements.
• All applicable and legally prescribed fees, royalties, taxes and other chargesshall be paid.
• Host country’s acceptability of SFM (development objectives and economicpriorities, AIJ regulations and priorities).
• Forest managers shall demonstrate a long-term commitment to adhere to theprinciples and criteria set for such projects.
• Conflicts between laws, regulations and principles and criteria shall beevaluated beforehand for the purposes of project implementation, on a case bycase basis, by the involved, affected and third parties.
• The management shall aim for best practice and good governance during thetime span of the project.
Criterion 5: Environmental sustainability• Plantations as well as natural forests are eligible.• Management shall take (precautionary) measures to decrease impacts of
production activities at plantations and natural forests.• Maintenance, conservation and appropriate enhancement of biological diversity
in forest ecosystems.• Maintenance of ecosystem function, health and vitality.• Representative samples of existing ecosystems within the landscape shall be
protected in their natural state and recorded on maps, appropriate to the scaleand intensity of operations and the uniqueness of the affected resources.
• Safeguards shall exist which protect rare, threatened and endangered speciesand their habitats (e.g., nesting and feeding areas). Conservation zones andprotection areas shall be established, appropriate to the scale and intensity offorest management and the uniqueness of the affected resources. Inappropriatehunting, fishing, trapping and collecting shall be controlled.
• Conservation of the processes that maintain genetic variation.• The use of exotic species shall be carefully controlled and actively monitored to
avoid adverse ecological impacts.• Measures shall be taken to maintain or improve soil structure, fertility, water
quality, and biological activity.• Management systems shall promote the development and adoption of
environmentally friendly non-chemical methods of pest management andstrive to avoid the use of chemical pesticides. If chemicals are used, proper

102 Alterra-rapport 777
equipment and training shall be provided to minimise health and environmentalrisks.
• Use of biological control agents shall be documented, minimised, monitoredand strictly controlled in accordance with national laws and internationallyaccepted scientific protocols. Use of genetically modified organisms shall beprohibited.
• Chemicals, containers, liquid and solid non-organic wastes including fuel and oilshall be disposed of in an environmentally appropriate manner at off-sitelocations.
Criterion 6: Socio-economic sustainability• Forest management shall not threaten or diminish, either directly or indirectly,
the resources or tenure rights of indigenous peoples.• Sites of special cultural, ecological, economic or religious significance to
indigenous peoples shall be clearly identified in co-operation with suchpeoples, and recognised and protected by forest managers.
• Indigenous peoples shall control forest management on their lands andterritories unless they delegate control with free and informed consent to otheragencies.
• The communities within, or adjacent to, the forest management area should begiven opportunities for employment, training and other services.
• The rights of workers to organise and voluntarily negotiate with their employersshall be guaranteed.
• Agreement exists on rights and responsibilities of relevant stakeholders.• Local stakeholders have detailed, reciprocal knowledge pertaining to forest
resource use (including user groups and gender roles), as well as forestmanagement plans prior to implementation.
• Effective mechanisms exist for two-way communication related to forestmanagement among stakeholders.
• Consultations shall be maintained with people and groups directly affected bymanagement operations.
• People link their and their children’s future with management of forestresources.
• Forest management should meet or exceed all applicable laws and/or regulationscovering health and safety of employees and their families.
• Indigenous peoples shall be compensated for the application of their traditionalknowledge regarding the use of forest species or management systems in forestoperations. This compensation shall be formally agreed upon with their free andinformed consent before forest operations commence.
• Forest actors have a reasonable share in the economic benefits derived fromforest use.
• Appropriate mechanisms shall be employed for resolving grievances and forproviding fair compensation in the case of loss or damage affecting the legal orcustomary rights, property, resources, or livelihoods of local peoples. Measuresshall be taken to avoid such loss or damage.

Alterra-rapport 777 103
Criterion 7: Sustainable Forest Management (SFM)• Sustainable Forest Management areas should be protected from illegal
harvesting, settlement and other unauthorised (non-forestry) activities.• Plantations as well as natural forests are eligible.• The design and layout of plantations should promote the protection, restoration
and conservation of natural forests, not increase pressures on natural forests andminimise environmental impact.
• Management of plantations should decrease impact on the environment andpromote environmental and socio-economic sustainability.
• Trees planted in natural forests may supplement natural regeneration, fill gapsor contribute to the conservation of genetic resources. Such plantings shall notreplace or significantly alter the natural ecosystem.
• A proportion of the overall forest management area, appropriate to the scaleof the plantation and to be determined in regional standards, shall be managedso as to restore the site to a natural forest cover.
• The selection of species for planting in plantations or natural forests shall bebased on their overall suitability for the site and their appropriateness to themanagement objectives. In order to enhance the conservation of biologicaldiversity, native species are preferred over exotic species in the establishment ofplantations and the restoration of degraded ecosystems.
• A functioning buffer zone exists between the managed forest and its ‘natural’environment.
• Maintenance and encouragement of productive functions of forests (woodand non-wood).
• Forest management and marketing operations should encourage the optimaluse and local processing of the forest’s diversity of products.
• Yield and quality of forest goods and services shall be sustainable.• Forest management should strive toward economic viability, while taking into
account the full environmental, social and operational costs of production, andensuring the investments necessary to maintain the ecological productivity of theforest.
• Forest management should strive to strengthen and diversify the localeconomy.
• Measures shall be taken to prevent and minimise outbreaks of pests,diseases, fire and invasive plant introductions, with primary reliance onprevention and biological control methods rather than chemical pesticides andfertilisers.
• Forest management shall minimise waste associated with harvesting and on-siteprocessing operations and avoid damage to other forest resources.
• Forest management operations shall recognise, maintain and, where appropriate,enhance the value of forest services and resources such as watersheds andfisheries.

104 Alterra-rapport 777
Criterion 8: Transparency• Rules shall be developed governing the provision of information to the public.
Procedures shall exist to ensure ready public access to information on thecertification process.
• While respecting the confidentiality of information, forest managers shall makepublicly available a summary of the results of monitoring indicators.
• The project concept must allow GHG benefits to be estimated within atolerable level of certainty.
Alterra-rapport 777 105
Annex E Important items of the Executive Summary of Chapter5 of the IPCC Special Report on LULUCF withregards to this project
Land use, land-use change, and forestry (LULUCF) activities aimed at mitigatinggreenhouse gas emissions are often organized as projects. An LULUCF project mayintegrate one or more activities aimed at reducing greenhouse gas emissions orenhancing greenhouse gas sinks in terrestrial ecosystems and related sectors.LULUCF projects are confined to a specific geographic location, time period, andinstitutional framework to allow changes in carbon stocks or greenhouse gasemissions to be monitored and verified. There are three broad types of LULUCFprojects:• avoiding emissions via conservation of existing carbon stocks• increasing carbon storage by sequestration• substituting carbon for fossil fuel and energy-intensive productsEach of these types of project has a variety of subtypes.
ConcernsLULUCF projects have raised specific concerns regarding duration, additionality,leakage, risks, accounting, measuring and monitoring, and verification of greenhouse gasbenefits. These concerns include the ability to construct reasonable, empiricallybased, without-project baselines; the ability to quantify and reduce potential leakageof greenhouse gases across project borders to other areas or markets; and the abilityto cope with natural or human-induced risks that may reduce or eliminate accruedgreenhouse gas benefits. Many of these issues are also applicable to climatemitigation projects in other sectors. There are further questions about the degree towhich projects can be designed to contribute to sustainable development andimproved rural livelihoods. Chapter 5 of the IPCC Special Report on LULUCFaddresses each of these concerns.
Assessment of the experience of LULUCF projects is constrained by the smallnumber of such projects, their limited activity and geographic scope, and the shortperiod of field operations since the first greenhouse gas mitigation project began in1988. About 3.5 Mha of land are currently included in 27 LULUCF greenhouse gasmitigation projects being implemented in 19 countries. In addition, LULUCF projectexperience to date has focused only on mitigating carbon (as carbon dioxide)emissions.
Because no internationally agreed set of guidelines or methods yet exists to quantifycarbon benefits, costs, and the carbon and financial efficiency of project activities,projects have used a wide range of methods to estimate changes in carbon stocks orgreenhouse gas emissions and financial indicators. Few of the results of theseprojects have been independently verified, which makes comparative assessmentsdifficult. Using data reported by projects that have been reviewed, average carbon
106 Alterra-rapport 777
sequestration or emissions avoidance per unit area ranges from about 4-440 t C ha-1;there is wide variation across regions and specific project types. The cost ofgreenhouse gas mitigation effects in these projects ranges from $0.1-28 per t C, basedon dividing the total financial commitment by the estimated long-term greenhousegas mitigation effect.
AdditionalityA fundamental component of project assessment is to determine whether changes incarbon stocks or greenhouse gas emissions associated with a project are ‘additional’to ‘business as usual’. The first step in determining additionality has been to developa without-project (baseline) scenario against which carbon stocks in the project canbe compared. Currently there is no standard method for developing baselines.Approaches for developing and applying baselines include: project specific –establishedthrough a case-by-case exercise, or generic –based on regional, national, or sectoralaggregated data. These baselines may remain fixed throughout the duration of aproject, or they may be periodically adjusted in light of new data or evidence.Methods to quantify (or estimate) carbon stocks in the baseline scenario include theuse of models to project the fate of land in the project area in combination with dataon carbon stocks from proxy or control areas or from the literature.
LeakageExperience shows that reducing access to food or fiber resources without offeringalternatives or substituting for the activity leading to greenhouse gas emissions mayresult in project leakage as people move elsewhere to find needed supplies. A fewpilot projects to date have been designed to reduce leakage by explicitly incorporatingcomponents that supply the resource needs of local communities (e.g., plantingfuelwood plantations to reduce pressures on other forests) and provide socio-economic benefits that create incentives to maintain the project.
AccountingProject accounting and monitoring methods could be matched with projectconditions to address leakage issues. For example, if flows of LULUCF products orpeople across project boundaries are negligible, leakage is likely to be small, and themonitoring area can be roughly equal to the project area. Conversely, where flows aresignificant and leakage is likely to be large, the monitoring area will need to beexpanded beyond the project area to account for the leakage. Alternative approachesfor accounting and monitoring leakage may be required where monitoring andproject areas cannot be easily matched. Potential options include national or regionalLULUCF sectoral benchmarks (empirically derived values that relate leakage levels toactivities and/or regions) that could capture and report leakage outside the projectarea, and standard risk coefficients developed by project or activity type and region,with adjustments to project greenhouse gas benefits made accordingly. However, theeffectiveness of these approaches is untested.
Implementation of projects in countries without assigned amounts for nationalemissions presents specific concerns regarding baselines, greenhouse gas accounting,leakage, and monitoring. Unlike Annex I countries, non-Annex I countries are not

Alterra-rapport 777 107
required to account for emissions on a national level. Therefore, leakage andemissions arising after the project has been completed will not be detected.
Several approaches have been used to account for changes in carbon stocks orgreenhouse gas emissions over the lifetimes of LULUCF projects. Three mainaccounting methods are distinguished in the SR:• One method is base on calculating the difference in carbon stocks between a
project and its baseline at a given point in time –the carbon stock method. Thevalues provided by this method vary depending on the decision of when toaccount for the project’s benefits.
• The average storage method has been used to account for dynamic systems inwhich planting, harvesting, and replanting operations take place. The advantageof this method is that it accounts for the dynamics of carbon storage over thewhole project duration, not only at the times chosen for accounting.
• Another approach is to credit only a fraction of the total changes in carbonstocks or greenhouse gas emissions for each year that the project is maintained –the ton-year method.
A variety of methods have been proposed for establishing an equivalency factor byanalogy to Global Warming Potentials (GWPs). Depending on the accountingmethod used, the year-to-year distribution of changes in carbon stocks or greenhousegas emissions over the project lifetime varies.
DurationThe Kyoto Protocol requires that LULUCF projects result in long-term impacts oncarbon dioxide concentrations in the atmosphere. The definition of ‘long-term’varies, however, and there is no consensus on minimum time frames for projectduration. Different approaches have been proposed to define the duration ofprojects.• According to one view, the changes in carbon stocks or greenhouse gas
emissions must be maintained in perpetuity. This argument is based on theassumption that ‘reversal’ of changes in carbon stocks or greenhouse gasemissions of a project at any point in time would invalidate a project.
• A second view is that the changes in carbon stocks or greenhouse gas emissionsmust be maintained for a period of 100 years to be consistent with the timeframes adopted in the Kyoto Protocol for the calculation of GWP values.
• Under a third view, the changes in carbon stocks or greenhouse gas emissionsmust be maintained until they counteract the effect of an equivalent amount ofgreenhouse gases emitted to the atmosphere.
• A fourth view holds that the changes in carbon stocks or greenhouse gasemissions may vary over different time frames, acknowledging that differentprojects may have different operational time frames; this approach has beenadopted during the Activities Implemented Jointly (AIJ) Pilot Phase.
Eventually, guidelines will be needed on how to calculate the changes in carbonstocks or greenhouse gas emissions of projects that are conducted over differentlifetimes.
108 Alterra-rapport 777
MonitoringQuantification of greenhouse gas emissions or removals in LULUCF projects issubject to a variety of risks and uncertainties. Some of these factors (such as fires,pest and disease, storms) are inherent to certain land-use activities, particularlyforestry; others (such as political and economic factors) may be generic andapplicable to any greenhouse gas mitigation project in LULUCF and other sectors.These risks and uncertainties could be estimated and the changes in carbon stocks orgreenhouse gas emissions adjusted or mitigated through project design,diversification of project portfolios, or insurance methods.
The changes in carbon stocks or greenhouse gas emissions associated with individualLULUCF projects are likely to be more readily quantified and monitored to desiredprecision levels than national inventories of greenhouse gas emissions and removalsbecause of the clearly defined boundaries of project activities, the ease ofstratification of project area, sampling efficiency, and measurement of only aselection of carbon pools. Techniques and methods for measuring carbon invegetation and soils in LULUCF projects to relatively high levels of precision exist.These techniques have not been universally applied to all projects, however, andmethods for accounting of the changes in carbon stocks have not been standardized.A selective accounting system could be used to choose which carbon pools tomeasure; the choice must include all pools that are expected to decrease and aselection of pools that are expected to increase as a result of the project. Therequirements for verifiability in the Protocol suggest that only carbon pools that canbe measured and monitored could be claimed.
The costs of measuring and monitoring carbon pools in LULUCF projects aremainly related to the desired precision level, which varies by project type, size ofproject, distribution of project lands (contiguous or dispersed), and natural variationswithin the various carbon pools. Different levels of sampling intensity can be used tobalance the costs of estimating, monitoring, and verifying the change in carbonstocks. In a few forestry projects in tropical counties, project developers in the earlystages of project implementation have measured and monitored relevantaboveground and below-ground carbon pools to precision levels of about 10 percentof the mean at a cost of about US$1-5 ha -1 and US$0.10-0.50 per t C. The attainableaccuracy and precision of carbon measurements and monitoring is likely to be similaramong LULUCF project types, but differing measuring and monitoring costs willresult from decisions about which particular carbon pools are to be measured andmonitored, as well as their variability.
VerificationQualified independent third-party verification plays an essential role in ensuringunbiased monitoring. Although there is growing experience in verification of baselineand project design, there is no experience with verification of monitored data.Guidelines are needed to help establish a procedure and institutional structure forverification.

Alterra-rapport 777 109
LULUCF projects may provide significant socio-economic and environmentalbenefits to host countries and local communities, though some types of projects posesignificant risk of negative impacts. Experience from many pilot projects to dateindicates that the involvement of local stakeholders in the design and management ofproject activities is often critical for success. Critical factors affecting the capacity ofprojects to provide greenhouse gas and other benefits include consistency withnationally defined sustainable development goals, institutional and technical capacityto develop and implement project guidelines and safeguards, and the extent andeffectiveness of local community participation in project development andimplementation.

110 Alterra-rapport 777

Alterra-rapport 777 111
Annex F Tabulated results of af-/reforestation and forestconservation simulations, potentials and costs
Table 49. Potential area, carbon sequestration and costs for af-/reforestation projects without adoption of criteria, a25% precision level and with banking from 2002 onwards
Af-/Reforestation without adoption of criteria, rotation length 35 years
Countries Plantedarea
(2001-2012)
Totalseques-
tration peryear
Totalseques-tration
2008-2012
costs2008-2012
Totalseques-tration
2000-2050
costs2000-2050
Totalseques-tration
2000-2100
costs2000-2100
(1000 ha) (Mt C y-1) (Mt C) (x 106 $) (Mt C) (x 106 $) (Mt C) (x 106 $)C. America/Caribbean 267 0 3 11 34 131 100 387Africa Developing 368 0 4 10 74 202 214 577Asia Developing 8080 6 64 173 541 1447 1065 2882Oceania Developing 19 0 0 0 1 2 2 6South America 1466 2 25 136 365 2020 924 5214Total (excl.Macedonia)*
10201 10 95 330 1014 3801 2305 9067
Angola 0 0 0 0 0 0 0 0Argentina 378 0 2 21 52 452 123 1071Bangladesh 66 0 0 1 4 10 6 15Belize 0 0 0 0 0 1 0 1Benin 3 0 0 0 1 3 4 9Bhutan 3 0 0 0 1 2 1 3Bolivia 3 0 0 0 1 3 3 9Botswana 0 0 0 0 0 0 0 0Brazil 405 1 8 45 171 943 515 2841Burundi 6 0 0 0 2 5 5 12Cambodia 9 0 0 0 1 3 4 9Cameroon 1 0 0 0 0 0 0 1Central AfricanRepublic
1 0 0 0 0 0 0 1
Chile 191 1 6 32 23 124 73 399China 3462 2 20 53 354 927 503 1317Colombia 21 0 0 1 8 30 25 90Congo 18 0 0 1 8 20 24 61Costa Rica 33 0 1 3 3 13 10 41Cote d'Ivore 15 0 0 0 4 10 12 32Cuba 78 0 1 3 4 13 13 41Democratic Republicof Congo
0 0 0 0 0 0 0 1
Ecuador 12 0 0 1 4 12 11 35El Salvador 6 0 0 0 1 3 2 5Equatorial Guinea 1 0 0 0 0 1 1 2Fiji 6 0 0 0 0 1 1 2French Guyana 0 0 0 0 0 0 0 0Gabon 18 0 0 1 5 25 10 53Gambia 6 0 0 0 0 0 0 0Ghana 6 0 0 0 1 3 3 8
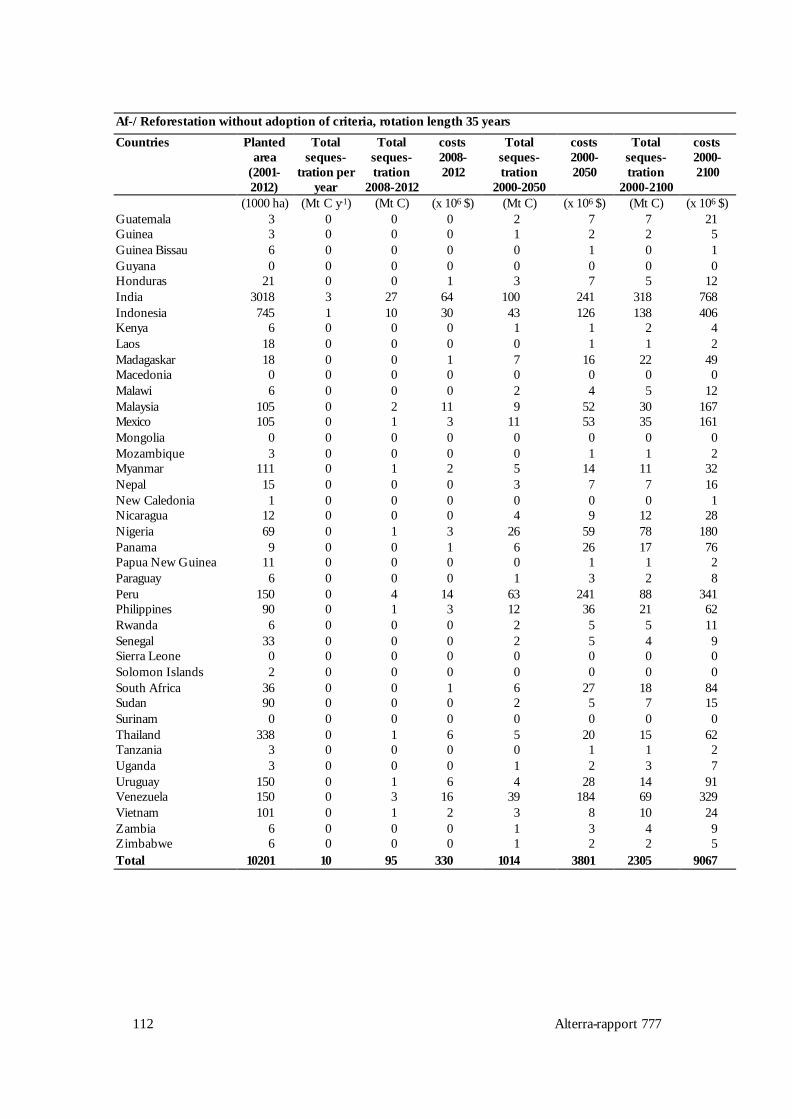
112 Alterra-rapport 777
Af-/Reforestation without adoption of criteria, rotation length 35 years
Countries Plantedarea
(2001-2012)
Totalseques-
tration peryear
Totalseques-tration
2008-2012
costs2008-2012
Totalseques-tration
2000-2050
costs2000-2050
Totalseques-tration
2000-2100
costs2000-2100
(1000 ha) (Mt C y-1) (Mt C) (x 106 $) (Mt C) (x 106 $) (Mt C) (x 106 $)Guatemala 3 0 0 0 2 7 7 21Guinea 3 0 0 0 1 2 2 5Guinea Bissau 6 0 0 0 0 1 0 1Guyana 0 0 0 0 0 0 0 0Honduras 21 0 0 1 3 7 5 12India 3018 3 27 64 100 241 318 768Indonesia 745 1 10 30 43 126 138 406Kenya 6 0 0 0 1 1 2 4Laos 18 0 0 0 0 1 1 2Madagaskar 18 0 0 1 7 16 22 49Macedonia 0 0 0 0 0 0 0 0Malawi 6 0 0 0 2 4 5 12Malaysia 105 0 2 11 9 52 30 167Mexico 105 0 1 3 11 53 35 161Mongolia 0 0 0 0 0 0 0 0Mozambique 3 0 0 0 0 1 1 2Myanmar 111 0 1 2 5 14 11 32Nepal 15 0 0 0 3 7 7 16New Caledonia 1 0 0 0 0 0 0 1Nicaragua 12 0 0 0 4 9 12 28Nigeria 69 0 1 3 26 59 78 180Panama 9 0 0 1 6 26 17 76Papua New Guinea 11 0 0 0 0 1 1 2Paraguay 6 0 0 0 1 3 2 8Peru 150 0 4 14 63 241 88 341Philippines 90 0 1 3 12 36 21 62Rwanda 6 0 0 0 2 5 5 11Senegal 33 0 0 0 2 5 4 9Sierra Leone 0 0 0 0 0 0 0 0Solomon Islands 2 0 0 0 0 0 0 0South Africa 36 0 0 1 6 27 18 84Sudan 90 0 0 0 2 5 7 15Surinam 0 0 0 0 0 0 0 0Thailand 338 0 1 6 5 20 15 62Tanzania 3 0 0 0 0 1 1 2Uganda 3 0 0 0 1 2 3 7Uruguay 150 0 1 6 4 28 14 91Venezuela 150 0 3 16 39 184 69 329Vietnam 101 0 1 2 3 8 10 24Zambia 6 0 0 0 1 3 4 9Zimbabwe 6 0 0 0 1 2 2 5Total 10201 10 95 330 1014 3801 2305 9067
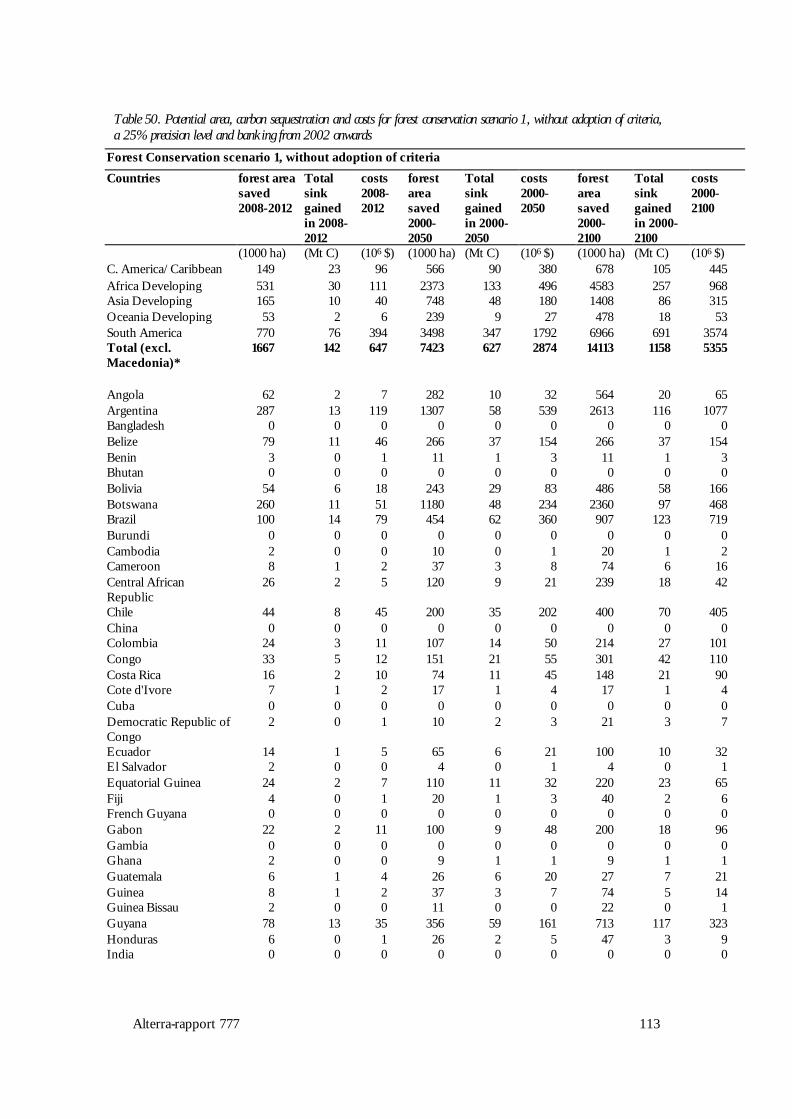
Alterra-rapport 777 113
Table 50. Potential area, carbon sequestration and costs for forest conservation scenario 1, without adoption of criteria,a 25% precision level and banking from 2002 onwards
Forest Conservation scenario 1, without adoption of criteria
Countries forest areasaved2008-2012
Totalsinkgainedin 2008-2012
costs2008-2012
forestareasaved2000-2050
Totalsinkgainedin 2000-2050
costs2000-2050
forestareasaved2000-2100
Totalsinkgainedin 2000-2100
costs2000-2100
(1000 ha) (Mt C) (106 $) (1000 ha) (Mt C) (106 $) (1000 ha) (Mt C) (106 $)C. America/Caribbean 149 23 96 566 90 380 678 105 445Africa Developing 531 30 111 2373 133 496 4583 257 968Asia Developing 165 10 40 748 48 180 1408 86 315Oceania Developing 53 2 6 239 9 27 478 18 53South America 770 76 394 3498 347 1792 6966 691 3574Total (excl.Macedonia)*
1667 142 647 7423 627 2874 14113 1158 5355
Angola 62 2 7 282 10 32 564 20 65Argentina 287 13 119 1307 58 539 2613 116 1077Bangladesh 0 0 0 0 0 0 0 0 0Belize 79 11 46 266 37 154 266 37 154Benin 3 0 1 11 1 3 11 1 3Bhutan 0 0 0 0 0 0 0 0 0Bolivia 54 6 18 243 29 83 486 58 166Botswana 260 11 51 1180 48 234 2360 97 468Brazil 100 14 79 454 62 360 907 123 719Burundi 0 0 0 0 0 0 0 0 0Cambodia 2 0 0 10 0 1 20 1 2Cameroon 8 1 2 37 3 8 74 6 16Central AfricanRepublic
26 2 5 120 9 21 239 18 42
Chile 44 8 45 200 35 202 400 70 405China 0 0 0 0 0 0 0 0 0Colombia 24 3 11 107 14 50 214 27 101Congo 33 5 12 151 21 55 301 42 110Costa Rica 16 2 10 74 11 45 148 21 90Cote d'Ivore 7 1 2 17 1 4 17 1 4Cuba 0 0 0 0 0 0 0 0 0Democratic Republic ofCongo
2 0 1 10 2 3 21 3 7
Ecuador 14 1 5 65 6 21 100 10 32El Salvador 2 0 0 4 0 1 4 0 1Equatorial Guinea 24 2 7 110 11 32 220 23 65Fiji 4 0 1 20 1 3 40 2 6French Guyana 0 0 0 0 0 0 0 0 0Gabon 22 2 11 100 9 48 200 18 96Gambia 0 0 0 0 0 0 0 0 0Ghana 2 0 0 9 1 1 9 1 1Guatemala 6 1 4 26 6 20 27 7 21Guinea 8 1 2 37 3 7 74 5 14Guinea Bissau 2 0 0 11 0 0 22 0 1Guyana 78 13 35 356 59 161 713 117 323Honduras 6 0 1 26 2 5 47 3 9India 0 0 0 0 0 0 0 0 0
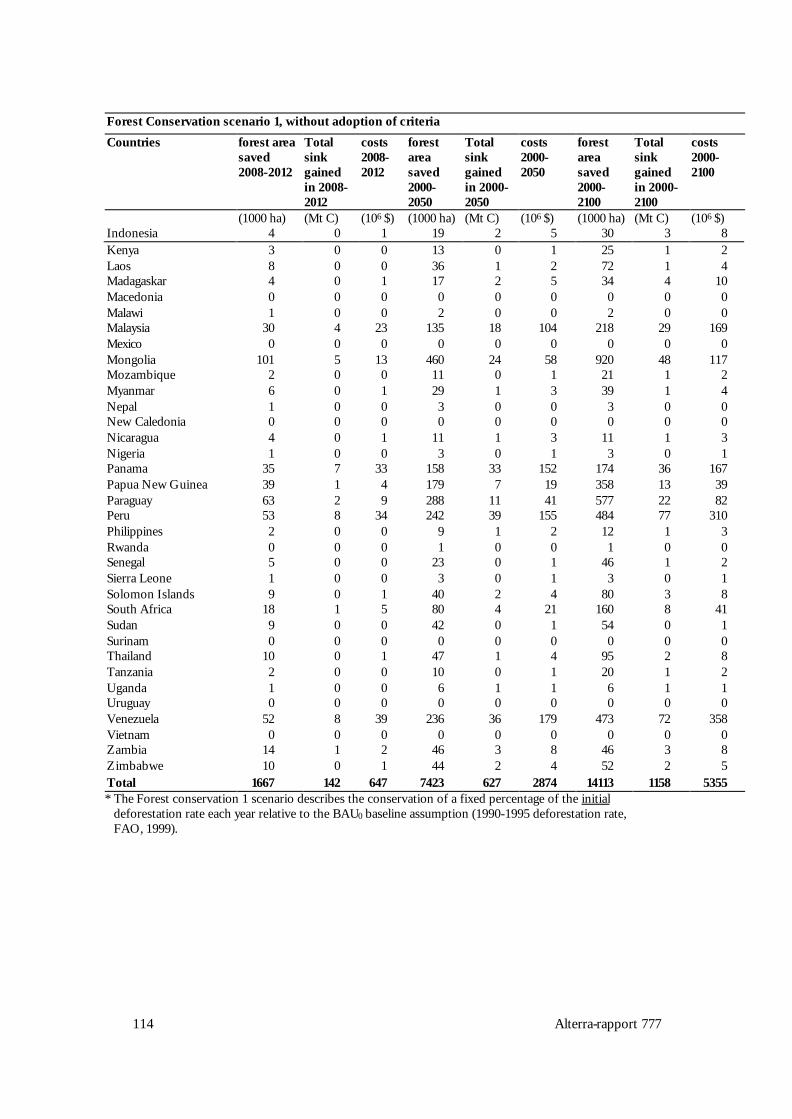
114 Alterra-rapport 777
Forest Conservation scenario 1, without adoption of criteria
Countries forest areasaved2008-2012
Totalsinkgainedin 2008-2012
costs2008-2012
forestareasaved2000-2050
Totalsinkgainedin 2000-2050
costs2000-2050
forestareasaved2000-2100
Totalsinkgainedin 2000-2100
costs2000-2100
(1000 ha) (Mt C) (106 $) (1000 ha) (Mt C) (106 $) (1000 ha) (Mt C) (106 $)Indonesia 4 0 1 19 2 5 30 3 8Kenya 3 0 0 13 0 1 25 1 2Laos 8 0 0 36 1 2 72 1 4Madagaskar 4 0 1 17 2 5 34 4 10Macedonia 0 0 0 0 0 0 0 0 0Malawi 1 0 0 2 0 0 2 0 0Malaysia 30 4 23 135 18 104 218 29 169Mexico 0 0 0 0 0 0 0 0 0Mongolia 101 5 13 460 24 58 920 48 117Mozambique 2 0 0 11 0 1 21 1 2Myanmar 6 0 1 29 1 3 39 1 4Nepal 1 0 0 3 0 0 3 0 0New Caledonia 0 0 0 0 0 0 0 0 0Nicaragua 4 0 1 11 1 3 11 1 3Nigeria 1 0 0 3 0 1 3 0 1Panama 35 7 33 158 33 152 174 36 167Papua New Guinea 39 1 4 179 7 19 358 13 39Paraguay 63 2 9 288 11 41 577 22 82Peru 53 8 34 242 39 155 484 77 310Philippines 2 0 0 9 1 2 12 1 3Rwanda 0 0 0 1 0 0 1 0 0Senegal 5 0 0 23 0 1 46 1 2Sierra Leone 1 0 0 3 0 1 3 0 1Solomon Islands 9 0 1 40 2 4 80 3 8South Africa 18 1 5 80 4 21 160 8 41Sudan 9 0 0 42 0 1 54 0 1Surinam 0 0 0 0 0 0 0 0 0Thailand 10 0 1 47 1 4 95 2 8Tanzania 2 0 0 10 0 1 20 1 2Uganda 1 0 0 6 1 1 6 1 1Uruguay 0 0 0 0 0 0 0 0 0Venezuela 52 8 39 236 36 179 473 72 358Vietnam 0 0 0 0 0 0 0 0 0Zambia 14 1 2 46 3 8 46 3 8Zimbabwe 10 0 1 44 2 4 52 2 5Total 1667 142 647 7423 627 2874 14113 1158 5355* The Forest conservation 1 scenario describes the conservation of a fixed percentage of the initial
deforestation rate each year relative to the BAU0 baseline assumption (1990-1995 deforestation rate,FAO, 1999).

Alterra-rapport 777 115
Table 51. Potential area, carbon sequestration and costs for forest conservation scenario 1, with adoption of criteria, a5% precision level and banking from 2002 onwardsForest Conservation scenario 1*, with adoption of all criteria
Countries forest areasaved2008-2012
Totalsinkgainedin 2008-2012
costs2008-2012
forestareasaved2000-2050
Totalsinkgainedin 2000-2050
costs2000-2050
forestareasaved2000-2100
Totalsinkgainedin 2000-2100
costs2000-2100
(1000 ha) (Mt C) (106 $) (1000 ha) (Mt C) (106 $) (1000 ha) (Mt C) (106 $)C. America/Caribbean 32 5 74 122 19 292 146 23 342Africa Developing 115 7 79 512 29 353 990 56 695Asia Developing 36 2 29 162 10 130 304 19 221Oceania Developing 11 0 3 52 2 16 103 4 32South America 166 16 333 756 75 1512 1505 149 3019Total (excl.Macedonia)*
360 31 517 1603 135 2303 3048 250 4308
Angola 13 0 5 61 2 21 122 4 42Argentina 62 3 118 282 12 537 565 25 1074Bangladesh 0 0 0 0 0 0 0 0 0Belize 17 2 35 58 8 118 58 8 118Benin 1 0 0 2 0 2 2 0 2Bhutan 0 0 0 0 0 0 0 0 0Bolivia 12 1 10 53 6 48 105 12 95Botswana 56 2 42 255 10 192 510 21 385Brazil 22 3 70 98 13 318 196 27 636Burundi 0 0 0 0 0 0 0 0 0Cambodia 0 0 0 2 0 0 4 0 1Cameroon 2 0 1 8 1 4 16 1 8Central AfricanRepublic
6 0 2 26 2 10 52 4 19
Chile 10 2 39 43 8 179 86 15 357China 0 0 0 0 0 0 0 0 0Colombia 5 1 8 23 3 36 46 6 71Congo 7 1 6 33 5 29 65 9 57Costa Rica 4 1 8 16 2 35 32 5 70Cote d'Ivore 2 0 1 4 0 2 4 0 2Cuba 0 0 0 0 0 0 0 0 0Democratic Republic ofCongo
0 0 0 2 0 1 4 1 3
Ecuador 3 0 3 14 1 13 22 2 21El Salvador 1 0 0 1 0 0 1 0 0Equatorial Guinea 5 1 4 24 2 18 48 5 37Fiji 1 0 1 4 0 2 9 0 5French Guyana 0 0 0 0 0 0 0 0 0Gabon 5 0 9 22 2 41 43 4 83Gambia 0 0 0 0 0 0 0 0 0Ghana 0 0 0 2 0 1 2 0 1Guatemala 1 0 3 6 1 13 6 1 14Guinea 2 0 1 8 1 4 16 1 7Guinea Bissau 1 0 0 2 0 0 5 0 0Guyana 17 3 19 77 13 88 154 25 176Honduras 1 0 1 6 0 3 10 1 5India 0 0 0 0 0 0 0 0 0

116 Alterra-rapport 777
Forest Conservation scenario 1*, with adoption of all criteria
Countries forest areasaved2008-2012
Totalsinkgainedin 2008-2012
costs2008-2012
forestareasaved2000-2050
Totalsinkgainedin 2000-2050
costs2000-2050
forestareasaved2000-2100
Totalsinkgainedin 2000-2100
costs2000-2100
(1000 ha) (Mt C) (106 $) (1000 ha) (Mt C) (106 $) (1000 ha) (Mt C) (106 $)Indonesia 1 0 1 4 0 3 7 1 5Kenya 1 0 0 3 0 0 5 0 1Laos 2 0 0 8 0 1 16 0 2Madagaskar 1 0 0 4 0 2 7 1 4Macedonia 0 0 0 0 0 0 0 0 0Malawi 0 0 0 0 0 0 0 0 0Malaysia 6 1 20 29 4 92 47 6 149Mexico 0 0 0 0 0 0 0 0 0Mongolia 22 1 6 99 5 27 199 10 54Mozambique 1 0 0 2 0 0 5 0 1Myanmar 1 0 0 6 0 2 8 0 2Nepal 0 0 0 1 0 0 1 0 0New Caledonia 0 0 0 0 0 0 0 0 0Nicaragua 1 0 1 2 0 1 2 0 1Nigeria 0 0 0 1 0 0 1 0 0Panama 8 2 27 34 7 122 38 8 134Papua New Guinea 9 0 2 39 1 11 77 3 22Paraguay 14 1 6 62 2 29 125 5 59Peru 11 2 25 52 8 116 104 17 232Philippines 0 0 0 2 0 1 3 0 2Rwanda 0 0 0 0 0 0 0 0 0Senegal 1 0 0 5 0 1 10 0 1Sierra Leone 0 0 0 1 0 0 1 0 0Solomon Islands 2 0 1 9 0 2 17 1 5South Africa 4 0 4 17 1 17 35 2 34Sudan 2 0 0 9 0 0 12 0 0Surinam 0 0 0 0 0 0 0 0 0Thailand 2 0 1 10 0 3 20 0 6Tanzania 0 0 0 2 0 0 4 0 1Uganda 0 0 0 1 0 1 1 0 1Uruguay 0 0 0 0 0 0 0 0 0Venezuela 11 2 33 51 8 149 102 15 298Vietnam 0 0 0 0 0 0 0 0 0Zambia 3 0 1 10 1 4 10 1 4Zimbabwe 2 0 0 10 0 2 11 0 3Total 360 31 517 1603 135 2303 3048 250 4308* The Forest conservation 1 scenario describes the conservation of a fixed percentage of the initial
deforestation rate each year relative to the BAU0 baseline assumption (1990-1995 deforestation rate,FAO, 1999).

Alterra-rapport 777 117
Table 52. Potential area, carbon sequestration and costs for forest conservation scenario 2, without adoption of criteria,a 25% precision level and banking from 2002 onwards
Forest Conservation scenario 2*, without adoption of criteria
Countries forest areasaved2008-2012
Totalsinkgainedin 2008-2012
costs2008-2012
forestareasaved2000-2050
Totalsinkgainedin 2000-2050
costs2000-2050
forestareasaved2000-2100
Totalsinkgainedin 2000-2100
costs2000-2100
(1000 ha) (Mt C) (106 $) (1000 ha) (Mt C) (106 $) (1000 ha) (Mt C) (106 $)C. America/Caribbean 14 2 9 14 2 9 14 2 9Africa Developing 48 3 10 48 3 10 48 3 10Asia Developing 15 1 4 15 1 4 15 1 4Oceania Developing 5 0 1 5 0 1 5 0 1South America 70 7 36 70 7 36 70 7 36Total (excl.Macedonia)*
152 13 59 152 13 59 152 13 59
Angola 6 0 1 6 0 1 6 0 1Argentina 26 1 11 26 1 11 26 1 11Bangladesh 0 0 0 0 0 0 0 0 0Belize 7 1 4 7 1 4 7 1 4Benin 0 0 0 0 0 0 0 0 0Bhutan 0 0 0 0 0 0 0 0 0Bolivia 5 1 2 5 1 2 5 1 2Botswana 24 1 5 24 1 5 24 1 5Brazil 9 1 7 9 1 7 9 1 7Burundi 0 0 0 0 0 0 0 0 0Cambodia 0 0 0 0 0 0 0 0 0Cameroon 1 0 0 1 0 0 1 0 0Central AfricanRepublic
2 0 0 2 0 0 2 0 0
Chile 4 1 4 4 1 4 4 1 4China 0 0 0 0 0 0 0 0 0Colombia 2 0 1 2 0 1 2 0 1Congo 3 0 1 3 0 1 3 0 1Costa Rica 1 0 1 1 0 1 1 0 1Cote d'Ivore 1 0 0 1 0 0 1 0 0Cuba 0 0 0 0 0 0 0 0 0Democratic Republic ofCongo
0 0 0 0 0 0 0 0 0
Ecuador 1 0 0 1 0 0 1 0 0El Salvador 0 0 0 0 0 0 0 0 0Equatorial Guinea 2 0 1 2 0 1 2 0 1Fiji 0 0 0 0 0 0 0 0 0French Guyana 0 0 0 0 0 0 0 0 0Gabon 2 0 1 2 0 1 2 0 1Gambia 0 0 0 0 0 0 0 0 0Ghana 0 0 0 0 0 0 0 0 0Guatemala 1 0 0 1 0 0 1 0 0Guinea 1 0 0 1 0 0 1 0 0Guinea Bissau 0 0 0 0 0 0 0 0 0Guyana 7 1 3 7 1 3 7 1 3Honduras 1 0 0 1 0 0 1 0 0India 0 0 0 0 0 0 0 0 0

118 Alterra-rapport 777
Forest Conservation scenario 2*, without adoption of criteria
Countries forest areasaved2008-2012
Totalsinkgainedin 2008-2012
costs2008-2012
forestareasaved2000-2050
Totalsinkgainedin 2000-2050
costs2000-2050
forestareasaved2000-2100
Totalsinkgainedin 2000-2100
costs2000-2100
(1000 ha) (Mt C) (106 $) (1000 ha) (Mt C) (106 $) (1000 ha) (Mt C) (106 $)Indonesia 0 0 0 0 0 0 0 0 0Kenya 0 0 0 0 0 0 0 0 0Laos 1 0 0 1 0 0 1 0 0Madagaskar 0 0 0 0 0 0 0 0 0Macedonia 0 0 0 0 0 0 0 0 0Malawi 0 0 0 0 0 0 0 0 0Malaysia 3 0 2 3 0 2 3 0 2Mexico 0 0 0 0 0 0 0 0 0Mongolia 9 0 1 9 0 1 9 0 1Mozambique 0 0 0 0 0 0 0 0 0Myanmar 1 0 0 1 0 0 1 0 0Nepal 0 0 0 0 0 0 0 0 0New Caledonia 0 0 0 0 0 0 0 0 0Nicaragua 0 0 0 0 0 0 0 0 0Nigeria 0 0 0 0 0 0 0 0 0Panama 3 1 3 3 1 3 3 1 3Papua New Guinea 4 0 0 4 0 0 4 0 0Paraguay 6 0 1 6 0 1 6 0 1Peru 5 1 3 5 1 3 5 1 3Philippines 0 0 0 0 0 0 0 0 0Rwanda 0 0 0 0 0 0 0 0 0Senegal 0 0 0 0 0 0 0 0 0Sierra Leone 0 0 0 0 0 0 0 0 0Solomon Islands 1 0 0 1 0 0 1 0 0South Africa 2 0 0 2 0 0 2 0 0Sudan 1 0 0 1 0 0 1 0 0Surinam 0 0 0 0 0 0 0 0 0Thailand 1 0 0 1 0 0 1 0 0Tanzania 0 0 0 0 0 0 0 0 0Uganda 0 0 0 0 0 0 0 0 0Uruguay 0 0 0 0 0 0 0 0 0Venezuela 5 1 4 5 1 4 5 1 4Vietnam 0 0 0 0 0 0 0 0 0Zambia 1 0 0 1 0 0 1 0 0Zimbabwe 1 0 0 1 0 0 1 0 0Total 152 13 59 152 13 59 152 13 59
* The Forest conservation 2 scenario is basically the same as Forest conservation 1, but with a singleforest conservation activity in the first year and no additional conservation activities in consecutiveyears.

Alterra-rapport 777 119
Table 53. Potential area, carbon sequestration and costs for forest conservation scenario 2, with adoption of criteria, a25% precision level and banking from 2002 onwardsForest Conservation scenario 2*, with adoption of all criteria
Countries forest areasaved
2008-2012
Totalsink
gainedin 2008-
2012
costs2008-2012
forestarea
saved2000-2050
Totalsink
gainedin 2000-
2050
costs2000-2050
forestarea
saved2000-2100
Totalsink
gainedin 2000-
2100
costs2000-2100
(1000 ha) (Mt C) (106 $) (1000 ha) (Mt C) (106 $) (1000 ha) (Mt C) (106 $)C. America/Caribbean 3 0 7 3 0 7 3 0 7Africa Developing 10 1 7 10 1 7 10 1 7Asia Developing 3 0 3 3 0 3 3 0 3Oceania Developing 1 0 0 1 0 0 1 0 0South America 15 1 30 15 1 30 15 1 30Total (excl. Macedonia)* 33 3 47 33 3 47 33 3 47
Angola 1 0 0 1 0 0 1 0 0Argentina 6 0 11 6 0 11 6 0 11Bangladesh 0 0 0 0 0 0 0 0 0Belize 2 0 3 2 0 3 2 0 3Benin 0 0 0 0 0 0 0 0 0Bhutan 0 0 0 0 0 0 0 0 0Bolivia 1 0 1 1 0 1 1 0 1Botswana 5 0 4 5 0 4 5 0 4Brazil 2 0 6 2 0 6 2 0 6Burundi 0 0 0 0 0 0 0 0 0Cambodia 0 0 0 0 0 0 0 0 0Cameroon 0 0 0 0 0 0 0 0 0Central African Republic 1 0 0 1 0 0 1 0 0Chile 1 0 4 1 0 4 1 0 4China 0 0 0 0 0 0 0 0 0Colombia 0 0 1 0 0 1 0 0 1Congo 1 0 1 1 0 1 1 0 1Costa Rica 0 0 1 0 0 1 0 0 1Cote d'Ivore 0 0 0 0 0 0 0 0 0Cuba 0 0 0 0 0 0 0 0 0Democratic Republic ofCongo
0 0 0 0 0 0 0 0 0
Ecuador 0 0 0 0 0 0 0 0 0El Salvador 0 0 0 0 0 0 0 0 0Equatorial Guinea 0 0 0 0 0 0 0 0 0Fiji 0 0 0 0 0 0 0 0 0French Guyana 0 0 0 0 0 0 0 0 0Gabon 0 0 1 0 0 1 0 0 1Gambia 0 0 0 0 0 0 0 0 0Ghana 0 0 0 0 0 0 0 0 0Guatemala 0 0 0 0 0 0 0 0 0Guinea 0 0 0 0 0 0 0 0 0Guinea Bissau 0 0 0 0 0 0 0 0 0Guyana 2 0 2 2 0 2 2 0 2Honduras 0 0 0 0 0 0 0 0 0India 0 0 0 0 0 0 0 0 0Indonesia 0 0 0 0 0 0 0 0 0Kenya 0 0 0 0 0 0 0 0 0

120 Alterra-rapport 777
Forest Conservation scenario 2*, with adoption of all criteria
Countries forest areasaved
2008-2012
Totalsink
gainedin 2008-
2012
costs2008-2012
forestarea
saved2000-2050
Totalsink
gainedin 2000-
2050
costs2000-2050
forestarea
saved2000-2100
Totalsink
gainedin 2000-
2100
costs2000-2100
(1000 ha) (Mt C) (106 $) (1000 ha) (Mt C) (106 $) (1000 ha) (Mt C) (106 $)Laos 0 0 0 0 0 0 0 0 0Madagaskar 0 0 0 0 0 0 0 0 0Macedonia 0 0 0 0 0 0 0 0 0Malawi 0 0 0 0 0 0 0 0 0Malaysia 1 0 2 1 0 2 1 0 2Mexico 0 0 0 0 0 0 0 0 0Mongolia 2 0 1 2 0 1 2 0 1Mozambique 0 0 0 0 0 0 0 0 0Myanmar 0 0 0 0 0 0 0 0 0Nepal 0 0 0 0 0 0 0 0 0New Caledonia 0 0 0 0 0 0 0 0 0Nicaragua 0 0 0 0 0 0 0 0 0Nigeria 0 0 0 0 0 0 0 0 0Panama 1 0 2 1 0 2 1 0 2Papua New Guinea 1 0 0 1 0 0 1 0 0Paraguay 1 0 1 1 0 1 1 0 1Peru 1 0 2 1 0 2 1 0 2Philippines 0 0 0 0 0 0 0 0 0Rwanda 0 0 0 0 0 0 0 0 0Senegal 0 0 0 0 0 0 0 0 0Sierra Leone 0 0 0 0 0 0 0 0 0Solomon Islands 0 0 0 0 0 0 0 0 0South Africa 0 0 0 0 0 0 0 0 0Sudan 0 0 0 0 0 0 0 0 0Surinam 0 0 0 0 0 0 0 0 0Thailand 0 0 0 0 0 0 0 0 0Tanzania 0 0 0 0 0 0 0 0 0Uganda 0 0 0 0 0 0 0 0 0Uruguay 0 0 0 0 0 0 0 0 0Venezuela 1 0 3 1 0 3 1 0 3Vietnam 0 0 0 0 0 0 0 0 0Zambia 0 0 0 0 0 0 0 0 0Zimbabwe 0 0 0 0 0 0 0 0 0Total 33 3 47 33 3 47 33 3 47* The Forest conservation 2 scenario is basically the same as Forest conservation 1, but with a single forest
conservation activity in the first year and no additional conservation activities in consecutive years.
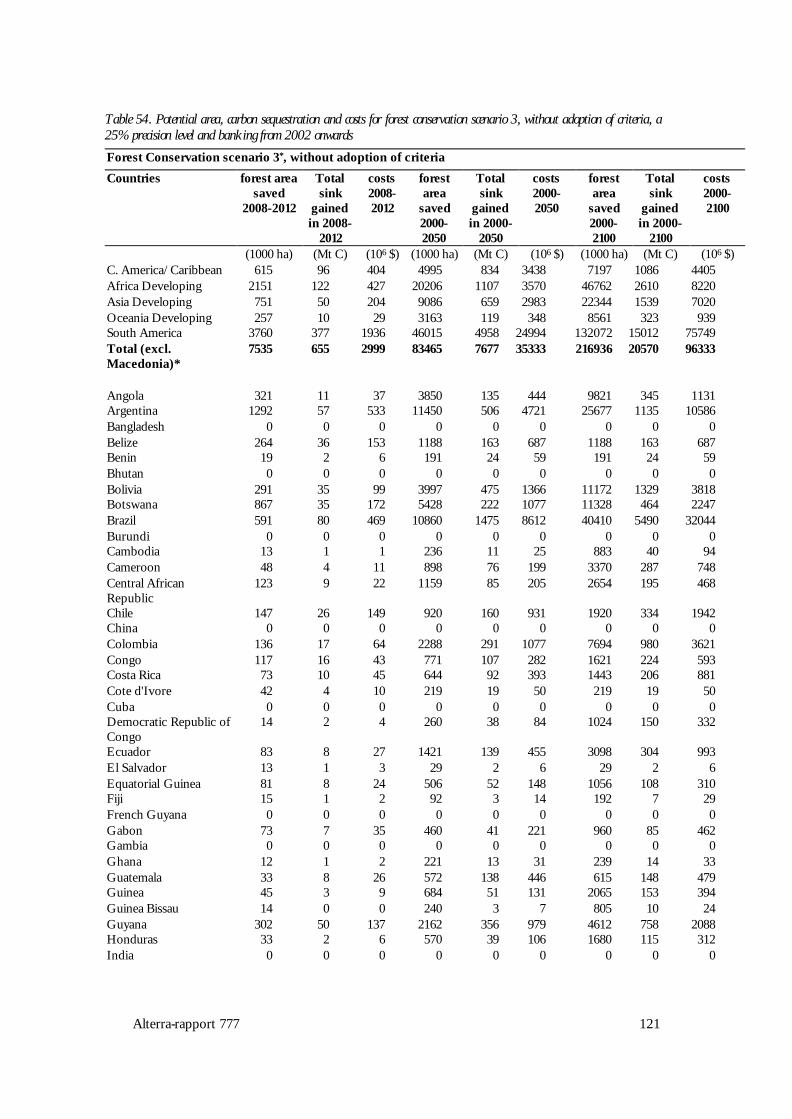
Alterra-rapport 777 121
Table 54. Potential area, carbon sequestration and costs for forest conservation scenario 3, without adoption of criteria, a25% precision level and banking from 2002 onwardsForest Conservation scenario 3*, without adoption of criteria
Countries forest areasaved
2008-2012
Totalsink
gainedin 2008-
2012
costs2008-2012
forestarea
saved2000-2050
Totalsink
gainedin 2000-
2050
costs2000-2050
forestarea
saved2000-2100
Totalsink
gainedin 2000-
2100
costs2000-2100
(1000 ha) (Mt C) (106 $) (1000 ha) (Mt C) (106 $) (1000 ha) (Mt C) (106 $)C. America/Caribbean 615 96 404 4995 834 3438 7197 1086 4405Africa Developing 2151 122 427 20206 1107 3570 46762 2610 8220Asia Developing 751 50 204 9086 659 2983 22344 1539 7020Oceania Developing 257 10 29 3163 119 348 8561 323 939South America 3760 377 1936 46015 4958 24994 132072 15012 75749Total (excl.Macedonia)*
7535 655 2999 83465 7677 35333 216936 20570 96333
Angola 321 11 37 3850 135 444 9821 345 1131Argentina 1292 57 533 11450 506 4721 25677 1135 10586Bangladesh 0 0 0 0 0 0 0 0 0Belize 264 36 153 1188 163 687 1188 163 687Benin 19 2 6 191 24 59 191 24 59Bhutan 0 0 0 0 0 0 0 0 0Bolivia 291 35 99 3997 475 1366 11172 1329 3818Botswana 867 35 172 5428 222 1077 11328 464 2247Brazil 591 80 469 10860 1475 8612 40410 5490 32044Burundi 0 0 0 0 0 0 0 0 0Cambodia 13 1 1 236 11 25 883 40 94Cameroon 48 4 11 898 76 199 3370 287 748Central AfricanRepublic
123 9 22 1159 85 205 2654 195 468
Chile 147 26 149 920 160 931 1920 334 1942China 0 0 0 0 0 0 0 0 0Colombia 136 17 64 2288 291 1077 7694 980 3621Congo 117 16 43 771 107 282 1621 224 593Costa Rica 73 10 45 644 92 393 1443 206 881Cote d'Ivore 42 4 10 219 19 50 219 19 50Cuba 0 0 0 0 0 0 0 0 0Democratic Republic ofCongo
14 2 4 260 38 84 1024 150 332
Ecuador 83 8 27 1421 139 455 3098 304 993El Salvador 13 1 3 29 2 6 29 2 6Equatorial Guinea 81 8 24 506 52 148 1056 108 310Fiji 15 1 2 92 3 14 192 7 29French Guyana 0 0 0 0 0 0 0 0 0Gabon 73 7 35 460 41 221 960 85 462Gambia 0 0 0 0 0 0 0 0 0Ghana 12 1 2 221 13 31 239 14 33Guatemala 33 8 26 572 138 446 615 148 479Guinea 45 3 9 684 51 131 2065 153 394Guinea Bissau 14 0 0 240 3 7 805 10 24Guyana 302 50 137 2162 356 979 4612 758 2088Honduras 33 2 6 570 39 106 1680 115 312India 0 0 0 0 0 0 0 0 0
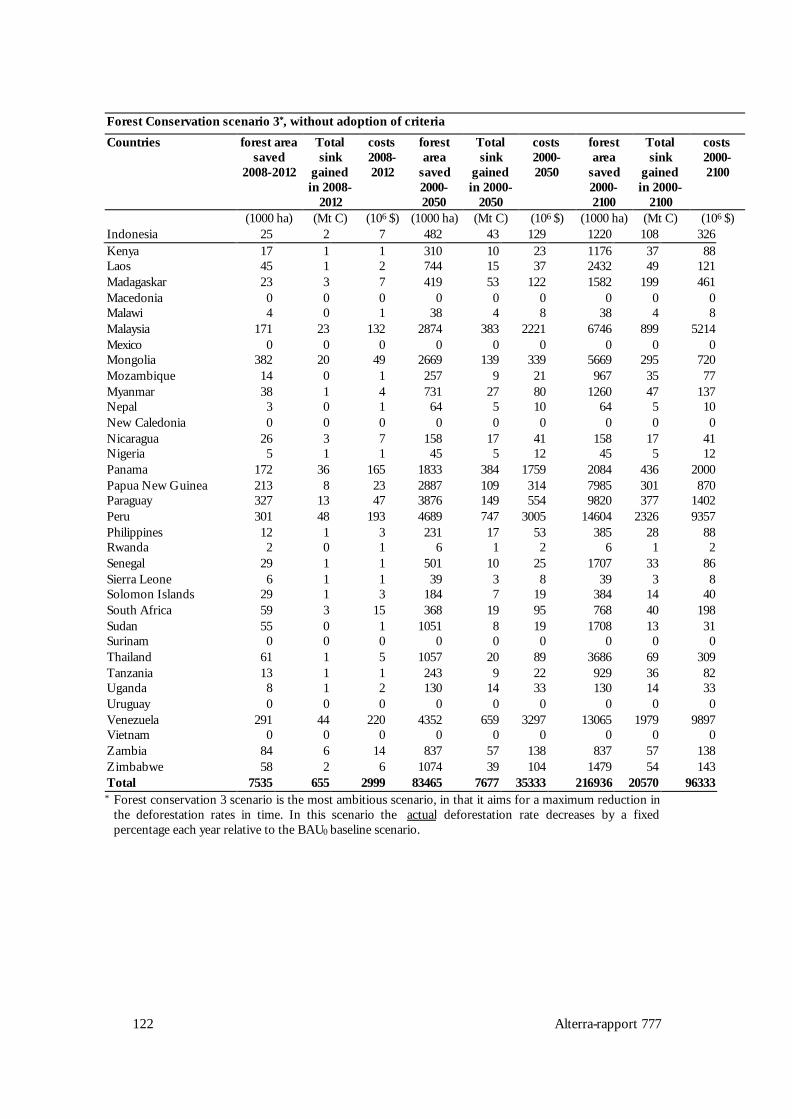
122 Alterra-rapport 777
Forest Conservation scenario 3*, without adoption of criteria
Countries forest areasaved
2008-2012
Totalsink
gainedin 2008-
2012
costs2008-2012
forestarea
saved2000-2050
Totalsink
gainedin 2000-
2050
costs2000-2050
forestarea
saved2000-2100
Totalsink
gainedin 2000-
2100
costs2000-2100
(1000 ha) (Mt C) (106 $) (1000 ha) (Mt C) (106 $) (1000 ha) (Mt C) (106 $)Indonesia 25 2 7 482 43 129 1220 108 326Kenya 17 1 1 310 10 23 1176 37 88Laos 45 1 2 744 15 37 2432 49 121Madagaskar 23 3 7 419 53 122 1582 199 461Macedonia 0 0 0 0 0 0 0 0 0Malawi 4 0 1 38 4 8 38 4 8Malaysia 171 23 132 2874 383 2221 6746 899 5214Mexico 0 0 0 0 0 0 0 0 0Mongolia 382 20 49 2669 139 339 5669 295 720Mozambique 14 0 1 257 9 21 967 35 77Myanmar 38 1 4 731 27 80 1260 47 137Nepal 3 0 1 64 5 10 64 5 10New Caledonia 0 0 0 0 0 0 0 0 0Nicaragua 26 3 7 158 17 41 158 17 41Nigeria 5 1 1 45 5 12 45 5 12Panama 172 36 165 1833 384 1759 2084 436 2000Papua New Guinea 213 8 23 2887 109 314 7985 301 870Paraguay 327 13 47 3876 149 554 9820 377 1402Peru 301 48 193 4689 747 3005 14604 2326 9357Philippines 12 1 3 231 17 53 385 28 88Rwanda 2 0 1 6 1 2 6 1 2Senegal 29 1 1 501 10 25 1707 33 86Sierra Leone 6 1 1 39 3 8 39 3 8Solomon Islands 29 1 3 184 7 19 384 14 40South Africa 59 3 15 368 19 95 768 40 198Sudan 55 0 1 1051 8 19 1708 13 31Surinam 0 0 0 0 0 0 0 0 0Thailand 61 1 5 1057 20 89 3686 69 309Tanzania 13 1 1 243 9 22 929 36 82Uganda 8 1 2 130 14 33 130 14 33Uruguay 0 0 0 0 0 0 0 0 0Venezuela 291 44 220 4352 659 3297 13065 1979 9897Vietnam 0 0 0 0 0 0 0 0 0Zambia 84 6 14 837 57 138 837 57 138Zimbabwe 58 2 6 1074 39 104 1479 54 143Total 7535 655 2999 83465 7677 35333 216936 20570 96333* Forest conservation 3 scenario is the most ambitious scenario, in that it aims for a maximum reduction in
the deforestation rates in time. In this scenario the actual deforestation rate decreases by a fixedpercentage each year relative to the BAU0 baseline scenario.

Alterra-rapport 777 123
Table 55. Potential area, carbon sequestration and costs for forest conservation scenario 3, with adoption of criteria, a25% precision level and banking from 2002 onwardsForest Conservation scenario 3*, with adoption of all criteria
Countries forest areasaved
2008-2012
Totalsink
gainedin 2008-
2012
costs2008-2012
forestarea
saved2000-2050
Totalsink
gainedin 2000-
2050
costs2000-2050
forestarea
saved2000-2100
Totalsink
gainedin 2000-
2100
costs2000-2100
(1000 ha) (Mt C) (106 $) (1000 ha) (Mt C) (106 $) (1000 ha) (Mt C) (106 $)C. America/Caribbean 176 27 406 2021 334 5018 3083 473 7000Africa Developing 624 35 419 8525 473 5393 23478 1303 14513Asia Developing 199 13 167 3111 208 2950 8658 548 7650Oceania Developing 65 2 20 1066 40 321 3623 137 1080South America 950 94 1900 15581 1565 31310 51948 5328 106158Total (excl.Macedonia)*
2013 172 2911 30305 2619 44992 90791 7789 136401
Angola 78 3 27 1330 47 460 4556 160 1575Argentina 349 15 664 5333 236 10149 16304 721 31027Bangladesh 0 0 0 0 0 0 0 0 0Belize 89 12 183 690 95 1419 690 95 1419Benin 4 1 3 43 5 28 43 5 28Bhutan 0 0 0 0 0 0 0 0 0Bolivia 68 8 61 1207 144 1092 4325 514 3911Botswana 292 12 221 3574 146 2697 9218 377 6957Brazil 129 18 419 2465 335 7997 9626 1308 31233Burundi 0 0 0 0 0 0 0 0 0Cambodia 3 0 1 53 2 12 208 9 45Cameroon 11 1 6 202 17 106 792 67 413Central AfricanRepublic
32 2 12 506 37 187 1590 117 586
Chile 50 9 205 606 106 2503 1562 272 6456China 0 0 0 0 0 0 0 0 0Colombia 30 4 47 567 72 874 2158 275 3330Congo 38 5 33 484 67 425 1282 177 1125Costa Rica 20 3 43 301 43 659 920 132 2009Cote d'Ivore 9 1 5 48 4 27 48 4 27Cuba 0 0 0 0 0 0 0 0 0Democratic Republic ofCongo
3 0 2 56 8 33 223 33 131
Ecuador 18 2 18 345 34 330 797 78 764El Salvador 3 0 2 7 0 4 7 0 4Equatorial Guinea 27 3 21 333 34 257 859 88 663Fiji 5 0 3 61 2 32 156 6 83French Guyana 0 0 0 0 0 0 0 0 0Gabon 25 2 47 303 27 580 781 70 1495Gambia 0 0 0 0 0 0 0 0 0Ghana 3 0 1 49 3 15 53 3 16Guatemala 7 2 17 139 34 322 150 36 347Guinea 10 1 5 188 14 83 695 51 308Guinea Bissau 3 0 0 58 1 3 219 3 13Guyana 92 15 105 1245 205 1422 3451 568 3940Honduras 7 0 3 137 9 63 439 30 202India 0 0 0 0 0 0 0 0 0
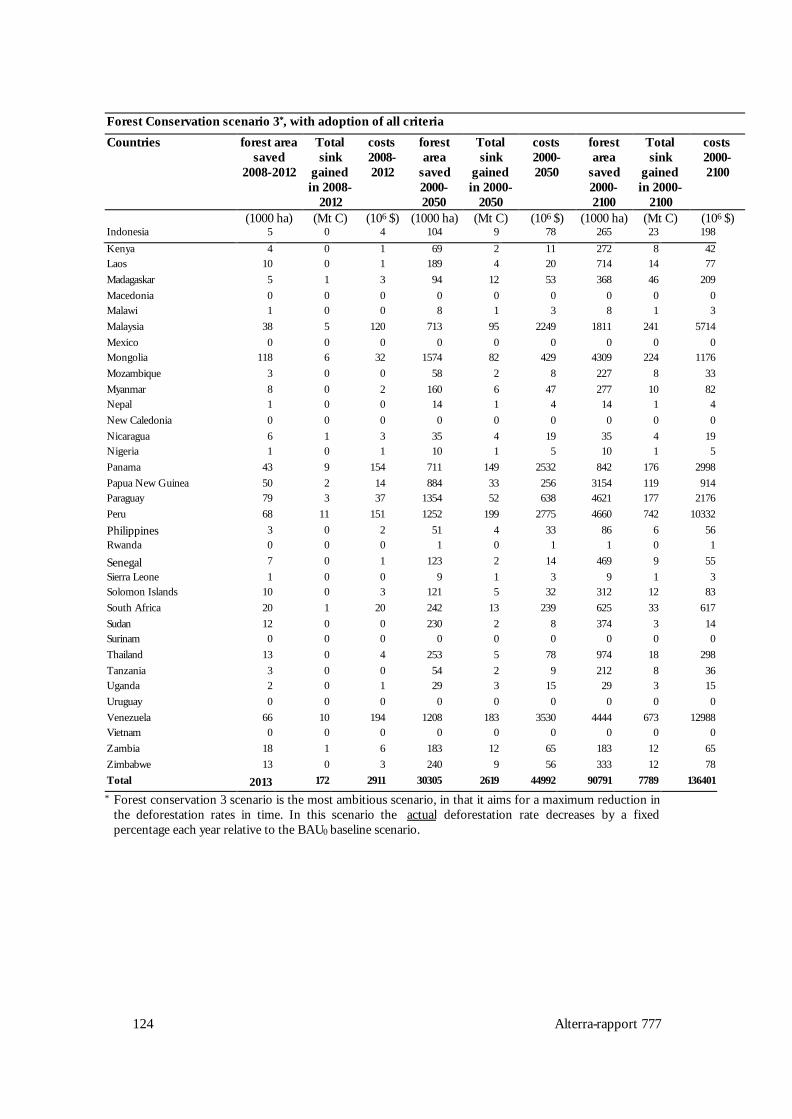
124 Alterra-rapport 777
Forest Conservation scenario 3*, with adoption of all criteria
Countries forest areasaved
2008-2012
Totalsink
gainedin 2008-
2012
costs2008-2012
forestarea
saved2000-2050
Totalsink
gainedin 2000-
2050
costs2000-2050
forestarea
saved2000-2100
Totalsink
gainedin 2000-
2100
costs2000-2100
(1000 ha) (Mt C) (106 $) (1000 ha) (Mt C) (106 $) (1000 ha) (Mt C) (106 $)Indonesia 5 0 4 104 9 78 265 23 198Kenya 4 0 1 69 2 11 272 8 42Laos 10 0 1 189 4 20 714 14 77Madagaskar 5 1 3 94 12 53 368 46 209Macedonia 0 0 0 0 0 0 0 0 0Malawi 1 0 0 8 1 3 8 1 3Malaysia 38 5 120 713 95 2249 1811 241 5714Mexico 0 0 0 0 0 0 0 0 0Mongolia 118 6 32 1574 82 429 4309 224 1176Mozambique 3 0 0 58 2 8 227 8 33Myanmar 8 0 2 160 6 47 277 10 82Nepal 1 0 0 14 1 4 14 1 4New Caledonia 0 0 0 0 0 0 0 0 0Nicaragua 6 1 3 35 4 19 35 4 19Nigeria 1 0 1 10 1 5 10 1 5Panama 43 9 154 711 149 2532 842 176 2998Papua New Guinea 50 2 14 884 33 256 3154 119 914Paraguay 79 3 37 1354 52 638 4621 177 2176Peru 68 11 151 1252 199 2775 4660 742 10332Philippines 3 0 2 51 4 33 86 6 56Rwanda 0 0 0 1 0 1 1 0 1
Senegal 7 0 1 123 2 14 469 9 55Sierra Leone 1 0 0 9 1 3 9 1 3Solomon Islands 10 0 3 121 5 32 312 12 83South Africa 20 1 20 242 13 239 625 33 617Sudan 12 0 0 230 2 8 374 3 14Surinam 0 0 0 0 0 0 0 0 0Thailand 13 0 4 253 5 78 974 18 298Tanzania 3 0 0 54 2 9 212 8 36Uganda 2 0 1 29 3 15 29 3 15Uruguay 0 0 0 0 0 0 0 0 0Venezuela 66 10 194 1208 183 3530 4444 673 12988Vietnam 0 0 0 0 0 0 0 0 0Zambia 18 1 6 183 12 65 183 12 65Zimbabwe 13 0 3 240 9 56 333 12 78Total 2013 172 2911 30305 2619 44992 90791 7789 136401* Forest conservation 3 scenario is the most ambitious scenario, in that it aims for a maximum reduction in
the deforestation rates in time. In this scenario the actual deforestation rate decreases by a fixedpercentage each year relative to the BAU0 baseline scenario.

Alterra-rapport 777 125
Table 56. Potential area, carbon sequestration and costs for forest conservation scenario 4, without adoption of criteria, a25% precision level and with banking from 2002 onwardsForest Conservation scenario 4*, without adoption of criteria
Countries forest areasaved
2008-2012
Totalsink
gainedin 2008-
2012
costs2008-2012
forestarea
saved2000-2050
Totalsink
gainedin 2000-
2050
costs2000-2050
forestarea
saved2000-2100
Totalsink
gainedin 2000-
2100
costs2000-2100
(1000 ha) (Mt C) (106 $) (1000 ha) (Mt C) (106 $) (1000 ha) (Mt C) (106 $)C. America/Caribbean 87 14 57 157 25 102 170 26 105Africa Developing 302 17 58 622 35 105 755 43 125Asia Developing 111 8 32 296 22 103 404 30 142Oceania Developing 39 1 4 96 4 11 114 4 13South America 570 58 295 1442 162 813 2000 238 1200Total (excl.Macedonia)*
1109 98 447 2613 248 1134 3443 341 1585
Angola 50 2 6 112 4 13 123 4 14Argentina 186 8 77 283 12 117 285 13 117Bangladesh 0 0 0 0 0 0 0 0 0Belize 33 5 19 36 5 21 36 5 21Benin 3 0 1 10 1 3 10 1 3Bhutan 0 0 0 0 0 0 0 0 0Bolivia 46 5 16 126 15 43 154 18 52Botswana 108 4 21 118 5 23 118 5 23Brazil 98 13 78 413 56 327 751 102 596Burundi 0 0 0 0 0 0 0 0 0Cambodia 2 0 0 9 0 1 17 1 2Cameroon 8 1 2 34 3 8 63 5 14Central AfricanRepublic
18 1 3 30 2 5 30 2 5
Chile 18 3 18 20 3 20 20 3 20China 0 0 0 0 0 0 0 0 0Colombia 22 3 10 82 10 39 129 16 61Congo 15 2 5 17 2 6 17 2 6Costa Rica 11 2 6 16 2 10 16 2 10Cote d'Ivore 7 1 2 16 1 4 16 1 4Cuba 0 0 0 0 0 0 0 0 0Democratic Republic ofCongo
2 0 1 10 1 3 20 3 7
Ecuador 14 1 4 52 5 17 71 7 23El Salvador 2 0 0 3 0 1 3 0 1Equatorial Guinea 10 1 3 11 1 3 11 1 3Fiji 2 0 0 2 0 0 2 0 0French Guyana 0 0 0 0 0 0 0 0 0Gabon 9 1 4 10 1 5 10 1 5Gambia 0 0 0 0 0 0 0 0 0Ghana 2 0 0 9 0 1 9 1 1Guatemala 5 1 4 21 5 16 21 5 17Guinea 7 1 1 23 2 4 31 2 6Guinea Bissau 2 0 0 9 0 0 14 0 0Guyana 40 7 18 49 8 22 49 8 22Honduras 5 0 1 21 1 4 32 2 6India 0 0 0 0 0 0 0 0 0

126 Alterra-rapport 777
Forest Conservation scenario 4*, without adoption of criteria
Countries forest areasaved
2008-2012
Totalsink
gainedin 2008-
2012
costs2008-2012
forestarea
saved2000-2050
Totalsink
gainedin 2000-
2050
costs2000-2050
forestarea
saved2000-2100
Totalsink
gainedin 2000-
2100
costs2000-2100
(1000 ha) (Mt C) (106 $) (1000 ha) (Mt C) (106 $) (1000 ha) (Mt C) (106 $)Indonesia 4 0 1 19 2 5 30 3 8Kenya 3 0 0 12 0 1 22 1 2Laos 7 0 0 26 1 1 40 1 2Madagaskar 4 0 1 16 2 5 30 4 9Macedonia 0 0 0 0 0 0 0 0 0Malawi 1 0 0 2 0 0 2 0 0Malaysia 28 4 22 103 14 80 143 19 111Mexico 0 0 0 0 0 0 0 0 0Mongolia 50 3 6 60 3 8 60 3 8Mozambique 2 0 0 10 0 1 18 1 1Myanmar 6 0 1 28 1 3 37 1 4Nepal 1 0 0 2 0 0 2 0 0New Caledonia 0 0 0 0 0 0 0 0 0Nicaragua 4 0 1 11 1 3 11 1 3Nigeria 1 0 0 3 0 1 3 0 1Panama 26 5 25 50 10 48 50 11 48Papua New Guinea 34 1 4 90 3 10 108 4 12Paraguay 50 2 7 112 4 16 122 5 17Peru 49 8 31 160 26 103 225 36 144Philippines 2 0 0 9 1 2 11 1 3Rwanda 0 0 0 1 0 0 1 0 0Senegal 5 0 0 18 0 1 29 1 1Sierra Leone 1 0 0 3 0 1 3 0 1Solomon Islands 4 0 0 4 0 0 4 0 0South Africa 7 0 2 8 0 2 8 0 2Sudan 9 0 0 41 0 1 52 0 1Surinam 0 0 0 0 0 0 0 0 0Thailand 10 0 1 39 1 3 64 1 5Tanzania 2 0 0 9 0 1 18 1 2Uganda 1 0 0 5 1 1 5 1 1Uruguay 0 0 0 0 0 0 0 0 0Venezuela 47 7 35 145 22 110 194 29 147Vietnam 0 0 0 0 0 0 0 0 0Zambia 14 1 2 45 3 7 45 3 7Zimbabwe 10 0 1 41 1 4 48 2 5Total 1109 98 447 2613 248 1134 3443 341 1585* In Forest conservation 4 scenario, the actual deforestation rate decreases by a fixed percentage each year,
but the baseline is redefined every year according to the results gained in the previous year.

Alterra-rapport 777 127
Table 57. Potential area, carbon sequestration and costs for forest conservation scenario 4, with adoption of criteria, a25% precision level and banking from 2002 onwardsForest Conservation scenario 4*, with adoption of all criteria
Countries forest areasaved
2008-2012
Totalsink
gainedin 2008-
2012
costs2008-2012
forestarea
saved2000-2050
Totalsink
gainedin 2000-
2050
costs2000-2050
forestarea
saved2000-2100
Totalsink
gainedin 2000-
2100
costs2000-2100
(1000 ha) (Mt C) (106 $) (1000 ha) (Mt C) (106 $) (1000 ha) (Mt C) (106 $)C. America/Caribbean 28 4 65 78 13 188 88 14 205Africa Developing 99 6 66 285 16 171 375 21 210Asia Developing 32 2 27 108 7 110 155 11 168Oceania Developing 11 0 3 38 1 11 62 2 18South America 154 15 309 555 56 1121 886 93 1835Total (excl.Macedonia)*
324 28 470 1065 94 1602 1566 141 2435
Angola 13 0 4 48 2 17 78 3 27Argentina 56 2 107 180 8 343 246 11 469Bangladesh 0 0 0 0 0 0 0 0 0Belize 14 2 28 29 4 60 29 4 60Benin 1 0 0 2 0 1 2 0 1Bhutan 0 0 0 0 0 0 0 0 0Bolivia 11 1 10 45 5 41 77 9 70Botswana 45 2 34 105 4 79 117 5 88Brazil 21 3 70 96 13 311 188 26 610Burundi 0 0 0 0 0 0 0 0 0Cambodia 0 0 0 2 0 0 4 0 1Cameroon 2 0 1 8 1 4 15 1 8Central AfricanRepublic
5 0 2 17 1 6 25 2 9
Chile 8 1 32 18 3 74 20 3 82China 0 0 0 0 0 0 0 0 0Colombia 5 1 8 22 3 34 41 5 63Congo 6 1 5 15 2 13 17 2 15Costa Rica 3 0 7 10 1 22 14 2 30Cote d'Ivore 2 0 1 4 0 2 4 0 2Cuba 0 0 0 0 0 0 0 0 0Democratic Republic ofCongo
0 0 0 2 0 1 4 1 3
Ecuador 3 0 3 13 1 13 20 2 19El Salvador 1 0 0 1 0 0 1 0 0Equatorial Guinea 4 0 3 10 1 8 11 1 8Fiji 1 0 0 2 0 1 2 0 1French Guyana 0 0 0 0 0 0 0 0 0Gabon 4 0 7 9 1 17 10 1 19Gambia 0 0 0 0 0 0 0 0 0Ghana 0 0 0 2 0 1 2 0 1Guatemala 1 0 3 5 1 12 6 1 13Guinea 2 0 1 7 1 3 13 1 6Guinea Bissau 1 0 0 2 0 0 4 0 0Guyana 15 2 17 39 6 45 47 8 54Honduras 1 0 1 5 0 2 9 1 4India 0 0 0 0 0 0 0 0 0

128 Alterra-rapport 777
Forest Conservation scenario 4*, with adoption of all criteria
Countries forest areasaved
2008-2012
Totalsink
gainedin 2008-
2012
costs2008-2012
forestarea
saved2000-2050
Totalsink
gainedin 2000-
2050
costs2000-2050
forestarea
saved2000-2100
Totalsink
gainedin 2000-
2100
costs2000-2100
(1000 ha) (Mt C) (106 $) (1000 ha) (Mt C) (106 $) (1000 ha) (Mt C) (106 $)Indonesia 1 0 1 4 0 3 7 1 5Kenya 1 0 0 3 0 0 5 0 1Laos 2 0 0 7 0 1 13 0 1Madagaskar 1 0 0 4 0 2 7 1 4Macedonia 0 0 0 0 0 0 0 0 0Malawi 0 0 0 0 0 0 0 0 0Malaysia 6 1 20 27 4 86 43 6 135Mexico 0 0 0 0 0 0 0 0 0Mongolia 19 1 5 49 3 13 58 3 16Mozambique 1 0 0 2 0 0 4 0 1Myanmar 1 0 0 6 0 2 8 0 2Nepal 0 0 0 1 0 0 1 0 0New Caledonia 0 0 0 0 0 0 0 0 0Nicaragua 1 0 1 2 0 1 2 0 1Nigeria 0 0 0 1 0 0 1 0 0Panama 7 1 25 25 5 90 27 6 96Papua New Guinea 8 0 2 33 1 10 56 2 16Paraguay 13 0 6 49 2 23 79 3 37Peru 11 2 25 48 8 105 87 14 192Philippines 0 0 0 2 0 1 3 0 2Rwanda 0 0 0 0 0 0 0 0 0Senegal 1 0 0 5 0 1 9 0 1Sierra Leone 0 0 0 1 0 0 1 0 0Solomon Islands 2 0 0 4 0 1 4 0 1South Africa 3 0 3 7 0 7 8 0 8Sudan 2 0 0 9 0 0 11 0 0Surinam 0 0 0 0 0 0 0 0 0Thailand 2 0 1 10 0 3 19 0 6Tanzania 0 0 0 2 0 0 4 0 1Uganda 0 0 0 1 0 1 1 0 1Uruguay 0 0 0 0 0 0 0 0 0Venezuela 11 2 32 46 7 133 82 12 239Vietnam 0 0 0 0 0 0 0 0 0Zambia 3 0 1 10 1 3 10 1 3Zimbabwe 2 0 0 9 0 2 11 0 3Total 324 28 470 1065 94 1602 1566 141 2435* In Forest conservation 4 scenario, the actual deforestation rate decreases by a fixed percentage each year,
but the baseline is redefined every year according to the results gained in the previous year.

Alterra-rapport 777 129
Table 58. Potential area, carbon sequestration and costs for forest conservation scenario 5, without adoption of criteria, a25% precision level and banking from 2002 onwardsForest Conservation scenario 5*, without adoption of criteria
Countries forest areasaved
2008-2012
Totalsink
gainedin 2008-
2012
costs2008-2012
forestarea
saved2000-2050
Totalsink
gainedin 2000-
2050
costs2000-2050
forestarea
saved2000-2100
Totalsink
gainedin 2000-
2100
costs2000-2100
(1000 ha) (Mt C) (106 $) (1000 ha) (Mt C) (106 $) (1000 ha) (Mt C) (106 $)C. America/Caribbean 270 43 178 496 80 322 533 83 331Africa Developing 944 54 185 1948 109 333 2347 134 394Asia Developing 336 23 93 911 68 315 1235 91 431Oceania Developing 116 4 13 298 11 33 353 13 39South America 1699 171 877 4441 498 2494 6123 725 3661Total (excl.Macedonia)*
3366 294 1346 8093 765 3497 10592 1046 4855
Angola 146 5 17 346 12 40 380 13 44Argentina 572 25 236 902 40 372 910 40 375Bangladesh 0 0 0 0 0 0 0 0 0Belize 111 15 64 124 17 72 124 17 72Benin 9 1 3 29 4 9 29 4 9Bhutan 0 0 0 0 0 0 0 0 0Bolivia 134 16 46 387 46 132 470 56 161Botswana 365 15 72 406 17 80 406 17 80Brazil 277 38 220 1241 169 984 2260 307 1792Burundi 0 0 0 0 0 0 0 0 0Cambodia 6 0 1 27 1 3 50 2 5Cameroon 23 2 5 103 9 23 190 16 42Central AfricanRepublic
55 4 10 93 7 16 95 7 17
Chile 62 11 63 69 12 70 69 12 70China 0 0 0 0 0 0 0 0 0Colombia 63 8 30 248 32 117 389 50 183Congo 50 7 18 58 8 21 58 8 21Costa Rica 32 5 20 51 7 31 51 7 31Cote d'Ivore 20 2 4 47 4 11 47 4 11Cuba 0 0 0 0 0 0 0 0 0Democratic Republic ofCongo
6 1 2 31 4 10 60 9 20
Ecuador 39 4 12 156 15 50 212 21 68El Salvador 6 0 1 9 0 2 9 0 2Equatorial Guinea 34 3 10 38 4 11 38 4 11Fiji 6 0 1 7 0 1 7 0 1French Guyana 0 0 0 0 0 0 0 0 0Gabon 31 3 15 34 3 17 34 3 17Gambia 0 0 0 0 0 0 0 0 0Ghana 5 0 1 26 1 4 26 1 4Guatemala 16 4 12 63 15 49 64 15 50Guinea 21 2 4 70 5 13 94 7 18Guinea Bissau 7 0 0 26 0 1 42 1 1Guyana 130 21 59 162 27 73 162 27 73Honduras 15 1 3 63 4 12 97 7 18India 0 0 0 0 0 0 0 0 0
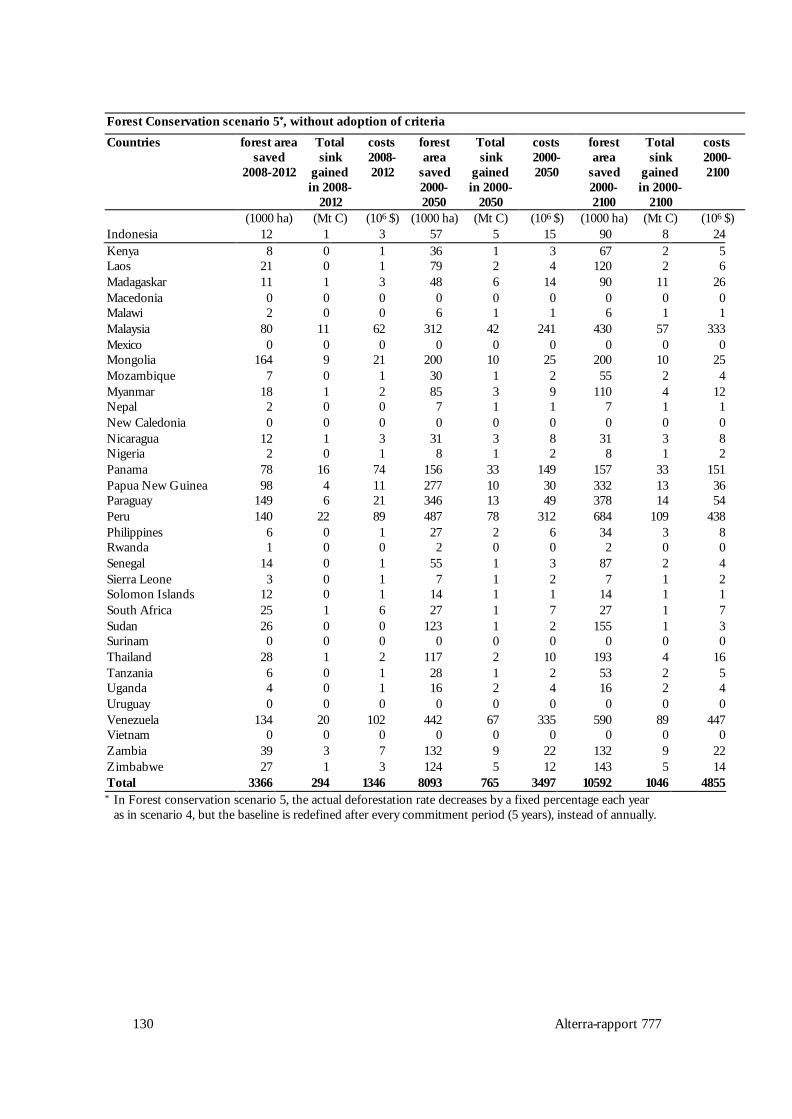
130 Alterra-rapport 777
Forest Conservation scenario 5*, without adoption of criteria
Countries forest areasaved
2008-2012
Totalsink
gainedin 2008-
2012
costs2008-2012
forestarea
saved2000-2050
Totalsink
gainedin 2000-
2050
costs2000-2050
forestarea
saved2000-2100
Totalsink
gainedin 2000-
2100
costs2000-2100
(1000 ha) (Mt C) (106 $) (1000 ha) (Mt C) (106 $) (1000 ha) (Mt C) (106 $)Indonesia 12 1 3 57 5 15 90 8 24Kenya 8 0 1 36 1 3 67 2 5Laos 21 0 1 79 2 4 120 2 6Madagaskar 11 1 3 48 6 14 90 11 26Macedonia 0 0 0 0 0 0 0 0 0Malawi 2 0 0 6 1 1 6 1 1Malaysia 80 11 62 312 42 241 430 57 333Mexico 0 0 0 0 0 0 0 0 0Mongolia 164 9 21 200 10 25 200 10 25Mozambique 7 0 1 30 1 2 55 2 4Myanmar 18 1 2 85 3 9 110 4 12Nepal 2 0 0 7 1 1 7 1 1New Caledonia 0 0 0 0 0 0 0 0 0Nicaragua 12 1 3 31 3 8 31 3 8Nigeria 2 0 1 8 1 2 8 1 2Panama 78 16 74 156 33 149 157 33 151Papua New Guinea 98 4 11 277 10 30 332 13 36Paraguay 149 6 21 346 13 49 378 14 54Peru 140 22 89 487 78 312 684 109 438Philippines 6 0 1 27 2 6 34 3 8Rwanda 1 0 0 2 0 0 2 0 0Senegal 14 0 1 55 1 3 87 2 4Sierra Leone 3 0 1 7 1 2 7 1 2Solomon Islands 12 0 1 14 1 1 14 1 1South Africa 25 1 6 27 1 7 27 1 7Sudan 26 0 0 123 1 2 155 1 3Surinam 0 0 0 0 0 0 0 0 0Thailand 28 1 2 117 2 10 193 4 16Tanzania 6 0 1 28 1 2 53 2 5Uganda 4 0 1 16 2 4 16 2 4Uruguay 0 0 0 0 0 0 0 0 0Venezuela 134 20 102 442 67 335 590 89 447Vietnam 0 0 0 0 0 0 0 0 0Zambia 39 3 7 132 9 22 132 9 22Zimbabwe 27 1 3 124 5 12 143 5 14Total 3366 294 1346 8093 765 3497 10592 1046 4855* In Forest conservation scenario 5, the actual deforestation rate decreases by a fixed percentage each year
as in scenario 4, but the baseline is redefined after every commitment period (5 years), instead of annually.

Alterra-rapport 777 131
Table 59. Potential area, carbon sequestration and costs for forest conservation scenario 5, with adoption of criteria, a25% precision level and banking from 2002 onwardsForest Conservation scenario 5*, with adoption of all criteria
Countries forest areasaved
2008-2012
Totalsink
gainedin 2008-
2012
costs2008-2012
forestarea
saved2000-2050
Totalsink
gainedin 2000-
2050
costs2000-2050
forestarea
saved2000-2100
Totalsink
gainedin 2000-
2100
costs2000-2100
(1000 ha) (Mt C) (106 $) (1000 ha) (Mt C) (106 $) (1000 ha) (Mt C) (106 $)C. America/Caribbean 81 13 187 237 38 571 265 42 620Africa Developing 287 16 192 868 48 523 1138 63 641Asia Developing 92 6 78 328 22 332 468 32 503Oceania Developing 30 1 9 115 4 35 188 7 56South America 442 44 884 1680 170 3391 2678 281 5540Total (excl.Macedonia)*
932 80 1350 3229 284 4852 4737 425 7359
Angola 36 1 13 146 5 50 235 8 81Argentina 162 7 308 548 24 1042 749 33 1426Bangladesh 0 0 0 0 0 0 0 0 0Belize 41 6 84 88 12 182 88 12 182Benin 2 0 1 7 1 4 7 1 4Bhutan 0 0 0 0 0 0 0 0 0Bolivia 32 4 29 135 16 122 233 28 211Botswana 133 5 101 324 13 245 360 15 272Brazil 61 8 196 288 39 935 564 77 1831Burundi 0 0 0 0 0 0 0 0 0Cambodia 1 0 0 6 0 1 12 1 3Cameroon 5 0 3 24 2 12 46 4 24Central AfricanRepublic
15 1 6 53 4 19 75 6 28
Chile 23 4 93 55 10 227 61 11 252China 0 0 0 0 0 0 0 0 0Colombia 14 2 22 65 8 101 123 16 190Congo 17 2 15 45 6 39 51 7 45Costa Rica 9 1 20 31 4 68 42 6 92Cote d'Ivore 4 0 2 10 1 6 10 1 6Cuba 0 0 0 0 0 0 0 0 0Democratic Republic ofCongo
1 0 1 7 1 4 13 2 8
Ecuador 9 1 8 40 4 38 59 6 57El Salvador 1 0 1 2 0 1 2 0 1Equatorial Guinea 12 1 10 30 3 23 34 3 26Fiji 2 0 1 5 0 3 6 0 3French Guyana 0 0 0 0 0 0 0 0 0Gabon 11 1 22 27 2 53 31 3 58Gambia 0 0 0 0 0 0 0 0 0Ghana 1 0 0 6 0 2 6 0 2Guatemala 3 1 8 16 4 37 16 4 38Guinea 5 0 2 21 2 9 39 3 17Guinea Bissau 1 0 0 7 0 0 13 0 1Guyana 42 7 48 120 20 137 144 24 164Honduras 3 0 2 16 1 7 28 2 13India 0 0 0 0 0 0 0 0 0

132 Alterra-rapport 777
Forest Conservation scenario 5*, with adoption of all criteria
Countries forest areasaved
2008-2012
Totalsink
gainedin 2008-
2012
costs2008-2012
forestarea
saved2000-2050
Totalsink
gainedin 2000-
2050
costs2000-2050
forestarea
saved2000-2100
Totalsink
gainedin 2000-
2100
costs2000-2100
(1000 ha) (Mt C) (106 $) (1000 ha) (Mt C) (106 $) (1000 ha) (Mt C) (106 $)Indonesia 3 0 2 12 1 9 20 2 15Kenya 2 0 0 8 0 1 16 0 2Laos 5 0 1 22 0 2 41 1 4Madagaskar 2 0 1 11 1 6 22 3 12Macedonia 0 0 0 0 0 0 0 0 0Malawi 0 0 0 1 0 1 1 0 1Malaysia 18 2 56 82 11 260 128 17 402Mexico 0 0 0 0 0 0 0 0 0Mongolia 54 3 15 150 8 41 178 9 48Mozambique 1 0 0 7 0 1 13 0 2Myanmar 4 0 1 19 1 6 25 1 7Nepal 0 0 0 2 0 1 2 0 1New Caledonia 0 0 0 0 0 0 0 0 0Nicaragua 3 0 1 7 1 4 7 1 4Nigeria 1 0 0 2 0 1 2 0 1Panama 20 4 72 76 16 271 81 17 290Papua New Guinea 23 1 7 99 4 29 169 6 49Paraguay 37 1 17 148 6 70 237 9 112Peru 32 5 71 143 23 317 261 42 578Philippines 1 0 1 6 0 4 8 1 5Rwanda 0 0 0 0 0 0 0 0 0Senegal 3 0 0 14 0 2 27 1 3Sierra Leone 1 0 0 2 0 1 2 0 1Solomon Islands 5 0 1 11 0 3 12 0 3South Africa 9 0 9 22 1 22 24 1 24Sudan 6 0 0 27 0 1 34 0 1Surinam 0 0 0 0 0 0 0 0 0Thailand 6 0 2 29 1 9 56 1 17Tanzania 1 0 0 6 0 1 12 0 2Uganda 1 0 0 4 0 2 4 0 2Uruguay 0 0 0 0 0 0 0 0 0Venezuela 31 5 91 137 21 401 246 37 719Vietnam 0 0 0 0 0 0 0 0 0Zambia 9 1 3 29 2 10 29 2 10Zimbabwe 6 0 1 28 1 7 33 1 8Total 932 80 1350 3229 284 4852 4737 425 7359* In Forest conservation scenario 5, the actual deforestation rate decreases by a fixed percentage each year
as in scenario 4, but the baseline is redefined after every commitment period (5 years), instead of annually.
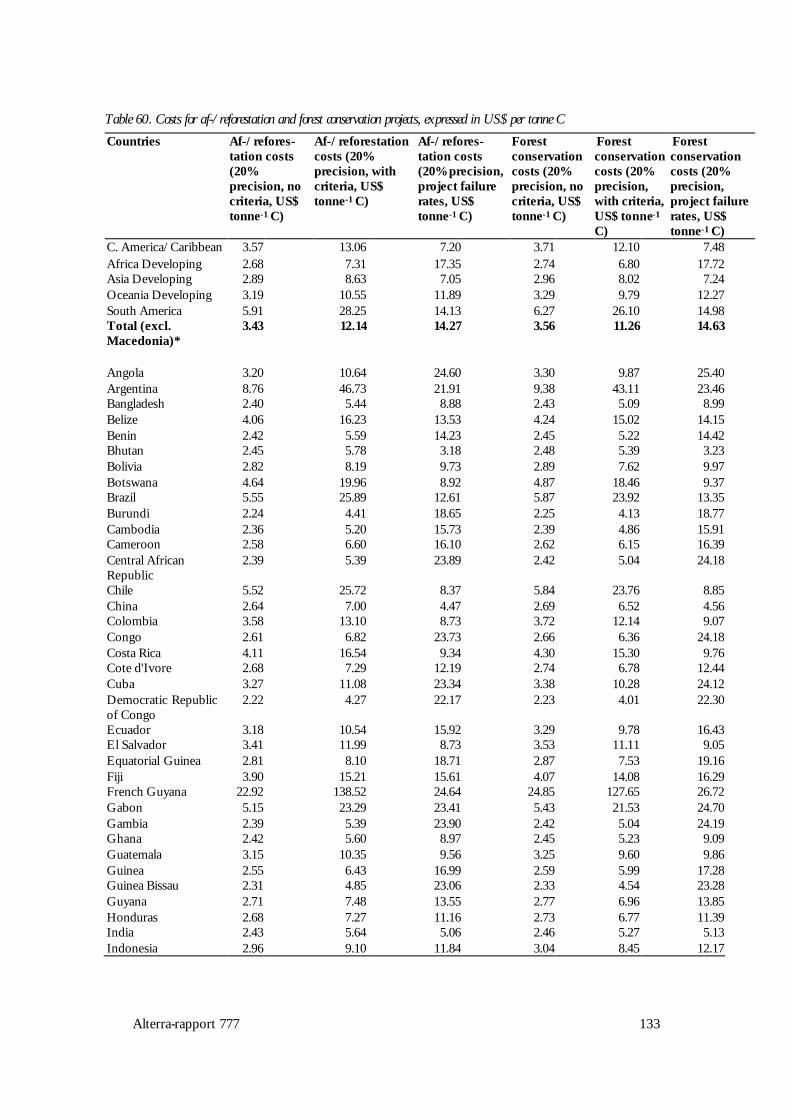
Alterra-rapport 777 133
Table 60. Costs for af-/reforestation and forest conservation projects, expressed in US$ per tonne CCountries Af-/refores-
tation costs(20%precision, nocriteria, US$tonne-1 C)
Af-/reforestationcosts (20%precision, withcriteria, US$tonne-1 C)
Af-/refores-tation costs(20% precision,project failurerates, US$tonne-1 C)
Forestconservationcosts (20%precision, nocriteria, US$tonne-1 C)
Forestconservationcosts (20%precision,with criteria,US$ tonne-1
C)
Forestconservationcosts (20%precision,project failurerates, US$tonne-1 C)
C. America/Caribbean 3.57 13.06 7.20 3.71 12.10 7.48Africa Developing 2.68 7.31 17.35 2.74 6.80 17.72Asia Developing 2.89 8.63 7.05 2.96 8.02 7.24Oceania Developing 3.19 10.55 11.89 3.29 9.79 12.27South America 5.91 28.25 14.13 6.27 26.10 14.98Total (excl.Macedonia)*
3.43 12.14 14.27 3.56 11.26 14.63
Angola 3.20 10.64 24.60 3.30 9.87 25.40Argentina 8.76 46.73 21.91 9.38 43.11 23.46Bangladesh 2.40 5.44 8.88 2.43 5.09 8.99Belize 4.06 16.23 13.53 4.24 15.02 14.15Benin 2.42 5.59 14.23 2.45 5.22 14.42Bhutan 2.45 5.78 3.18 2.48 5.39 3.23Bolivia 2.82 8.19 9.73 2.89 7.62 9.97Botswana 4.64 19.96 8.92 4.87 18.46 9.37Brazil 5.55 25.89 12.61 5.87 23.92 13.35Burundi 2.24 4.41 18.65 2.25 4.13 18.77Cambodia 2.36 5.20 15.73 2.39 4.86 15.91Cameroon 2.58 6.60 16.10 2.62 6.15 16.39Central AfricanRepublic
2.39 5.39 23.89 2.42 5.04 24.18
Chile 5.52 25.72 8.37 5.84 23.76 8.85China 2.64 7.00 4.47 2.69 6.52 4.56Colombia 3.58 13.10 8.73 3.72 12.14 9.07Congo 2.61 6.82 23.73 2.66 6.36 24.18Costa Rica 4.11 16.54 9.34 4.30 15.30 9.76Cote d'Ivore 2.68 7.29 12.19 2.74 6.78 12.44Cuba 3.27 11.08 23.34 3.38 10.28 24.12Democratic Republicof Congo
2.22 4.27 22.17 2.23 4.01 22.30
Ecuador 3.18 10.54 15.92 3.29 9.78 16.43El Salvador 3.41 11.99 8.73 3.53 11.11 9.05Equatorial Guinea 2.81 8.10 18.71 2.87 7.53 19.16Fiji 3.90 15.21 15.61 4.07 14.08 16.29French Guyana 22.92 138.52 24.64 24.85 127.65 26.72Gabon 5.15 23.29 23.41 5.43 21.53 24.70Gambia 2.39 5.39 23.90 2.42 5.04 24.19Ghana 2.42 5.60 8.97 2.45 5.23 9.09Guatemala 3.15 10.35 9.56 3.25 9.60 9.86Guinea 2.55 6.43 16.99 2.59 5.99 17.28Guinea Bissau 2.31 4.85 23.06 2.33 4.54 23.28Guyana 2.71 7.48 13.55 2.77 6.96 13.85Honduras 2.68 7.27 11.16 2.73 6.77 11.39India 2.43 5.64 5.06 2.46 5.27 5.13Indonesia 2.96 9.10 11.84 3.04 8.45 12.17
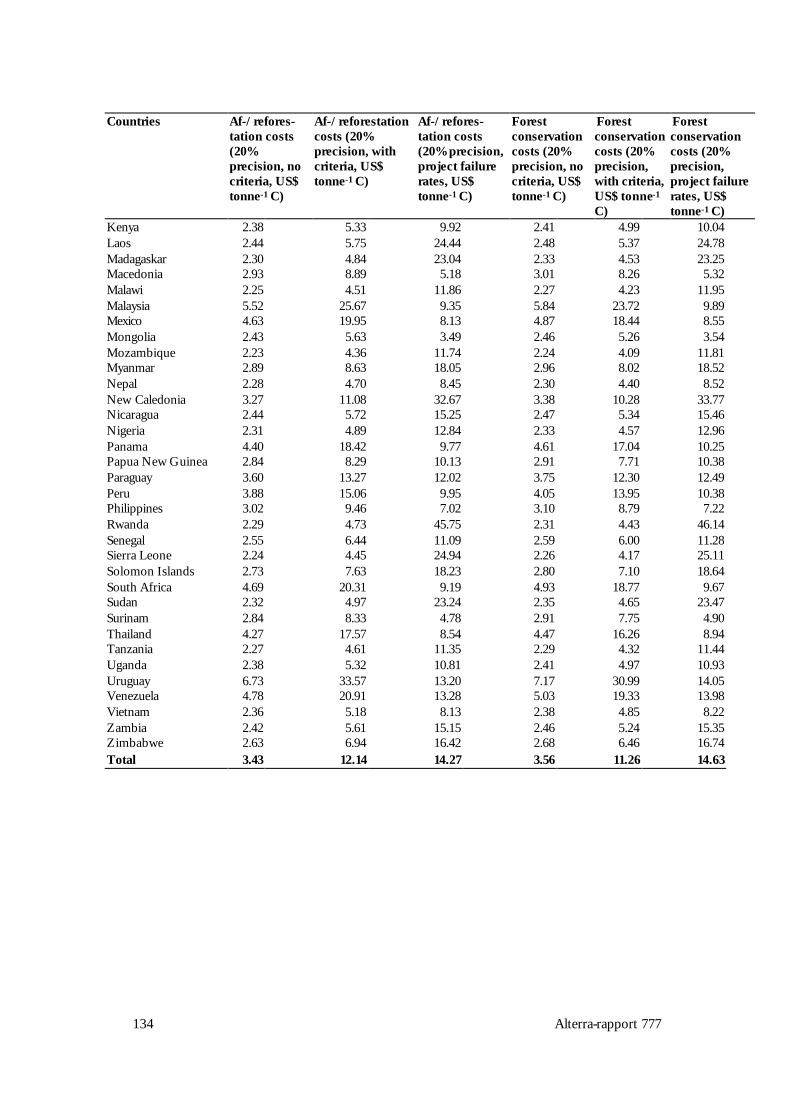
134 Alterra-rapport 777
Countries Af-/refores-tation costs(20%precision, nocriteria, US$tonne-1 C)
Af-/reforestationcosts (20%precision, withcriteria, US$tonne-1 C)
Af-/refores-tation costs(20% precision,project failurerates, US$tonne-1 C)
Forestconservationcosts (20%precision, nocriteria, US$tonne-1 C)
Forestconservationcosts (20%precision,with criteria,US$ tonne-1
C)
Forestconservationcosts (20%precision,project failurerates, US$tonne-1 C)
Kenya 2.38 5.33 9.92 2.41 4.99 10.04Laos 2.44 5.75 24.44 2.48 5.37 24.78Madagaskar 2.30 4.84 23.04 2.33 4.53 23.25Macedonia 2.93 8.89 5.18 3.01 8.26 5.32Malawi 2.25 4.51 11.86 2.27 4.23 11.95Malaysia 5.52 25.67 9.35 5.84 23.72 9.89Mexico 4.63 19.95 8.13 4.87 18.44 8.55Mongolia 2.43 5.63 3.49 2.46 5.26 3.54Mozambique 2.23 4.36 11.74 2.24 4.09 11.81Myanmar 2.89 8.63 18.05 2.96 8.02 18.52Nepal 2.28 4.70 8.45 2.30 4.40 8.52New Caledonia 3.27 11.08 32.67 3.38 10.28 33.77Nicaragua 2.44 5.72 15.25 2.47 5.34 15.46Nigeria 2.31 4.89 12.84 2.33 4.57 12.96Panama 4.40 18.42 9.77 4.61 17.04 10.25Papua New Guinea 2.84 8.29 10.13 2.91 7.71 10.38Paraguay 3.60 13.27 12.02 3.75 12.30 12.49Peru 3.88 15.06 9.95 4.05 13.95 10.38Philippines 3.02 9.46 7.02 3.10 8.79 7.22Rwanda 2.29 4.73 45.75 2.31 4.43 46.14Senegal 2.55 6.44 11.09 2.59 6.00 11.28Sierra Leone 2.24 4.45 24.94 2.26 4.17 25.11Solomon Islands 2.73 7.63 18.23 2.80 7.10 18.64South Africa 4.69 20.31 9.19 4.93 18.77 9.67Sudan 2.32 4.97 23.24 2.35 4.65 23.47Surinam 2.84 8.33 4.78 2.91 7.75 4.90Thailand 4.27 17.57 8.54 4.47 16.26 8.94Tanzania 2.27 4.61 11.35 2.29 4.32 11.44Uganda 2.38 5.32 10.81 2.41 4.97 10.93Uruguay 6.73 33.57 13.20 7.17 30.99 14.05Venezuela 4.78 20.91 13.28 5.03 19.33 13.98Vietnam 2.36 5.18 8.13 2.38 4.85 8.22Zambia 2.42 5.61 15.15 2.46 5.24 15.35Zimbabwe 2.63 6.94 16.42 2.68 6.46 16.74Total 3.43 12.14 14.27 3.56 11.26 14.63

Alterra-rapport 777 135
Figure 11. Carbon sequestration potentials for the different countries in the first commitment period, all criteria applied and banking from 2002 onwards.

136 Alterra-rapport 777
Figure 12. Carbon sequestration potentials for the different countries in the first commitment period, no riteria applied and banking from 2002 onwards.


![THE SEQUESTER - bipartisanpolicy.org · • Phil Gramm: “It was never the objective of [GRH] to trigger the sequester; the objective of [GRH] was to have the threat of the](https://img.pdfslide.us/doc/110x75/5c68952309d3f242168b9944/the-sequester-phil-gramm-it-was-never-the-objective-of-grh-to-trigger.jpg)


![Review of forestry potentials for Guam [typescript]](https://img.pdfslide.us/doc/110x75/568bda3a1a28ab2034aa0141/review-of-forestry-potentials-for-guam-typescript.jpg)
