Embed Size (px)
Citation preview
Copyright © 2014 Criteo
State of Mobile Commerce Q4 2014
Copyright © 2014 Criteo
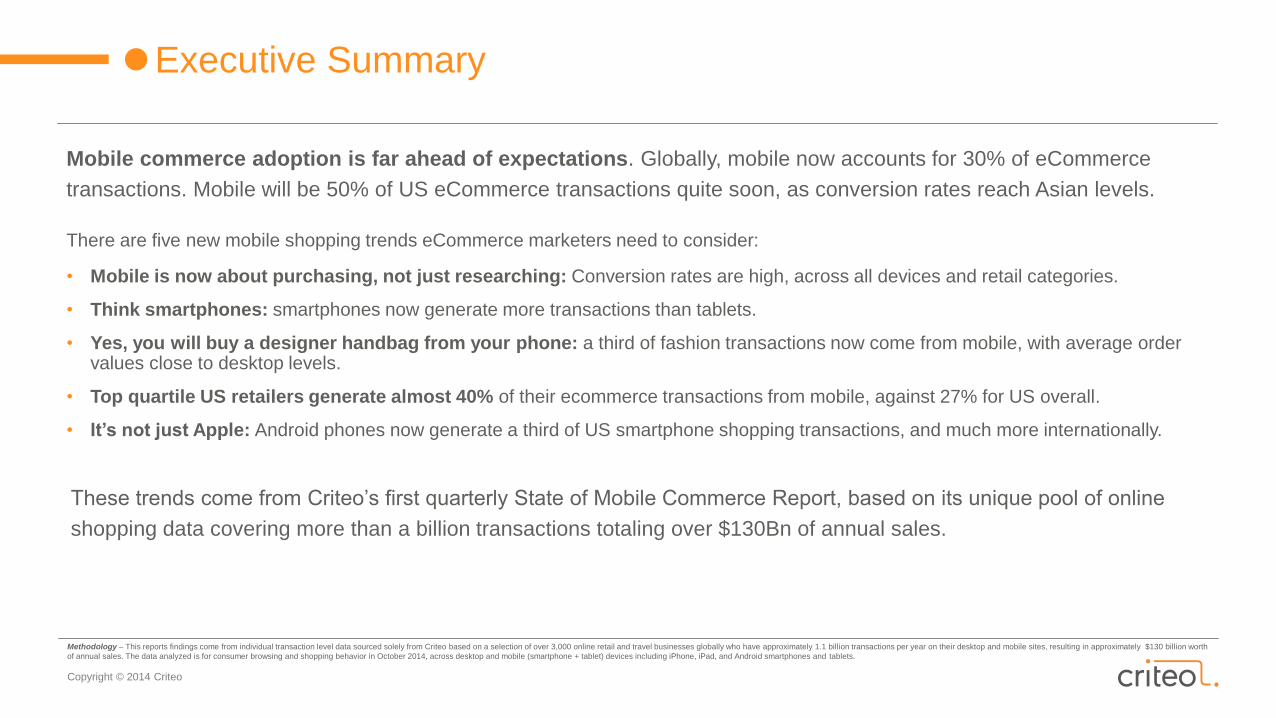
Executive Summary
Mobile commerce adoption is far ahead of expectations. Globally, mobile now accounts for 30% of eCommerce
transactions. Mobile will be 50% of US eCommerce transactions quite soon, as conversion rates reach Asian levels.
There are five new mobile shopping trends eCommerce marketers need to consider:
• Mobile is now about purchasing, not just researching: Conversion rates are high, across all devices and retail categories.
• Think smartphones: smartphones now generate more transactions than tablets.
• Yes, you will buy a designer handbag from your phone: a third of fashion transactions now come from mobile, with average order values close to desktop levels.
• Top quartile US retailers generate almost 40% of their ecommerce transactions from mobile, against 27% for US overall.
• It’s not just Apple: Android phones now generate a third of US smartphone shopping transactions, and much more internationally.
Methodology – This reports findings come from individual transaction level data sourced solely from Criteo based on a selection of over 3,000 online retail and travel businesses globally who have approximately 1.1 billion transactions per year on their desktop and mobile sites, resulting in approximately $130 billion worth
of annual sales. The data analyzed is for consumer browsing and shopping behavior in October 2014, across desktop and mobile (smartphone + tablet) devices including iPhone, iPad, and Android smartphones and tablets.
These trends come from Criteo’s first quarterly State of Mobile Commerce Report, based on its unique pool of online
shopping data covering more than a billion transactions totaling over $130Bn of annual sales.

Copyright © 2014 Criteo
The 5 New US
Mobile Shopping
Trends
Copyright © 2014 Criteo

Copyright © 2014 Criteo
#1Mobile is now about purchasing, not just
researching.
Copyright © 2014 Criteo
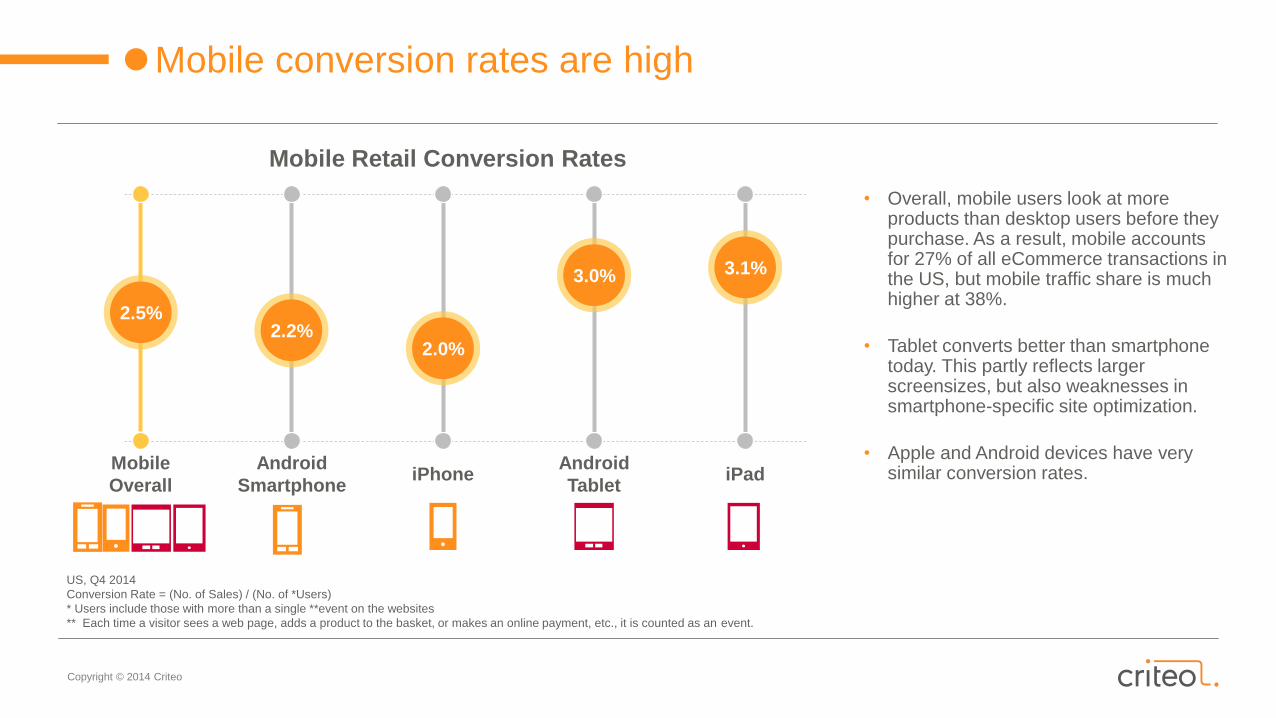
Mobile conversion rates are high
US, Q4 2014
Conversion Rate = (No. of Sales) / (No. of *Users)
* Users include those with more than a single **event on the websites
** Each time a visitor sees a web page, adds a product to the basket, or makes an online payment, etc., it is counted as an event.
Mobile
Overall
• Overall, mobile users look at more products than desktop users before they purchase. As a result, mobile accounts for 27% of all eCommerce transactions in the US, but mobile traffic share is much higher at 38%.
• Tablet converts better than smartphone today. This partly reflects larger screensizes, but also weaknesses in smartphone-specific site optimization.
• Apple and Android devices have very similar conversion rates.
Android
SmartphoneiPhone
Android
TabletiPad
Mobile Retail Conversion Rates
2.5%2.2%
2.0%
3.0% 3.1%
Copyright © 2014 Criteo
Shoppers are purchasing on mobiles across all categories
Travel
Mass
Merchants
Health &
Beauty
Home
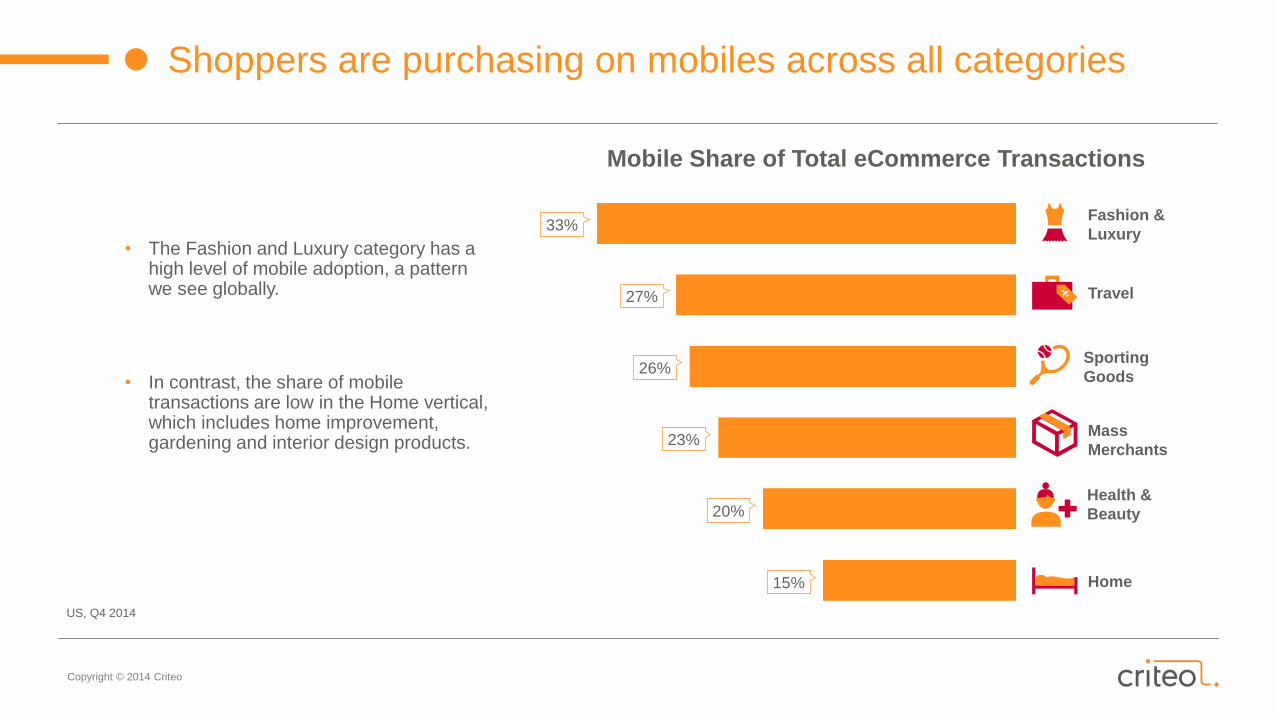
Mobile Share of Total eCommerce Transactions
Fashion &
Luxury
Sporting
Goods
33%
27%
26%
23%
20%
15%
US, Q4 2014
• The Fashion and Luxury category has a high level of mobile adoption, a pattern we see globally.
• In contrast, the share of mobile transactions are low in the Home vertical, which includes home improvement, gardening and interior design products.
Copyright © 2014 Criteo
#2Top quartile retailers
generate almost 40% of transactions
from mobile.
Copyright © 2014 Criteo
Significant opportunity to increase mobile sales by adopting best practices
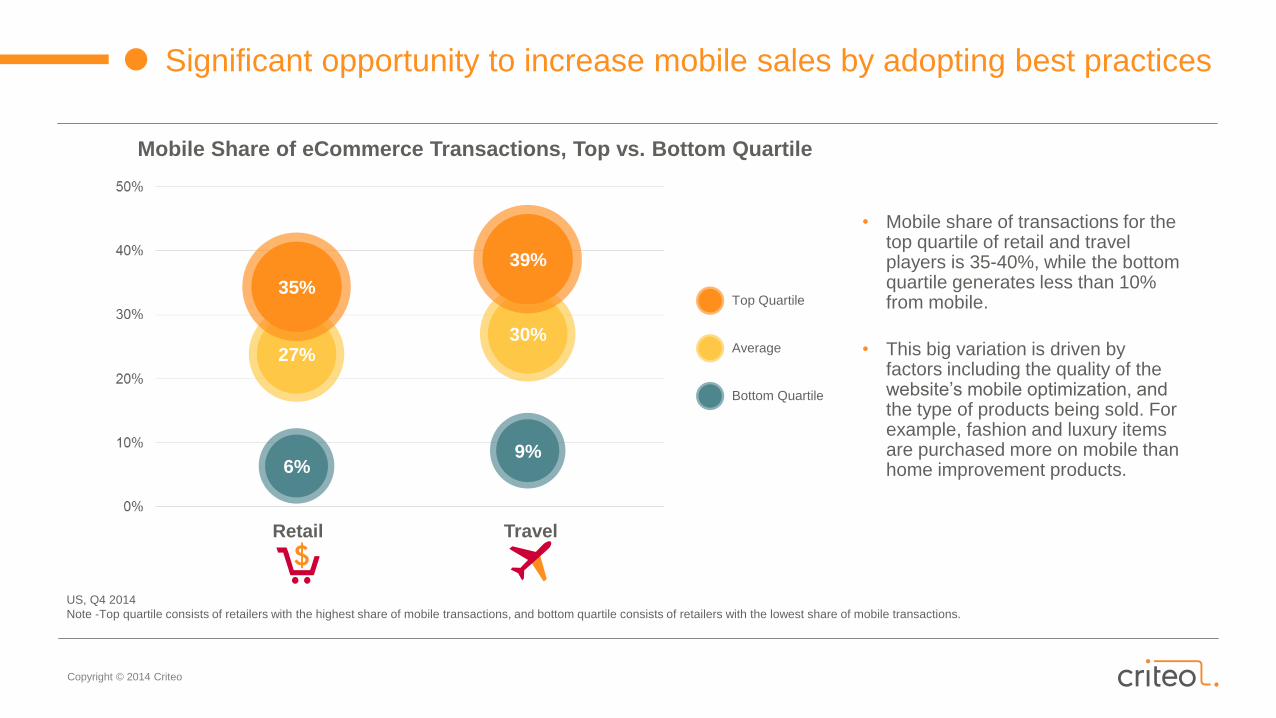
Mobile Share of eCommerce Transactions, Top vs. Bottom Quartile
30%27%
35%
9%6%
Travel
Top Quartile
Average
Bottom Quartile
Retail
39%
• Mobile share of transactions for the top quartile of retail and travel players is 35-40%, while the bottom quartile generates less than 10% from mobile.
• This big variation is driven by factors including the quality of the website’s mobile optimization, and the type of products being sold. For example, fashion and luxury items are purchased more on mobile than home improvement products.
US, Q4 2014
Note -Top quartile consists of retailers with the highest share of mobile transactions, and bottom quartile consists of retailers with the lowest share of mobile transactions.
Copyright © 2014 Criteo
#3Smartphones have
overtaken tablets in mobile transactions.
Copyright © 2014 Criteo
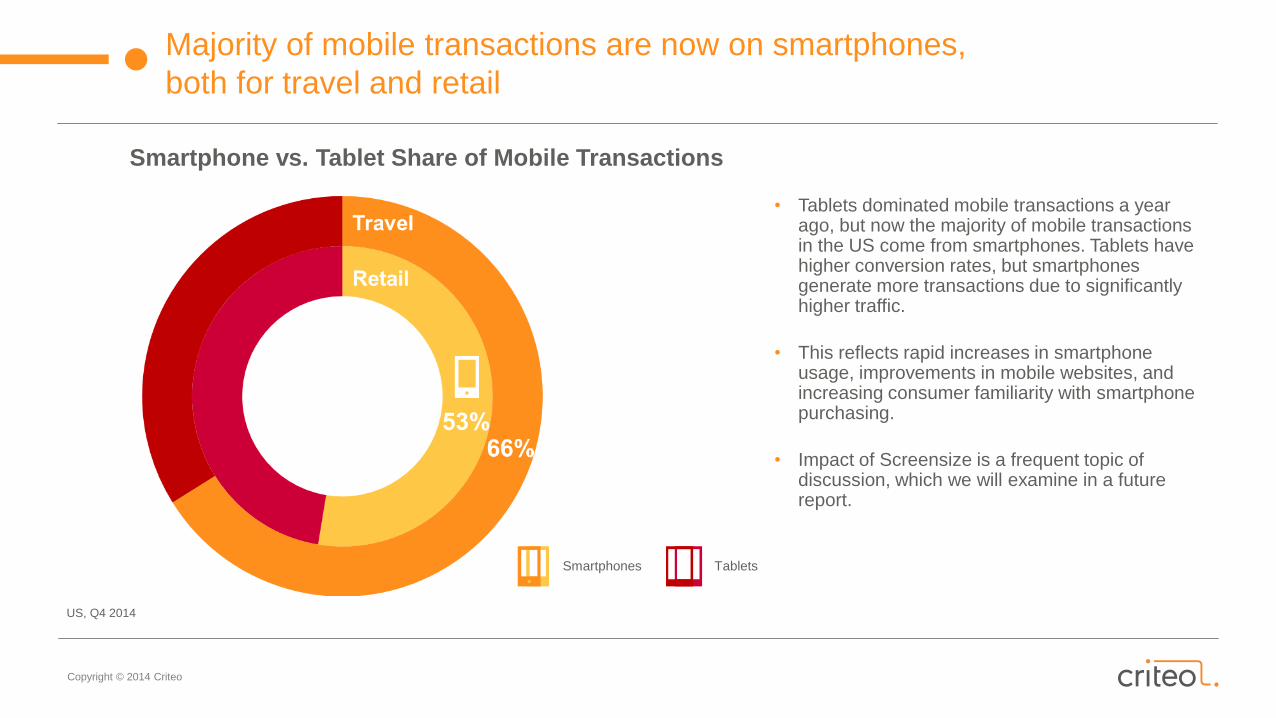
Smartphone vs. Tablet Share of Mobile Transactions
Majority of mobile transactions are now on smartphones,
both for travel and retail
• Tablets dominated mobile transactions a year ago, but now the majority of mobile transactions in the US come from smartphones. Tablets have higher conversion rates, but smartphones generate more transactions due to significantly higher traffic.
• This reflects rapid increases in smartphone usage, improvements in mobile websites, and increasing consumer familiarity with smartphone purchasing.
• Impact of Screensize is a frequent topic of discussion, which we will examine in a future report.
US, Q4 2014
Smartphones Tablets
Copyright © 2014 Criteo
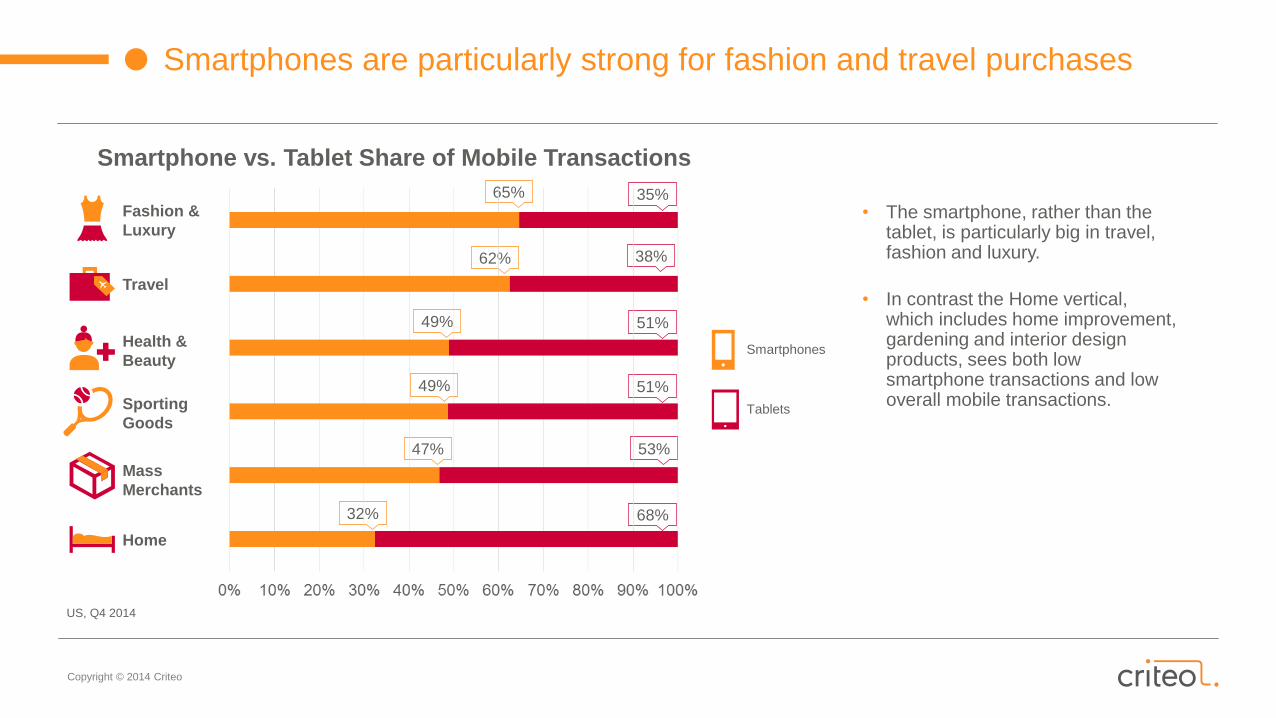
Smartphones are particularly strong for fashion and travel purchases
68%
53%
51%
51%
38%
35%
32%
47%
49%
49%
62%
65%
Smartphones
Tablets
• The smartphone, rather than the tablet, is particularly big in travel, fashion and luxury.
• In contrast the Home vertical, which includes home improvement, gardening and interior design products, sees both low smartphone transactions and low overall mobile transactions.
US, Q4 2014
Smartphone vs. Tablet Share of Mobile Transactions
Travel
Fashion &
Luxury
Mass
Merchants
Health &
Beauty
Sporting
Goods
Home
Copyright © 2014 Criteo
#4Mobile average order
value is reaching desktop levels.
Copyright © 2014 Criteo
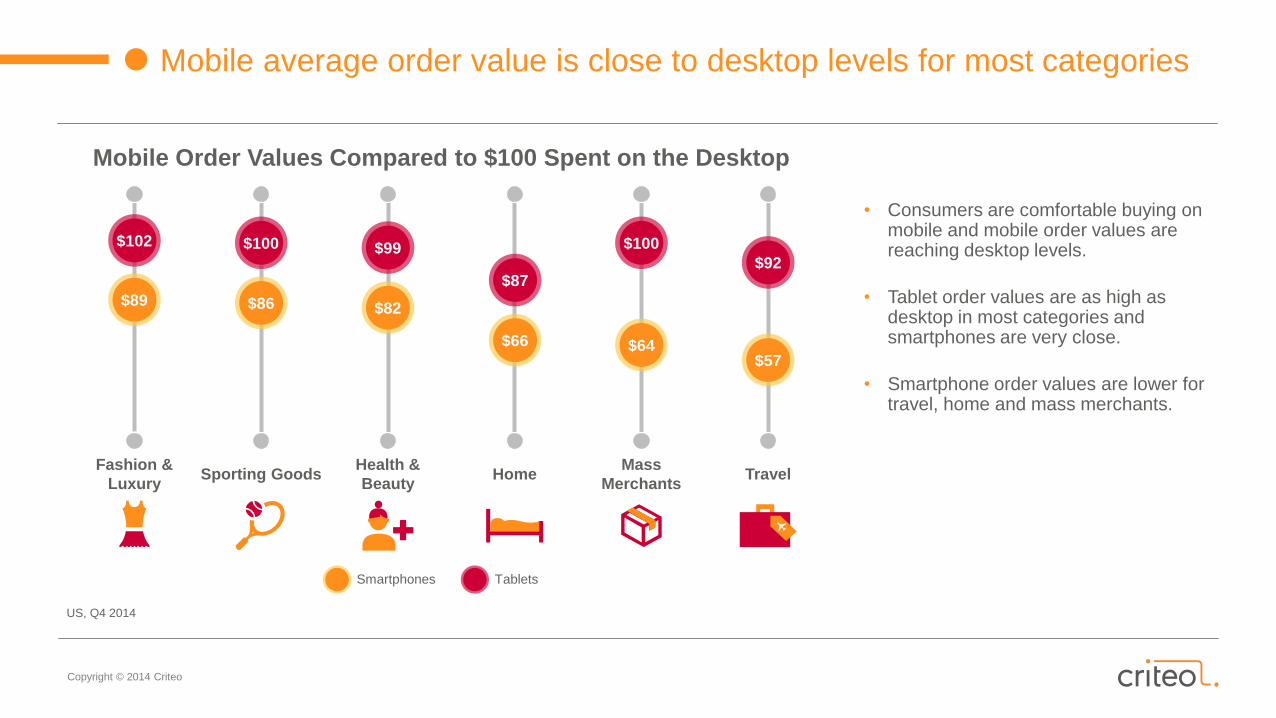
Mobile average order value is close to desktop levels for most categories
Mobile Order Values Compared to $100 Spent on the Desktop
• Consumers are comfortable buying on mobile and mobile order values are reaching desktop levels.
• Tablet order values are as high as desktop in most categories and smartphones are very close.
• Smartphone order values are lower for travel, home and mass merchants.
US, Q4 2014
Fashion &
LuxurySporting Goods
Health &
BeautyHome
Mass
MerchantsTravel
$87
$102 $100 $99 $100
$92
$89 $86 $82
$66 $64$57
TabletsSmartphones
Copyright © 2014 Criteo
#5It’s now importantto reach Android
shoppers.
Copyright © 2014 Criteo
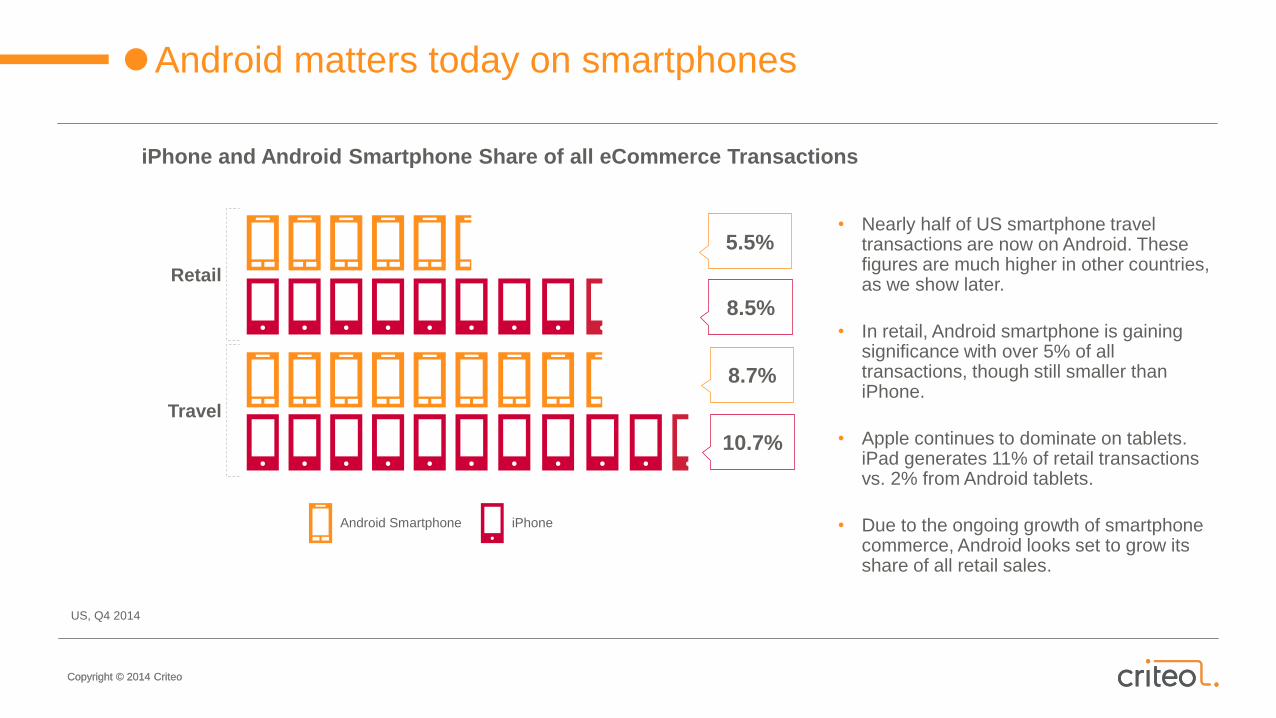
• Nearly half of US smartphone travel transactions are now on Android. These figures are much higher in other countries, as we show later.
• In retail, Android smartphone is gaining significance with over 5% of all transactions, though still smaller than iPhone.
• Apple continues to dominate on tablets. iPad generates 11% of retail transactions vs. 2% from Android tablets.
• Due to the ongoing growth of smartphone commerce, Android looks set to grow its share of all retail sales.
Android matters today on smartphones
iPhone and Android Smartphone Share of all eCommerce Transactions
US, Q4 2014
Copyright © 2014 Criteo
iPhoneAndroid Smartphone
8.7%
10.7%
5.5%
8.5%
Retail
Travel
Copyright © 2014 Criteo
Global
Mobile Commerce
Trends
Copyright © 2014 Criteo
Copyright © 2014 Criteo
49%
45%
41%
28%
27%
26%
24%
24%
21%
20%
10%
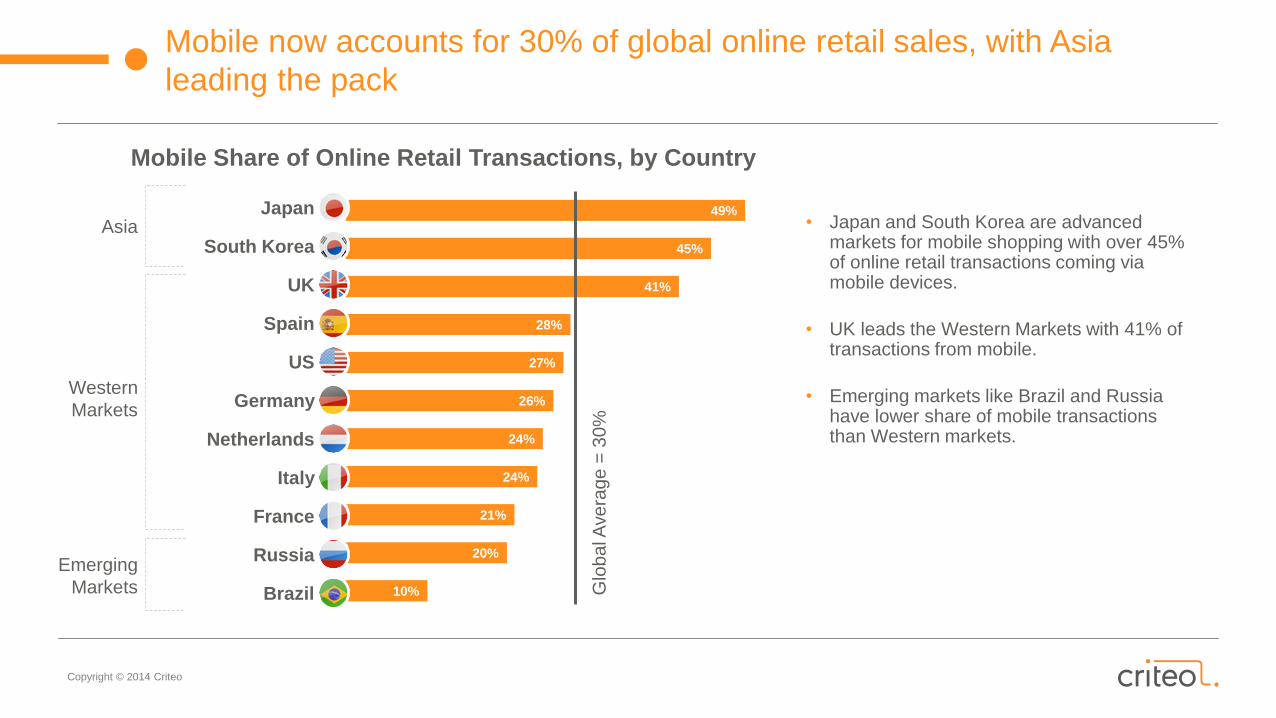
Mobile now accounts for 30% of global online retail sales, with Asia
leading the pack
Glo
ba
l Ave
rag
e =
30
%
Mobile Share of Online Retail Transactions, by Country
• Japan and South Korea are advanced markets for mobile shopping with over 45% of online retail transactions coming via mobile devices.
• UK leads the Western Markets with 41% of transactions from mobile.
• Emerging markets like Brazil and Russia have lower share of mobile transactions than Western markets.
Japan
South Korea
UK
Spain
US
Germany
Italy
Netherlands
France
Russia
Brazil
Asia
Western
Markets
Emerging
Markets
Copyright © 2014 Criteo
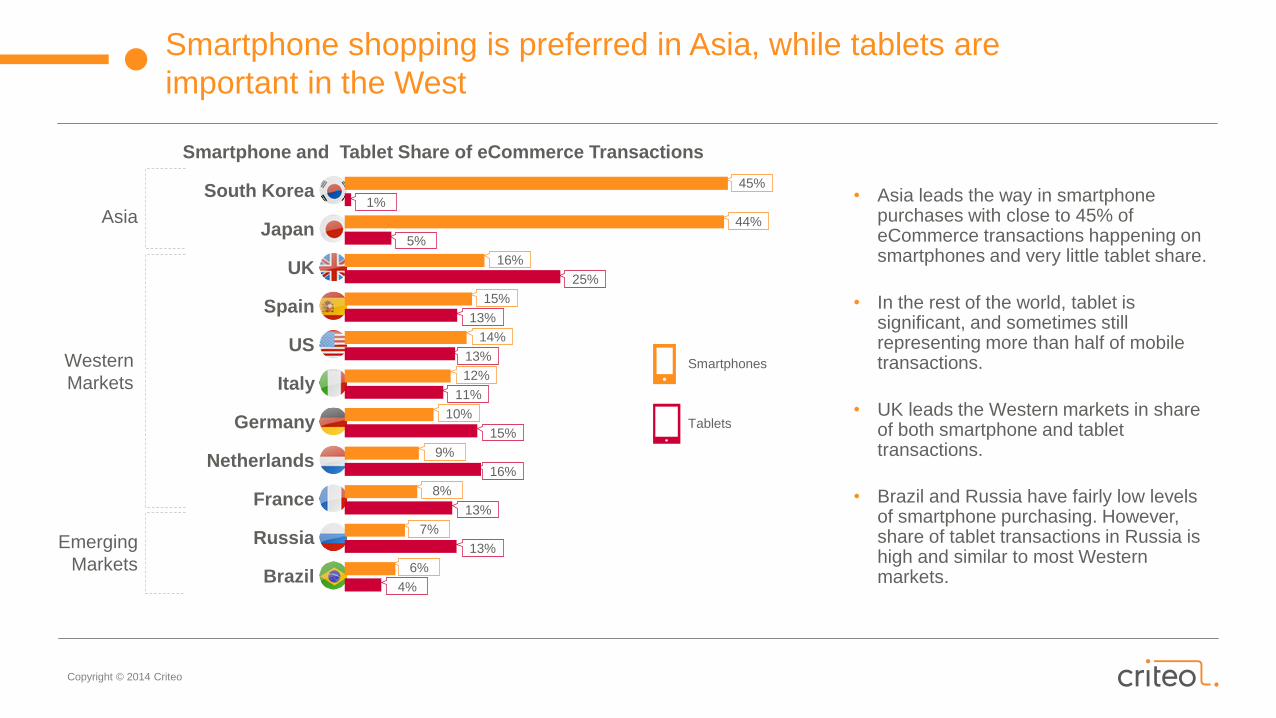
Smartphone shopping is preferred in Asia, while tablets are
important in the West
South Korea
Japan
UK
Spain
US
Italy
Germany
Netherlands
France
Russia
Brazil
Smartphone and Tablet Share of eCommerce Transactions
• Asia leads the way in smartphone purchases with close to 45% of eCommerce transactions happening on smartphones and very little tablet share.
• In the rest of the world, tablet issignificant, and sometimes still representing more than half of mobile transactions.
• UK leads the Western markets in share of both smartphone and tablet transactions.
• Brazil and Russia have fairly low levels of smartphone purchasing. However, share of tablet transactions in Russia is high and similar to most Western markets.
Smartphones
Tablets
45%
44%
16%
15%
14%
12%
10%
9%
8%
7%
6%
1%
5%
25%
13%
13%
11%
15%
16%
13%
13%
4%
Asia
Western
Markets
Emerging
Markets
Copyright © 2014 Criteo
59
68
68
70
100
107
123
136
161
202
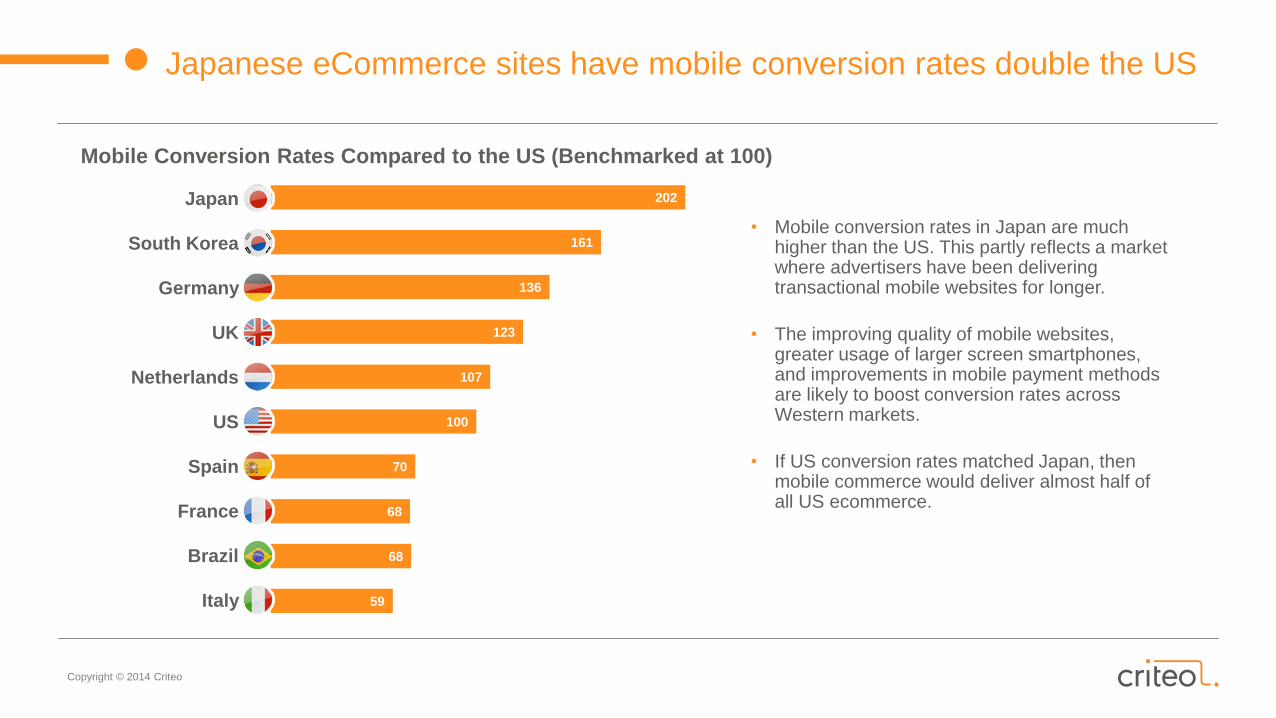
Japanese eCommerce sites have mobile conversion rates double the US
Mobile Conversion Rates Compared to the US (Benchmarked at 100)
Japan
South Korea
Germany
UK
Netherlands
US
Spain
France
Brazil
Italy
• Mobile conversion rates in Japan are much higher than the US. This partly reflects a market where advertisers have been delivering transactional mobile websites for longer.
• The improving quality of mobile websites, greater usage of larger screen smartphones, and improvements in mobile payment methods are likely to boost conversion rates across Western markets.
• If US conversion rates matched Japan, then mobile commerce would deliver almost half of all US ecommerce.
Copyright © 2014 Criteo
Retail
Travel
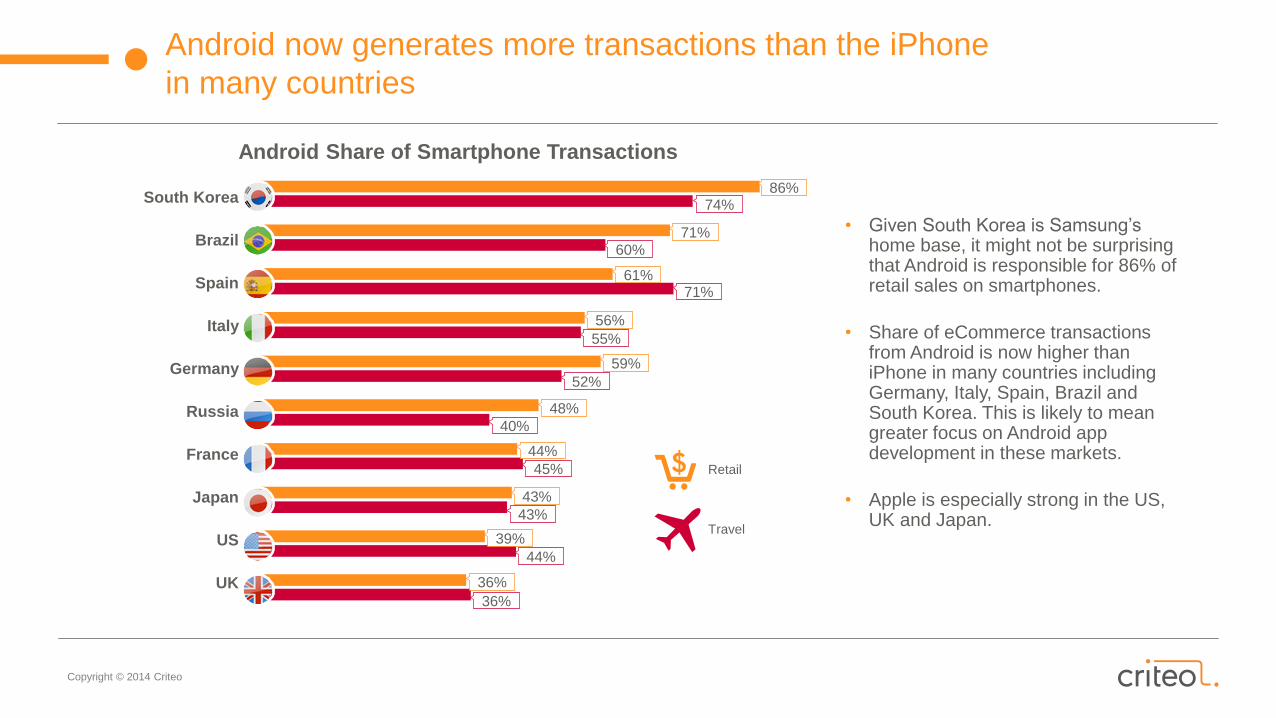
Android now generates more transactions than the iPhone
in many countries
South Korea
Brazil
Spain
Italy
Germany
Russia
France
Japan
US
UK
86%74%
71%
60%
61%71%
56%
55%
59%
52%
48%
40%
44%
45%
43%
43%
39%
44%
36%
36%
Android Share of Smartphone Transactions
• Given South Korea is Samsung’s home base, it might not be surprising that Android is responsible for 86% of retail sales on smartphones.
• Share of eCommerce transactions from Android is now higher than iPhone in many countries including Germany, Italy, Spain, Brazil and South Korea. This is likely to mean greater focus on Android app development in these markets.
• Apple is especially strong in the US,UK and Japan.

Copyright © 2014 Criteo
What
will the future
look like?
Copyright © 2014 Criteo
Copyright © 2014 Criteo
The future
We see five big trends for 2015:
• Growth in mobile commerce is unstoppable. Asia will soon pass 50% of online transactions via mobile devices, while Western markets will catch up.
• Smartphones will continue to displace slower-growing tablets. Larger form factor phones are an added accelerant to an existing trend towards greater use of smartphones for shopping.
• Advertisers will focus heavily on improving their mobile websites. This will lead to dramatic improvements in conversion rates, especially as mobile payments become more seamless.
• Apple and Android continue to battle it out but both are winners. Total percentage of ecommerce generated by both will grow at the expense of Microsoft Windows.
• Understanding cross-device behavior will be the biggest challenge and opportunity for marketers in 2015, as a majority of users going through their buying journey interact with the same site through multiple devices.

Copyright © 2014 Criteo
AboutCriteo
Criteo delivers personalized performance marketing at
an extensive scale. Measuring return on post-click
sales, Criteo makes ROI transparent and easy to
measure. Criteo has over 1,000 employees in 21
offices across the Americas, Europe and Asia-Pacific,
serving over 6,000 advertisers worldwide with direct
relationships with over 8,000 publishers.
Criteo ads reach 994 million unique Internet users
(comScore, September 2014).
For more information, please visit
http://www.criteo.com.
This and future Mobile Commerce reports can be
found at www.criteo.com/resources/mobile-commerce

Copyright © 2014 Criteo
Appendix:
Country Specific Data
Copyright © 2014 Criteo
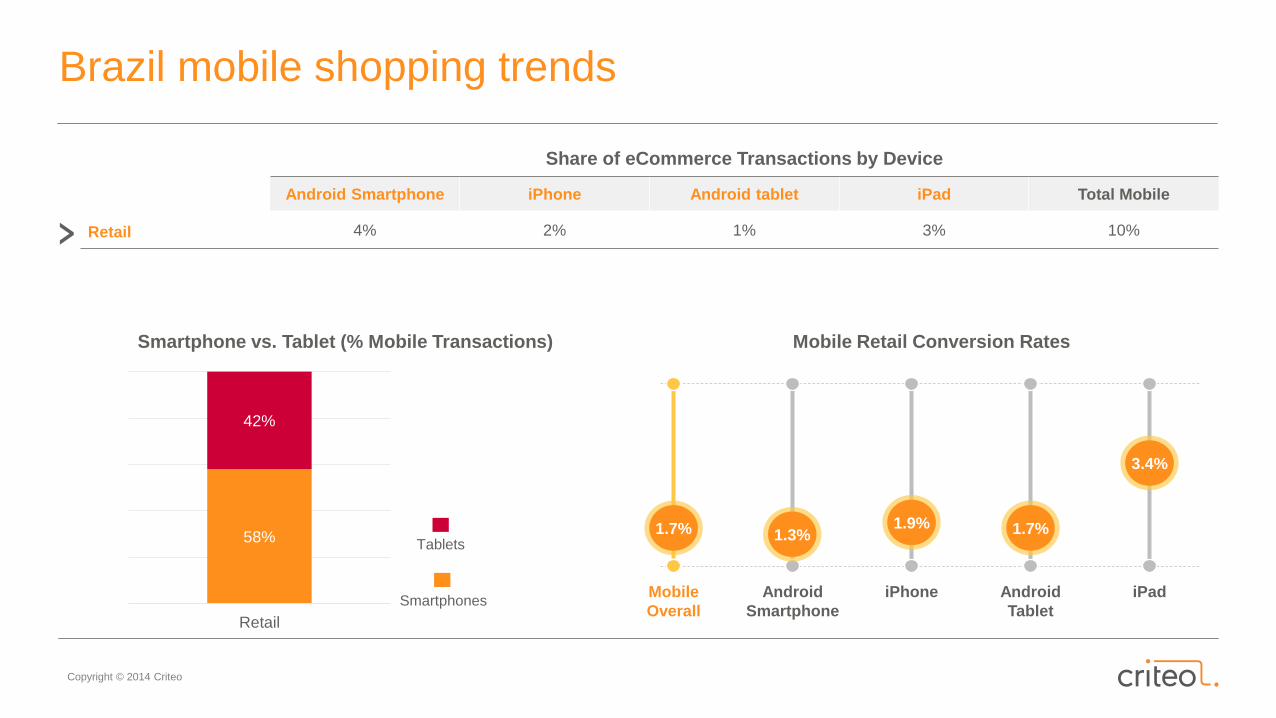
Brazil mobile shopping trends
Smartphone vs. Tablet (% Mobile Transactions)
Share of eCommerce Transactions by Device
Android Smartphone iPhone Android tablet iPad Total Mobile
Retail 4% 2% 1% 3% 10%
Smartphones
Tablets
Mobile Retail Conversion Rates
Mobile
Overall
Android
Smartphone
iPhone Android
Tablet
iPad
1.7% 1.3%1.9% 1.7%
3.4%
58%
42%
Retail
Copyright © 2014 Criteo
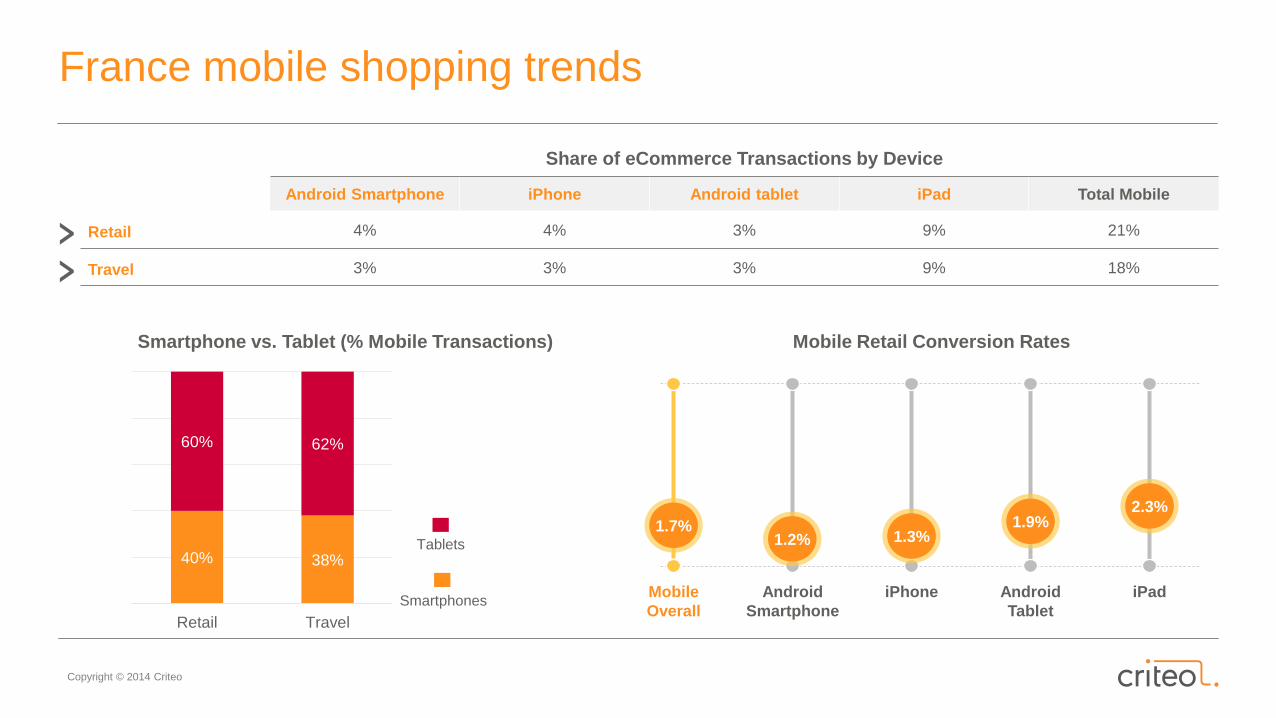
France mobile shopping trends
Mobile Retail Conversion Rates
Mobile
Overall
Android
Smartphone
iPhone Android
Tablet
iPad
1.7%1.2% 1.3%
1.9%2.3%
Smartphone vs. Tablet (% Mobile Transactions)
Share of eCommerce Transactions by Device
Android Smartphone iPhone Android tablet iPad Total Mobile
Retail 4% 4% 3% 9% 21%
Travel 3% 3% 3% 9% 18%
Smartphones
Tablets40% 38%
60% 62%
Retail Travel
Copyright © 2014 Criteo
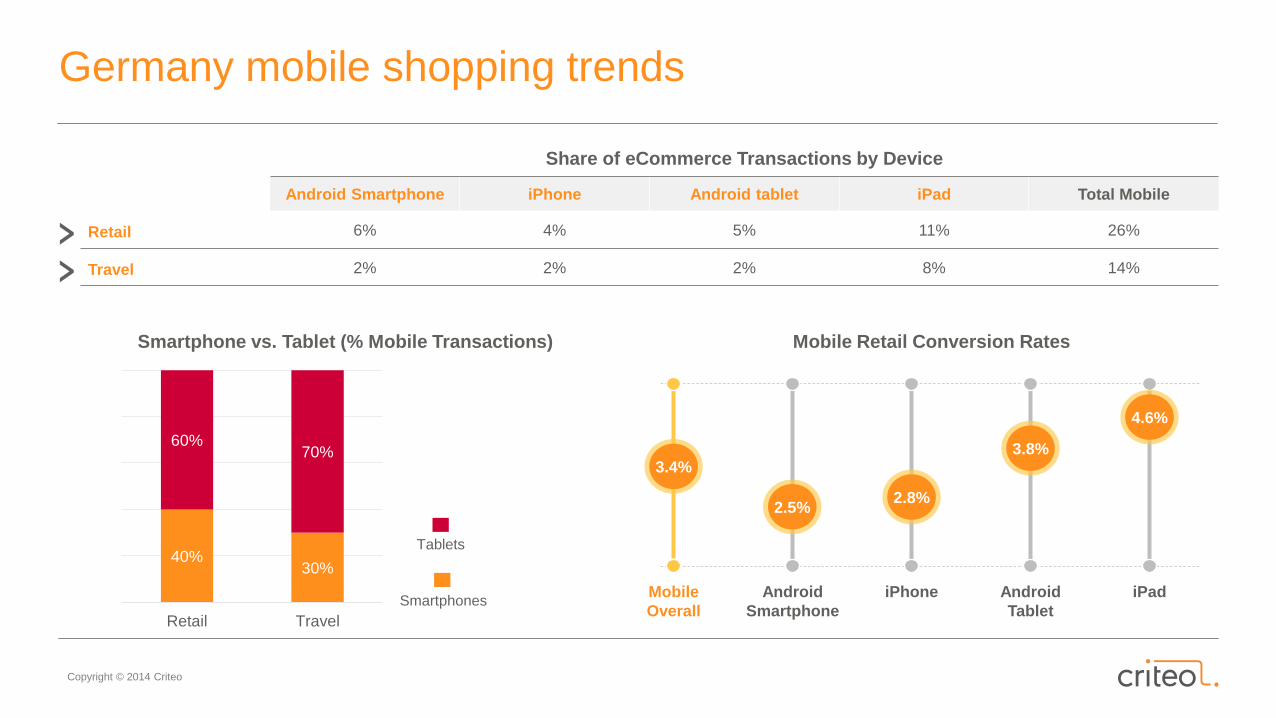
Germany mobile shopping trends
Mobile Retail Conversion Rates
Mobile
Overall
Android
Smartphone
iPhone Android
Tablet
iPad
3.4%
2.5%2.8%
3.8%
4.6%
Smartphone vs. Tablet (% Mobile Transactions)
Share of eCommerce Transactions by Device
Android Smartphone iPhone Android tablet iPad Total Mobile
Retail 6% 4% 5% 11% 26%
Travel 2% 2% 2% 8% 14%
Smartphones
Tablets40%
30%
60%70%
Retail Travel
Copyright © 2014 Criteo
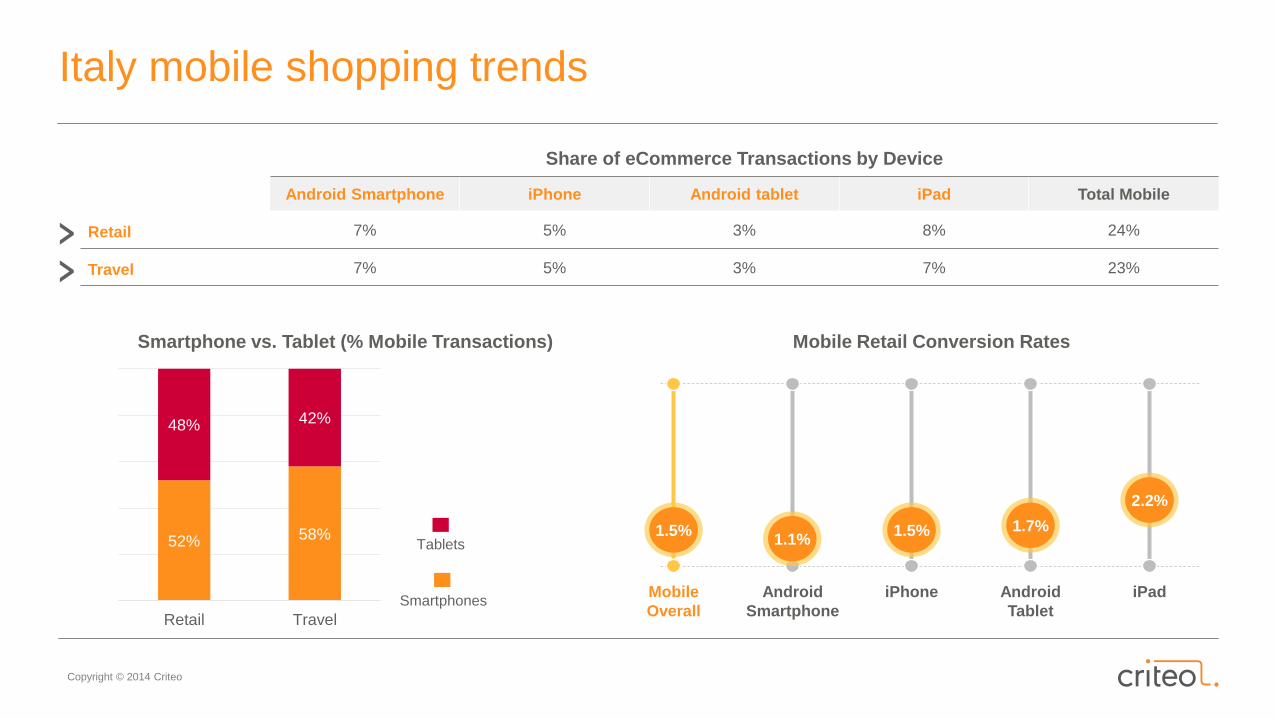
Italy mobile shopping trends
Mobile Retail Conversion Rates
Mobile
Overall
Android
Smartphone
iPhone Android
Tablet
iPad
1.5%1.1%
1.5% 1.7%
2.2%
Smartphone vs. Tablet (% Mobile Transactions)
Share of eCommerce Transactions by Device
Android Smartphone iPhone Android tablet iPad Total Mobile
Retail 7% 5% 3% 8% 24%
Travel 7% 5% 3% 7% 23%
Smartphones
Tablets52% 58%
48% 42%
Retail Travel
Copyright © 2014 Criteo
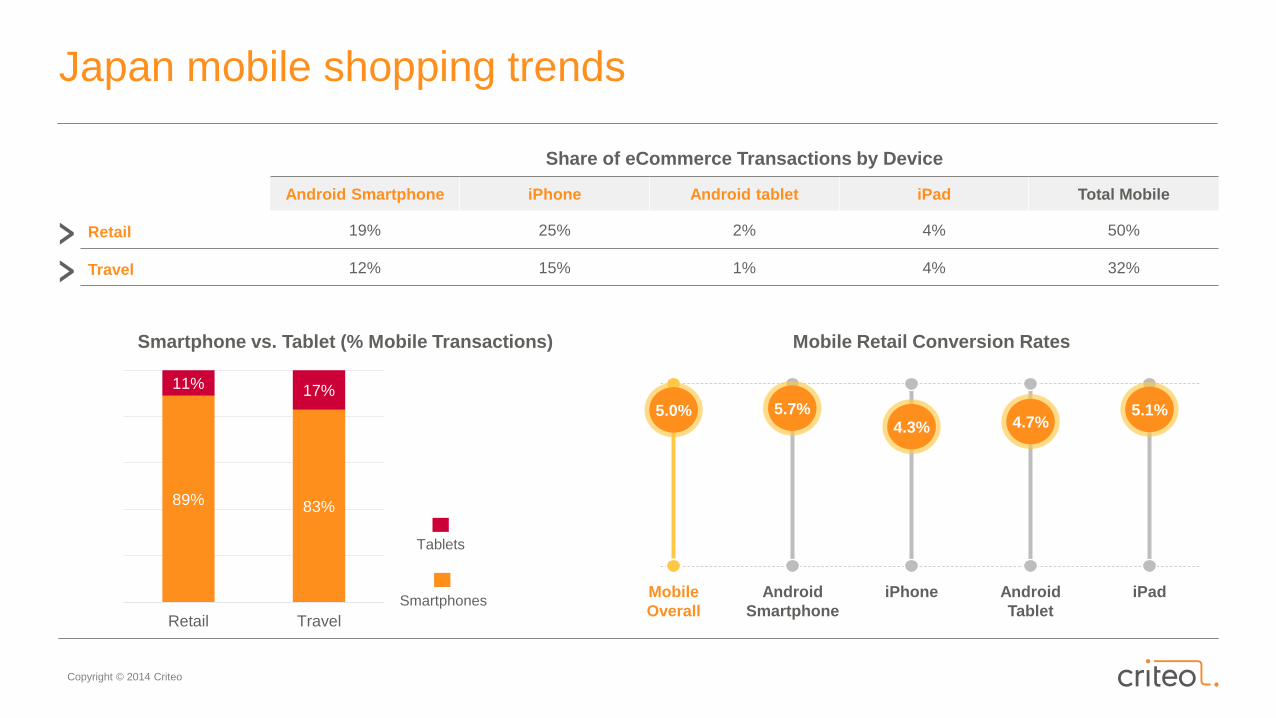
Japan mobile shopping trends
Mobile Retail Conversion Rates
Mobile
Overall
Android
Smartphone
iPhone Android
Tablet
iPad
5.0% 5.7%4.3% 4.7%
5.1%
Smartphone vs. Tablet (% Mobile Transactions)
Share of eCommerce Transactions by Device
Android Smartphone iPhone Android tablet iPad Total Mobile
Retail 19% 25% 2% 4% 50%
Travel 12% 15% 1% 4% 32%
Smartphones
Tablets
89% 83%
11% 17%
Retail Travel
Copyright © 2014 Criteo
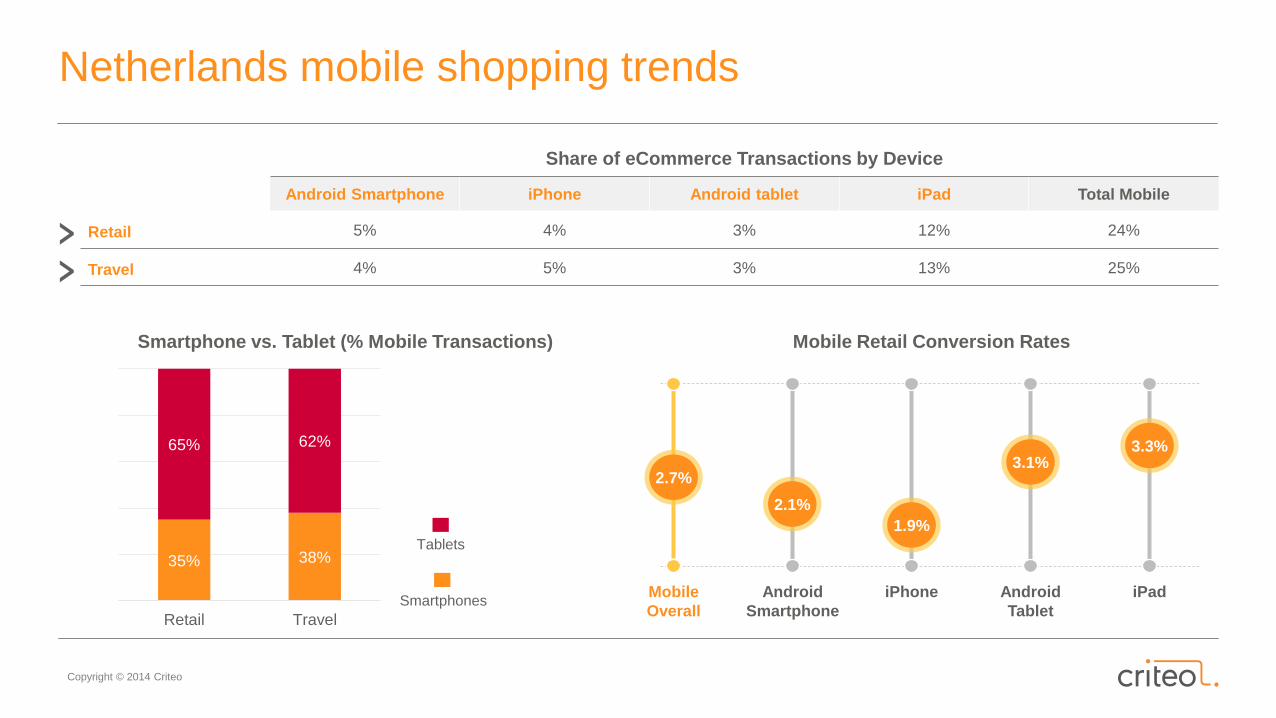
Netherlands mobile shopping trends
Mobile Retail Conversion Rates
Mobile
Overall
Android
Smartphone
iPhone Android
Tablet
iPad
2.7%
2.1%
1.9%
3.1%3.3%
Smartphone vs. Tablet (% Mobile Transactions)
Share of eCommerce Transactions by Device
Android Smartphone iPhone Android tablet iPad Total Mobile
Retail 5% 4% 3% 12% 24%
Travel 4% 5% 3% 13% 25%
Smartphones
Tablets35% 38%
65% 62%
Retail Travel
Copyright © 2014 Criteo
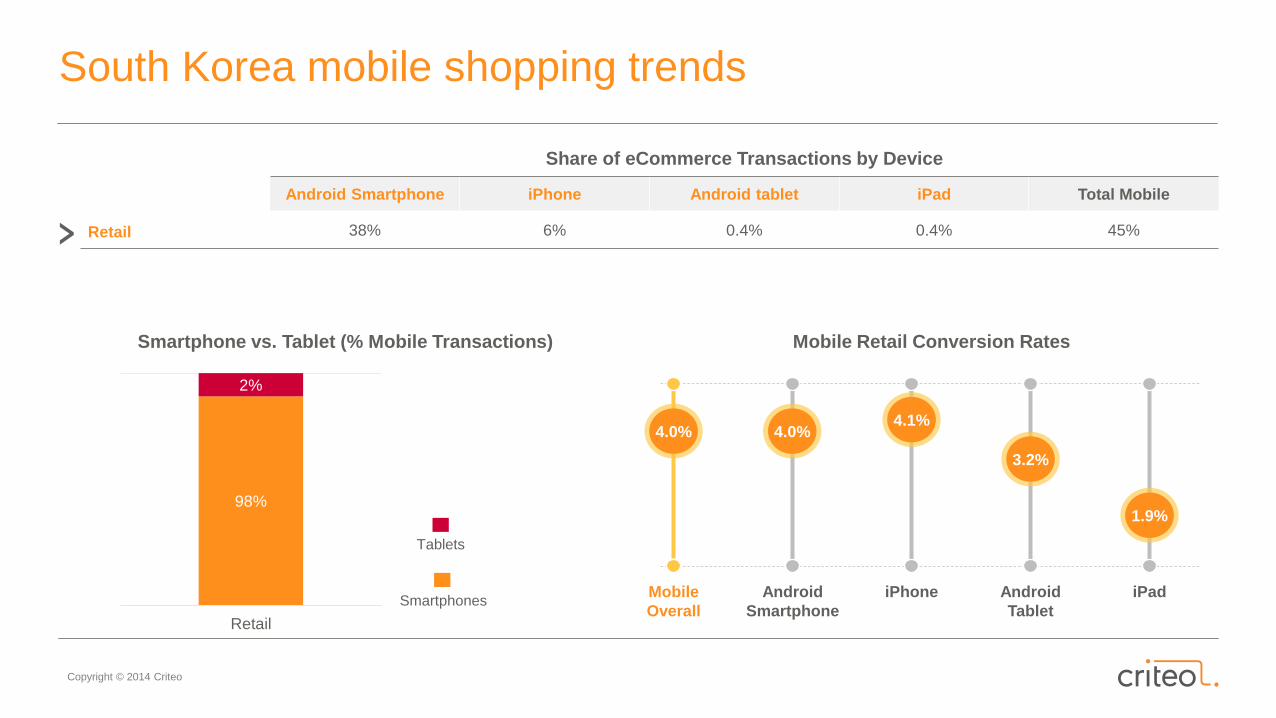
South Korea mobile shopping trends
Mobile Retail Conversion Rates
Mobile
Overall
Android
Smartphone
iPhone Android
Tablet
iPad
4.0% 4.0%4.1%
3.2%
1.9%
Smartphone vs. Tablet (% Mobile Transactions)
Share of eCommerce Transactions by Device
Android Smartphone iPhone Android tablet iPad Total Mobile
Retail 38% 6% 0.4% 0.4% 45%
Smartphones
Tablets
98%
2%
Retail
Copyright © 2014 Criteo
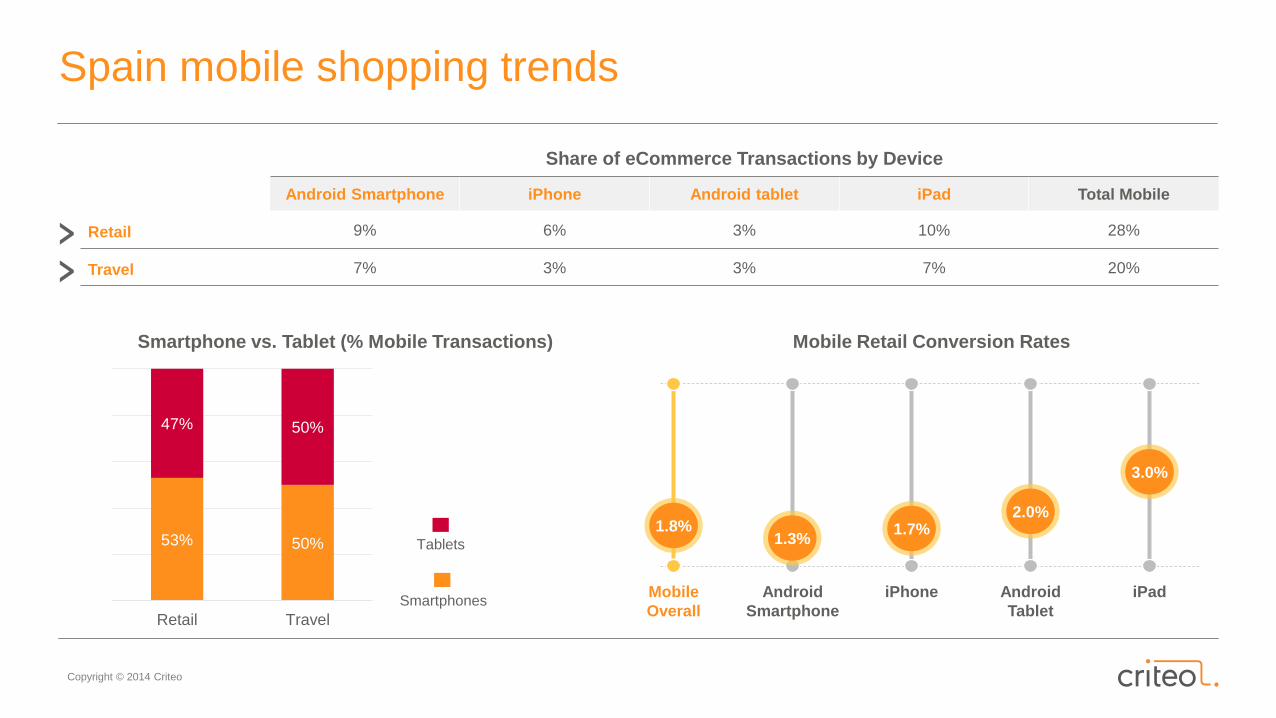
Spain mobile shopping trends
Mobile Retail Conversion Rates
Mobile
Overall
Android
Smartphone
iPhone Android
Tablet
iPad
1.8%1.3%
1.7%2.0%
3.0%
Smartphone vs. Tablet (% Mobile Transactions)
Share of eCommerce Transactions by Device
Android Smartphone iPhone Android tablet iPad Total Mobile
Retail 9% 6% 3% 10% 28%
Travel 7% 3% 3% 7% 20%
Smartphones
Tablets53% 50%
47% 50%
Retail Travel
Copyright © 2014 Criteo
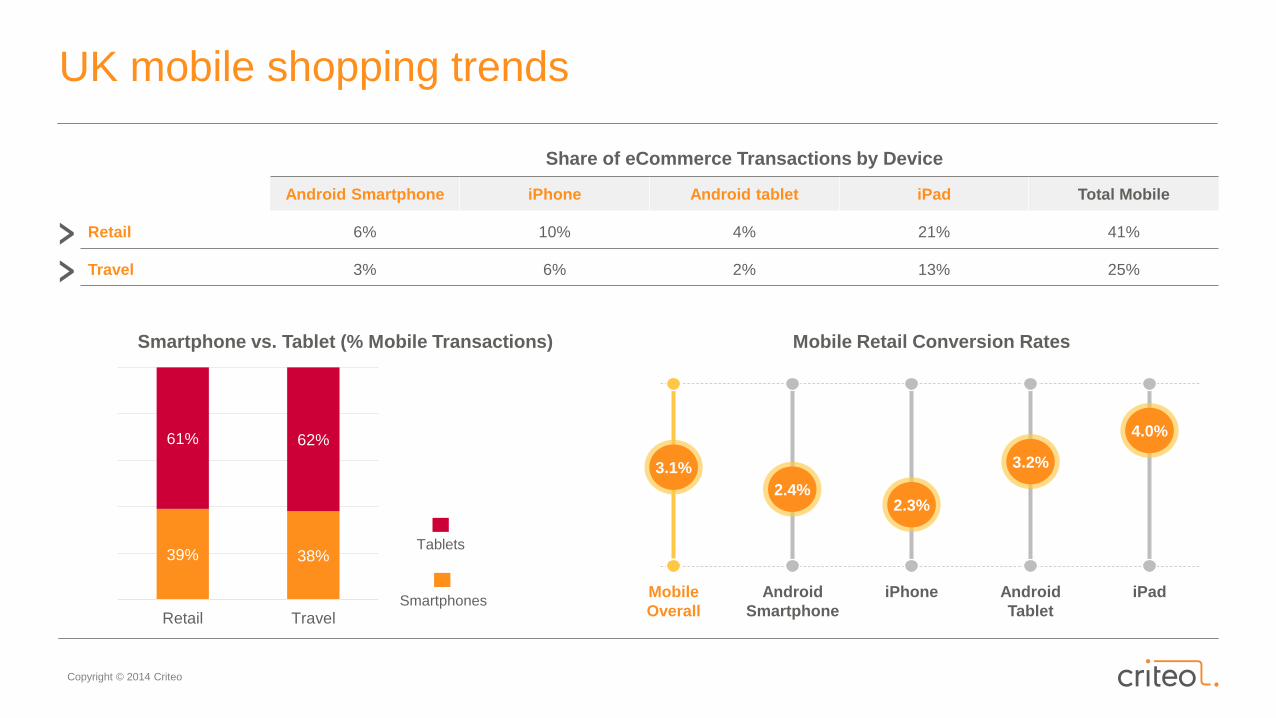
UK mobile shopping trends
Mobile Retail Conversion Rates
Mobile
Overall
Android
Smartphone
iPhone Android
Tablet
iPad
3.1%
2.4%2.3%
3.2%
4.0%
Smartphone vs. Tablet (% Mobile Transactions)
Share of eCommerce Transactions by Device
Android Smartphone iPhone Android tablet iPad Total Mobile
Retail 6% 10% 4% 21% 41%
Travel 3% 6% 2% 13% 25%
Smartphones
Tablets39% 38%
61% 62%
Retail Travel
Copyright © 2014 Criteo
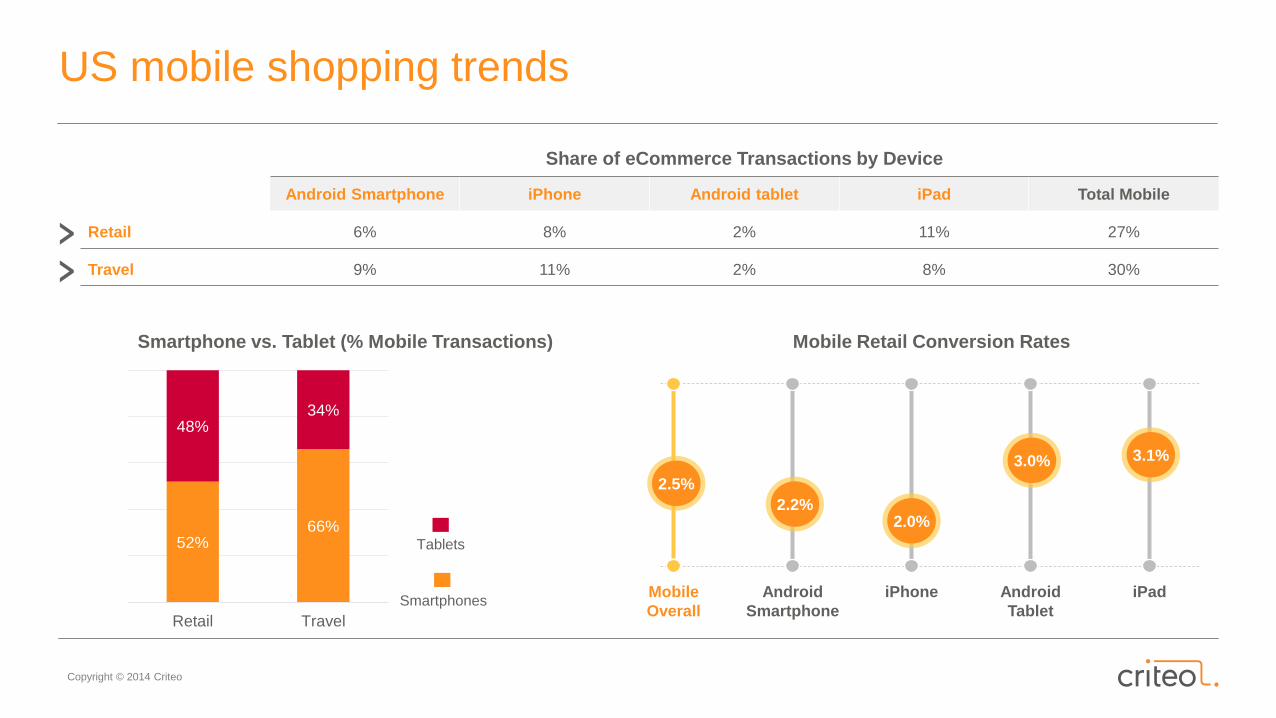
US mobile shopping trends
Mobile Retail Conversion Rates
Mobile
Overall
Android
Smartphone
iPhone Android
Tablet
iPad
2.5%
2.2%2.0%
3.0% 3.1%
Smartphone vs. Tablet (% Mobile Transactions)
Share of eCommerce Transactions by Device
Android Smartphone iPhone Android tablet iPad Total Mobile
Retail 6% 8% 2% 11% 27%
Travel 9% 11% 2% 8% 30%
Smartphones
Tablets52%66%
48%34%
Retail Travel