Embed Size (px)
Citation preview
Crisis Politics:Uncertainty, Relative Prices, and Political
Change
Jeffry A. FriedenDavid A. Lake
Michael NicholsonAditya Ranganath
What is a Crisis?Why and how do crises affect national politics?
Crises increase uncertainty and change relative prices so as to alter the expected gains from political activity relative to alternatives
We posit theoretically grounded, ex ante measures of crisis, independent of (and possibly predictive of) observed political change
Politics in Normal Times Individuals pursue their interests in
economic and political arenasRelative price changes create winners and
losers Winners exploit market opportunities; losers
pursue political remediesCollective action central in coalition
formation Time horizon – “shadow of the future” – affects
ability to resolve collective action problemsLonger time horizon, more stable coalitions
Institutions induce equilibrium Fixed asset holders “vested” in policy regime
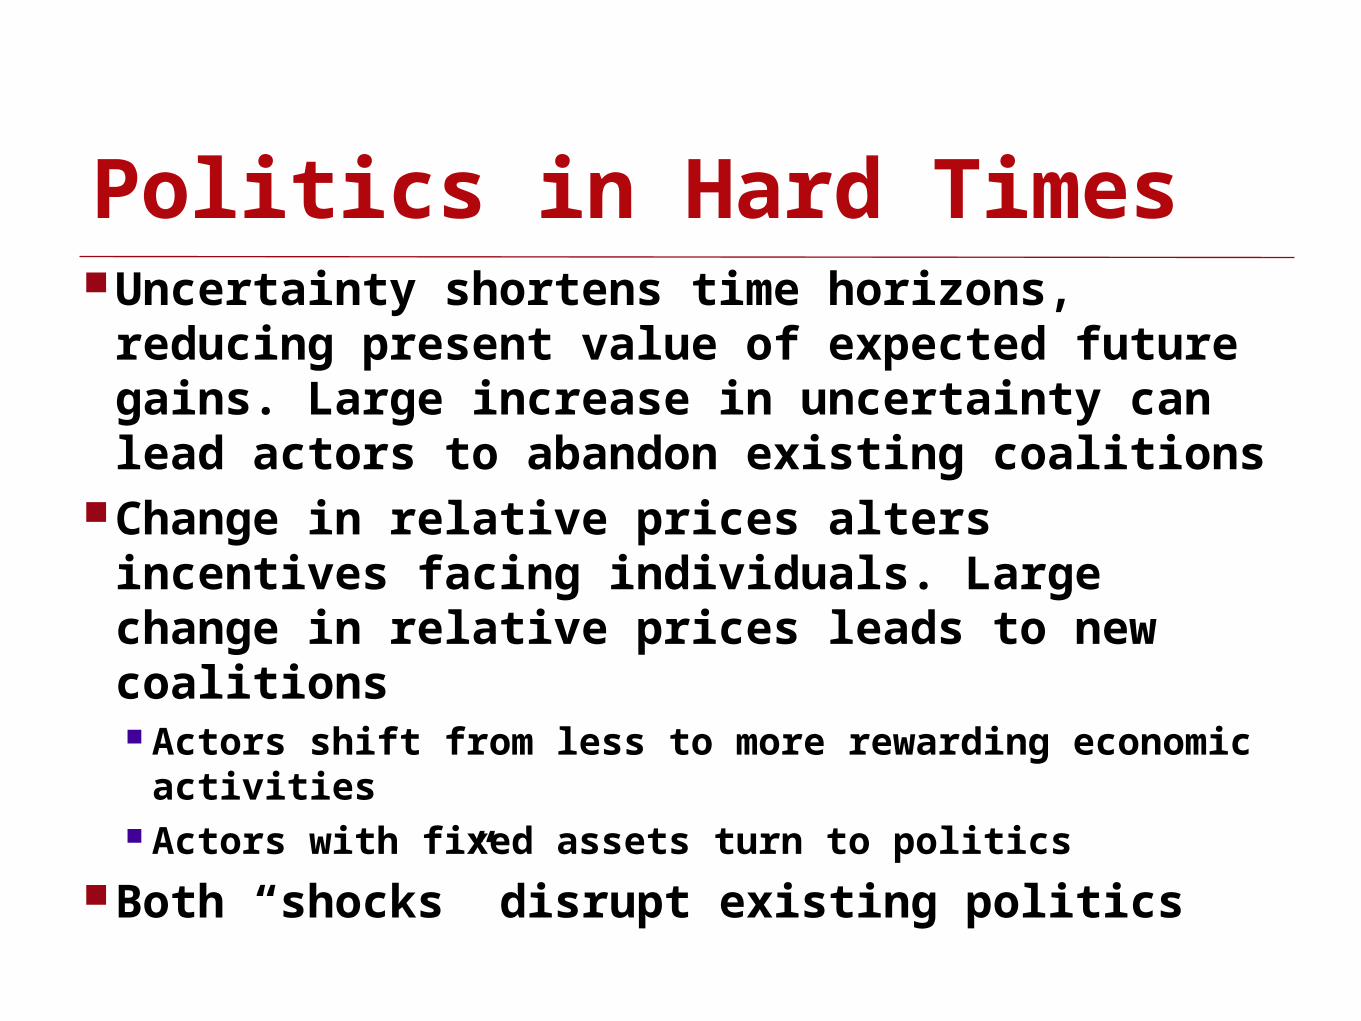
Politics in Hard TimesUncertainty shortens time horizons, reducing present value of expected future gains. Large increase in uncertainty can lead actors to abandon existing coalitions
Change in relative prices alters incentives facing individuals. Large change in relative prices leads to new coalitions Actors shift from less to more rewarding
economic activities Actors with fixed assets turn to politics
Both “shocks” disrupt existing politics
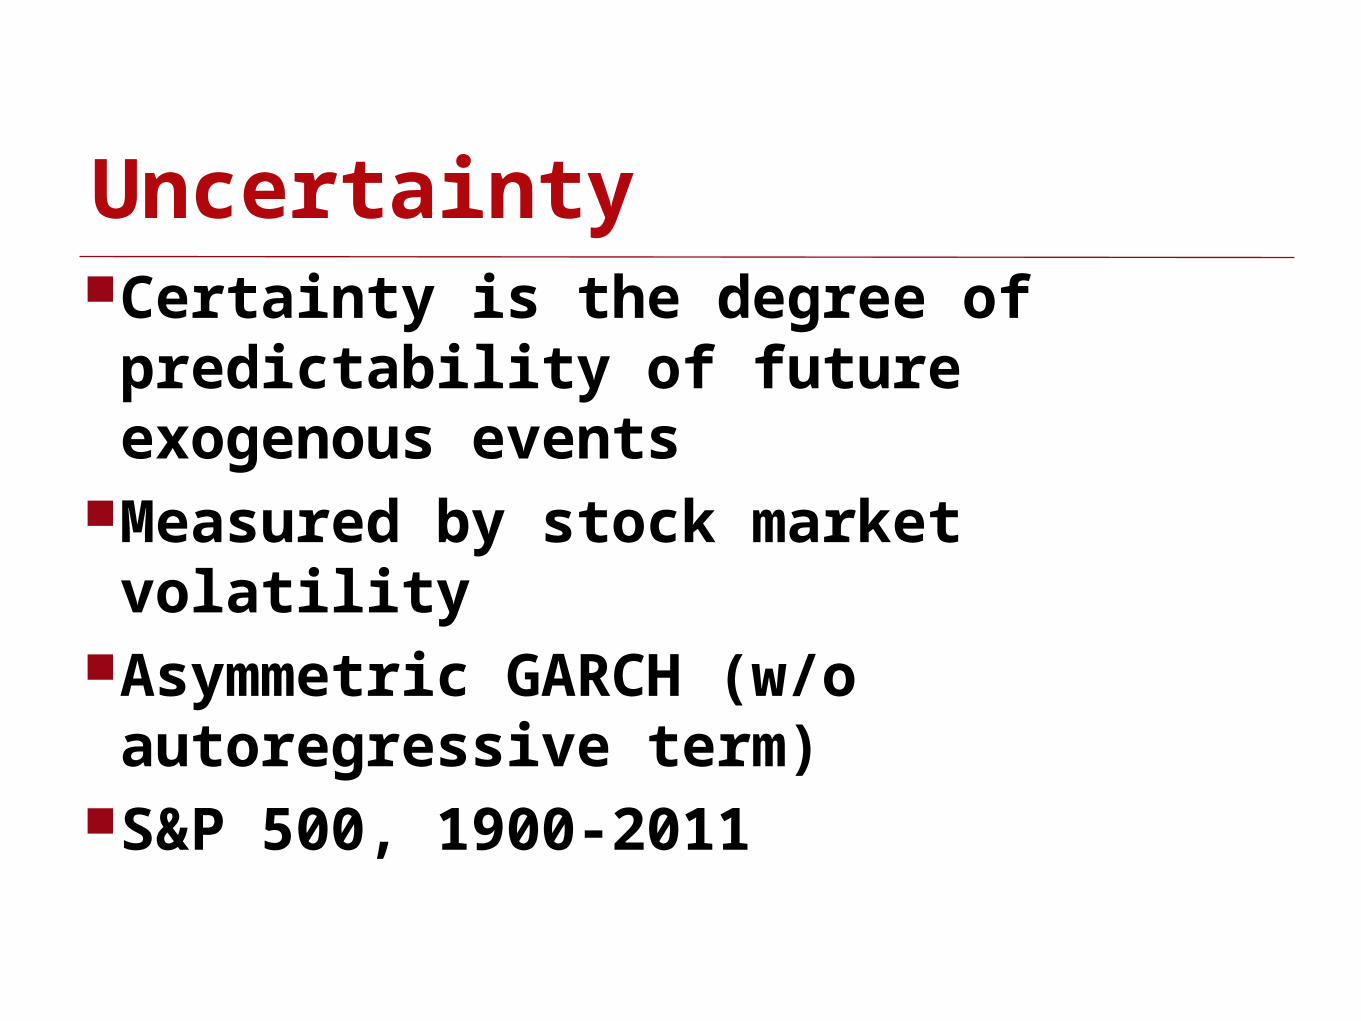
UncertaintyCertainty is the degree of predictability of future exogenous events
Measured by stock market volatility
Asymmetric GARCH (w/o autoregressive term)
S&P 500, 1900-2011
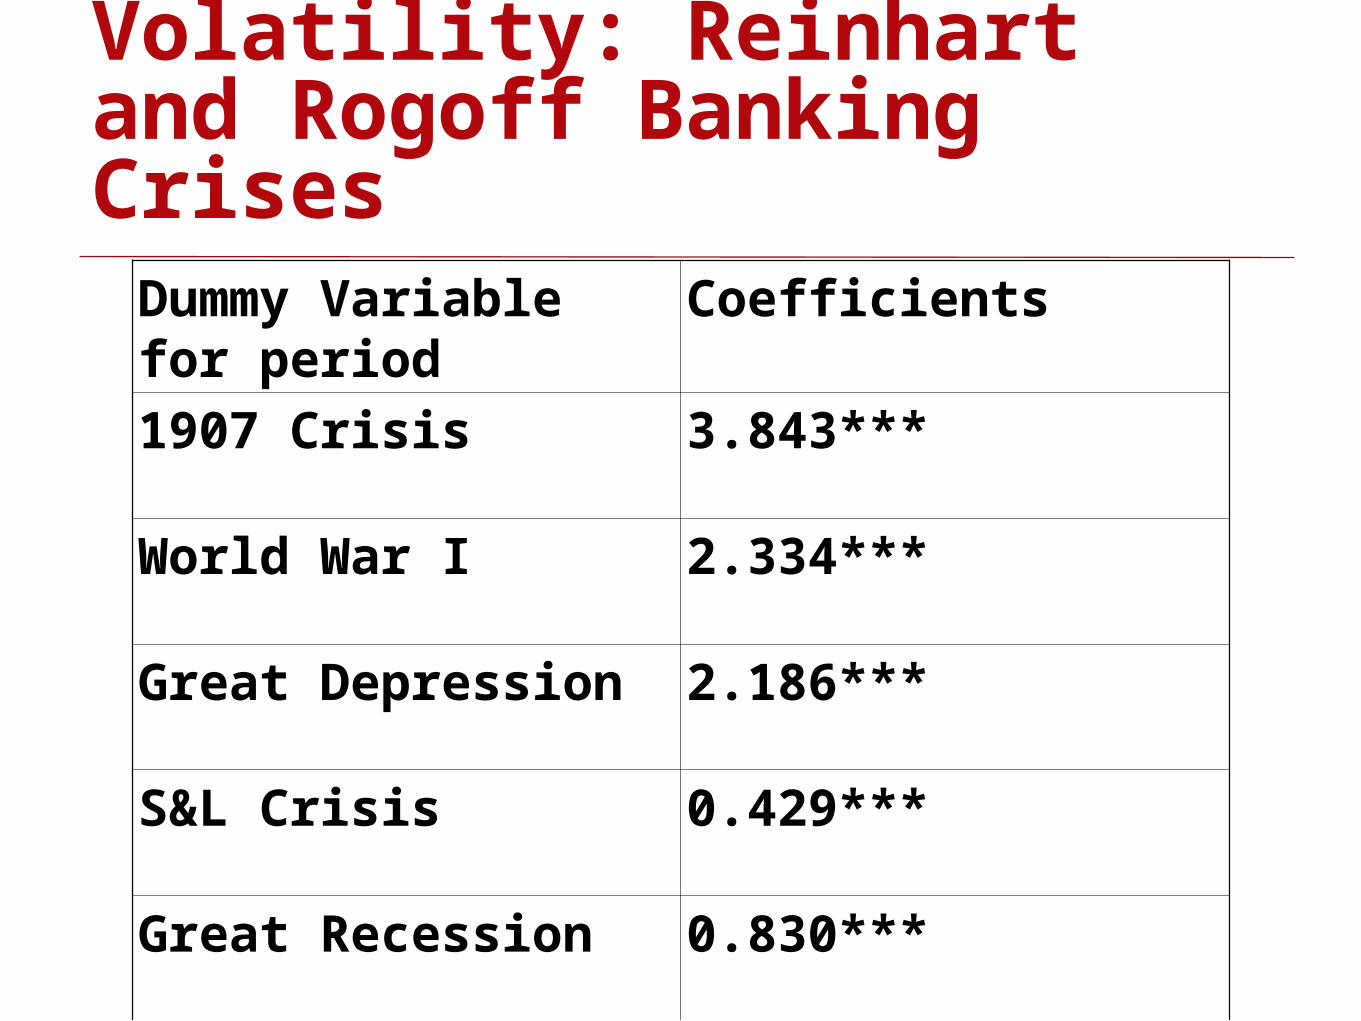
Volatility: Reinhart and Rogoff Banking Crises
Dummy Variable for period
Coefficients
1907 Crisis 3.843***
World War I 2.334***
Great Depression 2.186***
S&L Crisis 0.429***
Great Recession 0.830***
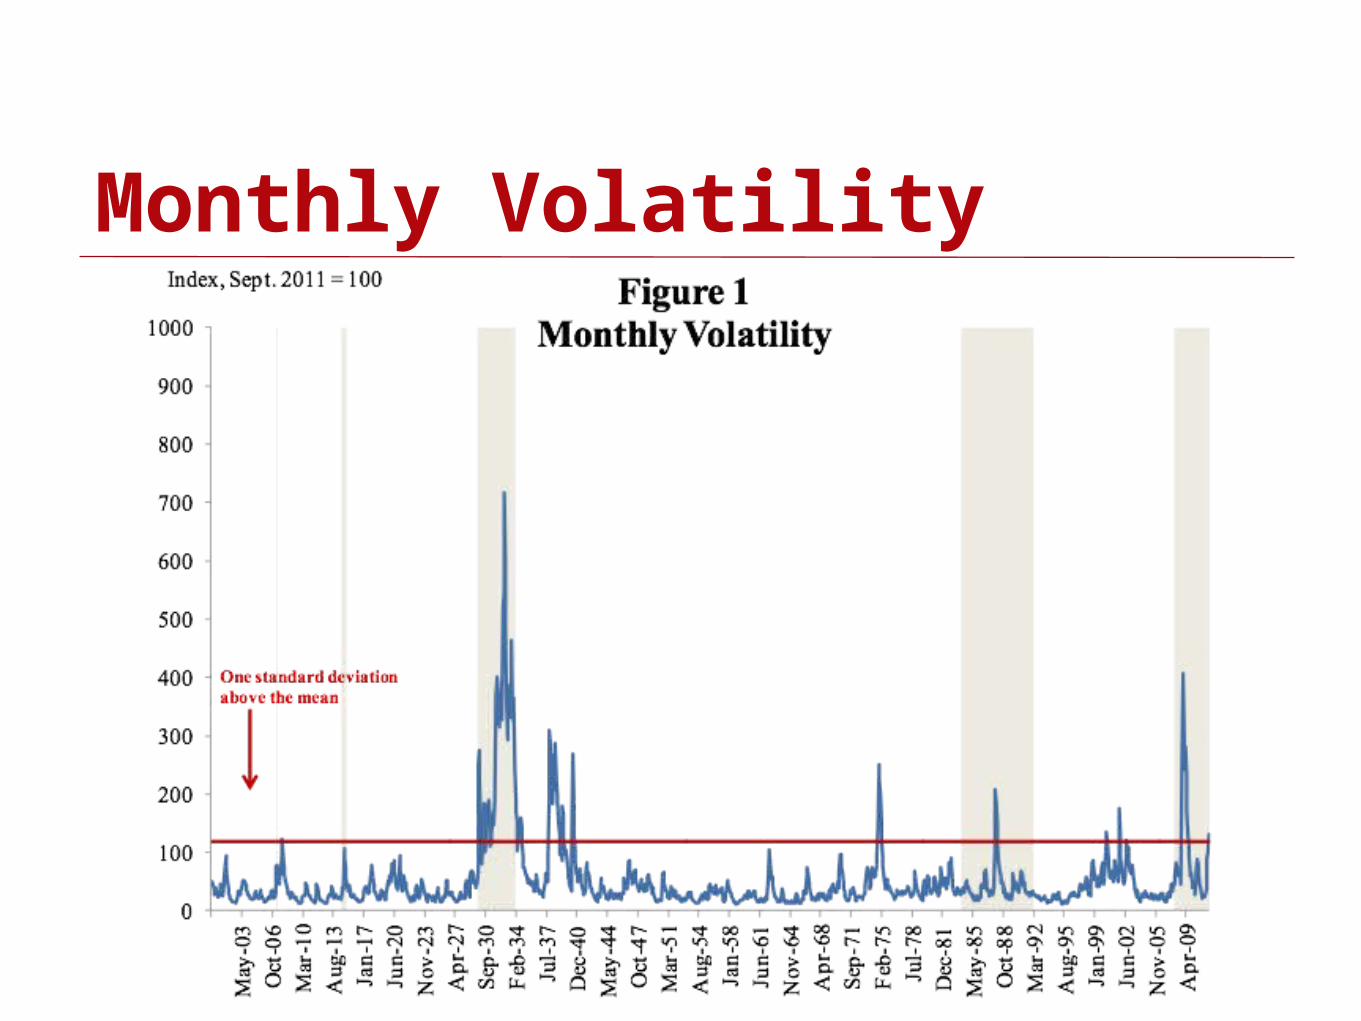
Monthly Volatility
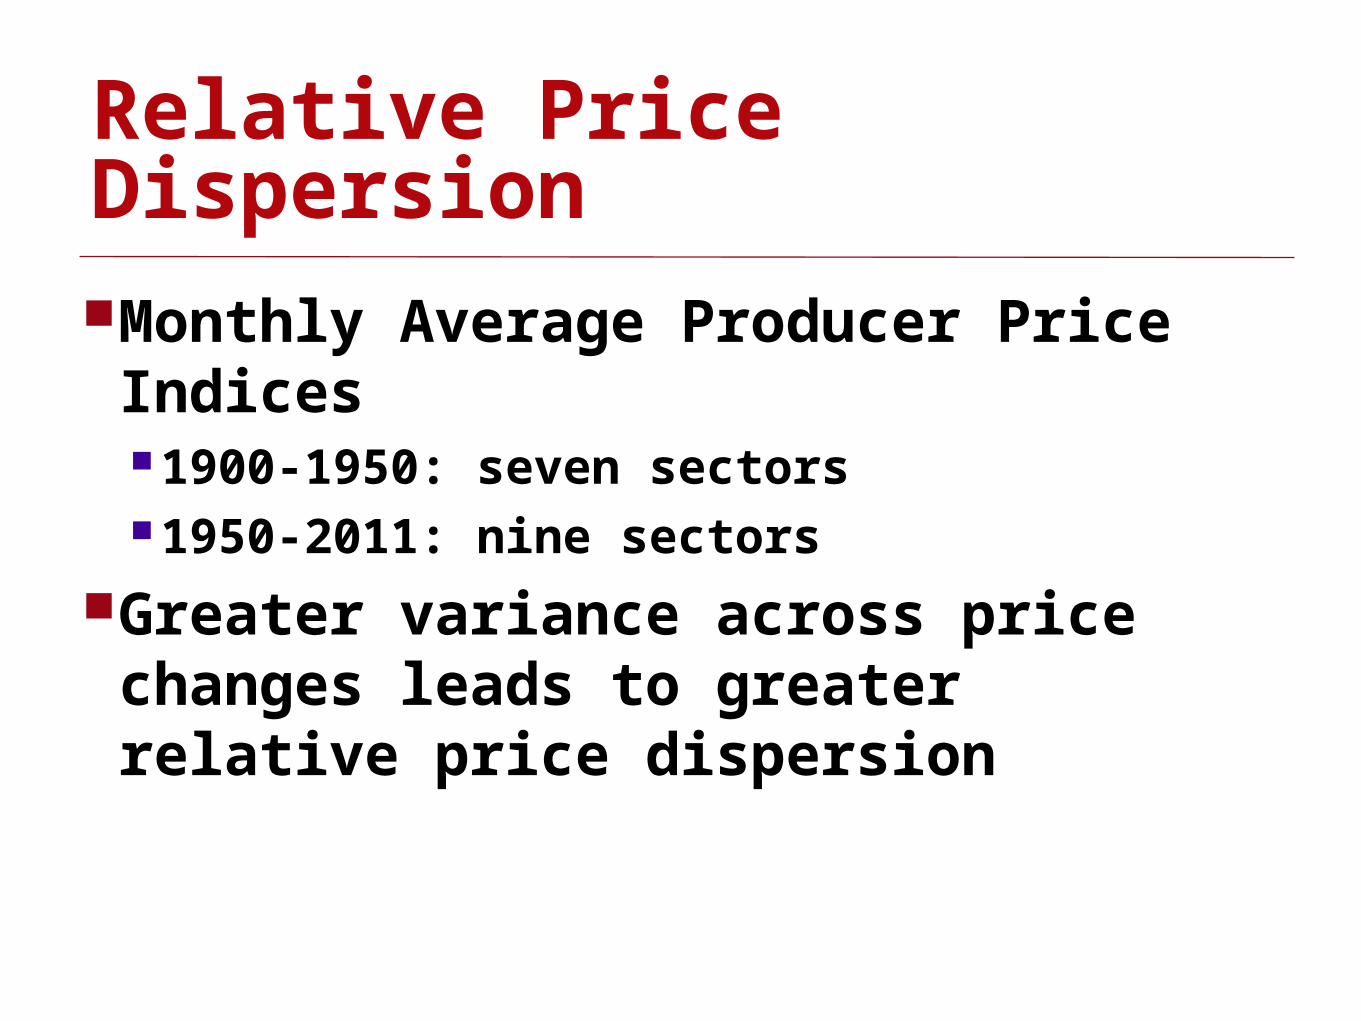
Relative Price DispersionMonthly Average Producer Price Indices 1900-1950: seven sectors1950-2011: nine sectors
Greater variance across price changes leads to greater relative price dispersion
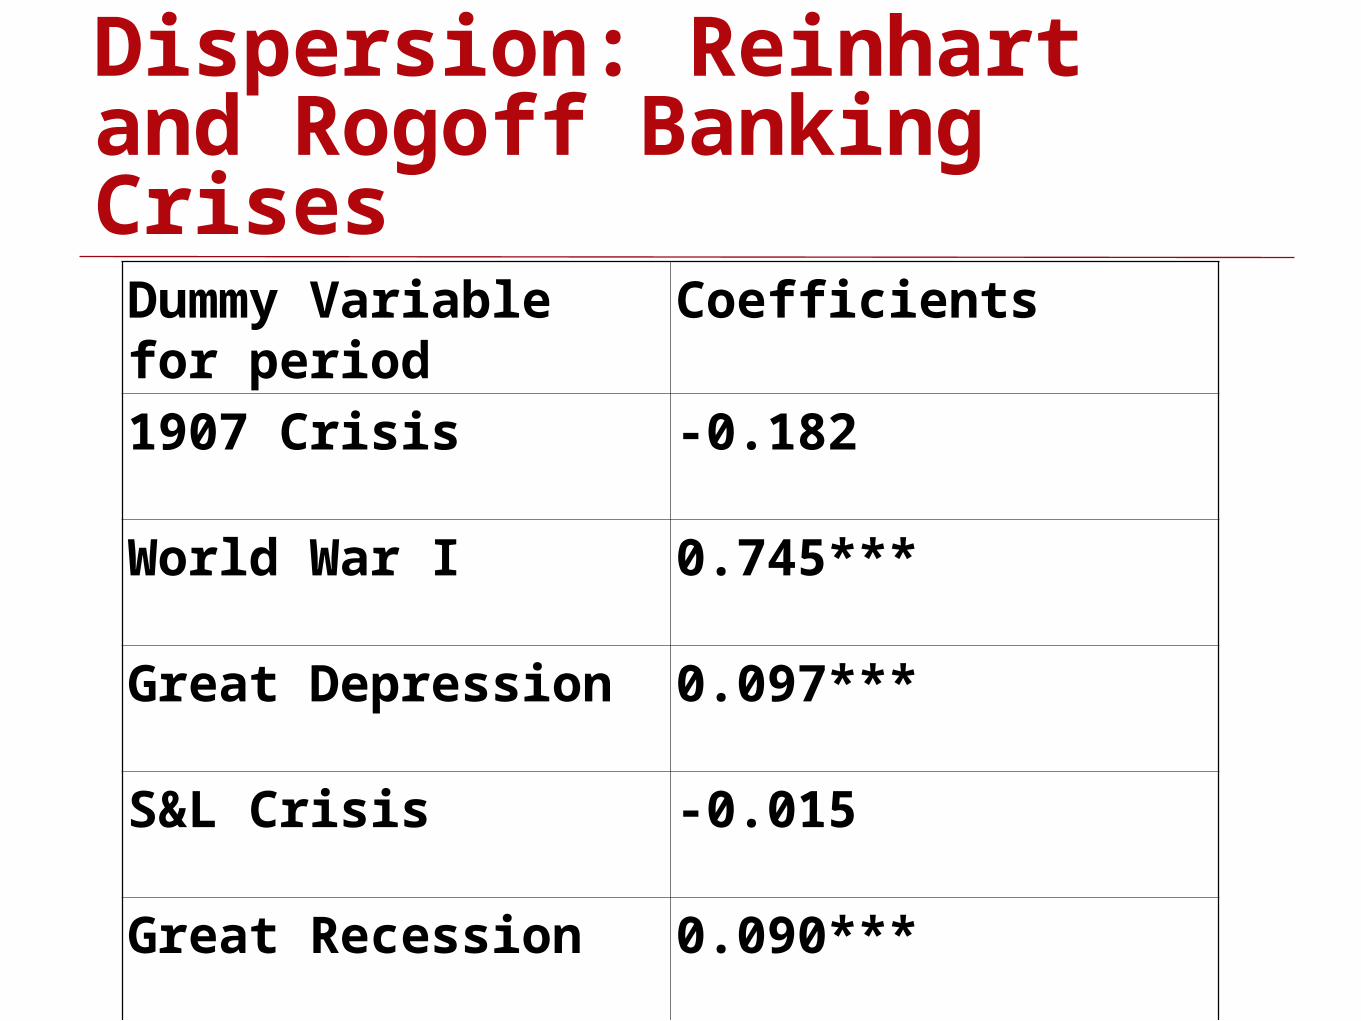
Relative Price Dispersion: Reinhart and Rogoff Banking CrisesDummy Variable for period
Coefficients
1907 Crisis -0.182
World War I 0.745***
Great Depression 0.097***
S&L Crisis -0.015
Great Recession 0.090***
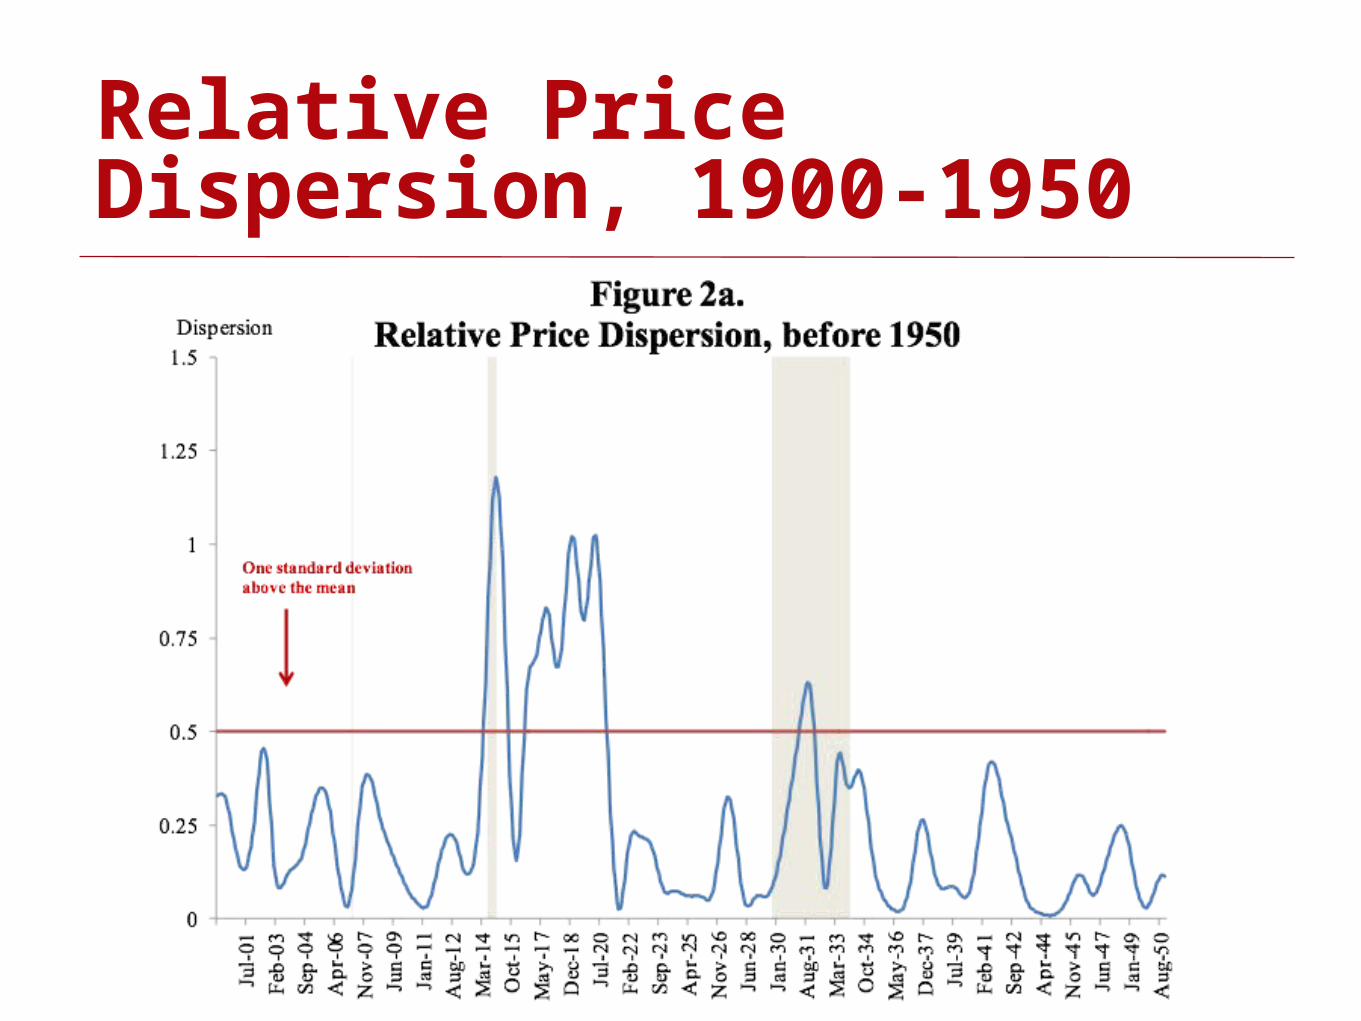
Relative Price Dispersion, 1900-1950
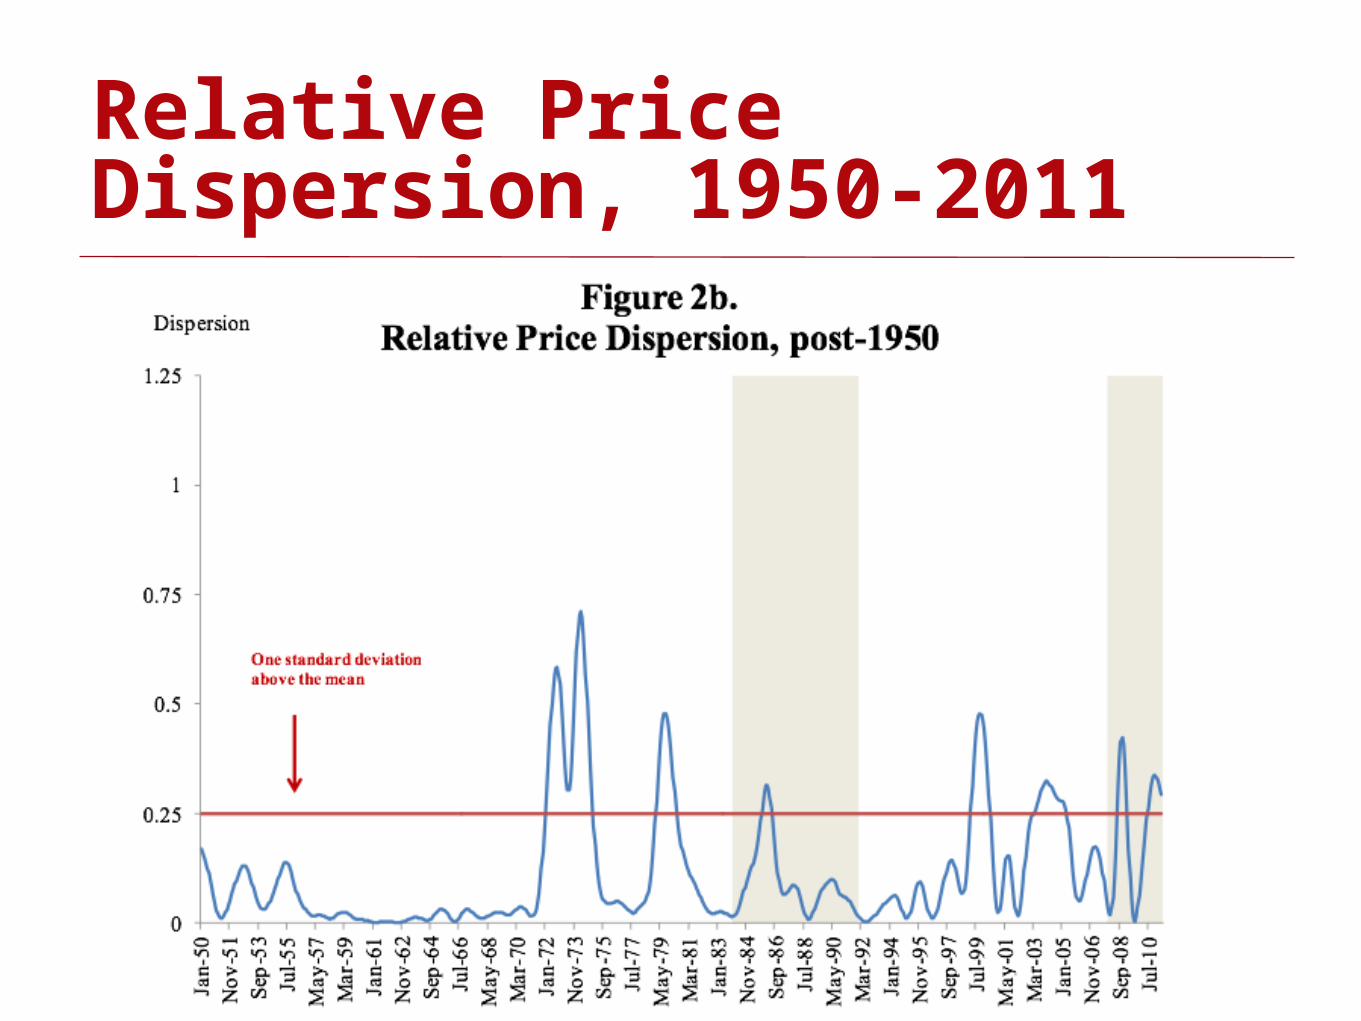
Relative Price Dispersion, 1950-2011
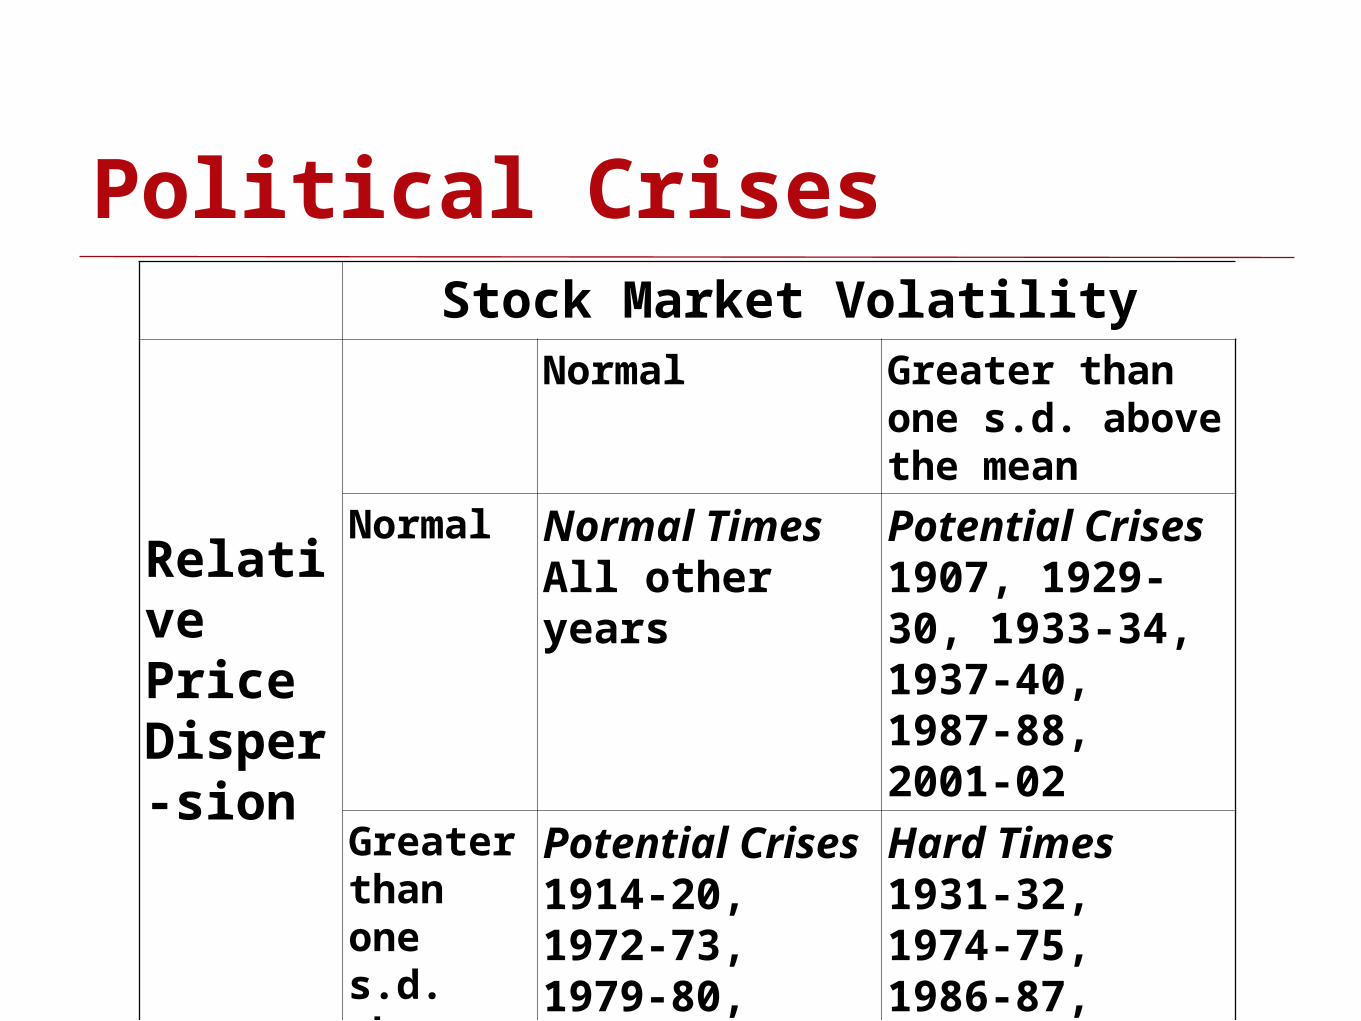
Political CrisesStock Market Volatility
Relative Price Disper-sion
Normal Greater than one s.d. above the mean
Normal Normal TimesAll other years
Potential Crises1907, 1929-30, 1933-34, 1937-40, 1987-88, 2001-02
Greater than one s.d. above the mean
Potential Crises1914-20, 1972-73, 1979-80, 1985-86, 1999, 2003-05, 2010-11
Hard Times1931-32, 1974-75, 1986-87, 2000, 2008-09
ConclusionThe Great Recession: “The times they are a-changin”Stock market volatility second highest since 1900
Relative price dispersion fourth highest in any crisis period
Next step: identify winners and losers and map onto post-crisis coalition formation