Embed Size (px)
Citation preview

1
Directorate General for Communication Directorate C – Relations with Citizens PUBLIC OPINION MONITORING UNIT
Brussels, 21 May 2012
CRISIS AND ECONOMIC GOVERNANCE V
European Parliament Eurobarometer (EB77.2) Summary
Coverage: EU27 (26 593 EU citizens) Population: Europeans aged 15 or over Methodology: Face-to-face (CAPI) Fieldwork: 10-25 March 2012 carried out by TNS Opinion
INTRODUCTION......................................................................................................................3
I. Member States’ reactions to the crisis .........................................................................8
A. Priority to reduction of public spending, measures to boost the economy or both at the same time?.............................................................................................................................................8 B. According to Europeans, how should the Member states behave? .......................................10
II. Finding a way out of the crisis ....................................................................................12
A. Measures to overcome the crisis ...........................................................................................12 B. Towards a convergence of budgetary policies ......................................................................16 C. Compliance with common rules............................................................................................18 D. Sharing of debt by the Member States ..................................................................................19 E. Tax on financial transactions................................................................................................20 F. Eurobonds: awareness and opinion .......................................................................................24
III. Credit rating agencies..................................................................................................27
A. Awareness of credit rating agencies......................................................................................27 B. The role of credit rating agencies..........................................................................................30
ANNEXES ................................................................................................................................35
Eurostat data...............................................................................................................................35

2
The tables below were taken from the following issues of Eurobarometer:
EB 77 Fieldwork: 10-25 March 2012
Coverage: 26 593 people (face-to-face interviews) Population: Europeans aged 15 or over TNS Opinion on behalf of the European Parliament
EB 76 Fieldwork: 3-16 September 2011 Coverage: 26 856 people (face-to-face interviews) Population: Europeans aged 15 or over TNS Opinion on behalf of the European Parliament
EB 75 Fieldwork: 13 April-2 May 2011 Coverage: 26 825 people (face-to-face interviews) Population: Europeans aged 15 or over TNS Opinion on behalf of the European Parliament
N.B.: Readers should bear in mind that the results of a survey are estimates, the accuracy of which – all else being equal – depends on the sample size and the percentages recorded. For samples of around 1 000 interviews (the sample size generally used at the level of a Member State), the actual percentage (that which would have been obtained by interviewing the whole population) varies within the following confidence intervals: Percentages recorded 10 % or 90 % 20 % or 80 % 30 % or 70 % 40 % or 60 % 50 %
Confidence limits +/- 1.9 points +/- 2.5 points +/- 2.7 points +/- 3.0 points +/- 3.1 points

3
INTRODUCTION
This Eurobarometer survey on ‘The crisis and the economic governance in Europe is the fifth1 carried out by the European Parliament. It was conducted by TNS opinion between 10 and 25 March 2012, in face-to-face interviews with 26 593 Europeans aged 15 and over Over the last six months, a significant number of political, economic and social events occurred which undoubtedly had an impact on people’s answers. Six general elections and three presidential elections were held during this six-month period. Thirteen countries had their ratings downgraded by the credit rating agencies – most of them were downgraded repeatedly. At the same time, the European Union and its Member States kept up their fight against the crisis. In September 2011, at the request of the European Parliament, the Commission brought forward a proposal for a financial transaction tax (FTT). On 21 July 2011, the Member States agreed to strengthen the European Financial Stability Facility (EFSF), a decision later ratified by the 17 member countries of the euro zone. Three European councils took place during the period concerned. At the last of these, on 2 March 2012, 25 Member States adopted the Treaty on stability, coordination and governance in the economic and monetary union. As with any Eurobarometer survey, it should be noted that the European average is balanced and that the six most populous Member States account for approximately 70 % of the EU average. Before proceeding to a more detailed analysis, we shall look at the major trends brought to light by the survey.
1 The previous four were carried out in January-February 2009, September 2010, April-May 2011 and September 2011.
4
Main trends - Prior to key meetings of heads of state and government on the theme of the crisis, most
Europeans think that the EU has to take action reduce public spending and boost economic growth at the same time.
- The survey’s findings confirm a known trend which shows a polarisation of public opinion.
Indeed, the number of people who do not have any opinion decreases from survey to survey. The impact of the crisis on the day-to-day lives of people in Europe has certainly played a major role in this development.
- Although the primary focus of the current debate between the Member States is whether or
not to they should take action together, most Europeans are in favour of collective, coordinated action.
As far as the ways of tackling the crisis are concerned, there are clear differences between those inside the euro zone and those outside it. Countries within the euro zone are clearly more in favour of coordinated action than those outside it. We should therefore be careful that the perception European citizens have of the EU, in both zones, is not becoming increasingly distant.
- Although they are in favour of solidarity , most Europeans consider that financial help for Member States in economic or financial difficulties must be made conditional on compliance with common rules. They also believe that penalties should be imposed when these rules are broken.
- People’s awareness of Eurobonds, the financial transaction tax (FTT ) and credit rating
agencies CRA) was constantly on the increase over the six-month period concerned. - Several observations can be drawn from the socio-demographic analysis:
� The most significant differences of opinion relate to the age of the person surveyed and their level of education: the youngest and those people who studied until they were at least 20 are most in favour of coordination and solidarity actions.
� With regard to coordination measures, real differences can be noted between
managers (63 %) and unemployed people (51 %). Unemployed people and manual workers are more in favour of Member States taking measures individually.
� Men’s and women’s answers did not vary much, except for those relating to certain
questions on objective knowledge, with men seeming to have a better knowledge than women.

5
� Emerging from the crisis by simultaneously reducing public spending and
boosting the economy
- People’s answers concerning the way out of the crisis were very clear: 47 % take the view that the EU and its Member States should act to reduce public spending and boost the economy at the same time. The majority of people in the 27 Member States take this view.
- However, 25 % of Europeans consider that priority must be given to
measures that stimulate the economy, and 23 % are in favour of measures to reduce public spending.
� In the face of the crisis, most Europeans are in favour of coordinated measures
- In the face of the current crisis, 55 % of Europeans (=) would feel
better protected by measures adopted in a coordinated way with the other EU countries.
However, the proportion of those who would feel better protected by measures adopted and applied individually by their Member States is slightly increasing (38 %, +3).
- It is important to note that this tendency to favour coordinated
measures is greater within the euro zone (61 %) than outside it (43 %).
� A clear ‘ yes’ to EU-Member State consultation on national budgets
As the answers to all the other questions also showed, a clear majority is in favour of coordinated action, but the number of respondents who are against such action has increased slightly.
- Some 65 % (-2) of those surveyed are in favour of preliminary consultations
between European and national institutions whilst national budgets are being drawn up.
- Once again, there is a very big difference between those inside the euro zone
and those outside it. Some 70 % of respondents within the euro zone are in favour of preliminary consultation, as against 56 % outside the euro zone.

6
� Help for Member States in economic or financial difficulties must be made conditional on compliance with common rules
Two years after the adoption of the European Financial Stability Facility
(EFSF) in May 2010, the issue of whether financial support should be conditional is still central to the discussions.
- 80 % of Europeans think that financial support must made conditional
on compliance with common rules. A difference of 10 percentage points separates those inside the euro zone (83 %) and those outside the euro zone (73 %) on this issue.
- As additional way of guaranteeing compliance with the rules, the idea
of the automatic application of escalating financial penalties is accepted by 72 % (+4) of Europeans. Once again, a difference of 10 percentage points separates those inside the euro zone (76 %) from those outside it (66 %).
� Support for pooling part of the public debt but different points of view on its effects
- 66% (=) of Europeans think that sharing part of the public debt would
benefit only those Member States which are in worst difficulties;
- 64% (+3) consider that this would be necessary in the name of solidarity between member states;
- 61% (+4) think that this would reinforce the financial stability of the Member states;
- 61% (-1) reckon that this would penalise those Members which are not
in difficulty;
- 57% (+7) consider that this would allow reducing the cost of the crisis.
� Europeans are becoming increasingly keen on the principle of a financial
transaction tax (FTT)
- 66 % of Europeans (+5) are in favour of the principle of creating a financial transaction tax.
- On this issue there is once again a split between those inside the euro
zone (73 %) and those outside it (53 %) – a difference of 20 percentage points.
- National results differ by up to 46 percentage points. The highest levels
of support for this kind of tax are in the countries hardest hit by the crisis (Greece, Cyprus, Italy, Portugal and Spain).

7
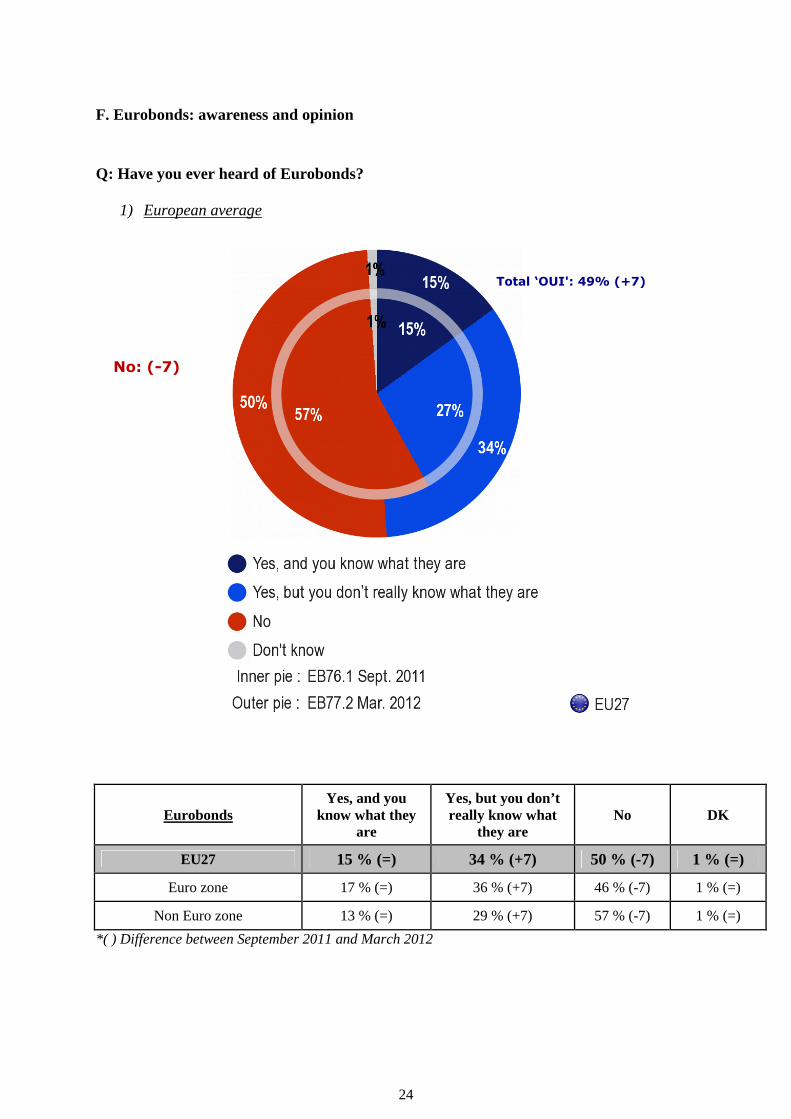
� A better knowledge of Eurobonds
Today, nearly one European in two (49 %; +7) has heard of Eurobonds. This awareness is greater inside the euro zone (53 %) than outside it (42 %). Some 53 % of respondents in the euro zone who had heard of Eurobonds were asked whether they were in favour of them: 44 % (+6) are for and 25 % (-8) against.
� Awareness of credit rating agencies (CRAs) has increased sharply and people are in
favour of the creation of an independent European Credit Rating Agency
- As mentioned above, 13 countries had their ratings downgraded by CRAs in the six months since the last survey was carried out.
- It is therefore no surprise to discover that 61 % (+11) of Europeans have heard of
CRAs. Among them, 32 % say that they know what the credit rating agencies are, with 29 % saying that they do not really know.
- As an example, the biggest increases are in Hungary, Slovenia (+22), and Italy
(+20): three countries which were downgraded by the CRAs at the beginning of 2012.
- Asked whether a European CRA should be created to counterbalance the power
of the existing agencies, 67 % (+2) of Europeans were in favour.
- Finally, 54 % of Europeans think that in serious crisis, the CRAs should not rate countries which have been helped by other EU Member States.
For further information:
Public Opinion Monitoring Unit [email protected]
Jacques Nancy +32 2 284 24 85
Survey and national data available on the European Parliament’s ‘Eurobarometer’ page: http://www.europarl.europa.eu/parliament/public/staticDisplay.do?language=EN&id=40

8
I. Member States’ reactions to the crisis
A. Priority to reduction of public spending, measures to boost the economy or both at the same time?
Q: Personally, would you say that to emerge from the crisis rapidly, EU Member States should...?
1) European average
Reduction of public
spending
Measures to boost the economy
Both at the same time DK
EU27 23 % 25 % 47 % 5 %
euro zone 25 % 24 % 47 % 4 %
non euro zone 18 % 29 % 45 % 8 % * March 2012
� Within the euro zone, the percentage of people in favour of reducing public spending was roughly the same as the percentage in favour of measures to boost the economy (25 % and 24 %). Outside the euro zone, however, there was an 11 percentage point difference (29 % in favour of measures to boost the economy and 18 % in favour of reducing public spending).

9
2) National variations
Reducing public spending/Boosting the economy?
Measures to boost the economy:
� Economy-boosting measures were placed above reducing public spending in
19 Member States, in particular in Lithuania, Ireland, Romania and Greece.
Reduction of public spending:
� Austerity measures were the top priority in France, Germany and Austria.
Both at the same time:
� Across the 27 Member States, people are in favour of boosting the economy and reducing public spending at the same time.

10
B. According to Europeans, how should the Member states behave?
Q: As a citizen would you say that you would be better protected in the face of the current crisis if…?
1) European average
Coordinated measures Individual measures DK
EU27 55 % (=) 38 % (+3) 7 % (-3)
euro zone 61 % (-1) 32 % (+3) 7 % (-2)
non euro zone 43 % (=) 48 % (+2) 9 % (-2)
*( ) Difference between September 2011 and March 2012
� N.B.: There is a difference of 18 percentage points between euro zone countries and non-euro zone countries.

11
2) National variations Coordinated measures/Individual measures
� In the vast majority of countries (22), the citizens would feel ‘more protected’ if ‘their country took measures and applied them in a way coordinated with the other countries of the EU’.
� Countries hardest hit by the crisis tend to be more in favour of coordinated action
between Member States.
� Respondents in the United Kingdom, the Czech Republic, Austria, Latvia and Cyprus favour measures that are applied individually .

12
II. Finding a way out of the crisis
A. Measures to overcome the crisis
Q: The European Parliament promotes certain measures to help the European Union emerge from the crisis, by ensuring a return to employment and sustainable growth. In your view, which of the following measures should be a priority? (Max 4 answers)
1) European average
Support for SMEs Education, training and research
Fight against youth unemployment
EU27 49 % 47 % 44 % euro zone 51 % 49 % 44 %
non euro zone 45 % 42 % 46 % *March 2012 � 6 percentage points separate the countries of the euro zone (51 %) and those outside the
euro zone (45 %) when it comes to support for SMEs. There is also a 7 percentage-point difference between both groups of countries when it comes to investment in education, training and research (49 % in the euro zone and 42 % outside it).
13
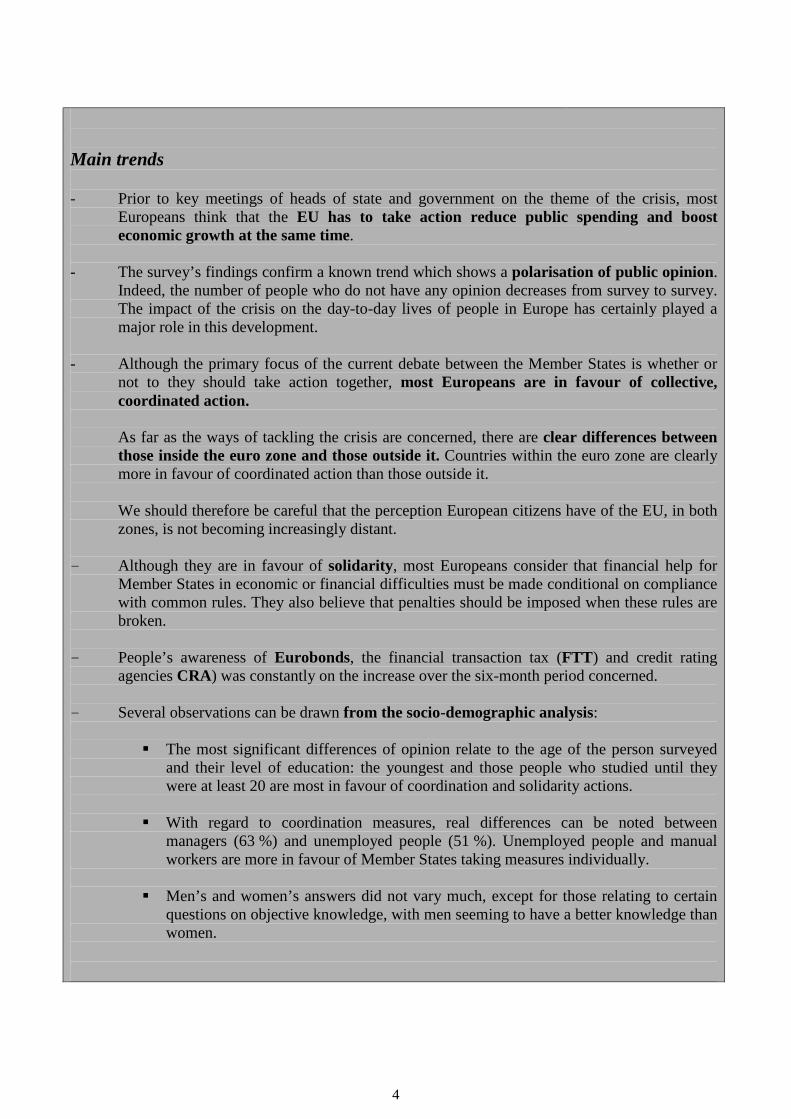
2) National variations � Respondents in 7 Member States chose ‘support for SMEs’ as their first answer: CY
(63 %), ES (62 %), FR (60 %), PT (49 %), BE (47 %), IT (47 %, RO (46 %), AT (45 %).
� Respondents in 8 Member States chose ‘invest in education, training and research’ as their first answer: DE (69 %), IE (62 %), MT (61 %), LU (58 %), NL (57 %), DK (57 %), UK (56 %), EE (49 %).
� Respondents in 8 countries chose ‘encourage the fight against youth unemployment’ as
their first answer: EL (64 %), HU (64 %), BG (59 %), SI (56 %), LT (55 %), SK (55 %), PL (54 %). FI (50 %).
� Among respondents in Austria, ‘support for SMEs’ and ‘invest in education, training and
research’ both achieved 45 %.
� The Czech Republic was the only country in which ‘reduce bureaucracy’ came top (53 %). Latvia favours measures to ‘encourage entrepreneurship‘(55 %) and Sweden’s priority is to ‘Invest in innovation and R&D’ (48 %).

14
Fight against youth unemployment: crossed analysis with statistics (Eurostat)
Eurostat data from March 2012 for all Member States except: EL, UK (January 2012), RO, EE, LV, LT (data for Q4 2011)
� In countries with relatively low youth unemployment figures (less than 10 % in Austria, Germany and the Netherlands), respondents were less likely to choose the fight against youth unemployment as the measure to be promoted by the European Parliament.
� On the other hand, in Greece, where youth unemployment exceeds 50 %,
people are keenly aware of the problem, with 64 % of people choosing the fight against youth unemployment as the first measure to be promoted by the European Parliament.
Youth Unemployment
0%
10%
20%
30%
40%
50%
60%
70%
0% 10% 20% 30% 40% 50% 60%
Unemployment rate- less than 25 years (Eurostat)
Measures to be promoted by the EP: encourage the fight against
youth unemployment
EB/EP 77.2 DE
NL
MT
DK
BE
AT
SI
LU
UKEE
CZ
FI
UE27RO
LT
PT
IT
IE
EL
BG
HU
ES
FR
SE
PL
CY
LVSK

15
Focus on youth: the three top answers among young people (aged 15-24) Q: The European Parliament promotes certain measures to help the European Union emerge from the crisis, by ensuring a return to employment and sustainable growth. In your view, which of the following measures should be a priority? (Max 4 answers)
Invest in education, training, and research
Encourage the fight against youth unemployment
Support small and medium-sized businesses (SMEs)
MT 85% 26% 17%
DE 78% 37% 29%
NL 72% 45% 31%
DK 63% 48% 33%
EE 63% 42% 32%
UK 62% 43% 38%
LU 58% 54% 38%
IE 57% 47% 46%
EL 55% 70% 36%
EU27 52% 49% 41%
CY 52% 75% 48%
PT 52% 55% 49%
SE 52% 50% 38%
LT 51% 55% 35%
FR 50% 64% 51%
BG 49% 65% 40%
LV 49% 53% 36%
ES 48% 49% 65%
AT 48% 43% 44%
BE 46% 46% 34%
CZ 46% 45% 35%
RO 43% 43% 44%
SK 39% 62% 33%
FI 36% 54% 43%
IT 35% 37% 44%
HU 33% 70% 49%
SI 33% 63% 42%
PL 28% 56% 36%
� In 12 countries, ‘Encourage the fight against youth unemployment’ was the top answer among people aged between 15 and 24: CY, EL, HU, BG, FR, SI, SK, PL, LT, PT, FI, and LV.
� In 10 countries, ‘ Invest in education, research and training’ was the top answer among
young people: LU, SE, DK; IE, NL, AT, UK, EE, DE, MT. Among Belgium’s young people, this measure shared the top spot with ‘Encourage the fight against youth unemployment’ (46 %).
� Young people in Spain, Italy and Romania thought that the European Parliament ought to
promote ‘Support for SMEs’ as a priority.
� The Czech Republic was the only country in which the top answer among young people was ‘ reduce bureaucracy’ .
16
B. Towards a convergence of budgetary policies
1) European average
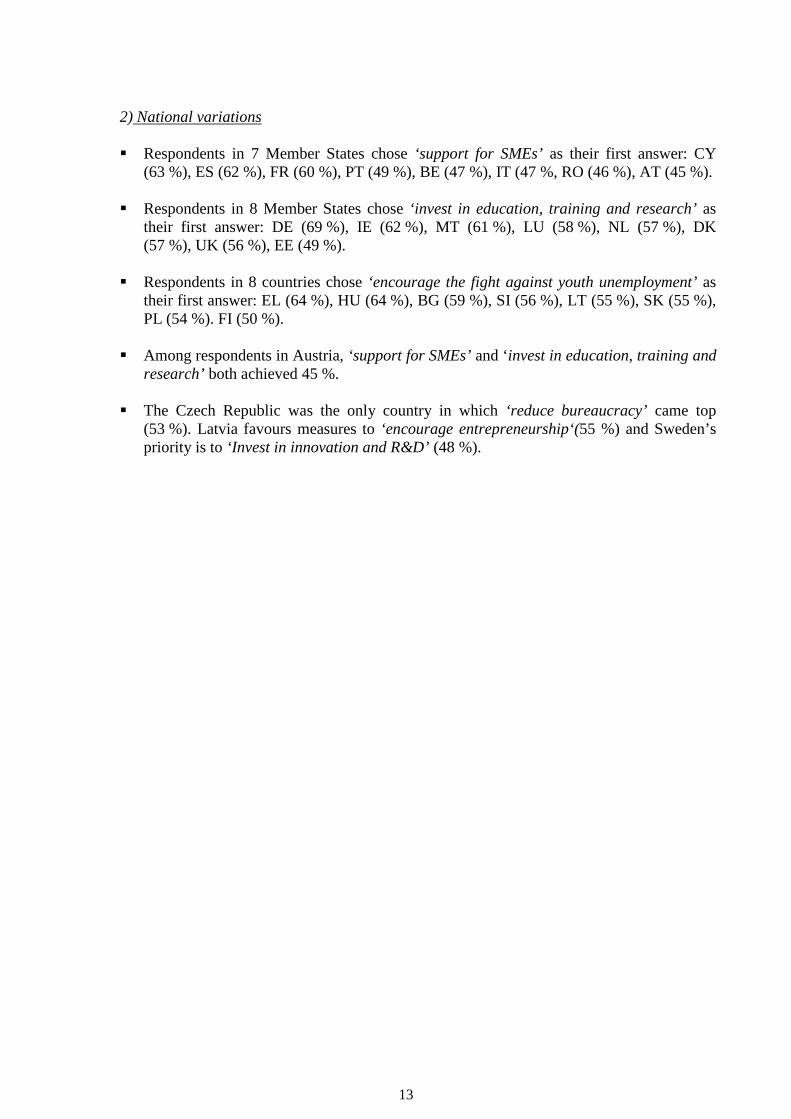
Q: Specifically regarding the convergence between the budgetary policies of the EU Member States tell me if you are in favour of or opposed to include a preliminary consultation between European institutions and national political institutions in the drafting process of national budgets.
*( ) Difference between September 2011 and March 2012
� There is a very clear difference between the euro zone (70 %) and the non-euro zone (56 %): 16 percentage points.
Total
‘In favour’ Total ‘Opposed’ DK
EU27 65% (-2) 21% (+3) 14% (-1) euro zone 70 % (-2) 17 % (+2) 13 % (=)
non-euro zone 56 % (-2) 28 % (+5) 16 %(-3)
Total ‘In favour’: 65% (-2)
Total ‘Opposed’: 21% (+3)

17
2) National variations
Total 'In Favour' Total 'Opposed' DK
EB76.1Sep 2011
EB77.2March 2012
Diff. EB77,2
- EB 76,1
EB76.1Sep 2011
EB77.2March 2012
Diff. EB77,2
- EB 76,1
EB76.1Sep 2011
EB77.2March 2012
Diff. EB77,2
- EB 76,1BE 74% 81% +7 22% 15% -7 4% 4% =DE 78% 78% = 17% 16% -1 5% 6% +1
SK 73% 75% +2 17% 16% -1 10% 9% -1HU 73% 74% +1 16% 17% +1 11% 9% -2EL 70% 72% +2 17% 16% -1 13% 12% -1IT 75% 72% -3 9% 11% +2 16% 17% +1BG 66% 71% +5 12% 12% = 22% 17% -5CY 80% 71% -9 8% 16% +8 12% 13% +1
NL 82% 70% -12 13% 23% +10 5% 7% +2PT 73% 69% -4 12% 12% 0 15% 19% +4LU 66% 67% +1 19% 24% +5 15% 9% -6FI 74% 66% -8 20% 26% +6 6% 8% +2
EU27 67% 65% -2 18% 21% +3 15% 14% -1MT 51% 65% +14 7% 17% +10 42% 18% -24
AT 67% 65% -2 25% 26% +1 8% 9% +1SE 61% 65% +4 33% 30% -3 6% 5% -1ES 64% 64% = 14% 17% +3 22% 19% -3LT 66% 64% -2 15% 14% -1 19% 22% +3SI 77% 63% -14 12% 28% +16 11% 9% -2CZ 65% 62% -3 27% 31% +4 8% 7% -1
DK 58% 61% +3 35% 33% -2 7% 6% -1FR 65% 61% -4 18% 21% +3 17% 18% +1PL 62% 60% -2 15% 22% +7 23% 18% -5EE 56% 59% +3 19% 21% +2 25% 20% -5LV 57% 52% -5 28% 29% +1 15% 19% +4RO 66% 52% -14 9% 23% +14 25% 25% =
IE 49% 47% -2 19% 29% +10 32% 24% -8UK 46% 47% +1 33% 36% +3 21% 17% -4
� In Romania (-14), Slovenia (-14) and the Netherlands (-12), there was a marked decrease in respondents in favour of preliminary consultation, while in Malta (+14) the opposite is true.
� There is a 34 percentage point difference between the top Member State (Belgium,
81 %) and the bottom one (United Kingdom, 47 %).

18
C. Compliance with common rules Q: And when it comes to enforcing the common rules for public debts and deficits, please tell me if you are in favour of or opposed to each of the following measures.
1) European average
� Making financial help to Member States in economic or financial difficulties conditional on complying with common rules
Total
‘In favour’ Total
‘Opposed’ DK
EU27 80 % 12 % 8 % euro zone 83 % 11 % 6 %
non-euro zone 73 % 16 % 11 % *( ) Difference between September 2011 and March 2012
� There is a difference of 10 percentage points between the euro zone (83 %) and the non-
euro zone (73 %).
� Automatic application of escalating financial penalties for EU Member States which fail to comply with jointly defined rules on debt and public deficit
Total
‘In favour’ Total
‘Opposed’ DK
EU27 72 % (+4) 19 % (=) 9 %(-4) euro zone 76 % (+4) 17 % (-1)) 7 % (-3)
non-euro zone 66 % (+5) 21 % (=) 13 %(-5) *( ) Difference between September 2011 and March 2012
� Once again there is a difference of 10 percentage points between the euro zone (76 %)
and the non-euro zone (66 %).

19
D. Sharing of debt by the Member States
Q: Please tell me to what extent you agree or disagree with each of the following statements on this topic. Setting aside a share of the public debt of all Member States to be held jointly…
� European citizens appear to be divided: they seem to think that sharing the debt could be a way out of the crisis but at the same time they are aware of the advantages and disadvantages of the possible consequences.

20
E. Tax on financial transactions
� Support for the tax on financial transactions? Q: Please tell me to what extent you are in favour or opposed to each of the following statements related to this tax. The principle of a tax on financial transactions (FTT)
1) European average
Total ‘In favour’
Total ‘Opposed’ DK
EU27 66 % (+5) 22 % (-4) 12 % (-1) euro zone 73 % (+10) 18 % (-7) 9 % (-3)
non-euro zone 53 % (-1) 30 % (=) 17 % (+1) * Difference between April-May 2011 and March 2012
� Respondents in euro zone Member States are markedly more in favour (73 %) of the principle of a tax on financial transactions than those in countries outside the euro zone (53 %): a difference of 20 percentage points.
Total ‘Opposed’: 22% (-4) Total ‘In favour’: 66% (+5)

21
2) National variations Q: The principle of a tax on financial transactions (FTT)
Total 'In Favour' Total 'Opposed' DK
EB75.2April-May
2011
EB77.2March 2012
Diff. EB77,2 - EB 75,2
EB75.2April-May
2011
EB77.2March 2012
Diff. EB77,2 - EB 75,2
EB75.2April-May
2011
EB77.2March 2012
Diff. EB77,2 - EB 75,2
EL 61% 81% +20 33% 14% -19 6% 5% -1
FR 69% 79% +10 22% 13% -9 9% 8% -1
DE 71% 78% +7 20% 15% -5 9% 7% -2
SK 69% 78% +9 24% 16% -8 7% 6% -1
AT 80% 74% -6 17% 22% +5 3% 4% +1
CY 54% 73% +19 34% 21% -13 12% 6% -6
LU 65% 73% +8 26% 20% -6 9% 7% -2
BE 67% 72% +5 30% 25% -5 3% 3% =
IT 61% 72% +11 22% 17% -5 17% 11% -6
HU 66% 70% +4 28% 26% -2 6% 4% -2
SE 67% 70% +3 27% 25% -2 6% 5% -1
PT 66% 68% +2 17% 16% -1 17% 16% -1
EU27 61% 66% +5 26% 22% -4 13% 12% -1
ES 50% 66% +16 32% 20% -12 18% 14% -4
CZ 60% 64% +4 33% 29% -4 7% 7% =
FI 63% 64% +1 28% 25% -3 9% 11% +2
DK 63% 63% = 31% 29% -2 6% 8% +2
LT 49% 62% +13 29% 18% -11 22% 20% -2
SI 44% 61% +17 39% 30% -9 17% 9% -8
NL 58% 60% +2 35% 33% -2 7% 7% =
EE 47% 53% +6 33% 28% -5 20% 19% -1
LV 56% 53% -3 34% 33% -1 10% 14% +4
UK 65% 53% -12 25% 31% +6 10% 16% +6
BG 34% 52% +18 23% 18% -5 43% 30% -13
PL 45% 52% +7 36% 31% -5 19% 17% -2
IE 55% 47% -8 19% 33% +14 26% 20% -6
RO 38% 35% -3 32% 32% = 30% 33% +3
MT 30% 33% +3 44% 47% +3 26% 20% -6
� The difference between the top and bottom Member States where support for the FTT is concerned is close to 50 percentage points: 81 % in Spain (+20) and 33 % in Malta (+3).
� In three countries (Ireland, Malta and Romania), support for the FTT does not reach a
majority of 50 %. Malta is the only one in which the majority is opposed to the FTT (47 %).
� In terms of variations there were marked increases in terms of support for the FTT in
Greece (+20), Cyprus (+19), Bulgaria (+18), Slovenia (+17) and Spain (+16).

22
1) European average
� Reasons for supporting the FTT
Basis: Questions put to the 66 % of respondents in favour of the FTT Q: What is the main reason behind your support for a tax on financial transactions? A tax on financial transactions would make it possible to ...
1) European average

23
� Reasons for objecting to the FTT Basis: Questions put to the 22 % of respondents against the introduction of the FTT at EU level
Q: What is the main reason behind your objection to a tax on financial transactions in the EU? A tax on financial transactions in the EU would...
1) European average
� Respondents opposed to the principle of a FTT (22 %) are very divided and do not seem to have a clear idea of the reasons for their opinion.
24
F. Eurobonds: awareness and opinion Q: Have you ever heard of Eurobonds?
1) European average
Eurobonds Yes, and you
know what they are
Yes, but you don’t really know what
they are No DK
EU27 15 % (=) 34 % (+7) 50 % (-7) 1 % (=)
Euro zone 17 % (=) 36 % (+7) 46 % (-7) 1 % (=)
Non Euro zone 13 % (=) 29 % (+7) 57 % (-7) 1 % (=)
*( ) Difference between September 2011 and March 2012
Total ‘OUI': 49% (+7)
No: (-7)

25
2) National variations
Q: Have you ever heard of Eurobonds?
NO Total 'Yes' DK
EB76.1Sep 2011
EB77.2March 2012
Diff. EB77,2
- EB 76,1
EB76.1Sep 2011
EB77.2March 2012
Diff. EB77,2
- EB 76,1
EB76.1Sep 2011
EB77.2March 2012
Diff. EB77,2
- EB 76,1DK 80% 77% -3 20% 22% +2 0% 1% +1FR 73% 69% -4 27% 31% +4 0% 0% =LV 68% 69% +1 32% 31% -1 0% 0% =PT 75% 69% -6 24% 30% +6 1% 1% =RO 77% 68% -9 19% 27% +8 4% 5% +1SE 68% 63% -5 31% 36% +5 1% 1% =LT 68% 58% -10 32% 41% +9 0% 1% +1UK 62% 58% -4 38% 42% +4 0% 0% =HU 66% 57% -9 33% 42% +9 1% 1% =PL 63% 54% -9 36% 44% +8 1% 2% +1LU 49% 53% +4 50% 46% -4 1% 1% =MT 58% 53% -5 42% 46% +4 0% 1% +1BE 62% 52% -10 38% 48% +10 0% 0% =
EU27 57% 50% -7 42% 49% +7 1% 1% =ES 57% 50% -7 42% 48% +6 1% 2% +1EE 57% 49% -8 43% 51% +8 0% 0% =CY 59% 47% -12 41% 52% +11 0% 1% +1SI 51% 45% -6 49% 55% +6 0% 0% =IT 55% 43% -12 43% 55% +12 2% 2% =FI 52% 42% -10 48% 58% +10 0% 0% =BG 61% 40% -21 38% 59% +21 1% 1% =AT 55% 39% -16 43% 60% +17 2% 1% -1SK 56% 39% -17 44% 60% +16 0% 1% +1NL 36% 38% +2 64% 61% -3 0% 1% +1IE 42% 34% -8 57% 64% +7 1% 2% +1CZ 46% 33% -13 53% 67% +14 1% 0% -1DE 37% 32% -5 62% 67% +5 1% 1% =EL 28% 19% -9 72% 81% +9 0% 0% =
• Those most likely to have heard of Eurobonds are Greeks (81 %), followed by Czechs and Germans (67 %), and Irish (64 %).
• Those most likely to say they never heard of Eurobonds are Danes (77 %), followed by
the French, Latvian, Portuguese (all 69 %) and Romanians (68 %). • Knowledge of Eurobonds increased in 24 of the 27 Member States. The highest
increases were in Bulgaria (+21 percentage points), Austria (+17) and Slovakia (+16). Decreases were recorded in only three Member States: Latvia (-1), the Netherlands (-3) and Luxembourg (-4).

26
3) Socio-demographic variations • At the socio-demographic level, many more men than women have heard of Eurobonds:
57 % as against 42 %. The age at which people finished their studies is also a very important criterion (Eurobonds are known to 62 % of respondents who studied until they were at least 20, but among people who finished school before the age of 15 this figure drops to just 37 %). The same applies when it comes to the level of people’s occupation (68 % of managers and 65 % of self-employed people have heard of Eurobonds, as against only 38 % of unemployed people).
� Support for the creation of Eurobonds
1) European average Q: Would you say that you are in favour of or opposed to the creation of Eurobonds, on the basis of what you know about them? Basis: Question put only to those interviewed in the euro zone who had heard of Eurobonds
� More than one third of respondents do not have an opinion on the creation of
Eurobonds (31 %; +2).
2) Socio-demographic variations � More men (48 %) than women (39 %) are in favour of the creation of Eurobonds.
The same applies to respondents who ended their education after the age of 20 (50 %) compared to those who left school before the age of 15 (38 %).

27
III. Credit rating agencies
A. Awareness of credit rating agencies
Q: Have you ever heard of credit rating agencies?
1) European average
� In contrast to the answers on awareness of Eurobonds, the ‘real knowledge’ of credit rating agencies (‘Yes and you know what they are’) increases by 5 percentage points (from 27 % to 32 %).
CRA Yes, and you
know what they are
Yes, but you don’t really know what
they are No DK
EU27 32 % (+5) 29 % (+6) 38 % (-11) 1 % (=)
euro zone 32 % (+7) 31 % (+7) 36 % (-14) 1 % (=)
non-euro zone 31 % (+2) 26 % (+5) 41 % (-8) 2 % (+1)
*( ) Difference between September 2011 and March 2012
(+5)
(+6)
(-11)
(+5)
(=)
Total ‘Yes’: 61% (+11)

28
2) National variations
Q: Have you ever heard of credit rating agencies?
Total 'YES' NO DK
EB76.1Sep 2011
EB77.2March 2012
Diff. EB77.2 - EB 76.1
EB76.1Sep 2011
EB77.2March 2012
Diff. EB77.2 - EB 76.1
EB76.1Sep 2011
EB77.2March 2012
Diff. EB77.2 - EB 76.1
HU 47% 69% +22 52% 30% -22 1% 1% =
SI 38% 60% +22 62% 39% -23 0% 1% +1
AT 55% 76% +21 44% 23% -21 1% 1% =IT 36% 56% +20 61% 41% -20 3% 3% =
FR 40% 60% +20 60% 40% -20 0% 0% =
SK 46% 64% +18 54% 35% -19 0% 1% +1
CY 33% 50% +17 66% 49% -17 1% 1% =
DE 63% 79% +16 37% 21% -16 0% 0% =
BE 41% 55% +14 59% 44% -15 0% 1% +1EL 49% 63% +14 51% 36% -15 0% 1% +1
BG 34% 48% +14 63% 48% -15 3% 4% +1
FI 62% 73% +11 38% 27% -11 0% 0% =
UE27 50% 61% +11 49% 38% -11 1% 1% =
MT 27% 38% +11 72% 60% -12 1% 2% +1RO 27% 36% +9 69% 59% -10 4% 5% +1
PL 26% 35% +9 73% 63% -10 1% 2% +1
LU 47% 54% +7 52% 45% -7 1% 1% =
CZ 42% 49% +7 58% 51% -7 0% 0% =
LT 22% 27% +5 78% 72% -6 0% 1% +1
UK 74% 78% +4 26% 22% -4 0% 0% =DK 68% 72% +4 32% 27% -5 0% 1% +1
EE 28% 31% +3 72% 69% -3 0% 0% =
SE 77% 79% +2 23% 21% -2 0% 0% =
NL 77% 78% +1 22% 22% = 1% 0% -1
PT 51% 52% +1 48% 47% -1 1% 1% =
ES 45% 46% +1 54% 52% -2 1% 2% +1LV 44% 44% = 56% 55% -1 0% 1% +1
IE 69% 68% -1 30% 30% = 1% 2% +1
� The percentage of citizens who have already heard of Eurobonds is increasing in 25
Member States in 27.
� Sweden, Germany (79 %), the United Kingdom, the Netherlands (78 %) and Austria (76 %) are the countries in which there is the highest level of awareness of credit rating agencies.
� Latvia (27 %), Estonia (31 %) and Poland (35 %) are the countries in which there is the lowest level of awareness of credit rating agencies.
� The most marked increase was 22 percentage points in Hungary and Slovenia, with the
level of awareness of CRAs standing at 69 % and 60 % respectively. There was an increase of 21 percentage points in Austria (76 %) and 20 percentage points in Italy (56 %) and France (60 %).
� Awareness of CRAs decreased by just 1 point only in 1 Member State (Ireland ) (from
69 % to 68 %).

29
3) Socio-demographic variations
� As was the case with Eurobonds, the socio-demographic variations with respect to awareness of CRAs are very significant. Many more men than women have heard of CRAs: 68 % as against 55 %.
� The age at which people complete their studies also has an impact on respondents’
answers: 76 % of those who studied until they were at least 20 have heard of CRAs, as against only 44 % of those who left school before they were 15.
� Answers also varied according to the level of people’s occupation: (85 % of managers
and 75 % of self-employed people have heard of CRAs, as against only 52 % of unemployed people).

30
B. The role of credit rating agencies
1) European average Q: Please tell me to what extent you agree or disagree with each of the following statements on credit rating agencies, on the basis of what you know about them. Basis: Question put to 61 % of respondents who had heard of credit rating agencies (CRAs)
� Ambivalence about the role and purpose of CRAs
• People were ambivalent about CRAs – both as regards the role the CRAs played in the development of the crisis and the way in which the purpose of the CRAs is perceived.

31
Q: Please tell me to what extent you agree or disagree with each of the following statements on credit rating agencies, on the basis of what you know about them. Basis: Question put to 61 % of respondents who had heard of CRAs
Total ‘Agree’ Total ‘Disagree’ DK
CRAs’ role EURO ZONE
NON EURO ZONE
EURO ZONE NON
EURO ZONE
EURO ZONE NON
EURO ZONE
Credit rating agencies have played a significant role in the development of the financial crisis
70 % (-1) 58 % (+1) 17 % (=) 19 % (-3) 13 % (-1) 23 % (+2)
Information provided by credit rating agencies is useful to economic actors as support for their financial decision-making
61 % (-1) 63 % (-3) 26 % (+2) 18 % (+4) 13 % (-1) 19 % (+1)
*( ) Difference between September 2011 and March 2012

32
1) European average Q: In a serious crisis, credit rating agencies should not rate the EU Member States which are financially helped by other Member States Basis: Question put to 61 % of respondents who had heard of CRAs
CRAs’ role Total ‘Agree‘ Total ‘Disagree‘ ‘ DK
EU27 54 % 29 % 17 %
euro zone 58 % 27 % 15 %
non-euro zone 45 % 33 % 22 %
Total ‘Agree’: 54%
Total ‘Disagree’: 29%

33
2) National variations Q: In a serious crisis, credit rating agencies should not rate the EU Member States which are financially helped by other Member States Basis: Question put to 61 % of respondents who had heard of CRAs
� In 24 Member States out of 27 most of the respondents who had heard of CRAs thought
that credit rating agencies should not rate EU Member States which are financially helped by other Member States.
� The Europeans hardest hit by the crisis are the most in favour of this measure, i.e. those
in Greece (76 %), Cyprus (74 %) and Portugal (66 %), with Spain and Italy both at 62 %.

34
1) European average Q: The creation of an independent European credit rating agency would counterbalance the power of the existing agencies Basis: Question put to 61 % of respondents who had heard of CRAs
Total ‘Agree’ Total ‘Disagree’ DK CRAs’ role
EURO ZONE NON-EURO ZONE
EURO ZONE NON-EURO ZONE
EURO ZONE NON-EURO ZONE
The creation of an independent European credit rating agency would counterbalance the power of the existing agencies
72 % (+1) 56 % (+2) 15 % (+1) 22 % (-3) 13 % (-2) 22 % (+1)
*( ) Difference between September 2011 and March 2012.
Total ‘Agree’: 67% (+2)
Total ‘Disagree’: 17% (=)

35
ANNEXES
Eurostat data The three following tables show the evolution in time of different key figures related to the economic and social EU context. They are extracted from the updated Eurostat data and designed by the Public Opinion Monitoring Unit. First table: Evolution of the public debt, budgetary deficit, and gross domestic product Second table: Evolution of total unemployment Third table: Evolution of unemployment according to age groups

36
Evolution of the public debt, budgetary deficit, and gross domestic product
Evolution of the budgetary deficit Gross Domestic Product (GDP) Forecast*
Public debt (% of the GDP)
Difference of the public debt (% of the GDP)
Budgetary deficit (% of the GDP)
Difference of the budgetary deficit
(% of the GDP)Percentage change compared with the previous year
Countries 2011variation in percentage points
(2010-2011)2011
variation in percentage points(2010-2011)
variation % (2011 - 2012)
variation % (2012 - 2013)
European Union 82,5 +2,5 4,5 -2,00 -0,03% +1,27%
Belgium 98,2 +2,30 3,7 -0,10 -0,02% +1,24%
Bulgaria 16,3 = 2,1 -1,00 +0,50% :
Czech Republic 41,2 +3,10 3,1 -1,70 +2,81% -0,46%
Denmark 46,5 +3,60 1,8 -0,70 +1,09% +1,62%
Germany 81,2 -1,8 1,0 -3,30 +0,68% +1,67%
Estonia 6 -0,7 -1 +0,8 +1,62% +3,79%
Ireland 108,2 +15,70 13,1 -18,10 +0,53% +1,91%
Greece 165,3 +20,30 9,1 -1,20 -4,74% =
Spain 68,5 +7,30 8,5 -0,80 -1,76% -0,33%
France 86,4 +3,90 5,2 -1,90 +0,47% +1,34%
Italy 120,1 +1,50 3,9 -0,70 -1,41% +0,44%
Cyprus 71,6 +10,10 6,3 -1,00 : :
Latvia 42,6 -2,1 3,5 -4,70 +2,59% +4,74%
Lithuania 38,5 +0,50 -5,5 -1,70 +2,40% +3,51%
Luxembourg 18,2 -0,9 0,6 -0,30 +1,06% +2,10%
Hungary 80,6 -0,8 -4,3 -8,50 -1,66% -3,41%
Malta 72 +2,60 2,7 -1,00 +1,22% +1,90%
Netherlands 65,2 +2,30 4,7 -0,40 -0,89% +0,71%
Austria 72,2 +0,30 2,6 -1,90 +0,78% +1,67%
Poland 56,3 +1,50 5,1 -2,70 -0,41% +0,65%
Portugal 107,8 +14,50 4,2 -5,60 -3,26% +0,25%
Romania 33,3 +2,80 5,2 -1,60 +0,72% +0,24%
Slovenia 47,6 +8,80 6,4 +0,4 -1,40% +0,66%
Slovakia 43,3 +2,20 4,8 -2,90 +1,81% +2,87%
Finland 48,6 +0,20 0,5 -2,00 +0,76% +1,60%
Sweden 38,4 -1 -0,3 = +5,92% +4,49%
United Kingdom 85,7 +6,10 8,3 -1,90 -0,66% +5,55%
Evolution of the public debt
EUROSTAT data; date of extraction: 16 05 2012;: = not available; * forecast

37
Evolution of total unemployment
Evolution of the unemployment
Unemployment rate Percentage change compared
with the previous quarter
Percentage change compared
with the same quarter of the
previous year
Countries March 2012variation in percentage points
(2011 Q4 - 2012 Q1)
variation in percentage points
(2011 Q1 - 2012 Q1)
European Union 10,20% +0,20 +0,70
Euro area 10,90% +0,30 +0,90
Belgium 7,30% +0,10 +0,20
Bulgaria 12,60% +0,80 +1,20
Czech Republic 6,70% +0,10 -0,20
Denmark 8,10% +0,10 +0,40
Germany 5,60% = -0,40
Estonia : : :
Ireland 14,50% -0,1 +0,40
Greece : : :
Spain 24,10% +0,80 +2,80
France 10,00% +0,20 +0,40
Italy 9,80% : :
Cyprus 10,00% +0,50 +2,50
Latvia : : :
Lithuania : : :
Luxembourg 5,20% +0,30 +0,40
Hungary 11,20% +0,30 +0,30
Malta 6,80% +0,20 +0,10
Netherlands 5,00% +0,10 +0,80
Austria 4,00% : :
Poland 10,10% +0,10 +0,50
Portugal 15,30% +0,90 +2,40
Romania 7,50% -0,2 -0,20
Slovenia 8,50% -0,1 +0,60
Slovakia 13,90% = +0,70
Finland 7,50% -0,1 -0,30
Sweden 7,30% = =
United Kingdom : : :
EUROSTAT data; date of extraction: 10 05 2012; : = not available

38
Evolution of unemployment according to age groups
COUNTRIES Dec-11 Jan-12 Feb-12 Mar-12 Dec-11 Jan-12 Feb-12 Mar-12
Greece 47,0 51,2 : : 19,7 21,7 : :
Spain 48,4 50,3 50,9 51,1 22,7 23,5 23,8 24,1
Portugal 32,9 35,1 35,4 36,1 13,6 14,8 15,0 15,3
Italy 30,6 32,9 33,9 35,9 8,8 9,5 9,6 9,8
Lithuania 34,3 : : : 14,3 : : :
Slovakia 33,8 34,0 34,1 33,9 13,9 14,0 14,0 13,9
Bulgaria 26,9 31,1 32,3 32,8 11,3 12,2 12,5 12,6
Ireland 30,0 31,4 31,3 30,3 14,7 14,7 14,7 14,5
Chyprus 26,9 28,8 28,8 28,8 9,0 9,6 9,8 10,0
Hungary 26,6 28,4 28,1 28,4 10,9 11,3 11,1 11,2
Latvia 27,3 : : : 14,6 : : :
Poland 26,7 27,2 27,2 26,7 9,9 10,1 10,1 10,1
Estonia 24,9 : : : 11,7 : : :
Romania 24,8 : : : 7,3 7,2 7,1 7,5
Sweden 22,3 22,4 23,5 22,8 7,5 7,6 7,5 7,3
European Union 22,0 22,4 22,5 22,6 9,9 10,1 10,2 10,2
United Kingdom 22,0 21,9 : : 8,3 8,2 : :
France 22,8 22,2 21,9 21,8 9,8 10,0 10,0 10,0
Finland 19,9 19,7 19,6 19,4 7,6 7,5 7,5 7,5
Czech Republic 18,1 18,8 19,1 19,0 6,5 6,7 6,8 6,7
Luxembourg 15,7 16,6 16,9 17,4 4,9 5,1 5,2 5,2
Belgium 18,2 17,0 17,0 17,1 7,2 7,3 7,3 7,3
Slovania 16,4 16,5 16,5 16,5 8,6 8,7 8,7 8,5
Denmark 14,4 14,6 14,7 15,1 7,7 7,9 7,9 8,1
Malta 13,8 14,7 14,4 13,6 6,4 6,8 6,8 6,8
Netherlands 8,2 9,0 9,4 9,3 4,8 5,0 4,9 5,0
Austria 9,0 8,9 8,7 8,6 4,3 4,1 4,1 4,0
Germany 8,4 8,1 8,0 7,9 5,7 5,6 5,6 5,6
Total PopulationLess than 25 years old
EUROSTAT data; date of extraction: 10 05 2012; : = not available