Embed Size (px)
Citation preview

CRISIL-AMFIMutual FundPerformanceInsights
11-Mar-13 24129.38046 19646.21 5942.35 4661.25 24129.38046 5732.755376 6125.186827 7276.15435 10-Mar-08 17574.15074 6.55% 15923.72 4.29% 4800.4 4.36% 3927.9 3.48%
12-Mar-13 24012.22878 19564.92 5914.1 4636.9 24012.22878 5709.03499 6096.067618 7238.144298 11-Mar-08 17997.80863 5.94% 16123.15 3.95% 4865.9 3.98% 4024.4 2.87%
13-Mar-13 23731.19443 19362.55 5851.2 4585 23731.19443 5649.983513 6031.232284 7157.129031 12-Mar-08 17905.79871 5.80% 16127.98 3.72% 4872 3.73% 4010.15 2.72%
14-Mar-13 23928.91147 19570.44 5908.95 4625.75 23928.91147 5710.645723 6090.759161 7220.739284 13-Mar-08 17014.35037 7.06% 15357.35 4.97% 4623.6 5.03% 3785.1 4.09%
15-Mar-13 23781.09482 19427.56 5872.6 4598.2 23781.09482 5668.953403 6053.290728 7177.73407 14-Mar-08 17248.91958 6.63% 15760.52 4.27% 4745.8 4.35% 3868.65 3.52%
18-Mar-13 23653.37315 19293.2 5835.25 4572.65 23653.37315 5629.747214 6014.791527 7137.850832 17-Mar-08 16221.33971 7.84% 14809.49 5.43% 4503.1 5.32% 3642.35 4.65%
19-Mar-13 23313.28754 19008.1 5745.95 4500.85 23313.28754 5546.55516 5922.743906 7025.771908 18-Mar-08 16159.47253 7.61% 14833.46 5.08% 4533 4.86% 3642.8 4.32%
20-Mar-13 22974.63334 18884.19 5694.4 4446.05 22974.63334 5510.398277 5869.607793 6940.229777 19-Mar-08 16163.91335 7.29% 14994.83 4.72% 4573.95 4.48% 3657.8 3.98%
21-Mar-13 22839.57303 18792.87 5658.75 4413.5 22839.57303 5483.751142 5832.860898 6889.419625 20-Mar-08 16163.91335 7.16% 14994.83 4.62% 4573.95 4.35% 3657.8 3.83%
22-Mar-13 22767.13146 18735.6 5651.35 4404.5 22767.13146 5467.039781 5825.233211 6875.370735 21-Mar-08 16163.91335 7.09% 14994.83 4.56% 4573.95 4.32% 3657.8 3.79%
25-Mar-13 22687.39782 18681.42 5633.85 4390.3 22687.39782 5451.230081 5807.194764 6853.204708 24-Mar-08 16088.82638 7.12% 15289.4 4.09% 4609.85 4.09% 3656.45 3.73%
26-Mar-13 22715.17387 18704.53 5641.6 4394.6 22715.17387 5457.973569 5815.183219 6859.916955 25-Mar-08 16962.35926 6.01% 16217.49 2.89% 4877.5 2.95% 3879.75 2.52%
28-Mar-13 22948.88216 18835.77 5682.55 4438.35 22948.88216 5496.269343 5857.393187 6928.210171 27-Mar-08 16970.59362 6.22% 16015.56 3.30% 4830.25 3.30% 3862.25 2.82%
01-Apr-13 23080.98672 18864.75 5704.4 4465.6 23080.98672 5504.725694 5879.915477 6970.747089 31-Mar-08 17030.28075 6.27% 15644.44 3.81% 4734.5 3.80% 3825.85 3.14%
02-Apr-13 23331.74918 19040.95 5748.1 4508.8 23331.74918 5556.140776 5924.960058 7038.181761 1-Apr-08 16911.28584 6.65% 15626.62 4.03% 4739.55 3.93% 3817.45 3.38%
03-Apr-13 23089.8002 18801.64 5672.9 4457.2 23089.8002 5486.310224 5847.446271 6957.634791 2-Apr-08 16976.35404 6.34% 15750.4 3.61% 4754.2 3.60% 3835.5 3.05%
04-Apr-13 22718.56304 18509.7 5574.75 4378.65 22718.56304 5401.122261 5746.276349 6835.0192 3-Apr-08 16927.90444 6.06% 15832.55 3.17% 4771.6 3.16% 3840.3 2.66%
05-Apr-13 22695.84448 18450.23 5553.25 4366.65 22695.84448 5383.768941 5724.114828 6816.287347 4-Apr-08 16558.67784 6.51% 15343.12 3.76% 4647 3.63% 3747.95 3.10%
08-Apr-13 22664.65676 18437.78 5542.95 4361.15 22664.65676 5380.136037 5713.497913 6807.701914 7-Apr-08 16856.59294 6.10% 15757.08 3.19% 4761.2 3.09% 3830.5 2.63%
09-Apr-13 22463.21843 18226.48 5495.1 4323.4 22463.21843 5318.478791 5664.175643 6748.774625 8-Apr-08 16788.5522 6.00% 15587.62 3.18% 4709.65 3.13% 3807.1 2.58%
10-Apr-13 22651.3634 18414.45 5558.7 4366.45 22651.3634 5373.328353 5729.732516 6815.975149 9-Apr-08 16974.54697 5.94% 15790.51 3.12% 4747.05 3.21% 3844.4 2.58%
11-Apr-13 22776.18963 18542.2 5594 4388.05 22776.18963 5410.605747 5766.118641 6849.692485 10-Apr-08 16943.34009 6.10% 15695.1 3.39% 4733 3.40% 3830.75 2.75%
12-Apr-13 22579.27643 18242.56 5528.55 4352.7 22579.27643 5323.170927 5698.654847 6794.511567 11-Apr-08 17083.11923 5.74% 15807.64 2.91% 4777.8 2.96% 3861.7 2.42%
15-Apr-13 22700.45412 18357.8 5568.4 4376.05 22700.45412 5356.797908 5739.730969 6830.960632 14-Apr-08 17083.11923 5.85% 15807.64 3.04% 4777.8 3.11% 3861.7 2.53%
16-Apr-13 23019.23462 18744.93 5688.95 4457.5 23019.23462 5469.762271 5863.990105 6958.103088 15-Apr-08 17317.42102 5.86% 16153.66 3.02% 4879.65 3.12% 3938 2.51%
17-Apr-13 23076.22963 18731.16 5688.7 4461.75 23076.22963 5465.744191 5863.732413 6964.737286 16-Apr-08 17430.52619 5.77% 16244.19 2.89% 4887.3 3.08% 3959.75 2.42%
18-Apr-13 23349.30557 19016.46 5783.1 4526.8 23349.30557 5548.994605 5961.036953 7066.279542 17-Apr-08 17664.51357 5.74% 16481.2 2.90% 4958.4 3.12% 4027.9 2.36%
22-Apr-13 23565.77975 19169.83 5834.4 4574.4 23565.77975 5593.747903 6013.915374 7140.582561 21-Apr-08 17984.31816 5.55% 16739.33 2.75% 5037 2.98% 4099.75 2.22%
23-Apr-13 23526.66078 19179.36 5836.9 4572.4 23526.66078 5596.528752 6016.492295 7137.460585 22-Apr-08 18092.48235 5.39% 16783.87 2.70% 5049.3 2.94% 4120.85 2.10%
25-Apr-13 23730.70978 19406.85 5916.3 4624.3 23730.70978 5662.910234 6098.335309 7218.475852 24-Apr-08 17963.40753 5.73% 16721.08 3.02% 4999.85 3.42% 4083.6 2.52%
26-Apr-13 23608.11837 19286.72 5871.45 4591.65 23608.11837 5627.856353 6052.105345 7167.5096 25-Apr-08 18205.55019 5.33% 17125.98 2.40% 5111.7 2.81% 4162.55 1.98%
29-Apr-13 23740.7755 19387.5 5904.1 4620.9 23740.7755 5657.263912 6085.759934 7213.168493 28-Apr-08 18193.48195 5.47% 17015.96 2.64% 5089.65 3.01% 4156.9 2.14%
30-Apr-13 23834.55901 19504.18 5930.2 4641.75 23834.55901 5691.311085 6112.66299 7245.715089 29-Apr-08 18424.7027 5.28% 17378.46 2.33% 5195.5 2.68% 4233.25 1.86%

GrowthLong Term
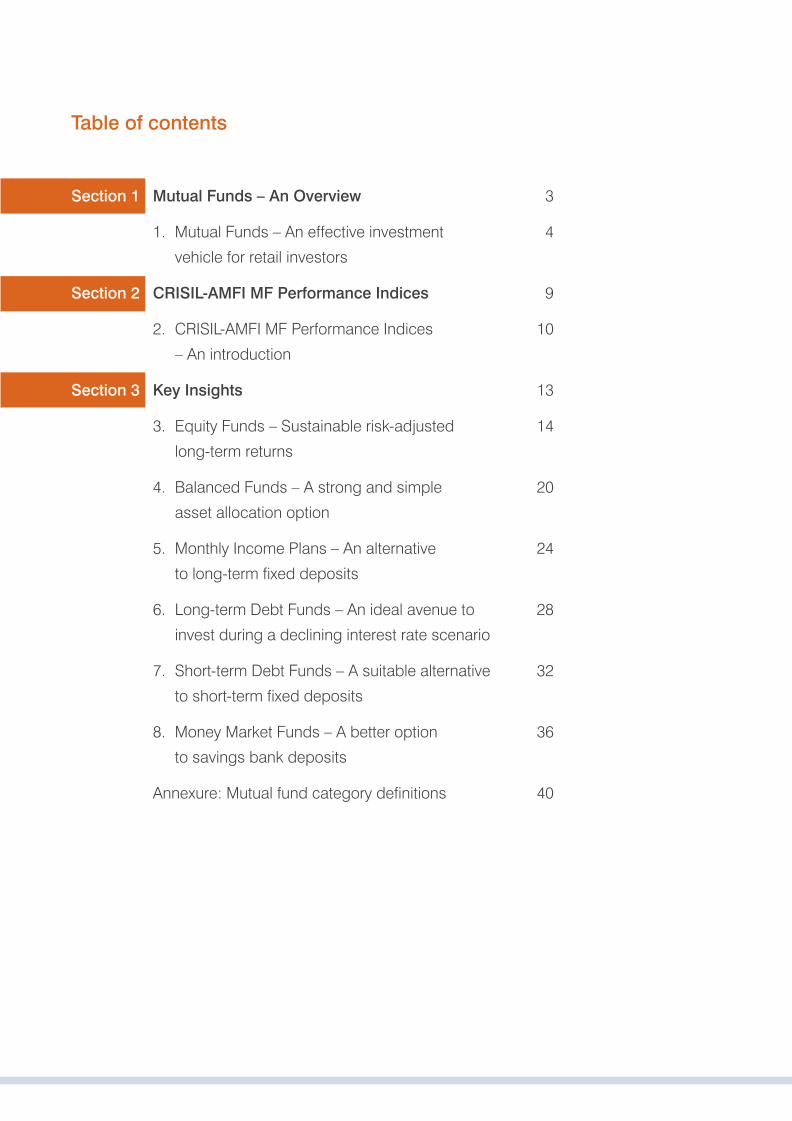
Table of contents
Section 1 Mutual Funds – An Overview 3
1. Mutual Funds – An effective investment 4
vehicle for retail investors
Section 2 CRISIL-AMFI MF Performance Indices 9
2. CRISIL-AMFI MF Performance Indices 10
– An introduction
Section 3 Key Insights 13
3. Equity Funds – Sustainable risk-adjusted 14
long-term returns
4. Balanced Funds – A strong and simple 20
asset allocation option
5. Monthly Income Plans – An alternative 24
to long-term fixed deposits
6. Long-term Debt Funds – An ideal avenue to 28
invest during a declining interest rate scenario
7. Short-term Debt Funds – A suitable alternative 32
to short-term fixed deposits
8. Money Market Funds – A better option 36
to savings bank deposits
Annexure: Mutual fund category definitions 40
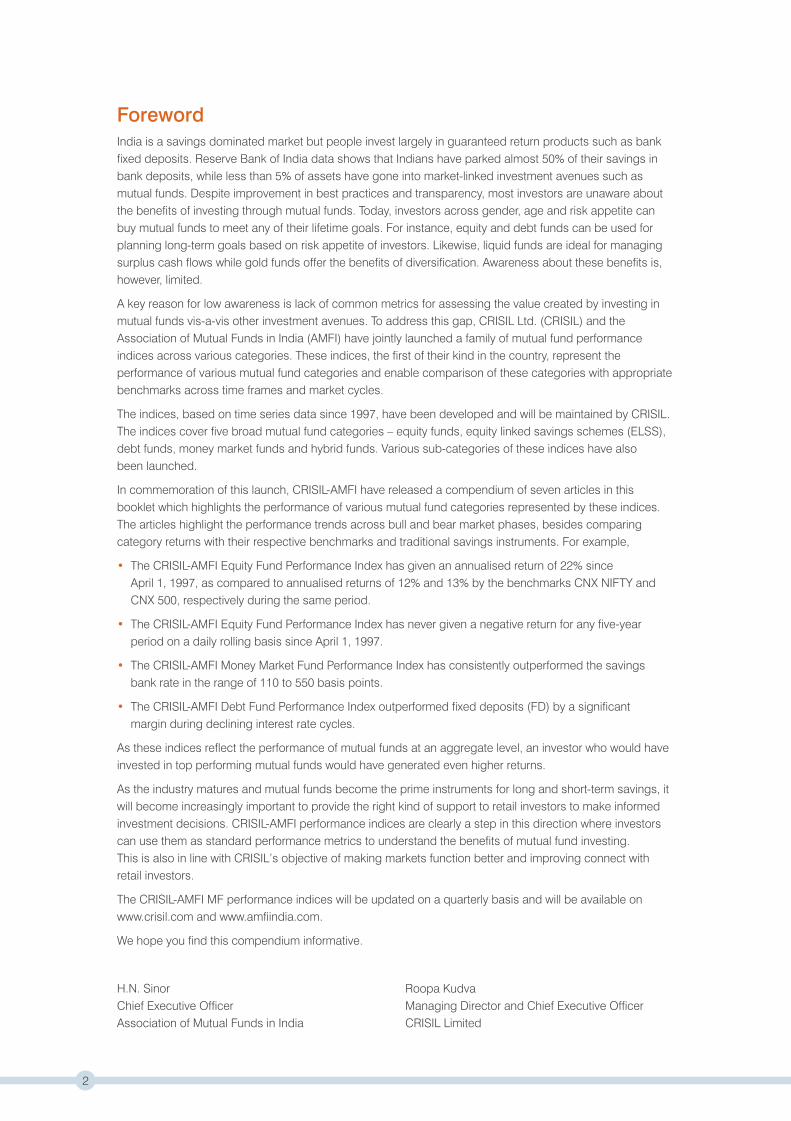
ForewordIndia is a savings dominated market but people invest largely in guaranteed return products such as bank fixed deposits. Reserve Bank of India data shows that Indians have parked almost 50% of their savings in bank deposits, while less than 5% of assets have gone into market-linked investment avenues such as mutual funds. Despite improvement in best practices and transparency, most investors are unaware about the benefits of investing through mutual funds. Today, investors across gender, age and risk appetite can buy mutual funds to meet any of their lifetime goals. For instance, equity and debt funds can be used for planning long-term goals based on risk appetite of investors. Likewise, liquid funds are ideal for managing surplus cash flows while gold funds offer the benefits of diversification. Awareness about these benefits is, however, limited.
A key reason for low awareness is lack of common metrics for assessing the value created by investing in mutual funds vis-a-vis other investment avenues. To address this gap, CRISIL Ltd. (CRISIL) and the Association of Mutual Funds in India (AMFI) have jointly launched a family of mutual fund performance indices across various categories. These indices, the first of their kind in the country, represent the performance of various mutual fund categories and enable comparison of these categories with appropriate benchmarks across time frames and market cycles.
The indices, based on time series data since 1997, have been developed and will be maintained by CRISIL. The indices cover five broad mutual fund categories – equity funds, equity linked savings schemes (ELSS), debt funds, money market funds and hybrid funds. Various sub-categories of these indices have alsobeen launched.
In commemoration of this launch, CRISIL-AMFI have released a compendium of seven articles in this booklet which highlights the performance of various mutual fund categories represented by these indices. The articles highlight the performance trends across bull and bear market phases, besides comparing category returns with their respective benchmarks and traditional savings instruments. For example,
• The CRISIL-AMFI Equity Fund Performance Index has given an annualised return of 22% since April 1, 1997, as compared to annualised returns of 12% and 13% by the benchmarks CNX NIFTY and CNX 500, respectively during the same period.
• The CRISIL-AMFI Equity Fund Performance Index has never given a negative return for any five-year period on a daily rolling basis since April 1, 1997.
• The CRISIL-AMFI Money Market Fund Performance Index has consistently outperformed the savings bank rate in the range of 110 to 550 basis points.
• The CRISIL-AMFI Debt Fund Performance Index outperformed fixed deposits (FD) by a significant margin during declining interest rate cycles.
As these indices reflect the performance of mutual funds at an aggregate level, an investor who would have invested in top performing mutual funds would have generated even higher returns.
As the industry matures and mutual funds become the prime instruments for long and short-term savings, it will become increasingly important to provide the right kind of support to retail investors to make informed investment decisions. CRISIL-AMFI performance indices are clearly a step in this direction where investors can use them as standard performance metrics to understand the benefits of mutual fund investing.This is also in line with CRISIL’s objective of making markets function better and improving connect with retail investors.
The CRISIL-AMFI MF performance indices will be updated on a quarterly basis and will be available on www.crisil.com and www.amfiindia.com.
We hope you find this compendium informative.
H.N. Sinor Roopa KudvaChief Executive Officer Managing Director and Chief Executive OfficerAssociation of Mutual Funds in India CRISIL Limited
2

Mutual Funds – An Overview
3

An effective investmentvehicle for retail investors
MutualFunds1India has one of the highest savings rate globally. This penchant for wealth creation
makes it necessary for Indian investors to look beyond the traditionally favoured bank
FDs and gold towards mutual funds. However, lack of awareness has made mutual
funds a less preferred investment avenue.
Mutual funds offer multiple product choices for investment across the financial
spectrum. As investment goals vary – post-retirement expenses, money for children’s
education or marriage, house purchase, etc. – the products required to achieve these
goals vary too. The Indian mutual fund industry offers a plethora of schemes and
caters to all types of investor needs.
What are mutual funds? A mutual fund is a professionally managed investment product that collects money
from a number of investors and invests the same in equities, bonds, money market
instruments and/or other securities. Mutual funds are ideal for investors who either
lack large sums for investment, or for those who neither have the inclination nor the
time to research the market, yet want to grow their wealth. The money collected in
mutual funds is invested by professional fund managers in line with the scheme’s
stated objective. In return, the fund house charges a small fee which is deducted from
the investment. The fees charged by mutual funds are regulated and are subject to
certain limits specified by the Securities and Exchange Board of India (SEBI).
Investors of all categories can invest on their own but a mutual fund is a good choice
for the only reason that all benefits come in a package. Read on to see how.
4
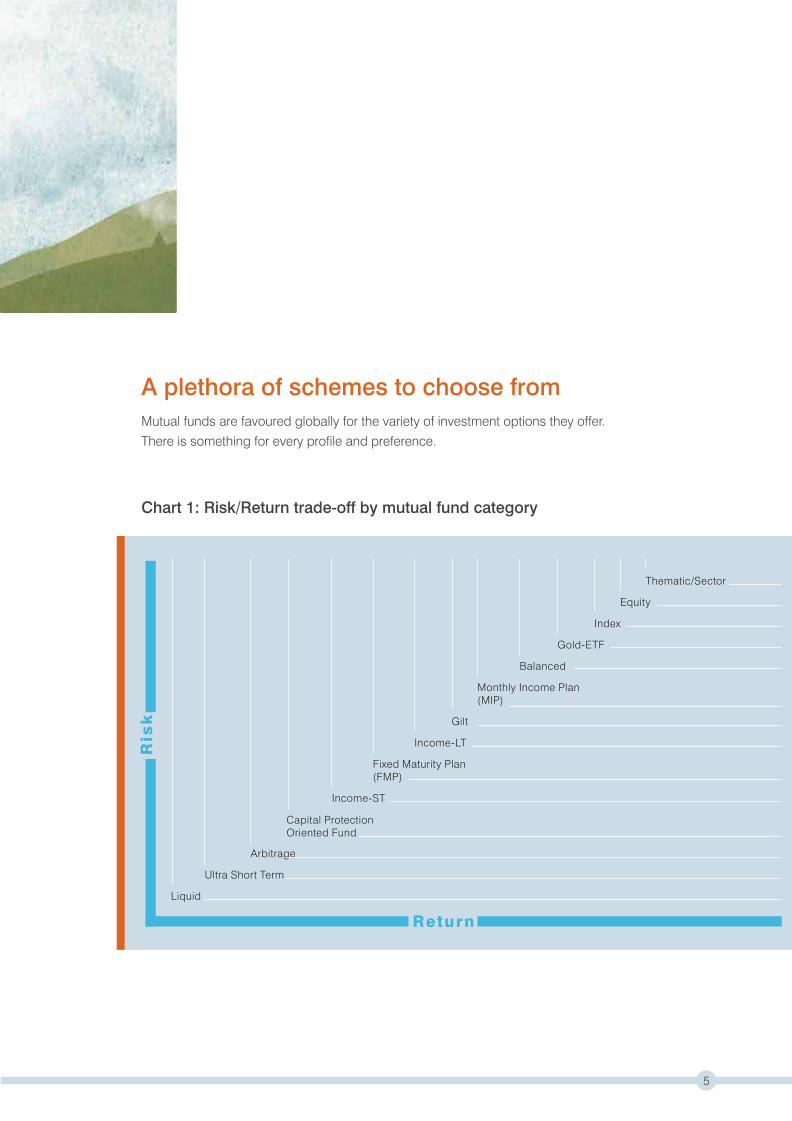
A plethora of schemes to choose fromMutual funds are favoured globally for the variety of investment options they offer.
There is something for every profile and preference.
Chart 1: Risk/Return trade-off by mutual fund category
Liquid
Ultra Short Term
Arbitrage
Capital ProtectionOriented Fund
Income-ST
Fixed Maturity Plan(FMP)
Income-LT
Gilt
Monthly Income Plan(MIP)
Balanced
Gold-ETF
Index
Equity
Thematic/Sector
Return
Ris
k
5
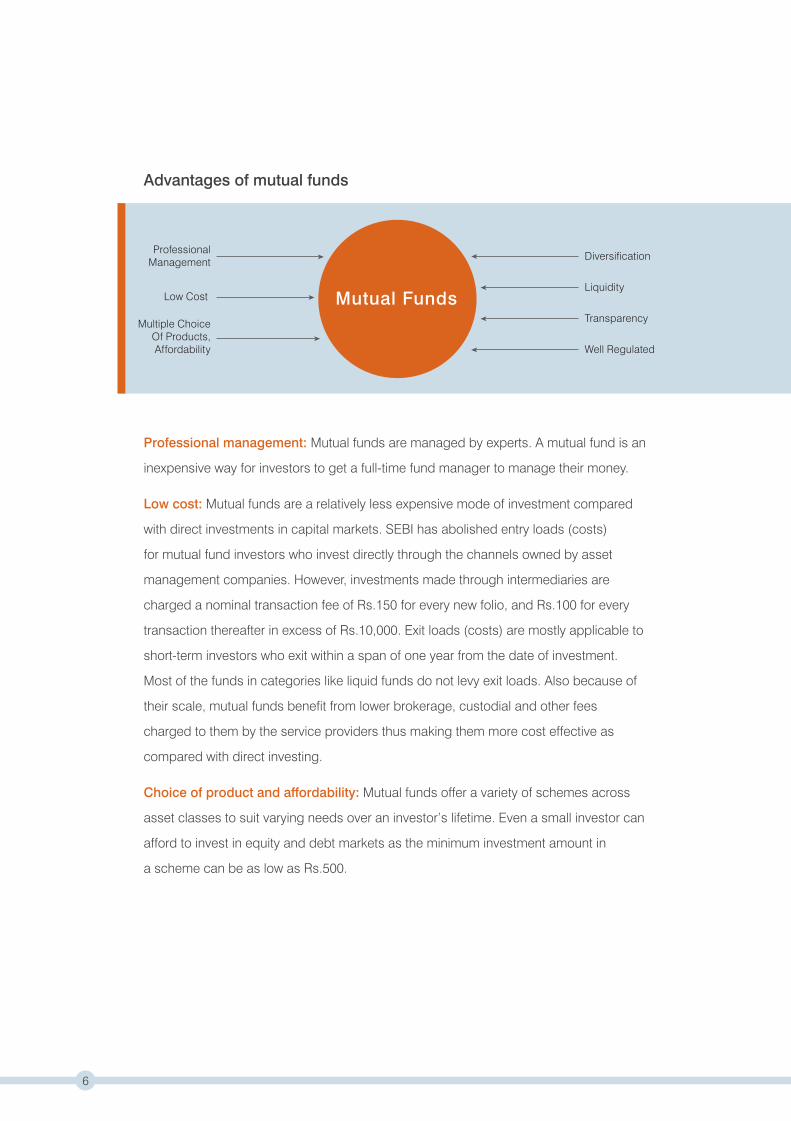
Advantages of mutual funds
Professional management: Mutual funds are managed by experts. A mutual fund is an
inexpensive way for investors to get a full-time fund manager to manage their money.
Low cost: Mutual funds are a relatively less expensive mode of investment compared
with direct investments in capital markets. SEBI has abolished entry loads (costs)
for mutual fund investors who invest directly through the channels owned by asset
management companies. However, investments made through intermediaries are
charged a nominal transaction fee of Rs.150 for every new folio, and Rs.100 for every
transaction thereafter in excess of Rs.10,000. Exit loads (costs) are mostly applicable to
short-term investors who exit within a span of one year from the date of investment.
Most of the funds in categories like liquid funds do not levy exit loads. Also because of
their scale, mutual funds benefit from lower brokerage, custodial and other fees
charged to them by the service providers thus making them more cost effective as
compared with direct investing.
Choice of product and affordability: Mutual funds offer a variety of schemes across
asset classes to suit varying needs over an investor’s lifetime. Even a small investor can
afford to invest in equity and debt markets as the minimum investment amount in
a scheme can be as low as Rs.500.
ProfessionalManagement
Low Cost
Multiple ChoiceOf Products,Affordability
Diversification
Liquidity
Transparency
Well Regulated
Mutual Funds
6

7
Diversification: Mutual funds diversify risks across a large number of
stocks/securities, which may otherwise not be feasible for retail investors. Funds not
only invest in several companies across industries and sectors, but also across asset
classes such as equity (including international equity), debt, commodities, etc.
This helps reduce portfolio risk as all asset classes/securities seldom decline at
the same time and in the same proportion.
Liquidity: Mutual funds offer convenience and ease of liquidity. Depending on their
category of investment, investors can get the money back promptly for the
open-ended schemes at the applicable net asset value (NAV) from mutual funds
within 1-3 days of applying for redemption. For close-ended schemes, one can sell
units on a stock exchange at the prevailing market price or avail of the facility of
repurchase through mutual funds at the applicable NAV which some close-ended and
interval schemes offer periodically. Also, some fund houses offer the convenience of
buying and selling of mutual fund units through an online platform.
Well regulated: All mutual funds are registered with SEBI and function within the
provisions of these regulations which are designed to protect the interests of
investors. The operations of all mutual funds are regularly monitored by SEBI.
Post the 2008 liquidity crisis, SEBI has introduced several new measures to protect
the interests of retail investors.
Transparency: Mutual funds regularly disclose all information pertaining to schemes
such as the latest NAV (declared daily) and full portfolio details (disclosed monthly).
They also release a monthly factsheet that contains performance and portfolio related
information of schemes. These are prominently displayed on the websites of the
respective fund houses. Further, SEBI and AMFI disclose industry level information
such as fund house and scheme-wise industry assets, cash flows within the industry,
scheme offer documents, AMC financial account statements, etc. on their website.

Tax advantageMutual funds are a tax-efficient form of investment for a retail investor.
Product Short-term Capital Long-term Capital Dividend
Gains Tax@ Gains Tax Distribution Tax*
Equity-oriented Funds** 15.450% (15% + 3% Cess) Nil Nil
Debt-oriented Funds As per income tax bracket 10.300% without indexation; 28.325% (25% +
of the investor 20.600% with indexation 10% Surcharge +
3% Cess)
Money Market & As per income tax bracket 10.300% without indexation; 28.325% (25% +
Liquid Schemes of the investor 20.600% with indexation 10% Surcharge +
3% Cess)
Tax rates applicable for Financial Year 2013-14@Surcharge at the rate of 10% is levied in the case of individual/HUF unit holders whose income exceeds Rs.1 crore.*Deducted at source – payable by the scheme**Securities Transaction Tax (STT) is deducted on equity funds at the time of redemption or switch to other schemes
Indexation (for tax purposes) allows the returns generated on the investment to be
adjusted for inflation (real returns). The benefit of indexation is that investors are
taxed only on the real returns generated from the debt-oriented fund. The indexed
value of initial investment (initial investment adjusted for inflation prevailing during
the year) is deducted from the redemption amount for calculating capital gains.
As a result, the investor’s tax liability is reduced by the extent of inflation prevailing
during the investment period.
ConclusionMutual funds offer an excellent avenue for retail investors to participate and benefit
from the uptrends in capital markets. While investing in mutual funds can be
beneficial, selecting the right fund can be challenging. Hence, investors should do
proper due diligence of the fund and take into consideration the risk-return trade-off
and time horizon. Further, in order to reap maximum benefit from mutual fund
investments, it is important for investors to diversify across different categories of
funds such as equity, debt and gold.
8
CRISIL-AMFI MF Performance Indices
9

An introductionCRISIL-AMFI MFPerformance Indices2Background – As part of CRISIL’s ongoing research on mutual funds, CRISIL has
carried out a study of mutual funds’ performance for a period of more than 15 years
from 1997. CRISIL has created fund performance indices based on the performance
of mutual fund schemes across categories including equity, equity-linked savings
schemes (ELSS), debt, money market and hybrid. The performance of these indices
was compared with other investment options such as equity benchmarks (CNX NIFTY,
CNX 500, etc.), small savings schemes (Public Provident Fund) and bank deposits
(fixed deposit, savings bank rate).
Methodology of Index Construction – The indices are constructed using schemes
that are ranked by CRISIL under its quarterly Mutual Fund Rankings. The list of indices
is as follows:
10
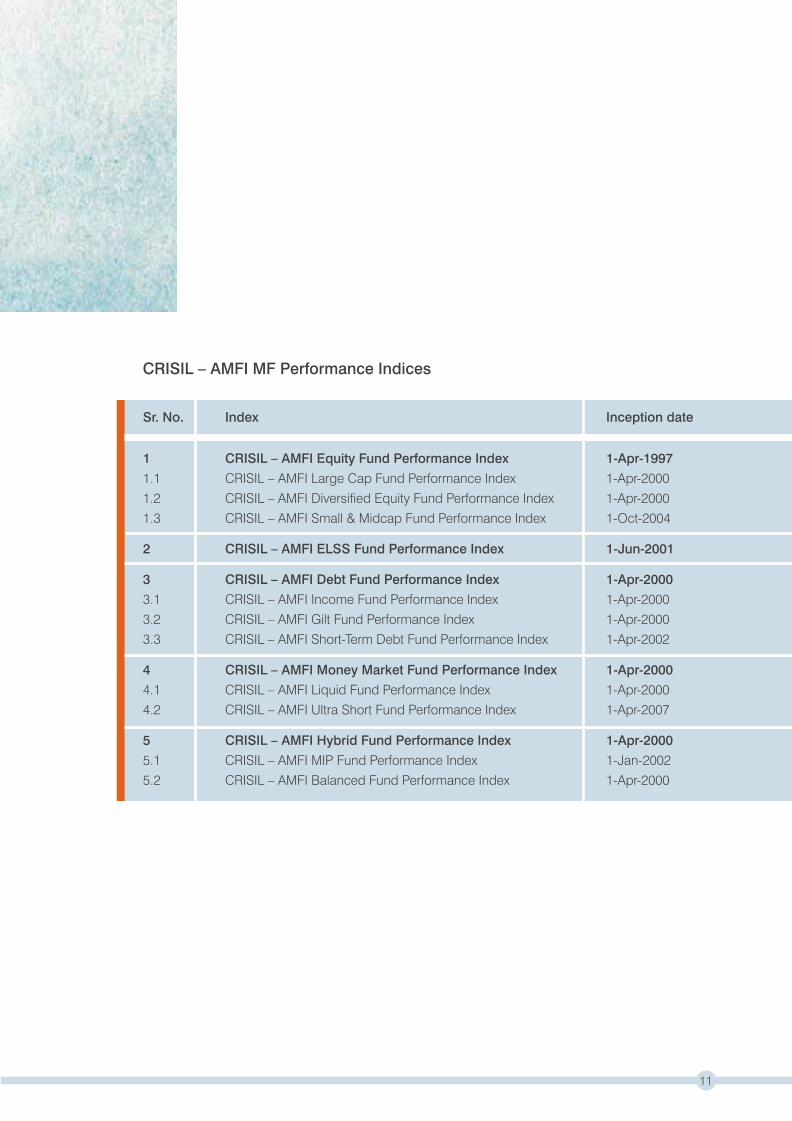
Sr. No. Index Inception date
1 CRISIL – AMFI Equity Fund Performance Index 1-Apr-1997
1.1 CRISIL – AMFI Large Cap Fund Performance Index 1-Apr-2000
1.2 CRISIL – AMFI Diversified Equity Fund Performance Index 1-Apr-2000
1.3 CRISIL – AMFI Small & Midcap Fund Performance Index 1-Oct-2004
2 CRISIL – AMFI ELSS Fund Performance Index 1-Jun-2001
3 CRISIL – AMFI Debt Fund Performance Index 1-Apr-2000
3.1 CRISIL – AMFI Income Fund Performance Index 1-Apr-2000
3.2 CRISIL – AMFI Gilt Fund Performance Index 1-Apr-2000
3.3 CRISIL – AMFI Short-Term Debt Fund Performance Index 1-Apr-2002
4 CRISIL – AMFI Money Market Fund Performance Index 1-Apr-2000
4.1 CRISIL – AMFI Liquid Fund Performance Index 1-Apr-2000
4.2 CRISIL – AMFI Ultra Short Fund Performance Index 1-Apr-2007
5 CRISIL – AMFI Hybrid Fund Performance Index 1-Apr-2000
5.1 CRISIL – AMFI MIP Fund Performance Index 1-Jan-2002
5.2 CRISIL – AMFI Balanced Fund Performance Index 1-Apr-2000
CRISIL – AMFI MF Performance Indices
11
Key highlights of mutual fund performance depicted by indices • CRISIL-AMFI Equity Fund Performance Indices have significantly outperformed the
relevant benchmark equity indices
• CRISIL-AMFI Equity Fund Performance Index has given an annualised return of 22% in the
past 16 years since 1997, higher than the 12% annualised returns from CNX NIFTY and
13% from CNX 500.
• CRISIL-AMFI Equity Fund Performance Index has never given negative returns for any
5-year period since 1997.
• Even during volatile times (the last decade included two bull and two bear phases),
the CRISIL-AMFI Equity Fund Performance Indices have delivered superior returns
as compared with the CNX NIFTY.
• CRISIL-AMFI ELSS Fund Performance Index outperformed market indices and
generated higher return than small saving schemes
• In the past 10 years, CRISIL-AMFI ELSS Fund Performance Index outperformed CNX 500
and Public Provident Fund (PPF) rate by 6% and 18% respectively.
• CRISIL-AMFI Money Market Fund Performance Index has consistently given better
returns than the savings bank rate.
• CRISIL-AMFI Debt Fund Performance Index outperformed fixed deposits (FD) during
declining interest rate cycles but underperformed during rising interest rate cycles.
12

Key Insights
13
Sustainable risk-adjustedlong-term returns
EquityFunds3Thinking long-term? Thinking superior returns? Go the equity way. Historical
performance of equity indicates that, though uncertainty is unavoidable in the short
term, this category fetches superior risk-adjusted returns over the long-term.
Mutual funds are an effective investment vehicle for retail investors to participate
in equity markets.
CRISIL’s study reveals that, over the past 16 years, equity mutual funds have
outperformed the broader market index, CNX 500, during most of the market phases.
The CRISIL-AMFI Equity Fund Performance Index has delivered a significant
outperformance over benchmarks such as CNX NIFTY and CNX 500. The magnitude
of outperformance is higher over a longer investment horizon, reinforcing the industry
adage that investments in equity mutual funds should have a long-term horizon.
The study also highlights the fact that at an aggregate level, equity funds have never
given negative returns over any five-year investment horizon since 1997.
CRISIL has created indices that reflect the performance of funds at an aggregate
level. These indices are based on mutual fund schemes ranked under CRISIL Mutual
Fund Rankings on a quarterly basis. CRISIL-AMFI Equity Fund Performance Index
consists of mutual fund schemes from diversified equity, large-cap equity and small
and mid-cap equity categories.
14
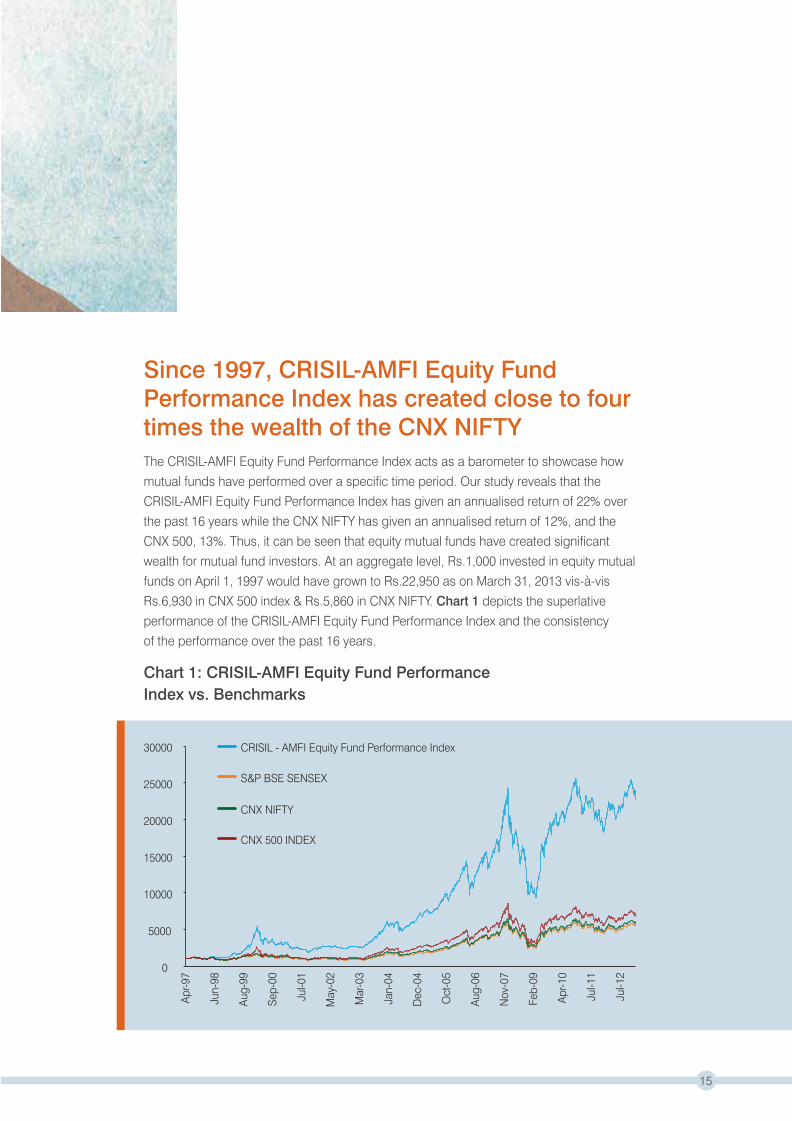
Since 1997, CRISIL-AMFI Equity Fund Performance Index has created close to four times the wealth of the CNX NIFTYThe CRISIL-AMFI Equity Fund Performance Index acts as a barometer to showcase how
mutual funds have performed over a specific time period. Our study reveals that the
CRISIL-AMFI Equity Fund Performance Index has given an annualised return of 22% over
the past 16 years while the CNX NIFTY has given an annualised return of 12%, and the
CNX 500, 13%. Thus, it can be seen that equity mutual funds have created significant
wealth for mutual fund investors. At an aggregate level, Rs.1,000 invested in equity mutual
funds on April 1, 1997 would have grown to Rs.22,950 as on March 31, 2013 vis-à-vis
Rs.6,930 in CNX 500 index & Rs.5,860 in CNX NIFTY. Chart 1 depicts the superlative
performance of the CRISIL-AMFI Equity Fund Performance Index and the consistency
of the performance over the past 16 years.
Chart 1: CRISIL-AMFI Equity Fund PerformanceIndex vs. Benchmarks
0
5000
10000
15000
20000
25000
30000
Apr-9
7
Jun-
98
Aug-
99
Sep-
00
Jul-0
1
May
-02
Mar
-03
Jan-
04
Dec
-04
Oct
-05
Aug-
06
Nov
-07
Feb-
09
Apr-1
0
Jul-1
1
Jul-1
2
CRISIL - AMFI Equity Fund Performance Index
S&P BSE SENSEX
CNX NIFTY
CNX 500 INDEX
15

Table 1 highlights that over the past 10 years, the CRISIL-AMFI Equity Fund
Performance Index or other sub-indices such as large cap, diversified equity or small
and mid-cap have given superior returns as compared with the various market indices
over different time periods. As CRISIL-AMFI Fund Performance Indices showcase the
performance of mutual funds at an aggregate level, an investor who would have
invested in top-performing mutual funds would have generated even higher returns.
Table 1: CRISIL-AMFI Equity Fund Performance indices have always given higher returns than the benchmark across different time periods except in the last one year
Performance as on March 31, 2013
Index 1 Year 3 Year 5 Year 7 Year 10 Year
(%) (%) (%) (%) (%)
CRISIL-AMFI Equity Fund Performance Index 5.66 3.61 6.15 8.43 24.53
CRISIL-AMFI Large Cap Fund Performance Index 6.23 4.10 6.39 8.71 23.66
CRISIL-AMFI Diversified Equity Fund Performance Index 4.66 2.79 5.64 8.51 25.70
CRISIL-AMFI Small & Midcap Fund Performance Index 7.14 5.24 6.44 6.95 –
CNX NIFTY 7.31 2.68 3.72 7.60 19.24
S&P BSE SENSEX 8.23 2.43 3.78 7.60 19.97
CNX 500 Index 5.13 0.96 3.01 6.21 20.26
CNX Midcap Index -4.02 -1.33 3.47 6.42 –
S&P BSE Midcap -3.22 -3.36 -0.91 2.00 –
16

CRISIL-AMFI Equity Fund Performance indices have outperformed respective benchmarks in different market cyclesThe key responsibility of fund management is to manage portfolios proactively during
various market cycles. Be it a bull or a bear phase, active fund managers are expected to
identify trends and take necessary action on portfolio construction to ensure that the
portfolio outperforms market indices. CRISIL’s study shows that the outperformance of the
CRISIL-AMFI Equity Fund Performance Index is not limited to a bull run; the index has
outperformed in a bear phase as well.
Starting April 1, 2000, CRISIL identified three bear and two bull phases. The return delivered
by the CRISIL-AMFI Equity Fund Performance Indices was compared with the relevant
benchmarks across these market cycles. Table 2 shows that the CRISIL-AMFI Equity Fund
Performance Index has outperformed the CNX 500 in two bull and bear phases.
Table 2 – Performance during market phases
Annualized Returns (%)
Period From Date To DateCRISIL-AMFI
Equity Fund
Performance
Index (%)
CRISIL-AMFI
Large Cap
Fund
Performance
Index (%)
CRISIL-AMFI
Diversified
Fund
Performance
Index (%)
CRISIL-AMFI
Small &
Midcap Fund
Performance
Index (%)
CNX
NIFTY
(%)
CNX
Midcap
Index
(%)
CNX
500
Index
(%)
Tech Bubble 1-Apr-00 30-Sep-01 -41.40 -38.08 -49.24 – -29.05 – -41.04
Bull Phase of 2003-07 1-Apr-03 31-Dec-07 59.54 56.00 63.47 – 46.97 – 53.14
Sub-prime Crisis 1-Jan-08 31-Mar-09 -47.52 -43.21 -47.33 -58.48 -43.42 -55.67 -49.55
Sharp Bounce Back 1-Apr-09 31-Dec-10 58.93 52.92 58.57 76.77 48.77 71.87 53.83
Post Sub-prime Crisis
European Crisis 1-Jan-11 31-Mar-13 -2.56 -1.90 -3.54 -0.94 -3.36 -7.70 -4.67
17
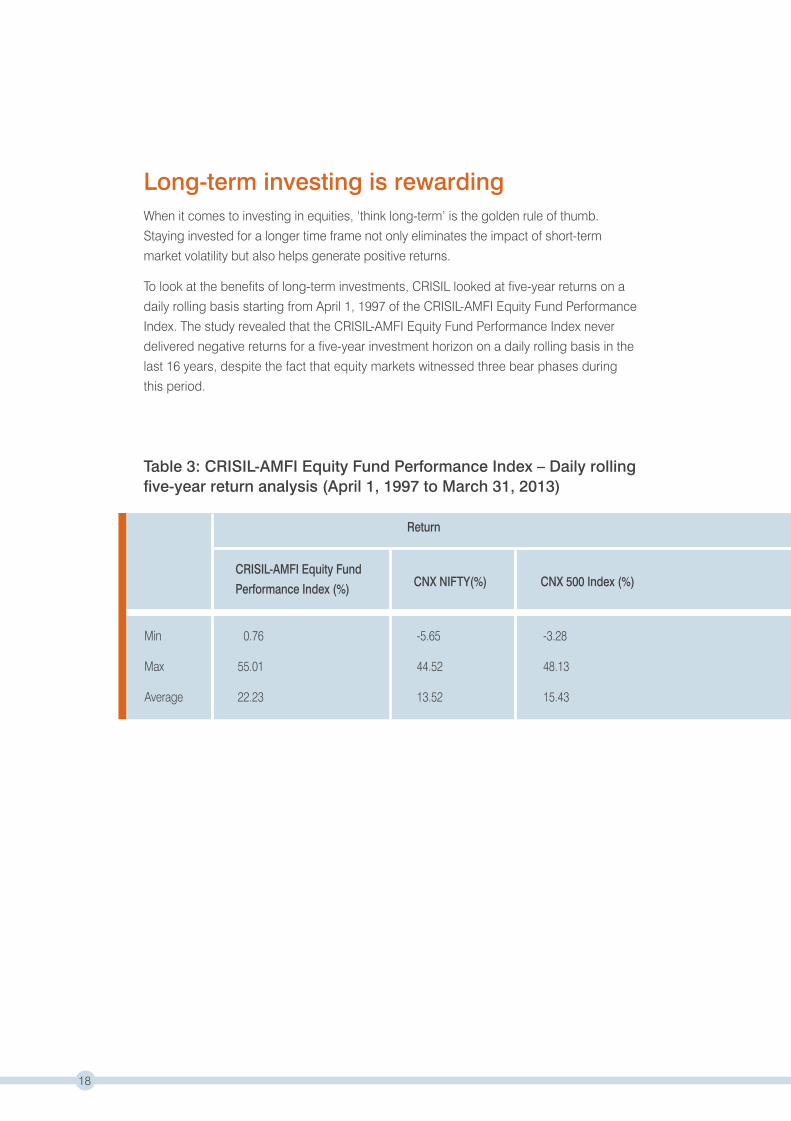
Long-term investing is rewardingWhen it comes to investing in equities, ‘think long-term’ is the golden rule of thumb.
Staying invested for a longer time frame not only eliminates the impact of short-term
market volatility but also helps generate positive returns.
To look at the benefits of long-term investments, CRISIL looked at five-year returns on a
daily rolling basis starting from April 1, 1997 of the CRISIL-AMFI Equity Fund Performance
Index. The study revealed that the CRISIL-AMFI Equity Fund Performance Index never
delivered negative returns for a five-year investment horizon on a daily rolling basis in the
last 16 years, despite the fact that equity markets witnessed three bear phases during
this period.
Table 3: CRISIL-AMFI Equity Fund Performance Index – Daily rolling five-year return analysis (April 1, 1997 to March 31, 2013)
Min 0.76 -5.65 -3.28
Max 55.01 44.52 48.13
Average 22.23 13.52 15.43
CNX NIFTY(%) CNX 500 Index (%)
Return
CRISIL-AMFI Equity Fund
Performance Index (%)
18

Conclusion The CRISIL-AMFI Equity Fund Performance Index clearly reveals that equity mutual funds
have given higher returns than broad market indices. As most retail investors may not
have an in-depth understanding of the financial markets, or may not have sufficient time to
track the markets, direct equity investment can prove to be risky. CRISIL believes that
investing in mutual funds is the ideal way for retail investors to reap returns and create
wealth as they are managed and supervised by professional money managers. The study
also brings out the benefits of long-term investing. The findings are more relevant today,
when the markets are globally integrated and, hence highly vulnerable to global events as
evident from the back-to-back sub-prime crises of 2008 and the European crisis of 2011.
19

A strong and simpleasset allocation option
BalancedFunds
One of the golden rules of financial investment is – “Don't put all your eggs in one
basket.” Diversifying investment across asset classes plays an important role in
building long-term financial security. Most investors today face a dilemma of varying
their allocation towards equity. Balanced mutual funds offer a simple solution to this
dilemma, if investors are comfortable with the asset allocation pattern followed by
these funds; 65-80% into equity and the balance in debt instruments. These also
insulate the investor from making hasty investment decisions when there are sudden
changes in equity markets. CRISIL’s study reveals that in the last ten years balanced
funds at an aggregate level witnessed lower capital erosion when the markets
declined. Balanced funds also enabled investors to capitalise from gains in equity
markets by delivering returns higher or similar to those of the CNX NIFTY, thus
highlighting the benefits of asset allocation.
CRISIL has created indices that reflect performance of funds at an aggregate level.
The indices are based on mutual fund schemes ranked under CRISIL Mutual Fund
Rankings on a quarterly basis. CRISIL-AMFI Balanced Fund Performance Index
consists of mutual fund schemes from the balanced fund category.
Performance analysis Balanced funds (measured by the CRISIL-AMFI Balanced Fund Performance Index) have
outperformed CRISIL Balanced Fund Index (the category benchmark), CNX NIFTY and
CNX 500 across various time frames analysed, as on March 31, 2013 (see Table 1).
CRISIL’s study also shows that the balanced fund category has managed to achieve the
objective of delivering returns higher or in line with the equity markets and minimising
losses when equity markets deliver negative returns. The CRISIL-AMFI Balanced Fund
Performance index has given higher returns than the CNX NIFTY in three out of five market
cycles since April 1, 2000 (see Table 2).
20

Index 3 Years 5 Years 7 Years 10 Years
(%) (%) (%) (%)
CRISIL-AMFI Balanced 5.96 9.11 10.31 20.60
Fund Performance Index
CRISIL Balanced Fund Index 4.64 5.78 8.17 14.72
CNX NIFTY 2.68 3.72 7.60 19.24
CNX 500 Index 0.96 3.01 6.21 20.26
Performance as on March 31, 2013
Table 2 – Market phase analysis – CRISIL-AMFI Balanced FundsPerformance Index
PeriodFrom
Date
To
Date
CRISIL - AMFIBalanced FundPerformanceIndexAnnualisedReturn (%)
CNX NIFTYAnnualisedReturn (%)
Tech Bubble 1-Apr-00 30-Sep-01 -33.80 -29.05
Bull Phase of 2003-07 1-Apr-03 31-Dec-07 42.11 46.97
Sub-prime crisis 1-Jan-08 31-Mar-09 -35.93 -43.42
Sharp bounce back postSub-prime crisis 1-Apr-09 31-Dec-10 51.67 48.77
European crisis 1-Jan-11 31-Mar-13 0.78 -3.36
Table 1 - Performance
21

Benefits of investing in balanced funds 1 Diversification – One of the key benefits of investing in a balanced fund is the mix of
debt and equity investments. The diversification between equity and debt protects the
portfolio from downside risks if either equity or debt enters a bearish phase. While equity
has the potential to deliver superior long-term returns, debt provides stability to the portfolio.
2 No manual rebalancing of asset allocation – In line with the investment goal, investors
need to periodically rebalance their equity and debt investments if held separately. However,
this can be a tedious exercise, besides having tax and cost (of rebalancing) implications.
Market sentiments tend to drive asset allocation decisions, if done manually, which may not
be in the best interest of investors.
These challenges can be avoided by investing in a balanced fund as the responsibility of
asset allocation and portfolio rebalancing lies with the fund manager, and investors get the
benefit of both equity and debt by investing in one fund.
3 Tax benefits – Most balanced funds maintain at least 65% exposure to equities, thereby
allowing them to be taxed like equity funds. These funds enjoy tax-free returns for holding
periods greater than one year. Dividend distributed by balanced funds is also tax free.
22
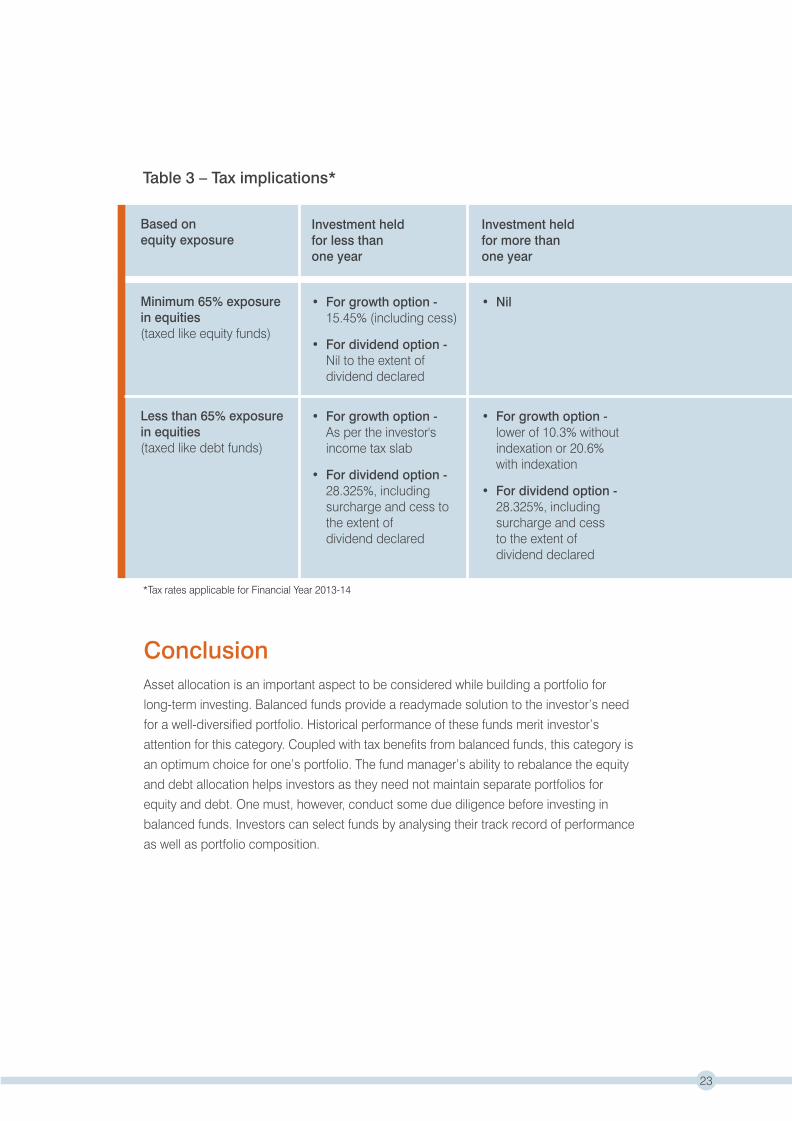
Conclusion Asset allocation is an important aspect to be considered while building a portfolio for
long-term investing. Balanced funds provide a readymade solution to the investor’s need
for a well-diversified portfolio. Historical performance of these funds merit investor’s
attention for this category. Coupled with tax benefits from balanced funds, this category is
an optimum choice for one’s portfolio. The fund manager’s ability to rebalance the equity
and debt allocation helps investors as they need not maintain separate portfolios for
equity and debt. One must, however, conduct some due diligence before investing in
balanced funds. Investors can select funds by analysing their track record of performance
as well as portfolio composition.
Based onequity exposure
Minimum 65% exposurein equities(taxed like equity funds)
Less than 65% exposure in equities (taxed like debt funds)
Investment heldfor less thanone year
Investment heldfor more thanone year
• For growth option - 15.45% (including cess)
• For dividend option - Nil to the extent of dividend declared
• For growth option - As per the investor's income tax slab
• For dividend option - 28.325%, including surcharge and cess to the extent of dividend declared
• For growth option - lower of 10.3% without indexation or 20.6% with indexation
• For dividend option - 28.325%, including surcharge and cess to the extent of dividend declared
• Nil
*Tax rates applicable for Financial Year 2013-14
Table 3 – Tax implications*
23

An alternativeto long-termfixed deposits
Monthly IncomePlans5Indian investors’ preference for guaranteed returns has made bank FDs the largest
portion of India’s savings pie. In their quest for safety, long-term investors often miss
out on the extra return they can generate by having a marginal exposure to equity.
Most investors are unaware of hybrid mutual funds, which not only offer convenience
and liquidity but also come with better tax benefits vis-à-vis bank FDs.
Monthly Income Plans (MIPs) are mutual funds that provide an optimal combination
of equity and debt for risk-averse investors. These funds invest a majority of their
portfolio (at least 70%) in debt and the rest in equities and are ideal for an investment
horizon of greater than three years. CRISIL’s analysis reveals that MIPs have given
better tax-adjusted returns than 3 Year FDs.
CRISIL has created indices that reflect the performance of funds at an aggregate
level. The indices are based on mutual fund schemes ranked under CRISIL Mutual
Fund Rankings on a quarterly basis. The CRISIL-AMFI MIP Fund Performance Index
consists of mutual fund schemes from MIP-Conservative and MIP-Aggressive
categories. The equity allocation for MIP-Conservative and MIP-Aggressive funds
ranges from 0-15% and 15-30%, respectively.
CRISIL 3-Year FD Index is a time weighted index that takes into consideration
the simple average of FD rates of top three (by total deposits) public and
private sector banks.
24

Performance as on March 31, 2013
MIPs outperform FDsCRISIL’s study on mutual funds’ performance over the past 10 years reveals that at an
aggregate level, MIP funds (measured by the CRISIL-AMFI MIP Fund Performance Index)
have outperformed the 3-Year FD Index over 1, 5, 7 and 10 year periods (See Table 1).
Table 1 – Annualised performance (%)
Indices 1 Year 3 Years 5 Years 7 Years 10 Years
(%) (%) (%) (%) (%)
CRISIL-AMFI MIP Fund 8.48 7.20 8.79 8.45 9.42Performance Index
Benchmark - CRISIL 9.06 6.81 6.95 7.33 8.28Monthly IncomePlans Index
3 Year FD Index 8.40 8.27 8.10 7.60 7.45
25
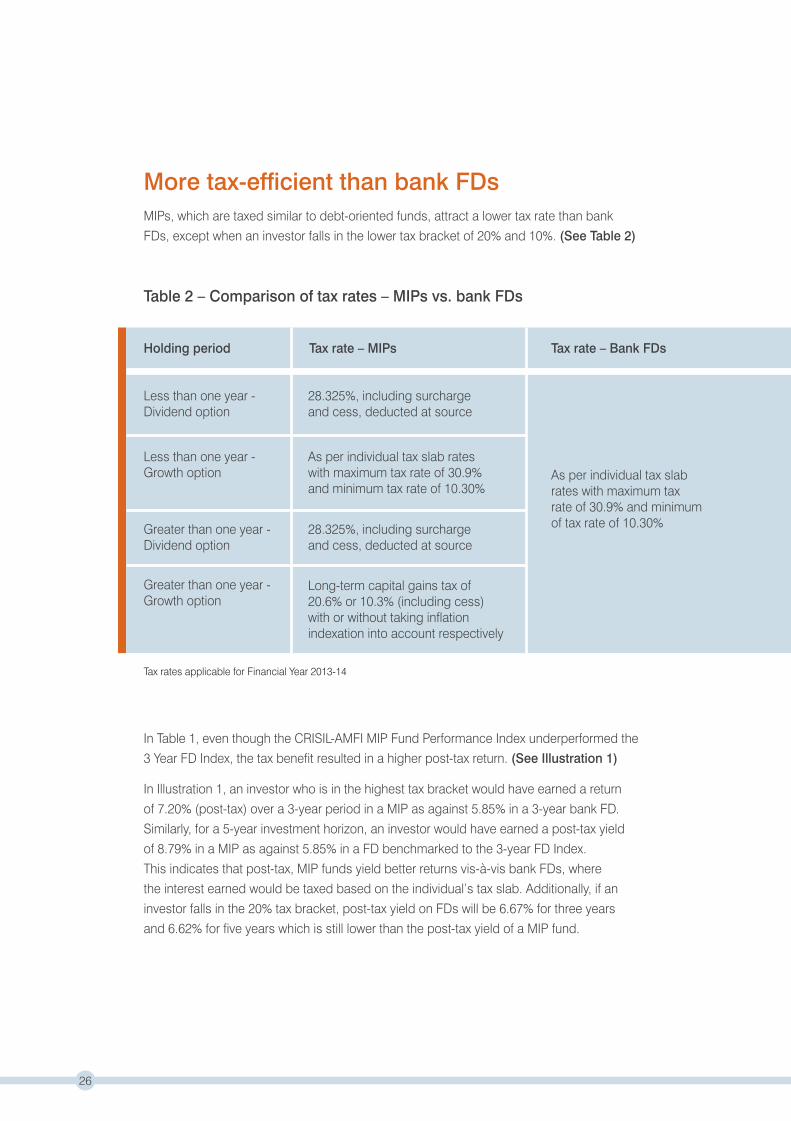
More tax-efficient than bank FDsMIPs, which are taxed similar to debt-oriented funds, attract a lower tax rate than bank
FDs, except when an investor falls in the lower tax bracket of 20% and 10%. (See Table 2)
Table 2 – Comparison of tax rates – MIPs vs. bank FDs
-
Holding period
Less than one year -Dividend option
Less than one year -Growth option
Greater than one year -Dividend option
28.325%, including surchargeand cess, deducted at source
As per individual tax slab rateswith maximum tax rate of 30.9%and minimum tax rate of 10.30%
28.325%, including surchargeand cess, deducted at source
Greater than one year -Growth option
Long-term capital gains tax of20.6% or 10.3% (including cess)with or without taking inflationindexation into account respectively
Tax rate – MIPs Tax rate – Bank FDs
As per individual tax slab rates with maximum taxrate of 30.9% and minimum of tax rate of 10.30%
Tax rates applicable for Financial Year 2013-14
In Table 1, even though the CRISIL-AMFI MIP Fund Performance Index underperformed the
3 Year FD Index, the tax benefit resulted in a higher post-tax return. (See Illustration 1)
In Illustration 1, an investor who is in the highest tax bracket would have earned a return
of 7.20% (post-tax) over a 3-year period in a MIP as against 5.85% in a 3-year bank FD.
Similarly, for a 5-year investment horizon, an investor would have earned a post-tax yield
of 8.79% in a MIP as against 5.85% in a FD benchmarked to the 3-year FD Index.
This indicates that post-tax, MIP funds yield better returns vis-à-vis bank FDs, where
the interest earned would be taxed based on the individual’s tax slab. Additionally, if an
investor falls in the 20% tax bracket, post-tax yield on FDs will be 6.67% for three years
and 6.62% for five years which is still lower than the post-tax yield of a MIP fund.
26

Investment TypeAmountInvested(Rs)
IndicativeYield(%)
Pre-taxReturns(Rs)
Tax Rate(Highest)(%)
Post-TaxReturns(Rs)
Post-TaxAnnualisedYield (%)
3 Year FD Index
CRISIL-AMFIMIP FundPerformanceIndex
3 Year FD Index
CRISIL-AMFIMIP FundPerformanceIndex
Illustration 1 - Comparison of post-tax returns – MIPs vs. bank FDs
500,000 8.27* 134,592 30.90 93,003 5.85
500,000 7.20^ 115,963 20.60** 115,963 @ 7.20
500,000 8.10* 238,072 30.90 164,507 5.85
500,000 8.79^ 261,930 20.60** 261,930@ 8.79
Post tax returns for 3 year investment horizon
Post tax returns for 5 year investment horizon
Tax rates applicable for Financial Year 2013-14Analysis as on March 31, 2013*3-year return of FD Index^3-year return of CRISIL-AMFI MIP Fund Performance Index**Assuming an investment of 3 years@Indexation benefits have resulted in nil tax
How to choose MIPs?Conservative investors, with a greater than 3-year time horizon, can enhance their portfolio
returns by investing in equities through the MIP route. The category not only offers higher
returns than 3-year FDs but also helps cushion the downside risks of the equity market.
Each MIP has a stated asset allocation that sets an upper limit on the equity component.
Based on this cap, MIPs can be categorised as conservative (cap up to 15%) and
aggressive (between 15% and 30%). Within the stated equity cap, a fund manager may
alter the portfolio’s equity exposure based on the prevailing market scenario. This asset
allocation strategy ensures that MIPs are less risky than pure equity funds and only
marginally more risky than pure debt funds.
Investors seeking regular income can select from monthly, quarterly, half-yearly or annual
dividend options. However, MIP schemes are not obliged to provide any ‘monthly income’
(dividend) as the name suggests. This is dependent on the scheme’s cash flows. A growth
option is also available to investors who do not require any regular dividend income.
27

An ideal avenue to investduring a declininginterest rate scenario
Long-TermDebt Funds6While traditionally bank FDs comprise a bulk of the fixed income investment space,
debt mutual funds are also an ideal avenue for investors due to their inherent
qualities of professional management, liquidity and tax efficiency. Among debt
mutual funds, long-term debt funds provided the highest returns when interest rates
declined. CRISIL’s study shows that long-term debt funds have outperformed bank
FDs by a significant margin during declining interest rate cycles since April 1, 2000.
Long-term debt funds are of two types – income funds and gilt funds. Income funds
invest a majority of their corpus in long-term corporate debt papers and government
securities. Gilt funds invest only in securities issued by central and state
governments, thereby carrying lower credit risk than income funds. The average
maturity of long-term debt funds can range between a few months to 25 years,
depending on the prevalent interest rate scenario. These funds are suitable for
investors with a long-term investment horizon.
long-term debt
funds provided
the highest
returns when
interest rates
declined.
“
”
28

CRISIL has created indices that reflect the performance of funds at an aggregate
level. The CRISIL-AMFI Debt Fund Performance Index consists of gilt funds, income
funds and short-term debt mutual fund schemes which form a part of CRISIL Mutual
Fund Rankings.
CRISIL 3-Year FD Index is a time weighted index, which takes into consideration the
simple average of FD rates of the top three (by total deposits) public and private
sector banks.
Long-term debt funds benefit in a declining interest rate scenarioThe value of a debt fund’s portfolio is inversely related to the interest rate movement.
The portfolio value rises when interest rates fall and vice-versa. The longer the maturity
period of the portfolio, the greater is the impact of a change in interest rates.
Thus, long-term debt funds benefit the most when interest rates fall. CRISIL’s study
of long-term debt funds (measured by the CRISIL-AMFI Debt Fund Performance Index)
reveals that these funds have outperformed the 3-Year FD Index by a significant margin
when interest rates fell. Gilt funds (represented by the CRISIL-AMFI Gilt Fund Performance
Index) generated the highest returns during these phases. (See Table 1)
29
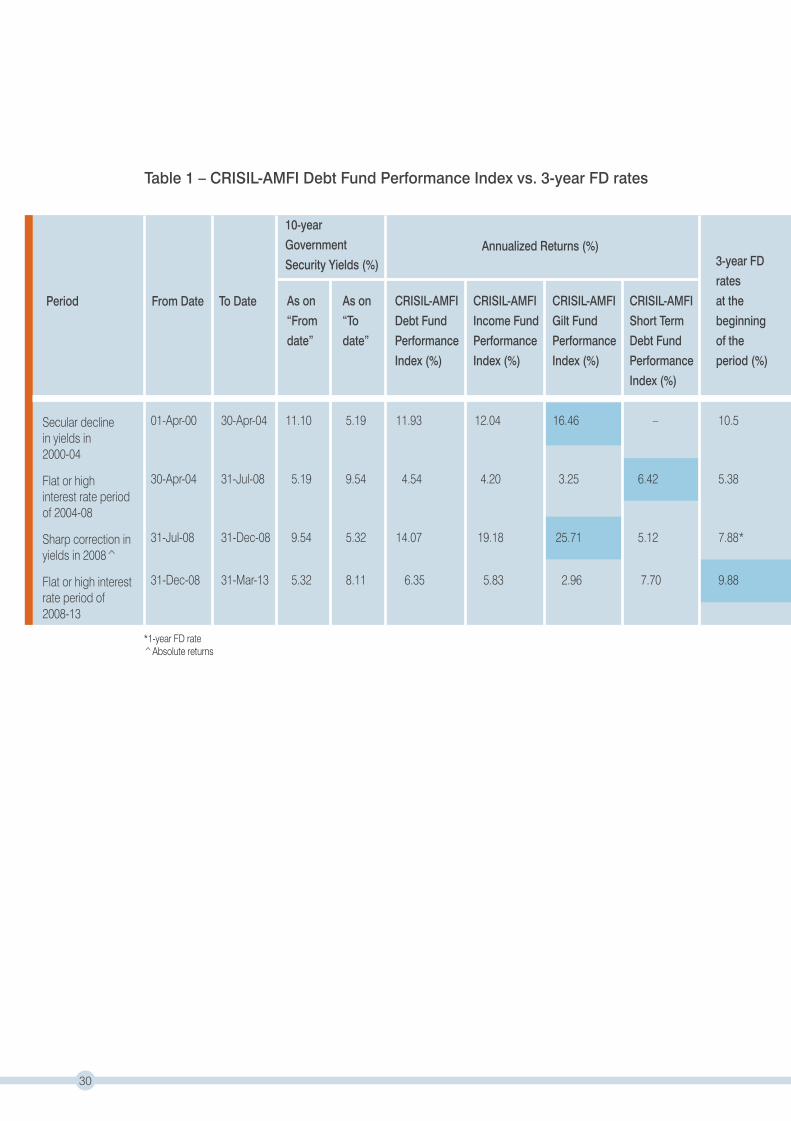
Annualized Returns (%)
Period From Date To Date As on
“From
date”
As on
“To
date”
10-year
Government
Security Yields (%)
CRISIL-AMFI
Debt Fund
Performance
Index (%)
CRISIL-AMFI
Income Fund
Performance
Index (%)
CRISIL-AMFI
Gilt Fund
Performance
Index (%)
01-Apr-00 30-Apr-04 11.10 5.19 11.93 12.04 16.46 – 10.5
30-Apr-04 31-Jul-08 5.19 9.54 4.54 4.20 3.25 6.42 5.38
31-Jul-08 31-Dec-08 9.54 5.32 14.07 19.18 25.71 5.12 7.88*
31-Dec-08 31-Mar-13 5.32 8.11 6.35 5.83 2.96 7.70 9.88
*1-year FD rate^Absolute returns
Table 1 – CRISIL-AMFI Debt Fund Performance Index vs. 3-year FD rates
Secular declinein yields in2000-04
Flat or highinterest rate periodof 2004-08
Sharp correction inyields in 2008^
Flat or high interestrate period of2008-13
30
CRISIL-AMFI
Short Term
Debt Fund
Performance
Index (%)
3-year FD
rates
at the
beginning
of the
period (%)

Conclusion Historically, long-term debt funds have given superior returns over FDs in a falling interest
rate scenario. The quantum of returns depend on the pace and degree of the decline in
interest rates. Investors should consider the following while investing in long-term debt funds:
1 Interest Rate Risk – Investors should look at the underlying interest rate cycle
before investing. Long-term debt funds benefit from a falling interest rate regime.
2 Credit Risk – Investors can gauge the credit risk of a debt fund by looking
at the rating distribution of the portfolio.
3 Concentration Risk – Funds that have a diversified portfolio of debt instruments
but do not concentrate on a few sectors or issuers are ideal.
4 Exit Loads – Investors must check whether any exit load is applicable for early
withdrawal from an open-ended debt fund.
31

A suitable alternativeto short termfixed deposits
Short-TermDebt Funds7Fixed income is a very important component of an investment portfolio, especially for
conservative investors who want stable returns. In India, retail investment in debt is
mainly associated with FDs and there is a lack of awareness of debt mutual funds.
Short-term debt fund is one such category investing in short-term corporate debt
papers, money market instruments such as certificates of deposit (CDs), commercial
papers (CPs), etc. and government securities whose residual maturities range
up to three years. These funds are suitable for investors with a medium-term
investment horizon.
There are several distinct advantages that debt mutual funds offer over FDs.
Debt funds provide investors access to portfolios of varying maturities and credits
which can lead to higher returns over FDs. Debt funds also provide additional
benefits of liquidity and tax efficiency. CRISIL’s study of short-term debt funds over
the past 10 years reveals that the returns on these funds have been higher than
investments in 1-year FDs. On a year-on-year basis, these funds have outperformed
1-year FDs during a declining interest rate scenario.
CRISIL has created indices that reflect the performance of funds at an
aggregate level. The CRISIL-AMFI Short-Term Debt Fund Performance Index
consists of short-term debt mutual fund schemes which form a part of CRISIL
Mutual Fund Rankings.
CRISIL 1-Year FD Index is a time-weighted index which takes into consideration
the simple average of FD rates of the top three (by total deposits) public and
private sector banks.
32
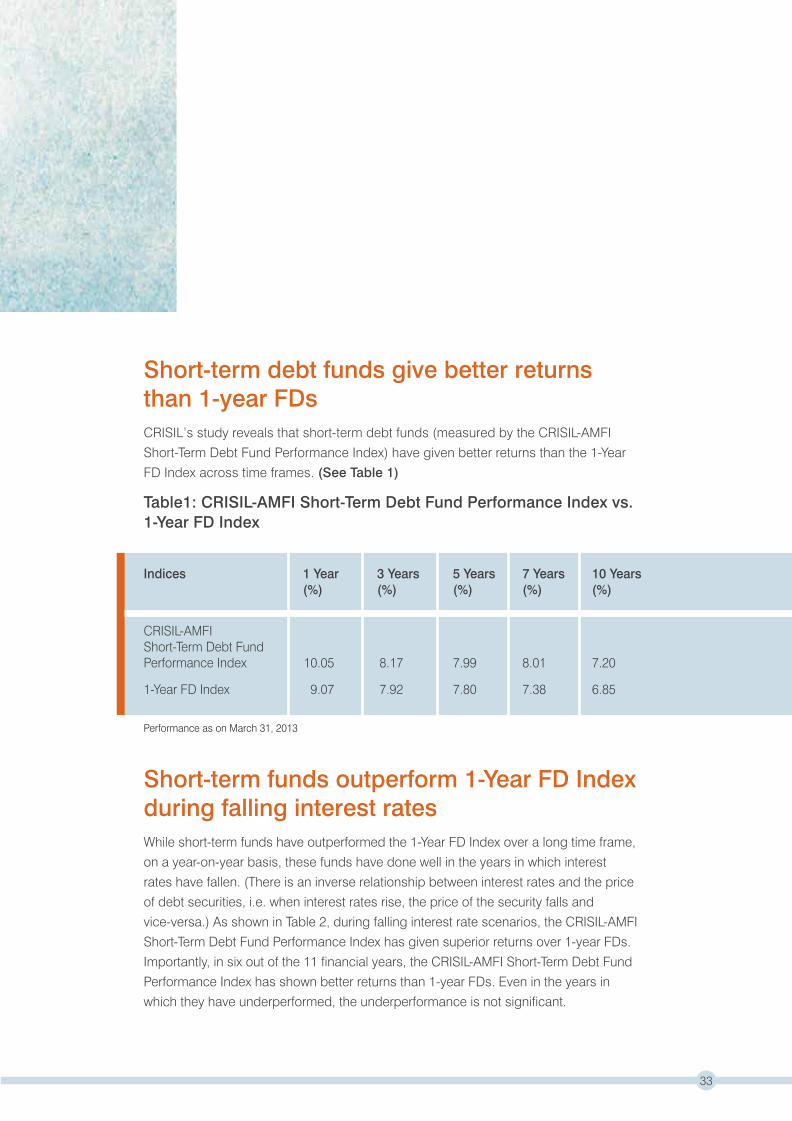
Short-term debt funds give better returns than 1-year FDsCRISIL’s study reveals that short-term debt funds (measured by the CRISIL-AMFI
Short-Term Debt Fund Performance Index) have given better returns than the 1-Year
FD Index across time frames. (See Table 1)
Table1: CRISIL-AMFI Short-Term Debt Fund Performance Index vs. 1-Year FD Index
Indices 1 Year 3 Years 5 Years 7 Years 10 Years (%) (%) (%) (%) (%)
CRISIL-AMFIShort-Term Debt FundPerformance Index 10.05 8.17 7.99 8.01 7.20
1-Year FD Index 9.07 7.92 7.80 7.38 6.85
Performance as on March 31, 2013
Short-term funds outperform 1-Year FD Index during falling interest ratesWhile short-term funds have outperformed the 1-Year FD Index over a long time frame,
on a year-on-year basis, these funds have done well in the years in which interest
rates have fallen. (There is an inverse relationship between interest rates and the price
of debt securities, i.e. when interest rates rise, the price of the security falls and
vice-versa.) As shown in Table 2, during falling interest rate scenarios, the CRISIL-AMFI
Short-Term Debt Fund Performance Index has given superior returns over 1-year FDs.
Importantly, in six out of the 11 financial years, the CRISIL-AMFI Short-Term Debt Fund
Performance Index has shown better returns than 1-year FDs. Even in the years in
which they have underperformed, the underperformance is not significant.
33

Table 2: Comparison of year-on-year performance of CRISIL-AMFI Short-Term Debt Fund Performance Index with 1-Year FD rates
Short-term debt funds are tax efficientShort-term debt funds have a considerable tax advantage over FDs. While the interest
earned on deposits is added to one’s income and taxed at the applicable rate,
income from short-term debt funds held for more than one year is treated as
long-term capital gains and is taxed at a lower rate. For a holding period of more than
a year, the long-term capital gains tax rate applicable is lower at 10.3% without
indexation or 20.6% with indexation benefit. Indexation (for tax purposes) allows the
returns generated on the investment to be adjusted for inflation. Thus, investors in the
higher income tax slab of 20% and 30% are likely to gain by investing in short-term
debt funds on account of the lower tax rate and indexation benefit. However, if the
investment horizon is less than a year, the tax is as per the individual tax slab.
Further, for investors that fall in the highest tax bracket of 30%, the dividend option
(reinvestment or payout) provides a tax advantage vis-à-vis FDs because the dividend
distribution tax (DDT) is charged at 28.325% (25% plus 10% surcharge plus 3% cess).
1 Year Returns (%)
YearEnding 10 Year
Yield TrendCRISIL-AMFIShort-Term Debt FundPerformance Index
1 YearFD Rates(%)
31-Mar-03 8.08 8.13
31-Mar-04 6.27 5.88
31-Mar-05 4.54 5.13
31-Mar-06 5.16 5.25
31-Mar-07 6.94 5.75
31-Mar-08 9.21 7.00
31-Mar-09 9.01 7.50
31-Mar-10 6.43 8.05
31-Mar-11 5.35 6.13
31-Mar-12 9.17 8.25
31-Mar-13 10.05 9.04
34
Investment TypeAmountInvested(Rs)
IndicativeYield(%)
Pre-taxReturns(Rs)
Tax Rate(Highest)(%)
Post-TaxReturns(Rs)
Post-TaxAnnualisedYield (%)
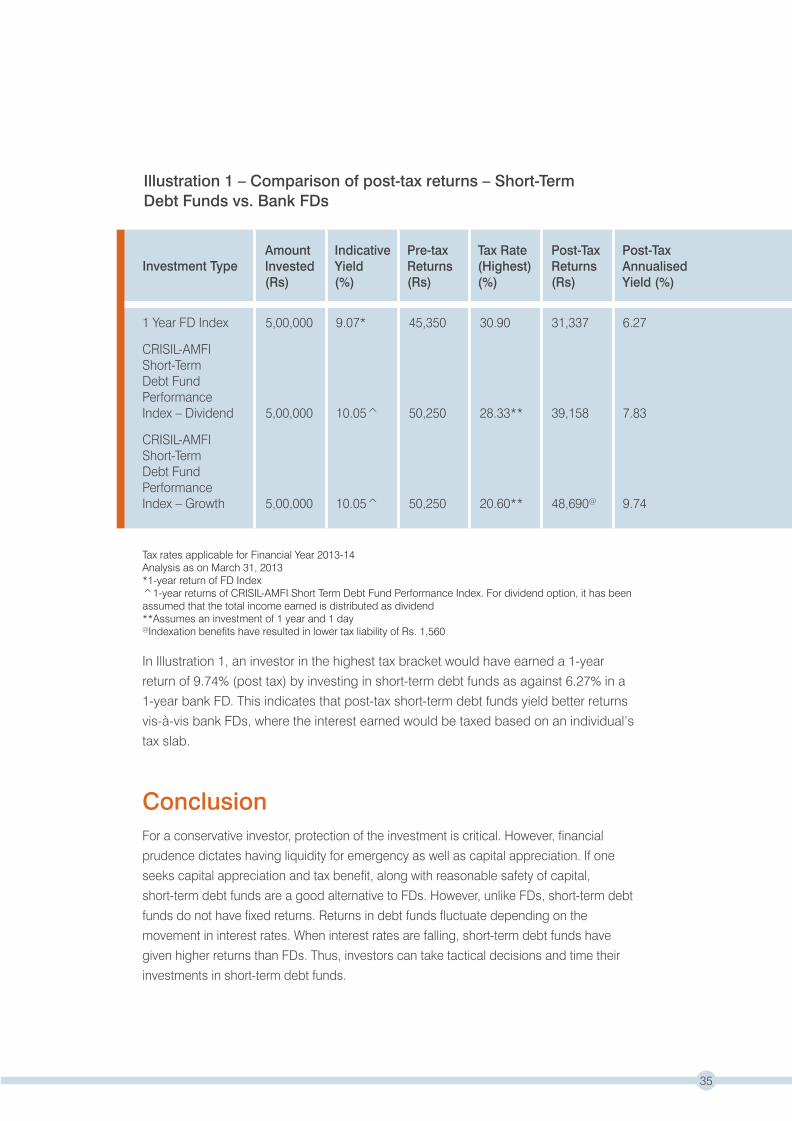
1 Year FD Index 5,00,000 9.07* 45,350 30.90 31,337 6.27
CRISIL-AMFIShort-TermDebt FundPerformanceIndex – Dividend 5,00,000 10.05^ 50,250 28.33** 39,158 7.83
CRISIL-AMFIShort-TermDebt FundPerformanceIndex – Growth 5,00,000 10.05^ 50,250 20.60** 48,690@ 9.74
Tax rates applicable for Financial Year 2013-14Analysis as on March 31, 2013*1-year return of FD Index^1-year returns of CRISIL-AMFI Short Term Debt Fund Performance Index. For dividend option, it has been assumed that the total income earned is distributed as dividend**Assumes an investment of 1 year and 1 day@Indexation benefits have resulted in lower tax liability of Rs. 1,560
In Illustration 1, an investor in the highest tax bracket would have earned a 1-year
return of 9.74% (post tax) by investing in short-term debt funds as against 6.27% in a
1-year bank FD. This indicates that post-tax short-term debt funds yield better returns
vis-à-vis bank FDs, where the interest earned would be taxed based on an individual’s
tax slab.
Illustration 1 – Comparison of post-tax returns – Short-TermDebt Funds vs. Bank FDs
ConclusionFor a conservative investor, protection of the investment is critical. However, financial
prudence dictates having liquidity for emergency as well as capital appreciation. If one
seeks capital appreciation and tax benefit, along with reasonable safety of capital,
short-term debt funds are a good alternative to FDs. However, unlike FDs, short-term debt
funds do not have fixed returns. Returns in debt funds fluctuate depending on the
movement in interest rates. When interest rates are falling, short-term debt funds have
given higher returns than FDs. Thus, investors can take tactical decisions and time their
investments in short-term debt funds.
35
A better optionto savingsbank deposits
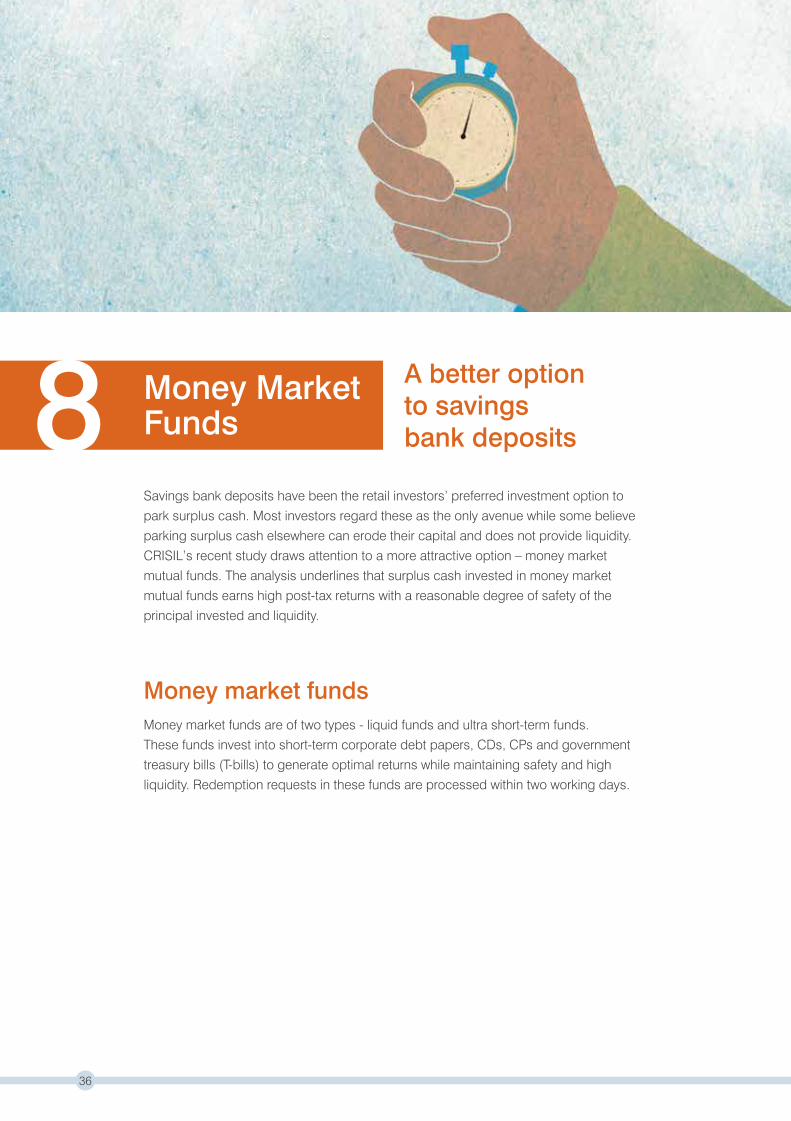
Money MarketFunds8Savings bank deposits have been the retail investors’ preferred investment option to
park surplus cash. Most investors regard these as the only avenue while some believe
parking surplus cash elsewhere can erode their capital and does not provide liquidity.
CRISIL’s recent study draws attention to a more attractive option – money market
mutual funds. The analysis underlines that surplus cash invested in money market
mutual funds earns high post-tax returns with a reasonable degree of safety of the
principal invested and liquidity.
Money market fundsMoney market funds are of two types - liquid funds and ultra short-term funds.
These funds invest into short-term corporate debt papers, CDs, CPs and government
treasury bills (T-bills) to generate optimal returns while maintaining safety and high
liquidity. Redemption requests in these funds are processed within two working days.
36

CRISIL has created indices that reflect the performance of funds at an aggregate level.
The CRISIL-AMFI Money Market Fund Performance Index consists of liquid and ultra
short-term mutual fund schemes which form a part of CRISIL Mutual Fund Rankings.
CRISIL Savings Bank Deposit Index is an index that tracks the returns on savings bank
deposits, which takes into consideration the simple average of savings bank deposit
rates of the top three public and private sector banks (by total deposits).
Comparison between liquid funds and ultra short-term funds
Tax rates applicable for Financial Year 2013-14
Sr. No.
1
2
2.1
2.1.1
2.1.2
2.2
2.2.1
Particulars
Portfolio average maturity
Taxation for individual
Growth options
Short-term capital gains
Long-term capital gains
Dividend options
Dividend distribution tax (deducted at source)
Liquid Funds
60 days and below
As per individual'stax bracket
Lower of 10% without indexation and 20% with indexation plus 3% cess
28.325% (25% + 10% surcharge + 3% cess)
Ultra Short-term Funds
1 year and below
As per individual's tax bracket
Lower of 10% without indexation and 20% with indexation plus 3% cess
28.325% (25% + 10% surcharge + 3% cess)
37
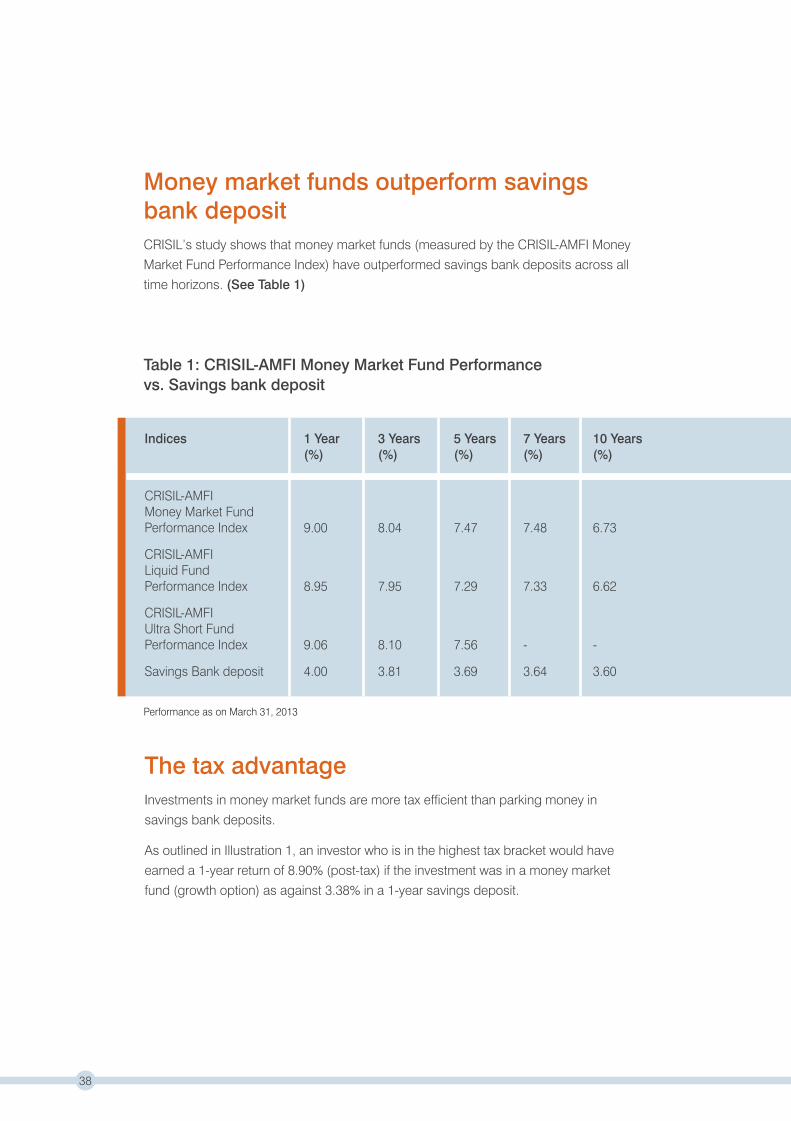
Money market funds outperform savings bank depositCRISIL’s study shows that money market funds (measured by the CRISIL-AMFI Money
Market Fund Performance Index) have outperformed savings bank deposits across all
time horizons. (See Table 1)
Table 1: CRISIL-AMFI Money Market Fund Performancevs. Savings bank deposit
The tax advantageInvestments in money market funds are more tax efficient than parking money in
savings bank deposits.
As outlined in Illustration 1, an investor who is in the highest tax bracket would have
earned a 1-year return of 8.90% (post-tax) if the investment was in a money market
fund (growth option) as against 3.38% in a 1-year savings deposit.
Indices 1 Year 3 Years 5 Years 7 Years 10 Years (%) (%) (%) (%) (%)
CRISIL-AMFI Money Market Fund Performance Index 9.00 8.04 7.47 7.48 6.73
CRISIL-AMFILiquid FundPerformance Index 8.95 7.95 7.29 7.33 6.62
CRISIL-AMFIUltra Short FundPerformance Index 9.06 8.10 7.56 - -
Savings Bank deposit 4.00 3.81 3.69 3.64 3.60
Performance as on March 31, 2013
38

Investment TypeIndicativeYield(%)
Pre-taxReturns(Rs)
Tax Rate(Highest)(%)
Post-TaxReturns(Rs)
Post-TaxAnnualisedYield (%)
Savings bank deposit 4.00* 20,000 30.90 16,910^^ 3.38
Liquid fund – dividend 9.00^ 45,000$ 28.33 35,067 7.01
Ultra short-term fund– dividend 9.00^ 45,000$ 28.33 35,067 7.01
Liquid fund – growth 9.00^ 45,000 20.60** 44,521@ 8.90
Ultra short-term fund – growth 9.00^ 45,000 20.60** 44,521@ 8.90
Tax rates applicable for Financial Year 2013-14*Average of top three public and private sector banks (by total deposits)^1-year returns of CRISIL-AMFI Money Market Fund Performance Index has been used to highlight the relative tax benefits. For dividend option, total income earned is assumed to be distributed as dividend.^^Interest income up to Rs.10,000 is tax-exempted**Assumes an investment of 1 year and 1 day@Indexation benefits have resulted in lower tax liability of Rs.479 $Dividend income earned
ConclusionMoney market funds are an alternate investment avenue for individuals willing to
take marginal risk to park their short-term surplus funds. While savings bank
deposits are easier to access and offer some degree of principal protection,
the higher yield combined with liquidity and taxation benefits make money market
funds an attractive option.
Illustration 1: 1-year returns across investment typesfor Rs.500,000 invested
39
Mutual fund category definitionsAnnexure
40
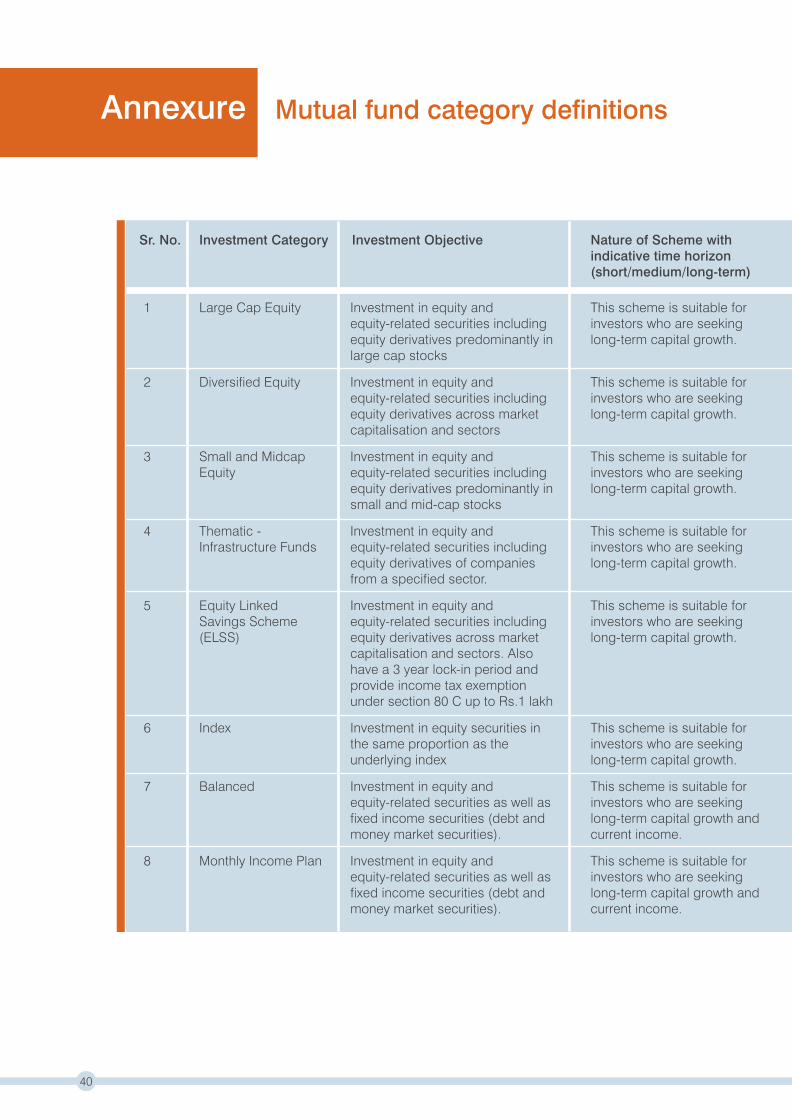
Sr. No. Investment Category Investment Objective Nature of Scheme withindicative time horizon(short/medium/long-term)
This scheme is suitable for investors who are seeking long-term capital growth.
This scheme is suitable for investors who are seeking long-term capital growth.
This scheme is suitable for investors who are seeking long-term capital growth.
This scheme is suitable for investors who are seeking long-term capital growth.
This scheme is suitable for investors who are seeking long-term capital growth.
This scheme is suitable for investors who are seeking long-term capital growth.
This scheme is suitable for investors who are seeking long-term capital growth and current income.
This scheme is suitable for investors who are seeking long-term capital growth and current income.
Investment in equity and equity-related securities including equity derivatives predominantly in large cap stocks
Investment in equity and equity-related securities including equity derivatives across market capitalisation and sectors
Investment in equity and equity-related securities including equity derivatives predominantly in small and mid-cap stocks
Investment in equity and equity-related securities including equity derivatives of companies from a specified sector.
Investment in equity and equity-related securities including equity derivatives across market capitalisation and sectors. Also have a 3 year lock-in period and provide income tax exemption under section 80 C up to Rs.1 lakh
Investment in equity securities in the same proportion as the underlying index
Investment in equity and equity-related securities as well as fixed income securities (debt and money market securities).
Investment in equity and equity-related securities as well as fixed income securities (debt and money market securities).
Large Cap Equity
Diversified Equity
Small and Midcap Equity
Thematic - Infrastructure Funds
Equity LinkedSavings Scheme (ELSS)
Index
Balanced
Monthly Income Plan
1
2
3
4
5
6
7
8
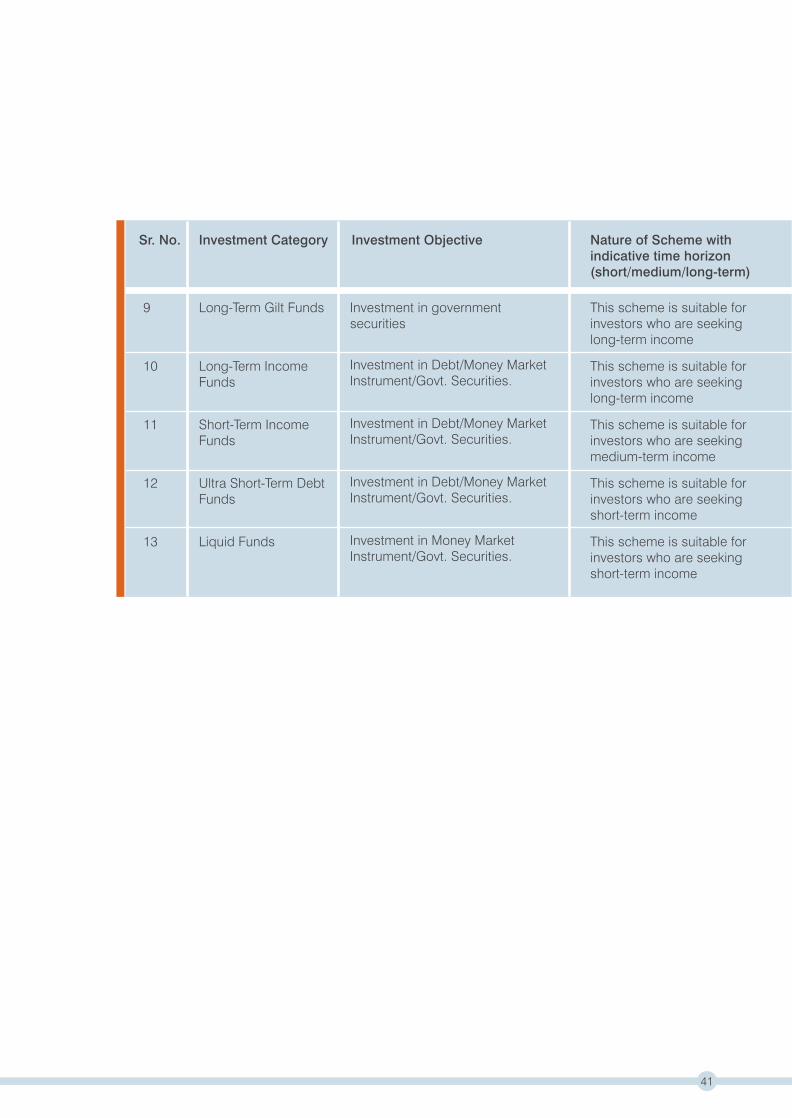
Sr. No. Investment Category Investment Objective Nature of Scheme withindicative time horizon(short/medium/long-term)
This scheme is suitable for investors who are seeking long-term income
This scheme is suitable for investors who are seeking long-term income
This scheme is suitable for investors who are seeking medium-term income
This scheme is suitable for investors who are seeking short-term income
This scheme is suitable for investors who are seeking short-term income
Investment in government securities
Investment in Debt/Money Market Instrument/Govt. Securities.
Investment in Debt/Money Market Instrument/Govt. Securities.
Investment in Debt/Money Market Instrument/Govt. Securities.
Investment in Money Market Instrument/Govt. Securities.
Long-Term Gilt Funds
Long-Term Income Funds
Short-Term Income Funds
Ultra Short-Term Debt Funds
Liquid Funds
9
10
11
12
13
41

CRISIL Limited
About CRISIL Limited
CRISIL is a global analytical company providing ratings, research, and risk and policy
advisory services. We are India's leading ratings agency. We are also the foremost
provider of high-end research to the world's largest banks and leading corporations.
About CRISIL Research
CRISIL Research is India's largest independent and integrated research house.
We provide insights, opinions, and analysis on the Indian economy, industries, capital
markets and companies. We are India's most credible provider of economy and
industry research. Our industry research covers 70 sectors and is known for its rich
insights and perspectives. Our analysis is supported by inputs from our network of
more than 4,500 primary sources, including industry experts, industry associations,
and trade channels. We play a key role in India's fixed income markets. We are India's
largest provider of valuations of fixed income securities, serving the mutual fund,
insurance, and banking industries. We are the sole provider of debt and hybrid indices
to India's mutual fund and life insurance industries. We pioneered independent equity
research in India, and are today India's largest independent equity research house.
Our defining trait is the ability to convert information and data into expert judgments
and forecasts with complete objectivity. We leverage our deep understanding of the
macro economy and our extensive sector coverage to provide unique insights on
micro-macro and cross-sectorial linkages. We deliver our research through an
innovative web-based research platform. Our talent pool comprises economists,
sector experts, company analysts, and information management specialists.
Disclaimer
CRISIL Research, a Division of CRISIL Limited has taken due care and caution in
preparing this Report. Information has been obtained by CRISIL from sources which it
considers reliable. However, CRISIL does not guarantee the accuracy, adequacy or
completeness of any information and is not responsible for any errors or omissions or
for the results obtained from the use of such information. CRISIL is not liable for
investment decisions which may be based on the views expressed in this Report.
CRISIL especially states that it has no financial liability whatsoever to the
subscribers/users/transmitters/distributors of this Report. CRISIL Research operates
independently of, and does not have access to information obtained by CRISIL’s
Ratings Division, which may, in its regular operations, obtain information of a
confidential nature which is not available to CRISIL Research. No part of this Report
may be published/reproduced in any form without CRISIL’s prior written approval.
42

CRISIL Privacy
CRISIL respects your privacy. We use your contact information, such as your name,
address, and email id, to fulfil your request and service your account and to provide
you with additional information from CRISIL and other parts of McGraw Hill Financial
you may find of interest.
For further information, or to let us know your preferences with respect to receiving
marketing materials, please visit www.crisil.com/privacy. You can view McGraw Hill
Financial’s Customer Privacy Policy at http://www.mhfi.com/privacy.
Last updated: May, 2013
43

Association ofMutual Funds in India
44
About AMFI
Association of Mutual Funds in India (AMFI) incorporated in 1995 under Section 25 of
the Companies Act, 1956, is the Trade Body of all the Mutual Funds registered with SEBI.
At present AMFI has 46 Members. It is a non-profit organisation, committed to develop
the Indian Mutual Fund Industry on professional, healthy and ethical lines and to enhance
and maintain standards in all areas with a view to protecting and promoting the interest
of Mutual Funds and their unit-holders.
AMFI is governed by the Board and the Directors are elected by the members every year.
AMFI has developed a unique style of functioning through Committees, constituted by
the Board on various subjects. At present AMFI has 6 Standing Committees.
About AMFI’s Activities
AMFI plays an important role in liaising with Regulatory Bodies, Ministry of Finance, etc.
on matters pertaining to the Mutual Fund Industry.
AMFI formulates guidelines on several operational and compliance areas with a view
to comply with statutory requirements, such as Valuation of Securities, etc.
AMFI carries out the activities of registering Mutual Fund Distributors and assigns them
an ARN (AMFI Registration Number).
AMFI being the Industry Body disseminates information pertaining to the Mutual Fund
Industry on its website, which is widely used by the Analyst, Media and Research Institutions.
Another important activity undertaken by AMFI from its inception is Investor Awareness
Programme (IAP). Over the years, AMFI itself and through AMCs and various bodies
organised a large number of Awareness Programmes.

LongTerm Growth
Mutual Fund investments are subject to market
risks, read all scheme related documents carefully.

11-Mar-13 24129.38046 19646.21 5942.35 4661.25 24129.38046 5732.755376 6125.186827 7276.15435 10-Mar-08 17574.15074 6.55% 15923.72 4.29% 4800.4 4.36% 3927.9 3.48%
12-Mar-13 24012.22878 19564.92 5914.1 4636.9 24012.22878 5709.03499 6096.067618 7238.144298 11-Mar-08 17997.80863 5.94% 16123.15 3.95% 4865.9 3.98% 4024.4 2.87%
13-Mar-13 23731.19443 19362.55 5851.2 4585 23731.19443 5649.983513 6031.232284 7157.129031 12-Mar-08 17905.79871 5.80% 16127.98 3.72% 4872 3.73% 4010.15 2.72%
14-Mar-13 23928.91147 19570.44 5908.95 4625.75 23928.91147 5710.645723 6090.759161 7220.739284 13-Mar-08 17014.35037 7.06% 15357.35 4.97% 4623.6 5.03% 3785.1 4.09%
15-Mar-13 23781.09482 19427.56 5872.6 4598.2 23781.09482 5668.953403 6053.290728 7177.73407 14-Mar-08 17248.91958 6.63% 15760.52 4.27% 4745.8 4.35% 3868.65 3.52%
18-Mar-13 23653.37315 19293.2 5835.25 4572.65 23653.37315 5629.747214 6014.791527 7137.850832 17-Mar-08 16221.33971 7.84% 14809.49 5.43% 4503.1 5.32% 3642.35 4.65%
19-Mar-13 23313.28754 19008.1 5745.95 4500.85 23313.28754 5546.55516 5922.743906 7025.771908 18-Mar-08 16159.47253 7.61% 14833.46 5.08% 4533 4.86% 3642.8 4.32%
20-Mar-13 22974.63334 18884.19 5694.4 4446.05 22974.63334 5510.398277 5869.607793 6940.229777 19-Mar-08 16163.91335 7.29% 14994.83 4.72% 4573.95 4.48% 3657.8 3.98%
21-Mar-13 22839.57303 18792.87 5658.75 4413.5 22839.57303 5483.751142 5832.860898 6889.419625 20-Mar-08 16163.91335 7.16% 14994.83 4.62% 4573.95 4.35% 3657.8 3.83%
22-Mar-13 22767.13146 18735.6 5651.35 4404.5 22767.13146 5467.039781 5825.233211 6875.370735 21-Mar-08 16163.91335 7.09% 14994.83 4.56% 4573.95 4.32% 3657.8 3.79%
25-Mar-13 22687.39782 18681.42 5633.85 4390.3 22687.39782 5451.230081 5807.194764 6853.204708 24-Mar-08 16088.82638 7.12% 15289.4 4.09% 4609.85 4.09% 3656.45 3.73%
26-Mar-13 22715.17387 18704.53 5641.6 4394.6 22715.17387 5457.973569 5815.183219 6859.916955 25-Mar-08 16962.35926 6.01% 16217.49 2.89% 4877.5 2.95% 3879.75 2.52%
28-Mar-13 22948.88216 18835.77 5682.55 4438.35 22948.88216 5496.269343 5857.393187 6928.210171 27-Mar-08 16970.59362 6.22% 16015.56 3.30% 4830.25 3.30% 3862.25 2.82%
01-Apr-13 23080.98672 18864.75 5704.4 4465.6 23080.98672 5504.725694 5879.915477 6970.747089 31-Mar-08 17030.28075 6.27% 15644.44 3.81% 4734.5 3.80% 3825.85 3.14%
02-Apr-13 23331.74918 19040.95 5748.1 4508.8 23331.74918 5556.140776 5924.960058 7038.181761 1-Apr-08 16911.28584 6.65% 15626.62 4.03% 4739.55 3.93% 3817.45 3.38%
03-Apr-13 23089.8002 18801.64 5672.9 4457.2 23089.8002 5486.310224 5847.446271 6957.634791 2-Apr-08 16976.35404 6.34% 15750.4 3.61% 4754.2 3.60% 3835.5 3.05%
04-Apr-13 22718.56304 18509.7 5574.75 4378.65 22718.56304 5401.122261 5746.276349 6835.0192 3-Apr-08 16927.90444 6.06% 15832.55 3.17% 4771.6 3.16% 3840.3 2.66%
05-Apr-13 22695.84448 18450.23 5553.25 4366.65 22695.84448 5383.768941 5724.114828 6816.287347 4-Apr-08 16558.67784 6.51% 15343.12 3.76% 4647 3.63% 3747.95 3.10%
08-Apr-13 22664.65676 18437.78 5542.95 4361.15 22664.65676 5380.136037 5713.497913 6807.701914 7-Apr-08 16856.59294 6.10% 15757.08 3.19% 4761.2 3.09% 3830.5 2.63%
09-Apr-13 22463.21843 18226.48 5495.1 4323.4 22463.21843 5318.478791 5664.175643 6748.774625 8-Apr-08 16788.5522 6.00% 15587.62 3.18% 4709.65 3.13% 3807.1 2.58%
10-Apr-13 22651.3634 18414.45 5558.7 4366.45 22651.3634 5373.328353 5729.732516 6815.975149 9-Apr-08 16974.54697 5.94% 15790.51 3.12% 4747.05 3.21% 3844.4 2.58%
11-Apr-13 22776.18963 18542.2 5594 4388.05 22776.18963 5410.605747 5766.118641 6849.692485 10-Apr-08 16943.34009 6.10% 15695.1 3.39% 4733 3.40% 3830.75 2.75%
12-Apr-13 22579.27643 18242.56 5528.55 4352.7 22579.27643 5323.170927 5698.654847 6794.511567 11-Apr-08 17083.11923 5.74% 15807.64 2.91% 4777.8 2.96% 3861.7 2.42%
15-Apr-13 22700.45412 18357.8 5568.4 4376.05 22700.45412 5356.797908 5739.730969 6830.960632 14-Apr-08 17083.11923 5.85% 15807.64 3.04% 4777.8 3.11% 3861.7 2.53%
16-Apr-13 23019.23462 18744.93 5688.95 4457.5 23019.23462 5469.762271 5863.990105 6958.103088 15-Apr-08 17317.42102 5.86% 16153.66 3.02% 4879.65 3.12% 3938 2.51%
17-Apr-13 23076.22963 18731.16 5688.7 4461.75 23076.22963 5465.744191 5863.732413 6964.737286 16-Apr-08 17430.52619 5.77% 16244.19 2.89% 4887.3 3.08% 3959.75 2.42%
18-Apr-13 23349.30557 19016.46 5783.1 4526.8 23349.30557 5548.994605 5961.036953 7066.279542 17-Apr-08 17664.51357 5.74% 16481.2 2.90% 4958.4 3.12% 4027.9 2.36%
22-Apr-13 23565.77975 19169.83 5834.4 4574.4 23565.77975 5593.747903 6013.915374 7140.582561 21-Apr-08 17984.31816 5.55% 16739.33 2.75% 5037 2.98% 4099.75 2.22%
23-Apr-13 23526.66078 19179.36 5836.9 4572.4 23526.66078 5596.528752 6016.492295 7137.460585 22-Apr-08 18092.48235 5.39% 16783.87 2.70% 5049.3 2.94% 4120.85 2.10%
25-Apr-13 23730.70978 19406.85 5916.3 4624.3 23730.70978 5662.910234 6098.335309 7218.475852 24-Apr-08 17963.40753 5.73% 16721.08 3.02% 4999.85 3.42% 4083.6 2.52%
26-Apr-13 23608.11837 19286.72 5871.45 4591.65 23608.11837 5627.856353 6052.105345 7167.5096 25-Apr-08 18205.55019 5.33% 17125.98 2.40% 5111.7 2.81% 4162.55 1.98%
29-Apr-13 23740.7755 19387.5 5904.1 4620.9 23740.7755 5657.263912 6085.759934 7213.168493 28-Apr-08 18193.48195 5.47% 17015.96 2.64% 5089.65 3.01% 4156.9 2.14%
30-Apr-13 23834.55901 19504.18 5930.2 4641.75 23834.55901 5691.311085 6112.66299 7245.715089 29-Apr-08 18424.7027 5.28% 17378.46 2.33% 5195.5 2.68% 4233.25 1.86%
CRISIL Limited
CRISIL House, Central Avenue, Hiranandani Business Park,
Powai, Mumbai – 400 076, India
Tel: +91 22 3342 3000 Fax: +91 22 3342 8088
www.crisil.com
Association of Mutual Funds in India
One Indiabulls Centre, Tower 2, Wing B, 701, 7th Floor, 841
Senapati Bapat Marg, Elphinstone Road, Mumbai – 400 013
Tel: +91 22 2421 0093/2421 0383/4334 6700
Fax: +91 22 4334 6712/4334 6722
www.amfiindia.com