Embed Size (px)
Citation preview

This project has received funding from the European Union’s Horizon 2020 research and innovation programme under grant agreement No 740627.
CRIMSONTTX3 features
Guillaume INGLESE
DIGINEXT

COP User interface
o Start from desktop shortcut
o The application starts
Slide 2

COP User interface
o User log-in
o Select inprep-online
o (in-prep-local for the 10/10)
o Enter your user name and password
o rot-1 or trainer1
o 0123
o Select an Event
o Event_20191003
Slide 3

COP User interface
o Header bar: Buttons (layouts, notifications, …)
o Tabs
o Map, Coll. records
o Modelling results
o Drone Missions
o Footer bar
o Logged-in user
o Current event
Slide 4

COP User interface
o Header bar (from left to Right)
o Main menu: to quit
o Date/Time
o Layout: to have the map and collaborative table displayed
o Notifications button: when new information is available
o last buttons:
o Revert: to cancel a modification not yet shared
o Share: to send a modification
o Overview: to export information
Slide 5
COP User interface
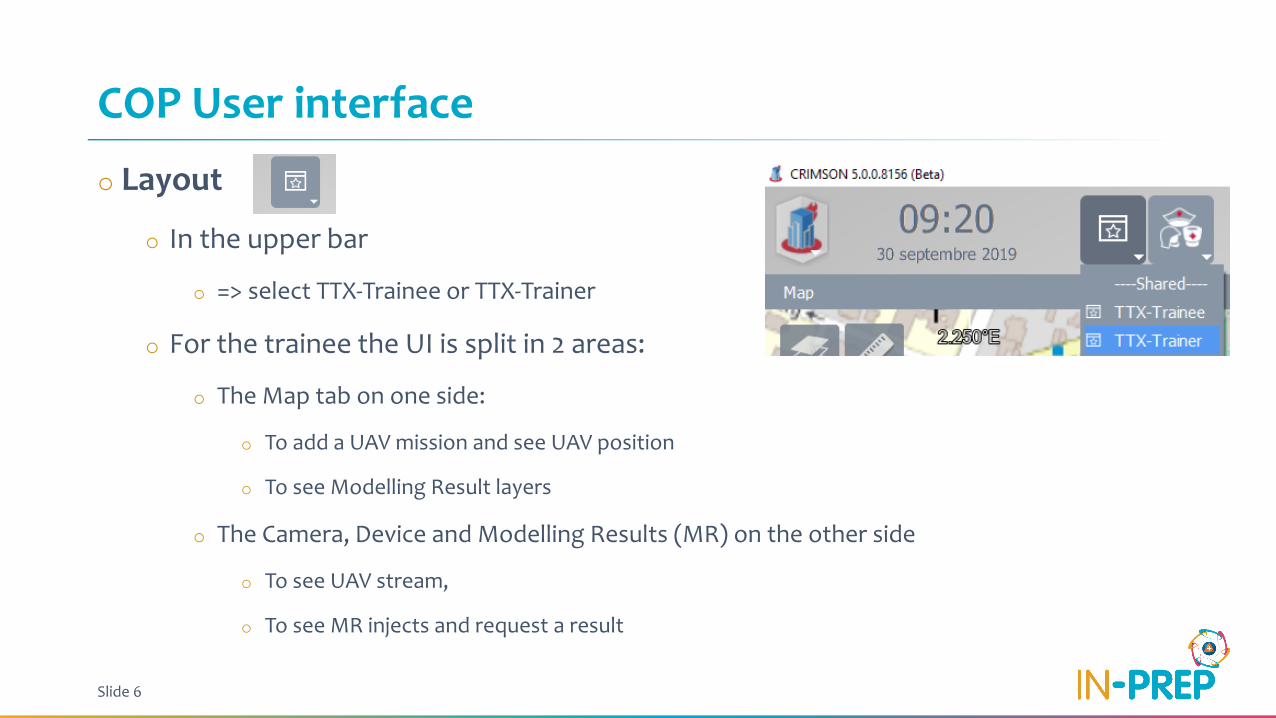
o Layout
o In the upper bar
o => select TTX-Trainee or TTX-Trainer
o For the trainee the UI is split in 2 areas:
o The Map tab on one side:
o To add a UAV mission and see UAV position
o To see Modelling Result layers
o The Camera, Device and Modelling Results (MR) on the other side
o To see UAV stream,
o To see MR injects and request a result
Slide 6

COP User interface
oMap Bookmark
o In the map upper right corner
o Provide bookmarked view to
specific area
o Kampen
o Den Haag (MR energy grid example)
o Spoleto (MR Evacuation example)
Slide 7

COP User interface: Drone Mission
o On the map
o From annotation Bar, click on Drone Missions
o Click on the map to add waypoints, double click to finish
o A popup window opens and display point list
o Enter a mission name and validate
o Share
Slide 8

COP User interface: Drone Position
o On the map: A drone icon is then visible
Slide 9

COP User interface: Drone Stream
o In the Device List,
o Select UAV-C and click on the “Assign” button
o The camera grid opens, click in one of the grid cell
to start displaying the stream.
Slide 10
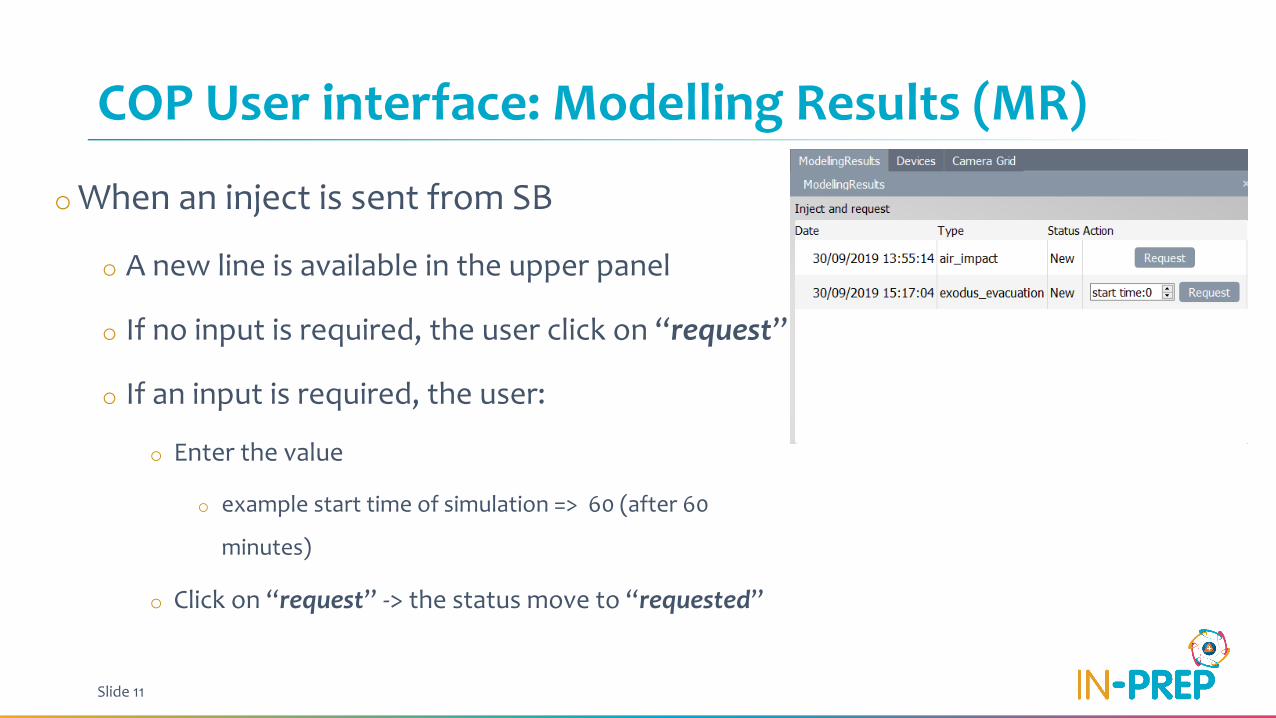
COP User interface: Modelling Results (MR)
oWhen an inject is sent from SB
o A new line is available in the upper panel
o If no input is required, the user click on “request”
o If an input is required, the user:
o Enter the value
o example start time of simulation => 60 (after 60
minutes)
o Click on “request” -> the status move to “requested”
Slide 11

COP User interface: Modelling results
oWhen the result is available
o A new line is available in the lower panel
o 3 cases:
o Static maps: One or more raster that can be displayed on top of the map (flood, impacts,
etc.)
o Dynamic maps: A list of raster than can be animated to see the simulation (evacuation for
instance)
o Numerical results: A table with a list of parameters and their values.
Slide 12

COP User interface: Modelling results
o Static maps
o One line per raster is provided
o User can display/hide the raster
and adjust opacity
o (Use bookmark to go to Den
Haag)
Slide 13

COP User interface: Modelling results
oDynamic maps (evacuation case)
o One line is provided with options
o User can
o Display/hide the result by checking the check box
o Play an animation to display one layer after the other by clicking on the ”play” button (and
stop it)
o Display a specific step or move step by step (forward or backward)
Slide 14

COP User interface: Modelling resultso Dynamic maps (evacuation case)
o Blues rectangles will be displayed at the location => use bookmark to go to Spoleto
Slide 15

COP User interface: Modelling results
oNumerical results
o A view button is available for each time a numerical result is available
o Clicking on view open a popup with a table
o 1 line per parameter name/value
Slide 16

COP User interface: Injects for this TTX
o Mainly for the trainer
o In the Collaborative table
o SB injects
o LCMS synopsis has attachment
Slide 17

COP User interface: other injects for this TTX
o In the Coll. Table
o LCMS synopsis has attachment
o Select the line and click on the attachment icon
o And click on view in the popup list
Slide 18