Embed Size (px)
Citation preview
U.S. Department of Justice Office of Justice Programs Bureau of Justice Statistics
Bureau of Justice Statistics · Statistical TablesJULY 2017, NCJ 250632
Crime Against Persons with Disabilities, 2009-2015 - Statistical Tables
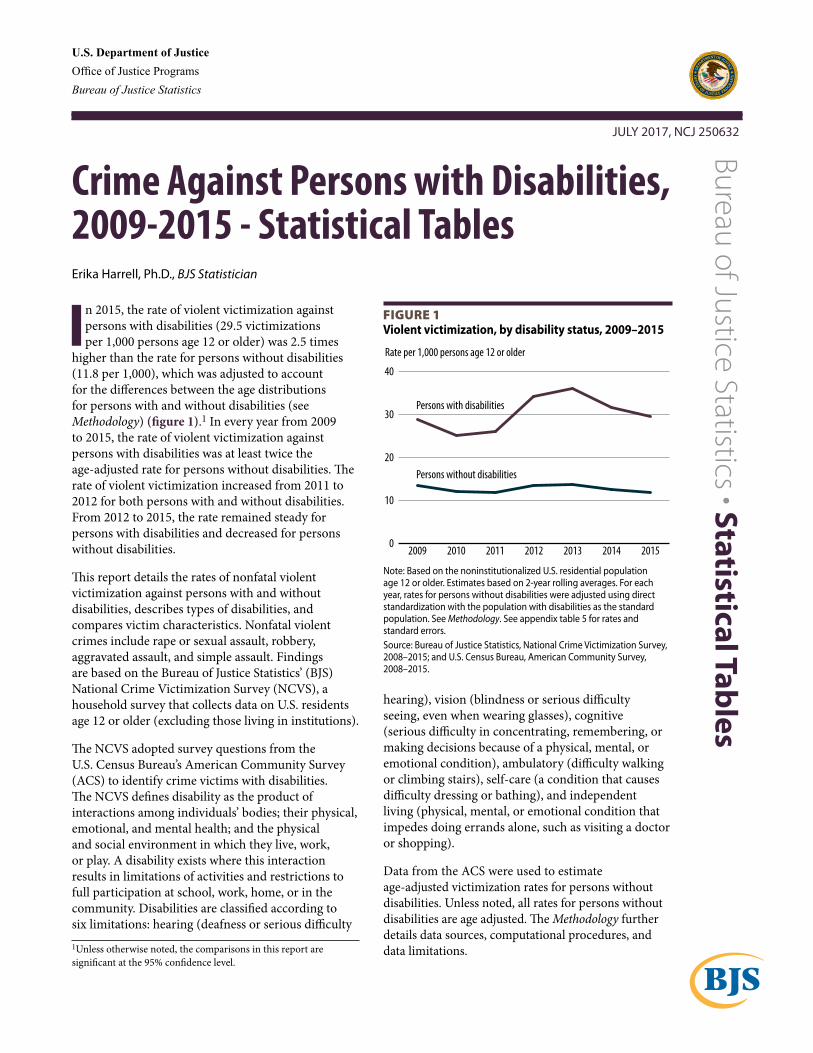
Figure 1Violent victimization, by disability status, 2009–2015
Note: Based on the noninstitutionalized U.S. residential population age 12 or older. Estimates based on 2-year rolling averages. For each year, rates for persons without disabilities were adjusted using direct standardization with the population with disabilities as the standard population. See Methodology. See appendix table 5 for rates and standard errors.Source: Bureau of Justice Statistics, National Crime Victimization Survey, 2008–2015; and U.S. Census Bureau, American Community Survey, 2008–2015.
Rate per 1,000 persons age 12 or older
0
10
20
30
40
2015201420132012201120102009
Persons with disabilities
Persons without disabilities
Erika Harrell, Ph.D., BJS Statistician
In 2015, the rate of violent victimization against persons with disabilities (29.5 victimizations per 1,000 persons age 12 or older) was 2.5 times
higher than the rate for persons without disabilities (11.8 per 1,000), which was adjusted to account for the differences between the age distributions for persons with and without disabilities (see Methodology) (figure 1).1 In every year from 2009 to 2015, the rate of violent victimization against persons with disabilities was at least twice the age-adjusted rate for persons without disabilities. The rate of violent victimization increased from 2011 to 2012 for both persons with and without disabilities. From 2012 to 2015, the rate remained steady for persons with disabilities and decreased for persons without disabilities.
This report details the rates of nonfatal violent victimization against persons with and without disabilities, describes types of disabilities, and compares victim characteristics. Nonfatal violent crimes include rape or sexual assault, robbery, aggravated assault, and simple assault. Findings are based on the Bureau of Justice Statistics’ (BJS) National Crime Victimization Survey (NCVS), a household survey that collects data on U.S. residents age 12 or older (excluding those living in institutions).
The NCVS adopted survey questions from the U.S. Census Bureau’s American Community Survey (ACS) to identify crime victims with disabilities. The NCVS defines disability as the product of interactions among individuals’ bodies; their physical, emotional, and mental health; and the physical and social environment in which they live, work, or play. A disability exists where this interaction results in limitations of activities and restrictions to full participation at school, work, home, or in the community. Disabilities are classified according to six limitations: hearing (deafness or serious difficulty
hearing), vision (blindness or serious difficulty seeing, even when wearing glasses), cognitive (serious difficulty in concentrating, remembering, or making decisions because of a physical, mental, or emotional condition), ambulatory (difficulty walking or climbing stairs), self-care (a condition that causes difficulty dressing or bathing), and independent living (physical, mental, or emotional condition that impedes doing errands alone, such as visiting a doctor or shopping).
Data from the ACS were used to estimate age-adjusted victimization rates for persons without disabilities. Unless noted, all rates for persons without disabilities are age adjusted. The Methodology further details data sources, computational procedures, and data limitations.1Unless otherwise noted, the comparisons in this report are
significant at the 95% confidence level.
Crime Against Persons with Disabilities, 2009-2015 - Statistical Tables | July 2017 2
List of tablesTAbLe 1. Rate of violent victimization and average annual number of persons, by victim’s disability status and age, 2011–2015
TAbLe 2. Rate of violent victimization against persons with and without disabilities, by type of crime, 2011–2015
TAbLe 3. Rate of violent victimization against persons with and without disabilities, by victim characteristics, 2011–2015
TAbLe 4. Rate of violent victimization against persons with disabilities, by disability type and type of crime, 2011–2015
TAbLe 5. Rate of violent victimization against persons with disabilities, by disability type and sex, 2011–2015
TAbLe 6. Percent of violent crime against persons with disabilities, by type of crime and number of disability types, 2011–2015
TAbLe 7. Rate of violent victimization, by number of disability types and type of crime, 2011–2015
TAbLe 8. Victim-offender relationship, by victim's disability status, 2011–2015
TAbLe 9. Time violent crime occurred, by victim's disability status, 2011–2015
TAbLe 10. Violent crime reported to police, by victim’s disability status and disability type, 2011–2015
TAbLe 11. Person who notified police of violent crime, by victim's disability status, 2011–2015
TAbLe 12. Reasons for not reporting violent crime to police, by victim's disability status, 2011–2015
TAbLe 13. Percent of violent victimizations in which assistance from a nonpolice victim services agency was received, by victim's disability status, 2011–2015
List of appendix tablesAPPenDix TAbLe 1. Unadjusted rates and standard errors of violent victimization against persons without disabilities, 2009–2015
APPenDix TAbLe 2. Unadjusted rates and standard errors for violent victimization against persons without disabilities, by type of crime, 2011–2015
APPenDix TAbLe 3. Unadjusted rates and standard errors for violent victimization against persons without disabilities, by victim characteristics, 2011–2015
APPenDix TAbLe 4. U.S. population, according to the U.S. Census Bureau's American Community Survey Public Use Microdata Sample data, by disability status and demographic characteristics, 2011–2015
APPenDix TAbLe 5. Rates and standard errors for figure 1: Violent victimization, by disability status, 2009–2015
APPenDix TAbLe 6. Standard errors for table 1: Rate of violent victimization and average annual number of persons, by victim's disability status and age, 2011–2015
APPenDix TAbLe 7. Standard errors for table 2: Rate of violent victimization against persons with and without disabilities, by type of crime, 2011–2015
APPenDix TAbLe 8. Standard errors for table 3: Rate of violent victimization against persons with and without disabilities, by victim characteristics, 2011–2015
APPenDix TAbLe 9. Standard errors for table 4: Rate of violent victimization against persons with disabilities, by disability type and type of crime, 2011–2015
APPenDix TAbLe 10. Standard errors for table 5: Rate of violent victimization against persons with disabilities, by disability type and sex, 2011–2015
APPenDix TAbLe 11. Standard errors for table 6: Percent of violent crime against persons with disabilities, by type of crime and number of disability types, 2011–2015
APPenDix TAbLe 12. Standard errors for table 7: Rate of violent victimization, by number of disability types and type of crime, 2011–2015
APPenDix TAbLe 13. Standard errors for table 8: Victim-offender relationship, by victim's disability status, 2011–2015
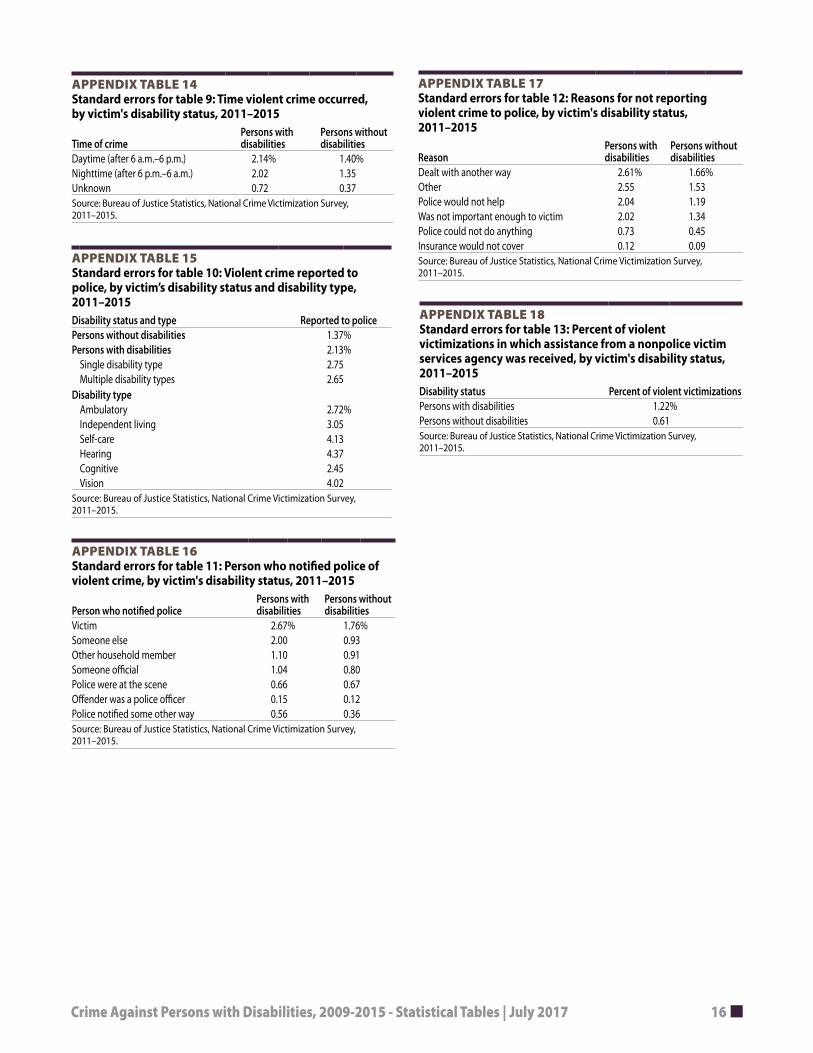
APPenDix TAbLe 14. Standard errors for table 9: Time violent crime occurred, by victim's disability status, 2011–2015
APPenDix TAbLe 15. Standard errors for table 10: Violent crime reported to police, by victim’s disability status and disability type, 2011–2015
APPenDix TAbLe 16. Standard errors for table 11: Person who notified police of violent crime, by victim's disability status, 2011–2015
APPenDix TAbLe 17. Standard errors for table 12: Reasons for not reporting violent crime to police, by victim's disability status, 2011–2015
APPenDix TAbLe 18. Standard errors for table 13: Percent of violent victimizations in which assistance from a nonpolice victim services agency was received, by victim's disability status, 2011–2015
Crime Against Persons with Disabilities, 2009-2015 - Statistical Tables | July 2017 3
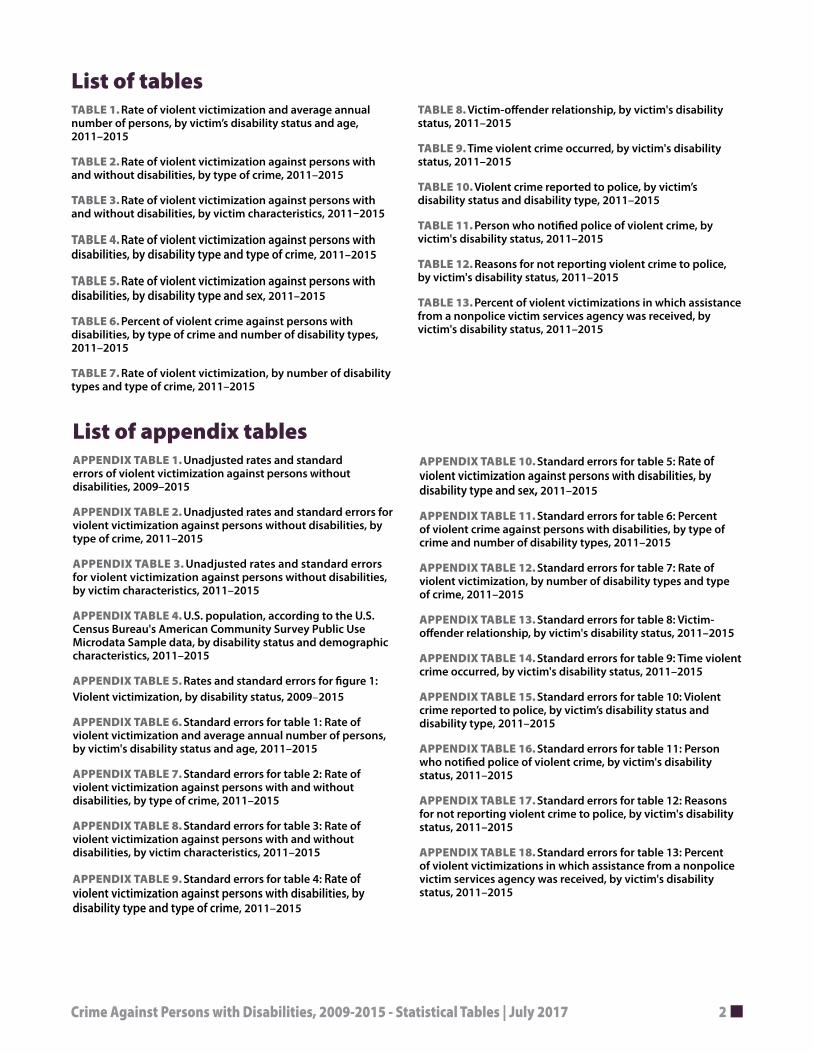
Violent crime by victim’s age and disability status
�� During the 5-year aggregate period from 2011 to 2015, for each age group measured except persons age 65 or older, the rate of violent victimization against persons with disabilities was at least 2.5 times the unadjusted rate for those without disabilities (table 1).
�� Among persons age 65 or older, there was no statistically significant difference between the rates of violent victimization by disability status.
TAbLe 1 Rate of violent victimization and average annual number of persons, by victim’s disability status and age, 2011–2015
Persons with disabilities Persons without disabilities*
Age
Average annual number
Rate per 1,000 persons
Average annual number
Rate per 1,000 persons
Total 37,157,340 32.3 † 226,696,790 20.412–15 938,300 144.1 † 15,682,970 38.816–19 966,680 86.6 † 16,097,530 31.420–24 1,276,180 83.4 † 20,982,730 29.625–34 2,493,140 64.5 † 39,370,470 26.335–49 5,387,430 58.2 † 56,038,570 19.750–64 10,482,880 31.2 † 50,818,180 12.765 or older 15,612,740 4.8 27,706,350 4.0Note: Based on the noninstitutionalized U.S. residential population age 12 or older. Rates for persons without disabilities are unadjusted. See appendix table 6 for standard errors. *Comparison group.†Significant difference from comparison group at 95% confidence level.Source: Bureau of Justice Statistics, National Crime Victimization Survey, 2011–2015; and U.S. Census Bureau, American Community Survey, 2011–2015.
Disability population in the United States
Between 2011 and 2015, 14% of the U.S. population age 12 or older living outside of institutions had a disability, according to the U.S. Census Bureau’s American Community Survey (ACS) (appendix table 4). Among noninstitutionalized persons with disabilities, 48% were male and 52% were female. Whites accounted for about 69% of the population with disabilities, followed by blacks (14%), Hispanics (11%), persons of other races (4%), and persons of two or more races (2%). Forty-two percent of the population with disabilities were age 65 or older, compared to 12% of the population without disabilities. The 2011 to 2015 ACS population estimates of persons by disability status were generated from the Public Use Microdata Sample.
Use of age-adjusted rates
The differences in age distributions between the persons with and without disabilities must be taken into account when making direct comparisons of the violent victimization rate between the two populations. The age distribution of persons with disabilities differs considerably from that of persons without disabilities, and violent crime victimization rates vary significantly with age.
According to the ACS, persons with disabilities are generally older than persons without disabilities. The age adjustment standardizes the rate of violence against persons without disabilities to show what the rate would be if persons without disabilities had the same age distribution as persons with disabilities.
Crime Victims with Disabilities Awareness Act
The Crime Victims with Disabilities Awareness Act, 1998 (P.L. 105-301) mandates that the National Crime Victimization Survey (NCVS) include statistics on crimes against persons with disabilities and the characteristics of these victims. The act was designed “to increase public awareness of the plight of victims of crime with developmental disabilities, to collect data to measure the magnitude of the problem, and to develop strategies to address the safety and justice needs of victims of crime with developmental disabilities.” Section 5 of the act directed the Department of Justice to include statistics relating to “the nature of crimes against persons with developmental disabilities; and the specific characteristics of the victims of those crimes” in the NCVS. This report is a part of BJS’s series on crime against persons with disabilities. More information can be found on the BJS website.
TAbLe 2Rate of violent victimization against persons with and without disabilities, by type of crime, 2011–2015
Type of crimePersons with disabilities
Persons without disabilities*
Total 32.3 † 12.7Serious violent crime 12.7 † 4.0
Rape/sexual assault 2.1 † 0.6Robbery 4.7 † 1.3Aggravated assault 5.9 † 2.1
Simple assault 19.6 † 8.7Note: Based on the noninstitutionalized U.S. residential population age 12 or older. Rates presented per 1,000 persons. Rates for persons without disabilities were adjusted using direct standardization with the population with disabilities as the standard population. See Methodology. See appendix table 7 for standard errors. *Comparison group.†Significant difference from comparison group at 95% confidence level.Source: Bureau of Justice Statistics, National Crime Victimization Survey, 2011–2015; and U.S. Census Bureau, American Community Survey, 2011–2015.
�� Among those with disabilities, persons ages 12 to 15 (144.1 per 1,000 age 12 or older) had the highest rate of violent victimization among all age groups measured.
Violent crime by type of crime
�� The rate of violent victimization against persons with disabilities (32.3 per 1,000 age 12 or older) was 2.5 times the rate for persons without disabilities (12.7 per 1,000) during 2011-15 (table 2).
Crime Against Persons with Disabilities, 2009-2015 - Statistical Tables | July 2017 4
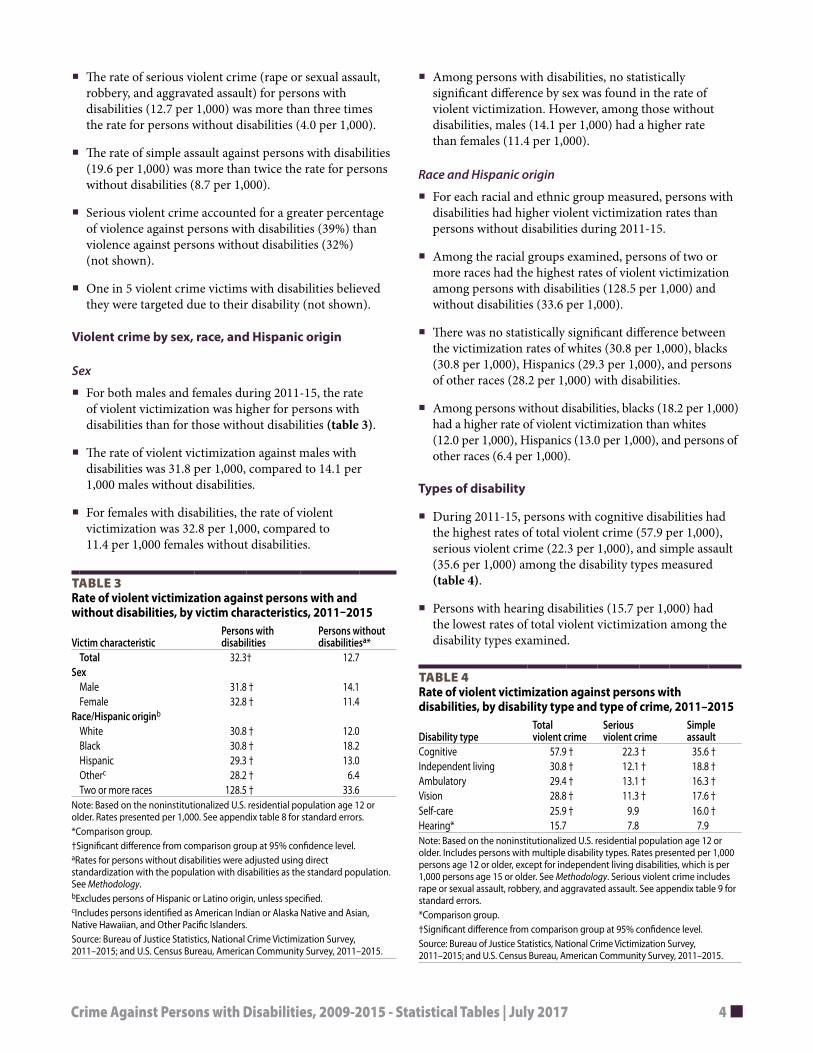
�� The rate of serious violent crime (rape or sexual assault, robbery, and aggravated assault) for persons with disabilities (12.7 per 1,000) was more than three times the rate for persons without disabilities (4.0 per 1,000).
�� The rate of simple assault against persons with disabilities (19.6 per 1,000) was more than twice the rate for persons without disabilities (8.7 per 1,000).
�� Serious violent crime accounted for a greater percentage of violence against persons with disabilities (39%) than violence against persons without disabilities (32%) (not shown).
�� One in 5 violent crime victims with disabilities believed they were targeted due to their disability (not shown).
Violent crime by sex, race, and Hispanic origin
Sex
�� For both males and females during 2011-15, the rate of violent victimization was higher for persons with disabilities than for those without disabilities (table 3).
�� The rate of violent victimization against males with disabilities was 31.8 per 1,000, compared to 14.1 per 1,000 males without disabilities.
�� For females with disabilities, the rate of violent victimization was 32.8 per 1,000, compared to 11.4 per 1,000 females without disabilities.
�� Among persons with disabilities, no statistically significant difference by sex was found in the rate of violent victimization. However, among those without disabilities, males (14.1 per 1,000) had a higher rate than females (11.4 per 1,000).
Race and Hispanic origin
�� For each racial and ethnic group measured, persons with disabilities had higher violent victimization rates than persons without disabilities during 2011-15.
�� Among the racial groups examined, persons of two or more races had the highest rates of violent victimization among persons with disabilities (128.5 per 1,000) and without disabilities (33.6 per 1,000).
�� There was no statistically significant difference between the victimization rates of whites (30.8 per 1,000), blacks (30.8 per 1,000), Hispanics (29.3 per 1,000), and persons of other races (28.2 per 1,000) with disabilities.
�� Among persons without disabilities, blacks (18.2 per 1,000) had a higher rate of violent victimization than whites (12.0 per 1,000), Hispanics (13.0 per 1,000), and persons of other races (6.4 per 1,000).
Types of disability
�� During 2011-15, persons with cognitive disabilities had the highest rates of total violent crime (57.9 per 1,000), serious violent crime (22.3 per 1,000), and simple assault (35.6 per 1,000) among the disability types measured (table 4).
�� Persons with hearing disabilities (15.7 per 1,000) had the lowest rates of total violent victimization among the disability types examined.
TAbLe 4Rate of violent victimization against persons with disabilities, by disability type and type of crime, 2011–2015
Disability typeTotal violent crime
Serious violent crime
Simple assault
Cognitive 57.9 † 22.3 † 35.6 †Independent living 30.8 † 12.1 † 18.8 †Ambulatory 29.4 † 13.1 † 16.3 †Vision 28.8 † 11.3 † 17.6 †Self-care 25.9 † 9.9 16.0 †Hearing* 15.7 7.8 7.9Note: Based on the noninstitutionalized U.S. residential population age 12 or older. Includes persons with multiple disability types. Rates presented per 1,000 persons age 12 or older, except for independent living disabilities, which is per 1,000 persons age 15 or older. See Methodology. Serious violent crime includes rape or sexual assault, robbery, and aggravated assault. See appendix table 9 for standard errors. *Comparison group.†Significant difference from comparison group at 95% confidence level. Source: Bureau of Justice Statistics, National Crime Victimization Survey, 2011–2015; and U.S. Census Bureau, American Community Survey, 2011–2015.
TAbLe 3 Rate of violent victimization against persons with and without disabilities, by victim characteristics, 2011–2015
Victim characteristicPersons with disabilities
Persons without disabilitiesa*
Total 32.3† 12.7Sex
Male 31.8 † 14.1Female 32.8 † 11.4
Race/Hispanic originb
White 30.8 † 12.0Black 30.8 † 18.2 Hispanic 29.3 † 13.0Otherc 28.2 † 6.4 Two or more races 128.5 † 33.6
Note: Based on the noninstitutionalized U.S. residential population age 12 or older. Rates presented per 1,000. See appendix table 8 for standard errors. *Comparison group.†Significant difference from comparison group at 95% confidence level.aRates for persons without disabilities were adjusted using direct standardization with the population with disabilities as the standard population. See Methodology.bExcludes persons of Hispanic or Latino origin, unless specified.cIncludes persons identified as American Indian or Alaska Native and Asian, Native Hawaiian, and Other Pacific Islanders.Source: Bureau of Justice Statistics, National Crime Victimization Survey, 2011–2015; and U.S. Census Bureau, American Community Survey, 2011–2015.
Crime Against Persons with Disabilities, 2009-2015 - Statistical Tables | July 2017 5
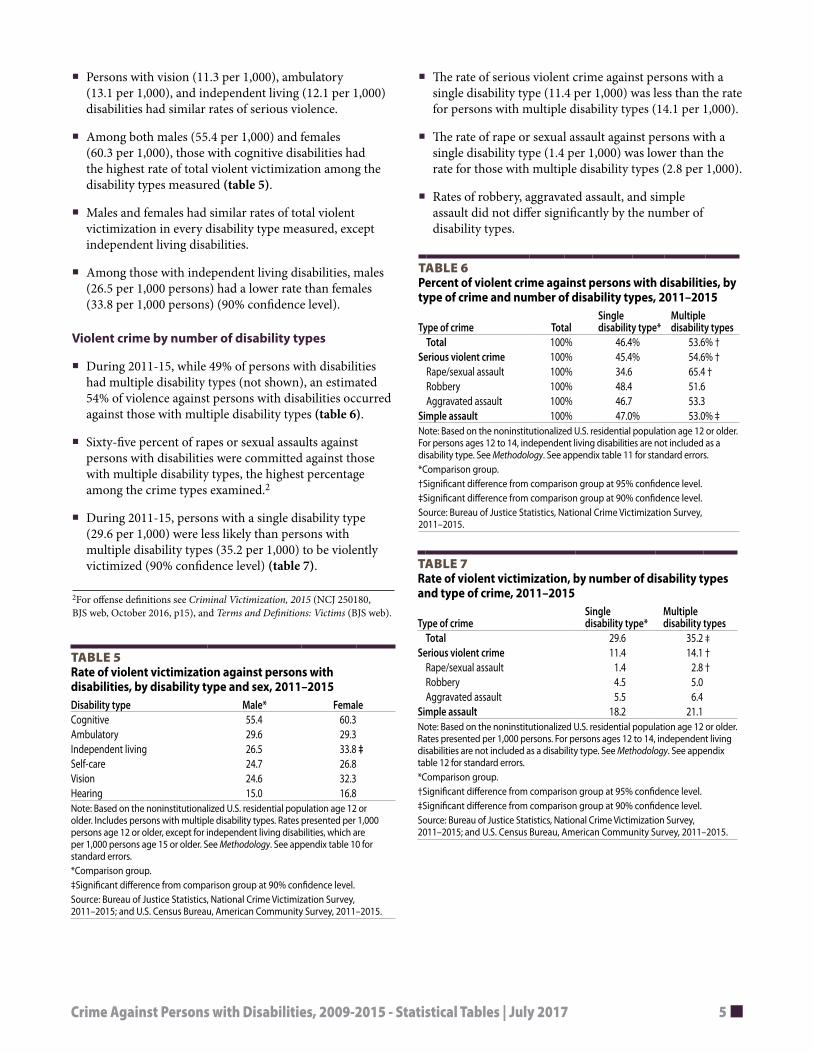
�� Persons with vision (11.3 per 1,000), ambulatory (13.1 per 1,000), and independent living (12.1 per 1,000) disabilities had similar rates of serious violence.
�� Among both males (55.4 per 1,000) and females (60.3 per 1,000), those with cognitive disabilities had the highest rate of total violent victimization among the disability types measured (table 5).
�� Males and females had similar rates of total violent victimization in every disability type measured, except independent living disabilities.
�� Among those with independent living disabilities, males (26.5 per 1,000 persons) had a lower rate than females (33.8 per 1,000 persons) (90% confidence level).
Violent crime by number of disability types
�� During 2011-15, while 49% of persons with disabilities had multiple disability types (not shown), an estimated 54% of violence against persons with disabilities occurred against those with multiple disability types (table 6).
�� Sixty-five percent of rapes or sexual assaults against persons with disabilities were committed against those with multiple disability types, the highest percentage among the crime types examined.2
�� During 2011-15, persons with a single disability type (29.6 per 1,000) were less likely than persons with multiple disability types (35.2 per 1,000) to be violently victimized (90% confidence level) (table 7).
�� The rate of serious violent crime against persons with a single disability type (11.4 per 1,000) was less than the rate for persons with multiple disability types (14.1 per 1,000).
�� The rate of rape or sexual assault against persons with a single disability type (1.4 per 1,000) was lower than the rate for those with multiple disability types (2.8 per 1,000).
�� Rates of robbery, aggravated assault, and simple assault did not differ significantly by the number of disability types.
TAbLe 5 Rate of violent victimization against persons with disabilities, by disability type and sex, 2011–2015Disability type Male* FemaleCognitive 55.4 60.3Ambulatory 29.6 29.3Independent living 26.5 33.8 ‡Self-care 24.7 26.8Vision 24.6 32.3Hearing 15.0 16.8Note: Based on the noninstitutionalized U.S. residential population age 12 or older. Includes persons with multiple disability types. Rates presented per 1,000 persons age 12 or older, except for independent living disabilities, which are per 1,000 persons age 15 or older. See Methodology. See appendix table 10 for standard errors.*Comparison group.‡Significant difference from comparison group at 90% confidence level.Source: Bureau of Justice Statistics, National Crime Victimization Survey, 2011–2015; and U.S. Census Bureau, American Community Survey, 2011–2015.
TAbLe 7 Rate of violent victimization, by number of disability types and type of crime, 2011–2015
Type of crimeSingle disability type*
Multiple disability types
Total 29.6 35.2 ‡Serious violent crime 11.4 14.1 †
Rape/sexual assault 1.4 2.8 †Robbery 4.5 5.0Aggravated assault 5.5 6.4
Simple assault 18.2 21.1Note: Based on the noninstitutionalized U.S. residential population age 12 or older. Rates presented per 1,000 persons. For persons ages 12 to 14, independent living disabilities are not included as a disability type. See Methodology. See appendix table 12 for standard errors. *Comparison group.†Significant difference from comparison group at 95% confidence level.‡Significant difference from comparison group at 90% confidence level.Source: Bureau of Justice Statistics, National Crime Victimization Survey, 2011–2015; and U.S. Census Bureau, American Community Survey, 2011–2015.
TAbLe 6 Percent of violent crime against persons with disabilities, by type of crime and number of disability types, 2011–2015
Type of crime TotalSingle disability type*
Multiple disability types
Total 100% 46.4% 53.6% †Serious violent crime 100% 45.4% 54.6% †
Rape/sexual assault 100% 34.6 65.4 †Robbery 100% 48.4 51.6Aggravated assault 100% 46.7 53.3
Simple assault 100% 47.0% 53.0% ‡Note: Based on the noninstitutionalized U.S. residential population age 12 or older. For persons ages 12 to 14, independent living disabilities are not included as a disability type. See Methodology. See appendix table 11 for standard errors.*Comparison group.†Significant difference from comparison group at 95% confidence level.‡Significant difference from comparison group at 90% confidence level.Source: Bureau of Justice Statistics, National Crime Victimization Survey, 2011–2015.
2For offense definitions see Criminal Victimization, 2015 (NCJ 250180, BJS web, October 2016, p15), and Terms and Definitions: Victims (BJS web).
Crime Against Persons with Disabilities, 2009-2015 - Statistical Tables | July 2017 6
Victim-offender relationship
�� A higher percentage of violence against persons with disabilities (40%) was committed by persons the victims knew well or who were casual acquaintances than against persons without disabilities (32%) (table 8).
�� A lower percentage of total violence against persons with disabilities (30%) was committed by strangers than against persons without disabilities (39%) during 2011-15.
�� There was no statistically significant difference in the percentage of total violence committed by intimate partners (including spouses, ex-spouses, boyfriends, and girlfriends) of victims with (15%) and without (13%) disabilities.
�� Other relatives (including parents, children, and other relatives) accounted for a higher percentage of violence against persons with disabilities (10%) than persons without disabilities (6%).
Time of crime
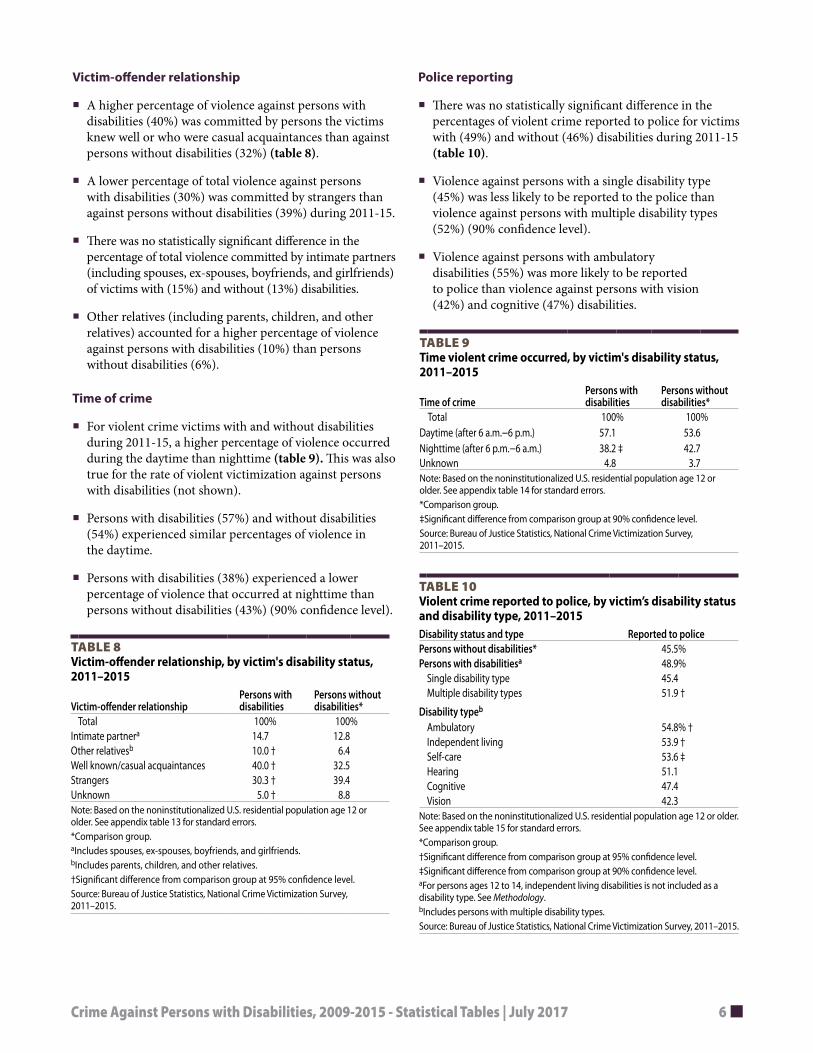
�� For violent crime victims with and without disabilities during 2011-15, a higher percentage of violence occurred during the daytime than nighttime (table 9). This was also true for the rate of violent victimization against persons with disabilities (not shown).
�� Persons with disabilities (57%) and without disabilities (54%) experienced similar percentages of violence in the daytime.
�� Persons with disabilities (38%) experienced a lower percentage of violence that occurred at nighttime than persons without disabilities (43%) (90% confidence level).
TAbLe 8Victim-offender relationship, by victim's disability status, 2011–2015
Victim-offender relationshipPersons with disabilities
Persons without disabilities*
Total 100% 100%Intimate partnera 14.7 12.8Other relativesb 10.0 † 6.4Well known/casual acquaintances 40.0 † 32.5Strangers 30.3 † 39.4Unknown 5.0 † 8.8Note: Based on the noninstitutionalized U.S. residential population age 12 or older. See appendix table 13 for standard errors. *Comparison group. aIncludes spouses, ex-spouses, boyfriends, and girlfriends. bIncludes parents, children, and other relatives.†Significant difference from comparison group at 95% confidence level.Source: Bureau of Justice Statistics, National Crime Victimization Survey, 2011–2015.
TAbLe 9Time violent crime occurred, by victim's disability status, 2011–2015
Time of crimePersons with disabilities
Persons without disabilities*
Total 100% 100%Daytime (after 6 a.m.–6 p.m.) 57.1 53.6Nighttime (after 6 p.m.–6 a.m.) 38.2 ‡ 42.7Unknown 4.8 3.7Note: Based on the noninstitutionalized U.S. residential population age 12 or older. See appendix table 14 for standard errors. *Comparison group.‡Significant difference from comparison group at 90% confidence level.Source: Bureau of Justice Statistics, National Crime Victimization Survey, 2011–2015.
TAbLe 10 Violent crime reported to police, by victim’s disability status and disability type, 2011–2015Disability status and type Reported to policePersons without disabilities* 45.5%Persons with disabilitiesa 48.9%
Single disability type 45.4Multiple disability types 51.9 †
Disability typeb
Ambulatory 54.8% †Independent living 53.9 †Self-care 53.6 ‡Hearing 51.1Cognitive 47.4Vision 42.3
Note: Based on the noninstitutionalized U.S. residential population age 12 or older. See appendix table 15 for standard errors.*Comparison group.†Significant difference from comparison group at 95% confidence level.‡Significant difference from comparison group at 90% confidence level.aFor persons ages 12 to 14, independent living disabilities is not included as a disability type. See Methodology.bIncludes persons with multiple disability types.Source: Bureau of Justice Statistics, National Crime Victimization Survey, 2011–2015.
Police reporting
�� There was no statistically significant difference in the percentages of violent crime reported to police for victims with (49%) and without (46%) disabilities during 2011-15 (table 10).
�� Violence against persons with a single disability type (45%) was less likely to be reported to the police than violence against persons with multiple disability types (52%) (90% confidence level).
�� Violence against persons with ambulatory disabilities (55%) was more likely to be reported to police than violence against persons with vision (42%) and cognitive (47%) disabilities.
Crime Against Persons with Disabilities, 2009-2015 - Statistical Tables | July 2017 7
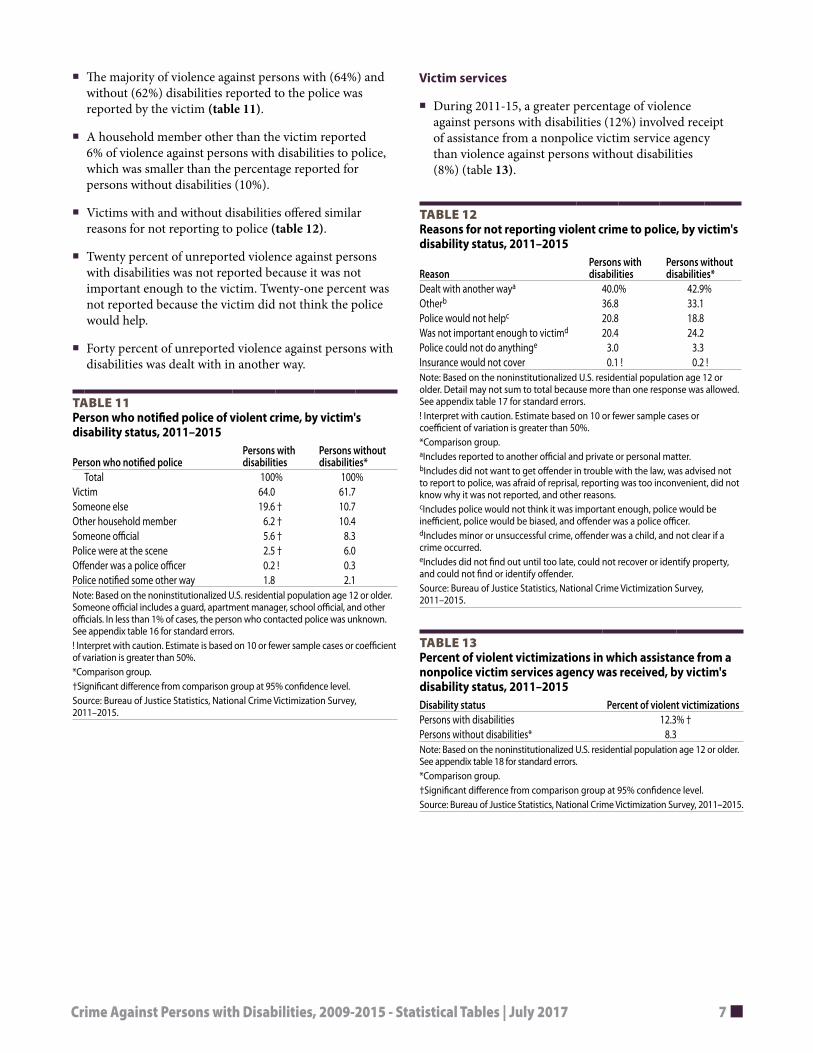
�� The majority of violence against persons with (64%) and without (62%) disabilities reported to the police was reported by the victim (table 11).
�� A household member other than the victim reported 6% of violence against persons with disabilities to police, which was smaller than the percentage reported for persons without disabilities (10%).
�� Victims with and without disabilities offered similar reasons for not reporting to police (table 12).
�� Twenty percent of unreported violence against persons with disabilities was not reported because it was not important enough to the victim. Twenty-one percent was not reported because the victim did not think the police would help.
�� Forty percent of unreported violence against persons with disabilities was dealt with in another way.
TAbLe 11Person who notified police of violent crime, by victim's disability status, 2011–2015
Person who notified policePersons with disabilities
Persons without disabilities*
Total 100% 100%Victim 64.0 61.7Someone else 19.6 † 10.7Other household member 6.2 † 10.4Someone official 5.6 † 8.3Police were at the scene 2.5 † 6.0Offender was a police officer 0.2 ! 0.3Police notified some other way 1.8 2.1Note: Based on the noninstitutionalized U.S. residential population age 12 or older. Someone official includes a guard, apartment manager, school official, and other officials. In less than 1% of cases, the person who contacted police was unknown. See appendix table 16 for standard errors.! Interpret with caution. Estimate is based on 10 or fewer sample cases or coefficient of variation is greater than 50%.*Comparison group.†Significant difference from comparison group at 95% confidence level.Source: Bureau of Justice Statistics, National Crime Victimization Survey, 2011–2015.
TAbLe 12Reasons for not reporting violent crime to police, by victim's disability status, 2011–2015
ReasonPersons with disabilities
Persons without disabilities*
Dealt with another waya 40.0% 42.9%Otherb 36.8 33.1Police would not helpc 20.8 18.8Was not important enough to victimd 20.4 24.2Police could not do anythinge 3.0 3.3Insurance would not cover 0.1 ! 0.2 !Note: Based on the noninstitutionalized U.S. residential population age 12 or older. Detail may not sum to total because more than one response was allowed. See appendix table 17 for standard errors.! Interpret with caution. Estimate based on 10 or fewer sample cases or coefficient of variation is greater than 50%.*Comparison group.aIncludes reported to another official and private or personal matter.bIncludes did not want to get offender in trouble with the law, was advised not to report to police, was afraid of reprisal, reporting was too inconvenient, did not know why it was not reported, and other reasons.cIncludes police would not think it was important enough, police would be inefficient, police would be biased, and offender was a police officer.dIncludes minor or unsuccessful crime, offender was a child, and not clear if a crime occurred.eIncludes did not find out until too late, could not recover or identify property, and could not find or identify offender.Source: Bureau of Justice Statistics, National Crime Victimization Survey, 2011–2015.
TAbLe 13 Percent of violent victimizations in which assistance from a nonpolice victim services agency was received, by victim's disability status, 2011–2015Disability status Percent of violent victimizationsPersons with disabilities 12.3% †Persons without disabilities* 8.3Note: Based on the noninstitutionalized U.S. residential population age 12 or older. See appendix table 18 for standard errors. *Comparison group.†Significant difference from comparison group at 95% confidence level.Source: Bureau of Justice Statistics, National Crime Victimization Survey, 2011–2015.
Victim services
�� During 2011-15, a greater percentage of violence against persons with disabilities (12%) involved receipt of assistance from a nonpolice victim service agency than violence against persons without disabilities (8%) (table 13).
Crime Against Persons with Disabilities, 2009-2015 - Statistical Tables | July 2017 8
MethodologySurvey coverage
The National Crime Victimization Survey (NCVS) is an annual data collection conducted by the U.S. Census Bureau for the Bureau of Justice Statistics (BJS). The NCVS is a self-report survey in which interviewed persons are asked about the number and characteristics of victimizations they experienced during the prior 6 months. The NCVS collects information on nonfatal personal crimes (rape or sexual assault, robbery, aggravated assault, simple assault, and personal larceny) and household property crimes (burglary, motor vehicle theft, and other theft) both reported and not reported to police. In addition to providing annual level and change estimates on criminal victimization, the NCVS is the primary source of information on the nature of criminal victimization incidents.
Survey respondents provide information about themselves (e.g., age, sex, race and Hispanic origin, marital status, education level, and income) and whether they experienced a victimization. The NCVS collects information for each victimization incident about the offender as perceived by the victim (e.g., sex, race, Hispanic origin, age, and victim-offender relationship), characteristics of the crime (including time and place of occurrence, use of weapons, nature of injury, and economic consequences), whether the crime was reported to police, reasons the crime was or was not reported, and experiences with the criminal justice system.
The NCVS is administered to persons age 12 or older from a nationally representative sample of households in the United States. The survey defines a household as a group of persons who all reside at a sampled address. Persons are considered household members when the sampled address is their usual place of residence at the time of the interview and when they have no usual place of residence elsewhere. Once selected, households remain in the sample for 3 years, and eligible persons in these households are interviewed every 6 months either in person or over the phone for a total of seven interviews.
Generally, all first interviews are conducted in person, with subsequent interviews conducted either in person or by phone. New households rotate into the sample on an ongoing basis to replace outgoing households that have been in the sample for a 3-year period. The sample includes persons living in group quarters (such as dormitories, rooming houses, and religious group dwellings) and excludes persons living in military barracks and institutional settings (such as correctional or hospital facilities) and persons who are homeless.
In 2007, the NCVS adopted questions from the U.S. Census Bureau’s American Community Survey (ACS) to measure the rate of victimization against persons with disabilities. The NCVS does not identify persons in the general population with disabilities.3 The ACS Subcommittee on Disability Questions developed the disability questions based on those used in the 2000 Decennial Census and earlier versions of the ACS. The questions identify persons who may require assistance to maintain their independence, be at risk for discrimination, or lack opportunities available to the general population because of limitations related to a prolonged (i.e., 6 months or longer) sensory, physical, mental, or emotional condition. More information about the ACS and the disability questions is available on the U.S. Census Bureau’s website at https://www.census.gov/people/disability/methodology/acs.html.
Changes to the disability questions in the NCVS and ACS in 2008
In 2008, the U.S. Census Bureau changed some of the disability questions on the ACS. The question about sensory disability was separated into two questions about blindness and deafness, and the questions about physical disability asked only about serious difficulty walking or climbing stairs. Also, questions on employment disability and going outside of the home were eliminated in 2008. Analysis of 2007 and 2008 ACS disability data by the U.S. Census Bureau revealed significant conceptual and measurement differences between the 2007 and 2008 disability questions. The U.S. Census Bureau concluded that data users should not compare the 2007 estimates of the population with disabilities to those of later years. Because the 2007 and 2008 NCVS disability questions mirrored the ACS disability questions, estimates of victimization of persons with disabilities from the 2007 and 2008 NCVS should not be compared. As a result, the 2007 disability data are not presented in this report. Further explanation about incomparability of the 2007 and 2008 ACS disability data is available at https://www.census.gov/people/disability/files/2008ACS_disability.pdf.
3Beginning in July 2016, questions about disability status of victims were removed from the crime incident form of the NCVS. The questions were placed on the screener questionnaire to ask about the disability status of the general noninstitutionalized household population.
Crime Against Persons with Disabilities, 2009-2015 - Statistical Tables | July 2017 9
Disability questions included in the NCVS between 2009 and 2015
Questions 169a through 173
169a. Are you deaf or do you have serious difficulty hearing?
169b. Are you blind or do you have serious difficulty seeing, even when wearing glasses?
170a. Because of a physical, mental, or emotional condition, do you have serious difficulty—
�� concentrating, remembering, or making decisions
�� walking or climbing stairs
�� dressing or bathing?
170b. Because of a physical, mental, or emotional condition, do you have difficulty doing errands alone, such as visiting a doctor’s office or shopping?
171. Is “Yes” marked in any of 169a-170b? (That is, has the respondent indicated that he/she has a health condition or disability?)
172. During the incident you just told me about, do you have reason to suspect you were victimized because of your health condition(s), impairment(s), or disability(ies)?
173. What health conditions, impairments, or disabilities do you believe caused you to be targeted for this incident?
Age limitation on independent living disabilities
In the ACS, persons ages 12 to 14 are not asked about having an independent living disability and are, therefore, excluded from the populations with independent living disabilities. Even though crime victims ages 12 to 14 receive this question in the NCVS (question 170b), victims ages 12 to 14 who respond affirmatively are excluded from rates of violent victimization against persons with an independent living disability to match the age limitations for having an independent living disability in the ACS (age 15 or older). In this report, rates of violence against persons with an independent living disability are per 1,000 persons age 15 or older, compared to rates per 1,000 persons age 12 or older for other disability types. Also, violent crime victims ages 12 to 14 who report in the NCVS that they have an independent living disability and no other disability type are classified as not having a disability, to be compatible with age limits on the disability definitions in the ACS.
Limitations of the estimates
The NCVS was designed to measure the incidence of criminal victimization against the U.S. civilian household population, excluding persons who live in institutions and the homeless. Institutions include adult correctional facilities, juvenile facilities, nursing or skilled nursing facilities, inpatient hospice facilities, residential schools for persons with disabilities, and hospitals with patients who have no usual home elsewhere. The measures of crime against persons with disabilities (as measured by the NCVS) cover only persons with disabilities who are living among the general population in household settings. Subsequently, there is some coverage error in using solely the noninstitutionalized population. For example, according to the ACS, about 95% of the 1.3 million persons age 65 or older living in institutions had disabilities in 2015 (not shown). Because persons in these facilities would not be covered in the NCVS, estimates of violence against these persons were not counted. The lack of information from the institutions will result in an undercount of violence against persons with disabilities.
Certain aspects of the NCVS design can also contribute to underestimating the level or type of violence against persons with disabilities. For example, the survey instruments, modes of interview, and interviewing protocols used in the NCVS may not be suited for interviewing persons who have difficulty communicating, especially by telephone. Some persons have disabilities that limit their verbal communication and use technology to enhance their ability to communicate, but many persons do not have access to such technology.
Proxy interviews may also lead to an underestimate of violence against persons with disabilities. The survey requires direct interviews with eligible respondents but allows the use of proxy interviews with a caregiver or other eligible party in a limited set of circumstances. A proxy interview is allowed when a respondent is physically or mentally incapable of responding. The survey restrictions on proxy interviews were instituted because someone else may not know about the victimization experiences of the respondent, or because the person providing the information via proxy may be the perpetrator of the violence experienced by the respondent. Because proxy respondents may be more likely to omit crime incidents or may not know some details about reported incidents, the number or types of crimes against persons with disabilities may be underestimated.
Crime Against Persons with Disabilities, 2009-2015 - Statistical Tables | July 2017 10
In 2015, information from about 6% of violent crime incidents against persons with disabilities was obtained from proxy interviews. In addition, 76% of the reports of violent incidents against persons with disabilities obtained through proxy interviews were for simple assault, compared to about 58% of reports of violent incidents against persons with disabilities obtained through nonproxy interviews (not shown).
Public Use Microdata Sample data
To generate populations by disability status between 2008 and 2015, Public Use Microdata Sample (PUMS) data from the U.S. Census Bureau’s ACS were used to calculate populations by disability status. The ACS PUMS dataset is a sample of population and housing unit records from the ACS. Usually, the PUMS files include about two-thirds of the cases contained in the larger, complete confidential dataset. The ACS PUMS files include the actual responses collected in ACS questionnaires, although some responses have been edited to protect the confidentiality of respondents. The ACS PUMS file included sample weights for each person and housing unit, which were applied to the individual records to expand the sample to estimate totals and percentages of the full population. For more information on ACS PUMS data from the U.S. Census Bureau, see https://www.census.gov/programs-surveys/acs/technical-documentation/pums.html.
Direct standardization
To generate age-adjusted rates of violent victimization of persons without disabilities, direct standardization was used with the population with disabilities as the standard population.4 This procedure eliminates the problem of different age distributions between and within groups. In general, persons with disabilities are an older population than persons without disabilities. Because of this and due to the fact that crime rates vary by age, direct standardization produces age-adjusted rates for persons without disabilities that would occur if the population without disabilities had the same age distribution as the population with disabilities.
The age-adjusted violent victimization rate, using direct standardization (Rd), is calculated as—
Rd = Σ (wa * ra)
where
Rd = age-adjusted rate of violent victimization of the population without disabilities calculated using direct standardization
wa = weight calculated from the population with disabilities for age-group a
ra = unadjusted rate of violent victimization of persons without disabilities in age-group a.
The weight (wa) for age-group a is calculated as—
wa = na / N
where
wa = weight calculated from the population with disabilities for age-group a
na = number of persons in age-group a in the population with disabilities
N = total number of persons in the population with disabilities.
In figure 1, for each year, unadjusted rates were calculated for persons with disabilities. For persons without disabilities, rates were age-adjusted to the population with disabilities for that year. For example, the 2014-15 rate of violent victimization against persons with disabilities was unadjusted. The 2014-15 rate of violent victimization against persons without disabilities was age-adjusted using the 2014-15 population with disabilities as the standard population.
Change in direct standardization calculations
In previous BJS reports about crimes against persons with disabilities, several different methods were used to calculate age-adjusted rates. More specifically, changes in the standard population were made. In the past, the population without disabilities and the 2000 U.S. standard population generated by the U.S. Census Bureau have both been used as the standard population in calculating age-adjusted rates for persons with and without disabilities. Each time a change was made to the standard population, rates for all years were recalculated using the new standard population. This resulted in previous years having different rates from earlier reports.
Nonresponse and weighting adjustments
In 2015, about 95,760 households and 163,880 persons age 12 or older were interviewed for the NCVS. Each household was interviewed twice during the year. The response rate was 82% for households and 86% for eligible persons. Victimizations that occurred outside of the United States were excluded from this report. In 2015, less than 1% of the unweighted victimizations occurred outside of the United States and were excluded from the analyses.
4For more information on direct standardization, see Curtin, L. R. & Klein, R. J. (1995). Direct standardization (age-adjusted death rates). Healthy People 2000: Statistical Notes, 6 Revised. Available at https://www.cdc.gov/nchs/data/statnt/statnt06rv.pdf.
Crime Against Persons with Disabilities, 2009-2015 - Statistical Tables | July 2017 11
Estimates in this report use data from the 2008 to 2015 NCVS data files weighted to produce annual estimates for persons age 12 or older living in U.S. households. Because the NCVS relies on a sample rather than a census of the entire U.S. population, weights are designed to inflate sample point estimates to known population totals and to compensate for survey nonresponse and other aspects of the sample design.
The NCVS data files include both household and person weights. The household weight is commonly used to calculate estimates of property crimes, such as motor vehicle theft or burglary, which are identified with the household. Person weights provide an estimate of the population represented by each person in the sample. Person weights are most frequently used to compute estimates of crime victimizations of persons in the total population. After proper adjustment, both household and person weights are also used to form the denominator in calculations of crime rates.
The victimization weights used in this analysis account for the number of persons present during an incident and for repeat victims when a series of incidents occurs. The weighting counts a series of incidents as the actual number of incidents reported by the victim, up to a maximum of 10 incidents. Series victimizations are victimizations that are similar in type but occur with such frequency that a victim is unable to recall each individual event or to describe each event in detail. Survey procedures allow NCVS interviewers to identify and classify these similar victimizations as series victimizations and collect detailed information on only the most recent incident in the series. In 2015, series incidents accounted for about 1% of all victimizations and 4% of all violent victimizations. The approach to weighting series incidents as the number of incidents up to a maximum of 10 produces more reliable estimates of crime levels, while the cap at 10 minimizes the effect of extreme outliers on the rates. Additional information on the series enumeration is detailed in the report Methods for Counting High Frequency Repeat Victimizations in the National Crime Victimization Survey (NCJ 237308, BJS web, April 2012).
Standard error computations for percentages and unadjusted rates
When national estimates are derived from a sample, as is the case with the NCVS, caution must be taken when comparing one estimate to another or when comparing estimates over time. Although one estimate may be larger than another, estimates based on a sample have some degree of sampling error. The sampling error of an estimate depends on several factors, including the amount of variation in the responses, the size of the sample, and the size of the subgroup for which the estimate is computed. When the sampling error around the estimates is taken into consideration, estimates that appear different may not be statistically different.
One measure of the sampling error associated with an estimate is the standard error. The standard error can vary from one estimate to another. In general, for a given metric, an estimate with a smaller standard error provides a more reliable approximation of the true value than an estimate with a larger standard error. Estimates with relatively large standard errors are associated with less precision and reliability and should be interpreted with caution.
To generate standard errors around numbers and estimates from the NCVS, the U.S. Census Bureau produces generalized variance function (GVF) parameters for BJS. GVFs take into account aspects of the NCVS complex sample design and represent the curve fitted to a selection of individual standard errors based on the Jackknife Repeated Replication technique. GVF parameters were used to generate standard errors for each point estimate (such as counts, percentages, and unadjusted rates) in this report. For estimates, standard errors were based on the ratio of the sums of victimizations and respondents across years.
BJS conducted tests to determine whether differences in estimated percentages and unadjusted rates in this report were statistically significant once sampling error was taken into account. Using statistical programs developed specifically for the NCVS, all comparisons in the text were tested for significance. The primary test procedure was the Student’s t-statistic, which tests the difference between two sample estimates. Unless otherwise noted, the findings described in this report as higher, lower, or different passed a test at the 0.05 level of statistical significance (95% confidence level). Findings that passed a test at the 0.10 level of significance are noted as such in the text (90% confidence level). Caution is required when comparing estimates not explicitly discussed in this report.
Crime Against Persons with Disabilities, 2009-2015 - Statistical Tables | July 2017 12
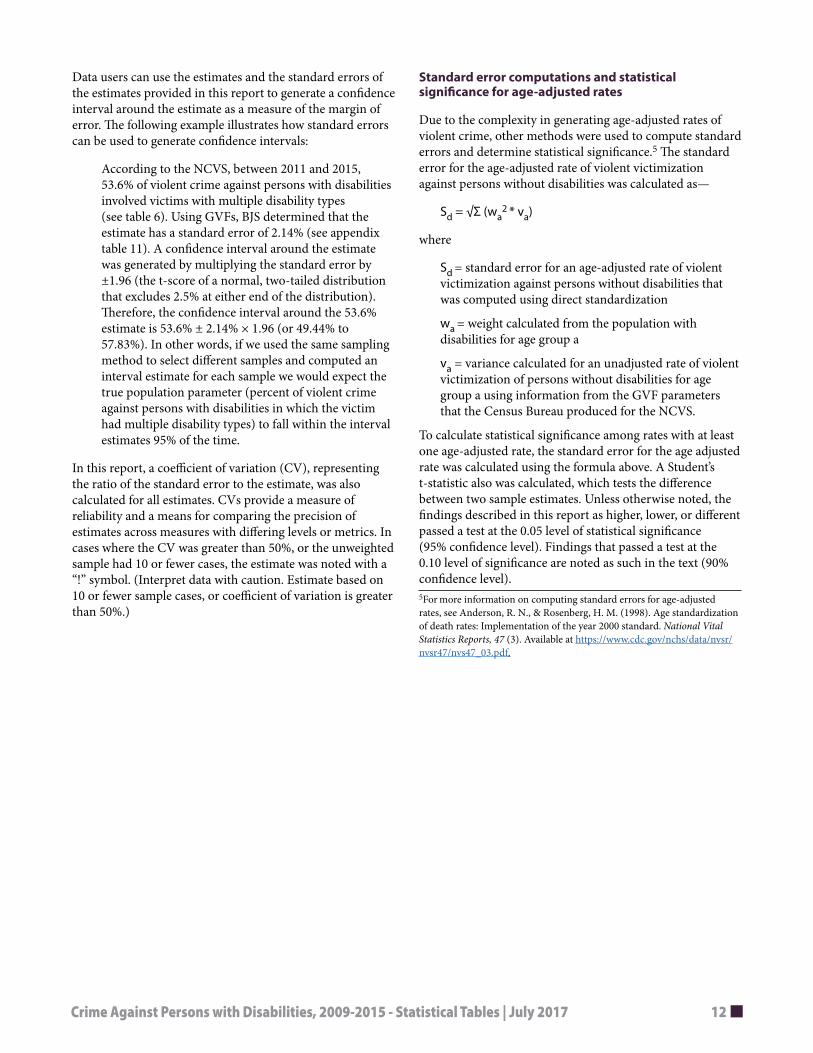
Data users can use the estimates and the standard errors of the estimates provided in this report to generate a confidence interval around the estimate as a measure of the margin of error. The following example illustrates how standard errors can be used to generate confidence intervals:
According to the NCVS, between 2011 and 2015, 53.6% of violent crime against persons with disabilities involved victims with multiple disability types (see table 6). Using GVFs, BJS determined that the estimate has a standard error of 2.14% (see appendix table 11). A confidence interval around the estimate was generated by multiplying the standard error by ±1.96 (the t-score of a normal, two-tailed distribution that excludes 2.5% at either end of the distribution). Therefore, the confidence interval around the 53.6% estimate is 53.6% ± 2.14% × 1.96 (or 49.44% to 57.83%). In other words, if we used the same sampling method to select different samples and computed an interval estimate for each sample we would expect the true population parameter (percent of violent crime against persons with disabilities in which the victim had multiple disability types) to fall within the interval estimates 95% of the time.
In this report, a coefficient of variation (CV), representing the ratio of the standard error to the estimate, was also calculated for all estimates. CVs provide a measure of reliability and a means for comparing the precision of estimates across measures with differing levels or metrics. In cases where the CV was greater than 50%, or the unweighted sample had 10 or fewer cases, the estimate was noted with a “!” symbol. (Interpret data with caution. Estimate based on 10 or fewer sample cases, or coefficient of variation is greater than 50%.)
Standard error computations and statistical significance for age-adjusted rates
Due to the complexity in generating age-adjusted rates of violent crime, other methods were used to compute standard errors and determine statistical significance.5 The standard error for the age-adjusted rate of violent victimization against persons without disabilities was calculated as—
Sd = √Σ (wa2 * va)
where
Sd = standard error for an age-adjusted rate of violent victimization against persons without disabilities that was computed using direct standardization
wa = weight calculated from the population with disabilities for age group a
va = variance calculated for an unadjusted rate of violent victimization of persons without disabilities for age group a using information from the GVF parameters that the Census Bureau produced for the NCVS.
To calculate statistical significance among rates with at least one age-adjusted rate, the standard error for the age adjusted rate was calculated using the formula above. A Student’s t-statistic also was calculated, which tests the difference between two sample estimates. Unless otherwise noted, the findings described in this report as higher, lower, or different passed a test at the 0.05 level of statistical significance (95% confidence level). Findings that passed a test at the 0.10 level of significance are noted as such in the text (90% confidence level).5For more information on computing standard errors for age-adjusted rates, see Anderson, R. N., & Rosenberg, H. M. (1998). Age standardization of death rates: Implementation of the year 2000 standard. National Vital Statistics Reports, 47 (3). Available at https://www.cdc.gov/nchs/data/nvsr/nvsr47/nvs47_03.pdf.
Crime Against Persons with Disabilities, 2009-2015 - Statistical Tables | July 2017 13
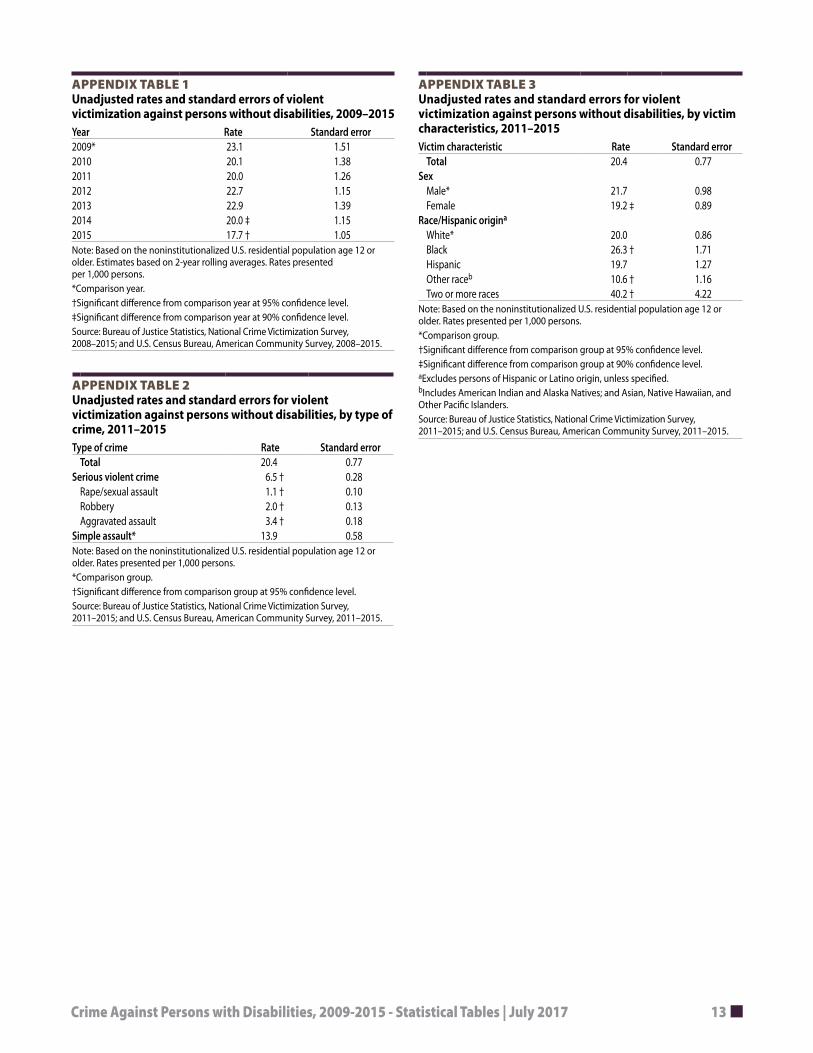
APPenDix TAbLe 1 Unadjusted rates and standard errors of violent victimization against persons without disabilities, 2009–2015Year Rate Standard error2009* 23.1 1.512010 20.1 1.382011 20.0 1.262012 22.7 1.152013 22.9 1.392014 20.0 ‡ 1.152015 17.7 † 1.05Note: Based on the noninstitutionalized U.S. residential population age 12 or older. Estimates based on 2-year rolling averages. Rates presented per 1,000 persons. *Comparison year.†Significant difference from comparison year at 95% confidence level.‡Significant difference from comparison year at 90% confidence level.Source: Bureau of Justice Statistics, National Crime Victimization Survey, 2008–2015; and U.S. Census Bureau, American Community Survey, 2008–2015.
APPenDix TAbLe 2 Unadjusted rates and standard errors for violent victimization against persons without disabilities, by type of crime, 2011–2015 Type of crime Rate Standard error
Total 20.4 0.77Serious violent crime 6.5 † 0.28
Rape/sexual assault 1.1 † 0.10Robbery 2.0 † 0.13Aggravated assault 3.4 † 0.18
Simple assault* 13.9 0.58Note: Based on the noninstitutionalized U.S. residential population age 12 or older. Rates presented per 1,000 persons. *Comparison group.†Significant difference from comparison group at 95% confidence level.Source: Bureau of Justice Statistics, National Crime Victimization Survey, 2011–2015; and U.S. Census Bureau, American Community Survey, 2011–2015.
APPenDix TAbLe 3 Unadjusted rates and standard errors for violent victimization against persons without disabilities, by victim characteristics, 2011–2015 Victim characteristic Rate Standard error
Total 20.4 0.77Sex
Male* 21.7 0.98Female 19.2 ‡ 0.89
Race/Hispanic origina
White* 20.0 0.86Black 26.3 † 1.71Hispanic 19.7 1.27Other raceb 10.6 † 1.16Two or more races 40.2 † 4.22
Note: Based on the noninstitutionalized U.S. residential population age 12 or older. Rates presented per 1,000 persons. *Comparison group.†Significant difference from comparison group at 95% confidence level.‡Significant difference from comparison group at 90% confidence level.aExcludes persons of Hispanic or Latino origin, unless specified.bIncludes American Indian and Alaska Natives; and Asian, Native Hawaiian, and Other Pacific Islanders.Source: Bureau of Justice Statistics, National Crime Victimization Survey, 2011–2015; and U.S. Census Bureau, American Community Survey, 2011–2015.
Crime Against Persons with Disabilities, 2009-2015 - Statistical Tables | July 2017 14
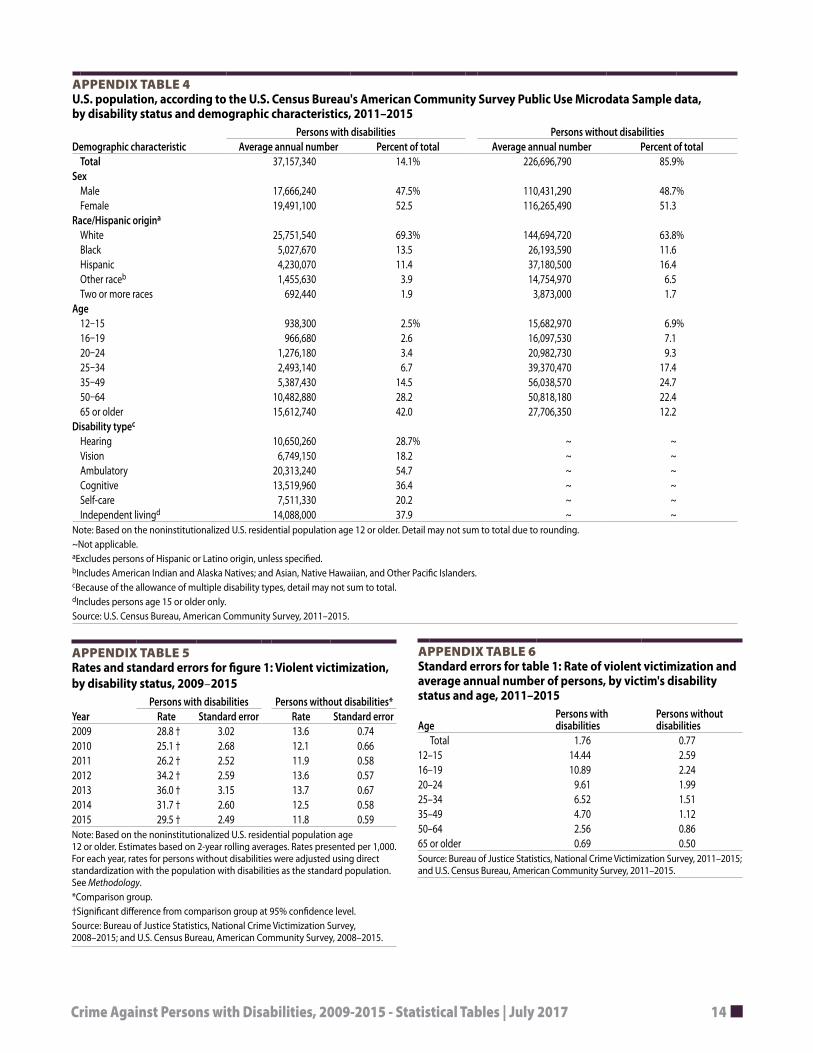
APPenDix TAbLe 4U.S. population, according to the U.S. Census Bureau's American Community Survey Public Use Microdata Sample data, by disability status and demographic characteristics, 2011–2015
Persons with disabilities Persons without disabilitiesDemographic characteristic Average annual number Percent of total Average annual number Percent of total
Total 37,157,340 14.1% 226,696,790 85.9%Sex
Male 17,666,240 47.5% 110,431,290 48.7%Female 19,491,100 52.5 116,265,490 51.3
Race/Hispanic origina
White 25,751,540 69.3% 144,694,720 63.8%Black 5,027,670 13.5 26,193,590 11.6Hispanic 4,230,070 11.4 37,180,500 16.4Other raceb 1,455,630 3.9 14,754,970 6.5Two or more races 692,440 1.9 3,873,000 1.7
Age12–15 938,300 2.5% 15,682,970 6.9%16–19 966,680 2.6 16,097,530 7.120–24 1,276,180 3.4 20,982,730 9.325–34 2,493,140 6.7 39,370,470 17.435–49 5,387,430 14.5 56,038,570 24.750–64 10,482,880 28.2 50,818,180 22.465 or older 15,612,740 42.0 27,706,350 12.2
Disability typec
Hearing 10,650,260 28.7% ~ ~Vision 6,749,150 18.2 ~ ~Ambulatory 20,313,240 54.7 ~ ~Cognitive 13,519,960 36.4 ~ ~Self-care 7,511,330 20.2 ~ ~Independent livingd 14,088,000 37.9 ~ ~
Note: Based on the noninstitutionalized U.S. residential population age 12 or older. Detail may not sum to total due to rounding.~Not applicable.aExcludes persons of Hispanic or Latino origin, unless specified.bIncludes American Indian and Alaska Natives; and Asian, Native Hawaiian, and Other Pacific Islanders.cBecause of the allowance of multiple disability types, detail may not sum to total.dIncludes persons age 15 or older only.Source: U.S. Census Bureau, American Community Survey, 2011–2015.
APPenDix TAbLe 5 Rates and standard errors for figure 1: Violent victimization, by disability status, 2009–2015
Persons with disabilities Persons without disabilities*Year Rate Standard error Rate Standard error2009 28.8 † 3.02 13.6 0.742010 25.1 † 2.68 12.1 0.662011 26.2 † 2.52 11.9 0.582012 34.2 † 2.59 13.6 0.572013 36.0 † 3.15 13.7 0.672014 31.7 † 2.60 12.5 0.582015 29.5 † 2.49 11.8 0.59Note: Based on the noninstitutionalized U.S. residential population age 12 or older. Estimates based on 2-year rolling averages. Rates presented per 1,000. For each year, rates for persons without disabilities were adjusted using direct standardization with the population with disabilities as the standard population. See Methodology.*Comparison group.†Significant difference from comparison group at 95% confidence level.Source: Bureau of Justice Statistics, National Crime Victimization Survey, 2008–2015; and U.S. Census Bureau, American Community Survey, 2008–2015.
APPenDix TAbLe 6 Standard errors for table 1: Rate of violent victimization and average annual number of persons, by victim's disability status and age, 2011–2015
AgePersons with disabilities
Persons without disabilities
Total 1.76 0.7712–15 14.44 2.5916–19 10.89 2.2420–24 9.61 1.9925–34 6.52 1.5135–49 4.70 1.1250–64 2.56 0.8665 or older 0.69 0.50Source: Bureau of Justice Statistics, National Crime Victimization Survey, 2011–2015; and U.S. Census Bureau, American Community Survey, 2011–2015.
Crime Against Persons with Disabilities, 2009-2015 - Statistical Tables | July 2017 15
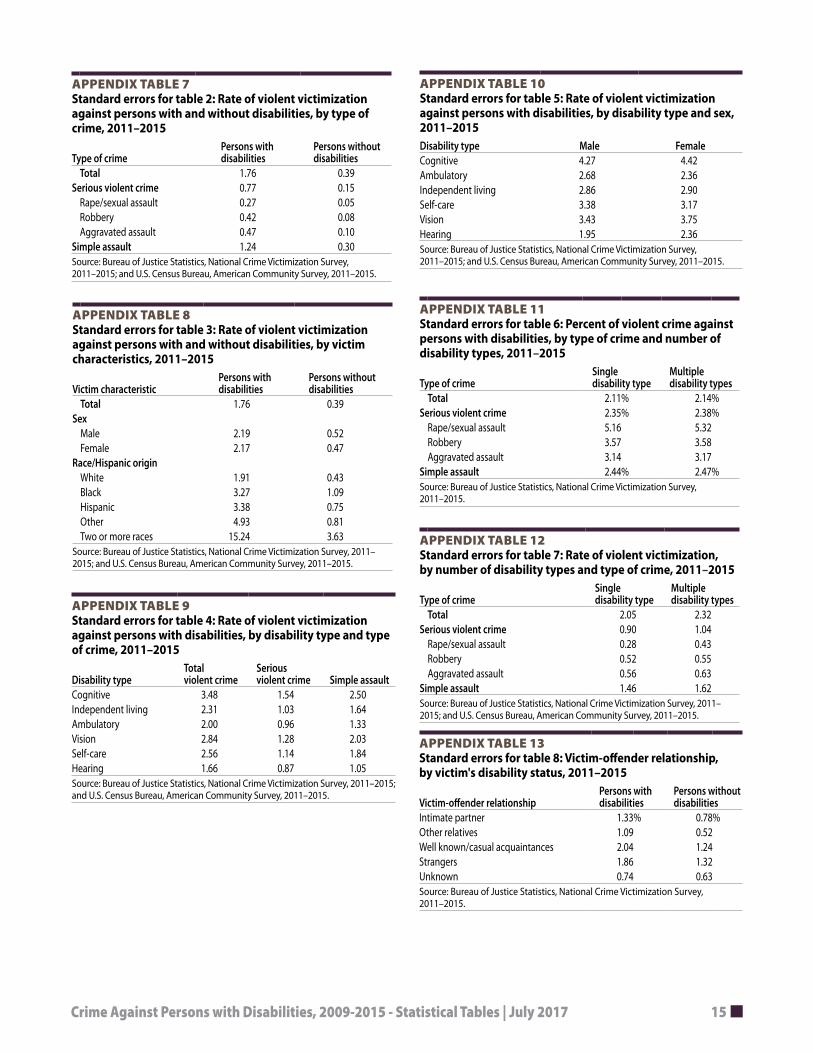
APPenDix TAbLe 7Standard errors for table 2: Rate of violent victimization against persons with and without disabilities, by type of crime, 2011–2015
Type of crimePersons with disabilities
Persons without disabilities
Total 1.76 0.39Serious violent crime 0.77 0.15
Rape/sexual assault 0.27 0.05Robbery 0.42 0.08Aggravated assault 0.47 0.10
Simple assault 1.24 0.30Source: Bureau of Justice Statistics, National Crime Victimization Survey, 2011–2015; and U.S. Census Bureau, American Community Survey, 2011–2015.
APPenDix TAbLe 8Standard errors for table 3: Rate of violent victimization against persons with and without disabilities, by victim characteristics, 2011–2015
Victim characteristicPersons with disabilities
Persons without disabilities
Total 1.76 0.39Sex
Male 2.19 0.52Female 2.17 0.47
Race/Hispanic originWhite 1.91 0.43Black 3.27 1.09Hispanic 3.38 0.75Other 4.93 0.81Two or more races 15.24 3.63
Source: Bureau of Justice Statistics, National Crime Victimization Survey, 2011–2015; and U.S. Census Bureau, American Community Survey, 2011–2015.
APPenDix TAbLe 9 Standard errors for table 4: Rate of violent victimization against persons with disabilities, by disability type and type of crime, 2011–2015
Disability typeTotal violent crime
Serious violent crime Simple assault
Cognitive 3.48 1.54 2.50Independent living 2.31 1.03 1.64Ambulatory 2.00 0.96 1.33Vision 2.84 1.28 2.03Self-care 2.56 1.14 1.84Hearing 1.66 0.87 1.05Source: Bureau of Justice Statistics, National Crime Victimization Survey, 2011–2015; and U.S. Census Bureau, American Community Survey, 2011–2015.
APPenDix TAbLe 10Standard errors for table 5: Rate of violent victimization against persons with disabilities, by disability type and sex, 2011–2015Disability type Male FemaleCognitive 4.27 4.42Ambulatory 2.68 2.36Independent living 2.86 2.90Self-care 3.38 3.17Vision 3.43 3.75Hearing 1.95 2.36Source: Bureau of Justice Statistics, National Crime Victimization Survey, 2011–2015; and U.S. Census Bureau, American Community Survey, 2011–2015.
APPenDix TAbLe 11Standard errors for table 6: Percent of violent crime against persons with disabilities, by type of crime and number of disability types, 2011–2015
Type of crimeSingle disability type
Multiple disability types
Total 2.11% 2.14%Serious violent crime 2.35% 2.38%
Rape/sexual assault 5.16 5.32Robbery 3.57 3.58Aggravated assault 3.14 3.17
Simple assault 2.44% 2.47%Source: Bureau of Justice Statistics, National Crime Victimization Survey, 2011–2015.
APPenDix TAbLe 12Standard errors for table 7: Rate of violent victimization, by number of disability types and type of crime, 2011–2015
Type of crimeSingle disability type
Multiple disability types
Total 2.05 2.32Serious violent crime 0.90 1.04
Rape/sexual assault 0.28 0.43Robbery 0.52 0.55Aggravated assault 0.56 0.63
Simple assault 1.46 1.62Source: Bureau of Justice Statistics, National Crime Victimization Survey, 2011–2015; and U.S. Census Bureau, American Community Survey, 2011–2015.
APPenDix TAbLe 13 Standard errors for table 8: Victim-offender relationship, by victim's disability status, 2011–2015
Victim-offender relationshipPersons with disabilities
Persons without disabilities
Intimate partner 1.33% 0.78%Other relatives 1.09 0.52Well known/casual acquaintances 2.04 1.24Strangers 1.86 1.32Unknown 0.74 0.63Source: Bureau of Justice Statistics, National Crime Victimization Survey, 2011–2015.
Crime Against Persons with Disabilities, 2009-2015 - Statistical Tables | July 2017 16
APPenDix TAbLe 14Standard errors for table 9: Time violent crime occurred, by victim's disability status, 2011–2015
Time of crimePersons with disabilities
Persons without disabilities
Daytime (after 6 a.m.–6 p.m.) 2.14% 1.40%Nighttime (after 6 p.m.–6 a.m.) 2.02 1.35Unknown 0.72 0.37Source: Bureau of Justice Statistics, National Crime Victimization Survey, 2011–2015.
APPenDix TAbLe 15 Standard errors for table 10: Violent crime reported to police, by victim’s disability status and disability type, 2011–2015Disability status and type Reported to policePersons without disabilities 1.37%Persons with disabilities 2.13%
Single disability type 2.75Multiple disability types 2.65
Disability typeAmbulatory 2.72%Independent living 3.05Self-care 4.13Hearing 4.37Cognitive 2.45Vision 4.02
Source: Bureau of Justice Statistics, National Crime Victimization Survey, 2011–2015.
APPenDix TAbLe 16 Standard errors for table 11: Person who notified police of violent crime, by victim's disability status, 2011–2015
Person who notified policePersons with disabilities
Persons without disabilities
Victim 2.67% 1.76%Someone else 2.00 0.93Other household member 1.10 0.91Someone official 1.04 0.80Police were at the scene 0.66 0.67Offender was a police officer 0.15 0.12Police notified some other way 0.56 0.36Source: Bureau of Justice Statistics, National Crime Victimization Survey, 2011–2015.
APPenDix TAbLe 17 Standard errors for table 12: Reasons for not reporting violent crime to police, by victim's disability status, 2011–2015
ReasonPersons with disabilities
Persons without disabilities
Dealt with another way 2.61% 1.66%Other 2.55 1.53Police would not help 2.04 1.19Was not important enough to victim 2.02 1.34Police could not do anything 0.73 0.45Insurance would not cover 0.12 0.09Source: Bureau of Justice Statistics, National Crime Victimization Survey, 2011–2015.
APPenDix TAbLe 18 Standard errors for table 13: Percent of violent victimizations in which assistance from a nonpolice victim services agency was received, by victim's disability status, 2011–2015Disability status Percent of violent victimizationsPersons with disabilities 1.22%Persons without disabilities 0.61Source: Bureau of Justice Statistics, National Crime Victimization Survey, 2011–2015.
Office of Justice ProgramsBuilding Solutions • Supporting Communities • Advancing Justice
www.ojp.usdoj.gov
NCJ250632
The Bureau of Justice Statistics of the U.S. Department of Justice is the principal federal agency responsible for measuring crime, criminal victimization, criminal offenders, victims of crime, correlates of crime, and the operation of criminal and civil justice systems at the federal, state, tribal, and local levels. BJS collects, analyzes, and disseminates reliable and valid statistics on crime and justice systems in the United States, supports improvements to state and local criminal justice information systems, and participates with national and international organizations to develop and recommend national standards for justice statistics. Jeri M. Mulrow is acting director.
These statistical tables were prepared by Erika Harrell. Shannan Catalano provided verification.
Caitlin Scoville and Jill Thomas edited the report. Steve Grudziecki produced the report.
July 2017, NCJ 250632