Embed Size (px)
Citation preview
• II . II In II
a"., . I III
II " . .' • ,'. ,II .. ;1 aJ· ~ III I .' ,; , • . t ",' 'l'I' [ ' .. ' : "I",! ~.- ~ '~',-
• ,
_=-, ~~ ~ lit. - ~"II tl1II ',-" - - ~ .
Crime in Ohio 1976
I.".'~ ,,! ~.j
.~ '.~ , ~ sued by Attorney General William J. Brown
If you have issues viewing or accessing this file contact us at NCJRS.gov.

Crime in Ohio 1976 = .
I NCJRS
DEC 211977
ACQUISITIONS

l
Table of Contents p a::aua; W *HE •
Preface-William J. Brown, Attorney General -- .. ppp'" -Foreword-Jack E. McCormick, Superintendent, BCI
Participating Agencies
Section I-The Ohio Uniform Crime Reporting Program
History of Uniform Crime Reporting Objectives of Ohio UCR Considerations for Interpretation
Classification of Offenses Counting of Offenses Arrests Clearances Property Stolen and Recovered Reporting Variations
... =
j".£
L
....
ii •
1
5 5 5
5 6 6 6 6 6 _______________________ : ______ '.n ________ ...... ______ ·QfL __ • __________ __
Information Grouping w,
Population Groupings Community Types
Crime Index Crime Rate Risk Factor Offense Definitions
Section II-Officers Assaulted and Killed
Section III-Ohio Index Crime
a
Introduction Ohio Overview Murder Forcible Rape Robbery Aggravated Assault Burglary Larceny Motor Vehicle Theft Value of Property Stolen and Recovered
.. M
Fi
7
7 7
7 8 8 8
11
14 14 22 29 35 42 48 55 62 68

am. "I -I
Section IV.......;Tables and Statistical Data 70 == .s !NiAJiWI Wi
Table i-Officers Assaulted and Killed: 1976 13 Table 2-0hio Reported Index Offenses by Month: 1976 16 Table 3-0hio Murder by Month: 1976 22 Table 4-0hio Rape by Month: 1976 29 Table S-Ohio Robbery by Month: 1976, by Weapon 36 Table 6-0hio Robbery by Month: 1976, by Location 36 Table 7-0hio Assaults by Month: 1976, by Weapon 42 Table 8-0hio Burglary by Month: 1976, by Type 48 Table 9-· Ohio Burglary by Month: 1976, by Location 49 Table 10-0hio Larceny by Month: 1976, by Type 55 Table ii-Ohio Larceny by Month: 1976, by Value of Offense 56 Table 12-0hio Motor Vehicle Theft by Month: 1976 62 Table 13-0hio & United States, Crime Rates & Estimated
Index Crime: Percent Change from 1966 70 Table 14-United States, Estimated Index Crime: 1966~1976 71 Table is-Ohio, Estimated Index Crime: 1966~1976 73 Table 16-Adult Arrests by Age, Sex & Race: 1976 75 Table 17-Juvenile Arrests by Age, Sex & Race: 1976 79 Table 18-Summary of Arrests by Age & Sex: 1976 83 Table 19-5ummary of Arre(,ts by Age & Race: 1976 84 Table 20-Monthly Index Clearances, Adult and Juvenile: 1976 85 Table 21-lndex Clearance Rates: 1975 & 1976 87 Table 22-Reported Index Offenses by Agency: 1976 88 Table 23--Reported Index Offenses by County: 1976 112 Table 24-Number of Law Enforcement Employees by Agency 116
• .,. aNI am

\ I I
Pr face LhZ &"
, In recent years, increasing attention has been
focused on the problem of crime in our commLmities. The citizens of Ohio have become justifiably concerned about violence on the streets; lawenforcement personnel have been called upon to handle expanding responsibilities; and courts have been staggering under mushrooming caseloads. Each day, newspapers and radio and TV newscasts bring new evidence of violence into our living rooms. Too often, however, this is the only information we receive, and we hear only part of the story - the worst part.
Little has been heard about the routine work done everyday by law enforcement officers to preserve the peace in our neighborhoods and protect our people. We have not known the real probability that one of us will actually be a victim of crime. Enough information simply has not been available to know what the total situation really is.
I have been deeply concerned abollt this lack of information because I feel that the people of Ohio should be able to realistically assess the problem for themselves.
In late 1975, the Ohio Bureau of Criminal Identification and Investigation of this Office assumed responsibility for collecting Uniform Crime statistics from Ohio's law enforcement agencies for the FBI. We are proud to be one of 42 states participating in this program. As a direct result of our participation, we now are able to provide the comprehensive information about crime in Ohio that has been unavailable in the past.
My special thanks to the participating Sheriff's Offices and Police Departments throughout Ohio. Without their (~fficient and time-consuming record-keeping and reporting, this publication would not have been possible. As of this printing, all 88 Ohio Stleriff's Offices are participating in UCR.
It is with great pleasure, therefore, that I present the following report to the people of Ohio.
uI~.r.~ William J. Brown Attorney General

I . ! !
ii
Foreward
The Uniform Crime Reporting program is entirely dependent on the voluntary submission of crime reports by law enforcement agencies j and the indi w
vidual efforts of every law enforcement officer in Ohio. Partially funded through the Law Enforcement Assistance Administration, UCR was originally implemented to provide management informa-tion to the law enforcement community. However, as the level of criminal activity increased, many other interest groups have wanted and needed information about the extent of crime in Ohio.
Crime in Ohio 1976 presents detailed information about Ohio crime for the first time. It is hoped that this information will not only address the information needs of law enforcement managers and planners, but will allow citizens to realistically assess the problem for themselves.
~&/U~~ Jack E. McCormick SUperintendent Ohio Bureau of Criminal Identification & Investigation

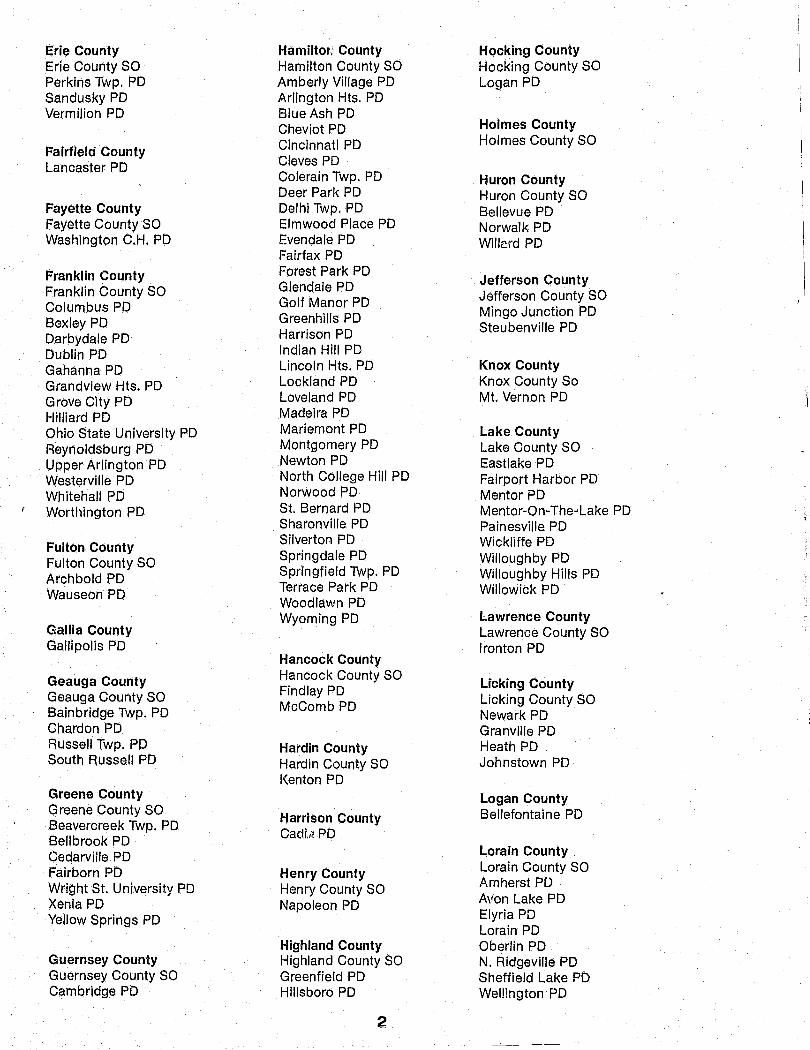
Partici pati ng Agencies: 1976 ... f:'-C r,HiA1 __ lIEd _
We wish to thank the following agencies for contributing-1
Adams County Carroll County Broadview Hts. PD Adams County SO Garroll CouQty SO Brooklyn PD ~. :anchester PD Garrollton PD Brooklyn Hts. PD West Union PD Brook Park PD Seaman PD Champaign County Chagrin Falls PD
Champaign County SO Cleveland Hts. Pc) Allen County Mechanicsburg PD East Cleveland PD Allen County SO Urbana PD Euclid PD Bluffton PD Fairview Park PD Ft. Shawnee PD Clark County Garfield Hts. PD Lima PO Clark County SO Highland Hts. PD Shawnee Twp. PD New Carlisle PD Independence PD
Springfield PD Lakewood PD Ashland County Lyndhurst PD Ashland County SO Clermont County Maple Hts. PD Ashll::ind PD Clermont County SO Mayfield Hts. PD Loudonville PD Milford PD Mayfield Village PD
Miami Twp. PD Middleburg Hts. PD Ashtabula County Union Twp. PD Newburg Hts. PD Ashtabula County SO North Olmsted PD Ashtabula PD Clinton County North Royalton PD Conneaut PD Clinton County SO Oakwood Village PD
Blanchester PD Parma PD Athens County Wilmington PD Parma Hts. PD Athens County SO Pepper Pike PD Athens PD Columbiana County Richmond Hts. PD Nelsonville PD Columbiana County SO Seven Hills PD Ohio University PD Columbiana PD Shaker Hts. PD
East Liverpool PD Solon PD Auglaize County East Palestine PD South Euclid PD Auglaize County SO Lisbon PD Strongsville PD Wapakoneta PD Salem PD University Hts. PD Buckland PD Wellsville PD Valley View PD
Walton Hills PD Belmont County Coshocton County Warrensville Hts. PD Belmont County SO Coshocton County SO Warrensville Twp. PD Bellaire PD Coshocton PD Westlake PD Bridgeport PD Shadyside PD Crawford County st. Clairsville PD Crawford County SO
Bucyrus PD Brown County Crestline PD Darke County Brown County SO Galion PD Darke County SO Russellville PD Greenville PD
Cuyahoga County Butler County Cuyahoga County SO Defiance County Fairfield PD Cleveland PD Defiance County SO Hamilton PD Bay Village PD Defiance PD Middletown PD Beachwood PD Hicksville PD Oxford PD Bedford PD Trenton PD Bedford Hts. PD Delaware County Union Twp. PD Berea PD Delaware County SO Miami University PD Brecksville PD Delaware PD
lin 1976, there were 336 police departments, 80 sheriff'S offices, and 3 special agencies contributing UCR statistics.
1 :.........------"----~~--- --
Erie County Hamiltor,' County Hocking County Erie County SO Hamilton County SO Hocking County SO Perkins Twp. PO Amberly Village PO Logan PO Sandusky PO Arlington Hts. PO Vermilion PO Blue Ash PO
Cheviot PO Holmes County
Fairfield County Cincinnati PO Holmes County SO
Lancaster PO Cleves PO Colerain Twp. PO Huron County Oeer Park PO Huron County SO
Fayette County Oelhi Twp. PO Bellevue PO Fayette County SO Elmwood Place PO Norwalk PO Washington C.H. PO Evendale PO Willerd PO
Fairfax PO
Franklin County Forest Park PO Jefferson County Glendale PO Franklin County SO
Golf Manor PO Jefferson County SO Columbus PO Mingo Junction PO Bexley PO Greenhills PO
Harrison PO Steubenville PO Oarbydale PO Dublin PO Indian Hill PO'
Gahanna PO Lincoln Hts. PO Knox County
GrandvieW Hts. PO Lockland PO Knox County So
Grove City PO Loveland PO Mt. Vernon PO
Hilliard PO Madeira PO
Ohio State University PO Mariemont PO Lake County Reynoldsburg PO Montgomery PO Lake County SO Upper Arlington PO Newton PO Eastlake PO Westerville PO North College Hill PO Fairport Harbor PD Whitehall PO Norwood PO Mentor PO Worthington PO St. Bernard PO Mentor-On-The-Lake PO
Sharonville PO Painesville PO
Fulton County Silverton PO Wickliffe PO
Fulton County SO Springdale PO Willoughby PO
Archbold PO Springfield Twp. PO Willoughby Hills PO
Wauseon PO Terrace Park PO Willowick PO Woodlawn PO Wyoming PO Lawrence County
Gallia County Lawrence County SO Gallipolis PD Ironton PO
Hancock County
Geauga County Hancock County SO Licking County
Geauga County SO Findlay PO Licking County SO
Bainbridge Twp. PO McComb PO Newark PO
Chardon PO Granville PO Russell Twp. PO Hardin County Heath PO South Russe.1I PO Hardin County SO Johnstown PO
Kenton PO Greene County Logan County Greene County SO
Harrison County Bellefontaine PO Beavercreek TWp. PO
Cad!'..,? PO Bellbrook PO Cedarville PO Lorain County
Fairborn PO Henry County Lorain County SO
Wright st. University PD Henry County SO Amherst PD
Xenia PO Napoleon PO Avon Lake PO
Yellow Springs PO Elyria PD Lorain PO
Highland County Oberlin PO Guernsey County Highland County SO N. Ridgeville PO ,j
Guernsey County SO Greenfield PO Sheffield Lake PD Il Cambridge PO Hillsboro PO Wellington PO
Ii 2 ,1 -------

Lucas County Oakwood PO Richland County Lucas County SO Riverside PO Richland County SO Maumee PO Trotwood PO Bellville PO Oregon PO Vandalia PO Butler PO Sylvania PO Village of Union PO Lexington PD Sylvania Twp. PO Wayne Twp. PO Mansfield PO Toledo PO Ontario PO Waterville PO Morgan County Shelby PO
Morgan County SO Madison County
Morrow County Ross County
Madison County SO Ross County SO Mt. Sterling PO Morrow County SO Bainbridge PO Plain City PO Mt. Gilead PO Chillicothe PO
Mahoning County Muskingum County Sandusky County Muskingum County SO
Mahoning County SO Roseville PO Sandusky County SO
Boardman PO Zanesville PO Fremont PO
Canfield PO Sebring PO Noble County
Scioto County Scioto County SO Youngstown PO Noble County SO New Boston PO
Marion County Ottawa County Portsmouth PO
Marion County SO Ottawa County SO Seneca County \\
Marion PO Oak Harbor PO Seneca County SO Port Clinton PO Attica PO
Medina County Fostoria PO Medina County SO Paulding County Tiffin PO Brunswick PO Paulding County SO Medina PO Paulding PO Shelby County Wadsworth PO Shelby County SO
Perry County Sidney PO Meigs County Perry County SO Middleport PO Crooksville PO Stark County
New Lexington PO Stark County SO Mc:rcer County Alliance PO Mercer County SO Pickaway County Canton PO
Pickaway County SO East Canton PO Miami County Circleville PD Massillon PO Bradford PO North Canton PO COVington PO Pike County Lawrence Twp. PO Piqua PO Pike County SO Perry Twp. PO Tipp City PO Waverly PO Troy PO Summit County
Portage County Summit County SO Monroe County Portage County SO Akron PO Monroe County SO Aurora PO Barberton PO Woodsfield PO Brady Lake PO Copley Twp. PO
Kent PO Cuyahoga Falls PO Montgomery County Kent State University PO Fairlawn Village PO Montgomery County SO Ravenna PO Hudson PO Brookville PO Streetsboro PO Lakemore PO Centerville PO Windham PO Macedonia Village PO Oayton PO Mogadore PO Englewood PD Preble County Munroe F?lIs PO Germantown PO Preble County SO Northampton TWp. PO . German Twp. PO Eaton PO Norton PO Jefferson Twp. PO New Paris PO Peninsula PO Kettering PO Richfield PO Madison TWp. PO Putnam County Stow PO Miamisburg PO Putnam County SO Tallmadge PO
l ......... Moraine PO Leipsic PO Twinsburg PO
3

Trumbull County Trumbull County SO Brookfield TWp. PD Girard PD Howland TWp. PD Hubbard PD Liberty Twp. PD Newton Falls PD Niles PD Warren PD .
Tuscarawas Co.unty Tuscarawas County SO Dennison PD Dover PD
'Newcomerstown PD New Philadelphia PD Uhrichsville PD
Union County Union County SO Marysville PD
Van Wert County Van Wert County SO Van Wert PD
Vinton County Vinton County SO
Warren Coun~y Warren County SO Carlisle PD Clearcreek Twp. PD Franklin PD Lebanon PD Mason PD Springboro PD
Washington County Washington County SO Belpre PD Marietta PD
Wayne County Wayne County SO Doylestown PO Orrville PD Wooster PD
Williams County Williams County SO Bryan PD Edgerton PD
Wood County Wood County SO Bowling Green PD North Baltimore PD Northwood PD Perrysburg PO Rossford PO
Wyandot County Wyandot County SO Carey PD Upper Sandusky PD
Special Agencies Mound City National Monument Ohio State Highway Patrol Ranger Department, Cleveland Metro Parks System
We wish to thank the Federal Bureau or Investigation, Uniform Crime Reporting Section for providing 1975 comparison data for Ohio's first Annual Report, and for assisting Ohio in assuming this responsibility at the state level.
Our appreciation is extended to the Law Enforcement Assistance Administration for their support in this effort.
• 4

Section • .. ..
The Ohio Uniform Crime I
i; . Reporting Program
I
I I
• i
I
I
I
, I


History of Uniform Crime Reporting
Although the impetus for collecting nationwide crime information dah3s back to the 1890'sl no ongoing program was initiated until the Committee on Uniform Crime Records of the International AssocIation of Chiefs of Police (lACP) was established in 1927, This Committee's responsibility to provide management information to law enforcement agencies was eventually turned over to the Federal Bureau of Investigation (FBI) in 1930, when the FBI received a Congressional mandate to collect and disseminate national crime information. The IACP has continued to serve the Uniform Crime Reporting Program (UCR) in an advisory capacity, and has been joined in this responsibility by the Committee on Crime Records of the National Sheriffs' Association.
UCR receives crime information through voluntary reports submitted by individual law enforcement agencies across the country. In 1966. the FBI began coordinating UCR data collection through designated state level agencies which report statewide information to the FBI each month. Ohio is pleased to be one of 42 states now participating in the state level UCR program.
Objectives of Ohio UCR Because increasing attention has been focused
on the problem of crime in our communities in recent years. many segments of our population need more complete information for a variety of reasons.
Citizens are understandably concerned about the possibility of becoming victims of crime, but may not know what the real probability is. Law enforcement professional$, r:nanagers and administrators who must focus on crime in their own jurisdictions, also need to know what is occurring in surrounding jurisdictions in order to deploy personnel and equipment most efficiently to protect oitizens and bring crminals to justice. Legislators need statewide information about crime in order to pass realistic laws that will increase the stability of our society. Resea.rchers and planners need to know what is actually happening to predict trends and recommend changes.
The goal of Crime In Ohio is to identify the nature and extent of criminal activity in this state and present the information needed by ~ach of these groups. This information wiil not in itself prevent crime, but it may encourage all segments of society, by understanding the problem, to work together with law enforcement agencies to reduce crime through more effective enforcement.
The objectives of Crime In Ohio are:
5
1. To identify the nature and extent of crime in our st~te;
2. ''(0 provide the management Information needed by tha law enforcement community to augment their ability to attack the crime problem;
3, To provide our citizens with the most complete information available;
4. To provide legislators with the information necessary to formulate laws which address the crime problem; and
5. To include sufficiently detailed data for researcl1ers and planners.
Considerations for Interpretation - •
Statistics are a tool used to summarize informa~ tion so t!~at patterns or trends become clearer. All statistics must be interpreted with an understanding of just what it is that they can say. Too often, numbers of the type in this report are used incorrectly to draw conclusions that the statistics simply do not support. In order to avoid this error, it is necessa,'Y to know what information is included and how it Is reported.
To obtain accurate information from many differ~ ent agencies, the national UCR program had to precisely define the methods for counting such information as the number of offenses, arrests, clearances and value of stolen or recovered property. The methods of counting and some resulting limita.,. Hons are explained below.
Classification of Offenses
UCR divides offenses into two major classifjca~ tions which are designated Part I and Part 1/ offenses. This distinction is important to keep in mind because different information is collected for each. Part I offenses include 1) Violent Crimes: murder and non-negligent manslaughter. negligent man~ slaughter, forcible rape, robbery and aggravated assault; and 2) Property Crimes: burglary, larceny (theft) ahd motor vehicle theft. All other ~ffe"ses are classified under Part II (see Offense Definitions section, page 8 ).
Part I offenses. excluding negligent manslaughter, are used to calculate the Crime Index and Crime Rate (see sections entitled Crime Index and Crime Rate, pages 7 and 8 ).
All offenses are classified on the basis 6f lawen ... forcement officer investigation in accordance With UCR offense definitions (which will not necessarily be identical to State Code definitions). Because UCR identifies a Police problem, offense classifica~ tions are not based on the findings of a court, coroner, jury or decision of a prosecutor.

Counting of Offenses
The number of offenses is counted only for Part I crimes and simple assault. The method of count.'1g varies with the type of crime committed, and it is important to remember that the number of offenders does not determine the number of offenses.
For murder and non-negligent manslaughter, negligent manslaughter, forcible rape, aggravated assault and simple assault, one offense is counted for each victim, regardless of the number of offenders invulved.
For robbery and larceny, one offense is counted for each distinct operation which is separate in time and place. The number of victims in anyone operation does not determine the number of offenses. For example, if 20 people are robbed in a bar at the same time, only one offense has occurred. However, if that robber then leaves the bar and holds up a passerby, a second offense has occurred.
For burglary, one offense is counted for each structure Which is illegally entered. HowGver, when the structure is an apartment house, or business or office building in which Units are leased for a period of time, one offen sa is counted for each unit burglarized.
For motor vehicle theft, one offense IS counted for each vehicle stolen.
Note: Attempts to commit any of the above are also counted as offenses, except that attempts to kill and assaults to kill are counted as aggravated assault.
For multiple offens~s that occur in one crime incident, only the most serious offense is counted. Purt I crimes are ranked according to seriousness and appear in order from most serious to least serious under "Classification of Offenses," above. Example: A robber takes a man's wallet and then beats him causing serious injury. Both a robbery and an ag~ gravated assault have occurred, but because robbery is consider'ed by UCR to be more serious, only the robbery is counted. From one perspective, this method of counting seriously understates the crime problem, but from another, it prevents undue inflation of crime statistics.
Note: The number of offenses is not counted for Part 1/ offenses.
Arrests
Arrest information is collected 'for all Part I and Part II offenses according to the age, sex and race of the offender. It is not possible, however, to corfelate race with sex or specific ages because the information is collected independently, thus limiting analysis. Furthermore, arrest figures cannot be directly related to the number of crimes cleared because arrest totals count all offenders arrested for each offense, and clearance totals count only the offenses for which an arrest or arrests have occurred.
Clearances
An offense is considered cleared (solved) when at least one offender is arrested for a crime, even though several may have been involved1•
Clearances are counted as "adult" and "juvenile". A "juvenile" clearance is counted only when juveniles are exclusively involved in the clearance of an offense. If the arrest of both adults and juveniles results in a clearance, it is counted as an "adult" clearance.
Note: Not all crime~ are cleared within the calendar year in which the offense ocwrs.
Property Stolen and Recovered
The figures for value of property stolen and reca;\"ered report the value at each point in time. Although property can increase in value over time, it is more likely that stolen property will be recovered in a damaged condition. Because this value is the one reported, it does not necessarily represent a "clearance rate" for stolen property, and one cannot use it to determine police or sheriff effectiveness in recovering stolen goods. Because stolen and recovered property figures indicate thefts and recoveries in the current year, it is important to note that recovered property may have been stolen in a previous year. In addition, the type and value of stolen or recovered property is reported only for Part I offenses and does not include such Part 2 offenses a\~ fraud, forgery or embezzlement.
Reporting Variations
Ohio now re('eives Uniform Crime Reports from 419 law enforcement agencies. Because the number of reporting agencies is so large, one must be aware
lOffenses may also be cleared by exceptional means when the offender: commits suicide; makes a dying declaration; confesses while In oustod:> or serving time for another crime; is prosecuted in another Jurisdiotion for the same offense; is a Juvenile who is handled by notifying the parents; or when the victim refuses to prosecute or another JUrisdiction refuses to extradite the offender.
6

that unintentional variations from UCR guidelines may occur that would affect the validity of the data presented here.
Offense totals will probably vary frOfrt the actual number of offenses that occur because UCR statisticas are based on crimes that are reported to law enforoement agencies and many crimes are not reported.
Information Grouping ...... The crime statistics reported by an individual
agency indicate what is happening in one particular area, but to make rational comparisons among a number of jurisdictions, communities with similar characteristics need to be grouped together. It may be important to know how a city compares with cities of similar size, or how patterns of crime differ in various types of communities. Grouping agencies with similar characteristics allows these determinations to be made. Aside from being mere!y interesting, such comparative analysis provides the basic information for long-range criminal justice planning.
UCR groups jurisdictions on the basis of population size and community type, both of which are necessary to view a jurisdiction in proper perspective. Grouping by population size considers only the population of the relevant area. It does not consider proximity to a major metropolitan area in spite of the fact that widely different crime patterns could be expected in a city of. 20,000 which is a suburb of Cleveland or Cincinnati and one which is in a rural area. Grouping by community type does take into account the urban/rural character of the area, and includes a wider range of populations in each category. For use in interpreting this report, the UCR grouping systems are listed below.
Population Groupings
Cities Group
1 2 3 4 5 6 7
Counties Group
8 9
Population Over 250,000 100,000 to 250,000 50,000 to 100,000 25,000 to 50,000 10,000 to 25,000 2,500 to 10,000 Under 2,500
Population Outside an SMSA1 Inside an SMSA
Community Types
Standard Metropolitan Statistical Area (SMSA): A core city and the county within which it is located, plus surrounding counties which are socially and economically integrated with the oentral county and Which are metropolitan in character 2•
Core City: . Any city with a population of 50,000 or more that IS
within an SMSA.
Suburban City: Any city that is within an SMSA .
Rural City: Any city that is outside an SMSA.
Suburban County: Any county that is within an SMSA.
Rural County: Any county that is outside an SMSA.
Crime Index .... Wi H
The Crime Index is a basic measure of orime which can be used for comparing the extent of crime among cities, counties and states of similar size. The Index is simply the total number of certain offenses that occur in a given area in one calendar year. These offenses are murder and non-negligent manslaughter, forcible rape, robbery, aggravated assault, burglary, larceny and motor vehicle theft -all of the Part I offenses except negligent manslaughter.
These offenses were seleoted as Indicators of the total amount of criminal activity because they are serious offenses that are the focus of widespread concern; they occur with sufficient frequency to refleot flUctuations in the overall level of criminal activity; they are most likely to be reported, and reporte? accurately, to law enforcement officers due to their seriousness; and, they are offenses that can be clearly and specifically defined.
Notwithstanding its usefulness, the Index does have limitations. The relationship between the Index offenses and total criminal activity, both reported and unreported, has never been firmly established. The varying severity of offenses is not taken into account, resulting in equal weight being given to a shoplifting and a forcible rape. Furthermore, the actual incidence of crime in a city may not be accurately depicted by the Index if the majority of the city's crime involves non-Index offenses such as gambling and narcotics.
1 St ndard Metropolitan Statistical Area; see "Community Types." .. 25% 2s:cially and Economically Integrated: At least 15% of the workers living in the adjacent county work in the central county or at Jeast 0 of those working in the adjacent county live in the central county.
Metropolitan Character: At least 75% of the labor force is engaged in nonagricultural work.
7

Crime Rate b ••
The Crime Rate is based on the Crime Index, but adjusts the Index for variances in population by indicating the number of Index offenses for each ~OO,OOO persons. This means that comparisons may be made among several areas with different populations, or within one area with different populations over a period of time, without the information being biased by population differences1. For most general comparisons, the Crime Rate is probably the most accurate figure to use.
To calculate the Crime Rate, first divide the population of the area by 100,000, and then divide the Crime Index by that answer. For example, if a city has a population of 273,000 and a Crime Index of 21,257, the calculations would be:
1) 273,000 divided by 100,000:= 2.73 2) 21,257 divided by 2.73 = 7,786.4
Thus, although the city's Crime Index is 2'1,257, its Crime Rate (the number of crimes for each 100,000 people) is 7,786.4.
The calculations are the same for a city with fewer than 100,000 inhabitants. A city has 45,000 population and a Crime Index of 1,588:
1) 45,000 divided by 100,000 = .45 2) 1,588 divided by .45 = 3528.9
The Crime Rate is higher than the Index because it indicates the number of offenses that would have occurred if the city had had 100,000 inhabitants.
Risk Factor .
The Risk Factor, which has been calcUlated for each Index offense, indicates the likelihood that an individual Ohio citizen or his or her property would have been the victim of a particular crime. Because the Risk Factor identifies the risk to each individual, it differs from the Crime Rate which specifies the number of offenses for every 100,000 people.
Interpretation: If the Risk Factor states "1 in 273 People," it should be interpreted to mean that one person was victimized by that crime for every 273 people in Ohio.
Risk Factors have been computed for 1975 and 1976 for each Index offense 2 to point Ollt whether the degree of risk has increased or decreased. If the Risk Factors for a particular crime are:
1975 1 in 273 People 1976 1 in 265 People
the degree of risk increased from 1975 to 1976 because there was one crime f'or a fewer number of people in 1976 than in 1975. Thus, each individual was more likely to have become a victim. However, if the Risk Factors are:
1975 1 in 273 People 1976 1 in 295 People
the degree of risk decreased from 1975 to 1976. This is indicated by the fact that there was one crime for a larger number of people in 1976, and consequently, each individual was less likely to have become a victim.
The interpretation is the same whether the risk is stated for people, residences, businesses or vehicles.3
Offense Definitions Uniform Crime Reporting, as a nationwide pro
gram, receives information from more than 16,000 law enforcement agencies in 50 states. Because titles and descriptions of crimes can vary widely among state codes, it was necessary to ensure that each agency would define offenses the same way. For this reason, UCR established the following standard offense definitions:
Part I Offenses
Criminal Homicide: a. Murder and Non-negligent Manslaughter: The willful, non-negligent killing of one person by another. Excludes attempts to kill and assaults to kill (classified as aggravated assault), suicide, accidental death and justifiable homicide 4•
b. Negligent Manslaughter The killing of another person through gross negligence. Includes traffic fatalities.
'Factors other than population that also Influence crime rates inclUde level of economic activity and unemployment; the CUltural, religioUS, ractal and age mix of the population; the time of day, day of the week, or the season of the year; local standards and enforcement policies; proximity to a metropolitan area: and, transience of the population, among others.
?1975 offense figures for robbery by location were not availablo and a comparison Risk Factor could not be calculated for that year.
3 The FBI provided the population estimate; the Ohio Chamber of Commerce provided the number of residential units, chain and commercial stores, service stations and banks; and, the Ohio Bureau of Motor Vehicles provided the number of cars, tl'ucks and buses, and other types of vehicles.
4Justiftable homicide is the kllling of a person by a law enforcement officer in the line of duty or the killing c.f a person in the act of committing a felony by a private person.
8

Forcible Rape: The carnal knowledge of a female forcibly and against her will. Includes rape by force or threat of force, assault to rape and attempted rape. Excludes statutory rape which is based on the victim's age.
Robbery: Taking or attempting to take anything of value from a person or persons by force, or threat of force or violence and/or putting the victim in fear. Includes assault to rob, strongarm robbery and armed robbery.
Aggravated Assault: An unlawful attack by one person on another for the purpose of inflicting severe bodily injury or death, usually accompanied by the use of a weapon that is likely to produce death or great bodily harm. Includes attempted murder and attempted aggravated assault when a non-personal weapon (not part of the attacker's body) is used, even though there is no injury. Attacks using personal weapons (part of the attacker's body) must result in serious personal injury to be classified as aggravated assault. Excludes simple assault.
Burglary: The unlawful entry of a structure to commit a felony or a theft. It is not necessary th(!', torce be used in the entry or that a loss result from it. Includes attempted forcible entry.
Larceny: The unlawful taking or stealing of property from the possession of another without the use of force, violence or fraud. Includes attempted larceny. Excludes motor vehicle theft (classified separately because of volume), embezzlement, forgery, worthless checks and other thefts by fraud.
Motor Vehicle Theft: The unlawful taking of a motor driven vehicle. Includes attempted motor vehicle theft. Excludes the theft of motor boats, construction equipment, airplanes and farming equipment.
Part II Offenses
Other Assaults: An unlawful attack or attempted attack on another person which does not result in serious injury to the victim and which does not involve the use of a dangerous weapon.
Arson: The willful or malicious burning of property with or without the intent to defraud. Includes attempted arson.
9
Forgery and Counterfeiting-The making, altering, using or possession, with intent to defraud, of anything false which is made to appear true. Includes attempts.
Fraud: Fraudulent conversion, and obtaining money or property by fraudulent means. InclUdes confidence games, larceny by bailee and. bad checks (except forged or counterfeit checks).
Embezzlement: Misappropriation or misapplication of money or property entrusted to one's care, custody or control.
Stolen Property Offense: The buying, receiving and possessing of stolen property, or the attempt to do so.
Vandalism: The willful or malicious destruction, injury, disfigurement or defacement of real or personal property without the consent of the owner or person having custody or control.
Weapons Offense: All violations of regulations or statutes that control carrying, using, possessing, furnishing alid manufacturing deadly weapons or silencers. Includes attempts.
Prostitution and Commercialized Vice: Sex offenses and attempted sex offenses of a commercialized nature.
Sex Offenses: All offenses against common decency and morals. InclUdes statutory rape and all other sex offenses or attempted sex offenses not previously defined.
Narcotic Drug Laws: rhe unlawful possession, sale, use, growth or manufacture of narcotic drugs.
Gambling: Promoting, permitting or engaging in illegal gambling.
Offenses Against the Family and ChildrenNonsupport, neglect, desertion or abuse of family and children.
Driving Under the Influence: Operating ",,:ny motor vehicle or common carrier while under the influence of liquor or narcotics.
Liquor Laws: Violation of state or local regUlatory liquor laws. Includes sale to minors and drinking on a public conveyance. Excludes DriVing Under the Influence and Drunkenness.

Drunkenness: All offenses of intoxication except Driving Under the Influence.
Disorderly Conduct: Breaching the peace or attempting to do so.
Vagrancy: Offenses such as begging and loitering (age 18 and over).
All Other Offenses: All Violations of state or local laws except traffic violations and offenses defined above.
Suspicion: (Not an offense). Arrest for no specific offense and release without formal charges being filed.
Curfew and Loitering Laws: Juvenile violations of local curfew and loitering ordinances.
Runaway: The unlawful truancy from a legal place of residence by a juvenile.
10

Section - ..... -
Officers A saulted and Killed


I 'I
Officers Assaulted and Killed
-Law enforcement officers are often confronted
with emotionally charged, critical situations which might result in injury or death. In 1976, contributing agencies reported 2,330 officer assaults,1 at a rate of '17 assaults for every 100 officers, 46 percent of whom sustained injury.
Responding to disturbance calls resulted in the highest rate of assault - 24 percent, followed by arrests for offenses other than burglary or robbery - 23 percent, and traffic pursuits and stops - 20 percent. Firearm and cutting instrument assaults occurred more often during disturbance calls than during any other type of activity, and personal weapon and other dangerous weapon assaults were most frequent during arrests for offenses other than burglary or robbery. The officer assignment which most often resulted in an assault was a two man vehicle, which accounted for 37 percent, followed by a one man vehicle when the officer was alone, for 26 percent, and a one man vehicle when the officer was assisted, for 22 percent.
Personal weapons, such as hands or feet, were employed in 85 percent of all assaults and accounted for 87 percent of all injuries.2 Considering assaults according to the type of weapon used, those involving dangerous weapons excluding firearm::;, cutting instruments and personal weapons were most likely to result in injury - 55 percent of the time, while those involving firearms were least likely to do so - 23 percent of the time.
Fifty percent of all assaults occurred between 10 p.m. and 4 a.m., and only 5 percent between 6 a.m. and 10 a.m.
The most potent combination of all factors in 1976 assault situations was a one man vehicle when the officer was alone and involved in a traffic pursuit or stop; between 10 p.m. and 4 a.m.; confronting an offender Who had only personal weapons 3
• Second was a two man vehicle responding to a disturbance call and a two man vehicle involved in an arrest other than for robbery or burglary; during the 10 p.m. to 4 a.m. time frame; involving personal' weapons.
Officer assaults were cleared 96 percent of the time.
1See Table 1, page 13. 2"lnJury" includes even minor injuries such as bruises.
Six Ohio Officers from the Following Departments Were Killed in the Line of
Duty in 1976: Butler Township 1 Cleveland 1 Columbus 2 Coshocton 1 Mansfield 1
3Data is not collected in a manner that permits the correlation of all of these factors together. Independently, however, each of them occurred most frequently.
11

I njuries by Weapon
Personal weapons 87%
Firearms 3% ---------------_-.1 Cutting instruments 2% -------------\
Other dangerous weapons 8% ------------\
Assaults by Activity
Traffic 20% --------/ '>---- Disturbance calls 24%
Mentally deranged 2.5% ,.----Investigating 4.8%
Ambush 0.3% -----~====~~~~~:: __ ~--- Civil disorder 1 %
Burglaries 1.5% -----'
All other 6.5% -----'
Other arrests 23% -----~
Assaults by Time of Day
8-10 '----AM--....J
165
---- Robberies 1.4%
~------ Prisoners 15%
394 395 393
200
100
12
"

i r,
Table 1
Ohio Officers Assaulted: 1976
Activity by Weapon, Assignment and Clearances
Type of Weapon Type of Asslgnmonl Culling Other One-Manl
Fire- Inslru- Dangerous Per- 2-Man Vehicle Detoctive Activity Total arm ment Woapon sonal1 Vehicle Alone Assist Alone Assist
Disturbance 552 41 18 34 459 268 80 167 2 8 Burglaries 36 14 1 5 16 22 7 6 - -Robberies 32 17 - - 15 13 5 8 1 3 Other Arrests 535 27 2 37 469 250 80 110 12 35 Civi Disorder 21 - 1 2 i8 10 1 6 - -Prisoners 355 1 4 13 337 121 41 64 3 16 Investigating 113 25 3 10 75 50 24 22 2 3 Ambush 7 1 - 2 4 - 2 2 - 2 Mentally Deranged 58 4 5 4 45 33 8 13 1 1
Traffic 469 4 2 39 424 61 332 67 1 3 Ail other 15:1 13 1 13 125 39 19 48 9 3
Total 2,330 147 37 159 1,987 867 599 513 31 74
Number with
Injury 1,068 34 16 87 931
Number without
Injury 1,262 113 21 72 1,056
tpersonal weapons are a part of the attacker's body such as hands or feet.
13
Police Assaults Cleared
Other Alone Assist Num'ber Percent
12 14 51!7 95
1 - ~29 81
2 - 26 81
19 29 524 98
- 4 21 100
36 75 341 96
6 4 104 92
1 - 5 71
1 1 56 97
2 4 4156 97
19 15 1:39 91
9& 146 2,2~!8 96
Section . , ,Eea -
Ohio Index Crime

';."
I ntrodu ction "Ohio Index Crime" is presented in three parts: 1)
an overview of crime in Ohio, 2) individual reports for each Index offense1 and stolen property, and 3) detailed statistical tables. The Overview compares Ohio and national crime rates for the last decade and deals with the Index offenses in general terms. Individual Index offense reports describe each offense in more detail, primarily through the use of charts and graphs. Stolen property is described by Index offense and average losses for each type of offense. The final section of tables presents detailed statistics to supplement the offense reports and respond to precise information needs.
The number of Index offenses reported to law enforcement officers is the basic measure of yearly fluctuations and long-term trends in criminal activity. It is important to note that not all Index offenses are reported to law enforcement agencies, and no victimization studies are included in UCR statistics. Furthermore, because UCR is a voluntary program, not all law enforcement agencies report crime statistics. The FBI's UCR section does, however, formulate estimates of cr,lme for these agencies based on similar cities in the same state. Unless otherwise indicated, all tables, graphs, charts and references in this report refer to the number of offenses actually reported to law enforcement agencies in Ohio. Use of estimated figures is limited to discussions of crime rates and the percent change in the number of offenses from previous years.2
Ohio Overview Over the last ten years, Ohio has experienced sig
nificantly fewer Index crimes, both violent and property, per 100,000 people than the nation as a whole. Specifically, Ohio's total estimated crime rate has averaged 12.4 percent less than that for the nation; the violent crime rate 23.4 percent less; and, the property crime rate 16.3 percent less. In fact, until 1975, Ohio's total crime rate was lower than the national property crime rate alone.
This does not mean that Ohio has escaped being confronted with an expanding crime problem. In the last decade, Ohio's crime rate has grown more rapidly than the nation's3, and did so to a lesser
degree in 1976. This growth has taken Ohio from 21.5 percent below the national crime rate in 1966 to only 5.6 percent below in 1976. Nevertheless, Ohio's crime rate is still lower than the average for the nation.
Violent crime represented almost 8 percent of Ohio crime in 1976, and according to preliminary figures, about 8.7 percent nationally. Property offenses comprise the remainder.
The 1976 total estimated Ohio Crime Index remained at virtually the same level as in 1975, increasing by only 0,04 percent. Violent crime wa$ down by 5.7 percent and property crime was up by 5.2 percent. The change in the number of individual Index offenses from 1975 to 1976 closely approximates the national trends with the exceptions of a substantially greater decrease in robbery, and a significant increase in aggravated assault.
There were 318,433 reported arrests for Part I and Part II offenses in 1976.4 Adults accounted for 74 percent of these arrests and juveniles for 26 percent; males of all ages for 84 percent and females for 16 percent. By race, 71 percent of those arrested were white, 28.5 percent black and 0.5 percent of other races.
The age and race arrest groupings, in order of frequency are:
White/18 years. & older 51 percent
Black/18 years & older 28.5 percent
WIlite/under 18 years 20 percent
Black/Under 18 years 6 percent
Others/all ages 0.5 percent
The three age groupings with the highest arrest rates are the same for both males and females: 15 to 19 years old, 20 to 24 years old, and 25 to 29 years old, in descending order of frequency. These ages account for 64 percent of all male arrests and 62
llndex offenses include: Violent offenses: murder and non-negligent manslaughter, forcible rape, robbery, aggravated assault; and Property offenses: burglary. larceny and motor vehicle theft.
2Figu~eS indicating cri~e rates and the percent of change In the number of offenses are based on FBI estir~atlons for 100 percent of ~hio ~ pop~iatlon. Estimates of the probable number of ,offenses OCCUrring in non-reporting Jurisdictions are based on similar JurisdictIOns 10 OhIO. Because there were more agencies reportmg UCR crime statistics In 1976 than in 1975, the true Increase or decrease for any offense would not be indicated by a comparison of the reported number of offenses for each year.
3See Table 13, page 70.
4See Table i8, page 83.
14

percent of all female arrests. Many researchers attribute this bulge in arrest rates in part to the post World War II baby boom, the leading edge of which is now in their early thirties and the trailing edge in their mid-teens.
Males of all ages are arrested in far greater numbers than are females, at a rate of more than 5 to 1. Among juveniles, males account for 79 percent of the arrests and females for 21 percent. Considering all age groups, the highest number of arrests occurs at age 17 for males and age 16 for females, with the second most arrest-prone age occurring at age 18 for males and age 15 for females.
Crime In Ohio1
Clearance rates were from 2 percent to 6 percent higher for each Index offense except aggravated assault which dropped one percent. Juvenile arrests cleared 6.3 peroent of all 1976 offenses, slightly higher than the 5.8 percent in 1975. Overall, 21 percent of all Index offenses were cleared compared to 19 percent in 1975. Thus, the 0.04 percent increase in offen<}es was more than balanced by the 2 percent increase in clearances. In view of the fact that the number of law enforcement officers dropped by more than 10 percent from 1975 to 1976, it is particularly noteworthy that greater than 13,000 more offenses were cleared in 1976 than in 1975.
Each Day in Ohio Total Number of Offenses There Were:
1975 1976 Crimes2 1305 1344 Violent Crimes 109 106 Property Crimes 1196 1238
Murders 2.2 2.1 Forcible Rapes 6.7 7.1 Robberies 61 52 Aggravated Assaults 39 45 Burglaries 398 328 Larcenies 685 804 Motor Vehicle Thefts 113 105
Percent Distribution of Index Offenses: 19762
Motor vehicle theft 7.8% ---__ /
Robbery 3.9%-----__
Aggravated assault 3.3%----"
Forcible rape O.5%--~
Murder O.2%-~----"
Offenses Reported 1975 1976
476570 490417
39,948 38,682 436,622 451,735
\
807 766 2,460 2,600
22,347 19,065 14,334 16,251
145,180 119,602 250,077 293,564 41,365 38,369
-...-------Burglary 24.4%
I------Larceny 59.9%
tAnnual comparisons may be affected by increased reporting from 1975-76, among other factors. 2Based on the number of offenses actually reported to law enforcement agencies.
15

---------------~,.,...---------- -- ---
I
I: I'
'T. bl " I~ .a e"."", ' Ohio Reported index Offenses by Month: 19761
Total Violent Pror)srty Month Crime Crimez l,l'ime1 Murder Rape Robbel'y
January 36,842 3,085 33,757 56 156 1,816 February 37,630 2.960 34.670 '77 209 1,560 March 40,439 2,951 37,488 69 178 1,478 April 39,059 2,886 36,173 51 200 1,340 May I 42,500 3,082 39,418 62 224 1,332 June 44,519 3,364 41,155 59 266 1,423 July 45,095 3,472 41,623 83 263 1,457 August 46,055 3,394 42,661 64 293 1,437 September 40,495 3,455 37,040 63 245 1,659 October 42,888 3,424 39,464 60 214 1,771 November 38,350 3,230 35,120 59 173 1,821 December 36,545 3,379 33,166 63 179 1,971
Total 490,417 38,682 451,735 766 2,600 19,065 Rate4 4587.6 361.9 4225.8 7.2 24.3 178.3
1419 Agenci~ls reporting.
<,
Aggravated Assault Burglary
1,057 9,243 1,114 9,523 1,226 9,546 1,295 8,930 1,464 10,128 1,616 10,341 1,669 10,514 1,600 10,778 1,488 9,878 1,379 10,694 1,177 10,172 1.166 10,055
16,251 119,802 152.0 1120.7
2Violent crill'les Include murder and non-negligent manslaughter, forcible rape, robbery and aggravated a!'~ault. 3Property crimes include burglary, larceny and motor vehicle theft. 4Rate par 100,000 popUlation.
16
t
I
,--Motor
Vehicle Larceny Theft
21,514 3,000 22,103 3,044 24,592 3,350 23,995 3,24$ I 26,109 3,181 27,635 3,179 27,782 3,327 28,542 3,341 24,028 3,134 25,251 3,519 21,833 3,115 20,180 2,931
293,564 38,369 2746.2 358.9

Comparison of Ohio and United States Crime Rates: 1966-761
5500 4950 4400 3850 3300 2750 2200 1650 11.00
-.-.
550 o
500 450
,400 350 300 250 200 150 100
50 o
5,000 4,500 4,000 3,500 3,000 2,500 2,QOO 1,500 1,000
!j00 o
-
Total Index
/ 11"""~
.~,~ -"..; Il'I'" ~ I~.."..
, ~ ~ .~ i9""
IJIiI""~ I/8fB"'" l1""
1966 1967 1968 1969 1970 1971 1972 1973 1974 1975 1976
Violent Crime -- ....... ~ ....
.«lI1~· ".,. """"'IlIIi!I
.-.¢ ~ ... ~~
~ ~ ~ . ./' ~ ~
1966 1967 1968 1969 1970 1971 1972 1973 1974 1975 1976
Property Crime
~ ~ -,~ . ....".
, ~ ~ ~ ~
t-~ ---
1966 1967 1968 1969 1970 1971 1972 1973 1974 1975 1976
1 Number of offenses per 100,000 people. See Tables14 and 15 on pages '71 and 73.
17
United Year Ohio States 1966 2,097.9 2,670.8
1967 2,518.4 2,989.7
1968 2,780.9 3,370.2 1969 3,134.2 3,680.0 1970 3,574.4 3,984.5
1971 3,666.2 4,164.7
1972 3,439.4 3,961.4 1973 3,495,9 4,154.4 1974 4,223.4 4,850.4
1975 4,914.4 5,281.7 1976 4,948.2 5,243.9
United Year Ohio States
1966 i SC.S 220.0
1967 185.0 253.2
1968 200.4 298.4 1969 248.1 <328.7
1970 284.3 363.5 1971 298.4 396.0
1972 299.4 401.0
1973 291.7 417.4
1974 364.1 461.1 1975 408.0 481.5
1976 388.7 454.2
United Year Ohio States
1966 1.947.1 2,450.9 1967 2,333.4 2,736.5 1968 2,580.5 3,071.8 1969 2,886.1 3,351.3 1970 3,290.1 3,621.0 1971 3,367.8 3,768.8 1972 3,140.0 3,560.4 1973 3,204.1 3,737.0 1974 3,859.3 4,389.3 1975 4,506.4 4,800.2 1976 4,559.5 4,813.5
United States.

Ohio Crime Rates as a Percent of United States Crime Rates: 1966-761
100 90 80 70 60 50 40 30 20 10 o
100 90 80 70 60 50 40 30 20 10 o
100 90 80 70 60 50 40 30 20 10 o
Total Index
-- ~ I' L IF" ~ .......... ~ ." I~
1966 1967 1968 1969 1970 1971 1972 1973 1974 1975 1976
Violent Crime tW ~ f'
~ ~
....III!l ..... . .L - l./" ,- """"ll P ' ....
1966 1967 1968 1969 1970 1971 1972 1973 1974 1975 1976
Property Crime
...dP"'"
1966 1967 1968 1969 1970 1971 1972 1973 1974 1975 1976
Ohio.
2See lhbles 14 and 15 on pages 71 and 73 .
18
Year % 1966 78.5 1967 84.2 1968 82.5 1969 85.2 1970 89.7 11)71 88.0 1972 86.8 1973 84.1 1974 87.1 1975 93.0 1976 94.4
Year % 1966 68.5 1967 73.1 1968 67.2
1969 75.5 1970 78.2 1971 75.4 1972 74.7 1973 69.9 1974 79.0 1975 84.7 1976 85.6
Year % 1966 79.4 1967 85.3 1968 84.0
1969 86.1
1970 90.9
1971 89,4
1972 88.2 1973 85.7 1974 87.9 1975 93.9 1976 94.7
United States •

Density of Ohio Index Offenses by County: 1976
Density of Ohio Population by County: 1976
19
30,000 - 85,000
4,500 - 14,500
1,500 - 4,500
750 -1,500
D 0-749
m 900,000 -1.6 million
b<11180,000 - 800,000
o 65,000 - 155,000
o 20,000 - 64,000
D 3,000 - 19,000

Crime Rates by Population Group and County Type: 19761
Ohio Total
Group 1
Group 2
Group 3
Police Group 4
Group 5
Group 6
Group 7 Rural 1180.6
I~_-'-'...·';""_<W
Sheriffs
lSee Table 22 on page aa. Populations by group appear on page 7.
2Suburban: InsIde an SMSA: Rural; Outside an SMSA.
20
1708.8
4841.1
4501.6
4148.7
4836.1
3920.2
3945.4
3212.9
3233.8
7993.6

Ohio Clearance Rates: 1976
Total Index
Adult 15%------------
Juvenile 6%------------4
Total cleared 21 %
Violent Crime
Adult 41%-------------
Juvenile 7%-------------\
Total cleared 48%
Property Crime
'Adult 12.5%-------------
Juvenile 6%-------------\
Total cleared 18.5%
21

Murder - =- i. Definltion:
The willful, non-negligent killing of one person by 2,nother, excluding attempts to kill, assaults to kill, sIlicide, accidental death and justifiable homicide,
Murder is the most serious of the four violent Index offenses, In 1976, there were 766 murders in Ohio, which represented 2 percellt of all violent crime and less than 2/10ths of one percent of the totallndex,1 The greatest number of murders in one month was 83 in July, followed by 77 in February, Cuyahoga County, of which Cleveland is the main population center, accounted for 283 murders or 37 percent of the total.
The estimated number of murders2 not only declined by 10,6 percent from the 1975 level, but also by 2.4 percent from 1971. A steady decline by substantial increments has been evident since 1974 when there was an all time high of 952 murders. Nevertheless, murder has risen by 71.4 percent since 1966,
Ohio's murder rate dropped from 8,1 per 100,000 people in 1975 to 7.4 in 1976, and was lower than the preliminary estimate of 8,6 for the nation, However, the current rate is substantially higher than the 4,5 in 1966,
The Risk Factor indicates that there was 5 percent less chance that any Ohio citizen would become a victim of murder in 1976 than in 1975.
Due to the seriousness of this offense,. more detailed information is collected concerning victims, offenders, weapons used and the circumstances in which the offenses took place, than for any other' offense, Murder victims were 18 or more years old 90 percent of the time, male three-fourths of the time, 56 percent Negro and 43 percent white. Threefourths of the offenders were 18 or over, 64 percent were male, 17 percent female3, 50 percent Negro and 33 percent vyhlte,
Handguns were used in 49 percent of the murders and firearms of all types in 68 percent.
The situations most frequently resulting in murder were argumentfJ and fights which accounted for 44 percent of the murders. Robbery was second at 13 percent and burglary third at 3 percent. Drug related situations occurred in only 1 percent of the cases,
The clearance rate for murder was 84 percent, the highest for any Index offense, and was 6 percent higher than in 1975, In both years, juvenile arrests cleared 4 percent of the murders.
Risk Factor: 1975 1 in 13,332 People 1976 1 in 13,956 People
lSee Table 2 on page 16. 2See footnote 2 on page14,
3The sex of 19 percent of the offenders was unknown.
22
Table 3
Ohio Murder by Month: 1976
Month Total
January 56 February 77 March 69 April 51 May 62 June 59 July 83 August 64 September 63 October 60 November 59 December 63
Total 766

Murder Crime Rates, Ohio and United States: 1966-761
10 9 8 7 6 5 4 3 2 1 o
Year United States
Ohio
~-~$'
1966 5.6 4.5
~-~
.
1967 1968 6.2 6.9 5.2 5.3
--- ,~
1969 1970 1971 1972 7.3 7.9 8.6 9.0 6.4 6.6 7.5 7.5
Ohio EE
'-/' ~ ~ , ~
1973 1974 1975 1976 9.4 9.8 9.6 8.6 7.3 8.9 8.1 7.4
United States II
Ohio Murder Offenses and Clearances by Month: 19762
~!~
/ '~~
100 90 80 70 60 50 40 30 20 10
. ~ "" I~.
o Month J
Offenses 56 Clearances 49
F 77 65
M 69 67
, See Tables 14 and 15 I pages 71 and 73.
2See Tables 3 and 20 on pages 22 and 85 .
"" ~
A 51 42
M 62 51
" "'-/' "-
J
59 51
J
83 61
~
A 64 53
Offenses.
23
S 63 56
''''Ilk,
o 60 46
......... ./
dII"
N 59 45
D 63 58
Clearances II

Murder Density by County: 1976
Defiance Henry Wood
Seneca
Hardin
Logan
ShelbY Urtion
Darke ':'i 1 Champaign
Miami
Preble Montgomery ,,:1
'i
\J Greene
~-'::::::::'_I-I __ -L...-"r-__ ..l_Fayette
CC~) (:~;]
Crawford
24
Knox
Lic}<}ng
Holmes
~l
'11 Coshocton
Trumbull

Murder Rates1 by Population Group and County Type: 1976
Ohio
Group 1
Group 2
Group 3
Police Group 4
Group 5
Group 6
Group 7
Sheriffs
Suburban 1I"""'·"~·'_··"',~, __ "i
3.7
3.2 Rural
Suburban 1I __ '_i<>_ .• _"",~'
Rural II"-"'"'''''''''~'''"''
Suburban 11"'"""","_..3
Rural
Suburban 0.0
Rural 0.0
3.1
2.9
4.0
3.5
15ee Table 22 on page 88. Population by group appear on page 7 .
7.6
5.7
25
17.4

Murder Victims and Offenders by Age, Sex and Race 1
VICTIMS OFFENDERS
Age 18 & over 639 Age 18 & over 570 under 18 69 under 18 156 unknown 5 unknown 37
Sex Male 543 Sex Male 490 Female 170 Unknown 147
Female 128
Race Negro 399 Race Negro 378 White 309 White 249 Japanese/Chinese 2 Unknown 131 Other 2 Japanese/Chinese 2 Indian 1 Other 2
Murder Victim's Relationship to Offender
-.-c- ... :~. ~"-".".""'--~"---'--"- .-•. -.----.-•.. -.--.---........... - """ .w-·,··---.. ·c ''''''', ~~-... ---.... - .. .-... --, '--" ._.-.,." .:-... , .............. -,,- - •• - .. - ........ ~ • .,....-....... .,. . ..,.-.... ----~.~ .. --...,.-]
. .... 'rt.· . .... c 194 Stranger . :.. .• ~._ "'"'"'.,...,. ... _ ... __ ••• ;,--........- ••••• "_ ...... _.,.,~~,_ ... ~_ ..... ~, __ ~.,. ~,_~'"!.. •. ~_~..,.. •• "' ____ ._~"_ .. ;;," .. _._',..,.._ • .:....... ... _ ..... ,,.~.,....., .... """" ••.• _~.....,~"~,", ....... _ ;""'.,.-.. ~~',,~ ~,~ _._~."->, ...... .,.;...,,,..,._, ..... ---"' .... _,._ •.• __ .. _ .... ,:..~~!.-_~ .. ,,-__ .... -, .... -:..c __ .... ~"'_~_"'_~ .. ,_,,· .,,;
~~---.--:--.----... -.. --.. --.--,.--------, ....... -.-.-.. -,-"' ...... -'~ ... - .• -: -·-:·-~~· .. -·--· .. ,-·-----:'::--~·~·~~-·-·-----"'~,---1 .' ... c. . •... ".... .: . . 145 AcquaIntance \
___ .~~~l.~........:,. __ "._:""''''''.,'--.:.-..... ,.M-.~.~ .. ~.,...,._ ... ~w~_ .... i .. ~_ .. _'-:......,:tf~~ __ ..:..:....._.:.._'"'._ ~_"-~";'.h __ ,~: ., __ ~.~_~ __ ""-. __ ;.,.~;L.-:,...."_..-.:..:.,._:...".<-... ,~ .. "~, __ ~ ..... .,.. ......... ~.'"~. ¥
:''' ....... --r->~.- ... -~ ... -.'-<.-""'-".~.~.--' .... ,--r----.-.'-.-;-.... - .. -.~ ":'---.... --...... ···,41'"'":""'~-,(···'_ ...... ,...M_....-~',~ ........ ~~"'"7.~~-"~ ... " ............... r--"''1
. .. "'. " •. . . ...., 124 Unknown I •• ~ __ --'_, __ > .... ,---'_.~'". __ . ___ ~_ •• _'"'" ••• '"_."_,,, ___ "-'-_._ .... ~_ •• __ ,_._ •• "~ ___ ... _ ....... ;. •• _" __ ,, •• '" ••• _~. __ .,,J
"-': .... ~ .. -.,.--.~ ... ----.. -.~ ... ~ .... -' .... -'"-...... -" ... - .. ---,~-.. ---.. --"'.~ ... '~-7l h" . . 'b '93 Friend!
. __ -'--'-._,_ .... __ ~._~ ....... _._~ __ ,._.~ _____ ~-'-____ ._-'-____ ._,-'- ____ ........ _.1
.. ~-.':.-~~. ..,-,-.-.. ----. . -'21 . . . ..... 50 Wife .'J'"
_~ ......... _"". __ ~~....,' .... _ .. A.,.:..:,...:.......,_~"_"_..,.,, .... ..;... ..... ,
-.. -~~--:-.,.. . .,.....,..-~"'.-----:, '.. 45 Other.family i .. '-_,_~_,_"" . . '. ,._. __ J
'15 Daughter
14 Neighbor
lThis Table contains supplementary information which is not always reported for each murder offense listed In Table 3. Therefore. these offense totals may differ from those in Table 3.
2lncludes common-law spouse.
26

Murder by Type of Weapon
Handgun 376
Knife or cutting instrument 89
Shotgun 72 ; -.:_ h'-.~" ~., • __ "_~~ ._~:..._:.._)
Blunt instrument 61
Strong-arm 52
Other dangerous weapon 44
Firearm-unidentified 39
Rifle 27
Murder by Situation
Single victim/single offender 500 70%
Single victim/unknown offender 115-16%1--------4
Single victim/multiple offenders 55 8%
Multiple victims/single offender 35 5%
Multiple victims/multiple offenders 8 --1%
27

-- ._-----
Murder Arrests: 19761
Male 36 Juveniles
Female ------"'-""-"" ,.-.... ,_.
---I :J 6 Juveniles
White 22 Juveniles
Negro 12 JUVeniles
, .\1 Adult
Other 11 Juvenile
123 Adults
Murder Clearance Rates: 1975 & 19762
1975
If)
301 Adults
Juvenile clearances 4% ___ ------~~.........,r----
Adult clearances 74% -----....
Total percent clearances 78%
1976
Juvenile clearances 4% -----
Adult clearances 80% ----.
Total percent clearances 84%
lSee rabies 16 and 17 on pages 75 and 79. 28ee Tables 20 and 21 on pages 85 and 87 •
28
. : 433 Adults
----Uncleared
"...----- Uncleared

Forcible Rape ..... Definition: The carnal knowledge of a female forcibly and against her will including rape by force or threat vf force. assault to rape and attempted rape, but excluding statutory rape.
There were 2600 forcible rapes and attempted rapes reported In 1976.1 This represents 7 percent of all violent crime and 0.5 percent of the total Index. Forcible rape accounted for 82 percent of all rapes, the greatest number of which, 234, occurred in August, followed by 226 in June, More than 40 percent of the year's forcible rapes were reported from June through September. The months of July and August, with 59 each, had the highest frequency for attempted rape.
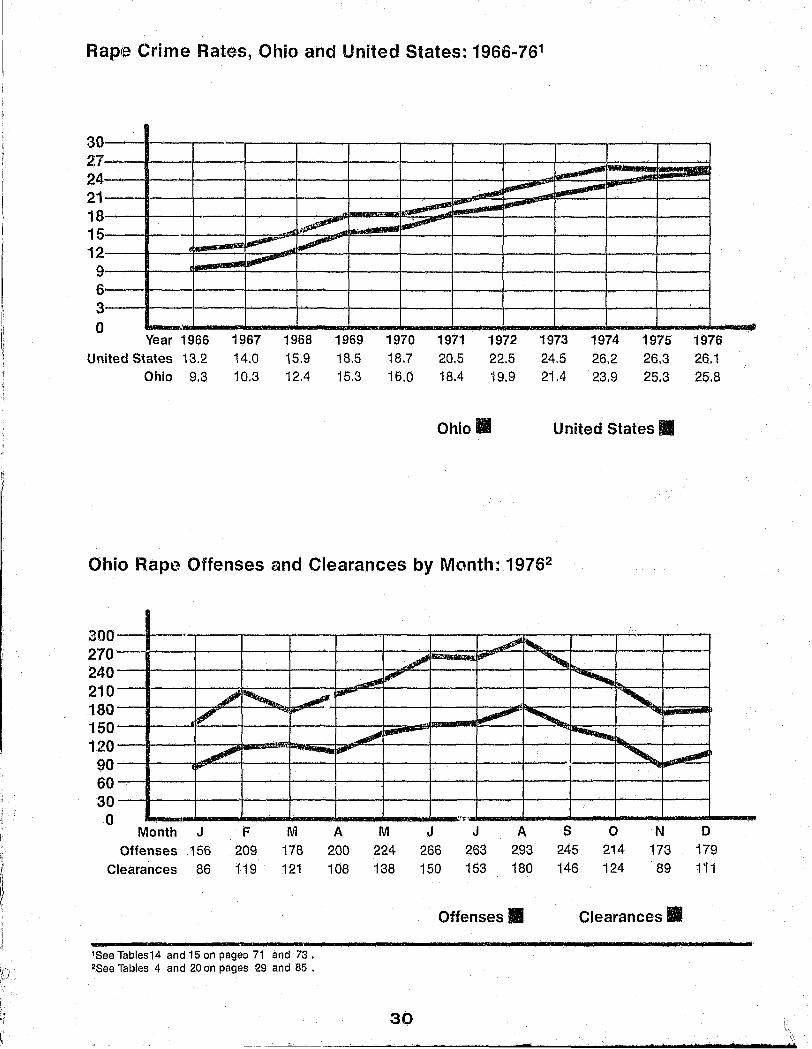
The estimated number of 1976 rapes2 Showed a slight Increase of 1.4 percent from 1975, a 38.8 percent increase from 1971 and an 86.5 percent increase from 1966. Preliminary calculations Indicate that the -\1-dmber of rape offenses nationally will remain ur.:~I:l£1nged from 1975. Rape has traditionally been one of the most under-reported crimes. However, as a result of changing laws and victim counselling in recent years, the rate of reporting rapes is increasing,3
The rape rate per 100,000 people was 25.8 in 1976, a minor increase from 25.3 in 1975. Although the rate at which rape occurs within the population Is usually calculated on the basis of the number of offenses per 100,000 inhabitants. both male and female, by UCR definition only females can be victims. TherefofO, the number of rapes in Ohia per 100,000 females was 50.6 in 1976, an increase from 49.6 in 1975. The forcible rape rate in 1976 was 38.9 per 100,000 temales. The 1976 national rape rates were 26.1 for the entire population and 51.2 for females only based on preliminary estimates.
The Risk Factor indicates that women were almost 6 percent more likely to be the Victims of rape, both attempted and -forcible, in 1976 than In 1975, with a much greater Increase occurring in the chances for attempt"d rape.
Rapes were cleared 59 percent of the time in 1976, up 4 percent from 1975. Juvenile arrests accounted for /half of this increase, clearing 5 percent of all rJ'tpes In 1975 and 7 percent in 1976.
'See Table 2. page 16. ~See lootnote 2 on page 14.
Risk Factor: Forcible 1975 1 in 2,702 Women 1976 1 in 2,578 Women Attempted 1975 1 in 12,790 Women 1976 1 in 11,241 Women
Table 4 Ohio Rape by Month: 1916
Month Total Forced
January 156 124 February 209 176 March 178 147 April 200 158 May 224 178 June 266 226 July 263 2Q4 August 293 234 September 245 2Q5 October 214 168 November 1 i'3 138 December 179 157
Total 2600 2115
Attempted
32 33 31
42 46 40 59 59 40 46 35 22
485 --
3Although the FBt has traditionally estimated that only 1 rape in every 10 is reported. the National Crime Panel now estimates that It is 1 rape In 3. Rape Crisis Centers In two major Ohio metropolitan areas report that 49% and 65% of their clients eventually reported rapes to the pOlice in 1976. In Cuyahoga County. the number of reported rapes has almost doubled from 1970 to 1976. the largest increase for any Index offense,
29
1-l Rape Crime Rates, Ohio and United States: 1966 .. 761
n ,-/
~. ~~
30 27 24 21 18 15 12
9 6 3 o
-1-
.... ~~ .......,.... -- ~ ....
Year 1966 1967 1968 1969 1970 1971 United States 13.2 14.0 15.9 18.5 18.7 20.5
Ohio 9.3 10.3 12.4 15.3 16.0 18.4
",,/IS!!IIflIIl .~
1972 22.5 '19.9
1973 24.5 21.4
1974 26.2 23.9
1975 1976 26.3 26,1 25.3 25.8
Ohio. United States.
Ohio Rape Offenses and Clearances by Month: 19762
300+ 270
~ ~ -, ~ '" ---" ~
./ I~ ~ ,JIIIII""" ',~ , ,...
~ ~ ...,;I' -- ............ ~
240 210 180 150 120
90 60 30
...,... - ~ ~
o 'J''!:
Month J F M A M J J A 5 0 N D
Offenses 156 209 178 200 224 266 263 293 245 214 173 179 Clearances 86 119 121 108 138 150 153 180 146 124 89 iii
Offenses • Clearances.
-- .. 'See Tables14 and 15 on pageo 71 and 73 • 2See Tables 4 and 20 on pages 29 and 85 .
30
- ••
\1 ':
\\ iIIIII

Rape Density by County: 1976
Williams Fulton
Defiance Henry Wood Sandusky
Paulding Seneca
Putnam
Van W~rt Wayne
Holmes Mercer Auglaize
:i Logan ~
r Shelby a
~ Darke Champa1gn ~
M1ami 11 fr~ a tl
100 - 613
30 - 99
10 - 29
0-9
31

Rape Rates1 by Population Group and County Type: 1976
Ohio "~~~""~'-""_"_'_'~~~_''''''~~ .~ •• _ • ...;o _.," ....... , •• 1"~. -_. "'"~,,-••• ~.o.t'....,"1
, " ' " t 257 '" .. ",,,.-,,,,,,_:,,,,,,,,,.- ",,,,,,,',, ,,,,_,, '''_..c. .. ..:: .. ,,:''''''~'' "'~" ,.'" •
Group 1
Group 2 52,6
Group 3 18.2
Suburban 16.8 Police Group 4
Rural ,17.6
J Suburban 7.9
Group 5
Rural 6.4
Group 6 Suburban 9.5 • .....;,,,-'",. __ ._ • ..J
10.1
11.0 Group 7
Rurall";' __ , __ ~_"J 7.1
16.5 Sheriffs
Rural I._........: __ ,,~...l
tSee Table 22 on page 88 • Populations by group appear on page 7.
32
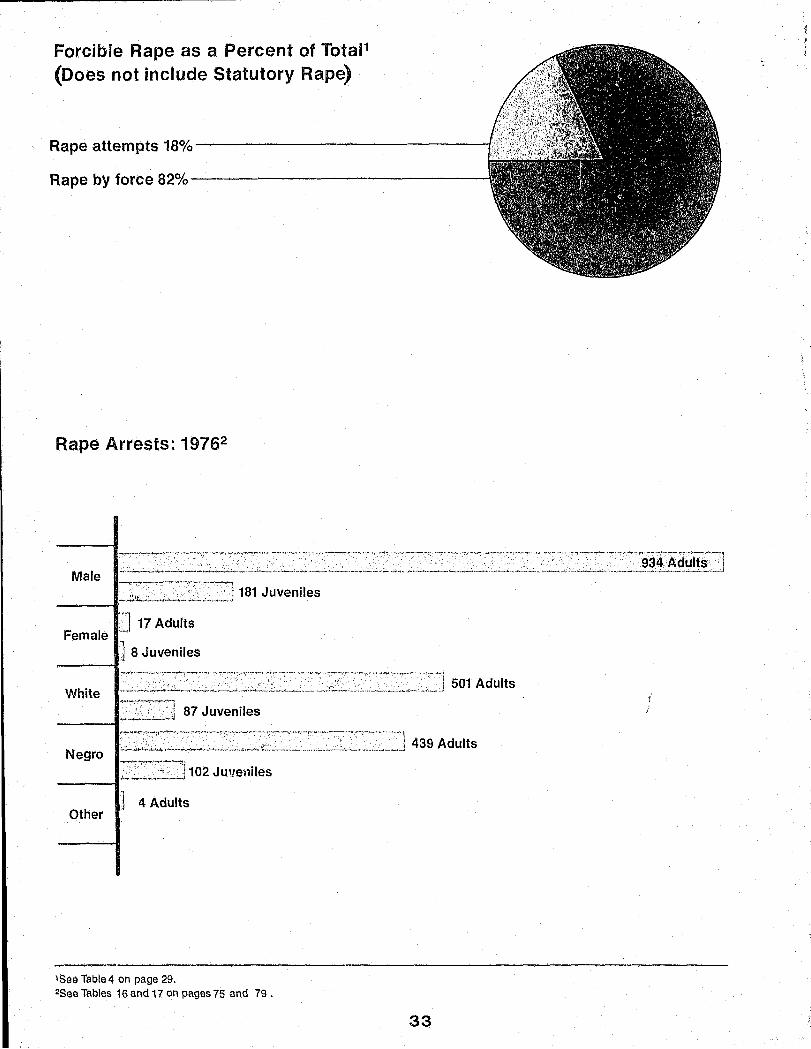
Forcible Rape as a Percent of TotaP (Does not include Statutory Rape)
Rape attempts 18%----------------r.~::, ..
Rape by force 82%--------------------:
Rape Arrests ~ 19762
>:" .', . :'
.' "
'.
Male
"". ........ 1181 Juveniles
Female J 17 Adults 1 J 8 Juveniles
' .. ~ . ,<, • ,'e' .
.. j 501 Adults . .
White
.' J 87 Juveniles
:,' ':' . ' ' .• 1 439 Adults IJ'" .
Negro ........ , ,1102 Juveniles
] 4 Adults Other
'See Table 4 on page 29. 2See Tables 16 and 17 on pages 75 and 79.
33
{ ,:

Rape Clearance Rates: 1975 & 19761
Juvenile clearances 5% -------~----------/
Adult clearances 50% --------------
Total percent clearances 550/0
Juvenile clearances 7% -------------1
Adult clearances 52% --------------
Total percent clearances 59%
lSee Tables 20 and 21 on pages 85 and 87.
34 rt f

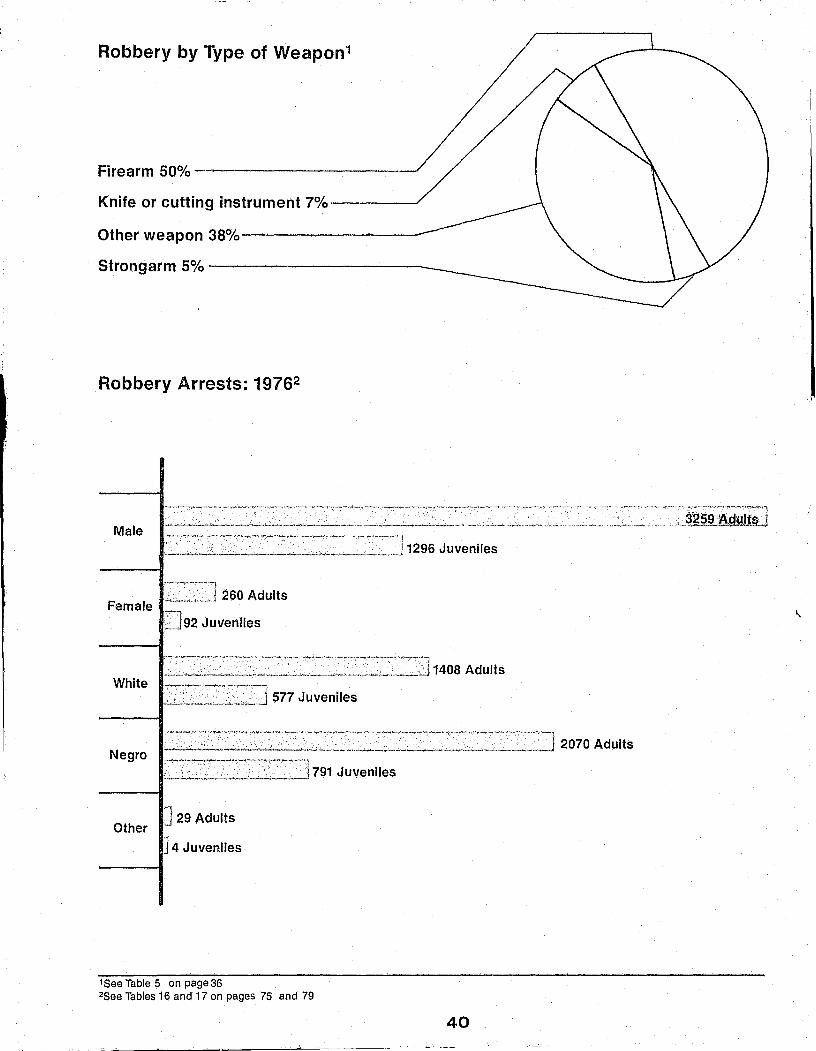
Robbery ., .. LWA ..... Definition: Taking or attempting to take anything of value from a person or persons by force, or threat of force or violence and/or putting the victim in fear, including assault to rob, strong-arm robbery and armed robbery.
The 19,065 robbery offenses in 1976 represented 49 percent of all violent crime, its largest component, and almost 4 percent of a!llndex crime.1
Considering all types of robbery, the greatest number of offenses -1971 - took place in December. This was also the highest month for commercial store, service station and residential robbery offenses. January was highest for chain stores, January and March for bank robbery, and November and December for highway robbery.g
A total of $5.5 million was stolen during Ohio robberies in 1976. December accounted for the highest dollar losses from all types of robbery - $646,622. For the twelve month period, both the greatest number of offenses - 9681 - and the largest dollar losses - $2.4 million - resulted from highway robbery. Understandably, banks, with the lowest number of offenses, had the highest average loss per offense.
Firearms were used in 50 percent of the robberies and other dangerous weapons, excluding cutting instruments, in 38 percent.
The estimated number of robberies3 decreased for the first time in a decade and showed the largest decrease for all Index offenses, down 20.5 percent from 1975. There were also 11.4 percent fewer robberies than in 197"1, but 175.6 percent more than in 1966. Robbery has increased more in the last 10 years than any other Index offense. Preliminary figures for the nation indicate that robbery decreased by ten percent.
The robbery rate per 100,000 people decreased from 220 in 1975, its highest point in the last ten years, to 183.8 in 1976, but this is still almost three times the rate of 69.2 in 1966. Based on preliminary figures, the 1976 national robbery rate is 194.9.
The Risk Factor indicates a wide disparity in the potential for becoming a robbery victim between banks and service stations on the one hand and residences and individuals on the other, from as high as 1 in 7 banks to a low as 1 In 2046 residences.
Robberies were cleared 31 percent of the time in 1976, an increase of 2 percent from 1975. Juvenile arrests cleared 6 percent of the robberies in both years,
ISee Table 2 on page 16. 2Robbery on the streets. 3Refer to footnote 2 on page 14.
4Number of robbery offenses by location not available for 1975.
Risk Factor:4
1976
Residential Highway Chain/Commercial Stores Service Stations Banks
35
1 in 2,046 Residences 1 In 1,104 People 1 in 27 Stores 1 in 8 Stations 1 in 7 Banks
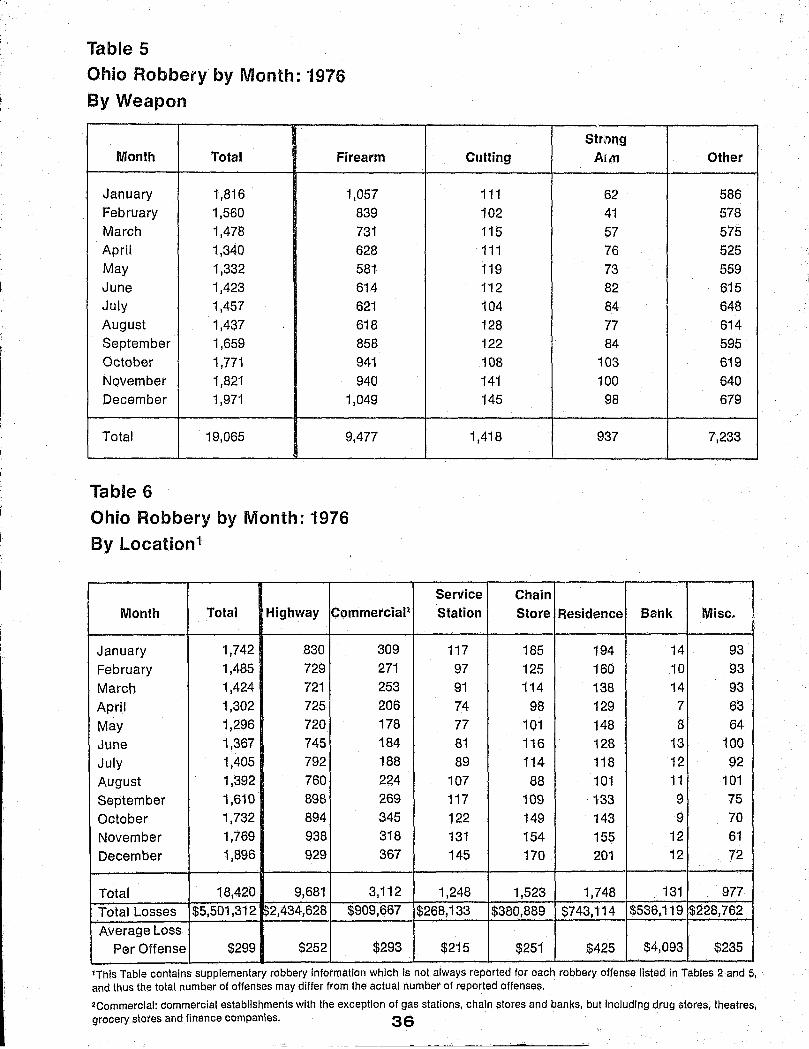
Table 5
Ohio Robbery by Month: 1976
By Weapon
Month Total Firearm
January 1,816 1,057 February 1,560 839 March 1,478 731 April 1,340 628 May 1,332 581 June 1,423 614 July 1,457 621 August 1,437 618 September 1,659 858 October 1,771 941 November 1,821 940 December 1,971 1,049
Total 19,065 9,477
Table 6
Ohio Robbery by Month: 1976
By Location1
Month Total Highway CommerciaP
January 1,742 830 309
February 1,485 729 271
March 1,424 721 253
April 1,302 725 206
May 1,296 720 178
June 1,367 745 184
July 1,405 792 188
August 1,392 760 224
September 1,610 B9B 269
October 1,732 B94 345
November 1,769 938 318
December 1,896 929 367
Total 18,420 9,681 3,112
Total Losses $5,501,312 :p2,434,628 $909,667
Average Loss Per Offense $299 $252 $293
StMng Cutting Arm Other
111 62 586 102 41 578 115 57 575 111 76 525 119 73 559 112 82 615 104 84 648 128 77 614 122 84 595 108 103 619 141 100 640 145 98 679
1,418 937 7,233
Service Chain
1 Station Store. Residence Bank Mise,
117 185 194 14 93 97 125 160 10 93 91 114 138 14 93 74 98 129 7 63 77 101 148 8 64 81 116 128 13 100 89 114 118 12 92
107 88 101 11 101 117 109 133 9 75 122 149 143 9 70 131 154 155 12 61 145 170 201 12 72
1,248 1,523 1,748 131 977 $268,133 $380,889 $743,114 $536,119 $228,762
$215 $251 $425 $4,093 $235
lThis Table contains supplementary robbery information which is not always reported for each robbery offense listed in Tables 2 and 5, . and thus the total number of offenses may differ from the actual number of reported offenses.
~Commercial: commercial establishments with the exception of gas stations, chain stores and banks, but including drug stores, theatres, grocery stotes and finance companies. 36

Robbery Crime Rates, Ohio and United States: 1966-761
250 225 200 175 150 125 100
~ 75 50 25 o
Year United States
Ohio
fP"~ (;'>"
1966 80.8 69.2
.~ r~~ .. ~~~, ~ ~~ ~'
~ l~ ~ ~.~
... -.-'-"
1967 1968 1969 1970 1971 1972 102.8 131.8 148.4 172.1 188.0 180.7 95.0 102.0 126.7 145.9 163.7 160.6
/ "'""'P"
1973 1974 1975 1976 183.1 209.3 218.2 194.9 143.5 191.2 220.0 183.8
Ohio8J United States fil
Ohio Robbery Offenses and Clearances by Month: 19762
2,000-+----.---,----.----.----.---,~--~---.----r---,---~---~ 1,800 I~
1,600~===41== ~·~~~~~J;;.;~:::t~~;;~~~~:~t~~=t===4==~ 1,400 ~ 1,200~--~--~--~--~----+---~--~~--4----+----~--~---+--~
1,OOO-+----~--~--~----+---~--~~--4----+----~--~---+--~
800-+----r---+----+--~----+----r---+----r---;----+--~--~
600-t---.(~~~--~~.~~~ .. ~·~~~~~.t,--.---t----r---~----t~~~.~~.~.~ .. ~~~~~ 400-t---+~~~_+~~~·~~~·~d.p2.~,-~~aJ~~~~~~~~~~ 200-+--~----~--~--~--~----~--+---~---+---4----~~
o Month J F M A M J J A S 0 N 0
Offenses 1,816 1,5601,4781,3401,3321,4231,4571,4371,6591,771 ,,821 1,971 Clearances 545 495 795 422 334 411 396 423 545 498 532 471
Offenses. Clearances.
1 See Tables 14 and 15 on pages 71 and 73. 2Sae Tables 5 and 20 on pages 36 and 85.
37

Robbery Density by County: 1976
Williams
Defiance
Paulding Seneca
,
i Van Wert Wayne
I I
I Holmes
Mercer Auglaize
f Logan (
Ii Shelby Union
Darke Champaign
Preble Pickaway
Ross
Pike
1,000 - 6,390
100 - 999
30 -99
0-29
38 -- - ----' "~---

Robbery Rates1 by Population Group and County Type: 1976
Ohio 188.2
Group 1 , " . • , •• ;.. ..... c, ..... ~ ~ _,~._..-____ .~_~ •••• __ ._.--' __ .,'-_,,_.~ ••• ; •• ~_" •• , ....... --"". __ ~_." __ ......... _ ,. ~ ••••• ~-"'<~ •• ___ .~_ • ..c, ___ , __ ,~ .~ ..
490.9
Group 2
Group 3 122.4
Suburban 103.7 Police Group 4
Suburban 55.7 Group 5
Rural 45.2
SUburban Group 6
Rural '-~l 23.3 :....,,_.J
Suburban 35.8 Group 7
""\
Rural! '7.1 ', ••• 1
Suburban 65.1 Sheriffs
Rural .~ 17.4
'Per 100,000 people. See Table 22 on page 88
39
Robbery by Type of Weapon'
Firearm 50% ~----------
Knife or cutting instrument 7% ----~
Other weapon 38%-------------
Strongarm 5% -------------
Robbery Arrests: 19762
-'-~"--.•• "-'-~"~. -'-·-'-'~·~"-"'---·-·~··_:-,-.·',~c"'-"'7··'-·-·'·"-·-c",".,,,-,, """"" ""':-"""'--'~'-:'-':-:----~"~~']
_,~;_._:.:.._'".~:........ __ .. "._.~.:... ___ ~~. __ ..:...'"_"" __ .""' ___ ,_ . .;._.:::.~._.:.._."", ,-... ,_",., .. ,"" ,;.,." ~, .... , ...... ',." ",'"'," : ... :"",,_, ., (, .. ~:2~i:A,~y.lt~tJ Male
I"";'''~_'''''''-' 260 Adults Female
~]92 Juvehiles
White
Negro
J 29 Adults Other
] 4 Juveniles
1See Table 5 on page36 2See Tables 16 and 17 on pages 75 and 79
40

Robbery Clearance Rates: 1975 & 19761
Adult clearances 23%--------
Juvenile clearances 6%-----·"-----1
Total percent clearances 29%
Adult clearances 25% ----------1
Juvenile clearances 6%--------1
Total percent clearances 31 %
2See Tables 20and 21 on pages 85and 87.
41

Aggravated Assault = $2E2U •
Definition: An unlawful attack by one person on another for the purpose of inflicting severe bodily injury or death, usually accompanied by the use of a weapon that is likely to produce death or great bodily harm. Includes attempted murder.
There were 16,251 aggravated assaults in Ohio in 1976 which totaled 42 percent of all violent crime and about 3 percent of the total Index.' Simple assault is primarily differentiated from aggravated assault by the seriousness of the injury and the weapon used. Considering both types of assault, aggravated represented 29 percent of the total.
Both the greatest number of aggravated assaults and the largest number with firearms and cutting instruments occurred in July. Other dangerous weapons were used most frequently in August and personal weapons in June. More than one third of all aggravated assaults Involved the use of personal weapons,2 and 28 percent involved firearms.
The estimatEld number of aggravated assaults3 in
Table 7
Ohio Assaults by Month: 1976
By Weapon
Cutting Month Total Firearm Instrument
January 1,057 326 211 February 1,114 319 256 March '1,226 :320 255 April 1,295 366 278 May 1,464 419 265 June 1,616 393 285 July 1,669 472 316 August 1,600 413 293 September 1,488 423 259 October 1,379 389 247 November 1,177 321 204 December 1,166 343 238
Total 16,251 4,504 3,107
1 See Table 2. page 16
1976 showed the largest increase from 1975 of all Index offenses, jumping by 1004 percent at a time when preliminary figures indicate a one percent de~ crease nationally. Aggravated assault was 56,7 percent higher than in 1971 and 162.8 percent higher than in 1966.
The rate of aggravated assault per 100,000 inhabitants was 171.1 in 1976, an increase from 154.6 in 1975 and more than double the rate of 67.8 in 1966. However, Ohio is still well below the national average of 223.5.
The Risk Factor indicates that there was a 14 per'" cent greater chance of a person's being the victim of aggravated assault in 1976 than in 1975.
It WOUld, therefore, seem significant that aggra'" vated assault was the only Index offense that had a lower clearance rate in 1976 than it did in 1975 - 64 percent compared to 65 percent. Juvenile arrests cleared 8 percent of the aggravated assaults in 1976 and 7 percent in 1975.
RiSk Factor: 1975 1 in 751 People 1976 1 in 658 People
Other Dangerous
WSlapon Personal
173 347 199 340 188 463 239 412 263 517 310 628 290 591 315 579 278 528 217 526 187 465 158 427
2,817 5,823
Aggravated & 2
Simple Simple Total
2,640 3,697 2,814 3,928 3,272 4,498 3,283 4,578 3,921 5,385 4,106 5,722 3,817 5,486 3,947 5,547 3,517 5,005 3,386 4,765 2,860 4,037 2,491 31657
40,054 56,305
2Personal weapons are a part of the attacker's body such as hands and feet. 3Refer to footnote 2 on page 14,
42
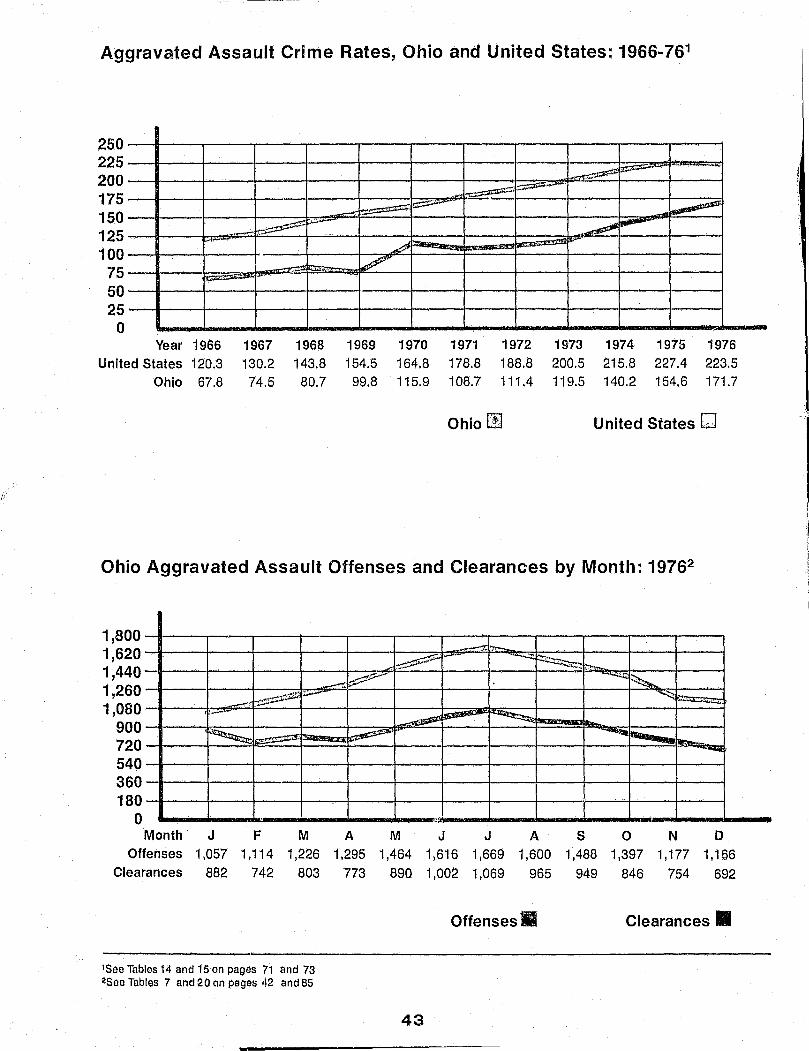
Aggravated Assault Crime Rates, Ohio and United States: 1966 .. 761
250 225 200 175 150 125 100
75 50 25 o
' ......
Year 1966 United States 120.3
Ohio 67.8
h;::~ p...,;.---
. , ........ ', .
1967 1968 130.2 143.8
74.5 80.7
~ =-" .....
~ ,~
1-~
~
1969 1970 154.5 164.8 99.8 115.9
~ --- fI'-" w --~ ~;.w- -~
~
1971 1972 1973 1974 1975 178.8 188.8 200.5 215.8 227.4 108.7 111.4 119.5 140.2 154.6
~
1976 223.5 171.7
Ohio rn United States GJ
Ohio Aggravated Assault Offenses and Clearances by Month: 19762
1,800~'----~--~--~----~---r----r----~--~----~---r---'--~
1,62°_-1====t===jt===j====1==::t~~·,~~:·t~:::~:::"-~~-l'~~~§~~~~:::t===j===~ 1,440 ~~.- ~~ 1,260-+----·~-~~-~-"-~-.. ~.~~~~~~--~--~~--~---+----~--~~.~~~~--~ 1,080 I=J,----:::c=r=t==c:;a~~~3;;;;J:::JC=r=J
900 '~ ~ _""~ 720-t---+='~'~'~~'~~~~~~--~--4---~--~--~~~~~_J 540-+----r---+---~--~----+----~--~----r---~---+--~~--4 360-+----r---+---~--~----+---~--~----~--~---+--~~--4
180-+----+---~--_4----4---~--___ ~--4----+----~~~---+--~ o
Month J F M A M J J A SON 0 Offenses 1,057 1,114 1,226 1,295 1.464 1,616 1,669 1,600 1,488 1,397 1,177 1,166
Clearances 882 742 803 773 890 1,002 1,069 965 949 846 754 692
'See Tables 14 and 15 on pages 71 and 73 ~See Tables 7 and:!O on pages 42 and 85
43
Offenses. Clearances.
•

Aggravated Assault Density by County: 19'76
o.
Williams
Doflance
Hllncock
Hardin Holmes
Mercer Auglaize
Logan Coshocton Sholby
·Darke Champaign
Mit\n\!
'" '
~ 2,700 - 3,375 ":;';~ , ',"
18 600 -1,300
D 100 - 599
0 40 -99
0 0-39
44

---------------------- ----
Aggravated Assault Rates1 by Population Group and County Type: 1976
Ohio 160.4
Group 1 270.6
Group 2
Group 3
Police Group 4 172.4 Suburban
E-'-~~--·,~,-~·~~~-,~(,,·-"'-,,·,~~~,C<,~-~--,-,-j
Rural
Group 5 Sub u rb an 1."_.,''''-',-oC,_,. ___ ,-'--,, ____ '-,'-' __ --'-'_'''-''-,-'-_: • .1
Rural I c ___ .,_,. __ ,:_~ ___ ,._~,.~,, __ , __ .:..,'--~":... ___ , 130.0
Group 6 Suburban'
.=,~,,-~~~~--~-~-"~~ .. "~~--.~-~ 126.5
Rural 11 __ ,· ___ ,~_'_:~~"';_·,_:.!._"·\_,_'_' 94.5
Group 7 107.5 Sub u rban ,,:..c .• _""",."'~"".: __ ~_, .... ..; _ _"__,._~~..:.: .... ____ J
Rural a",-'~--,,_' __ .c.~_;_~._.;,.l
Sheriffs Suburban •. ~-~-~-.. ~-~---~~=~~",,-j 113.5
Rural
lPer 100,000 people, See Table 22 on page 88.
45

Total Percentage Assaults by Type1
Aggravated assaults 29% -------------
Simple or minor assaults 71% -------------\
Aggravated Assaults by Type of Weapon Used1
Firearm 28% --------/
Personal weapon 56% ---..,.
Aggravated Assault Arrests: 19762
Knife or other
cutting instrument 19%
Other weapons
(club, poison, etc.) 17%
Male L~=~~====-"'===~;~~"~·-·=:~~~~~._~::~=.~~~=~·"~==~·-=~:~~~2~--=:.; . .;,:~-==~=~··'·' ·:-~=?:~~~~.q.AailJfd ___ -Ic-"''"''--~-.. ~'.....;.,'-."--• ..;-J 604 Juveniles
Female ==:·~c-.=:::L~~=- :J534 Adults
Adults White
Negro Juveniles
'-, -, ._,~:. ... ..J169 Adults
----I
Other J17 Adults
] 6 Juveniles
lSee Table 7 on page42. 2See Tables 16 and 17 on pages 75 and 79.
46
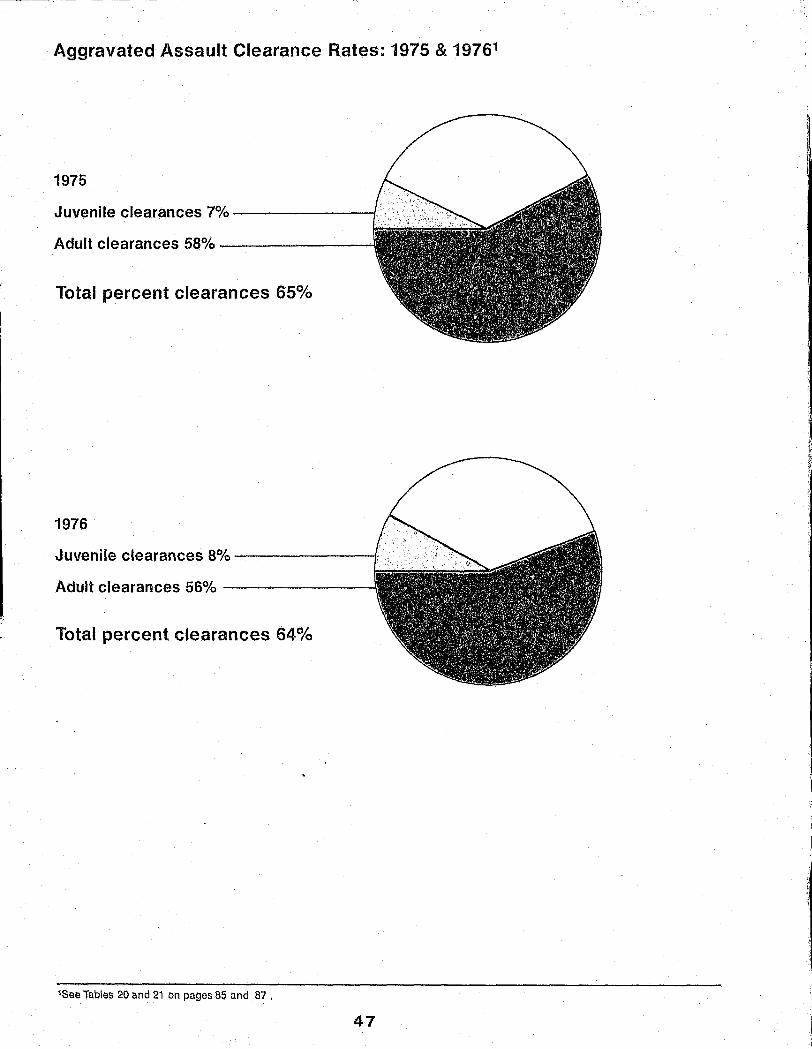
Aggravated Assault Clearance Rates: 1975 & 19761
I I
1975
Juvenile clearances 7% ---------f
Adult clearances 58% --------
Total percent clearances 65%
1976
Juvenile clearances 8% -------/'
Adult clearances 56% ----------'
Total percent clearances 64%
ISee Tables 20 and 21 on pages 85 and 87 .
47
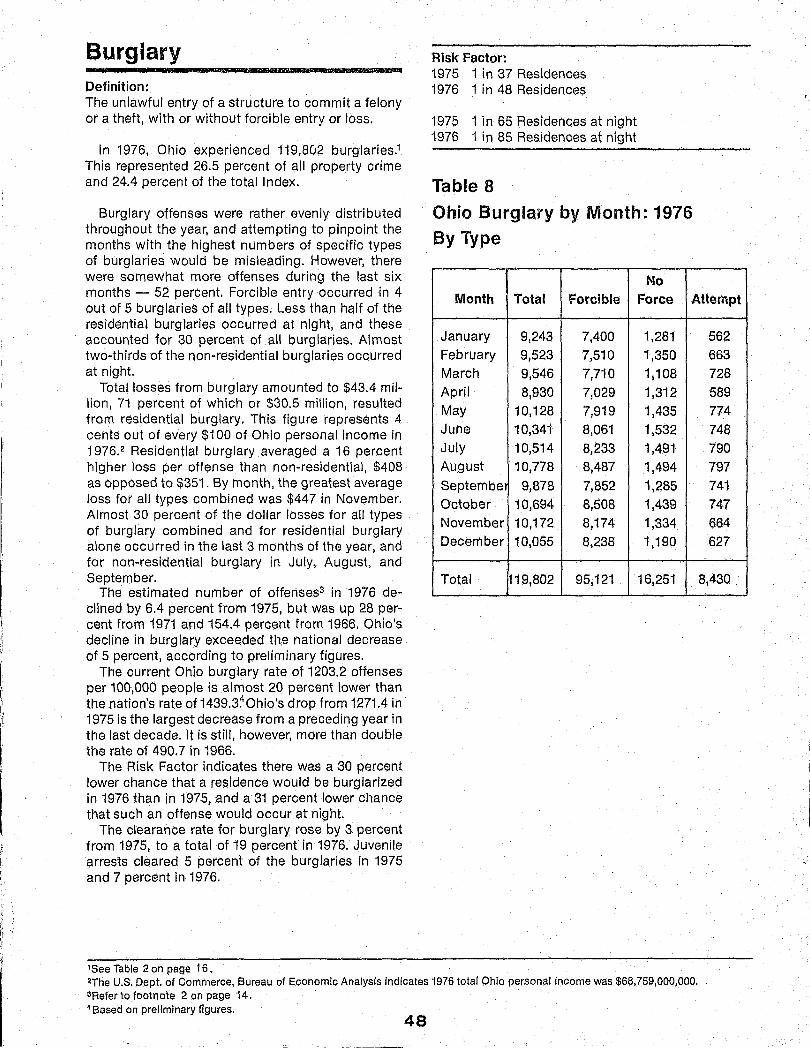
Burglary .M De. alA 'pr&1D
Definition: The unlawful entry of a structure to commit a felony or a theft, with or without forcible entry or loss.
In 1976, Ohio experienced 119,802 burglaries.1
This represented 26.5 percent of all property crime and 24.4 percent of the total Index.
Risk Factor: 1975 1 in 37 Residences 1976 1 in 48 Residences
1975 1 in 65 Residences at night 1976 1 in 85 Residences at night
Table 8
Ohio Burglary by Month: 1976
By Type
No
Burglary offenses were rather evenly distributed throughout the year, and attempting to pinpoint the months with the highest numbers of specific types of burglaries would be misleading. However, there were somewhat more offenses during the last six months - 52 percent. Forcible entry occurred in 4 out of 5 burglaries of all types. Less than half of the residential burglaries occurred at night, and these accounted for 30 percent of all burglaries. Almost two-thirds of the non-residential burglaries occurred at night.
Month Total Forcible Force Attempt
Total losses from burglary amounted to $43.4 million, 71 percent of which or $30.5 million, resulted from residential burglary. This figure represents 4 cents out of every $100 of Ohio personal income in 1976.2 Residential burglary averaged a 16 percent higher loss per offense than non-residential, $408 as opposed to $351. By month, the greatest average loss for all types combined was $447 in November. Almost 30 percent of the dollar losses for all types of burglary combined and for residential burglary alone occurred in the last 3 months of the year, and for non-residential burglary in July, August, and September.
The estimated number of offenses3 in 1976 declined by 6.4 percent from 1975, but was up 28 percent from 1971 and 154.4 percent from 1966. Ohio's decline in burglary exceeded the national decrease of 5 percent, according to preliminary figures.
The current Ohio burglary rate of 1203.2 offenses per 100,000 people is almost 20 percent lower than the nation's rate of 1439.3~Ohio's drop from 1271.4 in 1975 is the largest decrease from a preceding year in the last decade. It is still, however, more than double the rate of 490.7 in 1966.
The Risk Factor indicates there was a 30 percent lower chance that a residence would be burglarized in 1976 than in 1975, and a31 percent lower chance that such an offense would occur.at night.
The clearance rate for burglary rose by 3 percent from 1975, to a total of 19 percent in 1976. Juvenile arrests cleared 5 percent of the burglaries in 1975 and 7 percent in 1976.
lSee Table 2 on page 16.
January February March April May June July August
Septembe October November December
Total
9,243 7,400 1,281 9,523 7,510 1,350 9,546 7,710 1,108 8,930 7,029 1,312
10,128 7,919 1,435 10,341 8,061 1,532 10,514 8,233 1,491 10,778 8,487 1,494 9,878 7,852 1,285
10,694 8,508 1,439 10,172 8,174 1,334 10,055 8,238 1,190
119,802 95,121 16,251
2The U.S. Dept. of Commerce, Sureau of Economic Analysis indicates 1976 total Ohio personal income was $68,759,000,000. 3Refer to footnote 2 on page 14. 4 Based on preliminary figures.
48
562 663 728 589 774 748 790 797 741 747 664 627
8,430

Table 9
Ohio Burglary by Month: 1976
By Location1
Residential
Month Total Night Day
January 8,438 2,713 1,791
February 8,745 2,747 1,891
March 8,840 2,681 1,982
April 8,340 2,542 1,927
May 9,471 2,519 2,257 June 9,606 2,766 2,058 July 9,784 3,039 1,942 August 9,908 2,962 2,049 September 9,203 2,548 2,291
October 10,146 2,867 2,533 November 9,537 2,840 2,540 December 9,461 2,836 2,379
Total 111,479 33,060 25,640
Total Losses $43,407,010 $13,378,725 $10,614,139 Average Loss
Per Offense $389 $405 $414
Non-residential
Unknown Night Day Unknown
1,236 1,856 307 535 1,220 1,951 354 582 1,295 1,942 331 609 1,201 1,762 274 634 1,395 2,076 438 786 1,348 2,195 435 804 1,555 2,059 431 758 1,557 2,125 456 759 1,208 1,988 407 761 1,368 2,115 509 754 1,299 1,813 402 643 1,282 1,976 386 602
15,964 23,858 4,730 8,227 $6,506,147 $7,958,288 $1,554,114 . $3,395,597 .-
$408 $334 $329 $413
'Thls Table contains supplementary burglary information which is not always reported for each burglary listed in Tables 2 and 8 . Therefore, these offense totals will be different from the actual number of reported offenses in those Tables.
49

Burglary Crime Rates, Ohio and United States: 1966-761
1,600 1,440 1,280 1,120
960 800 640 480 320 160
o
.
~ i~
• .-'i
~ .-,~
- 1M-
.~~ t~ ~ ........
Year 1966 1967 1968 1969 1970 1971 1912 1973 1974 1975 1976 United States 721.0 826.6 932.3 984.1 1,084.9 1,163.5 1,140.8 1,222.5 1,437.7 1,525.9 1,439.3
Ohio 490.7 607.6 659.4 740.1 853.9 932.6 901.3 943.0 1,171.8 1,271.4 1,203.2
Ohio. United States.
Ohio Burglary Offenses and Clearances by Month: 19762
12,000~--~----~--~--~----~--~---~----~--~--~----~--~
10,800~=~::~:::+~I;:~~~~~~~~~~~~~;;~ 9,600 1 --8,4004----4----+---~----~---+----+----r--~----~---+--~r---~ 7,200 -I---_+--+-----I---4----l--_l_--r_--_i_-_+--+---_t__-___f 6,000-l--_+---+-----1--~-----l---_l_---r_--_i_--_+----r_--_t__--·~
4,800-l----+----+-----I----4-----l---_l_---r--_i_-_+---+----_t__--___f 3,600-l----+----+-----I---~----~---_l_----r_--_i_--_+---r_--_t__--___f
2'4001=J;;~~:t~S~~~~~~~e~~~~ 1,200 o h-____________________________________________________ __
Month J F M A M J J A SON 0 Offenses 9,243 9,523 9,546 8,930 10,128 10,341 10,514 10,778 9,878 10,694 10,172 10,055
Clearances 1,637 1,920 2,338 1,907 1,539 1,882 1,650 1,822 1,869 2,016 2.112 2,070
'See Tables 14 and 15 on pages 71 and 73 . 2See Tables 8 and 20 on pages 48 and 85 •
Offenses.
50 bW
Clearances.

Burglary Density by County: 1976
Wlllioms
Mercer
Logon
, >
Champaign
Brown
51
II n CD
D o [J
9,000 - 20,000
4,000 - 9,000
2,000 - 4,000
300 - 2,000
0-300

Burglary Rates1 by Population Group and County Type: 1976
Ohio
Group 1 2058.5
Group 2
Group 3 988.5
Police Group 4
Group 5
Suburban Group 6
.,~ ... _,""...o.=~,,,"-,-","';,_"'"
Rural 1·'-'"-'"';'·~"·~"'''';c;''.'''".;.J
Group 7 Suburban ._..;'"-'"'-._=.;....-""~w,....~,.".;.;..;.._ ..
Rural I~-"'~ ............. '.,.,
Sheriffs Suburban I'_"~''''''''''''''_'':'..;.J.;c,;,.;.;....",,;:..,,,.........,...;._ ... 927.3
Rural I~""";"""~"""'~.:J...=
1Per 100,000 people. See Tabtes22 on page 88.
52
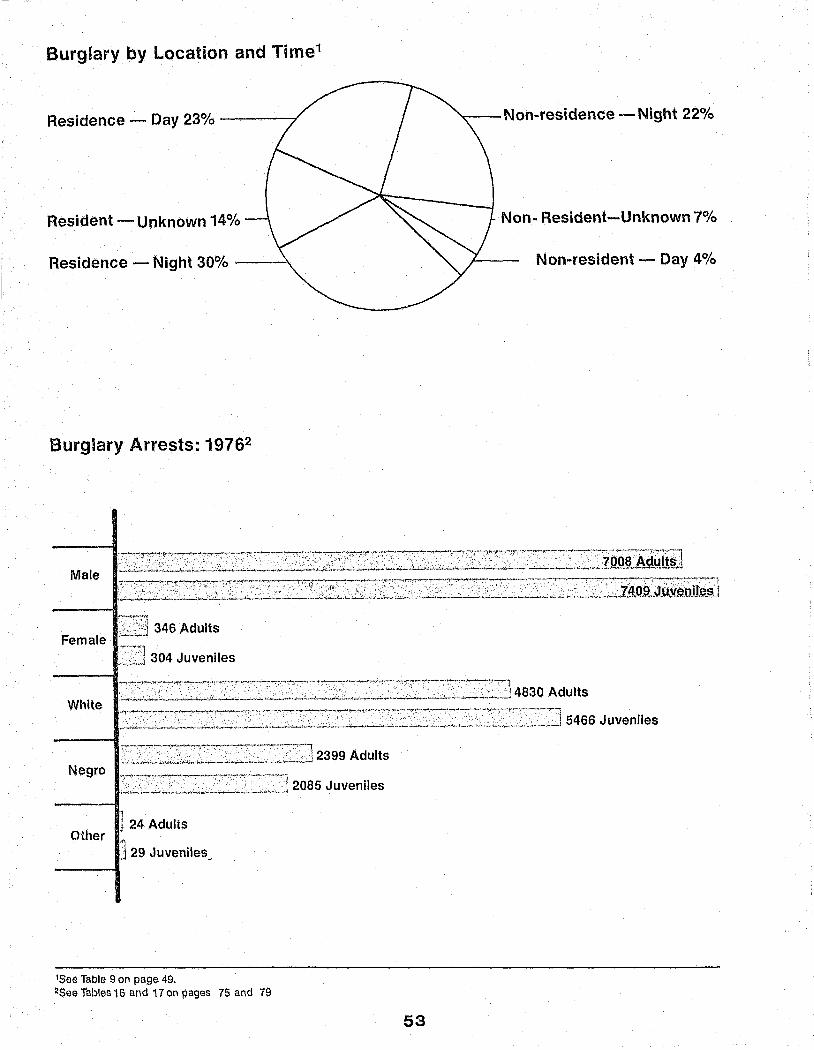
Burglary by Location and Time1
Residence - Day 23% ----.' "<---Non-residence - Night 22%
Resident - Unknown 14% Non- Resident-Unknown 7%
Residence - Night 30% ---\. Non-resident - Day 4%
Burglary Arrests: 19762
Male
346 Adults Female
White
1 j 24 Adults
Other .129 Juveniles J
1See Table 9 on page 49, 2See Tables 16 and 17 on pages 75 and 79
53
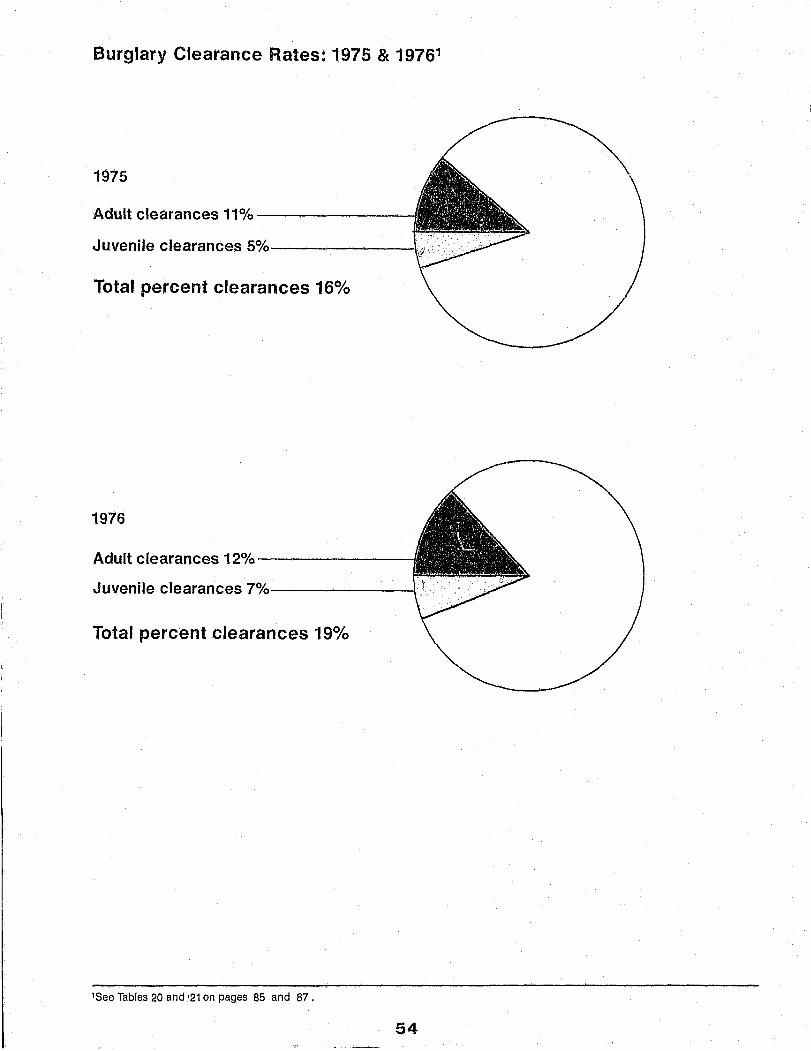
Burglary Clearance Rates: 1975 & 19761
1975
Adult clearances 11%-------
Juvenile clearances 5%--------1..1)
Total percent clearances 16%
1976
Adult clearances 12%-------
Juvenile clearances 7%--------\
Total percent clearances 190/0
lSee Tables 20 and '21 on pages 85 and 87.
54
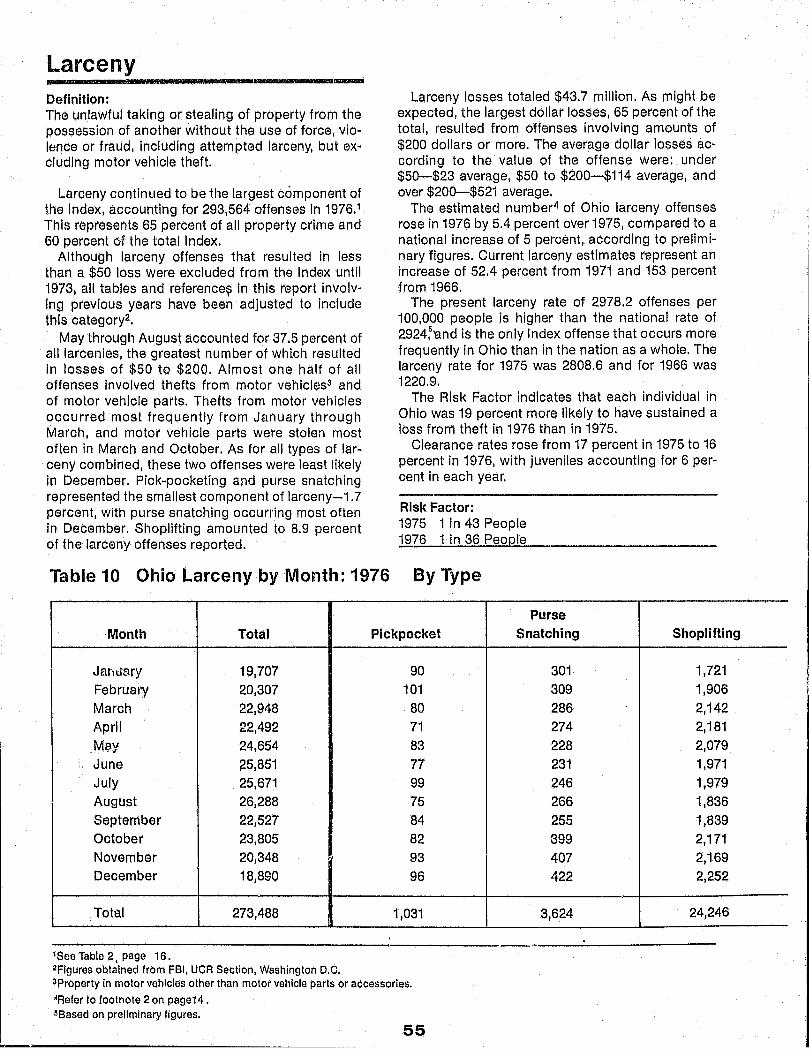
Larceny M ... ___________ • ____ ~--------------a .... Definition: The unlawful taking or stealing of property from the possession of another without the use of force, violance or fraud, Including attempted larceny, but excluding motor vehicle theft.
Larceny continued to be the largest component of the Index, accounting for 293,564 offenses in 1976.1
This represents 65 percent of all property crime and 60 percent of the total Index.
Although larceny offenses that resulted in less than a $50 loss were excluded from the Index until 1973, all tables and reference~ in this report Involving previous years have been adjusted to include this category2.
May through August accounted for 37.5 percent of all larcenies, the greatest number of whi.ch resulted In losses of $50 to $200. Almost one half of all offenses involved t~lefts from motor vehiclE)S3 and of motor vehicle parts, Thefts from motor vehicles occurred most frequently from January through March, and motor vehicle parts were stolEtn most often in March and October. As for all types of larceny combined, these two offenses were least likely in December. Pick-pocketing and purse snatching represented the smallest component of larceny-i. 7 percent, with purse snatching occurl'ing most often in December. Shoplifting amounted to 8.9 percent of the larceny offenses reported,
Larceny losses totaled $43.7 million. As might be expected, the largest dollar losses, 65 percent of the total, resulted from offenses Involving amounts of $200 dollars or more. The average dollar losses according to the value of the offense were: under $50-$23 average, $50 to $200-$114 average, and over $200-$521 average.
The estimated number4 of Ohio larceny offenses rose in 1976 by 5.4 percent over 1975, compared to a national increase of 5 percent, according to preliminary figures. Current larceny estimates represent an increase of 52.4 percent from 1971 and 153 percent from 1966.
The present larceny rate of 2978.2 offenses per 100,000 people is higher than the national rate of 2924;'8.nd is the only Index offense that occurs more frequently in Ohio than in the nation as a whole. The larceny rate for 1975 was 2808.6 and for 1966 was 1220.9.
The Risk Factor indicates that each individual in Ohio was 19 percent more likely to have sustained a loss from theft in 1976 than in 1975.
Clearance rates rose from 17 percent in 1975 to 16 percent in 1976, with juveniles accounting for 6 percent in each year.
Risk Factor: 1975 1 in 43 People 1976 1 in 36 People
Table 10 Ohio Larceny by Month: 1976 By Type
Purse Month Total Pickpocket Snatching Shoplifting
Jar.u$ry 19,707 90 301 1,721
FebrualY 20,307 101 309 1,906
March 22,948 80 286 2,142 April 22,492 71 274 2,181
May 24,654 83 228 2,079 June 125,851 77 231 1,971 July 25,671 99 246 1,979 August 26,288 75 266 1,836 September 22,527 84 255 1,839 October 23,805 82 399 2,171 November 20,348 /' 93 407 2,169 December 18,890 96 422 2,252
Total 273,488 1,031 3,624 24,246
'See Table 2 page 16. 2FIgures obt~ined from FBI, UCR Section, Washington D.C. ~Property in motor vehicles other than motor vehicle parts or accessories.
ARefer to footnote 2 on page14, sBased on preliminary figures.
55

---------------------------------------------~,~. ------\
Table 11
Ohio Lat'ceny by Month: 1976
Number of Offenses by Value of offense1
Month Total $200+ $50-$200 -$50
January 19,703 4,196 7,787 7,720
February 20,307 4,371 7,953 7,983 March 22,948 4,680 9,330 8,938 April 22,492 4,690 9,511 8,291 May 24,654 4,900 10,658 9,096 June 25,851 4,612 11,345 9,894 July 25,671 4,675 11,484 9,512 August 26,285 4,900 11,653 9,732 September 22,526 4,573 9,309 8,644 October 23,805 4,896 9,430 9,479 November 20,347 4,241 7,834 8,272 DeCember 18,890 3,704 6,769 8Ai7
Total 273,479 54,438 113,063 105,978 Total Losses $43,707,154 $28,366,045 $12,922,9.24 $2,431,621 Average Loss
Per Offense $160 $521 $114 $23
From Motor Motor Fr'om Coin'Op Vehicle Vehicle Parts Bicycles Buildings Machines Other
4,413 6,666 382 3,444 353 2,337 4,513 6,868 780 3,497 190 2,143 4,695 7,669 1,515 3,455 198 2,908 3,946 6,753 2,565 3,578 178 2,946 4,082 7,259 3,074 3,818 224 3,807 4,079 6,509 4,567 4,099 254 4,064 4,004 6,210 4,773 3,781 488 4,091 4,122 6,901 4,751 3,985 149 4,203 3,876 6,613 2,669 3,649 143 3,399 4,284 7,365 2,012 3,981 224 3,287 3,628 6,333 975 3,805 171 2,767 3,381 5,066 442 3,813 143 3,275
49,023 80,212 28,505 44,905 2,7.15 39,227
iThis Table contains supplementary larceny information which is not always reported for each larceny offense listed in Table 2: Therefore, these offense totals wlll be different from the actual number of reported oUenses in Table 2.
56 ---""' --------.

Larceny Crime Rates, Ohio and United States: 1966 .. 76'1
-.... \--
.All ~
3,000 2,700 2,400 2,100 1,800 1,500 1,200
~ ~ ....
900 600 300
°
,,,,,.- ----- ~
----- -
Year 1966 1967 19681969 1970 1971 1972 1973 1974 1975 1976 United States 1.442.9 1,575.8 1,746.6 1,930.9 2,079.3 2,145.5 1,993.6 2,071,9 2,489.5 2,804.8 2,924.0
Ohio 1,220.9 1,400.2 1,540.9 1,663.9 1,943.5 1,938.8 1,796.1 1,884.3 2,285.1 2,808.6 2,978.2
Ohio.
Ohio Larceny Onenses and Clearances by Month: 19762
30,000 27,000 24,000 21,000 18,000 15,000 12,000
9,000 6,000 3,000
o
---
----.-.-
~ ifi!- "" .-
... lit.. - ~
United States.
'"" -- ---
•••• ..,~
Month J F M A M J J A SON D Offenses 21,51422,103 24,592 23,895 26,109 27,635 27,782 28,54224,028 25.251 21,833 20,180
Clearances 3,560 4,397 4,856 4,589 4,498 4,571 7,074 3,843 4,353 4.610 4,250 4,392
Offenses. Clearances •
--------------------._---------------------------------------------------ISee Tables 14 3nd 15 on pages 71 and 73. 2See 'rabies 10 and 20 on pages 55 and 85 .
57

Larceny Density by County: 1976
Wllllams
Defiance Henry
Paulding
Wyandot Crawford
Holmes
Marcer Auglaize
Knox Logan Coshocton
Shelby
Darke Champaign
Mla",,1
Ros!t
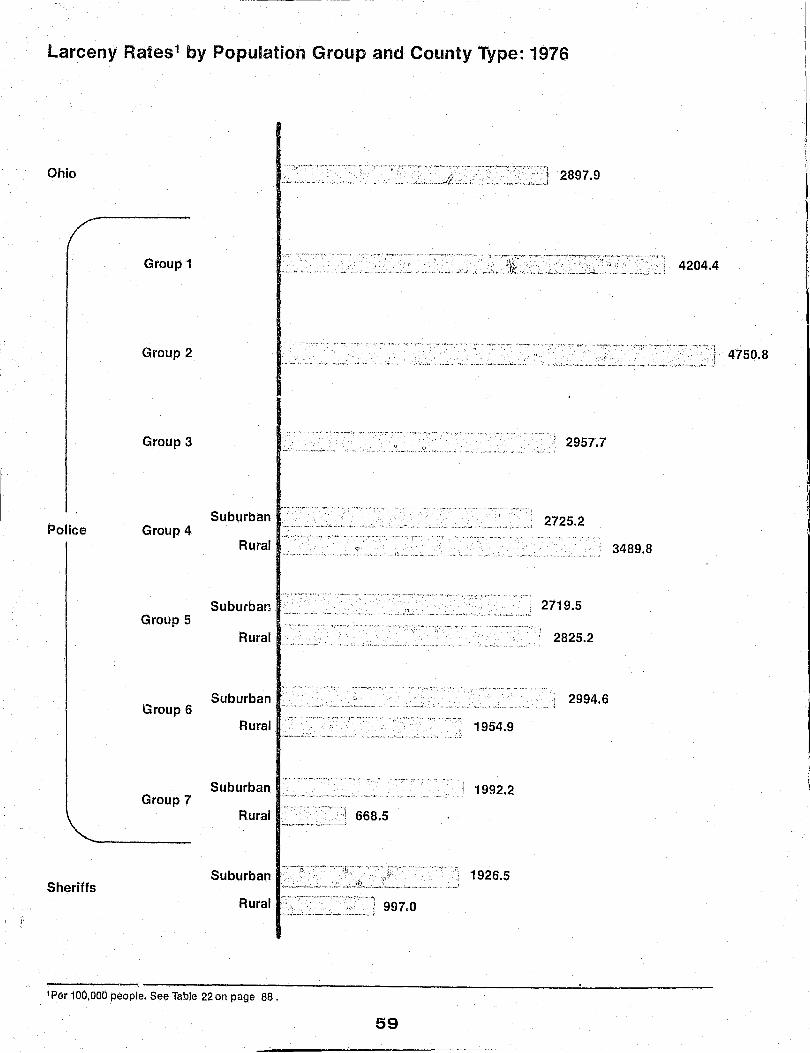
larceny Rates1 by Population Group and County Type: 1976
Ohio
Group 1 4204.4
Group 2 < <. , ,j, 4750.8 , ".:... ....... ,._"' __ " ...... ~.'-_ .. >-•• ~,.~."~,,"". ""e' .. ,_. _., ' •• , • .".._, ' .. ,~,~ •• ~ ____ ,_'" • ..;." ......
Group 3 2957.7
Suburban Police Group 4
2725.2
Rural . c;; 3489.8
Suburban Group 5
Rural --" .-"'~- '---,' -,' ~ .. ". ". '1
'; 2825.2
Suburban " 2994.6 Group 6
•. , .. ~ ~>~'-' ~, .. ~" ~,
Rural 1954.9
j., Suburban 1992.2 r
Group 7 Rural 668.5
SUburban 1926.5 Sheriffs
Rural
--------__ 4~----__________________________________________ ~ ____________ __
1Per 100,000 people. See Table 220n page 88.
59

! t
. -I
il ,
Larceny by Type1
Motor t'ehicle parts and accessories 29.5%
Pick-pocketing 0.5%
Purse snatching 1% From motor vehicles 18%
From coin-op machines 1%j~~;;;;;;;~/lt----l/----From buildings 16.5%
Shoplifting 9%-,-----
Bicycles 10.5%---------.....
Larceny Arrests: 19762
Male
Female
White
Negro
]168 Adults Other
J84 Juveniles
1 See Table 10 on page 55. Rounded to nearest 0.5%. 2See Tables16 and 17 on pages 75 and 79.
-L-__ ~----------Other 14%
Juveniles
Juveniles
60

larceny Clearances: 1975 & 19761
1975
Adult clearances 11%-------
Juvenile clearances 6%--------\
Total percent clearances 170/0
1976
Adult clearances 13%--------
Juvenile clearances 6% --------\
Total percent clearances 19%
lSee Tables 20 and 21 on pages 85 and 87 •
61

~ I ~.
I
I.
t.
~.
I
I .
r
.\
Motor Vehicle Theft :ar
Definition: The unlawful taking of a motor driven vehicle j ex~ cluding motor boats, construction equipment, airplanes and farming equipment.
There were 38,369 motor vehicle thefts in Ohio in 1976, which amounted to 8.5 percent of all property crime and 7.8 percent of the total Index.1 Motor Ve~ hicle thefts were evenly dispersed over the entire twelve month period, however, thefts according to type of vehicle stolen did show some high points. Trucks and buses were stolen most often in October, vehicles such as motorcycles and scooters in June, July, and August, and cars only slightly more often in March and October.
The estimated number of 1976 motor vehicle thefts2 decreased by 13.5 percent from 1975, and 32.4 percent from 1971, but increased by 66.6 percent from 1966.
The rate of motor vehicle theft per 100,000 people was 378.1 in 1976, a significant decline from 426.4 in 1975, but an increase from 235.5 in 1966. Ohio is well below the 1976 national rate of 438.1, based on preliminary figures. Although the rate of motor vehicle theft is generally calculated on the basis of the
Table 12
number of thefts per 100,000 people, the number of thefts per 100,000 vehicles provides additional information. This rate was 517.1 in 1975 and 479.6 in 1976.
The Risl< Factor indicates that there was an a per~ cent lower chance that any vehicle in Ohio would be stolen in 1976 than in 1975; a 12 percent higher chance that it would be a truck or bus; an 8.4 percent lower chance that it would be a car; and virtually the same probability that it would be any other type of vehicle.
Of the vehicles stolen in Ohio, 76.5 percent were recovered. Motor vehicle thefts were cleared by arrest 17 percent of the time in 1976, an increase from 14 percent in 1975. Juveniles cleared 6 percent of the offenses in each year.
Risk Factor: 1975 1 in 193 Vehicles 1976 1 in 208 Vehicles
1975 1 in 179 1 in 556 1 in 145
1976 1 in 194 Cars 1 in 491 Trucks/Buses 1 in 146 Other Vehicles
Ohio Motor Vehicle Theft by Month: 1976 3
Stolen Local- Stolenl Trucks Recovered Stolen Local- Recovered Stolen Out-
Month Total Auto Buses Other Local Recovered Out Total Local Recovered Local
January 3,000 2,782 147 71 1,622 445 2,067 . .'
389 February 3,044 2,739 178 127 1,692 444 2,136 421 March 3,350 2,948 199 203 5,411 503 5,914 452 April 3,248 2,817 181 250 1,803 468 2,271 444 May 3,181 2,716 155 310 1,638 493 2,131 393 June 3,179 2,621 192 366 1,511 472 1,983 415 July 3,327 2,740 207 380 1,671 539 21210 453 August 3,341 2 j 745 229 367 1,559 482 2,041 493 September 3,134 2 j 604 196 334 1,602 540 2,142 436 October 3,519 2,933 276 310 1,690 542 2,232 503 November 3,115 2,749 213 153 1,660 534 2,194
, 473
December 2,931 2,639 190 102 1,549 501 2,050 459
Total 38,369 33,033 2,363 2,973 23,408 5,963 29,371 5,331
1 See Table 2 on page 16. 2Refer to footnote 2 on page 14. 3The StolenlRecovered portion of this table contains supplementary information which is not always reported.
62

Motor Vehicle Theft Crime Rates, Ohio and United States: 1966-761
500 450 400 350 300 250 200 150 100
50 o
~ ~
r;JlIf'"
I~/ ,.,.
." ~ ~ ~.
.............. I!!""" -- ~
"I"""
Year 1966 1967 1968 1969 1970 1971 1972 1973 1974 1975 1976 UnitE~d States 286.9 334.1 393.0 436.2 456.8 459.8 426.1 442.6 462.2 469.4 438.1
Ohio 235.5 325.6 380.2 482.1 492.8 496.4 442.6 376.9 402.4 426.4 378.1
Ohio. United States II
Ohi(l~ Motor Vehicle Theft Offenses and Clearances by Month: 19762
4,0001
3,600 3,200 2,800 2,400 2,000 1,600 1,2001
8001 40U'
o
.- ./ '-to- .....
Month J F M A M J J A SON D Offenses 3,000 3,044 3,350 3,248 3,181 3,179 3,327 3,341 3,134 3,519 3,115 2,931
Clearances 576 501 580 540 466 595 600 515 536 645 569 489
lSee Tables 14 snd 15 on pages 71 and 73. 2See 1rables 12 and 20 on pages 62 and 85 •
Offenses.
63
Ciearances.
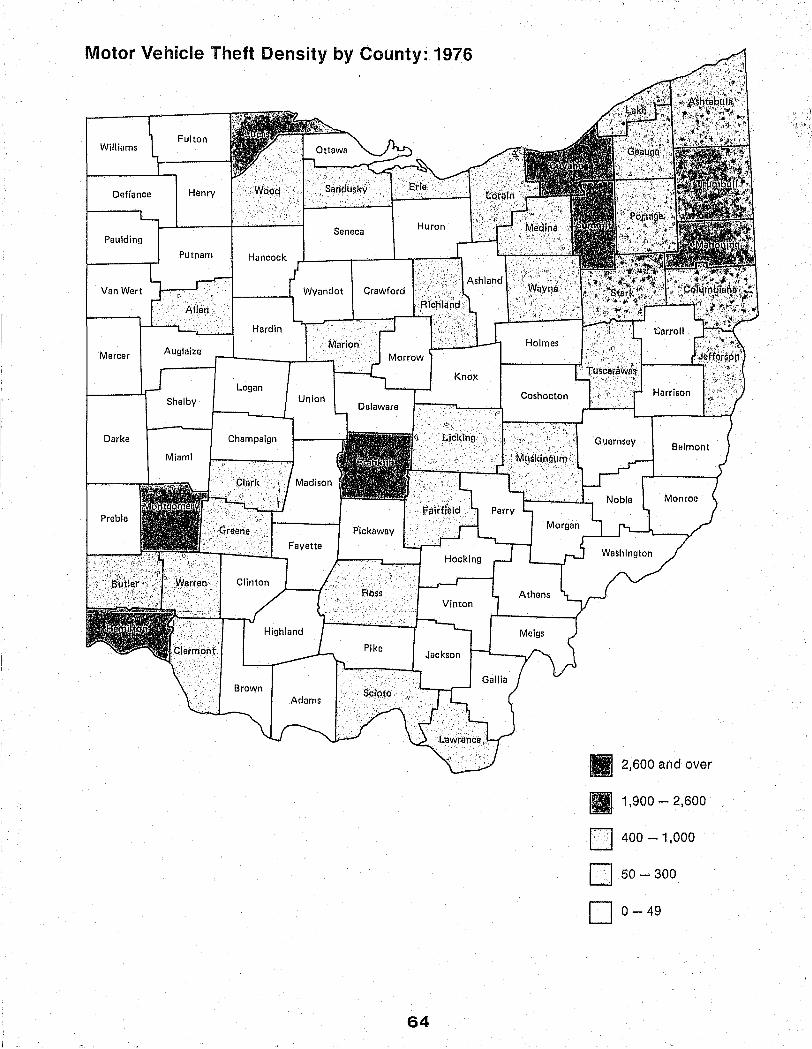
Motor Vehicle Theft Density by County: 1976
Williams
Defiance
Paulding
PUtnam
Mercer Auglaize
Logan Shelby
Darke Champaign
Miami
Preble
II 2,600 and over
1,900 - 2,600
0 400 -1,000
D 50 - 300
D 0-49
64

Motor Vehicle Theft Rates1 by Population Group and County Type: 1976
Ohio 378.8
Group 1
Group 2 600.7
Group 3 284.7
Suburban 290.6 Police Group 4
Suburban 250.5 Group 5
154.6
227.8 Group 6
Group 7 314.1
·1 Rural .. J 21.3
Sheriffs Suburban I·...; _____ -< .. _·c ___ .. 181.6
Rural
'Per 100,000 people. See Table 22 on page 88.
65

--------------------------- --- -
Motor Vehicle Thefts by Type of Vehicle 1
Trucks and buses 2,363
2
Other vehicles 2,973
Percent of Vehicles Recovered'
Stolen and recovered 76.5% /----Not recovered 23.5%
lSee Table 12 on page 62. 2Such as motorcycles, motor scooters, trallbikes, mopeds and snowmobiles.
66

Motor Vehicle Theft Arrests: 19761
Male
Female
White
Negro
Other J 4 Adults
] 4 Juveniles
Motor Vehicle Theft Clearance Rates: 1975 & 19762
1975
Adult clearances 8% ---------
Juvenile clearances 6% ----.-------4
Total percent clearances 14%
1976
Adult clE.,arances 11% ----------
Juvenile ,clearances 6% ---------\
Total percent clearilnces 170/0
lSee Table 16 and 17 on pages 75 and 79. 2See Tables 20 and 21 on pages 85 and 87 ,
67
1,535 Adults
I
j

Value of Property Stolen and Recovered'
Property valued at $169.83 mIllion was stolen in 1976. The property eventually returned to its owners was valued at $58.7 million at the time of recovery1. The greatest dollar value of property was stolen In October and the least in February. Motor vehicles accounted for 45.7 percent of the total, followed by TVs and other types of sound equipment at 13.3 percent. Losses due to livestock thefts were lowest, at 0.2 percent, just below consumables at 0.8 percenL TV set and sound equipment losses were highest in October, livestock in December and consumables in July and September. Livestock losses were lowest in April.
Total losses according to the major Index theft offenses with which they were associated were: Robbery .- $5.5 million, Burglary - $43.4 million, Larceny-$43.7 million, and Motor Vehicle Theft$76.6 million.
Stolen Property: Percent by Type
Motor vehicles 45.7%
Office 1.2%---........
r----Household 1.9%
Consumables 0.8%
Clothing 2.2%-----~~~;;;;;~~~~~~~~~----Livestock 0.2%
Jewelry 4.9%--~ '--'--- Firearms 1.4%
Miscellaneous 20.5% '----Currency 7.9%
~'-----TV, etc.13.3%
lThe value of property recovered Is not discussed in detail In order to avoid the assumption that It represents a clearance rate for stolen property. It does not. Property recovered values Indicate the value of the property at the time It Is recovered whether It is damaged or In Its original condition. From the figures available, there is no way to determine the value of stolen property which has been cleared by recovery.
68

Average Property Loss by Index Offense and Sub-type: 1976
o o ,..
o o C'I
o o M
Robbery by Location Highway1~~=~:= ~=_-=~:J$~51
o o "I"
Commercial store2 i~,==~:' =:.~ :=-:~ :$29~ Service station h~'~ .:---~ .. ~.,--.-- .:--~- "1$41
I"~"':""_' .. ., .~ • .,~ ... .;..~ ' .. -,., .... ~ .1
Chain store l:r~:= :==:: ::~J$ ~50
o o 10
Residence :~==: :~~.~= ==~:: =~':'.~~ ]$4 5
o o to
o o a;l
o o m
o o o ,...
o 000 o 000
~ g~li'l
Ban k I:~~~~~ ~:., ::- ':~= .:=:~~ ~=~~~ ~~ .. ~.= .~~.~:= _:=~~:: .~~~~.' :=~= =~~~:~ If~ r i Miscellaneous 7-"""""'!:"-- ~, --:'. '-"$2 4 _.~"" __ .~_._ , __ .. J -----------------------------------1 Aver,age Loss for All Robbery=~I~.·:~~~:=: ~~=:= =)2 9 ------------------------------~
Burglary by Location and Time Day
Residence
Non-residence
Night
Day
Night
Unknown
Average Loss for All Non-residence Burglary ,·-~===='~:~.~·.~·=J$~51
Average Loss for All Burglary :~.~~=~- ~~=~: ~'_='=,::-~~~~ ~389
Larceny by Type Pick-pocketing ·'·-·~~,l$10 ~
Purse snatching ~~=:~_~ $92
Shoplifting ~] $~ 7
From motor vehicles3 c:=.~ =~= ]$20 ~
Motor vehicle parts and accessories ::=.= =-J$1~O Bicycles [=J~85
From bulldings4 :.~~::==::: ]$2 29
From coin operated machines i:--~ ~~$t: IL----. __ .-l ,..,5
Other == :==~~ '] $2 3
=A=Me=r=a=g=e=t.=o=S=S=fo=r=A='='=L=ar=c=e=n=y===========:li-t~=~J$ 59
Motor Vehicle Theft
IStreets, alleys, etc. 3Except motor vehicle parts and accessories. ~Except service stations. chain stores. and banks. 4Except shoplifting and thefts from coin-operated machines.
69

Section - •• 1M . , •
Tables

t '/ l
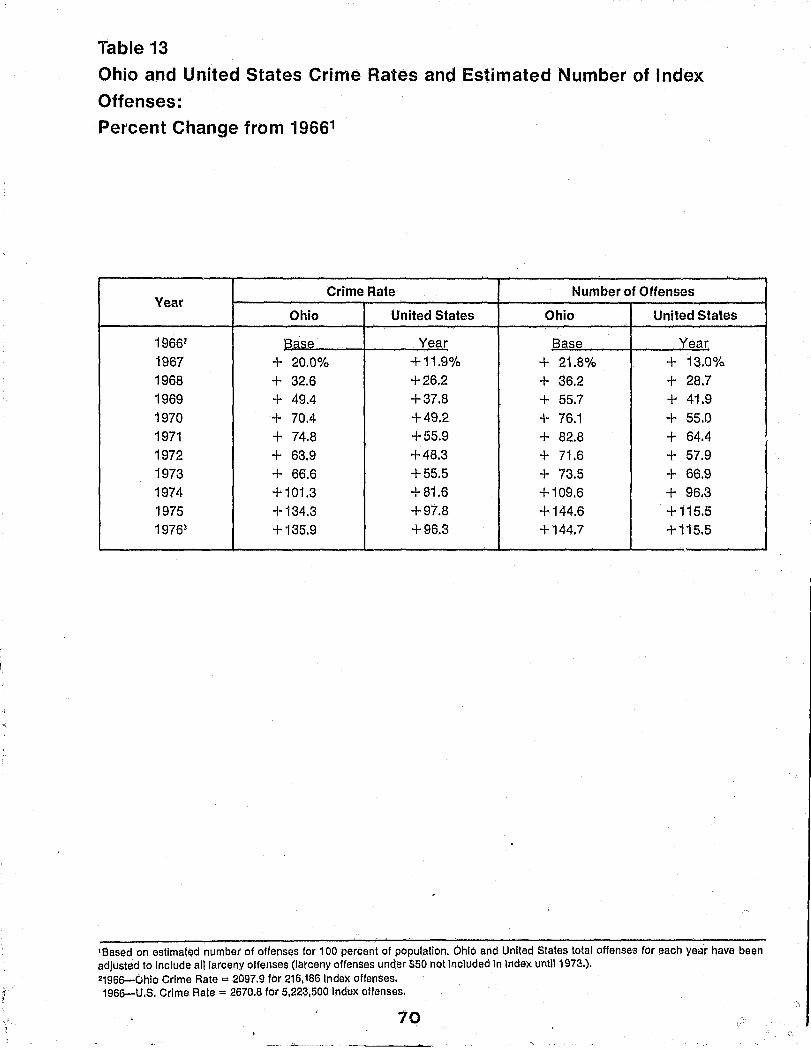
Table 13
Ohio and United States Crime Rates and Estimated Number of Index Offenses: Percent Change from 19661
Crime Rate Number of Offenses Year
Ohio United States Ohio United States
19662 Base Year Base Year 1967 + 20.0% +11.9% + 21.8% + 13.0% 1968 + 32.6 +26.2 + 36.2 + 28.7 1969 + 49.4 +37.8 + 55.7 + 41.9 1970 + 70.4 +49.2 + 76.1 + 55.0 1971 + 74.8 +55.9 + 82.8 + 64.4 1972 + 63.9 +48.3 + 71.6 + 57.9 1973 + 66.6 +55.5 + 73.5 + 66.9 1974 + 101.3 +81.6 + 109.6 + 96.3 1975 +134.3 +97.8 +144.6 +115.5 19763 +135.9 +96.3 +144.7 +115.5
t8ased on estimated number of offenses for 100 percent of population. OhIo and United States total offense's for each yeclr have been adjusted to include all larceny offenses (larceny offenses under $50 not included In Index untll1973.). 219GB-Ohio CrIme Rate"" 2097.9 for 216,186 IndeX offenses. 196B-U.S. Crime Rate := 2670.8 for 5,223,500 Indl:lx offenses.
70 -"-------~-- ---~~

Table 14 United States Estimated Crime Index: 1966-761
Total
Crime Violent Property Year Population Index Crime2 Crime]
1966 195,576,000 Number 5,223,500 430,180 4,793,300 Rate4 2,670.8 220.0 2,450.9
1967 197,457,000 Number )',903,400 499,930 5,403,500
Rate 2,989.7 253.2 2,736'.5 1968 199,399,000 Number 6,720,200 595,010 6,125,200
Rate 3,370.2 298.4 3,071.8 1969 201,385,000 Number 7,410,900 661,870 6,749,000
Rate 3,680.0 328.7 3,351.3 1970 203,325,298 Number 8,098,000 738,820 7,359,200
,,-
Rate 3,984.5 36,3.5 3,621.0 1971 206,212,800 Number 8,588,200 816,500 7,771,700
Rate 4,164.7 396.0 3,768.8 1972 208,230,000 Number 8,248,800 834,900 7,413,900
Rate 3,961.4 401.0 3,560.4 1973 209,851,000 Number 8,718,100 - 875,910 7,842,200
Rate ·~4,154.4 417.4 3,737.0 1974 211,392,000
~
Number 10,253,400 974,720 9,278,700 Rate 4,850.4 461.1 4,389.3
1975 213,124,000 Number 11,256,600 1,026,280 10,230,300 Rate 5,2a1.7 481.5 4,800.2 -19765 214,659,000 Number 11,256,600 974,970 10,332,600 Rate 5,243.9 454.2 4,813.5
lSources for 1~66·1975 Informatlon: Crime In the U.S., 1\~75, Federal Bureau of Investrgation, Washington, D.C. Population of Bureau of Census provisional estimates as of July 1, except 1970 c\"lnsu~. The number of offenses are estimated for 1 00% of the population. 2Violel\t crime is offenses of murder, forcible rape, robbery, and aggravated assault. 3Froperty crime Is offenses of burglary, larceny-theft, and motor vehicle theft. 4Rate por 100,000 population. 51976 figures are based on preliminary estimates.
71
,
I ,

-' Murder Motor
and NonN
negligent Forcible Aggravated Larceny~ Vehicle
Manslaughter Rape Robbery AssauH Burglary Theft Theft
11,040 25,820 157,990 235,330 1,410,100 2,822,000 561,200 5.6 13.2 80.8 120.3 721.0 1,442.9 286.9
12,240 27,620 202,910 257,160 1,632,100 3,111,600 659,800 6.2 14.0 102.8 130.2 826.6 1,575.8 334.1
13,800 31,670 262,840 286,700 1,858,900 3,482,700 783,600 6.9 15.9 131.8 143.8 932.3 1,746.6 393.0
14,760 37,170 298,850 311,090 1,981,900 ' 3,888,600 878,500 7.3 18.5 148.4 154.5 984.1 1,930.9 436.2
16,000 37,990 349,860 334,970 2,205,000 4,225,800 928,400
7.9 18.7 172.1 164.8 1,084.9 2,079.3 456.8
17,780 42,2A0 387,700 368,760 2,399,300 4,424,200 948,200 8.6 20.5 188.0 178.8 1,163.5 2,145.5 459.8
18,670 46,850 376,290 393,090 2,375,500 -4,151,200 887,200
9.0 22.5 180.7 188.8 1,140.8 1,993.6 426.1
19,640 51,400 384,220 420,650 2,565,500 4,347,900 928,800
9.4 24.5 183.1 200.5 1,222.5 2,071.9 442.6
20,710 55,400 442,400 456,210 3,039,200 5,262,500 977,1QO
9.8 26.2 209.3 215.8 1,437.7 2,489.5 462.2
20,510 56,090 464,970 484,710 3,252,100 5,977,700 1,000,500
9.6 26.3 218.2 227.4 1,525.9 2,804.8 469.4
18,460 56,090 418,470 479,860 19,500 6,276,600 940,500
8.6 26.1 194.9 223.5 1,439.3 2,924.0 438.1 _oJ
I 72
-

Table 15
Ohio Estimated Crime Index: 1966-761
Total
Crime Violent Property Year Population Index Crime2 Crime)
1966 10,305,000 Number 216,186 15,536 200,650 liate4 2,097.9 150.8 1,947.1
1967 10,458,000 Number 263,372 19,344 244,028 Rate 2,518.4 185.0 2,333.4
1968 10,591,000 Number 294,529 21,228 273,301 Rate 2,780.9 200.4 2,580.5
1969 10,740,000 Number 336,614 26,648 309,966 Rate 3,134.2 248.1 2,886.1
'. 1970 10,652,017 Number 380,744 30,279 350,465
Rate 3,574.4 284.3 3,290.1 1971 10,778,000 Number 395,142 32,159 362,983
Rate 3,666.2 298.4 3,367.8 1972 10,783,000 Number 370,870 32,286 338,584
Rate 3,439.4 299.4 3,140.0 1973 10,731,000 Number 375,140 31,304 343,836
Rate 3,495.9 291.7 3,204.1 1974 10,737,000 Number 453,471 39,094 414,377
Rate 4,223.4 364.1 3,859.3 1975 10,759,000 NUmber 528,745 43,901 484,884
Rate 4,914.4 408.0 4,506.4 19765 10,690,000 NUmber 528,962 41,553 487,409
Rate 4,948.2 388.7 4,559.5
'Sources for 1966-1975 information: Crime in the U.S., 1975, Federal Bureau of Investigation, Washington, D.C. Population of Bureau of Census provisional ostimates as of July 1, except 1970 ce'lSus. The number of offenses are estimated for 100% of the population.
aVlolent crime is offenses of murder, forcible rape, robbery, and aggravated assault. 3Property crime Is offenses of burglary, larceny-theft, and motor vehicle theft. 4Rate per 100,000 population. $1976 figures are based on preliminary estimate ...
73
j
I
l

Murder
and Non- Motor negligent Forcible Aggravated Larceny. Vehicle
Manslaughter Rape Robbery Assault Burglary Theft Theft
462 963 7,126 6,9as 50,567 125,816 24,267 4.5 9.3 69.2 67.8 490.7 '{,220.9 235.5
545 1,073 9,934 7,792 63,540 146,432 34,056 5.2 10.3 95.0 74.5 607.6 1,400.2 325.6
562 1,309 10,808 8,549 69,839 163,192 40,270-5.3 12.4 102.0 80.7 659.4 1,540.9 380.2
685 1,645 13,604 10,714 79,489 178,701 51,776 6.4 15.3 126.7 99.8 740.1 1,663.9 482.1
699 1,700 15,539 12,341 90,;::';:;3 207,024 52,488 6.6 16.0 145.9 115.9 853.9 1,943.5 492.8
811 1,988 17,642 11,718 100,520 208,962 53,501 7.5 18.4 163.7 108.7 932.6 1,938.8 496.4
811 2,149 17,318 12,008 97,186 193,673 47,725 7.5 ' 19.9 160.6 111.4 901.3 1,796.1 442.6
783 2,299 15,397 12,825 101,190 202,203 40,443 7.3 21.4 143.5 119.5 943.0 1,884.3 376.S
952 2,565 20,529 15,048 125,821 245,354 43,202
8.9 23.9 191.2 140.2 1,171.8 2,285.1 402.4
876 2,721 23,673 16,631 f36,791 302,174 45,879
8.1 25.3 220.0 154.6 1,271.4 2,808.6 426.4
792 2,759 19,645 18,357
I 128,618 3'18,370 40,421
7.4 25.8 183.8 171.7 1,203.2 2,978.2 378.1
14 __ ..c' _______ ~<,,, _________ --=--__ .••

-----------------------
Table 16
Ohio Adult Arrests by Age, Sex and Race: 1976
Age
Offense Sex 25 30 35 18 19 20 21 22 23 24 29 34 39
Murder & Non~
Negligent Male 54 36 30 33 32 27 30 123 74 54 Manslaughter Female 3 3 5 6 3 8 2 22 14 17
Manslaughter by Male 9 13 16 8 2 10 5 18 8 7 Negligence Female 0 1 0 1 1 0 1 0 2 0
Forcible Rape Male 64 78 61 63 72 37 36 211 126 52 Female 5 1 0 3 1 0 0 4 2 1
Robbery Male 456 401 344 313 272 211 217 576 204 111 Female 31 29 17 31 24 14 20 44 24 20
Aggravated Male 202 208 207 222 192 187 180 719 442 263 '. Assault Female 20 29 16 26 31 17 24 93 83 49
Burglary Male 1,390 1,064 858 636 528 415 313 973 358 183 Female 45 41 37 32 22 29 13 57 28 15
Larceny-Theft Male 2,398 1,855 1,511 1,141 957 831 731 2,383 1,158 702 Female 884 881 680 643 557 484 432 1,450 835 552
Motor Vehicle Male 281 212 143 128 101 88 71 260 95 59 Theft Female 14 18 10 6 6 7 8 20 11 4
Other Assaults Male 726 931 918 971 889 1,076 760 3,118 1,802 1,225 Female 105 135 148 131 144 118 106 399 317 208
Arson Male 23 20 21 16 12 8 16 44 23 10 Female 2 3 3 0 2 0 0 4 9 2
Forgery & Male 103 123 138 110 120 111 86 384 181 110 Counterfeiting Female 53 48 69 80 59 63 42 222 87 63
Fraud Male 56 85 120 143 158 142 156 626 435 247 Female 31 63 70 96 85 94 87 423 276 161
Embezzlement Male 3 0 1 1 2 1 2 5 3 4 Female 0 0 0 0 2 2 0 1 1 2
Stolen Property- Male 370 425 337 239 236 164 171 523 249 142 Buy, Sell, Receive Female 34 39 41 42 38 34 29 78 37 34
Vandaltsm Male 437 329 242 206 173 165 119 393 154 119 Female 14 23 20 19 18 14 14 42 27 19
Weapons Violations Male 321 291 257 279 233 196 194 747 445 303 Female 23 25 31 28 26 19 15 64 52 38
Prostitution & Male 31 1--34 33 64 56 49 42 194 76 55 Commercialized Female 333 ~68 398 371 340 275 159 434 64 39 Vice
Sex Offenses- Male 80 100 88 93 90 74 83 313 182 160 I
\
Except Rape & Female 17 7 10 4 9 7 2 23 10 5 Prostitution -Drug Abuse-Totals Male 1,174 1.214 1,016 910 687 536 487 1,393 422 182
Female 148 146 116 110 112 91 69 201 71 46 Salel Manufacturing Male 337 399 375 342 256 190 184 542 183 77
Subtotal Female 52 52 46 38 36 45 24 74 29 23 Opium, Cocaine & Male 24 28 35 43 25 25 25 103 41 20
Derivatives 1--'
Fnmale 9 5 10 7 10 12 Z 29 8 2
75

Race
40 45 50 55 60 65 & White Negro Indian Chinese Japanese Other Total 1
44 49 54 59 64 Over Total
40 23 30 19 10 6 621 301 433 1 0 0 1 736
11 12 6 2 6 ;3 123
8 6 6 6 4 2 128 112 22 0 0 0 0 134
0 1 1 2 0 0 10
46 33 25 9 15 6 934 501 439 4 0 0 3 947
0 0 0 0 0 0 17
65 45 26 10 3 3 3,259 1,40S 2,070
0 3 20 0 6 3,507
4 1 0 1 0 260
218 166 116 90 46 38 3,496 2,217 1,746
5 534 5 0 0 12 3,980
61 35 25 14 6
119 74 48 29 12 8 7,008 4,830 2,399 2 0 1 21 7,253
12 6 5 0 1 3 346
449 514 386 240 176 169 15,601 15,169 8,852 30 9 14 115 24,189
526 367 277 203 130 124 9,025
39 23 19 8 3 5 1,535 913 751 0 0 a 4 1,668
2 5 3 0 0 0 114
905 675 486 238 135 93 14,948 10,494 6,164 10 2 1 310 16,981
195 138 65 25 13 11 2,258
11 9 5 5 2 2 227 185 68 1 0 0 0 254
5 2 1 0 0 0 33
65 57 34 12 7 6 1,647 1,531 899 0 00 0 2,434 4 29 11 7 1 1 2 837 ,.
422 140 19 368 174 30 3,321 2,791 1,345 4 0 0 7 4,147 100 46 25 10 1 7 1,575 ,
3 1 2 0 0 (j 28 32 5 0 0 0 g'~ 0 37
0 0 1 0 0 0
100 69 41 23 14 7 3,110 2,085 1,409 2 0 0 3,505 9
12 6 8 3 0 0 435 ~
63 60 27 20 8 5 2,520 2,068 614 3 0 0 2,687 2
12 4 3 5 0 3 237
233 223 151 86 41 67 4,067 2.413 1.885 1 [) A .,.,/1 1 20 ,.''''~V
23 24 I is 2 7 2 397
31 23 24 14 4 14 744 974 2,456 21 0 0 3,453 2
13 12 2 3 1 1 2,713
_90 68- 58 42 37 32 1,590 1,337 325 0 1 0 6 1,669
4 5 2 3 1 4 113
93 81 29 10 10 36 8,280 6,823 2,213 2 2 0 37 9,077
19 5 9 2 4 2 1,151
47 37 15 3 -I 33 3,021 2,550 767 1 0 0 14 3,332
9 2 2 2 3 0 437
19 9 4 3 0 0 404 265 214 1 0 0 -1 48.1
2 1 0 0 0 0 97
'lRace is not always reported for each arrest, therefore, the number of arrests by race may differ from the total number of arrests for an
offense.
76

(Table 16 continued)
Age
Offense SeX 25 30 35 18 19 20 21 22 23 24 29 34 39
-
Marijuana Male 246 283 268 242 177 126 120 321 97 34 Female 35 31 25 22 16 17 10 27 10 10
Synthetrc Narcotics Male 14 31 20 19 11 11 10 42 10 4 Female 3 6 1 4 3 4 2 8 6 2
Dangerous Non- Male 53 57 52 38 43 28 29 76 35 19 -narcotic Drugs Female 5 10 10 5 7 12 10 10 5 9
Possession-Subtotal Male 837 815 641 568 431 346 303 851 239 105 Female 96 94 70 72 76 46 45 127 42 23
Opium, Cocaine Male 14 14 20 26 40 25 31 100 39 18 &. Derivatives Female 6 5 2 8 11 6 12 29 7 6
Marijuana Male 711 665 520 442 321 268 210 560 149 58 Female 81 70 49 53 38 30 19 47 19 9
Synthetic Narcotics Male 31 34 26 21 18 11 18 48 13 2 Female 4 3 1 2 6 3 8 7 7 5
Dangerous Non- Male 81 102 75 79 52 42 44 143 38 27 narcotic Drugs Female 5 16 18 9 21 7 6 44 9 3
,"-"
Gambling - Total Male 48 39 45 38 53 40 58 272 259 235 -Female 2 2 2 4 4 4 3 29 17 17
BOokmaking Male 0 2 2 2 2 2 0 11 15 8 Female 0 0 0 0 0 0 0 0 0 1
Numbers & Lottery Male 8 3 1 1 3 1 3 25 25 22 Female 0 1 1 0 'I 0 1 6 5 4
All Other Gambling Male 40 34 43 35 48 37 55 236 219 205 Female 2 1 1 4 3 4 2 23 12 12
Offenses Against Male 142 138 116 119 95 123 135 570 404 300 Family & Children Female 16 16 17 14 21 12 14 42 31 35
Driving Under Male 1,071 1,254 1,230 1,273 1 ,211 1 ,134 1 ,061 4,308 3,097 2,757 the Influence Female 54 73 69 89 61 62 71 322 282 292
Liquor Laws- Male 452 465 375 272 176 137 123 360 180 127 Regulatory Female 58 82 61 48 31 16 16 73 J5 34
Drunkenness Male 1,629 1,568 1,436 1,435 1,269 1,157 1,012 4,346 3,386 3,232 Female 122 153 158 142 95 120 103 414 386 349
Disorderly Conduct Male 1,511 1,436 1,281 1,214 1,060 8S'1 789 2,655 1,578 1,108 f.-,
154 116 408 315 243 Female 176 170 155 140 146 Vagrancy Male 13 13 13 19 6 4 6 25 15 23
Female 0 4 1 2 1 1 2 0 3 1 All Other Offenses. Male 3,030 3,010 2,763 2,651 2,348 2,081 1,904 6,758 3,599 2,290
Except Traffic Female 311 358 413 396 375 326 274 954 559 406 Suspicion Male 136 140 137 106 98 n< ..,,, n'" 110 79 ", IU ,"tu
Female 11 21 8 9 7 12 12 27 9 12
Totals Male 16,210 15,490 13,738 12,703 11,128 9,986 8,863 32,539 19,065 14,139 Female 2,512 2,639 2,554 2,488 2,215 1,975 1,634 5,850 3,587 2,664
I---18,722 18,129 16,292 15,191 13,343 11,961 10,497 38,389 22,652 16,803
77 ------------------- -- -

Race 40 4E 50 55 60 65 & White Negro Indian Chinese Japanese Other Total 44 49 54 59 64 Over Total
8 15 5 a a 4 1,r146
1 1 1 2 0 0 208 1,718 378 a a 0 11 2.107
4 2 2 a 1 0 181
3 0 a a a a 42 183 36 a 0 0 a 219
16 11 4 a a 29 490
3 0 1 a 3 a 90 384 139 a ° 0 2 525
46 44 14 7 9 3 5,259 '-'-
10 ;: 7 a 1 2 714 4,273 1,446 1 2 a 23 5.745
11 6 3 1 4 a 352
1 a 1 a a 2 96 144 298 0 a 0 0 442
23 18 5 3 3 1 3,957
5 2 1 a a a 423 3.276 911 a 1 0 13 4,201
5 5 1 2 1 1 237
4 ° 1 a a a 51 207 49 a a a 6 262
7 15 5 1 1 1 713 - 646 188 1 1 0 4 840 a 1 4 a 1 a 144
257 265 281 178 121 131 2,321
18 15 12 10 6 1 1413 590 1,869 a a a 3 2,462
8 6 10 6 3 9 8'6
2 a 3 3 2 a 11 57 38 a a ° a 95
40 65 64 46 31 39 377
6 5 4 2 3 1 40 32 383 a a a 2 417
209 194 207 126 87 83 1,858
10 10 5 5 1 0 95 501 1,448 0 a a 1 1,950
185 99 59 31 15 4 2.535
36 18 6 3 2 2 285 1.981 791 0 20 a 2 2.794
2578 2632 2129 1466 743 596 28,540
238 228 164 73 44 23 2,145 24.131 3,464 7 a 1 126 27,729
152 169 10', 63 59 45 3,262
32 24 26 16 4 6 562 2,820 824 3 a a 15 3.662
3609 4037 3786 2681 1726 1431 37.740
387 343 236 125 57 48 3,238 30.220 9,699 61 4 3 206 40,193
862 795 627 391 224 221 16.643
153 163 107 44 27 27 2.544 15.145 3,511 10 2 a 43 18,711
18 21 11 9 5 5 206
a a 0 0 1 (l '"""""16 161 47 0 a 0 0 208
1928 1689 1107 623 387 328 36,496
347 214 145 68 53 43 5,242 26.250 14,386 20 10 2 97 40.765
47 42 37 ;2 ij :> i,3(5 I ~ ~ - .~~
689 824 1 0 0 4 1.518 8 9 8 2 a 0 155
12,582 12,321 9,831 6,455 3,848 3,284 202,182
2,247 1,694 1,162 617 365 317 34,520
14,829 14,015 10,993 '7,072 4.213 3,601 236,702 158.171 69,510 183 79 22 1.055 229,020
, , 78 - -- -~~ ----~ ~-'--- -~--

Table 17 Ohio Juvenile Arrests by Age, Sex and Race: 1976
.. -Offense Sex Age
10 & 11 13 Under 12 14 15 16 17 Total
Murder & Non-negligent Male 0 0 8 3 9 16 36 Manslaughter Female 0 0 0 2 3 1 6
Manslaughter Male 0 0 1 2 5 2 10 by Negligence Female 0 0 0 0 0 2 2
Forcible Rape Male 5 14 45 29 42 46 181 Female 0 1 2 2 1 2 8
Robbery Male 18 47 187 246 336 462 1,296 Female 3 2 22 18 23 24 92
Aggravated Male 24 35 99 108 157 181 604 Assault Female 12 7 23 20 15 15 92
Burglary Male 288 562 1,739 1,634 1,584 1,602 7,409 Female 25 38 77 49 68 47 304
Larceny-Theft Male 593 1,154 2,762 2,183 2,526 2,543 11,761 "·~t
Female 138 430 1,169 843 937 938 4,455 Motor Vehicle Male 16 54 413 489 529 473 1,974
Theft Female 0 7 43 42 47 38 177 Other Assaults Male 90 177 422 433 501 609 2,232
Female 17 51 146 114 113 83 524 . Arson Male 36 33 63 35 48 26 241
Female 3 2 21 7 5 1 39 Forgery & Male 1 3 18 20 45 93 180
Counterfeiting Female 0 3 1~ 19 21 36 93 Fraud Male 4 1 8 14 26 54 107
Female 1 0 6 6 8 19 40 Embezzlement Male 0 0 2 1 0 0 3
Female 0 0 0 0 0 0 0 Stolen Property- Male 26 73 234 238 295 399 1,265
Buy, Sell, Receive Female 7 8 19 20 24 28 106 Vandalism Male 459 638 1,093 612 693 626 4,121
Female 26 41 e2 39 60 30 278 'vVtlapons Male 4 21 81 117 201 246 670
Violations Female 0 0 9 9 10' 16 44 Prostitution & ..
Commercialized Male 0 0 4 3 5 12 24 Vice Female 0 0 8 7 19 38 72
Sex Offenses-Except Rape & Male 16 29 92 64 61 95 357 Prostitution Female 0 2 . 5 6 12 16 41
Drug Abuse-Totals Male 6 41 322 543 897 1,236 3,045 Female 5 12 127 132 175 157 608
Sale/ Manufacturing- Male 1 1(\ 91 177 273 359 911 ., Subtotal Female 1 2 31 36 57 55 182
Opium, Cocaine & Male 0 ° 2 10 10 18 40 Derivatives Female 0 0 2 3 2 6 13
79

Offense Race
1
White Negro Indian Chinese Japanese Other Total Murder & Nonw
negligent 22 12 0 0 0 1 35 Manslaughter ---
Manslaughter 9 3 0 0 0 0 12 by Negligence
Forcible Rape 87 102 0 0 0 0 189
Robbery 577 791 {) 0 0 4 11372
Aggravated 285 169 0 0 0 6 460 (; ,/
Assault 1-----' --Burglary 5,466 2,085 3 1 0 25 7,!i . .aO
Larceny-Theft 11,307 4,760 5 1 a 78 16,151
Motor Vehicle 1,484 609 0 0 0 4 2,097 Theft
Other Assaults 1,798 891 1 1 0 18 2,709
Arson 206 65 0 0 0 0 271
Forgery & 212 53 0 0 0 10 275 Counterfeiting
Fraud 88 59 0 0 0 a ' 147
Embezzlement 2 1 a 0 0 0 3
--Stolen Property- 953 377 0 0 0 5 1,335
Buy, Sell, Receive Vandalism 3,600 630 3 0 0 19 4,252
Weapons 472 222 1 0 a 2 697 Violations
Prostitution & J Commercialized 35 60 0 0 0 0 95 Vice
Sex Offenses-Except Rape & 322 71 0 0 0 0 393 Prostitution
Drug Abuse-Totals 3,144 344 0 0 0 10 3,498
Sale/Manufacturing- 990 70 0 0 0 3 1,063 Subtotal
Opium, Cocaine & 52 1 0 0 0 0 53
Derivatives '--lRace Is not always reported for each arrest. therefore, the number of arrests by race may differ from the total number of arrests for an offense. 80
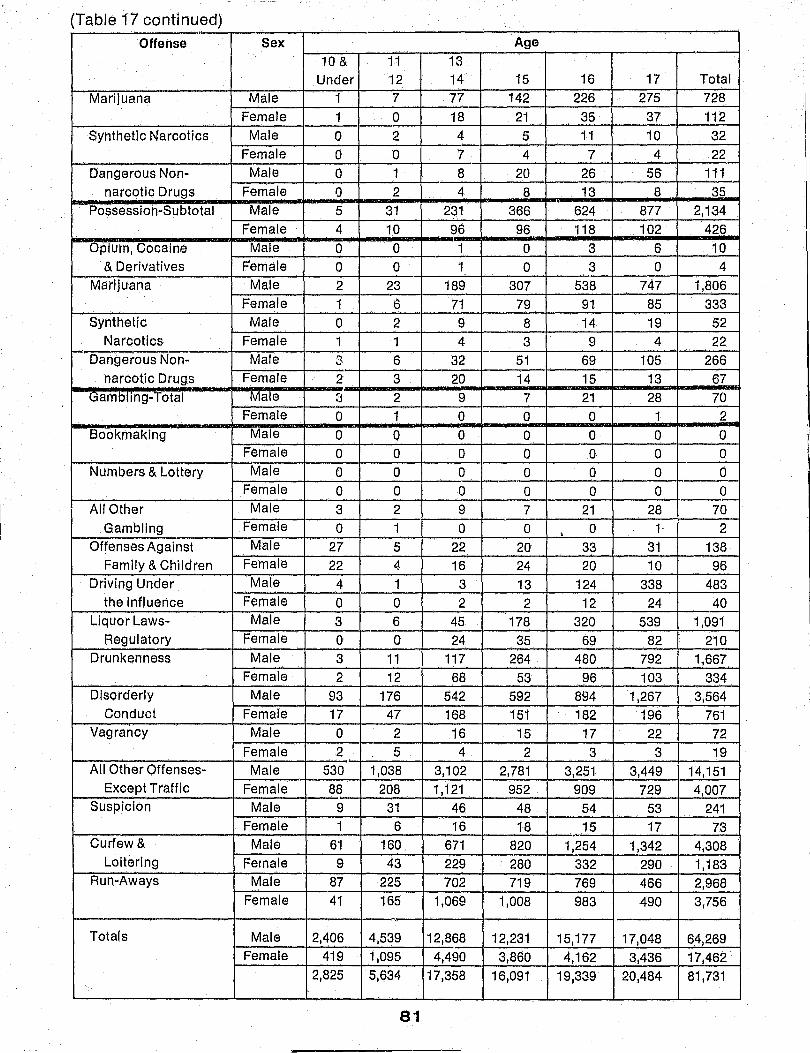
(Table 17 continued) '" Offense Sex Age
10 & 11 13 Under 12 14 15 16 17 Total
Marijuana Male 1 7 77 142 226 275 728 Female 1 0 18 21 35 37 112
Synthetic Narcotics Male 0 2 4 5 11 10 32 Female 0 0 7 4 7 4 22
Dangerous Non- Male 0 1 8 20 26 56 111 narcotic Drugs Female 0 2 4 8 13 8 35
Possession-Subtotal Male 5 31 231 366 624 877 2,134 Female 4 10 96 96 118 102 426
Opium, Cocaine Male 0 0 1 0 3 6 10 & Derivatives Female 0 0 1 0 3 0 4
Marijuana Male 2 23 189 307 538 747 1,806 Female 1 6 71 79 91 85 333
Synthetic Male 0 2 9 8 14 19 52 Narcotics Female 1 1 4 3 9 4 22
Dangerous Non- Male 2- 6 32 51 69 105 266 narcotic Drugs Female 2 3 20 14 15 13 67
Gambllng-Total Male fJ 2 9 7 21 28 70 Female 0 1 0 0 0 1 2
Bookmaking Male 0 0 0 0 0 0 0 Female 0 0 0 0 0 a 0
Numbers & Lottery Male 0 0 0 0 0 0 0 Female 0 0 0 0 0 0 0 .. -
Ali Other Male 3 2 9 7 21 28 70 Gambling Female 0 1 0 0 , 0 1· 2
Offenses Against Male 27 5 22 20 33 31 138 Family & Children Female 22 4 16 24 20 10 96
Driving Under Male 4 1 3 13 124 338 483 the Influence Female 0 0 2 2 12 24 40
Liquor Laws- Male 3 6 45 178 320 539 1,091 Regulatory Female 0 0 24 35 69 82 210
Drunkenness Male 3 11 117 264 480 792 1,667 Female 2 12 68 53 96 103 334
Disorderly Male 93 176 542 592 894 1,267 3,564 Conduct Female 17 47 168 151 182 196 761
Vagrancy Male 0 2 16 15 17 22 72 Female 2 5 4 2 3 3 19
All Other Offenses- Male 530 1,038 3,102 2,781 3,251 3,449 14,151 Except Traffic Female 88 208 1,121 952 909 729 4,007
Suspicion Male 9 31 46 48 54 53 241 Female 1 6 16 18 15 17 73 ,
Curfew & Male 61 160 671 820 1,254 1,342 4,308 Loitering Fernale 9 43 229 280 332 290 1,183
Run-Aways Male 87 225 702 719 769 466 2,968 Female 41 165 1,069 1,008 983 490 3,756
Totals Male 2,406 4,539 12,868 12,231 15,177 17,048 64,269 Female 419 1,095 4,490 3,860 4,162 3,436 17,462
2,825 5,634 17,358 16,091 19,339 20,484 81,731
81

\\
Offense Race
White Negro Indian Chinese Japanese Other Total
Marijuana 762 49 0 0 0 1 812
Synthetic Narcotics 47 7 0 0 0 0 54
Dangerous Non~ 129 13 0 0 0 2 144 narcotic Drugs
Possession~Subtotal 2,154 274 0 0 0 7 2,435
Opium, Cocaine 8 2 0 0 0 0 10 & Derivatives
Marijuana 1,784 246 0 0 0 2 2,032
Synthetic 63 5 0 0 0 0 68 Narcotics
Dangerous Non- 299 21 0 0 0 5 325 narcotic Drugs
Gambling-Total 19 53 0 0 0 0 72
Bookmaking 0 0 0 0 0 0 0
Numbers & Lottery 0 0 0 0 0 0 0
All Other 19 53 0 0 0 0 72 Gambling
Offenses Against 180 43 0 0 0 3 226 Family & Children
Driving Under 458 13 0 0 a 1 472 the Influence
Liquor Laws- 1,128 71 0 0 0 4 1,203 Regulatory
Drunkenness 1,778 122 1 0 0 3 1,904
Disorderly 3,440 791 1 1 0 13 4,241 Conduct
Vagrancy 73 11 . 4 0 0 0 88
All Other Offenses- 13,608 4,298 0 0 1 16 17,923
Except Traffic Suspicion 257 48 0 0 0 0 305
Curfew & 4,456 708 1 2 0 8 j) 5,175 Loitering
Run-Aways . 5,777 743 0 1 0 37 6,558
Totals 61,243 18,205 20 7 1 262- 79,738
82
(,)


i 1 1 f
~ 11 L r I I 1
\
I

Table 18
Summary of Ohio Arrests by Age and Sex: 1976
Age Male Female \o~ ....
Juvenile:
10 & Under 2,406 419 11 & 12 4,539 1,095 13 & 14 12,868 4,490 15 12,231 3,860 16 15,177 4,162 17 17,048 3,436
(Juvenile Sub-Total) (64,269) (17,462) Adult:
18 16,210 2,512 19 15,490 2,639 20 13,738 2,554 21 12,703 2,488 22 ~v, 11,128 2,215 23 I 9,986 1,975 24 8,863 1,634
(20-24 Sub-Total) (56,418) (10,866) 25-29 32,539 5,850 30-34 19,065 3,587 35-39 14,139 2,664 40-44 12,582 2,247 45-49 12,321 1,694 50-54 9,831 ~,162
55-59 6,455 617 60-64 3,848 365 65 & Over 3,284 317
(All Adult SUb-Total) {202,182} (34,520)
Total Adult &
Juvenile by Sex 266,451 51,982
Grand Total
Both Sexes 318,433
83

Table 19
Summ~ry of Ohio Arrests by Age and Race: 19761
Age White
18 and Over 158,171
% of all Arrests 51%
% of Race 72%
Under18 61,243
% of all Arrests 20%
% of Race 2,8%
Total All Ages 219,414
Race as % of all Arrests 71%
'Calculations are rounded to nearest 0.5%. "Less than 0.1%.
Negro
69,510
23% 79%
18,205
6%
21%
87,715
28.5%
Race
Indian Chinese
183 79
* i'
90% 92% 20 7
* *
10% 8%
203 86
* *
84
Japanese Other Total
22 1,055 229,020
* 0.3% 74%
96% 80% N/A 1 262 79,738
* * 26%
4% 20% N/A
23 1,317 308,758
* 0.4% 100%
()
tiM' -~
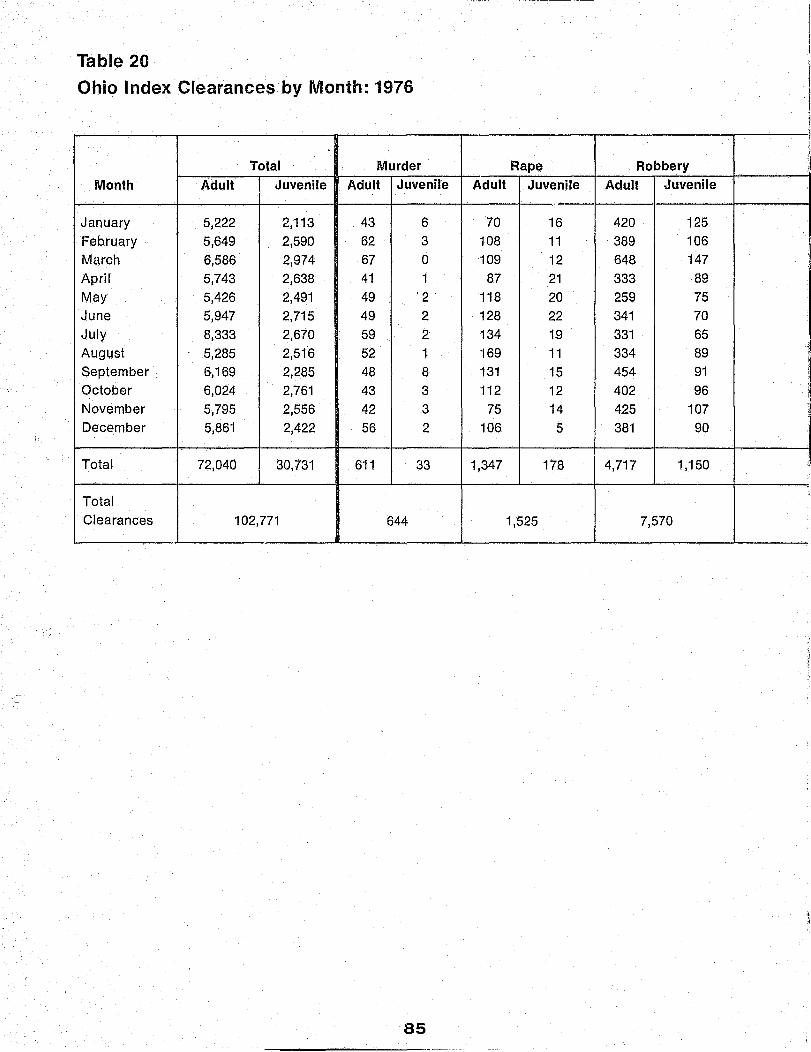
Table 20
Ohio I ndex Clearances by Month: 1976
1
)
Total Murder Rape Robbery II Month Adult Juvenile Adult Juvenile Adult Juvenile Adult Juvenile
January 5,222 2,113 43 6 70 16 420 125 February 5,649 2,590 62 3 108 11 389 106
~ March 6,586 2,974 67 0 109 12 648 147 April 5,743 2,638 41 1 87 21 333 89 May 5,426 2,491 49 '2 118 20 259 75 June 5,947 2,715 49 2 128 22 341 70 July 8,333 2,670 59 2 134 19 331 65 August 5,285 2,516 52 1 169 11 334 89
) September 6,169 2,285 48 8 131 15 454 91 October 6,024 2,761 43 3 112 12 402 96 ~ November 5,795 2,556 42 3 75 14 425 107 II
.~
December 5,861 2,422 56 2 106 5 381 90
Total 72,040 30,731 611 33 1,347 178 4,717 1,150 ,
Total ,
Clearances 102,771 644 1,525 7,570
85

Aggravated Motor Vehicle Assault Burglary Larceny Theft
Adult Juvenile Adult Juvenile Adult Juvenile Adult Juvenile
787 95 1,047 590 2,444 1,116 411 165 650 9::! 1,230 690 2,924 1,473 286 215 708 95 1,595 743 3,089 1,767 370 210 667 106 1,174 733 3,099 1,490 342 198 781 109 943 596 2,968 1,531 S08 158 877 125 1,159 723 2,984 1,587 409 186 952 117 1,043 607 5,419 1,655 395 205 834 131 1,097 725 2,432 1,411 367 148 821 128 1,259 610 3,063 1,290 393 143 726 120 1,270 746 3,003 1,607 468 177 642 112 1,391 721 2,861 1,389 359 210 611 81 1,408 662 2,962 1,430 337 152
9,056 1,311 14,616 8,146 37,248 17,746 4,445 2,167
10,367 22,762 54,994 6,612
86

Table 21 Ohio Index Clearance Rates: 1975 and 1976
1975 1976
Total Adult Juvenile Total Adult Juvenile
Offense Clearance Clearance Clearance Clearance Clearance Clearance
Rate Rate Rate Rate Rate Rate
Murder 78% 74% 4% 84% 80% 4%
Forcible Rape 55% 50% 5% 59% 52% 7%
Robbery 29% 23% 6% 31% 25% 6%
Aggravated Assault 65% 58% 7% 64% 56% 8%
Burglary 16% 11% 5% 19% 12% 7%
Larceny 17% 11% 6% 19% 13% 6% Motor Vehicle
Theft 14% 8% 6% 17% 11% 6%
All Index Offenses 19% 13% 5.8% 21% 15% 6.3%
87

Table 22 Ohio Reported Index Offenses by Agency: 1976
Crime Total Violent Property Department Population Ra~e Index Crime Crime
Police Departments
Group 1 (250,000 and over) Suburban
Akron 267,060 7,946.2 21,221 1,445 19,776 Cincinnati 427,045 7,340.2 31,346 3,461 27,885 Cleveland 642,298 8,273.6 53,141 8,496 44,645 Columbus 595,500 7,763.2 46,230 3,287 42,943 Toledo 383,647 8,642.8 33,158 2,762 30,396
Group 1 Total 2,315,550 7,993.6 185,096 19,451 165,645
Crime Rate 7,993.6 840.0 7,153.6
Group 2 (1 00,000-250,000) Suburban
Canton 107,000 5,997.2 6,417 565 5,852 Dayton 204,966 12,384.5 25,384 2,965 22,419 Youngstown 131,050 6,475.4 8,486 970 7,516
Group 2 Total 443,016 9,093.8 40,287 4,500 35,787
Crime Rate 9,093.8 1,015.8 8,078.0
Group 3 (50,000-100,000)
Suburban Cleveland Hts. 58,397 4,275.9 2,497 239 2,258 Colerain Twp. 63,250 1,307.5 827 35 792 Elyria 60,000 3,460.0 2,076 150 1,926 Euclid 67,976 2,818.6 1,916 69 1,847
Mansfield 54,407 6,703.2 3,647 241 3,106 Parma 97,328 2,829.6 2,754 170 2;584 Springfield 84,334 6,620.1 5,583 276 5,307 Warren 67,600 4,926.0 3,330 181 3,149
Group 3 Total 901,098 4,501.6 40,564 2,440 38,124
Crime Rate 4,501.6 270.8 4,230.8
88

\\
-Forcible Aggravated Motor Vehicle
Murder Rape Robbery Assault Burglary Larceny Theft
22 128 686 609 5,607 12,730 1,439 56 263 1,525 1,617 8,543 17,492 1,850
236 498 5,453 2,309 13,150 18,882 12,613 53 328 1,921 985 121610 27,350 2,983 35 200 1,782 745 7,755 20,901 1,740
--402 1,417 11,367 6,265 47,665 97,355 20,625
17.4 61.2 490.9 270.6 2,058.5 4,204,4 890.1
8 41 311 205 1,461 3,944 447 70 140 2,024 731 7,771 13,090 t,558 34 52 485 399 2,847 4,013 656
112 233 2,820 1,335 12,019 21,047 2,661
25.3 52.6 636.6 301.3 2,726.5 4;150.8 600.7
3 11 87 138 363 t,611 284
0 1 16 18 134 626 32
6 14 89 41 589 1,178 159
3 6 45 15 211 1,343 293
,,, "I', ~" ~ ,0
f .... ~ ... ~~~:..,···,: .. ·~-· '
. " '~6':":""~'" '~-: "'-'1~?"'," ~'Y ';'·':,:~·"11 r'~~' '~7 ;::::- .• 21~~:-:~~':·· ,-~'~';~~r2ff:;-;;;;'- 7";~'~3'~9Ei4-:i:-:'''0 :~;#~4M:::~5~~~':v~~~~ .. :' I )"'
"'. ~.:' , , "':~' -q, < r e: . .. '''S', : ".C. 81:' ,I .
"" " 41 ': :~7 ~ ~/".., 'Ii • 7 ,'l ,,~,'.~;:;' ~i1'~~.,:,~: ':', ,'. ,-',' ~4,., .' ' ;':2;1~21 •. I ' , . " '~:: '~';. ,', ' .. ' t ' "
' , : \' " 37" ~ .. I" ", '; ".q' 3'16 :.'-: ; o 1', . - ,g' , I" , 59' " ~'-1 ,g~6 .t~, : "';'" :~21,6 •.. ':. 'I . " , '.:,; r,\, I· >\ " d~ ~ 1\
:3', ,._ - .'" 16. \. " . "84';- -1 ,. ",,~
;':' . ~597.1' '. '. '~11 :~. r ~ ~6a"·'~~r. ~~~, I ~ 6a;-" : -'904 "'" 1 " . • t. '" ~.;..' .. l< ~ , ;: ", "::1 ,a;~{ , l~:~ '" ,,_, \ .• ",., ,," .. ,~ ..
, "11 :,30 .- .. ,,;,- 131-" " ',,,",, , ,1,5'3, "I~ .' \ ,,: 991:" ~ : i~t,.7- ~~ ~\>, a95 ,,:: ~, t ~: ~ ~~ ...... L ~""'~ji~;':"'::' , --:.., __ :~ ... :·:,L,.. ... "''li'._ ...... -.;._ ~ .':..:....l.,.-" __ "_;;:."" _~ ... I~>-...--. ... ," " ~'.$.. • ~ { ~
'-~-~8'-'''~' " .. , ....... - 1'5-- .-- ,,~, "' '"-'''14f~'''~''''' 799 2,427 ~A,,,,~~,li-:rlro -_ .. ,,"-,-"""
2 5 53 110 652 1,637 295
6 23 177 70 962 4,118 227 ,
I 1 12 115 53 1,001 1,985 163
52 164 1,103 1,121 8,907 26,652 '2,565
! I ' I: <-
5.7 18.2 122.4 124.4 98S.S 2,957.7 284.7
89

(Table 22 continued) r---------------~--~------------~--------_r--------~------~---------
Department
Group 4 (25,000-50,000) Suburban
Alliance
Barberton
Beavercreek Twp. Boardman
Brook Park I''CO~' - .. ~.--,.-,.,... • .. ,.,
·,E3runswick . , a " Cl,lyahoga 'i=aUs> ;. c,:
0(31bi:i.;Vp.: . . ,East Cleveland' . "
Eastlak.e . ,
Fairborn
Fairfield
Garfield Hts. Kent
Lancaster ,',"'Mafjre-'Hefgh!s ,,-
, " M?,ssirroh .
I.' ry1~lltor~. , 'Mi&i\1I'rw};>. . . Mictdletown
'" . ,., '" North Olmsted
Norwood
Parma Heights
Perry Twp.
Shaker Heights , '" South Euciucl ":,
< Springfieldfwp~ steubenville," . . . '
I', UnionTWp,(Cler~bnt 00 .. ) IJ;~,'."yp~.~r.Arlin~tqn:' , .._
Wayne Township
Whitehall Xenia
Suburban Subtotal
Crime Rate
Rural
Findlay
Marion
Newark
Sandusky Zanesville
"
Population
27,000 34,000 36,000 36,011 34,065 25,000 .
..
.' "
41,350 " )28,500
"38,425 25,289
-. 36,000 30,000 38,794 28,886 35,908
"'~3',9ag .. -
33,094 ,44,527.
32,359· 49,819
,. 38,931
...
29,356 28,225 30,962 35,725
, . 26,530' 44,036 3(),18~
2~,.1o.7 , .41,322 "26,739
~
25,873 28,500.
1,110,504
38,000 39,000 43,593 32,583 34,000
-. '.
Crime
Rate
640.7 6,170.6 3,125.0 4,376.4 2,037.3 2,400.0 3;603.0 2,091.2 7,708.5 .
;:~,080A . - .-""' ,',
5,058.3 4,633.3 3,144.8 5,168.6 3,648.2
., 3;727J3
4,759;2 ~2A78:4
4,572.5 .. 6,832.1····
. . 3,251.9' , ...
5,494.6 2,143.5 3,313.7 5,052.5
.. . 2, 122:1'~ .
3,60.6.1 7,096•9 2,542.3 2,91~.7
"" ~-~"'. ..~ , ~ -,. .. " ,
5,845.4 6,864.3 5,484.2
4,148.7
1,534.2 6,625.6 4,179.6 8,375.5 3,923.5
90
...
Total Index
173 2,098 1 ,125 1,576
694 ' €lOb
1,706 596
21962' 779
1,821 1 ,390 1,220 1 ,493 1,310
,,1,2'61 '
,1,574· \I
.. 2,0$0 . 802.
3404 c"i.
1;266 1,613
605 1,026 1,805
.'
)"
q'.
.,
l' ~'l
.56:f·· '1,588
.2,1 33 740. ,
1,204 ~. ~ " .. ~ '- > "
1,563 1,776 1,563
46,071
4,148.7
583 2,584 1,822 2,729 1,334
Violent Crime
11 143 54 48 13
,,,
25 276
2'1 ,.
483 '25 -44 82
120 154 141 ,t30 ',"
~81
89 .. ,
.62 . 120
52 138
23 87
154
I 3~ '. 1'77
161' 43 :
.. 40.
.~
:"
~' .-.
... r ~ .•
148 70 37
3,292
296.4
24 81 76
155 75
>
Property Crime
162 1,955 1 ,071 1,528
681 -'5-75'''
1.,431 575 ".
2'147~ '0:',
754 . ..
1,7??" 1,308 1,100 1,339 1,169
~, ,.
1,1:31:: 1,493 1,947
'0 740. .3,284
, 1,214' .
1,475 582 939
1,651 ... ;:528' ~ ..
1,411 ..
1,~66, " ·'pSi'
1164 . ., . ' ," __ 0" _~ .. ~'",._"_,
1,415 1,706 1,526
42,779
3,852.2
559 2,503 1,746 2,574 1,259
..
"
I
J
.. ~ :l~ l ·tl
.p)~."'; ,L.<, .. " ..
.\ .. .\ ·\\· ... i ~ \1.1
',\\,1 ' .
'.1 I
>"/> ,
1
'"'~ ..... ,~-!
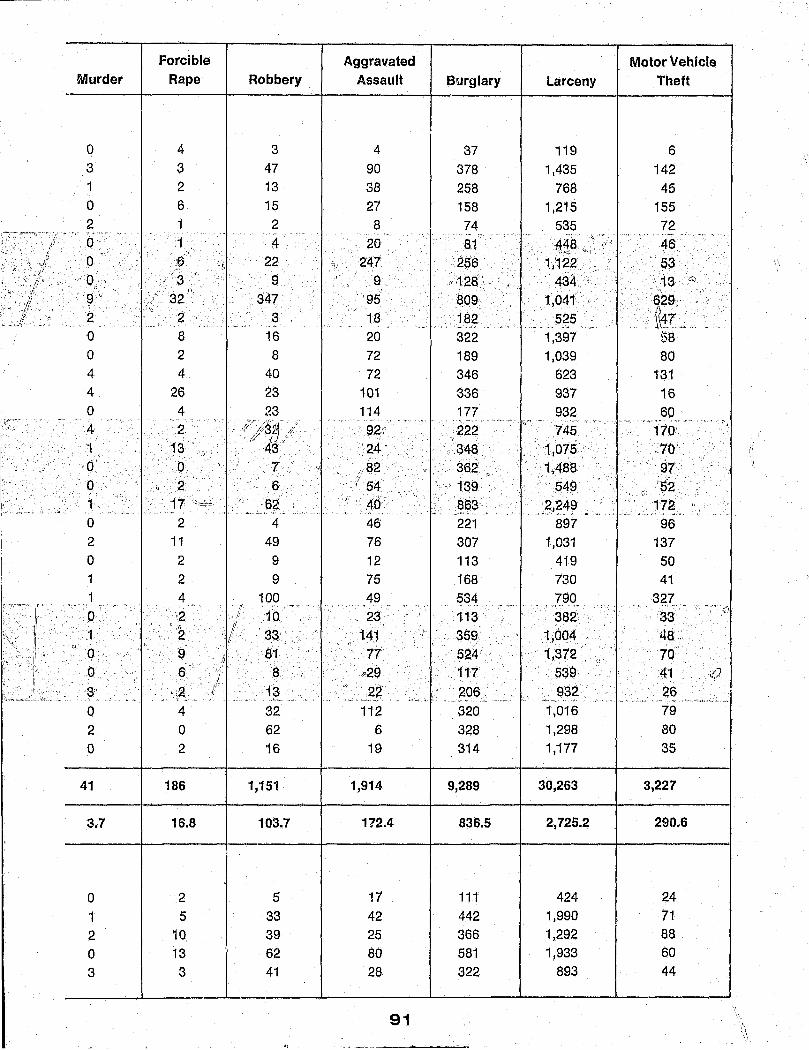
Forcible Aggravated Molor Vehicle Murder Rape Robbery Assault Burglary Larceny Theft
-
0 4 3 4 37 119 6 3 3 47 90 378 1,435 142 1 2 13 38 258 768 45 0 6 15 27 158 1,215 155 2 i 2 8 74 535 72 ,..,- '-~ '''.- .. .- . , "
M~8 <",' '~e •
.. . ,.'- < ,<0 ."~ ~, ".... -,
'0" 1 '. 4, 20 8.1 46. 0
~ pi 22 2'47 '256 . ,.
'1l22 5$ :? . ): " J, ,. 'J"
13 '0. 3 9 " ,9 " ;12$ 434 Q
" ,
',,:
9" 32 347 . '95 809 1,041 p 629· , '"
2 " \\ '. " '{\'17~: '2 3 18 182 $25
'~,,,' . _.+ , .. , " , ~-. ' - ~ _.- ",~ .' "'
0 8 16 20 322 1,397 58 0 2 8 72 189 1,039 80 4- 4 40 72 346 623 131 4 26 23 101 336 937 16 0 4 23 114 177 932 60
"
';;df3~ ,i' , , . , " .,.".
" ',.-." ~ .". . ,",,,,,.,,- ",
4, .2 92: 222 745 170 ,. 4~" "
"
'1 ,13 ' ?,4" 348 , , 1,075' .,70 ',' I;
0: '.' 0 ' I· 7 ',' .' Ja2 362, '1,488 97 "
0 2 6 If!' 64 " l:39 649 52 .,
" 40' " [1
1 17 .;~~=-, 6~ 863" ~ ,,?,?4~ 172 0
,., , "
. , " ,. '" ",. ~ >, ."
_ .. , ' " '.'1:' ., , , I"'r. ...... " .. .- ...
0 2 4 46 221 897 96 2 11 49 76 307 1,031 137 0 2 9 12 113 419 50 1 2 9 75 168 730 41
;' ,
I;'·· ... ··.·· ." " .
1 4 100 ,I 49 534 . ,.", 790 327 .~, .... -- ~, '~ , .. , - , , ,. " •• <~. , "":." '. , .. , ..
c\ 0 ,2
,Il 10" 23 113 362 33 ,1
; '2 141 1,004 48, 33' 359, I . v· " 0
0 9 81 77 524' 1,372 '.'., 70 -", f 0
,,0 6 \;< . 8 . ~29 117 539 , 41 ;0 ;' "
3 ,,2 Ii 1~ '" 22' "206, 932. 26 , , ,- , " ., '" ~-" "~ .. - . ., "., ,~, ~~- '.' .,« '~'--' -- . ,. -,,~ ,,-.. ~, .. -, -, ''''''''''''''''''''' ...
0 4 32 112 320 1,016 79 2 0 62 6 328 1,298 80 0 2 16 19 314 1,177 35
41 186 1,151 1,914 9,289 30,263 3,227
3.7 16.8 103.7 172.4 836.5 2,725.2 290.6
0 2 5 17 111 424 24
1 5 33 42 442 1,990 71 2 10 39 25 366 1,292 88 0 13 62 80 581 1,933 60 3 3 41 28 322 893 44
91
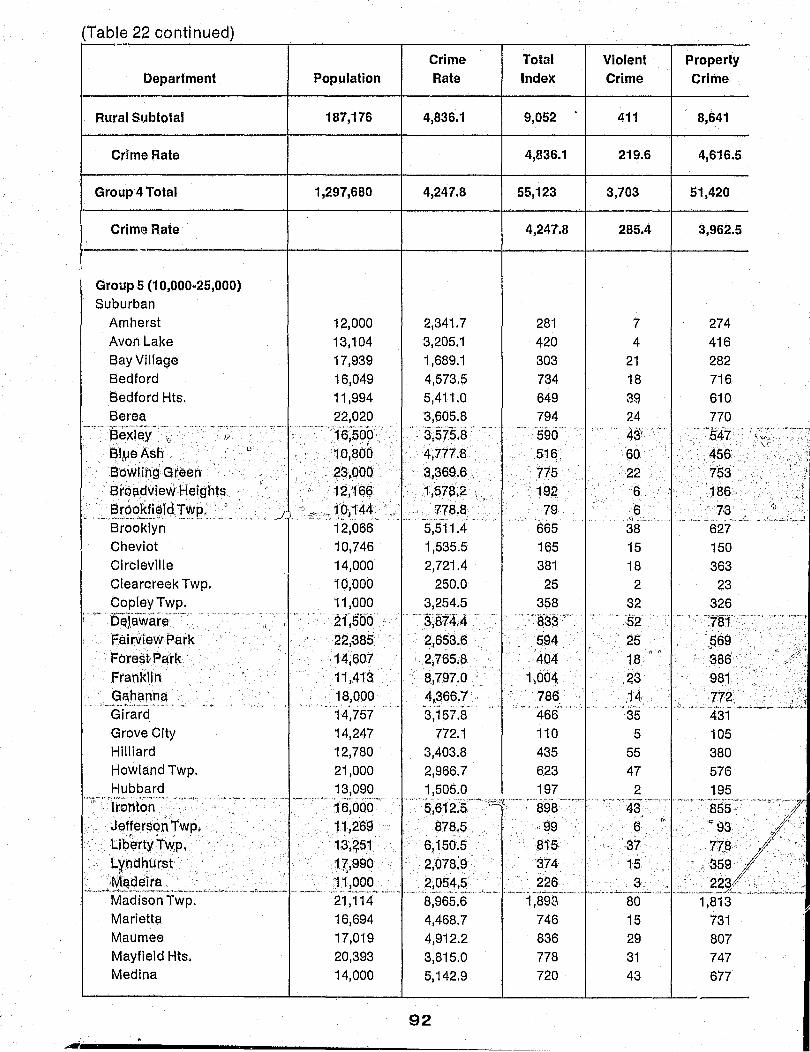
---------------
(Table 22 continued) "----~
Crime Total Violent Property Department Population Rate Index Crime Crime
Rural Subtotal 187,176 4,836.1 9,052 411 8,641
Crime Rate 4,836.1 219.6 4,616.5
Group 4 Total 1,297,680 4,247.8 55,123 3,703 51,420
Crim,~ Rate 4,247.8 285.4 3,962.5
- -I
Group 5 (10,000-25,000) Suburban
Amherst 12,000 2,341.7 281 7 274 Avon Lake 13,104 3,205.1 420 4 416 Bay Village 17,939 1,689.1 303 21 282 Bedford 16,049 4,573.5 734 18 716 Bedford Hts. 11,994 5,411.0 649 39 610 Berea 22,020 3,605.8 794 2:4 770
.. --j3exlei·~, . >'-," .... .. ~ ~ "~._'M_ , ....... ' -~-~ .,
-'T6~50P.· ....
3~g'iS:a --" h"·· -S9(f --43"'-- - .. ,. "'547' p
BlbJeAsn D 10,800 -4,7i7.8 5,16 60 456
Bowlihg Green > 23,000 3,369.6 . ". 715 22 753 Broc,{dview Heights
.. 1.2,16(:3 1,578.2 192 . 6. t. -, 186 ":".,
I?E~p~.fi~l.d~~p; . . ;)
-.. \ .-:> 10,144 778.8 79 6 73 ~: :t":~ , - ... - <, ~ '>T'<,,, _w·~ .. _" ,~ .. '-' Ji. . - .. _. -..LA" ~.-..... -
Brooklyn 12,066 5,511.4 665 38 627 Cheviot 10,746 1,535.5 165 15 150 Circleville 14,000 2,721.4 381 18 363 Clearcreek Twp. 10,000 250.0 25 2 23 CopleyTwp. 11,000 3,254.5 358 32 326
~
D~iawar~-"-'- - '" . , 21' j 500 .- '3;874.4 'e" .. ' 783;3'''- .. -52 ~~ .. -~, -:781 >.">~
\
" . FairviewPark 22,385 2,653.6
"
594 25 . ,$69 Fore$t' .Park 14,607 2,765.8 404 18·
el (j
386 Franklin 11,413 8,797.0 -. 1,004 .23 981 -. . '
Gahanna 18,000 4,366.7 . 786 .14 772 -",,,,>,,",--),.~.~~:.-,,, ~-~ -., .''', '" -- '> .. ." ,. ~.,.;., '<- .... -- .. ~. ,. ~~ .' , "' ... , .. ..... u _ ... .",.-- -<--" -. ""._ .• Girard 14,757 3,157.8 466 35 431 Grove City 14,247 772.1 110 5 105 Hilliard 12,780 3,403.8 435 55 380 Howland Twp. 21,000 2,966.7 6.23 47 576 Hubbard 13,090 1,505.0 197 2 195
·'ii'·~'"lFo·ntc;n<' .~< ... ':C--. .,.,.~ -"",,,,-. -.,-, -...........
'16;OOO'~" ""'-5:612:5-C'''~~,---''''898 ---,,"" .. ,.-... ,-43' ........ <" .. , ''''''''''t", w ~._ .... -_,,_ •• _.,.._~.,
855· Jl:)fferSQnTwp. t1~26S 878,5 ,99 Q
,n"
""93 " Liberty 1'.yp. t3~?51 6;150.5 815 .' 37 i7,f!/
L¥ndhurst , :11:,990 2,078:9 374 . . 15 ' .. '. "~359
'" ;r~adSira. IJ1~g~_." .. ;, 2,054.5 ... , 226 3 , "::~,, .. ... _?_?3L~ _'-" .. _04.....,.,,_, ... ,.,.....,... ~'"........--__ ,"~ .~.,~_ ... " ... <-~ ... ,,'._ ~.~~ .'" ,,~o .. ~"', _,,_ ~- --.~ ... - ...... .. .... --" .. ,,' " "J,,_~ ~_, ~'--":-"-- "'"'~,","'~----~,--' .:.., ..... ,.~ _ .... .:,.,.... ____ .. ~~...,;._1.,_ ... ".
Madison TWp. 21,114 8,965.6 1 ,89~' 80 1,813 Marietta 16,694 4,468.7 746 15 731 Maumee 17,019 4,912.2 836 29 807 Mayfield Hts, 20,393 3,815.0 778 31 747 Medina 14,000 5,142.9 720 43 677
92
~--------------------------------------------

Ie';' -, ,
('. \~ i!-' i~
}: l, .. ,,~ .~ .• ,_,,"_,, ~.~.
Murder
6
3.2
47
3.6
0 a a 1 a 0 0 1 D b 0'("
1 0 0 0 1
"';--'''':;'' -
1 0 0
'1 0
-,.,. ~ -~~, .... '-.. ~ 0 0 0 a
1 o
Forcible
"
Rape
33
17.6
219
16.9
0 2 3 2 a 1 1 0 0
.0 1 _ '''' ..
1 0 0 0 4
• ~ "r
':6
3 3 4' 2 0 1 2 1
o 1
Robbery
180
96.1
1,331
102.6
3 a 3
12 6
12
.34 4 ;G;)
(~1. a o~"' m, ;:.00
1 12
4
3 1 5 5
.10 1
14 1 ".,,,- ... ,,,-,,-.~" .. -.... -... -7 4 4
11
10 15
/1',
Aggravated Assault
192
102.6
2,106
162.3
4 2
15 3
Burglary
1,822
973.4
11,111
856.2
20 81 93 79
Larceny
6,532
3,489.8
30,795
2,835.4
236 324 183 544
Motor Vehicle Thaft
281
153.3
3,514
270.8
33 123 346
18 11
6
93 141
11 163 496 111 , . .... s·· " ~-:- ·· .. ···S9···' ''',e "'436"''''';; '-"-'-'~r1 iF"":"'" .:\~
.55 ~ 95. $47. ':':14 '.' ,12 ,,','599 ' " 8Q' 'I -'."
, .~ . ti'-',
.6, . 132 . \ .11. ,"'
, \;:~ .. _?,s .. _____ .. '" ... ~6.. ...... " _ -_J ., .. _~:: .. L": 24 115 399 113 11 57 86 7 15 67 287 9
1 9 13 1 22 90 221 15 4.0 .-., ·'i00666.~:>-(}·~·c"."'· .. i·f----.. ~:·
-;, 12 , '92 Sgg "".",78 "14 ' "93 . .'\)1 "28i, ,.' .'1'2.
4 260 ".$76. ." ;,,: "45',. ,. 5, '. . 158. . ;,< . 5'98' i··... .' '16 .' '
.. ~_-> .... '".~'."".,~ ... :.. ,.M _, _,_, _." .,.,~ :_~':,,.:, ,,~ .. -.< ,. __ ,.< •• * ~,.,~.~., ~_" ,h_~';;"'''_'''- ",:.~.,T~", , .... ~_~""'_ ....... _ .,",,",~;'; ........ _.,H.,_",_"""~< __ '
28 o
49 35
20 27
93
74 21 83
176
99 139
323 79
287 377
555 513
34 5
10 23
93 25

(Table 22 continued) Crime Total Violent Property
Department Population Rate Index Crime Crime
Mentor-on-the-Lake 10,000 2,510.0 251 4 247 Miamisburg 14,083 13,931.7 .1,962 76 1,886 Middleburg Hts. 11,354 8,384.7 952 30 922 Niles 24,354 2,081.8 507 45 462 North Canton 15,488 1,523.8 230 3 233 '. North College Hill 13,000 3A38.5 447 7 440 North Ridgeville 22,000 2,245.5 494 24 470 North Royalton 11,758 3,631.6 427 20 407
, ...... ' . .,.-.' .-_. .. , " - , 13,567 ",:i "4,429:1:} . 601" ,.,. , ~ "" 26 . -,.
~575 (' Nortpn ),..!",-
~"'i638.1 \
1,13.5 Oregon " ".'I 16,169 !,235 100 Oxford " 22000 637
'. 26
., .' , ~895.5 611
Palnesvill¢' "
15,477 7,087.9 1,097 91 " C'
1',006' " Plttua· ~2,644 - .5,891.2 1,~.34 I 27 f~301
• -<>"' .. ..,. . , .•. ,
12,255 ..
1,370.9 .. __ :-;\'::.:.> .\.'J. .. , ,,~, ~
Ravenna 168 10 158 Reynoldsburg 17,500 5,405.7 946 48 898 Seven Hills 14,599 1,493.3 2"18 12 206 Sharonville 10,601 10,583.9 1,12d 34 1,088 Shawnee TWp. 11,610 1,360.9 158 3 155
I .. ··• ~: .............. .. r . '" ····13,626 ...
'2j 774.1'· , .. - - '" ,"
Solon 378 22 ., '356 Sto~J .'
--'( o·
,~) 19~84t. " 3,970.4; ; ,!J 788 20 768 strongsville 14;3~.4 ~,904.4 0° . 703 30 f;h 673 Sylvania " ·11.,745 3,5~9.0 418. 110 408 0
,~--':=!s,
_ .. ~yrv~nia ~wp. "'" 20',401 :~ ~~Q?:8 ,
14 328 314 < •• , ' . "., ,. '-- ~ .,. '" .. - .. ,
Tallmadge 15,274 5,486.5 838 32 806 Troy 18,973 5,855.7 1,111 65 1,046 Union TWp. (Butler Co.) 13,605 3,204.7 436 5 43'1' University Hts. 15,294 3,465.4 530 39 491 Urbana 12,000 5,425.0 651 33 618 VanWert
... .. .. 11,607'
~." .. ~~ ," .- . "." TO'-: .- ~ -(,) 482.5 56 6 50
, Vandalia ,0 10,215 " " I 4,837.0 497 14 483) '" Jf
Wadsworth. 15,170. 4,858.3' 737 '.'
r? f. 19 718 Warr~nsvllle Hts. 19,466 ,8,820.5 1,717 66 1,651 Westerville 19,709 3,303.1 651 5f) i' 5"92 ,
,~ ... -.~ . .- .... , , .. ... ..,Ir,« .." Westlake 20,926 2,140.9 448 7 441 Wickliffe 23,000 2,060.9 474 9 465 Willoughby 20,200 4,856.4 981 33 948 Willowick 22,337 2,332.5 521 19 502 Worthington 17,422 3,696.5 644 16 628
Suburban Subtotal 1,159,707 3,920.2 45,463 2,037 43,426
Crime Rate 3,9:20.2 175.7 3,744.6
Rural Ashland 20,673 3,197.4 661 37 624 Ashtabula 24,890 5,347.5 1,331 42 1,289
94

I)
I
----~---r--------T_--------,_--------_r--------,_--------~--------~
Murclt:ll'
1 5 o 4 o o a a
. d-
" 0
.> ~,>I, "
1 ' 3 o o a o 1 o o o g o o 6 o o o 1
o 2 o o o o
36
3.1
2
1
Forcible Rape Robbery
O'
o 4 3 1 o o o o
'~Q" a >."
1 2 0
o 2 5 a 2 1 {)
1
2
18 8
13 1 6 8 5
.. 4
23 10 . .25" 16
•. ~"_ ~".4 •.
2 16
2 22
1 1"" 7
18' o 4 a '13 4 10 3 18 1 1 1 15 1 7 ,0
2 1 8
a 1 a 2 o o
91
7.9
3 4
2
3 50.
1 5
14 3 7
646
55.7
3 12
Aggravated Assault
1 49
19 27
2 1
16 15
Burglary
66 545 89
106 63 90
12Q 103
I.arceny
179 '\,110
707 277
160 341 325
Motor Vehicle Theft
2 231
126 79 10 ~
25 277 27 ..
22 ..,
1!;)3 , ... :''""""'33'9"'' , .. ····;':4:f"·'··· .. ·· ..
Jr, 14
1\96 110
61 11
6 27 10
,J" I. • ', .• "~," __ • _"
9
1 21 12
,9 , 6
1
35 133 58
131 42
· .. ·89--' .. 141
181 ,,.77 ,
~" 73 18 .,.., 182
44 3
23 24 4 8
13 27 55
3 4
17 16
9
1,264
109.0
29 25
95
245 84 66
155 -1 a' .... as
102 .. '178
1~5 90 65
257 98
169
8,983
774.6
67 417
,~ ,
C'? 0 .
i881 ' "" 58 482, c, ,,19 720 "" €?2' {I
.<:) ,·16 .. .... "~"" .' ... '. -, .. '''. __ .. , ., . 17
747 18 140 8 912 45 111 2 '246"",~'''' ...... :2·2·:~'·'·":' ~.
609 0',,. .18 '" . 4r~ 75 6
314 17~ . .,."".
589 790 330 370 439
~, "'sf"";,' 372 0
. 566 '". " ..
352 632 367 447
31,538
2,719.5
544 822
16 35 11 17 55 24 1
') 2~ 50
48 59 37 12
2,905
250.5
13 50
-e'
'.
• ,0,

------------------------~--------------------------------, ..
Department Population
Crime Rate
Athens 23,357 2,157.8 Bellefontaine 12,287 2,449.7 Bucyrus 14,166 4,404.9 Cambridge 14,510 4,397.0 Chillicothe ,23,424 7,082.5 Conneaut 16,500 2,563.6 CCshocton 14,987 1,301.1
'~':',D,lJnilfl'de,"::':""'",!';',;z~"'-<" ','c r' .':'.;~:~~,·4;4'9tCl;
•.•.• ,,'.~.';,' .• J.i.,s.:.~f.i.~v,a.( .•. r,:.~ .• ,.~,:',',~.·.,f . :' .... ..?i1~lr!;·:~~~·: !" ••• __ .. __ ,,,.-, __ •. _"~ '._ .. __ ,.__ _.,., .·,.;.."' .. ·.,._:,t.,,;j_ . .l., .... ~''''_·'~_........ "_,_ •• ,~_,,;.~,, .. ",
Galio.n 13,334 4,372.3 Greenville 14,076 3,225.4 Mt. Vernon New Philadelphia Norwalk
" -~"'RerklhS'TvJp' ;':' ~~ . .-- , . '" ' ., ·"s· I' .' . , " " a em-· . . ,
. " ,'J',' . " " ," ..,' ,,' '. J3'i~iiey' ; '. '", '. ,tlffiri' ,,'
, "', V~rmfliQO'" :., ."._ ~'''''''~_-'''''''''>-'''_'''MC,"~~" ~"""'"
Washington C.H. Wilmington Wooster
Rural Subtotal
Crime Rate
Group 5 Total
Crime Rate
Group 6 (2,500-10,OOO)
Belpre
14,612 3,483.4 17,600 3,619.3 14,795 2,872.6 ~i 4)§1~f""" ,., $,3:f7.() ,
. ,,';~J~ci~ '~~!'~:~{~ . .,~ ... ~. ".: . .:.:, ' '" ~ .' ". ,-,
6£0;878:' ", '5j,637,5 "14,gQO.~ .. " ,",3,157J,
13,188 3,450.1 12,000 3,450.0 19,800 5,535.4
453,943 3,945.4
1,613,650 3,927.3
, 9,500 1,673.7
96
Total Violent Property Index Crime Crime
504 12 492 301 6 295 624 57 567 638 13 625
1,659 55 1,604 423 86 337 195 16 179 . ,:~~:~-,c::~t--';"C;7~F; ..
, ,',~1841 ' ,,';1;040',49
-,-' .. , ~,,,,: .. ,.:': ...... ,-.. ,,~'
583 21 562 454 34. 420 509 12 497 637 425
. ,'4'85:'A68': ','
":91S',,:'
. ,·1,1;77.' '442:' 455 414
1,096
17,910
3,945.4
63,373
3,927.3
44
21 42
""34'" ,,12. ;~1
.~, ',n
23 o .
837
184.4
2,874
178.1
','. ,_", .. _~. ""~_. __ c
39 C,\
227 '0
149,
336 159
co." 15 9,'
5 5
616 383
.. ,',45\, '49() aga
'1,1$4 ,·386
426 406
1,040
17,073
3,761.0
60,499
3,749.2
331 154

Forcible Aggravated Motor Vehicle Murder Rape Robbery Assault Burglary Larceny Theft
0 1 6 5 66 397 29 0 0 3 3 98 192 5 1 4 6 46 114 438 15 1 0 10 2 71 524 30 0 1 17 37 285 1,272 47 0 0 3 83 82 232, 23 1 2 3 10 31 138 10
'·,:"'·-"-:':~i99~'.~~::-:"'.; ~ ~',
" 60. , , :>:".\25,4\
.. +~4" 2Q6
1 0 2 18 90 0 3 7 24 123 274 23 1 1 9 1 129 338 30 1 0 5 15 72 523 21
60 313 10
, , ;,~i;~\j ~}i! ,~:",:~,";t~ii~iI 74 339 13
'i 0 0 2 62 319 25 ).;
0 3 6 47 185 819 36
13 29 205 S90 3,546 12,825 702
2.9 6.4 45.2 130.0 781.2 2,825.2 154.6
49 120 851 1,854 12,529 44,363 3,607
3.0 7.4 52.7 115.0 776.4 2,749.2 223.5
o o 1 3 11 29 o
27 121 6
97
-'"-------------- ~

(Table 22 continued)
Department
Bluffton
Populati(nt
2,892 8,389 3,007 4,191
Crime Rate
2,662.5 2,479.4
764.9 7,645.9
Brecksville Bridgeport Brookville Canfield '; .. ,~:9~,r{is'~;: "7~;;': '
."".. ~, ."5,~?2" ", .. 2,~1,§-:~. "S,754 ·'6,,2Q6.7
'. :;'QarrbJI.t9Ii';, ·.·.·.·)Oe.tl~~nilll¢<··
• 'J Cha'grin Falls '
,~,~"9b~r~~D;,,~",, ... , Covington Deer Park Dublin Eaton Elmwood Place ,",,< ,r ,'-.r"- ... "" ... ~ ."'~, ":'" ')~.
SngleY'ood . ··Fairfax ,'. ." ."
~~Irlawn Village' ' F~irpdttHarbor .
"J:9lJ ,~~~~n~e,,, GermanTwp. Germantown Glendale Golf Manor Grandview Hts. '1~- ",", •. ,.~ .. ~", '.- ~.'I -
:~" 'Gree·nnills,i2 ;,;);. ,
,"'Hfirrison' ." ., ,": ;HighJ~nd Hk .
,'Hudsoh Village
. ' '. iJn.~~P~h~~Dce Indian Hill Lakemore Lawrence Twp. Lebanon
Le~i~gt~~ Lincolh His" Lockland' Loveland M'acedQhia Village Mariemont. Mason Mayfield Village Milford Mingo Junction Mogadore Montgomery Moraine
,S;iiOO '. :: 2;61,2',9' "":"'9 '8;34· 8928.2
'. t, ._1. "., ' ~~: ':'::' .,' :, ,,, ,~,.' '," • '~ ' •
., :4,45t ·,3;482;4 . , , ~ .. , '.
,: .• '.:, ... :: .... ,:~;'~::~:~~~.:.~>:: '~:~~~:~' 7,900 1,594.9 3,200 4,031.2 6,884 3,500
, ,~: 1,504; \' . ',,2750:',
, ;., ".'," "' .. ' ,,"
.' ;5/816 ~ ,4'000,':;·"· '..-
~, " ' ... ' . : A,2Jlq
7,589 5,050 2,665 5,300
. ~,664 . '6/912' ..
4;2$4: 6,326 3,749. 6,3(30 . 5,453 2,581 7,408 9,500 2,937 5,886 5,600 9,000 6;076 4,~81
5,578 3,893 4,503 5,104 5,000 8,000 4,662
4,067.4 3,285.7
'., .5,836.~ •. i·'$;'~81.8 ~ 1'4,081.8 • '.': .3;775,0' ". ,'.
';i;142:S '" . 2,187.4 4,792.1 2,851.8 1,735.8
. ,4,7g0.7 1,822.9 1,010,8 1,944.4
. 4,561.2
, 5t~45.9 2,402.3 5,889.2 1,970.8 4,715.8
510.7 1'j359~2
5,035:7 3,688.9 4,526.0 .
_~.,95~.7 3,693.1 3,853.1 7,328.4
607.4 3,840.0 4,212.5
17,696.3
98
Total Violent Index Crime
77 4 208 12
23 2 114 4 162 4
,..~ '" .. ....". ... ..,. .. ,:;:: ,1;1" " r ",2$$if;~
""8f ~ (
'Q ~ ,'" " ~.
" 'a1i3.·· .. : 22 1$5 .",'r'
.2.20. ',11' 3S 0
126 3 129 14 280 6 115 6 438 21 ·236 14 819 1.3 151 5
90 3 166 5 242 3
76 5 92 ° 409 12
126 5 43 2
123 2 1/
171 ,3 ,340' 8 131 2 152 9 146 5 448 21
15 2 80 31
"-6J 282 22 332 it; 275 45. 134 2 206 3 150 15 330 12 31 3
192 1 337 8 825 57
Property Crime
73 196
21 110 158
'c·, ...... ··.·."'"~,···~,_ .; .... -:_,.": ~"''',": .. "".,_,
',216 ." " "
. "~'. ~~~.;.';.:.,.L);·,;t~ ;,' :~148'" , ' . ~~''''/I' G).' <: '~1 ,". i: ~ ~ I" "t.
209, , •.. :. "~; , ",,",'., '-' '-"'1'
38 123
I
115 274 109 417
,. 'U
222 806 146
~:
87 161 239
71 92
397 121
41 121 168, . 332 129 143 141 427
13 . "4,9 260 317 230 132 203 135 318
28 191 329 768

Murder
o 2
o o o
Forcible
Rape
1
1 o o o
Q ,",::",20,'" " 'q., ,.,' "
",0 '", ' ,',' ,'3."'" " " . ~ ~ ~
b:,,\, '0 , ' !~ .• ;::. _ ~:.,\O" '~' ''',0
" , .I),
\, (.
'.' , ( ",~ .... ,,- ',", '.
o 0 o 0
o o o d
3 o 1
,&, 0:' "', ': ,,0:, O'Oc
" I-
o ' '0· o '0 o o o o o b o 1
'0
2 o o o 1
o o o o
',"0
0' 1"'" o o o o o o
",' .,'
o o o o 3 1.' '
0. o ", ,0
o o 2 o 2
o '1 ()
2 2 o f" o o o o o 3
, i~
Robbery
1
2 1 1
1 2' 0, '
8 2'
; " '0"
1 1 o o 5 '0 '2
, :
,0 '0
o 1 o 5 o
,,'1'
,12 1
, :: 1
2 o 1
o o 1
1 13
( ,
Aggravated
Assault
2
7 1 3 3
13 o .
·'Jl 5,'\
',,, 11., o 1
11 4
4 ," 12
10' <6,
:4
4 2 5 o 4 4 d
2
6 5
13 2
'( - ~
29,\ 10 t2 42
"'1" 14
12 3 o 7
41
99
Burglary
17 53
3 23
\"', ',,31" ' '._,. ,-.;:,"'>...-". ,,;.: '(;,:. ,
13 25
31 41 13
12-2 to 63 41
, , ,
28,
79
69 14 33 94
,10 , 7 "
25, 38,
24 20 33 40
73 6
"25 <'.?" ,100
64 "65
..
, '~,' ,
_ •• >< ,_ .... _ •• ' .<~ ~ •• ~.~_.N '." . 37 30 38 11 53 53 99
Larceny
55 130
16 84
121 ,f45~:
., \'" ·':;jr.~:· 24 89 80
224 89
ii~r' 209
, Cft? '94 '
55 73
160 50 55
297
108 34
" ,aa 125 240
< .. ,.
108 104 98
340 7
20 '149
,'229,' '
",150,:
117 '-'151"'"
92 253
14 130 259
619
Motor Vehicle
Theft
1 13
2 3
13 !':·~"]r":: :,:
",J'.
1 9 4 9
7
16: $::
"<, ,o,a:, 1, it 4;; 9
10 7 4 6
',; "'-"3:.,": o· ."
. " .. ~
o 8" 5'
68 1 6 3
14 o
"','4" ,"
".,11 , 0
"'24 1'5.
" , 6
9 13 27
3
8 17 50

(Table 22 continued)
Department Population Crime Rate
Total Index
Violent Crime
Property
Crime
Munroe Falls 5,050 3,207.9 162 7 155 New Carlisle 7,200 3,555.6 256 14 242 Newburgh Hts. 3,117 2,149.5 67 5 62 Newton Falls 5,965 3,570.8 213 10 203 North Baltimore 3,800 2,473.7 94 4 90 NorthamjJton Twp. 5,397 8,986.5 485 36 449
Ontario 4,800 6,812.5 327 2 325 Pepper Pike 5,447 2,203.0 120 8 112 Perrysburg 8,000 4,200.0 336 1 335 Port Olinton 7,409 6,438.1 477 21 456 Richfield 3,306 5,626.1 186 6 180
::';':$t:~$rnard>'"",' I. ,,:,A,a:~t, ""~>h4;s,,.. 9', 250 '~"'St:ClaiTsvme'~--'"'-"--'-'~""'~' "-"~-'4;764'-'~-' ---'""-'"'-6ii'o--'''-~ .,,,-,,--_cO~--·"':"~-···'·'--;":3·--·"~c- -" .. :...-;.~-,-~.
Sebring 4,932 3,122.5 154 11 143 Shadyside 5,081 728.2 37 1 36 Sheffield Lake 9,334 1,682.0 157 6 151 Shelby 9,732 2,907.9 283 8 275
~,~~t~~;-~~T:T---7~'F--7:~!::'f:--.-~-·2!r-- ·:~-~r·c-·· :.--2~-.----·~ . Spnh9.Qott;>. .. :, ...• . . 4,010 .,4,588;5 '" '" ·'· .•... 1~4 .'·11 ' .. , ; '173 0
.'.'>
"*~t!n~dal~' ",'~, .... . ... : ,.'l~843' . ,19,456.8',· .... . 1,526 ." .' .... 36 , '. '1,490 I . • '''g;,: '. ',Street$horo.l '. ".,8,28.8'" 5 46~],': 453. .', /37 '. .. . 416 . "'~ ... ~.:.:~,..r.,~ ... _ ........... ...--~~'\' ............ ..,:~ ........ __ )"._..-... .... "~'":~ __ ''_''~'n_~~''' _ ......... :.. ............. -.!... ..... .-.. ..,_ ... "" ..... _ ..... _.' • ..." ,-'_.~,L_...J.......:..._,"'" ....... _.~ ........ ___ ..;....-~., ... , ....... ,,~ .. ~ .. "'_, ... ,.,.,,_ ,...;~ "-•. _~"'-.....-_' ___ , __ ~ ... , __ ~V",}...; ... ~»;,~..:..,.''"''"' ...... ,..,:.~_,..-''''-_ .... _".-.,..._J
TippCity 5,710 3,940.5 225 8 217 Trenton 7,600 2,644.7 201 4 197 Trotwood 6,659 16,428.9 1,094 32 1,062 Twinsburg Village 8,400 2,881.0 242 14 228 Union Village 3,492 2,491.4 87 0 87
-":~'WaHon: •. Hm$-<'·7~:·c"t'~'-"·:' .. ""·"--·.,."~···~·-"2';638'.-:--'''-- ·'''''-4~S4'[9'.--'':''-- ~~120"'--~"~" .~~~~'~§------ '·~f1'2c~~"-.-~--~.~~·
Wapa~on~ta " " ' '. '10'8;254. '7'." .,3,331;7 " 275 '4' '271 . ,; .. it ,:', '. " ,,',' '.. :'.'. ,",,' :" "" "'., CiJ , '
,'W~ti;}tvHle3,6a7 .3;200.4' "'11a 3 '115 .' ,: /)' : ~ ",', :.', ':: ':, -' " " ""'. , . , '" ,
<"iWa4s~o:n, '... ..' . . ~,5,Q'{5," 1,753.18!3 ". . 2 .:Wellington',:.' >, ' '.' .... . 5,500" . .1,381.8."" 76": .. ·" 4., .' '." --~ WITIo'i:lQhby H i Ils'-"-~------''"'-' -,-, ----8;806-·------ ---3:318.2'-"-- --"'--"292---"- -'--1-3~"--~ 1---·--·-'·2 .. ·7·-9 .. ··--· .. "--"~'''-'''''.....l
Windham 3,496 5,120.1 179 14 165 Woodlawn 3,137 1,434.5 45 5 40 Wyoming 8,768 3,387.3 297 6 291 Yellow Springs 4,700 6,787.2 319 13 306
100

Murder
o o o 1 o 1
Forcible Rape
1 4
2 o 1 o
Robbery
1
o 1 1 o o
Aggravated
Assault
5 10
2 8 3
Burglary
32 42
25 41 29
Larceny
120
193 25
142 57
337
Motor Vehicle
Then
3 7
12 20
4
.--~;-~.~~,.~:~~.~-." .. " ~~._~p" v~· 30 15
1; 11 ,4 5
"""'-49r'-'-'~'
I
I: r .... '~~:· I., ..
;\;1 r :,'(/.
I' 0 it
1 """H'."-..*_ ,,,,,,_. ~
,. , ~i
o " ~
e. o
0
0
0 0
t 0 0 0 0 0 0 0
0
Q
a. o o o o
o
o o o 2 o
o o o o
o 1 o o 1 2
o o
1 o o 3 3
4 1
'5
o o o 3
S 25
5
1 8 1
16 3
," _." ,
1i: 5
.11 4 4 o
11 1 3 5
~,-"" -- ~ ._" ~ .. ,' . '" 30, .2
8 10
'32" ." ... ".~".-.,.""" ............ .; .-< -.
'$0
:' '290 . "'19' '. '; .. ,.: .
"_"' .... ,~:,~I~,,,_,,~. 18 296 11 25 78 9 43 285 7 47 396 13 36 130 14
""'''''-:-''58:''':'''''''''''' ""'~'~c'58:r""~"""" "-~""""':taS-"':~'c-:":·",,·",'" 31 32,:"
'23. 48
2 22 5
21
185: 1
115 30
121
0 6 1 9
100 164 11 ... ...''''~' .5~r'-'-' ... , '~". ',' ;f69":"-''''~''''-'''~''-~24~'-'"~~~ '::-":
1.9 .. 3. 2 ''':1, ... ' . .;;), ..
38 'i33:~2 110 '1,:2Qf .8,9,
". "11
91 '" , 309 ' 16 ci _ --" ', __ "" &', .'-~_~" ......... ~ ; ........... ....:~.~.,~,._ •• _~""""' ... ~ _____ ..... _,_ .............. ;,.;. ....... ~ _'·._"....,L".~" ..... ~:..-~-..:.,........"'-'._ ... ,,....,~·N'~,~" ... ~.,.;-
3 5 50 162 5 2 1 38 148 11
19 11 154 844 64 1 13 71 149 8 o 0 23 63 1
0 4
' .. , """0;'" "'" '-"'-"~"T""o"C'" , .... , .. ":' ... ,~ '"22''' ~~-;:' "'-->r7-':76·--·'·c-':~~~7r11~'\c.:c;',-:~·-~ Q '.' . 0 '7.1 :. ,. 1,$8 ' ".12,
0 2 o.f . p 25 ' :t}s " a. 0 o .2 .' ~"1£r E;l3 '6
O: .. "., .. _~."._~,_ ._,, __ ., .. ~,_ ..... ,.. . .. " .... _,~::,± .. ~_.~.~,,; .. "'.~~.'/(~_: .. _~ .. ,_ ... _~:~.~1._,~ .. , ~~~~L4· ·~ .. L .... ;~ I ... - .. ·~-··-·"-·· .. ··-·-O·· .. ·-"·· .. ···--'I 0 3 1 0 58 180 41
o 0 2 12 23 141 1 o 1 1 3 10 28 2 o 0 5 1 55 230 6 o 3 2 8 84 216 6
101
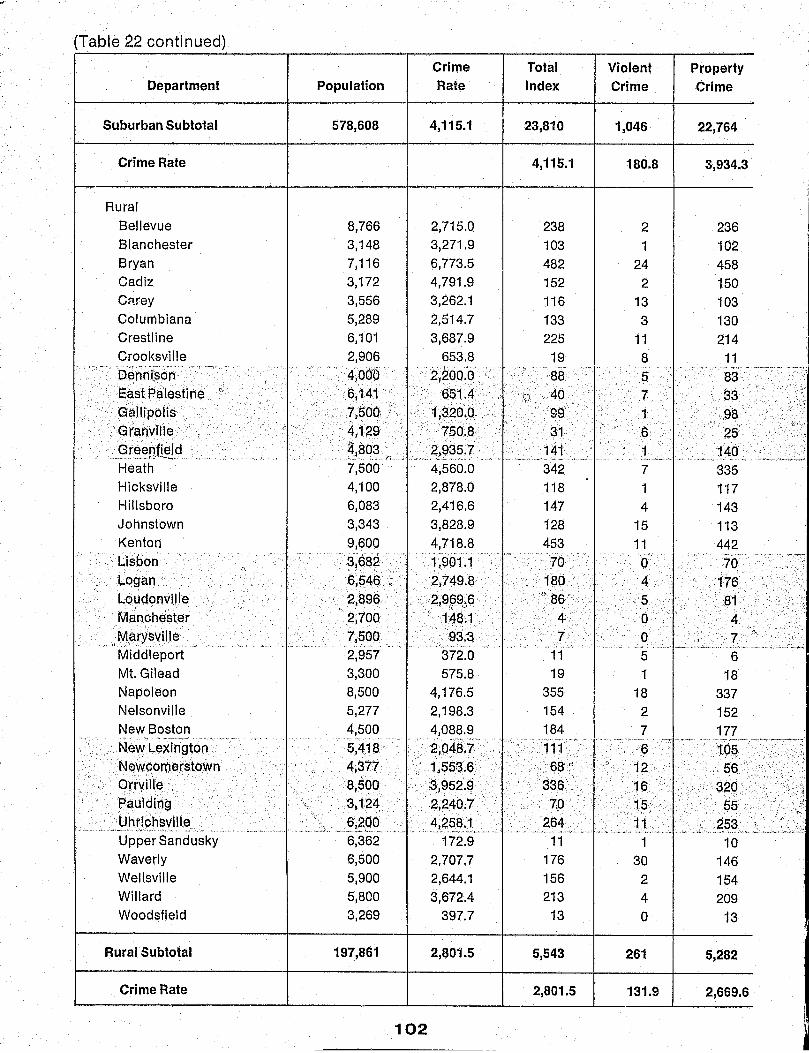
(Table 22 continued)
Crime Total Violent Property Department Population Rate Index Crime Crime
Suburban Subtotal 578,608 4,115.1 23,810 1,046 22,764
Crime Rate 4,115.1 180.8 3,934.3
Rural Bellevue 8,766 2,715.0 238 2 236 Blanchester 3,148 3,271.9 103 1 102 Bryan 7,116 6,773.5 482 24 458 Cadiz 3,172 4,791.9 152 2 150 C~rey 3,556 3,262.1 116 13 103 Columbiana 5,289 2,514.7 133 3 130 Crestline 6,101 3,687.9 225 11 214 Crooksville 2,906 653.8 19 8 11 Denni:sbn ,400'0
,- "",, ~,
"
, ~".' 2/200.0. 88 5 83, East Palestine 0 61141", 651.4 ,', t;i .,40 7 3:3 G.allipt>lis ",7,500, ·1,320~0 99, 1 ,·9/3
"
Grahvllie .,4,129 750.8 31 6 2fj" . Greentield ' a,aO'3 2~935.7 141 1 140 .... ,_. ", ........ ~.!" ........... , . .- ,. -"' ,-,.~ .~, .>,:; _._ v, ~_. fl,_ :., .-' .. ~- .. -~ ~".,' ... ". , ,._, -. ~. "~ ... - ., ... --~"--..;-Heath 7,500 4,560.0 342 7 335 Hicksville 4,100 2,878.0 118 1 117 Hillsboro 6,083 2,416.6 147 4 143 Johnstown 3,343 3,828.9 128 15 113 Kenton 9,600 4,718.8 453 11 442 Lisbon "3,682 1;90{1 ." ., .. . _,,, .- ......... "
, 70 0 70 '.\
Logan 6,54q 2i749~8 180 4 176 Loudonville 2,896 ' 2,999,~6 "86 .5 81 Manchester
. ~') 2,700 148.1 4 0 0 4
'. "Ma~xs~ill~ 7,500 93.3 0 7 ' ,
., , . "- .. , - ,,~ ... '-_ ..... "-- . ~.~ -~-" ~~ ... - -~,",.,
Middleport 2,957 372.0 11 5 6 Mt. Gilead 3,300 575.8 19 1 18 Napoleon 8,500 4,176.5 355 18 337 Nelsonville 5,277 2,198.3 154 2 152 New Boston 4,500 4,088.9 184 7 177 New'L9Xh1gtbn
'-" c~ .~u,.,.~_ .. ,~·'""'-"'-~""'-"""''''''4 5,4,18 2,Q48~7 6 "J05 ..
Newcomerstown 4,377 1,55S.6 ,,68 ,., I)~ 12 56 ~
orrvilfe. 8,500 3,95~.9 ' "'S36' 16 320 ,'P~ulding 3,124 ,2,240.7 70 lq ,,55
Uhrichsville , .. ?!?9° .. ,1! .. ~~~.:!, ." 2,64 11 '" :g§~,, __ ., __ .. :._.i.i ,..l. ....... ", , ... l~;' .. ,"_" .. "-'" - .~ .. ~ ~. '-~"'" , '-,- ... -~"--..... ~.-~ .. --... ,_. ~' .. --'~ ... _,,'OA'_"~~"" - ,,.,.~
Upper Sandusky 6,362 172.9 11 1 10 Waverly 6,500 2,707.7 176 30 146 Wellsville 5,900 2,644.1 156 2 154 Willard 5,800 3,672.4 213 4 209 Woodsfield 3,269 397.7 13 0 13
Rural Subtotal 197,861 2,80i.5 5,543 261 5,282
Crime Rate 2,801.5 131.9 2,669.6
102

'!
Murder
11
1.9
o o o o o o a 1 a ' . 0" 0, ,'"
,0 "'." '--~'-"--~""" ,./,
o o o o a o f ' ' o o o o o 1
o o
1 \ ',1
Forcible Rape
55
9.5
1 o 1 o 1 1
a 2
>'~'}
,J ~. ;f .' 0
1 o 1
2 a
"0'" , 1 o o
,0
o o 2
o a
Robbery
248
42.9 .
1 0 4 1 0 2 1 1 '6'" 0
..
1 4 0'0
3 1 1 2 8 0'" 2'"
1
" 0 0 0 0 1 0
2 ... "---'-"2"'-'"
0
Aggravated Assault
732
126.5
0 1
19 1
12 0
10 4
""Ii:'-'"
..... ; ..... " "
3 0 2
11 3
" . .,,,- .. -~ ... ".',
" 0
0 4 0 0
' .. ' .~ .. ~ -"-' .. ~-~. 5 1
14 2 5
Burglary
4,119
711.9
32 21 41 72 24 11 72
7 "32
10 29'
8
.!.'.~ 29
,. '~ .. " -'
25 22 32 37
116 -,
22 '-
50 "15
4 1
_~ .. _~o '"~''' ,':.,
1 0
70 43
;7:---;~ ~ .
Larceny
17,327
2,994.6
197 75
407 70 68
105 137
4 51" '
,2.1 . 66 13 ..
106 297
93 103
70 309
(" '44 '108
58 0 6 .... " ,,~.~ .. ~. _., . 5
18 255 94
145 >' .-~- -~-.. - .-~ •• ~..-~'" '~~"I"'-~'
Motor Vehicle Theft
1,318
227.8
7 6
10 8
11 14 5 0 0
f 'e'-"".
4 5
13 2
8 6
17 "'4" "
.'18
0 0
12 15 8
... ';.,....-. :'--" ," :'~~'-"-'-'''--'''''''"'''':'~'.'' ,0, 1
l " ,1 '014.. '. ! ,.0, . 0 . . .... ' J" ',t4 ,,24. . ",25... ' ,6
i ~c.."_ ••• ,-•• , .. ,, .. "_,::, .. ,,,;~.~_,.~~~_,2_, ' .•. ~~_~'"~~"''-.~ ... -c ~: __ " ,_: ... ,~ ... ::::~ .. ;. "'~:'''b",:~~.g,,, .... ,:~ .. ~ .• ,,,.:;,L,; ~~" .. ,j~~ ... ,,-~.~:~~ ,1,§..~ .. "J~, .. _ .. " .. _.~,.. .~J~(~L: ..... ~ ..• o 0 1 0 2 8 o 0 0 30 27 109 o 0 106 1 1 36 o 0 1BB 2 2 20 o o 0 0 6 5
8 20 46 187 1,163, 3,868
4.0 10.1 23.3 94.5 587.8 1,954.9
103 .. = r
a 10 12
1
2
251
126.9
• '2 C 2 L

~--------~----------~----------------~,--~------------~
(Table 22 continued)
Department
Group 6 Total'
Crime Rate
Group 7 (Under 2,500)
Cleves Darbydale East Canton Evendale
, Population
776,469
1,973 761
Crime Rate
3,780.3
1,773.9 262.8
1,659 2,471.4 1,898 16,754.5
Lelps[ci···· ",,, , ,. ,.,. ,'-~;170'" ',:': '. ''''2:6i2~8'' , .. '. Mephc\litcsburg
'Mt.$tet/Jng:·· ,
. NewParis
.J\J .. ~~t'<?\f{n Peninsula Plain City Terrace Park Valley View Warrensville Twp.
Suburban Subtotal
Crime Rate
Rural Attica Bainbridge Dbyfe$tQwn-. . ---'.-"-~' ,'- """;':, .",.
o Edgerton' ", .
McComb .'. Roseville . , Hussellviile
_~.e '0 r'_ ~;"""S~~m-a~n-"~~-' ,~-.~.'.~ " ... ,-~ West Union
Rural Subtotal
/' '::1,76(,.; ',.4,034;1 wns ~ . ,' ... , 2,2()5.b ~,400 .,",.., ,583.3
'2.04;7 ' .' . '3,859.3 • ,,, •• _,,~"' __ " _*- . ~,., •• J,", •.• ~"
670 16,716.4 2,254 480.0 2,187 1,920.4 1,305 4,904.2 1,983 4,689.9
36,291
1,233 1,034 '2~315
2;159 11700
'1;8d1' . 524
1,013 2,282
14,061
3,212.9
1,703.2 193.4
." ~"2,11'6:Ef ". 463.2
2,771$.2·, ,-.572.5 ,
· .. ··"l·S7!t6----350.6
1,180.6
104
Total Index
29,353
3,780.3
35 2
41 318 58
37 . :14 . /: I
:Z~:,: . 112 12 42 64 93
1,166
3,212.9
21 2
49 10
4 50
Violent Crime
1,307
16B.3
2 o
2 0 2 6 2
56
154.3
1 0
'6" 1 d 2
3 1 19 1 8 0
166 12
Property Crime
28,046
3,612.0
34 o
41
110 12 40 58 91
1,110
3,058.6
4,~·
20 2
'43. 9 4:
18 8
154
.. ~ ,-,~.~"'"-

Murder
19
2.5
o
°
Forcible Rape
75
9.7
o
Robbery
294
37.9
Aggravated Assault
919
118.4
o 4
Burglary Larceny
5,282 21,195
680.3 2,729.7
25 28 o 0 7 3
';~~:'h,:: " ,": 'f" '''';:,E3."'· ","" 'r,' ':"9 ; .' o.f 'l'~ "k , "
" " ' ,"., '0' ".'~ , ' ' "".":0;, ." . ,6'
Motor Vehicle Theft
1,569
202.1
o o
, ;~" " b:~ (5',.
0' .", ~ "'.',:,<"'.~',,n. "_',!.;~.;.:. ' .... , ' ., .' , '.' ,,0;\, ;) :,~, ... U. ',15: ,')37 , . ", 0, 0 . , ,'0.,' ' , ',.~'. "",i ';.g ::;' , '"
, ,,' '. , , "I ".,. ,~'. "';" ,.;5:,'.;~,',;.,',:.: .• ",·",'~:";',',· ..• ,·,',',,,:,"",','",',.,.':'" """":"0',",,',,.,,.,.,., :,,t"';,..,., • .:'.;,,, .... ! . .;.,;.,, ... ,,.Ji',"~;,,.;:.Ul,.;:..'·· ;,~.('_jc,~.: ' <0" ", ,,~,~~ "'P~'\"" ".- __ .. _ ,~. , _. ___ ..
.!\
o o o
o o
o
o
o o
,,0':
(l
o 0 0 o o o
o o o
1 2
o o 6 3
. '.,.{·.::-:·::Fr"""·. :,~~ .... o " "';0'" ., ",1'
0 0 0 1 0
4
11.0
o o
'.; ,0 "
° 021 • :~,,' ,
1
',". " 1" _, ~..,.. , .. ~... .A",,,,,1.
0 0 0 3 2
13
35.8
o o
,,,,,,.,, ". () .. ,,, ...... "
.- 0. ')
0"
~
" ".5". 2 o 2 2 o
39
107.5
1 o
.. ~6"" 1
'0 0.·
I..;.. ••• ::...c. __ ." •• ,_'-,'",.",'" .,,' •• ,.0 .. '. ,.~ .. "" .. ,,",' .~:'" "".~,gc ~.'''. o • 1 o 0 o 0
o 1
o o
1
o
10
105
3 14 o
11 30 15' 22
'" ,1J' :2
4 18 o
28 258
" ",~" ~ '~,37" 40' :26 ','1/
.1',8' .. ' " ,',' ,~' '. '", "" ..; '" .... c"~>~:44;:~,, 30 69 4
10 10 27
273
752.3
8 1
i7"
57
6 30 35 29
723
1,992.2
94
o 2 o 2
21 0,"':"'$"::': .
,10", ' , ~"."".-."~.",,,,,,,,~ .
11 2 o
13 35
114
314.1
o , ' O· ..
" ,. ~ - ~ ' ... ," .. ' • _>Co"
o o
3

(Table 22 continued)
Crime Total Violent Property Department Population Rate Index Crime Crime
Crime Rate 1,180.6 85.3 1,095.2
Group 7 Total 50,352 2,645.4 1,332 68 1,264
Crime Rate 2,645.4 135.1 2,510.3 ,
Sheriffs Offices Suburban Counties
Allen 44,098 4,961,7 2,188 41 2,147 Auglaize 24,057 1,621.1 390 14 376 Belmont 43,481 1,543.2 671 21 650
Carroll 18,541 1,828.4 339 5 334 Champaign 18,066 354.3 64 0 64 Clark 59,635 3,159.2 1,884 76 1,808
, , '-' . ,; ,. 50 1,084 OJermdrit 70,825 1,605.7 1,134
CUYEl~oga 9,544 104.8 . 10 8 ,2
DelaWare' 28,554 2;118.8 605 ~:i. 21 584 Franklin 43,080 9,856.1 4,246 251 3,995 Fulton 25,376 1,154.6 293 11 282 ..
" . Geauga 39,465 1,930.8 762 61 701 Greene 10,134 2,397.9 243 19 224 Hamilton 90,802 9,104.4 8,267 358 7,909 Jefferson 45,519 467.9 213 57 156 Lake 14,395 2,473.1 356 7 349 Lawrence 37,971· 2,878.5 1,093 65 1,028 LOrain. 41,462 3,186.0 1,321 226 1,095 Luges ," 16,015 8,979.1 . 1,438 81 t,357 Madison' 19,373 3.51.0 68
d/" ,i3 65 . ,
" t~
n1~ . Jv1ahonlng , 93,943 910.1 <,::~5S:' ~31 - , .,
Medina 48,450 3,131.1 1,517 83 1,434 Montgomery 143,473 4,073.2 5,844 466 5,378 Ottawa 25,663 2,560.1 657 45 612 Pickaway 29,157 3,553.2 1,036 103 933 portag.e, 69;055 2,086.7 .. .. 1,441 70 1,371
'. Preble ," 26,089 2,775.1 724 48 676 ' putnam" , 25,170 786.7 198 . 6 192
',' Rlo'hl?nd " 48823' , II
1,l1.98 ' 3,248.5 1,586 8,8 J " " , $tark J} 143,638 3,145.4 4,518 139 4,379
" ()
~~.lJmJ}11t :~ , 71,197 4,372.~, , 3!1~3 .. 358 2,7G5, " .. .'" , ...
Trumbull 66,647 3,790.1 2,526 178 2,348 Van Wert 14,177 1,876.3 266 6 260 Warren 55,051 3,583.9 1,973 62 1,911 Washington 32,432 1,452.3 471 7 464 Wood 53,289 1,749.0 932 102 830
106

~, '. J,
(.
~,
Murder
0
0
0
0 1 2
0 0 1
1 1 3 1 1 1 0 9 0 0 1 6 3 0,
4 2 9 1 0 1
" 2' " . Q'
" 0
2 1
-- ,. 2 0 0 0 2
Forcible Rape
7.1
5
9.9
6 5 1
2 0 6
12-4 4
35 0
" "
2
4 31 2 3
'3 11
9 0
0 7'
" " 6 35 1 4 6 ... , , '''--,·3':
0 , . ,
'8 28 14-
" ' ,
6 1 2 3 7
Aggravated Robbery Assault
7.1 71.1
14 49
27.8 97.3
14 21 2 6 7 11
0 3 0 0
13 56 14'
,-, ¥" , ,
23 2 i' 5 9 ,
147 ,68 1 9 ,. 3 55 1 14
138 180 25 30 2 2
'21 '40. " '" ,'"
45 164 ' ,
20 . , 49 1 2
'34 86 22 53
286 136 2 41 3 96
20 43 11 "32""
, .,
0 : 9 , t 16
" {)4
, '"
70 39 42 301
o " .... ~" -.. ' ~. - ~,~ ". .~ .... "".
68 102 0 5
18 42 0 4
18 75
107
Motor Vehicle Burglary larceny Theft
405.4 668.5 21.3 .'.
330 817 117
655.4 1,622.6 232.4
378 1,694 75 150 213 13 183 448 19 170 149 15
21 43 0 414 1,341 53 S9'5 " ".~'
585 104" , ~.', .' -
0 2, .. 0,' 182
.. 3$9 13 ' ,'1_ r
'1,057 2)644 ' " 294-107 159 16 21i " >~, , ~, •• /<->
432 57 74 132 18
1,802 5,690 417 77 66 13
102 224 23 338' ' 60S~' " 85 .. .,~ .,
\' ~
J99" 499 97 ' 'p12 780 65, ~" 32 0:' " , .;:~
'()
342' 321' 61 rC~
,~ ~ .' .~' ........ -.' - , , --:- '~ ,- , ,-
479 852 103 2,009 3,063 306
197 391 24 328 581 24 434 827 110
"'287 ,~'. .... , ....
$5-~r'"'' .' .. ..
.~'37'''''~-. 1~1 7~ , ,,12
, ..
!.
511 923'· .' t, e4 , ' . 1,311 .' -2.7.59,
, .'
e09 ... , . ; . , '168
.' 1-15 1,87.2 .. , '
" .. ~ ,,- ~ .... ,» J< ,~., ",.j. ~:~. ~ . . . ''''_¥' _.:.i""'_ .... ,.
737 1,421 190 96 157 7
589 1,187 135 163 295 6 262 511 57

(Table 22 continued\
Department
Suburban Subtotal
Crime Rate
Rural Counties
Adams
Ashland Ashtabula
Brown
Clinton '-'Qplumblana ,:oo~hoctpn " , .. ''C)rawford '
, ) ,-',";
o b~rkeo.
. Defiance
Erie
Fayette
Guernsey Hancock
Hardin , -He"nry"
Hlghl~\lid l-IOdl(l T19 HOJmes
··Huron. .. "-knox
Licking Marion Mercer
Monroe -'-Morgan
Morrow , ,<' l'
. Musklngum >. ,:No'ble .: ."
, fl
(\ . Paulding' ~ .. ,-.,," - ',,~ -
Perry
Pike
Ross
Sandusky 'Scioto
-.~~~~ 'S(fn~ba 7-
:, Sh!31by " ,," 'tuscarawa~ :-'" U~I(jO
,," , '.< 'j' ''',
Wntan ,0
< ------.,r--------,-------.----,-------,-----
Population
1,646,447
18,875 20,431 52,961 30,601 16,973
'56,846 19,499 17,399 37,08e 17,900 " 13,926 12,824 24,607 22,628 29,650
. i9,80P~;
,cr
201151 1'5,328 .
21,,7~ 2~,3f~7 _ , 30,:388 53:,761 27,607 24,802 12,631
13:302 20,$40 441145
,,10,937 17,015 18,833
;
"-
Crime
Rate
3,233.8
302.0 1,820.8 1,990.1 1,081.7 2,339.0
686.1 II ~,112.9.
" 931.,1 1,774.3
.,
" 2!~57.0 __ , 1,443.3 3,516.8
268.2 2,227.3 1,517.7 1'l53~5~4 " 1,543A 1,631.5 1.041.3
842:0 1,819.8 1,848.9 3,596.9 2,189.3
673.0 1,593.8 2,423~2
,0 1,676.3
82.3 1,686.1
Total
Index
53,242
3,233.8
57 372
1,054 331 397 'S90' 0412 ' 11(2) 658· 404
.. -201 451 66
504 450
',-304 311 251 226
c 222
,
553 "
994 993 5~3
85 21.2
505 740
9 ~8a'
"
..
., ~'" ... ! . ...,.. ,..,. ,,""'-__ .. ~ .• ~_ .,..' ~.~~~_ "!~" '0-
1,646.1 310
Violent
Crime
3,267
198.4
0 10 46
4 22 21 15 1
27 9') ,
".
9 11
8 17 62
.-.... " ... , .
."
" ,"
7 4
13 ,,2 '9
19 48 34
2
2 16 33
157 l'
14 '~i6"
" ....
Property
Crime
49,975
3,035.3
57 362
1,008 327 375
. .,,, 369' 3(;fl
"
1.61 'Q
~3f ., 0395
."~ ... . ,"
192 440
58 487 388
" . '297"-
1'301"8 .:?-
238 224 ' .213 536 946 959 541
83 202
, 472' , . 58~
13,699 1,511.1 207 8 199 35,449 1,280.7 454 42 412 29,633 2,153.0 638 29 609 45,334 3,747.7 1,699 19 1,680
.,
.. i
~ .... " 2fgS89 .... ".- :·'1:3t5.~-.·"" -;-"" " 352 .., '-'--'60 .... -.. ;- ... ~' .. 292"" ,----..... ~" -'-;:-;.~ P " g6;qoo ':, 2,030.0 .406 v 12 392:!l ' .. ,
': '" <341,#4 ,,':, ,;1.,,1!:1;2;6.. 397 .at- 316, {' . . ·20,8?7 •. 1,666,~, 348' (/ .31 317· '.. \
10,149 .>'1,359.7:.·.. . 138, ,,;)1.. ,1g7 q", .c- ...... _ .~. ~.=_ ~_.(: ,~,"'.-, __ . ____ ........ -"---~ _____ ~.......... __ .,..,_-,.. A_ <,_. __ ., _ ._".£\/._ .,_. ,"_rl,jO, _"",... • .:.-.---.-.:;.. ... ~- __ ~ _,"_,.,","~':"'.~~_ ~ ...... !~_ .. ",,, ...... "_'.~ ~ .•• -;._~<..._~ ... '<-,~ __ .;.~..,,:..._ . .,~._.,
108
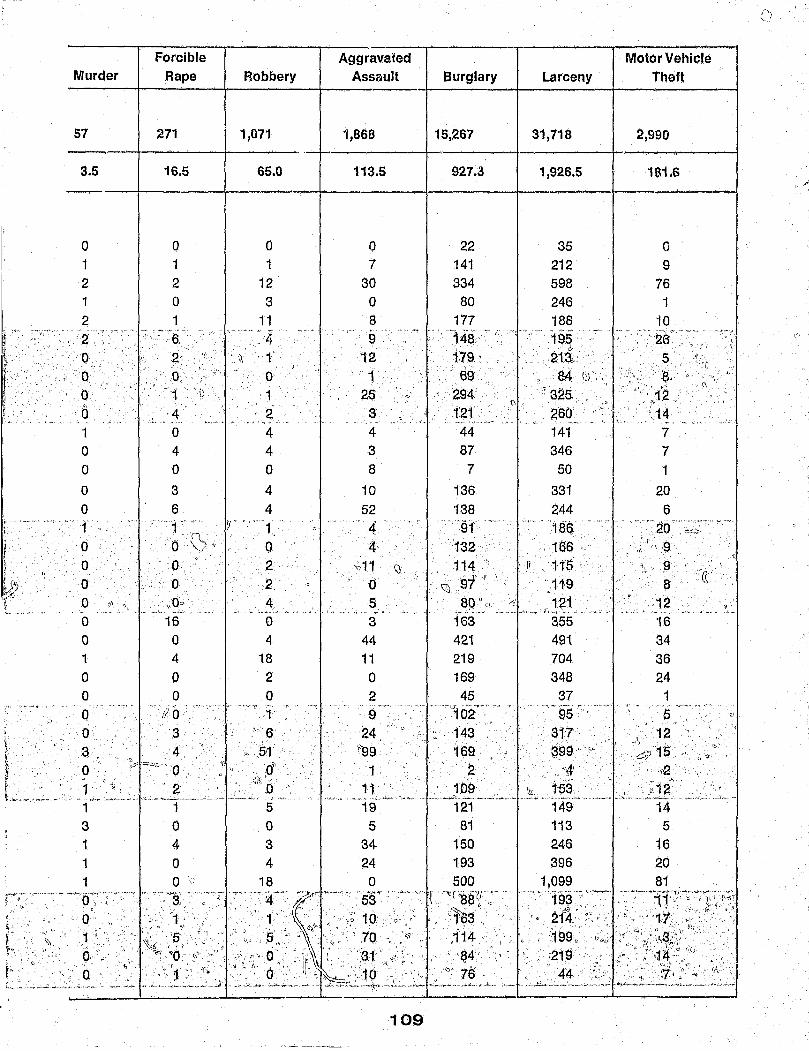
1 i~' . 1,
f
r ,,' (,'
I ! r .', ',.-' .-
> ,
I , t '
'd>. 'L,
~
.",
Murder
57
3.5
0
1 2 1 2 2 0
, 0, a '" "
0:
1 0 0
0 0
"
1 0
0 0
0 "
a q! "
0
0
1 0 0 Q
0',.
·a
Forcible
Rape
271
16.5
0 1 2 0
1 ''0 a
2 ,,',
0,
1 [)
,4 ., ... , '~<.,
0 4 0
3 6
""'f:' rl.'
d \.1 0
'.' 0 .. 0", 16
0 4 0 0
trb ,
S 4.
\;
0 ;:[~.:>
0 ·t 0
0 if, 1 2
..... ~~. ".,.;,.,.,~., .. "-" "';, ."-- .... .,,.,-~.-~~-.-.-
1 1 3 0 1 4 1 0 1 0
Robbery
1,071
65.0
0 1
12 3
11 '4
II '1 '0 1 2 , ,
4 4 0
4 4
r t, 0 2 2. 4 0 4
18 2 0 q
.. e '" ,,5'1 "
,o~ ~".
0 .--~.--
5
0 3 4
Aggravaled
Assault Burglary
'1,868 15,267
113.5 927.3
o 7
30 o 8
22 141 334 80
177 ~14a':
179'
,-
Larceny
31,718
1,926.5
35 212 598 246 188
,,~.
19S " .213;
Motor Vehicle
Theft
2,990
181.6
o 9
76 1
10 '26
5 .-~. ,M ,
9
12 1
25 3 4 3 8
69.' ., 294
., ,e4 0,:· . ~~, " , '. "I ... , .,".. _~:'~ . C\
,? 325 ',' .,12 ,
10 52 4. 4
'" 1.1 \l .. o 5 3
44 11 o 2 9.
24
b .
260 <l"l ,. :,.14 .. 121 ••• ",,,,,...- ,A
44 87
7
136
141 346 50
331 138 244
";'§f 'e.' 1M 132 1e€)e 114 " Ii 11'5,
. .' '1\' II
~ 97 '119 80o,,~, 121
__ ,, __ ~ ..... , '"'" {\ ~<S '''-' --_
163 421 219 169
355 491 704 348 37
7 7 1
20
6 20
"r~ 9
.9
.8 12
,,' -16 34 36 24 1 45
"·~1oie.' ',- ~f5 ";~"--" ,.. 5 , '
0" 143 • • '<:. 3t? ') " '12 f'99. 169
.' t 1.."-\
3,,99 ) ".) . ~'~15' - ~"'"
1 2 ,-,Q
"~',,,
'Ii'
.... ~. . --~ . \\ ,
o
11 J09, ',~ .... 0_.. . ... -->-,~ ' .. _ '~'""_ , .. .;,;.lL._._ ......... __ "~_~_ ~ ... ~_, .... '~ __ ""~ t~~,_,,_._ ... cL .. ,.~j.?: ._~".~:~_
19
5 34 24
109
121 81
150
193 500
149 14 113 5 246 16 396 20
81
" ~~'
.:.1
.1 I

(Table 22 continued)
Crime Total Violent Property Department Population Rate Index Crime Crime
--Wayne 48,238 1,822.2 879 17 862
Williams 20,666 2,201.7 455 7 448
Wyandot 12,057 1,078.2 130 3 127
Rural Subtotal 1,086,011 1,708.8 18,558 963 11,595
Crime Rate 1,708.8 88.7 1,620.2
Sheriffs Offices Total 2,732,458 2,627.7 71,800 4,230 67,570
Crime Rate 2,627.7 154.8 2,472.9
Special Departments Cleveland Metro Parks NA NA 74 16 58 Kent State University NA NA 848 47 801 Miami University 17,202 877.8 151 6 145 Mound City Group NA NA 1 0 1 Ohio State University 65,000 2,549.2 1,657 27 1,630 Ohio University NA NA 537 12 525
. Wright State University 15,000 1,473.3 221 1 220
Special Departments Total - - 3,489 109 3,380 .,
Grandlotal 10,130,273 4,841.1 490,411 38,682 451,735 "
Crime Rate 4,841.1 381.8 4,459.3
110

Forcible Aggravated MotorVehicle Murder Rape Robbery Assault Burglary Larceny Theft
2 4 3 8 306 522 34 1 0 3 3 148 285 15 1 0 1 1 47 70 10
27 79 189 668 6,104 10,827 664
2.5 7.3 17.4 61.5 562.1 997.0 61.1
84 350 1,260 2,536 21,371 42,545 31654
3.1 12.8 46.1 92.8 782.1 1557.0 133.7
1 5 0 10 3 51 4 0 5 8 34 39 743 19 0 0 0 6 23 122 0 0 0 a 0 1 0 0 0 7 16 4 306 1,293 31 0 0 1 11 86 437 2 0 0 0 1 70 149 1
1 17 25 66 528 2,795 57
766 2,600 19,065 16,251 119,802 293,564 38,369
7.6 25.7 188.2 160.4 1,182.6 2,891.9 378.8
111

Table 23
Ohio Reported Index Offenses by County: 1976
county
Adams Allen*
Ashland Ashtabula
'.~'Ath;n's' Ce-.. ', '. '. : ~ ~. 0
Auslaite* e~liTront~
· .. ar~wn:.';: .,>.'
Buffer*. . , .. """ .. " ... ,~~"'-., ••• ; .. ,.~ .. :-~,<-~.'.-"",, ~_. ' . ....c\" ...... , •. ,~" •• , ~
Carroll * Champaign* Clark.* Clermont· Clinton
~~>7;'~""~--"""-'''''''' ~.~.-, ~~ "~:""-:'-.(" ~.,- -.'
Columbiana <ii,' '" -:'
~. Coshocton "orawford
,Cuyahoga 1,'
"J2~.r.ke~.~., .... _~ .. Defiance Delaware*
Erie Fairfield·
Fayette ""Pra'hkl'in';-"'''''' ....
, '"' . ,.'
Fult<>0* . GalJia'
Total
Index
88 6,285 1,119 2,808 j,195 ' •. 678'= , ,823 ..... 334: ,"
,.J?Jo.~~" 420 786
7,723 3,006
914
~,13I, 607·
1,$94. 85]700
1,l11.?, 1,286 1 ,438 3,857 1,310
906 59,815.
421" 99
GEiauga* '. 1.,247
.. c,:I~.~~~n~,:~ ...... ,.. ...,., .............. , .... _ .... ,\~~!.??~;. Guernsey
Hamilton* Hancock Hardin
704 52,212
1,091 903
, 6'
I.'
Violent Crime
1
220 52
174
5
42 366 167
31 72 . 3t .90
10,659 .
61 23 73
254 141 40
. 3,943
13 1
,:88
21 4,564
41 73
Property
Crime Murder
87 0 6,065 3 1,067 3 2,634 3 ......... "'''.; iJ6~ ............. -. , ... ' ............. . . ,680,:
.. ,., .,c .• , .. ,},1!~~·~L .. : ..... "'.,. , 415 744
7,357 2,839
883 "', ""'~:d~5""'"''''''''~~'''
. '576,
1,263 1,365 3,603 1 ,169
866 , 55;872'" .. , .. , .. ". . "408' .'
.,.,Sf} .
. ',1,t59'
° 1 7 1 2
° 4 1
° 1
. ".:51462,.",' . "', .. ' ' "~_'<" __ "'''''''_N' "<'_ ... c_'~.".~_ ""'_"~h~'.-.,~--._ ..... *I._.C'_ .. ~. __ "" .. ".~.":._~,,,,_~,,,:,,,,. __ ,,"';''''';
683 47,648 1,050
830
1 70
° ° Harrison 152 2 150 ° "\t.,.~,,.~: ....... :-~ .. --.,-:-....... ~ .'""'~""'''''''-'''-'''''"':"'''''-:~''"--:''';-'.-~:J ~ ':"""'------~-.'~.".-:.-"~~"~., .. ~'~ .. ~,~--~. ,~".- ~~!' '""-''''''~.'' "_,,~_:~,, ..... u_ ~,-.-_ ..... ___ ." .. ~.,~~.-..~ •• ,";.,~."",:" ,'- ~ •• " •• .."., "r_""'-"",' I"'''._~" __ ,~ ___ ,-~ __ """ ____ .~,,,,, "Henr.y'. .' . '659 '25 6~4
HighJand' ·'599 9 "590' . IJ "
" Hocking" . 4~'1' .' .::42<21.44 .•.•..•.• , ... :'
. H.olm¢~ ?J' ', .. '.226 ., .' .' Hu rb n ;". ....,: '" ". ' . ". . 1 09S' .' • .' . . '.. . .... ,_ .... ~ .. 't .•. · 0 ... 4' _1 •.. ·.·.····:··~....., ... , ~,. '~'Y
:...".. ........ :-,..~-.. ~.,,~.;~~~.~,-...;-.. -~ ....... "'~:-, ... :."""""-...... , •• " .... ,. ___ ~,"'.~,,.;:._ .... .,.,~o_._.:.."'-~""".... ,__ ___ _ ____ ,_~~ ___ .___ _. __ ... o~ ______ ~ •• ..;.\;;;."'~ ...... _--'_,..;:_"..:.""' • ..i...:.,..:;._~_.:: ..... ~
Jefferson * 2,377 227 2,150 ° Knox 1,062 31 1,031 1 Lake* 6,938 295 6,643 6 Lawrence * 1,991 108 1,883 3 Licking 3,317 152 3,165 2
*Suburban County
112
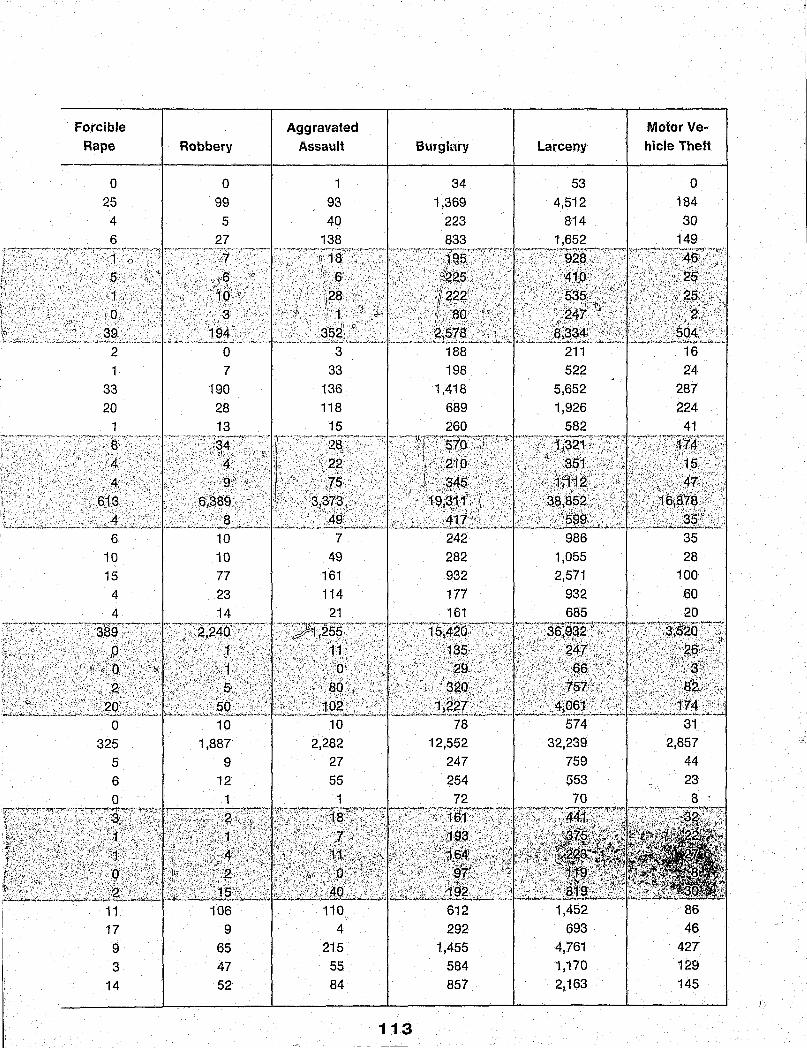
Forcible Aggravated Motor Ve-Rape Robbery Assault Burghny Larceny hicJe Theft
0 0 34 53 0 25 99 93 1,369 4,512 184 4 5 40 223 814 30
0 188 211 16 1 7 33 198 522 24
33 "190 136 1,418 5,652 287 20 28 118 689 1,926 224
1 13 15 260 582
6 10 7 242 986 35 10 10 49 282 1,055 28 15 77 161 932 2,571 100 4 23 114 177 932 60 4 14 21 161 685 20
0 10 10 78 574 31 325 1,887 2,282 12,552 32,239 2,857
r\
5 9 27 247 759 44 12 55 254 553 23
1 72 70 8
11 106 110 612 1,452 86 17 9 4 292 693 46 9 65 215 1,455 4,761 427 3 47 55 584 1,170 129
14 52 84 857 2,163 145
113 - - -~
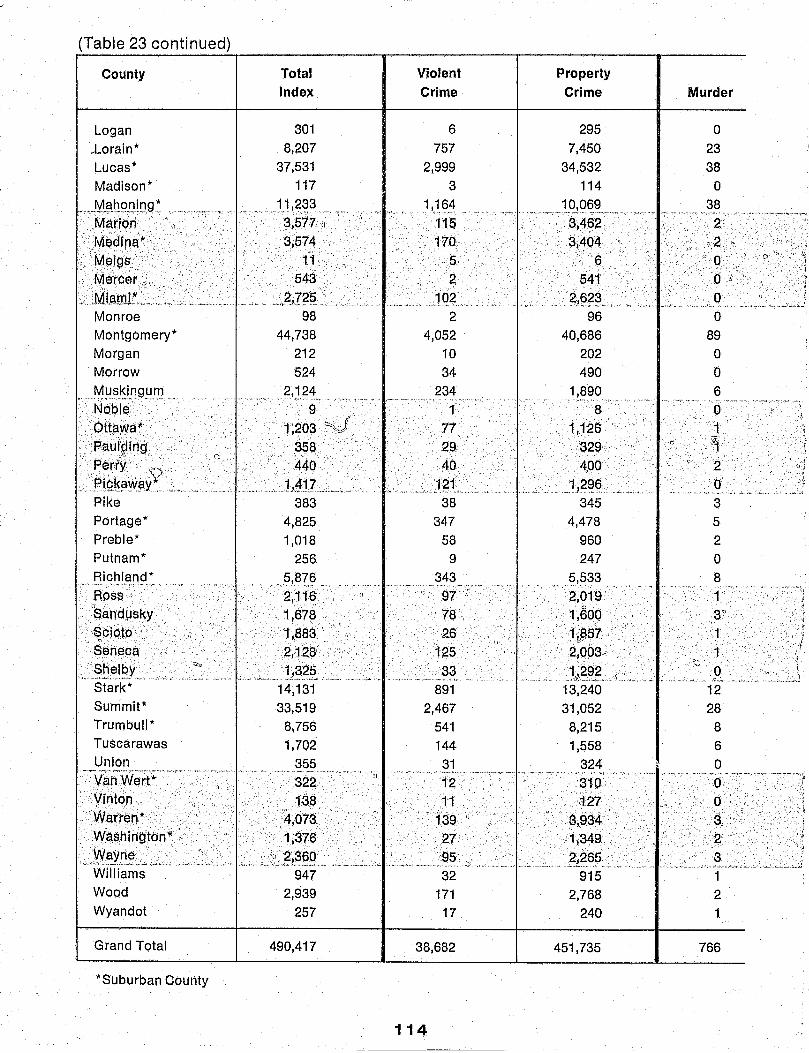
(Table 23 continued)
County
Logan .Lorain* Lucas* Madison*
"Jytc.t.bgn!o g : . MariOn Medln~* .. "M~lcif:
..•.... Mercer .. ~ .. ·· +cMlf1mt~;;~ .... '
Monroe Montgomery* Morgan Morrow Muskingum
"Nobf$~ .." . OttaWa* .·P~UipJh9
.. P~rrY' ,. v ' ... PLq~?I~El~\+.;~
Pike Portage* Preble* Putnam*
~i<::I}L~119~ Boss
" i)" :.-. .':
Sandusky
..... ~6iQtO Seh~oa
.. ,~h~l§y,_, .. ;_~... . "" Stark* Summit* Trumbull* Tuscarawas Union
~~Va';\j:re-tt;" "'~"
Virltoh. W~trei1* : .' . Wa$.hin9tonW :.
Total Index
301 8,207
37,531 117
,11 ,2.~3 31577 ',1
3J574·· ···11 543 .'
.. :,g,Z?§ .. _ ~ 98
44,738 212 524
g,1.?4,. 9
1;203 '.358
440 1417 . ;. ,L.,.,. , ... """.
383 4,825 1 ,018
256
5!~?§., 2,11~'
1,678 "1,!l83 2J12~r
. ; ~..... 1L~?,S. .. 14,131 33,519
8,756 1,702
355 ·322
138' 0": . ,: .
4073 '. . ~ . . '. ,
"1;376
Violent
Crime
6 757
2,999 3
1",1.~.~ .... 11$ 17Q
·5 2
192 .. ' 2
4,052 .
10 34
234 f
77 29 40
121 38
347 58
9
343
33 891
2,467 541 144
31 12' .
1.1 139'{
.27 ,.,.W~¥!].t~,.,+,,, .. "." :~ .. :..: ............ +~ .. ~l~+~!§'§QL +.""" .. _~ ...... ,+_-,._.,,,95. .. :, .. ,.
Williams 947 Wood 2,939 Wyandot 257
Grand Total 490,417
*Suburban County
32 171
17
38,682
114
Property
Crime
295 7,450
34,532 114
~q,Q69 . 3,462·.
3,404 . 6
541
~1C3?~_. 96
40,686 202 490
1,890 8
1;126 329 .
.4,00 1296 ..... 1. ...... ' ..
345 4,478
960 247
5,_5~3
·2,019 . 1,600
'1~57 "21003 .
JA~,~.?~ 13,240 31,052
8,215 1,558
324
Murder
o 23 38 o
38 ~""~"~':-"""~'-'.'~~ .- ·'···~--·-t ... ·--.··!_
Z
< O· p.,; .. o o
89 o o 6
·····0
'1 ~
3 5 2
o 8 1 3~
.1 'I
12 28
8 6 o
"".,-,- -"'-" .,." .. ~-.","" .. ,'",~ .~"~,, .. ,.- .. ~~ O· '}-~" 310 127'
3,934 1,349
, .?,'.?:6~~~ 915
2,768 240
451,735
0·', .
3, .... '. '"2"
'. 3 .... ,. ~- -.--"'- -- --~ .,' ... ,,_ .. "'-'"" .~« ~.-••• - ...... ~~ ••• .., .. ~;.~:~
1 2
1.
766

"
Forcible
Rape Robbery
0 3 57 2d5
212 1.853 0 1
65 535 9 51 9 46 a 0 0 -, 2
3 37 0 0
206 2.534 0 1 3 6 8 93
0 0 (\
3 5 2· 1
4 8
A 6 0 0
40 61 3 13 0 0
25 97 --, .~.
5 .. G 20 1 J3 ....
20
Aggravated
Assault
3 392 896
2 526
""'¥';
53 ,113
5 o
62 2
1,223 9
25 127
1
_e,v;, ".' ".,
68, . 25
, 2.6
111 35
241
40 9
213 ·,71·
61
Burglary
98 2,362
8.758 48
3.393 .681"'''' 80.1
'. 1 >169 '
o
." ,~~Lq :.,' 51
12.701 102 143 511
'. 395 .""
108 996 330 116
1 ,4~~ .., ",,~ 437
Larceny
192 4,470
23,836 64
5,785 ·'2;~9'4':'
··'2379 ...... J ... :. " ... '
:'5/<: , . 348 .
25.388 95
335
Motor Ve·
hicle Theft
5 618
1,938 2
891 ""'~ 'i57·:·~·
.~<~,.,.: " . 2~,\, 33'> .,,'., -...,.~". """fo_-..;,~._,~·,<.
3 2.597
5 12 59
','<" •.... ,.'~. '2 .. ' .
..• '3'$' . :,18' ,
,.:24.··r. '.' .. . 868' .' ..... '. ·'·······33· ,~" .':' ,._~_ . ..:..OK ._.].~:,.~ . . J:.:,,".,,~ .. _ ... ~.,,_~ .. ',-:~-:", .. ,; ... .;:~""' .... ~.;.:;.
222 3,242
583 116
15 240 47 15
267 ,···'t~&3:~':'·:
"75 5 524' ". '89:
'.' 91;) .$3a :46:: 17 " '426-.' '82044:;:1
•. :... __ ,,:~,.,. _ •. ,:: ~ __ ". _~.::...' ,,,_,~.,''''''_-C''.:'~'''''''~':'''"<:; d, •. ,,::">-, .. ~ __ : .. L;"'",k •.• ;_';:"'''''' ~..,.~_~~>-- ,,~_, ,'.<_._1.':.':" .. '''-'' ... ,.;.. ... ,.:-....i-.:,... __ :....~.~
88 437 354 3,439 8,913 888 165 843 1,431 8,044 20,908 2,100
23 235 275 2,336 5,291 588 9 17 112 390 '1,109 59 o 0 31 85 225 14 , .. "",,' ·' .. _·-2 .. · .. :-'· .... ' ~ -.. ~·· .. " .. ··--·~ .. O"·' .. "~ ................ ·• .... -· .. "·-'-· .. - .... 4~'·~~ .. --'-'" .... " .... ' .... ~-.-...... ~ .. , .. -.-"'''.'''.' ., ... ~.,e .. ':C':" ... : ... '.";;;~:-·':':;"
911188' ,'.pc: ;0 ,10 . .,"44' "J, I
43 . 82. '1' 2.,a$1,"~'t'1'
._ ;___ __ .,'-~J:~~ ___ "__;~" __ ~ __ .~-,-J~_~_ 2~:1~iL~ __ ._:.~~:;L 1 7 23 192 698 25 8 44 117 519 2,127 122 1 2 13 73 146 21
2,600 19,064 16,251 119,802 293,564 38,369
115
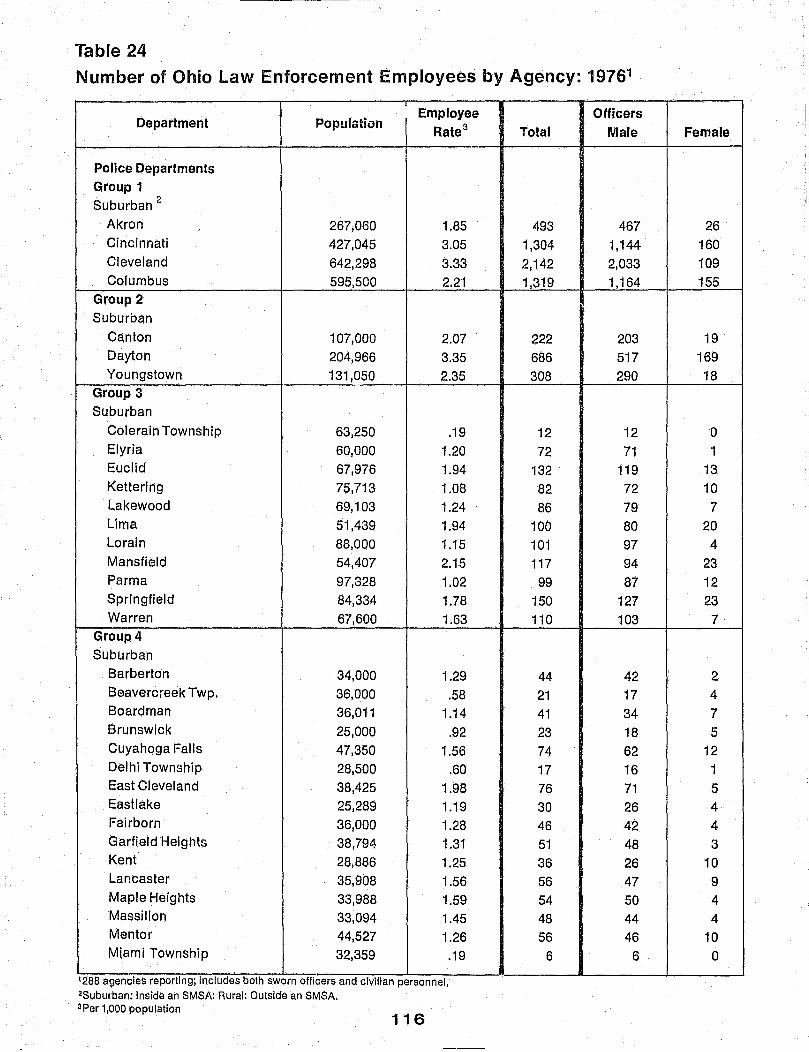
Table 24 Number of Ohio law Enforcement Employees by Agency: 19761
Department Population Employee
Rate3
Police Departments Group 1 Suburban 2
Akron 267,060 1.85 Cincinnati 427,045 3.05 Cleveland 642,298 3.33 Columbus 595,500 2.21
Group 2 Suburban
Canton 107,000 2.07 Dayton 204,966 3.35 Youngstown 131,050 2.35
Group 3 SUburban
Colerain Township 63,250 .19 Elyria 60,000 1.20 Euclid 67,976 1.94 Kettering 75,713 1.08 Lakewood 69,103 1.24 .Lima 51,439 1.94 Lorain 88,000 1.15 Mansfield 54,407 2.15 Parma 97,328 1.02 Springfield 84,334 1.78 Warren 67,600 1.63
Group 4 Suburban
Barberton 34,000 1.29 Beavercreek Twp. 36,000 .58 Boardman 36,011 1.14 Brunswick 25,000 .92 Cuyahoga Falls 47,350 1.56 Delhi Township 28,500 .60 East Cleveland 38,425 1.98 Eastlake 25,289 1.19 Fairborn 36,000 1.28 Garfield Heights 38,794 1.31 Kent 28,886 1.25 Lancaster 35,908 1.56 Maple Heights 33,988 1.59 Massillon 33,094 1.45 Mentor 44,527 1.26 Miami Township 32,359 .19
... 1288 agencies reporting; includes both sworn officers and cIvilian personnel. 2Suburban: Inside an SMSA: Rural: Outside an SMSA. ~Per 1,000 population
116
-
Officers Total Male
493 467 1,304 1,144 2,142 2,033 1,319 1,164
222 203 686 517 308 290
12 12 72 71
132 119 82 72 86 79
100 80 101 97 117 94
99 87 150 127 110 103
44 42 21 17 41 34 23 18 74 62 17 16 76 71 30 26 46 42 51 48 36 26 56 47 54 50 48 44 56 46
6 6
Female
26 160 109 155
19 169 18
° 1 13 10
7 20
4 23 12 23 7
2 4 7 5
12 1 5 4 4 3
10 9 4 4
10 0
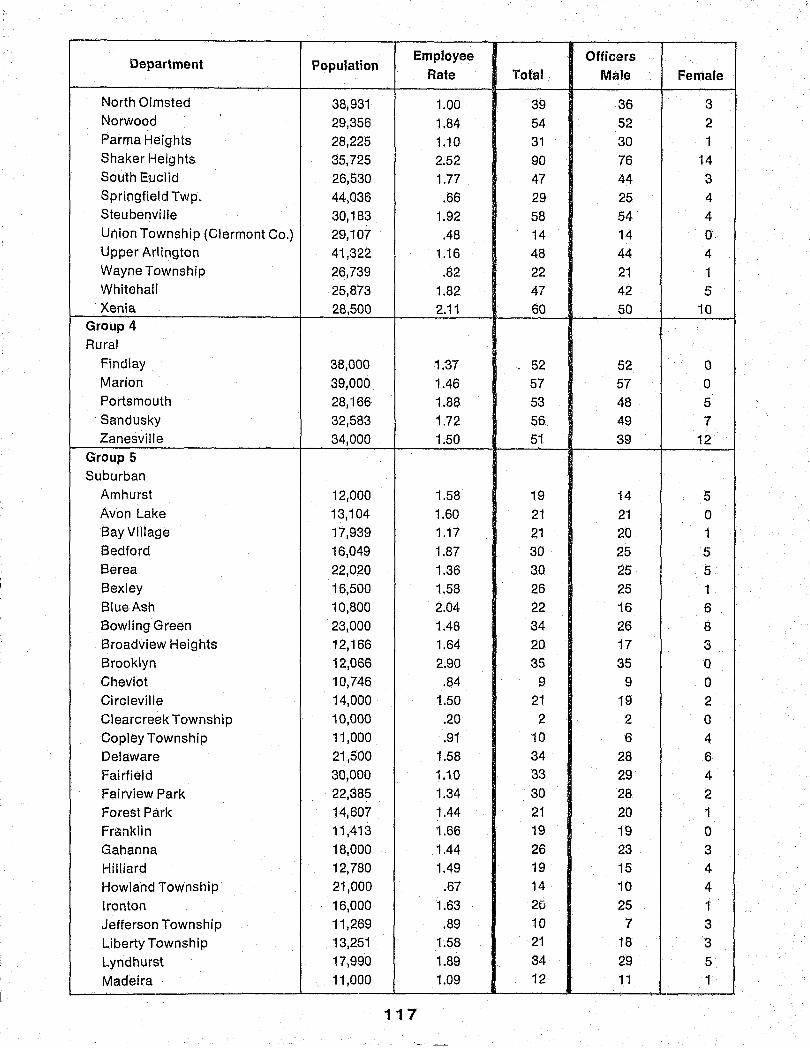
Department Population Employee Officers
Rate Total Male Female
North Olmsted 38,931 1.00 39 36 3 Norwood 29,356 1.84 54 52 2 Parma Heights 28,225 1.10 31 30 1 Shaker Heights 35,725 2.52 90 76 14 South Euclid 26,530 1.77 47 44 3 Springfield Twp. 44,036 .66 29 25 4 Steubenville 30,183 1.92 58 54 4 Union Township (Clermont Co.) 29,107 .48 14 14 0 Upper Arlington 41,322 1.16 48 44 4 Wayne Township 26,739 .82 22 21 1 Whitehall 25,873 1.82 47 42 5 Xenia 28,500 2.11 60 50 10
Group 4 Rural
Findlay 38,000 1.37 52 52 0 Marion 39,000 1.46 57 57 0 Portsmouth 28,'166 1.88 53 48 5 Sandusky 32,583 1.72 56 49 7 Zanesville 34,000 1.50 51 39 12
Group 5 Suburban
Amhurst 12,000 1.58 19 14 5 Avon Lake 13,104 1.60 21 21 0 Bay Village 17,939 1.17 21 20 1 Bedford 16,049 1.87 30 25 5 Berea 22,020 1.36 30 25 5 Bexley 16,500 1.58 26 25 1 Blue Ash 10,800 2.04 22 16 6 Bowling Green 23,000 1.48 34 26 8 Broadview Heights 12,166 1.64 20 17 3 Brooklyn 12,066 2.90 35 35 0 Cheviot 10,746 .84 9 9 0 Circleville 14,000 1.50 21 19 2 Clearcreek Township 10,000 .20 2 2 a Copley Township 11,000 .91 10 6 4 Delaware 21,500 1.58 34 28 6 Fairfield 30,000 1.10 33 29 4 Fairview Park 22,385 1.34 30 28 2 Forest Park 14,607 1.44 21 20 1 Fr«nklin 11,413 1.66 19 19 0 Gahanna 18,000 1.44 26 23 3 Hilliard 12,780 1.49 19 15 4 Howland Township 21,000 .67 14 10 4 Ironton 16,000 1.63 20 25 1 Jefferson Township 11,269 .89 10 7 3 Liberty Township 13,251 1.58 21 18 3 Lyndhurst 17,990 1.89 34 29 5 Madeira 11,000 1.09 12 1'1 1
117
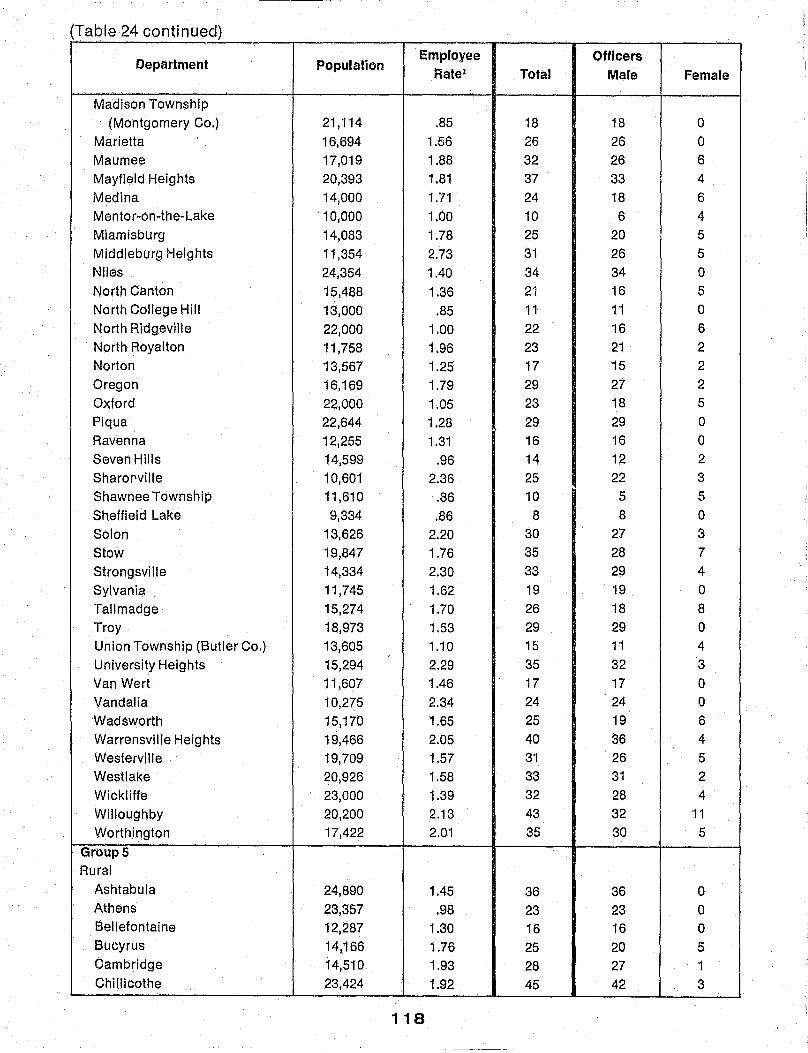
(Table 24 continued)
Department Population Employee Officers
Rate2 Total Male Female
Madison Township (Montgomery Co.) 21,'114 .85 18 18 0
Marietta 16,694 1.56 26 26 0 Maumee 17,019 1.88 32 26 6 Mayfield Heights 20,393 1.81 37 33 4 Medina 14,000 1.71 24 18 6 Mentor-on-the-Lake 10,000 1.00 10 6 4 Miamisburg 14,083 1.78 25 20 5 Middleburg Heights 11,354 2.73 31 26 5 Niles 24,354 1.40 34 34 0 North Canton 15,488 1.36 21 16 5 North College Hill 13,000 .85 11 11 0 North Ridgeville 22,000 1.00 22 16 6 North Royalton 11,758 1.96 23 21 2 Norton 13,567 1.25 17 15 2 Oregon 16,169 1.79 29 27 2 Oxford 22,000 1.05 23 18 5 Piqua 22,644 1.28 29 29 0 Ravenna 12,255 1.31 16 16 0 Seven Hills 1.4,599 .96 14 12 2 Sharorville 10,601 2.36 25 22 3 Shawnee Township 11,610 .86 10 5 5 Sheffield Lake 9,334 .86 8 8 0 Solon 13,626 2.20 30 27 3 Stow 19,847 1.76 35 28 7 Strongsville 14,334 2.30 33 29 4 Sylvania 11,745 1.62 19 19 0 Tallmadge 15,274 1.70 26 18 8 Troy 18,973 1.53 29 29 0 Union Township (Butler Co.) 13,605 1.10 15 11 4 University Heights 15,294 2.29 35 32 3 Van Wert 11,607 1.46 17 17 0 Vandalia 10,275 2.34 24 24 0
Wadsworth 15,170 1.65 25 19 6 Warrensville Heights 19,466 2.05 40 36 4 Westerville 19,709 1.57 31 26 5 Westlake 20,926 1.58 33 31 2 Wickliffe 23,000 1.39 32 28 4 Willoughby 20,200 2.13 43 32 11 Worthington 17,422 2.01 35 30 5
GroupS Rural
Ashtabula 24,890 1.45 36 36 0 Athens 23,357 .98 23 23 0 Bellefontaine 12,287 1.30 16 16 0 Bucyrus 14,166 1.76 25 20 5 Cambridge 14,510 1.93 28 27 1 Chillicothe 23,424 1.92 45 42 3
118
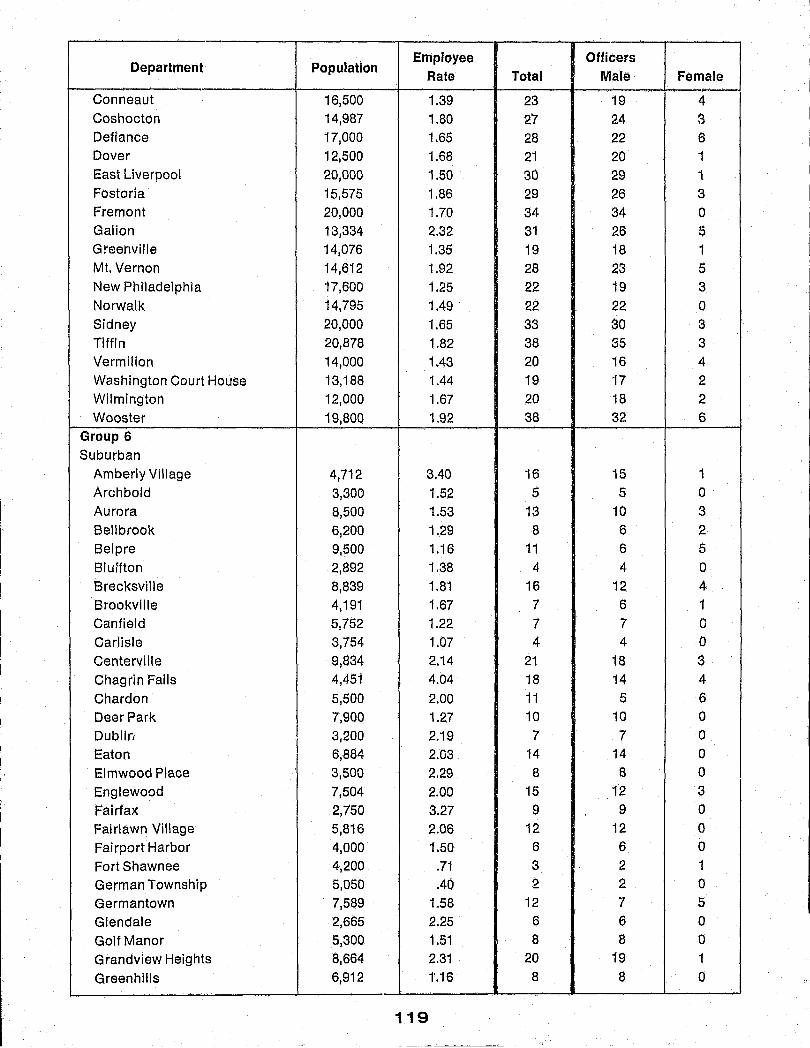
-Department Population
Employee Officers Rate Total Male Female
Conneaut 16,500 1.39 23 19 4 Coshocton 14,987 1.80 27 24 3 Defiance 17,000 1.65 28 22 6 Dover 12,500 1.68 21 20 1 East Liverpool 20,000 1.50 30 29 1 Fostoria 15,575 1.86 29 26 3 Fremont 20,000 1.70 34 34 0 Galion 13,334 2.32 31 26 5 Greenville 14,076 1.35 19 18 1 Mt. Vernon 14,612 1.92 28 23 5 New Philadelphia 17,600 1.25 22 19 3 Norwalk 14,795 1.49 22 22 0 Sidney 20,000 1.65 33 30 3
Tiffin 20,878 1.82 38 35 3 Vermilion 14,000 1,43 20 16 4 Washington Court House 13,188 1,44 19 17 2 Wilmington 12,000 1.67 20 18 2 Wooster 19,800 1.92 38 32 6
Group 6 Suburban
Amberly Village 4,712 3,40 16 15 1 Archbold 3,300 1.52 5 5 0 Aurora 8,500 1.53 13 10 3 Bellbrook . 6,200 1.29 8 6 2 Belpre 9,500 1.16 11 6 5
Bluffton 2,892 1.38 4 4 0 Brecksville 8,839 1.81 16 12 4
Brookville 4,191 1.67 7 6 1 Canfield 5,752 1.22 7 7 0
Carlisle 3,754 1.07 4 4 0
Centerville 9,$34 2.14 21 18 3
Chagrin Falls 4,451 4.04 18 14 4
Chardon 5,500 2.00 11 5 6
Deer Park 7,900 1.27 10 10 0 Dublirt I 3,200 2.19 7 7 0
Eaton 6,884 2.03 14 14 0
Elmwood Place 3,500 2.29 8 8 0
Englewood 7,504 2.00 15 12 3
Fairfax 2,750 3.27 9 9 0
Fairlawn Village 5,816 2.06 12 12 0
Fairport Harbor 4,000 1.50 6 6 0
Fort Shawnee 4,200 .71 3 2 1
German Township 5,050 ,40 2 .2 0 Germantown 7,589 1.58 12 7 5 Glendale 2,665 2.25 6 6 0
Golf Manor 5,300 1.51 8 8 0
Grandview Heights 8,664 2.31 20 19 1 Greenhills 6,912 1'.16 8 8 0
119
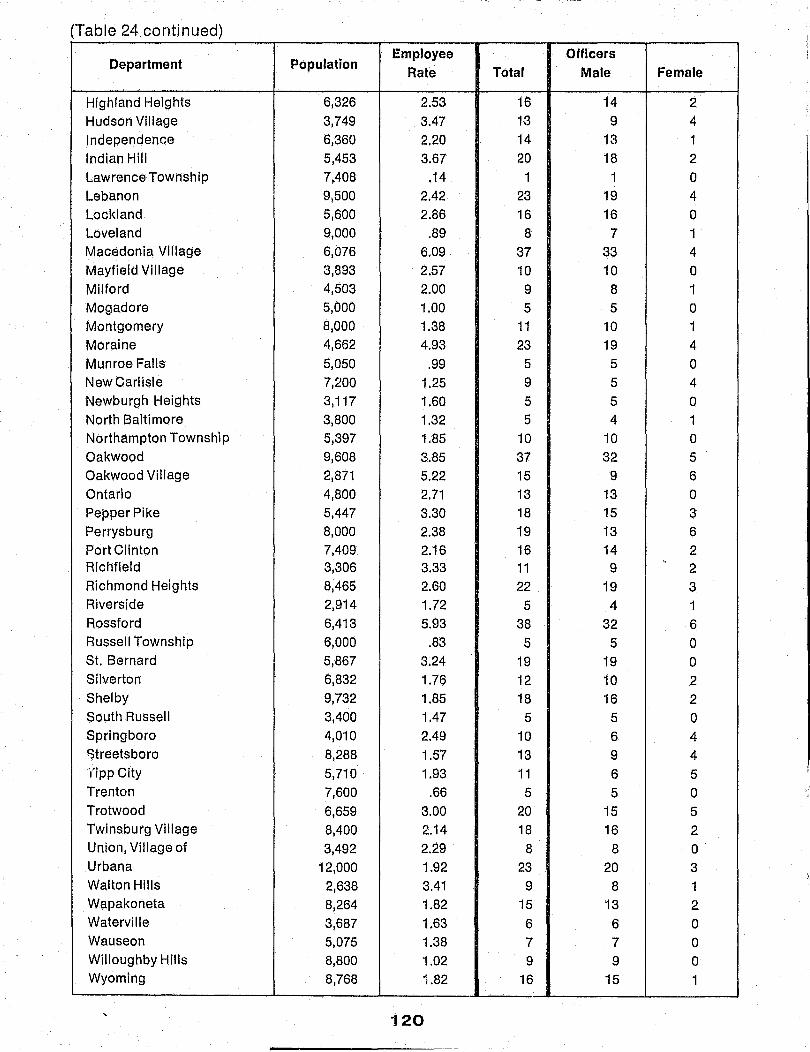
(Table 24 continued)
Population Employee Officers
Department Rate Total Male Female
Highland Heights 6,326 2.53 16 14 2 Hudson Village 3,749 3.47 13 9 4 Independence 6,360 2.20 14 13 1 Indian Hill 5,453 3.67 20 18 2 Lawrence Township 7,408 .14 1 1 0 Lebanon 9,500 2.42 23 19 4 Lockland 5,600 2.86 16 16 0 Loveland 9,000 .89 8 7 1 Macedonia Village 6,076 6.09 37 33 4 Mayfield Village 3,893 2.57 10 10 0 Milford 4,503 2.00 9 8 1 Mogadore 5,000 1.00 5 5 0 Montgomery 8,000 1.38 11 10 1 Moraine 4,662 4.93 23 19 4 Munroe Falls 5,050 .99 5 5 0 New Carlisle 7,200 1.25 9 5 4 Newburgh Heights 3,117 1.60 5 5 0 North Baltimore 3,800 1.32 5 4 1 Northampton Township 5,397 1.85 10 10 0 Oakwood 9,608 3.85 37 32 5 Oakwood Village 2,871 5.22 15 9 6 Ontario 4,800 2.71 13 13 0 Pepper Pike 5,447 3.30 18 15 3 Perrysburg 8,000 2.38 19 13 6 Port Clinton 7,409 2.16 16 14 2 Richfield 3,306 3.33 11 " 9 2 Richmond Heights 8,465 2.60 22 19 3 Riverside 2,914 1.72 5 4 1 Rossford 6,413 5.93 38 32 6 Russell Township 6,000 .83 5 5 0 Sf. Bernard 5,867 3.24 19 19 0 Silverton 6,832 1.76 12 10 2 Shelby 9,732 1.85 18 16 2 South Russell 3,400 1.47 5 5 0 Springboro 4,010 2.49 10 6 4 streetsboro 8,288 1.57 13 9 4 ripp City 5,710 . 1.93 11 6 5 Trenton 7,600 .66 5 5 0 Trotwood 6,659 3.00 20 15 5 Twinsburg Village 8,400 2.14 18 16 2 Union, Village of 3,492 2.29 8 8 0 Urbana 12,000 1.92 23 20 3 Walton Hills 2,638 3.41 9 8 1 Wapakoneta 8,264 1.82 15 13 2 Waterville 3,687 1.63 6 6 0 Wauseon 5,075 1.38 7 7 0 Willoughby Hills 8,800 1.02 9 9 0 Wyoming 8,768 1.82 16 15 1
120

Department Population Employee Officers
Rate2 Total Male Female
Group 6 Rural
Bellevue 8,766 1.94 17 14 3 Bryan 7,116 1.83 13 13 0 Carey 3,556 . 1.97 7 7 0 Crestline 6.101 2.46
" 15 12 3 Dennison 4,000 1.25 5 5 0 Gallipolis 7,500 2.00 15 13 2 Granville 4,129 4.84 20 19 1 Heath 7,500 2.00 15 13 2 Hicksville 4,100 2.44 10 5 5 Hillsboro 6,083 2.30 14 13 1 Johnstown 3,343 1.50 5 5 0 Kenton 9,600 1.46 14 12 2 Lisbon 3,682 1.36 5 5 0 Logan
. 6.546 1.53 10 10 0
Marysville 7,500 1.73 13 11 2 Mt. Gilead 3,300 1.52 5 5 0 Napoleon 8,500 2.12 18 17 1 Nelsonville 5,277 .95 5 5 0 New Boston 4.500 2.89 13 13 0 Newcomerstown 4,377 2.51 11 8 3 Orrville 8.500 1.88 16 12 4 Paulding 3,124 1.28 4 4 0 Uhrichsville 6,200 1.29 8 8 0 Upper Sandusky 6,362 2.83 18 18 0 Waverly 6,500 1.85 12 9 3 Willard 5,800 2.59 15 11 4
Group 1 Suburban
Arlington Heights 1,600 2.50 4 4 0 Belleville 1,775 1.69 3 2 1 Bradford 2,283 1.31 3 3 0 Brooklyn Heights 1,402 4.28 6 6 0 Buckland 298 10.07 3 3 0 East Canton 1,659 1.21 2 2 0 Leipsic 2,170 1.38 3 2 1 Mechanicsburg 1,760 2.84 5 3 2 /
Mt. Sterling 1,678 2.98 5 5 (Y'
New Paris 2,400 .83 2 2 0 Newtown 21047 1.95 4 4 0 Peninsula 670 4.48 3 3 0 Plain City 2,500 1.60 4 4 0 Valley View 1,305 4.60 6 6 0 Warrensville Township 1,983 2.52 5 5 0
121 ____ """"--_____ ._-....... ___ 1.110<'.
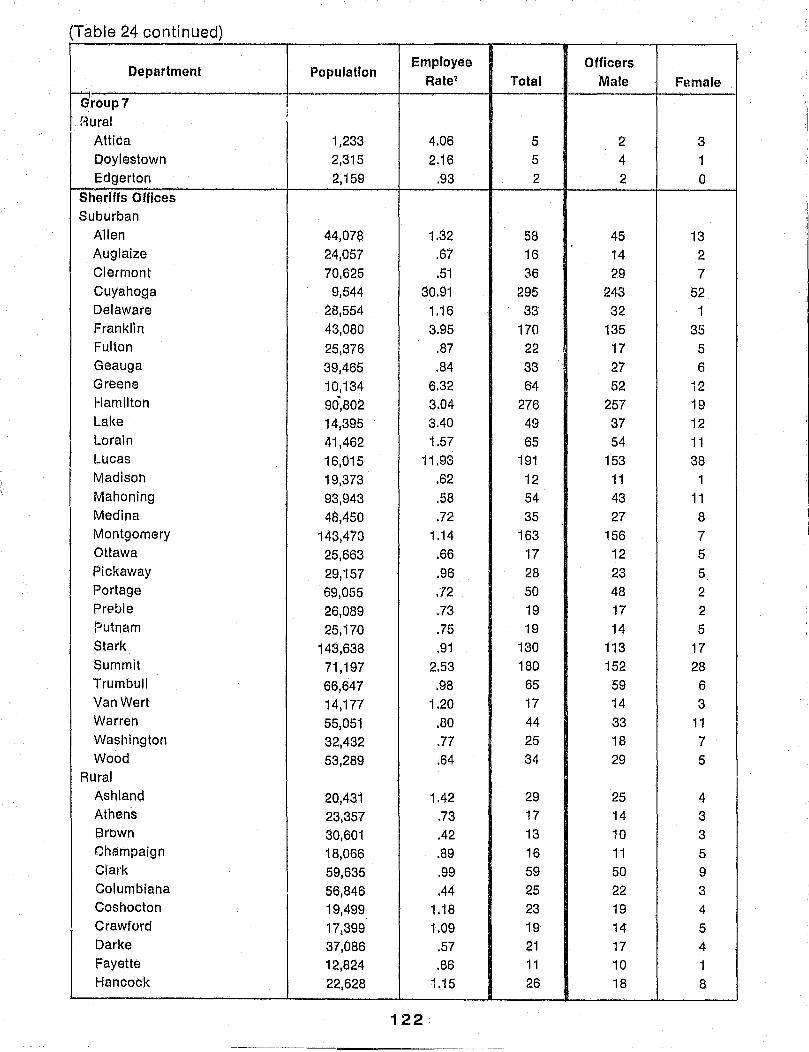
(Table 24 conti hued)
Department Population Employee Officers
Rate1 Total Male Female
Group 7 I
f-lural Attica 1,233 4.06 5 2 3 Doylestown 2,315 2.16 5 4 1 Edgerton 2,159 .93 2 2 0
Sheriffs Offices Suburban
Allen 44,078 1.32 58 45 13 Auglaize 24,057 .67 16 14 2 Clermont 70,625 .51 36 29 7 Cuyahoga 9.544 30.91 295 243 52 Delaware 28,554 1.16 33 32 1 Franklin 43,080 3.95 170 135 35 Fulton 25,376 .87 22 : 17 5 Geauga 39,465 .84 33 27 6 Greene 10,134 6.32 64 52 12 Hamilton 90,802 3.04 276 257 19 Lake 14,395 3.40 49 37 12 Lorain 41,462 1.57 65 54 11 Lucas 16,015 11.93 191 153 38
r Madison 19,373 .62 12 11 1 Mahoning 93,943 .58 54 43 11 Medina 48,450 .72 35 27 8 Montgomery 143,473 1.14 163 156 7 Ottawa 25,663 .66 17 12 6 Pickaway 29,157 .96 28 23 5 Portage 69,055 .72 50 48 2 Pr€lble 26,089 .73 19 17 2 Putnam 25,170 .75 19 14 5 Stark 143,638 .91 130 113 17 Summit 71,197 2.53 180 152 28 Trumbull 66,647 .98 65 59 6 Van Wert 14,177 1.20 17 14 3 Warren 55,051 .80 44 33 11 Washington 32,432 .77 25 18 7 Wood 53,289 .64 34 29 5
Rural Ashland 20,431 1.42 29 25 4 Athens 23,357 .73 17 14 3 Brown 30,601 .42 13 10 3 Ohampaign 18,066 .89 16 11 5 Clark 59,635 .99 59 50 9 Columbiana 56,846 .44 25 22 3 Coshocton 19,499 1.18 23 19 4 Crawford 17,399 1.09 19 14 5 Darke 37,086 .57 21 17 4 Fayette 12,824 .86 11 10 1 Hancock 22,628 1.15 26 18 8
122

Department Population Employee Officers
Rate Total Male Female - -Hardin 29,650 .64 19 12 7
Henry 19,800 .91 18 10 8 Highland 20,151 .60 12 12 0 Hocking 15,328 .98 15 12 '3 Holmes 21,703 .37 8 7
, 1
Jefferson 45,519 .44 20 19 1 Knox 30,388 .76 23 20 3 Lawrence 37,971 .63 24 17 7 Licking 53,761 .73 39 30 9 Logan 24,564 .53 13 11 2 Marion 2,',607 1.05 29 24 5 Monroe 12,631 .48 6 6 0 Morgan 13,302 .60 8 5 3 Musklngum 44,145 .68 30 . 28 2 ,
Pike 13,699 .88 12 11 1 Ross 35,449 .79 28 25 3 Sandusky 29,633 1.05 31 26 5 Scioto 45,334 .66 30 25 5 Tuscarawas 34,444 .64 22 19 3 Union 20,877 .38 8 7 1 Wayne 48,238 .75 36 29 7 Williams 22,666 .84 19 16 3 Wyan,)ot 12,057 1.00 12 9 3
Other Agencies Kent State University NA 26 26 0 Miami University 17,202 2.09 36 30 6 Ohio State Highway Patrol NA 1950 1608 342
j Ohio State University 65,000 1.06 69 59 10i'
Ohio University NA 30 27 3
Wright State University 10,000 1.67 25 18 7
123


I
I
i
..J