Embed Size (px)
Citation preview
Crime and Safety Surveys NCES HANDBOOK OF SURVEY METHODS
Crime and Safety SurveysWebsite: http://nces.ed.gov/surveys/ssocs/
The National Center for Education Statistics (NCES) conducts two surveys on a regular basis to collect data on school crime and safety: the School Crime Supplement (SCS) to the National Crime Victimization Survey (NCVS), a survey of students ages 12 through 18; and the School Survey on Crime and Safety (SSOCS), a survey of public schools and principals.
1. SCHOOL CRIME SUPPLEMENT (SCS)
Overview
T he SCS is conducted on a biennial basis as a supplement to the NCVS, which is administered by the Bureau of Justice Statistics (BJS), U.S. Department of Justice, and conducted by the U.S. Census Bureau. The NCVS is an ongoing
household survey that gathers information on the criminal victimization of household members age 12 and older. NCES and BJS jointly created the SCS to study the relationship between victimization at school and the school environment.
The SCS is designed to assist policymakers—as well as academic researchers and practitioners at the federal, state, and local levels—in making informed decisions concerning crime in schools. The SCS gathers data from nationally representative samples of students who are between the ages of 12 and 18 and who are enrolled in grades 6–12 in U.S. public or private schools. Prior to 2007, eligible sample members were those who had attended school at any time during the 6 months preceding the interview. In 2007, the questionnaire was changed to include students who attend school at any time during the school year.
The SCS asks students a number of questions about their experiences with, and perceptions of, crime and violence occurring inside their school, on school grounds, on the school bus, and from 2001 onward, going to or from school. The SCS contains questions not included in the NCVS, such as those on preventive measures employed by schools; students’ participation in after-school activities; students’ perceptions of school rules and the enforcement of these rules; the presence of weapons, drugs, alcohol, and gangs in school; student bullying and cyber-bullying; hate-related incidents; and students’ attitudes related to the fear of victimization at school. The SCS was conducted in 1989, 1995, 1999, 2001, 2003, 2005, 2007, and 2009. Future administrations are planned at 2-year intervals in odd-numbered years.
Survey Design Sample Design Each month, the U.S. Census Bureau selects respondents for the NCVS using a “rotating panel” design. Households are selected into the sample using a stratified, multistage cluster design. In the first stage, the primary sampling units (PSUs), consisting of counties or groups of counties, are selected, and smaller areas, called Enumeration Districts (EDs), are selected within each sampled PSU. Large PSUs are included in the sample automatically and are considered to be self-representing
TWO CRIME AND SAFETY SURVEYS: School Crime
Supplement
School Survey on Crime and Safety
Crime and Safety Surveys-1
Crime and Safety Surveys NCES HANDBOOK OF SURVEY METHODS
strata since all of them are selected. The remaining PSUs (called non-self-representing because only a subset of them are selected) are combined into strata by grouping PSUs with similar geographic and demographic characteristics, as determined by the decennial census. Within each ED, clusters of four households, called segments, are selected. Across all EDs, sampled households are then divided into discrete groups (rotations), and all age-eligible individuals in the households become part of the panel. Such a design ensures a self-weighting probability sample of housing units and group-quarter dwellings within each of the selected areas. (“Self-weighting” means that prior to any weighting adjustments, each sample housing unit had the same overall probability of being selected.)
To account for units built within each of the sample areas after the decennial census, a sample of permits issued for the construction of residential housing is drawn. Jurisdictions that do not issue building permits are sampled using small land-area segments. These supplementary procedures, though yielding a relatively small portion of the sample, enable persons living in housing units built after the decennial census to be properly represented.
In order to conduct field interviews for the NCVS, the sample of households is divided into six groups, or rotations. Each group of households is interviewed seven times—once every 6 months over a period of 3 years. Each rotation group is further divided into six panels. A different panel of households, corresponding to one-sixth of each rotation group, is interviewed each month during the 6-month period. Because the NCVS is continuous, newly constructed housing units are selected as described above, and assigned to rotation groups and panels for subsequent incorporation into the sample. A new rotation group enters the sample every 6 months, replacing a group phased out after 3 years. This type of rotation scheme is used to reduce the respondent burden that might result if households were to remain in the sample permanently. It should be noted that the data from the NCVS/SCS interviews obtained in the incoming rotation are included in the SCS data files. The incoming rotation was included in the NCVS data file only in 2007.
Once in the panel, NCVS interviews are conducted with all household members age 12 or older. After completion of the NCVS interview, an SCS interview is given to eligible household members. In order to be eligible for the SCS, students must be 12 through 18 years old, have attended school in grades 6 through 12 at some point during the school year, and not have been homeschooled during the school year. Persons who have dropped out of school, have been expelled or
suspended from school, or are temporarily absent from school for any other reason, such as illness or vacation, are eligible as long as they attended school at any time during the school year. For the 1989 and 1995 SCS, 19-year-old household members were considered eligible for the SCS interview. Prior to the 2007 SCS, household members who were enrolled in school sometime during the previous 6 months prior to the interview were eligible.
Data Collection and Processing In all SCS survey years, the SCS was conducted for a 6-month period from January through June in all households selected for the NCVS. Eligible respondents were asked the supplemental questions in the SCS only after completing their entire NCVS interview.
The 2007 SCS was fully automated; all interviews were conducted through computer-assisted personal interviewing (CAPI), where field representatives used questionnaires loaded into laptop computers to conduct interviews, which could be completed either in person (for the first and subsequent interviews, as circumstances called for) or by telephone. Two modes of data collection were used through the 2005 collection: (1) paper-and-pencil interviewing, which was conducted in person for the first NCVS/SCS interview; and (2) computer-assisted telephone interviewing (CATI), unless circumstances called for an in-person interview. There were 5,620 students who participated in the SCS in 2007; 6,300 in 2005; 7,150 in 2003; 8,370 in 2001; 8,400 in 1999; 9,730 in 1995; and 10,450 in 1989. The 2009 data have been collected but not yet released.
Interviewers are instructed to conduct interviews in privacy unless respondents specifically agree to permit others to be present. Most interviews are conducted over the telephone, and most questions require “yes” or “no” answers, thereby affording respondents a further measure of privacy. While efforts are made to assure that interviews about student experiences at school are conducted with the students themselves, interviews with proxy respondents are accepted under certain circumstances. These include interviews scheduled with a child between the ages of 12 and 13 where parents refuse to allow an interview with the child; interviews where the subject child is unavailable during the period of data collection; and interviews where the child is physically or emotionally unable to answer for him- or herself.
Weighting The purpose of the SCS is to be able to make inferences about criminal victimization in the 12- to
Crime and Safety Surveys-2
Crime and Safety Surveys NCES HANDBOOK OF SURVEY METHODS
18-year-old student population in the United States. Before such inferences can be drawn, it is important to adjust, or “weight,” the sample of students to ensure it is similar to the entire population in this age group. The SCS weights are a combination of household-level and person-level adjustment factors. In the NCVS, adjustments are made to account for both household- and person-level noninterviews. Additional factors are then applied to reduce the variance of the estimate by correcting for the differences between the sample distributions of age, race, and sex and the known population distributions of these characteristics. The resulting weights are assigned to all interviewed households and persons in the file.
A special weighting adjustment is then made for the SCS respondents, and noninterview adjustment factors are computed to adjust for SCS interview nonresponse. This noninterview factor is applied to the NCVS person-level weight for each SCS respondent. Prior to 2007, two weights were available in the SCS data file. The first SCS weight was to be used if producing NCVS estimates using only the continuing rotations. The second SCS weight was derived using the final NCVS person weight that was calculated for all interviewed persons in continuing and incoming rotations. In 2007, all rotations were used for both the SCS and NCVS.
Imputation Item response rates are generally high. Most items are answered by over 95 percent of all eligible respondents. No explicit imputation procedure is used to correct for item nonresponse.
Data Quality and Comparability Sampling Error Standard errors of percentage and population counts are calculated using the Taylor series approximation method using PSU and strata variables from the 1995, 1999, 2001, 2003, 2005, and 2007 data sets.
Another way in which the standard errors can be calculated, and were calculated in 1989, is by using the generalized variance function (GVF) constant parameters. The GVF represents the curve fitted to the individual standard errors that are calculated using the jackknife repeated replication technique.
Coverage Error The decennial census is used for sampling housing units in the NCVS. To account for units built since the census was taken, supplemental procedures are implemented. (See “Sample Design.”) Coverage error in the NCVS (and SCS), if any, would result from coverage error in the census and the supplemental procedures.
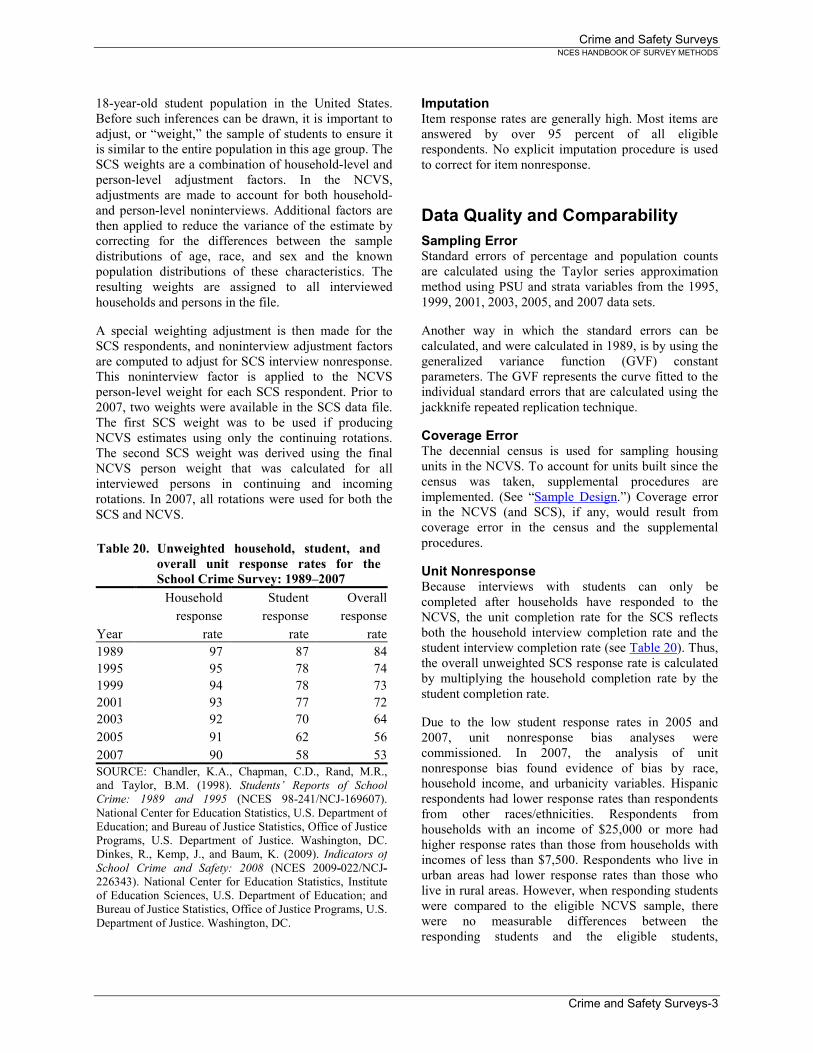
Unit Nonresponse Because interviews with students can only be completed after households have responded to the NCVS, the unit completion rate for the SCS reflects both the household interview completion rate and the student interview completion rate (see Table 20). Thus, the overall unweighted SCS response rate is calculated by multiplying the household completion rate by the student completion rate.
Due to the low student response rates in 2005 and 2007, unit nonresponse bias analyses were commissioned. In 2007, the analysis of unit nonresponse bias found evidence of bias by race, household income, and urbanicity variables. Hispanic respondents had lower response rates than respondents from other races/ethnicities. Respondents from households with an income of $25,000 or more had higher response rates than those from households with incomes of less than $7,500. Respondents who live in urban areas had lower response rates than those who live in rural areas. However, when responding students were compared to the eligible NCVS sample, there were no measurable differences between the responding students and the eligible students,
Table 20. Unweighted household, student, and overall unit response rates for the School Crime Survey: 1989–2007
Year
Household Student Overall response response response
rate rate rate 1989 97 87 84 1995 95 78 74 1999 94 78 73 2001 93 77 72 2003 92 70 64 2005 91 62 56 2007 90 58 53 SOURCE: Chandler, K.A., Chapman, C.D., Rand, M.R., and Taylor, B.M. (1998). Students’ Reports of School Crime: 1989 and 1995 (NCES 98-241/NCJ-169607). National Center for Education Statistics, U.S. Department of Education; and Bureau of Justice Statistics, Office of Justice Programs, U.S. Department of Justice. Washington, DC. Dinkes, R., Kemp, J., and Baum, K. (2009). Indicators of School Crime and Safety: 2008 (NCES 2009-022/NCJ-226343). National Center for Education Statistics, Institute of Education Sciences, U.S. Department of Education; and Bureau of Justice Statistics, Office of Justice Programs, U.S. Department of Justice. Washington, DC.
Crime and Safety Surveys-3
Crime and Safety Surveys NCES HANDBOOK OF SURVEY METHODS
suggesting the nonresponse bias has little impact on the overall estimates.
The analysis of unit nonresponse bias in 2005 also found evidence of bias for the race, household income, and urbanicity variables. White, non-Hispanic and other, non-Hispanic respondents had higher response rates than Black, non-Hispanic and Hispanic respondents. Respondents from households with incomes of $35,000–49,999 and $50,000 or more had higher response rates than those from households with incomes of less than $7,500, $7,500–14,999, $15,000–24,999, and $25,000–34,999. Respondents who live in urban areas had lower response rates than those who live in rural or suburban areas.
Item Nonresponse Item response rates for the SCS have been high. In all administrations, most items were answered by over 95 percent of all eligible respondents, with a few exceptions. One notable exception was the household income question, which was answered by about 80 percent of all households in 2007; about 82 percent of all households in 2005; and about 83, 84, 86, 90, and 90 percent of all households in 2003, 2001, 1999, 1995, and 1989, respectively. Due to their sensitive nature, income and income-related questions typically have relatively lower response rates than other items.
Measurement Error Measurement error can result from respondents’ different understandings of what constitutes a crime, memory lapses, and reluctance or refusal to report incidents of victimization. A change in the screener procedure between 1989 and 1995 was designed to result in the reporting of more incidents of victimization, more detail on the types of crime, and presumably more accurate data in 1995 than in 1989. (See “Data Comparability” below for further explanation.) Differences in the questions asked in the NCVS and SCS, as well as the sequencing of questions (SCS after NCVS), might have also lead to better recall in the SCS in 1995.
Data Comparability The SCS questionnaire has been modified in several ways since its inception, as has the larger NCVS. Users making comparisons of data across years should be aware of the changes detailed below and their impact on data comparability. In 1989 and 1995, respondents to the SCS were asked two separate sets of questions regarding personal victimization. The first set of questions was part of the main NCVS, and the second set was part of the SCS. When examining data from either 1989 or 1995, the following have an impact on the comparability of data on victimization: (1)
differences between years in the wording of victimization items in the NCVS as well as the SCS questionnaires; and (2) differences between SCS and NCVS items collecting similar data.
NCVS design changes. The NCVS was redesigned in 1992. Changes to the NCVS screening procedure put in place in 1992 make comparisons of 1989 data with those from later years difficult.
Due to the redesign, the victimization screening procedure used in 1995 and later years was meant to elicit a more complete tally of victimization incidents than the one used in 1989. For instance, it specifically asked whether respondents had been raped or otherwise sexually assaulted, whereas the 1989 screener did not. See Effects of the Redesign on Victimization Estimates (Kindermann, Lynch, and Cantor 1997) for more details on this issue.
In 2003, in accordance with changes to the Office of Management and Budget’s standards for the classification of federal data on race and ethnicity, the NCVS item on race/ethnicity was modified. A question on Hispanic origin is now followed by a question on race. The new race question allows the respondent to choose more than one race and delineates Asian as a separate category from Native Hawaiian or Other Pacific Islander. An analysis conducted by the Demographic Surveys Division at the U.S. Census Bureau showed that the new race question had very little impact on the aggregate racial distribution of NCVS respondents, with one exception: there was a 2-percentage-point decrease in the percentage of respondents who reported themselves as White. Due to changes in race/ethnicity categories, comparisons of race/ethnicity across years should be made with caution.
In 2007, three changes were made to the NCVS for budgetary reasons. First, the sample was reduced by 14 percent beginning in July 2007. Second, to offset the impact of sample reduction, first-time interviews, which are not traditionally used in the production of the NCVS estimates, were included. Since respondents tend to report more victimization during first-time interviews than in subsequent interviews (in part, because new respondents tend to recall events having taken place at a time that was more recent than when they actually occurred), weighting adjustments were used to counteract a possible upward bias in the survey estimates. Using first-time interviews helped to ensure that the overall sample size would remain consistent with that in previous years. Lastly, in July 2007, the use of CATI as an interview technique was discontinued, and interviewing was conducted using
Crime and Safety Surveys-4
Crime and Safety Surveys NCES HANDBOOK OF SURVEY METHODS
only CAPI. For more details, see Criminal Victimization, 2007 (U.S. Department of Justice 2008).
SCS design changes. The SCS questionnaire wording has been modified in several ways since its inception. Modifications have included changes in the series of questions pertaining to “fear” and “avoidance” between all survey years, beginning in 1995; changes in the definition of “at school” in 2001; changes in the introduction to, definition of, and placement of the item about “gangs” in 2001; and expansion of the single “bullying” question to include a series of questions in 2005 and including the topic of cyber-bullying in 2007. For more details, see Student Victimization in U.S. Schools: Results From the 2005 School Crime Supplement to the National Crime Victimization Survey (Bauer et al. 2008) and Indicators of School Crime and Safety: 2008 (Dinkes, Kemp, and Baum 2009).
In addition, the reference time period for the 2007 SCS was revised from “the last 6 months” to “this school year.” The change in reference period resulted in a change in eligibility criteria for participation in the 2007 SCS to include household members between ages 12 and 18 who had attended school at any time during the school year instead of during the 6 months preceding the interview, as in earlier surveys. This change was largely based on feedback obtained from students ages 12 to 18 during cognitive laboratory evaluations conducted by the U.S. Census Bureau. These respondents revealed they were not being strict in their interpretation of the 6-month reference period and were responding based on their experiences during the entire school year. Analyses of 2007 SCS data showed that estimates from 2007 are comparable to those from previous years. No change in reference period was made for criminal victimizations reported in the main NCVS.
Comparisons with related surveys. NCVS/SCS data have been analyzed and reported in conjunction with several other surveys on crime, safety, and risk behaviors. (See Indicators of School Crime and Safety, 2008 [Dinkes, Kemp, and Baum 2009].) These include both NCES and non-NCES surveys. There are four NCES surveys: the School Safety and Discipline Questionnaire of the 1993 National Household Education Survey; the Teacher Questionnaire (specifically, the teacher victimization items) of the 1993–94, 1999–2000, 2003–04, and 2007–08 Schools and Staffing Survey; the Fast Response Survey System’s Principal/School Disciplinarian Survey, conducted periodically; and the School Survey on Crime and Safety (SSOCS), conducted in 1999–2000, 2003–04, 2005–06, and 2007-08.
The non-NCES surveys and studies include the Youth Risk Behavior Surveillance System (YRBSS), a national and state-level epidemiological surveillance system developed by the Centers for Disease Control and Prevention (CDC) to monitor the prevalence of youth behaviors that most influence health; the School Associated Violent Death Study (SAVD), a study developed by the CDC (in conjunction with the U.S. Departments of Education and Justice) to describe the epidemiology of school-associated violent death in the United States and identify potential risk factors for these deaths; the Supplementary Homicide Reports (SHR), a part of the Uniform Crime Reporting (UCR) program conducted by the Federal Bureau of Investigation to provide incident-level information on criminal homicides; and the Web-based Injury Statistics Query and Reporting System Fatal (WISQARS Fatal), which provides data on injury-related mortality collected by the CDC.
Readers should exercise caution when doing cross-survey analyses using these data. While some of the data were collected from universe surveys, most were collected from sample surveys. Also, some questions may appear the same across surveys when, in fact, they were asked of different populations of students, in different years, at different locations, and about experiences that occurred within different periods of time. Because of these variations in collection procedures, timing, phrasing of questions, and so forth, the results from the different sources are not strictly comparable.
Contact Information For content information on the SCS, contact:
NCES Monica Hill Phone: (202) 502-7379 E-mail: [email protected]
Mailing Address: National Center for Education Statistics Institute of Education Sciences U.S. Department of Education 1990 K Street NW Washington, DC 20006-5651
BJS Michael Rand Phone: (202) 616-3494 E-mail: [email protected]
Crime and Safety Surveys-5
Crime and Safety Surveys NCES HANDBOOK OF SURVEY METHODS
Methodology and Evaluation Reports The reports listed below were either published by the U.S. Department of Education, National Center for Education Statistics (indicated by an NCES number), by the U.S. Department of Justice, Bureau of Justice Statistics, or were jointly published. See the technical notes in each report for a discussion of methodology.
General U.S. Department of Justice, Bureau of Justice
Statistics. (2008). Criminal Victimization, 2007 (NCJ-224390). U.S. Department of Justice. Washington, DC: Bureau of Justice Statistics.
Uses of Data Addington, L.A., Ruddy, S,A., Miller, A.K., and
DeVoe, J.F. (2002). Are America’s Schools Safe? Students Speak Out: 1999 School Crime Supplement (NCES 2002-331). National Center for Education Statistics, Institute of Education Sciences, U.S. Department of Education. Washington, DC.
Bauer, L., Guerino, P., Nolle, K.L., and Tang, S. (2008). Student Victimization in U.S. Schools: Results From the 2005 School Crime Supplement to the National Crime Victimization Survey (NCES 2009-306). National Center for Education Statistics, Institute of Education Sciences, U.S. Department of Education. Washington, DC.
Chandler, K.A., Chapman, C.D., Rand, M.R., and Taylor, B.M. (1998). Students’ Reports of School Crime: 1989 and 1995 (NCES 98-241/NCJ-169607). National Center for Education Statistics, U.S. Department of Education; and Bureau of Justice Statistics, Office of Justice Programs, U.S. Department of Justice. Washington, DC.
DeVoe, J.F., and Bauer, L. (2010). Student Victimization in U.S. Schools: Results From the 2007 School Crime Supplement to the National Crime Victimization Survey (NCES 2010-319). National Center for Education Statistics, Institute of Education Sciences, U.S. Department of Education. Washington, DC.
DeVoe, J.F., and Kaffenberger, S. (2005). Student Reports of Bullying: Results From the 2001 School Crime Supplement to the National Crime Victimization Survey (NCES 2005–310). National Center for Education Statistics, Institute of Education Sciences, U.S. Department of Education. Washington, DC.
DeVoe, J.F., Peter, K., Noonan, M., Snyder, T.D., and Baum, K. (2005). Indicators of School Crime and Safety: 2005 (NCES 2006-001/NCJ-210697). National Center for Education Statistics, Institute of Education Sciences, U.S. Department of Education; and Bureau of Justice Statistics, Office of Justice Programs, U.S. Department of Justice. Washington, DC.
Dinkes, R., Cataldi, E.F., Kena, G., and Baum, K. (2006). Indicators of School Crime and Safety: 2006 (NCES 2007-003/NCJ-214262). National Center for Education Statistics, Institute of Education Sciences, U.S. Department of Education; and Bureau of Justice Statistics, Office of Justice Programs, U.S. Department of Justice. Washington, DC.
Dinkes, R., Cataldi, E.F., and Lin-Kelly, W. (2007). Indicators of School Crime and Safety: 2007 (NCES 2008-021/NCJ-219553). National Center for Education Statistics, Institute of Education Sciences, U.S. Department of Education; and Bureau of Justice Statistics, Office of Justice Programs, U.S. Department of Justice. Washington, DC.
Dinkes, R., Kemp, J., and Baum, K. (2009). Indicators of School Crime and Safety: 2008 (NCES 2009-022/NCJ-226343). National Center for Education Statistics, Institute of Education Sciences, U.S. Department of Education; and Bureau of Justice Statistics, Office of Justice Programs, U.S. Department of Justice. Washington, DC.
Dinkes, R., Kemp, J., and Baum, K. (2009). Indicators of School Crime and Safety: 2009 (NCES 2010–012/NCJ 228478). National Center for Education Statistics, Institute of Education Sciences, U.S. Department of Education, and Bureau of Justice Statistics, Office of Justice Programs, U.S. Department of Justice. Washington, DC.
Ruddy, S., Bauer, L., and Neiman, S. (2010). A Profile of Criminal Incidents at School: Results From the 2003–05 National Crime Victimization Survey Crime Incident Report (NCES 2010-318). National Center for Education Statistics, Institute of Education Sciences, U.S. Department of Education. Washington, DC.
Survey Design Kindermann, C., Lynch, J., and Cantor, D. (1997).
Effects of the Redesign on Victimization Estimates (NCJ-164381). U.S. Department of Justice. Washington, DC: Bureau of Justice Statistics.
Crime and Safety Surveys-6
Crime and Safety Surveys NCES HANDBOOK OF SURVEY METHODS
2. SCHOOL SURVEY ON CRIME AND SAFETY
Overview
The School Survey on Crime and Safety (SSOCS) collects extensive crime and safety data from principals and school administrators of public schools. The survey builds on an earlier survey on school crime and safety conducted in 1997 using the Fast Response Survey System (FRSS). SSOCS focuses on incidents of specific crimes and offenses and a variety of specific discipline issues in public schools. It also covers characteristics of school policies, school violence prevention programs and policies, and school characteristics that have been associated with school crime. The survey is conducted with nationally representative samples of regular public primary, middle, high, and combined schools in the 50 states and the District of Columbia. The sample does not include special education, alternative, or vocational schools; schools in the U.S. outlying areas and Puerto Rico, overseas Department of Defense schools, newly closed schools, home schools, Bureau of Indian Education schools, nonregular schools, ungraded schools, and schools with a high grade of kindergarten or lower.
Purpose. To collect detailed information on crime and safety from the schools’ perspective; and to provide estimates of school crime, discipline, disorder, programs, and policies.
Components. SSOCS consists of a single questionnaire that is completed by principals or the person most knowledgeable about crime and safety issues at the school. Sections of the SSOCS questionnaire are composed of items about specific topics, including school practices and programs, parent and community involvement at school, school security, staff training, limitations on crime prevention, frequency of crime and violence at school, number of incidents, disciplinary problems and actions, and school characteristics.
Periodicity. SSOCS is administered to public primary, middle, high, and combined school principals in the spring of even-numbered school years. SSOCS is administered at the end of the school year to allow principals to report the most complete information possible. SSOCS was first administered in the spring of the 1999–2000 school year (SSOCS:2000). It has since been administered in the spring of the 2003–04, 2005–06, 2007–08, and 2009–10 school years (SSOCS:2004,
SSOCS:2006, SSOCS:2008, and SSOCS:2010). A sixth collection is planned for the 2011–12 school year.
Uses of Data SSOCS provides school-level data on crime and safety on the frequency of violence, the nature of the school environment, and the characteristics of school violence prevention programs. Such national data are valuable to policymakers and researchers who need to know what policies and programs are in place, what the level of crime is and how it is changing, and what disciplinary actions schools are taking. Some of the topics that may be examined are the following:
Frequency and types of crimes at schools, including homicide, rape, sexual battery, attacks with or without weapons, robbery, theft, and vandalism;
Frequency and types of disciplinary actions such as expulsions, transfers, and suspensions for selected offenses;
Perceptions of other disciplinary problems such as bullying, verbal abuse, and disorder in the classroom;
School policies and programs concerning crime and safety; and
Pervasiveness of student and teacher involvement in efforts that are intended to prevent or reduce school violence.
The survey data also support analyses of how these topics are related to each other and how they are related to various school characteristics.
Sample Design A stratified sample design is used to select schools for SSOCS. The sampling frame for SSOCS is constructed from the NCES Common Core of Data (CCD) Public Elementary/Secondary School Universe data file. Only “regular” schools (i.e., excluding special education, alternative, or vocational schools; schools in other U.S. jurisdictions; and schools that teach only prekindergarten, kindergarten, or adult education) are eligible for SSOCS. A stratified sample of 3,370 public schools was selected for SSOCS:2000; 3,740 public schools for SSOCS:2004; 3,570 public schools for SSOCS:2006; 3,480 for SSOCS:2008; and 3,476 for SSOCS:2010.
The same general sample design is used for each SSOCS. For sample allocation purposes, strata are
Crime and Safety Surveys-7
Crime and Safety Surveys NCES HANDBOOK OF SURVEY METHODS
defined by instructional level, type of locale, and enrollment size. Black, Hispanic, and other race/ethnicity status, and region were used as sorting variables in the sample selection process for SSOCS:2000, SSOCS:2004, SSOCS:2006, and SSOCS:2008 to induce additional implicit stratification. Beginning with SSOCS:2010, percent White enrolment and region were used as sorting variables. The three explicit and two implicit stratification variables have been shown to be related to school crime and thus create meaningful strata for this survey. The sample is designed to provide reasonably precise cross-sectional estimates for selected subgroups of interest.
Although the same design was used to allocate the sample across strata for all administrations of SSOCS, the calculation of the total initial sample differed between SSOCS:2000 and later SSOCS administrations. Without the experience of prior administrations, stratum response rates had to be estimated for SSOCS:2000 when determining the number of sample cases within each stratum. In contrast, later administrations took advantage of the lessons learned from the prior data collection and used the prior stratum response rates to determine the proper size of the initial sample.
Data Collection and Processing The data collection phase consists of (1) a mailout/ mailback stage; and (2) a telephone follow-up stage.
Reference dates. Data for SSOCS are collected at the end of even-numbered school years to allow principals to report the most complete information possible. For example, data collected in 2000 pertain to the 1999–2000 school year.
Data collection. SSOCS is conducted as a mail survey with telephone follow-up. Advance letters and, in some cases, e-mails, are sent to sampled schools informing them that they have been selected for SSOCS and describing the survey. SSOCS questionnaires are mailed to administrators with a cover letter describing the importance of the survey and a brochure providing additional information about it.
Starting approximately 1-2 weeks after the first questionnaire mailing, follow-up telephone prompts are used to verify that the questionnaire was received and to encourage survey response. As an alternative to replying by mail, data are also accepted by fax submission and by telephone.
After the data collection ends, returned questionnaires are examined for quality and completeness using both manual and computerized edits. Key items are
identified. Depending on the total number of items that have missing or problematic data, and on whether these items have been designated as key items, data quality issues are resolved by recontacting the respondents or by imputation.
Editing. The survey questionnaires are reviewed to match survey responses with the appropriate values to be entered. After the data are key-entered, they are run through a series of editing programs: first, to determine whether a returned questionnaire can be considered complete; subsequently, to check data for consistency, valid data value ranges, and skip patterns.
Weighting Data are weighted to compensate for differential probabilities of selection and to adjust for the effects of nonresponse.
Sample weights allow inferences to be made about the population from which the sample units are drawn. Because of the complex nature of the SSOCS sample design, these weights are necessary to obtain population-based estimates, to minimize bias arising from differences between responding and nonresponding schools, and to calibrate the data to known population characteristics in a way that reduces sampling error.
An initial (base) weight is first determined within each stratum by calculating the ratio of the number of schools available in the sampling frame to the number of schools selected. Because some schools refuse to participate, the responding schools do not necessarily constitute a random sample of the schools in the stratum. In order to reduce the potential of bias from nonresponse, weighting classes are determined by using a statistical algorithm similar to CHAID (i.e., chi-square automatic interaction detector) to partition the sample such that schools within a weighting class are homogeneous with respect to their probability of responding. The predictor variables for the analysis are school instructional level; locale; region; enrollment size; percent enrollment of Black, Hispanic, and other race/ethnicity students (or percent White enrollment for SSOCS:2010 and beyond); student-to-teacher ratio; percentage of students eligible for free or reduced-price lunch; and number of full-time-equivalent teachers. When the number of responding schools in a class is small, the weighting class is combined with another to avoid the possibility of large weights. After combining the necessary classes, the base weights are adjusted to produce nonresponse- adjusted weights, so that the weighted distribution of the responding schools resembles the initial distribution of the total sample.
Crime and Safety Surveys-8
Crime and Safety Surveys NCES HANDBOOK OF SURVEY METHODS
The nonresponse-adjusted weights are then poststratified to calibrate the sample to known population totals in order to reduce bias in the estimates due to undercoverage. Two-dimension margins are set up for the poststratification: (1) instructional level and school enrollment size; and (2) instructional level and locale. An iterative process, known as the raking ratio adjustment, brings the weights into agreement with the known control totals. To be effective, the variables that define the poststrata must be correlated with the outcome of interest (school crime, for example). All three variables—instructional level, school enrollment size, and locale—have been shown to be correlated with school crime (Miller 2004).
Imputation Completed SSOCS surveys contain some level of item nonresponse after the conclusion of the data collection phase. Imputation procedures were used to impute missing values of key items in SSOCS:2000 and missing values of all items in each subsequent SSOCS. All imputed values are flagged as such.
SSOCS:2000. In SSOCS:2000, only the key data items with missing data in the file were imputed. Depending on the type of data to be imputed and the extent of missing values, a number of techniques—including hot-deck imputation, hot-deck imputation with collapsed imputation cell, logical imputation, and mean imputation—were employed.
SSOCS:2004 and beyond. In subsequent collections, imputation procedures were used to create values for all questionnaire items with missing data. This procedural change from SSOCS:2000 was implemented because the analysis of incomplete datasets may cause different users to arrive at different conclusions, depending on how the missing data are treated. The imputation methods used in SSOCS:2004 and later surveys were tailored to the nature of each survey item. Four methods were used: aggregate proportions, logical, best match, and clerical.
Future Plans NCES plans to conduct SSOCS every 2 years in order to provide continued updates on crime and safety in U.S. public schools. SSOCS will next be administered in the 2011–12 school year.
Data Quality and Comparability Sampling Error The estimators of sampling variances for SSOCS statistics take the SSOCS complex sample design into
account. Both replication and Taylor Series methods are used to estimate sampling errors in SSOCS.
SSOCS utilizes the jackknife replication method, which involves partitioning the entire sample into a set of groups (replicates) based on the actual sample design of the survey. Survey estimates can then be produced for each of the replicates by utilizing replicate weights that mimic the actual weighting procedures used in the full sample. The variation in the estimates computed for the replicates can then be used to estimate the sampling errors of the estimates for the full sample. A total of 50 replicate weights were defined for each SSOCS.
Another approach to the valid estimation of sampling errors for complex sample designs is to use a Taylor series approximation. To produce standard errors using a Taylor series program, two variables are required (to identify the stratum and the Primary Sampling Unit [PSU]). The stratum-level variable is the indicator of the variance estimation stratum from which the unit was selected. The PSU is an arbitrary numeric identification number for the unit within the stratum.
Unit Nonresponse A response rate is the ratio of the number of completed questionnaires to the number of cases sampled and eligible to complete the survey. All of the response rates are weighted to account for different probabilities of selection. Schools that are determined to be ineligible to participate in the survey (e.g. special education, alternative, or vocational schools; schools in other U.S. jurisdictions; and schools that teach only prekindergarten, kindergarten, or adult education) are not included in the calculation of response rates. For SSOCS:2000, the weighted response rate was 70 percent and the final number of respondents was about 2,270. For SSOCS:2004, the weighted response rate was 77 percent and the final number of respondents was about 2,770. For SSOCS:2006, the weighted response rate was 81 percent and the final number of respondents was about 2,720. For SSOCS:2008, the weighted response rate was 77 percent and the final number of respondents was about 2,560. As of the date of this publication, response rates were not yet available for SSOCS:2010. (See Table 21 for weighted unit response rates by selected characteristics.)
Nonresponse bias analyses were conducted to determine if substantial bias is introduced due to school nonresponse. In SSOCS:2000, a CHAID analysis was conducted to group table cells to efficiently adjust for nonresponse, and regression analysis was used to confirm the choice of variables that resulted from the CHAID analysis. The study found virtually no
Crime and Safety Surveys-9
Crime and Safety Surveys NCES HANDBOOK OF SURVEY METHODS
significant differences in the estimates when comparing the initial nonresponse adjustments and the additional adjustments that were adopted based on the CHAID analysis. This suggests that much of the variation in response rates was captured in the original sampling strata. The adjustments to the weights were retained, despite their small impact, based on theoretical considerations that suggest they should be effective in attenuating nonresponse biases for a broad range of statistics.
In the 2004, 2006, and 2008 SSOCS, a number of analyses compared nonresponding and responding schools. The base-weighted distributions of the eight sampling frame variables—instructional level; type oflocale; region; school enrollment size; percent Black, Hispanic, and other race/ethnicity enrollment; student-to-teacher ratio; percentage of students eligible for free or reduced-price lunch; and number of full-time- equivalent teachers—were compared for responding and nonresponding schools. Then the differences and the full sample, using the base sampling weight,
between the respondent sample, using the final weight, were examined with respect to all eight sampling frame variables. Generally, the differences were not significant, leading to the conclusion that nonresponse bias is not an issue.
Item Nonresponse Generally, item response rates were quite high. Because a more extensive follow-up was conducted when nonresponse was present for key items, item response rates were often higher for key items than for other questionnaire items.
For the 2008 SSOCS, weighted item response rates for individual items within the questionnaire ranged from 72 to 100 percent.
Of the 241 subitems in the 2008 SSOCS questionnaire, only 13 had response rates below 85 percent, and a nonresponse bias analysis was conducted on these 13 items. The detected bias was not deemed problematic enough to suppress any items from the data file.
Crime and Safety Surveys-10
Crime and Safety Surveys NCES HANDBOOK OF SURVEY METHODS
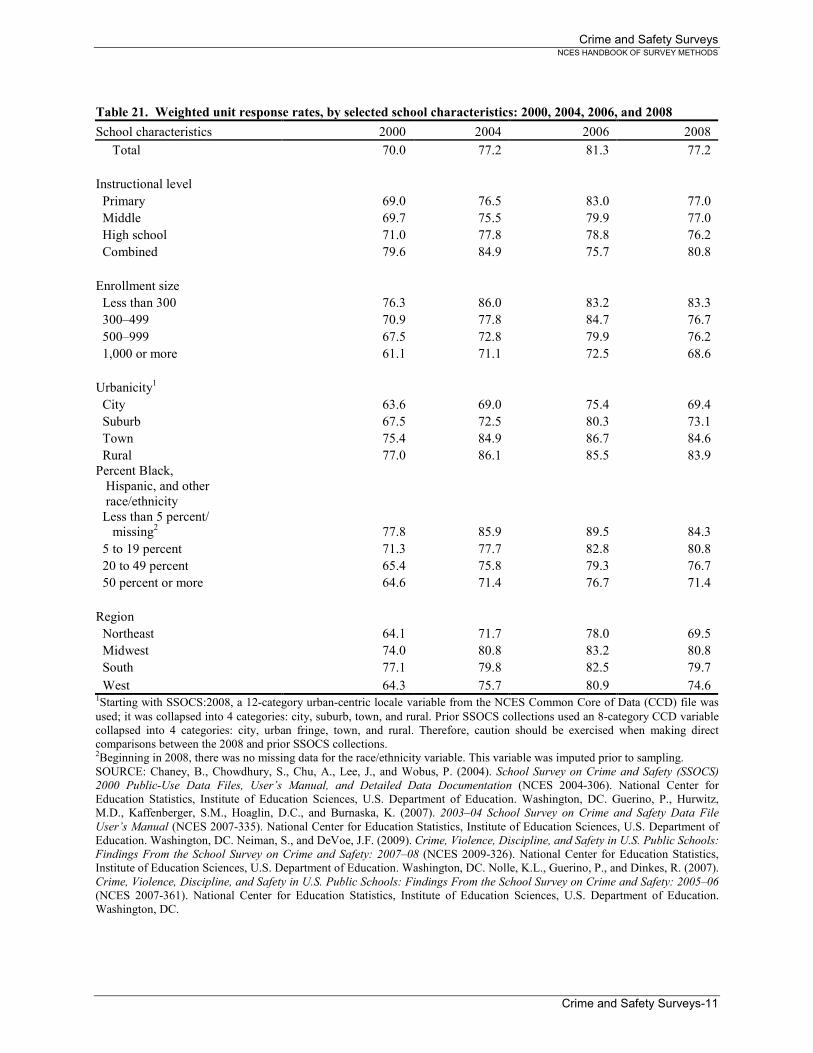
Table 21. Weighted unit response rates, by selected school characteristics: 2000, 2004, 2006, and 2008 School characteristics 2000 2004 2006 2008 Total 70.0 77.2 81.3 77.2 Instructional level Primary 69.0 76.5 83.0 77.0 Middle 69.7 75.5 79.9 77.0 High school 71.0 77.8 78.8 76.2 Combined 79.6 84.9 75.7 80.8 Enrollment size Less than 300 76.3 86.0 83.2 83.3 300–499 70.9 77.8 84.7 76.7 500–999 67.5 72.8 79.9 76.2 1,000 or more 61.1 71.1 72.5 68.6 Urbanicity1 City 63.6 69.0 75.4 69.4 Suburb 67.5 72.5 80.3 73.1 Town 75.4 84.9 86.7 84.6 Rural 77.0 86.1 85.5 83.9 Percent Black, Hispanic, and other race/ethnicity Less than 5 percent/ missing2 77.8 85.9 89.5 84.3 5 to 19 percent 71.3 77.7 82.8 80.8 20 to 49 percent 65.4 75.8 79.3 76.7 50 percent or more 64.6 71.4 76.7 71.4 Region Northeast 64.1 71.7 78.0 69.5 Midwest 74.0 80.8 83.2 80.8 South 77.1 79.8 82.5 79.7 West 64.3 75.7 80.9 1Starting with SSOCS:2008, a 12-category urban-centric locale variable from the NCES Common Core of Data (CCD) file was
74.6
used; it was collapsed into 4 categories: city, suburb, town, and rural. Prior SSOCS collections used an 8-category CCD variablecollapsed into 4 categories: city, urban fringe, town, and rural. Therefore, caution should be exercised when making directcomparisons between the 2008 and prior SSOCS collections. 2Beginning in 2008, there was no missing data for the race/ethnicity variable. This variable was imputed prior to sampling. SOURCE: Chaney, B., Chowdhury, S., Chu, A., Lee, J., and Wobus, P. (2004). School Survey on Crime and Safety (SSOCS)2000 Public-Use Data Files, User’s Manual, and Detailed Data Documentation (NCES 2004-306). National Center forEducation Statistics, Institute of Education Sciences, U.S. Department of Education. Washington, DC. Guerino, P., Hurwitz,M.D., Kaffenberger, S.M., Hoaglin, D.C., and Burnaska, K. (2007). 2003–04 School Survey on Crime and Safety Data FileUser’s Manual (NCES 2007-335). National Center for Education Statistics, Institute of Education Sciences, U.S. Department ofEducation. Washington, DC. Neiman, S., and DeVoe, J.F. (2009). Crime, Violence, Discipline, and Safety in U.S. Public Schools:Findings From the School Survey on Crime and Safety: 2007–08 (NCES 2009-326). National Center for Education Statistics,Institute of Education Sciences, U.S. Department of Education. Washington, DC. Nolle, K.L., Guerino, P., and Dinkes, R. (2007).Crime, Violence, Discipline, and Safety in U.S. Public Schools: Findings From the School Survey on Crime and Safety: 2005–06(NCES 2007-361). National Center for Education Statistics, Institute of Education Sciences, U.S. Department of Education.Washington, DC.
Crime and Safety Surveys-11
Crime and Safety Surveys NCES HANDBOOK OF SURVEY METHODS
Contact Information For content information on SSOCS, contact:
Monica Hill Phone: (202) 502-7379 E-mail: [email protected]
Mailing Address: National Center for Education Statistics Institute of Education Sciences U.S. Department of Education 1990 K Street NW Washington, DC 20006-5651
Methodology and Evaluation Reports General Chaney, B., Chowdhury, S., Chu, A., Lee, J., and
Wobus, P. (2003). 2000 School Survey on Crime and Safety: Detailed Data Documentation (NCES 2004-307). National Center for Education Statistics, Institute of Education Sciences, U.S. Department of Education. Washington, DC.
Chaney, B., Chowdhury, S., Chu, A., Lee, J., and Wobus, P. (2003). 2000 School Survey on Crime and Safety: Public-Use Data File User’s Manual (NCES 2004-308). National Center for Education Statistics, Institute of Education Sciences, U.S. Department of Education. Washington, DC.
Chaney, B., Chowdhury, S., Chu, A., Lee, J., and Wobus, P. (2004). School Survey on Crime and Safety (SSOCS) 2000 Public-Use Data Files, User’s Manual, and Detailed Data Documentation (NCES 2004-306). National Center for Education Statistics, Institute of Education Sciences, U.S. Department of Education. Washington, DC.
Guerino, P., Hurwitz, M.D., Kaffenberger, S.M., Hoaglin, D.C., and Burnaska, K. (2007). 2003–04 School Survey on Crime and Safety Data File User’s Manual (NCES 2007-335). National Center for Education Statistics, Institute of Education Sciences, U.S. Department of Education. Washington, DC.
Izrael, D., and deFriesse, F.A. (2007). 2003–04 School Survey on Crime and Safety Public-Use Data File Codebook (NCES 2007-333). National Center for Education Statistics, Institute of Education Sciences, U.S. Department of Education. Washington, DC.
Ruddy, S.A., Neiman, S., Bauer, L., Swaim, N.L., Thomas, T.L., and Parmer, R.J. (2009). 2005-06 School Survey on Crime and Safety (SSOCS) Survey Documentation for Data Users (NCES 2010-320). National Center for Education Statistics, Institute of Education Sciences, U.S. Department of Education. Washington, DC.
Ruddy, S.A., Neiman, S., Hryczaniuk, C.A., Thomas, .L., and Parmer, R.J. (2010). 2007–08 School Survey on Crime and Safety (SSOCS) Survey Documentation for Public-Use Data File Users (NCES 2010-307). National Center for Education Statistics, Institute of Education Sciences, U.S. Department of Education. Washington, DC.
Tonsager, K., Neiman, S., Hryczaniuk, C., and Guan, X. (2010). School Survey on Crime and Safety: 2007–08, Public-Use Data File Codebook (NCES 2010-334). National Center for Education Statistics, Institute of Education Sciences, U.S. Department of Education. Washington, DC.
Wallace, E.C., Neiman, S., Foster, K.M., and Guan, X. (2009). 2005–06 School Survey on Crime and Safety (SSOCS) Public-Use Data File Codebook (NCES 2009-312). National Center for Education Statistics, Institute of Education Sciences, U.S. Department of Education. Washington, DC.
Uses of Data DeVoe, J.F., Peter, K., Noonan, M., Snyder, T.D., and
Baum, K. (2005). Indicators of School Crime and Safety: 2005 (NCES 2006-001/NCJ-210697). National Center for Education Statistics, Institute of Education Sciences, U.S. Department of Education; and Bureau of Justice Statistics, Office of Justice Programs, U.S. Department of Justice. Washington, DC.
Dinkes, R., Cataldi, E.F., Kena, G., and Baum, K. (2006). Indicators of School Crime and Safety: 2006 (NCES 2007-003/NCJ 214262). National Center for Education Statistics, Institute of Education Sciences, U.S. Department of Education; and Bureau of Justice Statistics, Office of Justice Programs, U.S. Department of Justice. Washington, DC.
Dinkes, R., Cataldi, E.F., and Lin-Kelly, W. (2007). Indicators of School Crime and Safety: 2007 (NCES 2008-021/NCJ-219553). National Center for Education Statistics, Institute of Education Sciences, U.S. Department of Education; and Bureau of Justice Statistics, Office of Justice Programs, U.S. Department of Justice. Washington, DC.
Crime and Safety Surveys-12
Crime and Safety Surveys NCES HANDBOOK OF SURVEY METHODS
Dinkes, R., Kemp, J., and Baum, K. (2009). Indicators of School Crime and Safety: 2008 (NCES 2009–022/NCJ 226343). National Center for Education Statistics, Institute of Education Sciences, U.S. Department of Education, and Bureau of Justice Statistics, Office of Justice Programs, U.S. Department of Justice. Washington, DC.
Guerino, P., Hurwitz, M.D., Noonan, M.E., and Kaffenberger, S.M. (2006). Crime, Violence, Discipline, and Safety in U.S. Public Schools: Findings From the School Survey on Crime and Safety: 2003–04 (NCES 2007-302REV). National Center for Education Statistics, Institute of Education Sciences, U.S. Department of Education. Washington, DC.
Miller, A.K. (2004). Violence in U.S. Public Schools: 2000 School Survey on Crime and Safety (NCES
2004-314REV). National Center for Education Statistics, Institute of Education Sciences, U.S. Department of Education. Washington, DC.
Neiman, S., and DeVoe, J.F. (2009). Crime, Violence, Discipline, and Safety in U.S. Public Schools: Findings From the School Survey on Crime and Safety: 2007–08 (NCES 2009-326). National Center for Education Statistics, Institute of Education Sciences, U.S. Department of Education. Washington, DC.
Nolle, K.L., Guerino, P., and Dinkes, R. (2007). Crime, Violence, Discipline, and Safety in U.S. Public Schools: Findings From the School Survey on Crime and Safety: 2005–06 (NCES 2007-361). National Center for Education Statistics, Institute of Education Sciences, U.S. Department of Education. Washington, DC.
Crime and Safety Surveys-13