Embed Size (px)
Citation preview
Stat ist ics in focus Population and social conditions Authors: Cynthia TAVARES, Geoffrey THOMAS
58/2010
Crime and Criminal Justice
Recent work at European level to improve the comparability of the data makes it possible to make some analysis of trends in crime and criminal justice. National sources of information about crime show considerable differences in approach and coverage, which makes it necessary to exercise caution in making direct comparisons between countries.
Main findings The total number of crimes recorded by the police in the European Union is decreasing. Until 2002, the trend was upwards. The countries where the decreases are most noticeable include the United Kingdom, the Netherlands and France. In some of the new Member States, crime rates peaked slightly later, but here also they are now falling.
In a few southern countries such as Portugal, Slovenia, Spain, Italy and Cyprus, crime rates have risen. There is also some indication among the Nordic Member States that, after a period of decreasing crime, the trend is now upwards. Underlying the total crime trends, there are different tendencies for specific types of offence. For the EU as a whole, police recorded instances of domestic burglary and drug trafficking have remained virtually unchanged since 2005, while violent crime (including robbery) and thefts of motor vehicles have fallen. The prison population rate (per head of population) remains generally much higher in most countries in the eastern part of the European Union than in the west, but it is gradually falling, while the prison populations have grown in some western Member States such as Spain and the United Kingdom.
Figure 1: Crime trends in the European Union 2005 – 2008*
Total crime
Violent crime
Robbery
Domestic burglary
Motor vehicle theft
Drug trafficking
80
85
90
95
100
2005 2006 2007 2008
Off
ence
s re
cord
ed b
y th
e po
lice,
Inde
x 20
05 =
100
* for countries where consistent time series are available (23 or 24 EU Member States)
Source: Eurostat (crim_gen)
2 58/2010 — Statistics in focus
Crimes recorded by the police
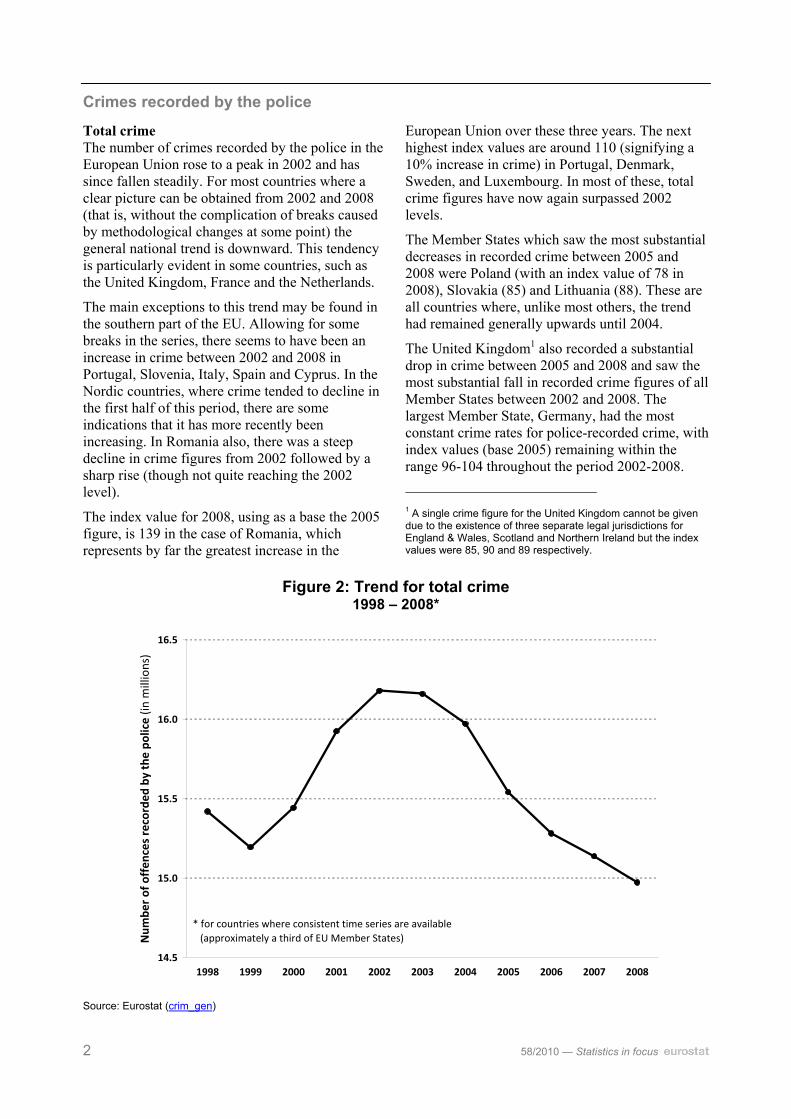
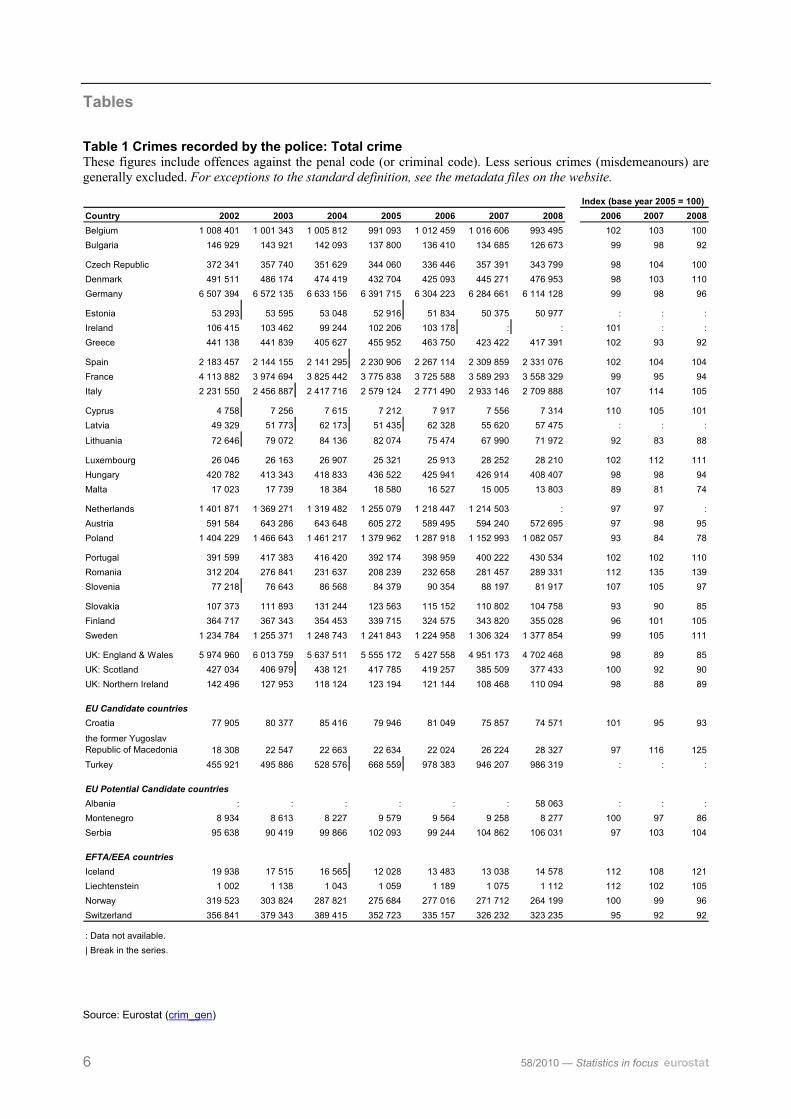
Total crime The number of crimes recorded by the police in the European Union rose to a peak in 2002 and has since fallen steadily. For most countries where a clear picture can be obtained from 2002 and 2008 (that is, without the complication of breaks caused by methodological changes at some point) the general national trend is downward. This tendency is particularly evident in some countries, such as the United Kingdom, France and the Netherlands.
The main exceptions to this trend may be found in the southern part of the EU. Allowing for some breaks in the series, there seems to have been an increase in crime between 2002 and 2008 in Portugal, Slovenia, Italy, Spain and Cyprus. In the Nordic countries, where crime tended to decline in the first half of this period, there are some indications that it has more recently been increasing. In Romania also, there was a steep decline in crime figures from 2002 followed by a sharp rise (though not quite reaching the 2002 level).
The index value for 2008, using as a base the 2005 figure, is 139 in the case of Romania, which represents by far the greatest increase in the
European Union over these three years. The next highest index values are around 110 (signifying a 10% increase in crime) in Portugal, Denmark, Sweden, and Luxembourg. In most of these, total crime figures have now again surpassed 2002 levels.
The Member States which saw the most substantial decreases in recorded crime between 2005 and 2008 were Poland (with an index value of 78 in 2008), Slovakia (85) and Lithuania (88). These are all countries where, unlike most others, the trend had remained generally upwards until 2004.
The United Kingdom1 also recorded a substantial drop in crime between 2005 and 2008 and saw the most substantial fall in recorded crime figures of all Member States between 2002 and 2008. The largest Member State, Germany, had the most constant crime rates for police-recorded crime, with index values (base 2005) remaining within the range 96-104 throughout the period 2002-2008.
1 A single crime figure for the United Kingdom cannot be given due to the existence of three separate legal jurisdictions for England & Wales, Scotland and Northern Ireland but the index values were 85, 90 and 89 respectively.
Figure 2: Trend for total crime 1998 – 2008*
14.5
15.0
15.5
16.0
16.5
1998 1999 2000 2001 2002 2003 2004 2005 2006 2007 2008
Num
ber
of o
ffen
ces
reco
rded
by
the
polic
e (in
mill
ions
)
* for countries where consistent time series are available (approximately a third of EU Member States)
Source: Eurostat (crim_gen)
Statistics in focus — 58/2010 3
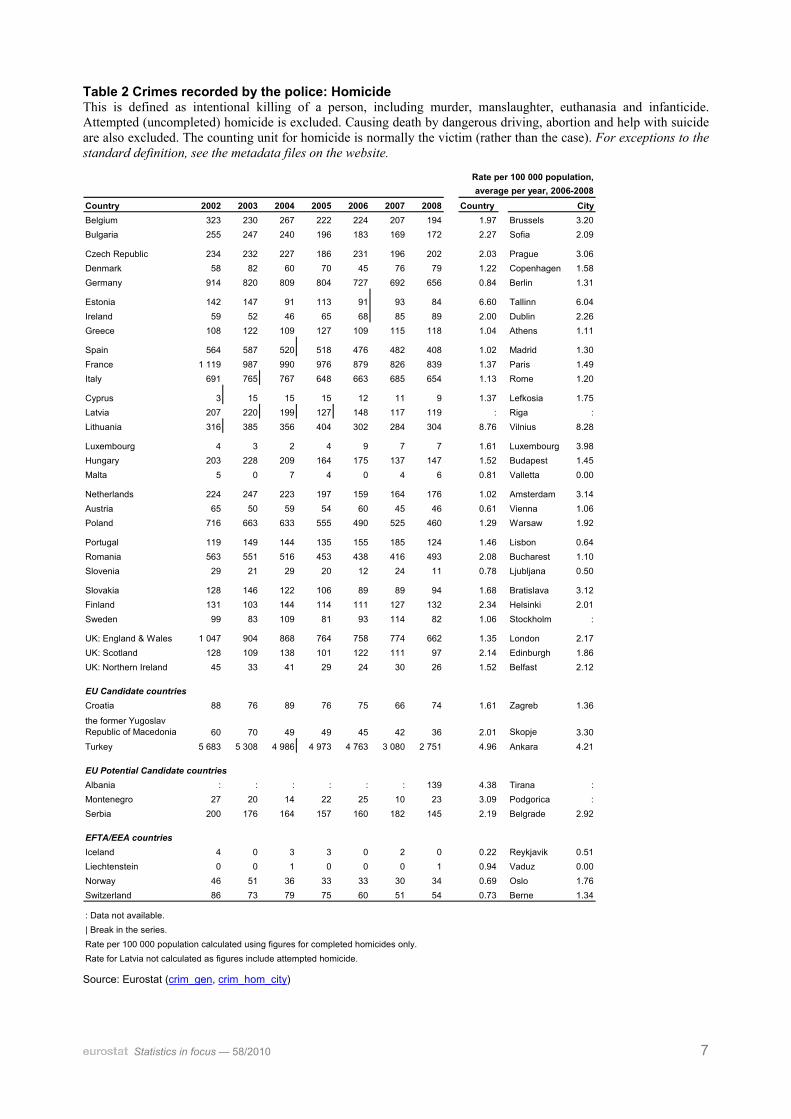
Homicide Homicide is defined as the intentional killing of a person, including murder, manslaughter, euthanasia and infanticide. It excludes death by dangerous driving, abortion and help with suicide. Homicide is fairly universally reported because of its seriousness, and definitions vary less between countries than for some other types of crime, so that the figures may be regarded as more comparable between countries than for other types of crime. Unlike other offences, the counting unit for homicide is normally the victim (rather than the case).
The figures suggest that Lithuania and Estonia have by far the highest incidence of homicides, with over six cases annually per hundred thousand population on average during the period 2005-2008.
The only other countries reporting more than two cases a year per hundred thousand population were Finland, Bulgaria, Scotland, Romania, the Czech Republic and Ireland, while the lowest rates (less than one per hundred thousand) were observed in Austria, Slovenia and Germany. The fact that homicide figures are often low can sometimes distort the trends; for this reason indices have not been calculated. As a general rule, national homicide rates fell or remained stable.
Homicide rates are available for EU capitals and these are typically rather higher than for the country as a whole. They follow generally the national trends, with the highest figures being reported in Vilnius (about 8 cases per hundred thousand population) and Tallinn (about 6 cases).
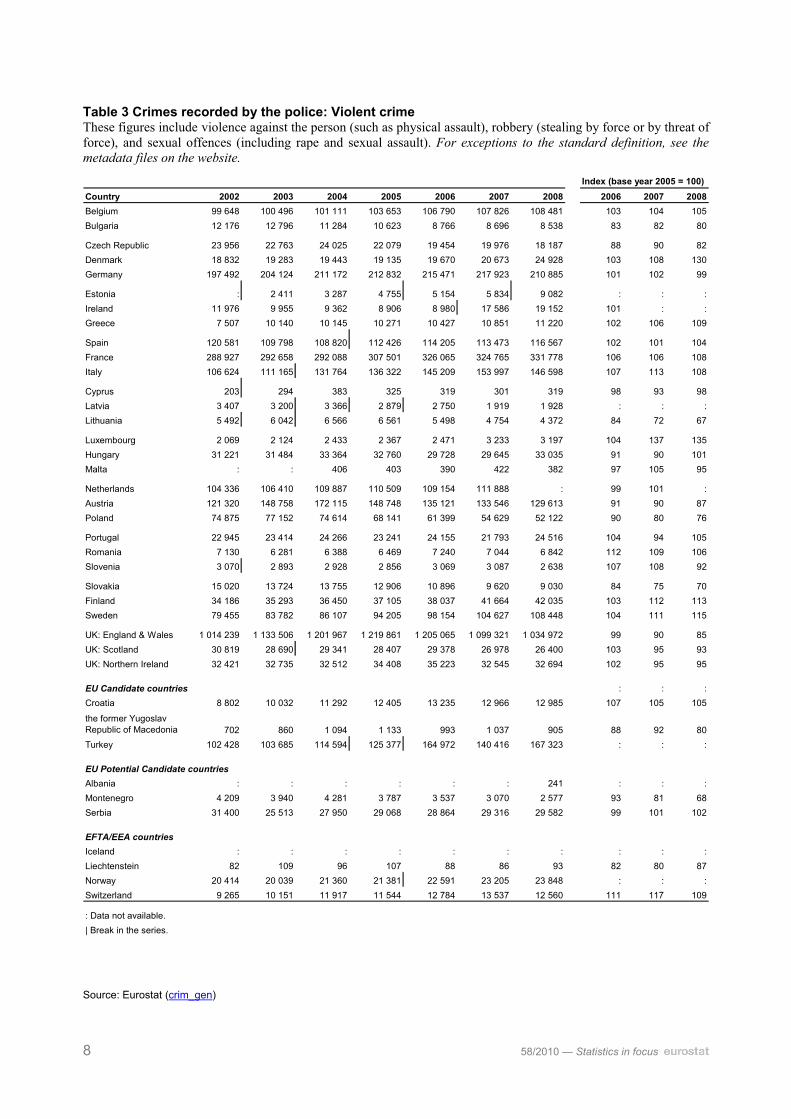
Violent crime Violent crime includes violence against the person (such as physical assault), robbery (stealing by force or threat of force) and sexual offences (including rape and sexual assault). The general trend since 2002 has been for such offences to rise, and in the period 2005-8 this remained noticeable in most countries in western Europe. This is particularly the case for the Nordic countries as the highest index values for 2008 (using 2005 as base) included Denmark (130), Sweden (115) and Finland (113).
However this was outweighed by a decline in the number of violent crimes in the eastern part of the European Union, notably in Lithuania (with a 2008 index value of 67 based on the 2005 figure), Slovakia (70), Poland (76), Bulgaria (80) and the Czech Republic (82). The total number of cases in the European Union consequently fell by about six percent over the three-year period.
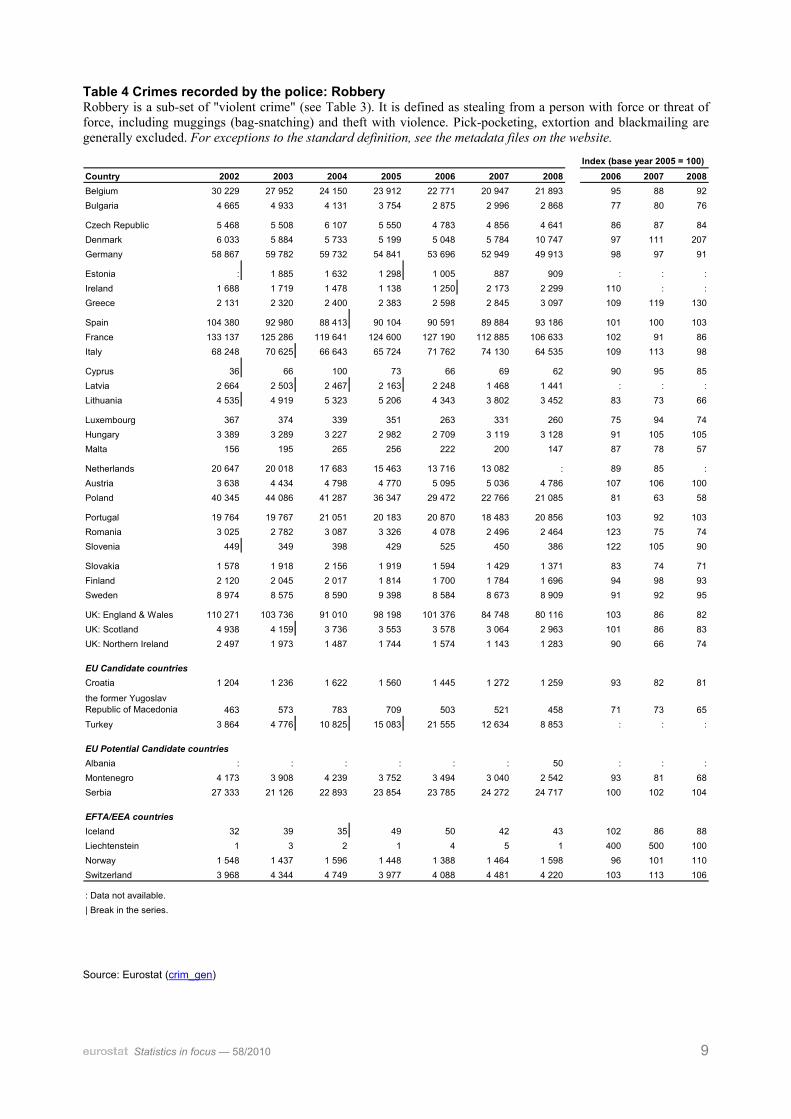
Robbery Robbery is a sub-set of violent crime, and is defined as stealing by force or threat of force, including such offences as mugging and bag-snatching. In Denmark such crimes (as recorded by the police) doubled between 2005 and 2008, accounting almost entirely for the rise in violent crime in that country, but elsewhere only Greece recorded a substantial increase. In most other countries, cases of robbery dropped, even in countries where violent crime generally was increasing (such as Luxembourg, Sweden, Finland, France and Italy). Even larger falls were recorded in those countries (mostly new Member States) with generally declining violent crime rates, such as Poland, Lithuania, Slovakia, Romania and Bulgaria. The total number of offences in the European Union dropped by about ten percent between 2005 and 2008.
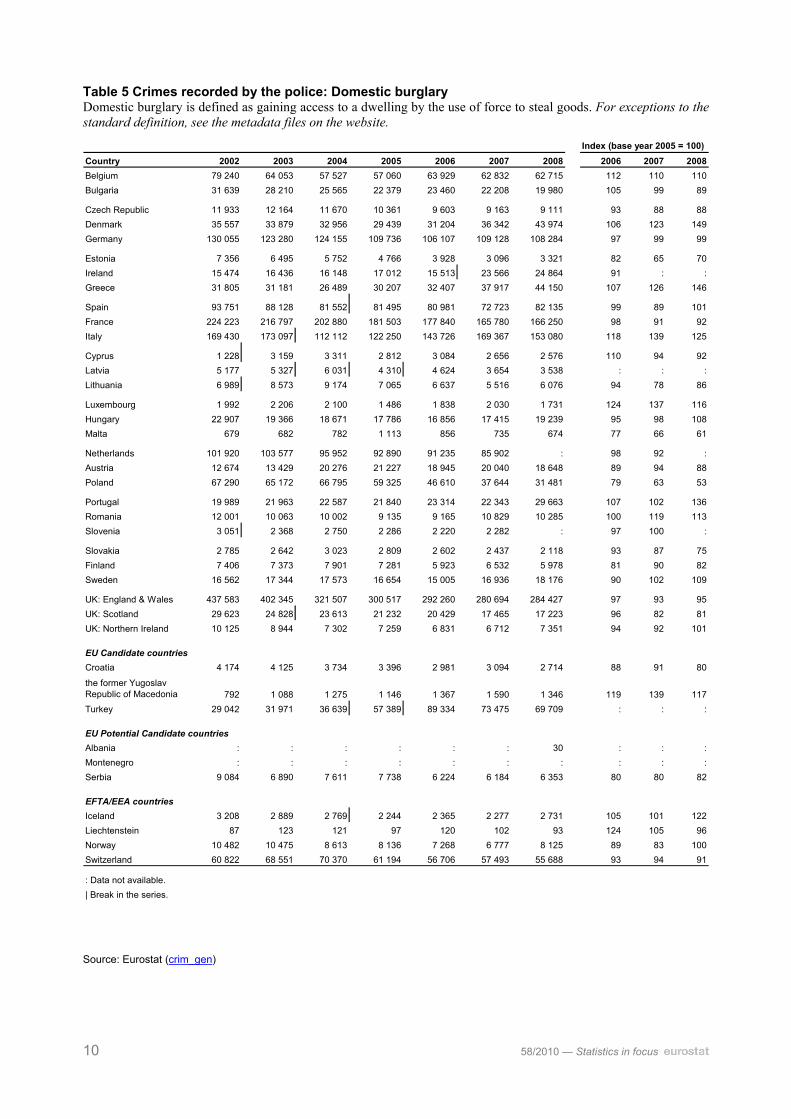
Domestic burglary Burglary, defined as gaining access to a dwelling by force in order to steal goods, has been generally on the decrease since 2002. This tendency, which may be associated with improved security measures such as locks and alarm systems, has been especially noticeable recently in eastern European countries. In Poland and Estonia, for example, there were less than half as many burglaries in 2008 than in 2002, and France and the United Kingdom also experienced falls of at least a quarter.
Over the most recent three years for which figures are available, cases of domestic burglary continued to fall in a number of countries, with the lowest index values for 2008 (based on the 2005 figure) being observed in the new Member States Poland (53), Estonia (70) and Slovakia (75). However in other (mostly western) Member States there are some indications that burglary is one of the crimes which are again on the rise. In Denmark and Greece it rose by almost a half between 2005 and 2008 (giving index values of 149 and 146 respectively), with noticeable increases also in Portugal (136), Italy (125), Luxembourg (116), Romania (113) and Belgium (110). The overall result is therefore that the total number of offences shows little change between 2005 and 2008.
4 58/2010 — Statistics in focus
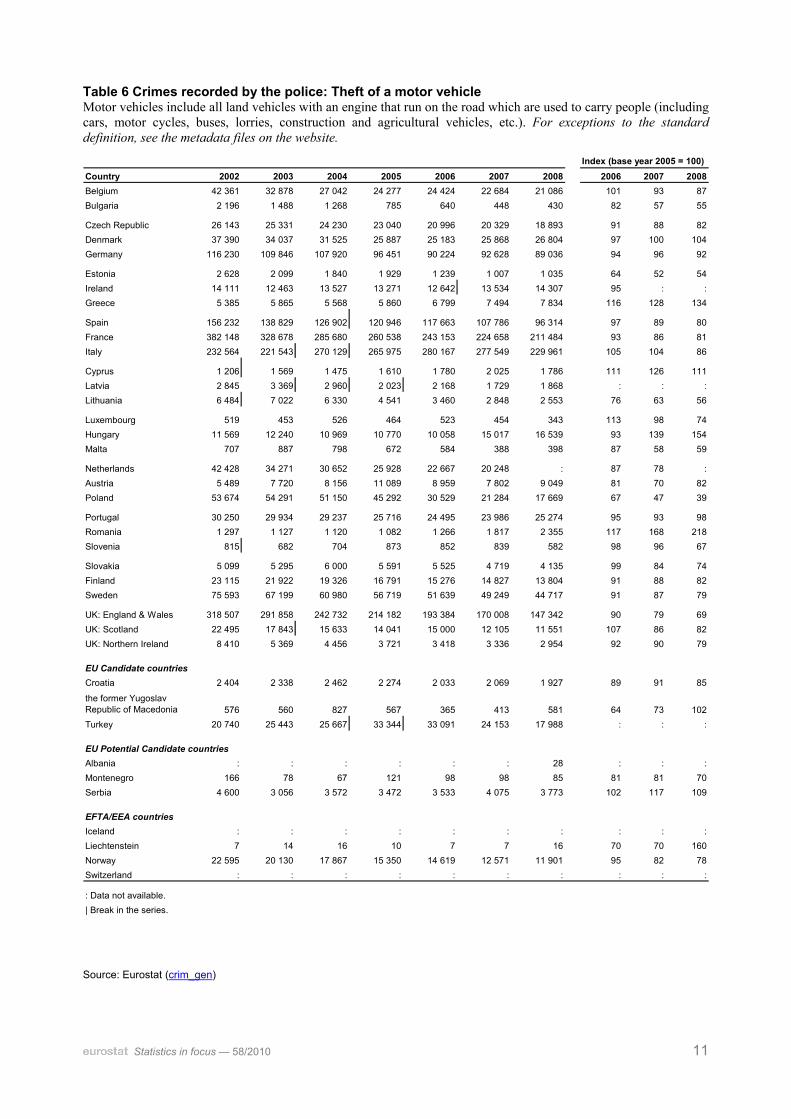
Theft of a motor vehicle As with alarm systems for buildings, there have been numerous technical improvements in recent years in car security. This may explain the general trend for a decline in thefts of vehicles (the figures include not only cars but also motorcycles, buses, lorries, construction and agricultural vehicles).
Between 2005 and 2008 vehicle thefts continued to decrease sharply in the great majority of countries, and in some eastern Member States the drops were dramatic, over 60% in Poland and slightly less than a half in Estonia, Bulgaria and Lithuania. In most western European countries the decrease tended to be nearer 20%. The outstanding exception to the general trend is Romania, where vehicle thefts more than doubled between 2005 and 2008. Neighbouring Hungary also recorded a rise of over a half in this period, with other noticeable increases being observed in Greece and Cyprus, but for the European Union as a whole there was a decrease of about one-fifth.
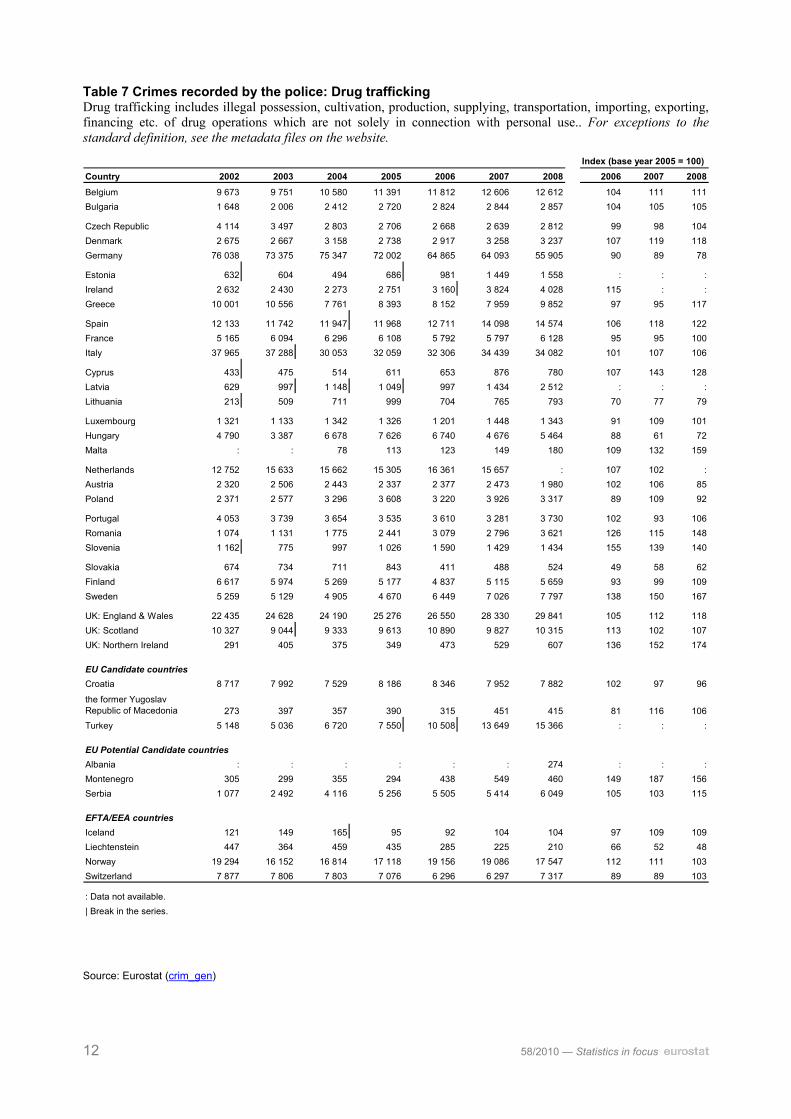
Drug trafficking Drug trafficking (that is, illegal possession, cultivation, production, supplying, transportation, importing, exporting and financing of drugs operations) has generally been increasing steadily since 2002. This trend slowed over the period 2005 to 2008, with the total number of offences remaining fairly stable, but there were considerable variations between countries. Increases of about a half were observed in Sweden, Romania and Slovenia. Less marked, but still substantial, rises took place in Cyprus, Spain, Denmark, Greece and the United Kingdom (particularly in Northern Ireland).
The countries which reported a drop in drug-trafficking offences between 2005 and 2008 were mostly eastern Member States which had experienced sharp increases in the immediately preceding period (notably Slovakia, Hungary, Lithuania and Poland). However Germany has witnessed a steady gradual fall in crimes of this type (over a third since 2002), and a similar if less consistent trend is visible in neighbouring Austria.
Prison population
The prison population figures include all types of prison, including adult and juvenile facilities and pre-trial detainees, but exclude non-criminal prisoners held for administrative purposes such as pending investigation into their immigration status.
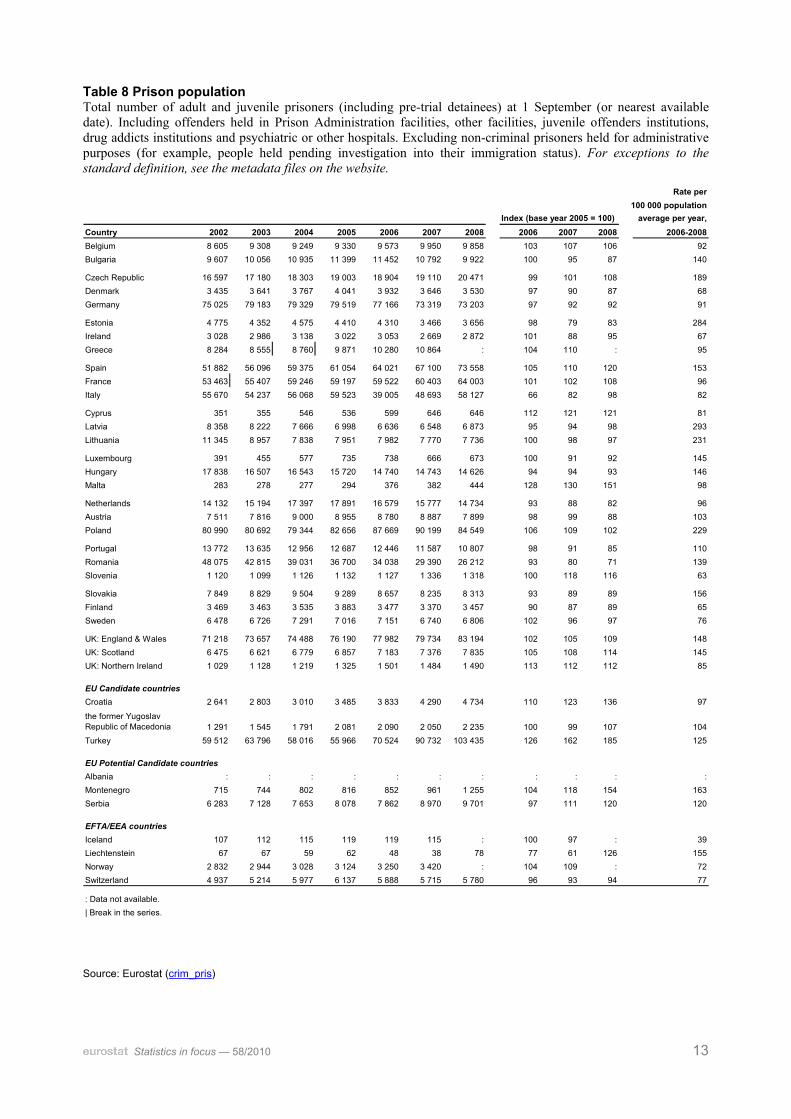
For the period 2006 – 2008, there were, on average, about 123 prisoners per 100 000 general population in the EU Member States. The highest rates (more than 150 per 100 000 population) are found in the newer Member States of eastern Europe (Latvia, Estonia, Lithuania, Poland, Czech Republic and Slovakia). The lowest rates are in the Nordic Member States (Sweden, Finland and Denmark), Ireland and Slovenia, which all have fewer than 80 prisoners per 100 000 population. This compares with an incarceration rate of 775 in the USA.
The main countries where the prison population is increasing are Spain and the United Kingdom (except Northern Ireland). These countries now have rates comparable with those in the eastern European Member States. In most other countries prison populations are falling, a trend observable in countries as diverse as the Nordic Member States, where rates are anyway low, and in eastern European countries with high figures, such as Latvia and Estonia.
A number of EU candidate or potential candidate countries have recently recorded considerable increases in their prison populations, particularly Turkey, Croatia, Montenegro and Serbia.
Statistics in focus — 58/2010 5
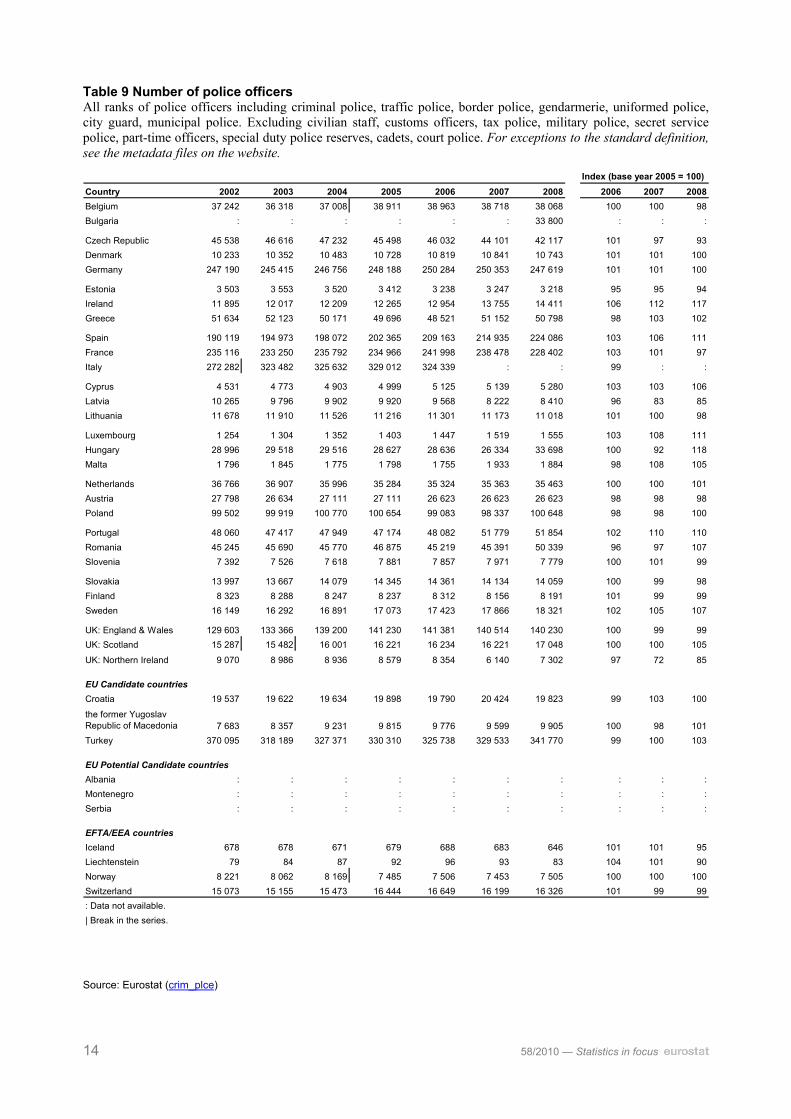
Police officers
It is difficult to compare the numbers of police officers in different countries, as definitions vary. The figures available for most countries include criminal police, traffic police, border police, gendarmerie, uniformed police, city guard and municipal police, while excluding civilian staff, customs officers, tax police, military police, secret service police, special duty police reserves, cadets and court police.
Countries where police numbers are increasing include Hungary, Ireland, Luxembourg, Spain and Portugal. There are fewer police forces which have declined in numbers since 2005, but these include Estonia and Czech Republic and, most substantially, Latvia and Northern Ireland.
6 58/2010 — Statistics in focus
Tables
Table 1 Crimes recorded by the police: Total crime These figures include offences against the penal code (or criminal code). Less serious crimes (misdemeanours) are generally excluded. For exceptions to the standard definition, see the metadata files on the website.
Index (base year 2005 = 100)Country 2002 2003 2004 2005 2006 2007 2008 2006 2007 2008Belgium 1 008 401 1 001 343 1 005 812 991 093 1 012 459 1 016 606 993 495 102 103 100Bulgaria 146 929 143 921 142 093 137 800 136 410 134 685 126 673 99 98 92
Czech Republic 372 341 357 740 351 629 344 060 336 446 357 391 343 799 98 104 100Denmark 491 511 486 174 474 419 432 704 425 093 445 271 476 953 98 103 110Germany 6 507 394 6 572 135 6 633 156 6 391 715 6 304 223 6 284 661 6 114 128 99 98 96
Estonia 53 293 53 595 53 048 52 916 51 834 50 375 50 977 : : :Ireland 106 415 103 462 99 244 102 206 103 178 : : 101 : :Greece 441 138 441 839 405 627 455 952 463 750 423 422 417 391 102 93 92
Spain 2 183 457 2 144 155 2 141 295 2 230 906 2 267 114 2 309 859 2 331 076 102 104 104France 4 113 882 3 974 694 3 825 442 3 775 838 3 725 588 3 589 293 3 558 329 99 95 94Italy 2 231 550 2 456 887 2 417 716 2 579 124 2 771 490 2 933 146 2 709 888 107 114 105
Cyprus 4 758 7 256 7 615 7 212 7 917 7 556 7 314 110 105 101Latvia 49 329 51 773 62 173 51 435 62 328 55 620 57 475 : : :
Lithuania 72 646 79 072 84 136 82 074 75 474 67 990 71 972 92 83 88
Luxembourg 26 046 26 163 26 907 25 321 25 913 28 252 28 210 102 112 111Hungary 420 782 413 343 418 833 436 522 425 941 426 914 408 407 98 98 94Malta 17 023 17 739 18 384 18 580 16 527 15 005 13 803 89 81 74
Netherlands 1 401 871 1 369 271 1 319 482 1 255 079 1 218 447 1 214 503 : 97 97 :Austria 591 584 643 286 643 648 605 272 589 495 594 240 572 695 97 98 95Poland 1 404 229 1 466 643 1 461 217 1 379 962 1 287 918 1 152 993 1 082 057 93 84 78
Portugal 391 599 417 383 416 420 392 174 398 959 400 222 430 534 102 102 110Romania 312 204 276 841 231 637 208 239 232 658 281 457 289 331 112 135 139Slovenia 77 218 76 643 86 568 84 379 90 354 88 197 81 917 107 105 97
Slovakia 107 373 111 893 131 244 123 563 115 152 110 802 104 758 93 90 85Finland 364 717 367 343 354 453 339 715 324 575 343 820 355 028 96 101 105Sweden 1 234 784 1 255 371 1 248 743 1 241 843 1 224 958 1 306 324 1 377 854 99 105 111
UK: England & Wales 5 974 960 6 013 759 5 637 511 5 555 172 5 427 558 4 951 173 4 702 468 98 89 85UK: Scotland 427 034 406 979 438 121 417 785 419 257 385 509 377 433 100 92 90UK: Northern Ireland 142 496 127 953 118 124 123 194 121 144 108 468 110 094 98 88 89
EU Candidate countriesCroatia 77 905 80 377 85 416 79 946 81 049 75 857 74 571 101 95 93
the former Yugoslav Republic of Macedonia 18 308 22 547 22 663 22 634 22 024 26 224 28 327 97 116 125Turkey 455 921 495 886 528 576 668 559 978 383 946 207 986 319 : : :
EU Potential Candidate countriesAlbania : : : : : : 58 063 : : :Montenegro 8 934 8 613 8 227 9 579 9 564 9 258 8 277 100 97 86Serbia 95 638 90 419 99 866 102 093 99 244 104 862 106 031 97 103 104
EFTA/EEA countriesIceland 19 938 17 515 16 565 12 028 13 483 13 038 14 578 112 108 121Liechtenstein 1 002 1 138 1 043 1 059 1 189 1 075 1 112 112 102 105Norway 319 523 303 824 287 821 275 684 277 016 271 712 264 199 100 99 96Switzerland 356 841 379 343 389 415 352 723 335 157 326 232 323 235 95 92 92
: Data not available.| Break in the series.
Source: Eurostat (crim_gen)
Statistics in focus — 58/2010 7
Table 2 Crimes recorded by the police: Homicide This is defined as intentional killing of a person, including murder, manslaughter, euthanasia and infanticide. Attempted (uncompleted) homicide is excluded. Causing death by dangerous driving, abortion and help with suicide are also excluded. The counting unit for homicide is normally the victim (rather than the case). For exceptions to the standard definition, see the metadata files on the website.
Rate per 100 000 population,average per year, 2006-2008
Country 2002 2003 2004 2005 2006 2007 2008 Country CityBelgium 323 230 267 222 224 207 194 1.97 Brussels 3.20Bulgaria 255 247 240 196 183 169 172 2.27 Sofia 2.09
Czech Republic 234 232 227 186 231 196 202 2.03 Prague 3.06Denmark 58 82 60 70 45 76 79 1.22 Copenhagen 1.58Germany 914 820 809 804 727 692 656 0.84 Berlin 1.31
Estonia 142 147 91 113 91 93 84 6.60 Tallinn 6.04Ireland 59 52 46 65 68 85 89 2.00 Dublin 2.26Greece 108 122 109 127 109 115 118 1.04 Athens 1.11
Spain 564 587 520 518 476 482 408 1.02 Madrid 1.30France 1 119 987 990 976 879 826 839 1.37 Paris 1.49Italy 691 765 767 648 663 685 654 1.13 Rome 1.20
Cyprus 3 15 15 15 12 11 9 1.37 Lefkosia 1.75Latvia 207 220 199 127 148 117 119 : Riga :Lithuania 316 385 356 404 302 284 304 8.76 Vilnius 8.28
Luxembourg 4 3 2 4 9 7 7 1.61 Luxembourg 3.98Hungary 203 228 209 164 175 137 147 1.52 Budapest 1.45Malta 5 0 7 4 0 4 6 0.81 Valletta 0.00
Netherlands 224 247 223 197 159 164 176 1.02 Amsterdam 3.14Austria 65 50 59 54 60 45 46 0.61 Vienna 1.06Poland 716 663 633 555 490 525 460 1.29 Warsaw 1.92
Portugal 119 149 144 135 155 185 124 1.46 Lisbon 0.64Romania 563 551 516 453 438 416 493 2.08 Bucharest 1.10Slovenia 29 21 29 20 12 24 11 0.78 Ljubljana 0.50
Slovakia 128 146 122 106 89 89 94 1.68 Bratislava 3.12Finland 131 103 144 114 111 127 132 2.34 Helsinki 2.01Sweden 99 83 109 81 93 114 82 1.06 Stockholm :
UK: England & Wales 1 047 904 868 764 758 774 662 1.35 London 2.17UK: Scotland 128 109 138 101 122 111 97 2.14 Edinburgh 1.86UK: Northern Ireland 45 33 41 29 24 30 26 1.52 Belfast 2.12
EU Candidate countriesCroatia 88 76 89 76 75 66 74 1.61 Zagreb 1.36
the former Yugoslav Republic of Macedonia 60 70 49 49 45 42 36 2.01 Skopje 3.30Turkey 5 683 5 308 4 986 4 973 4 763 3 080 2 751 4.96 Ankara 4.21
EU Potential Candidate countriesAlbania : : : : : : 139 4.38 Tirana :Montenegro 27 20 14 22 25 10 23 3.09 Podgorica :Serbia 200 176 164 157 160 182 145 2.19 Belgrade 2.92
EFTA/EEA countriesIceland 4 0 3 3 0 2 0 0.22 Reykjavik 0.51Liechtenstein 0 0 1 0 0 0 1 0.94 Vaduz 0.00Norway 46 51 36 33 33 30 34 0.69 Oslo 1.76Switzerland 86 73 79 75 60 51 54 0.73 Berne 1.34
: Data not available.| Break in the series.Rate per 100 000 population calculated using figures for completed homicides only.Rate for Latvia not calculated as figures include attempted homicide. Source: Eurostat (crim_gen, crim_hom_city)
8 58/2010 — Statistics in focus
Table 3 Crimes recorded by the police: Violent crime These figures include violence against the person (such as physical assault), robbery (stealing by force or by threat of force), and sexual offences (including rape and sexual assault). For exceptions to the standard definition, see the metadata files on the website.
Index (base year 2005 = 100)Country 2002 2003 2004 2005 2006 2007 2008 2006 2007 2008Belgium 99 648 100 496 101 111 103 653 106 790 107 826 108 481 103 104 105Bulgaria 12 176 12 796 11 284 10 623 8 766 8 696 8 538 83 82 80
Czech Republic 23 956 22 763 24 025 22 079 19 454 19 976 18 187 88 90 82Denmark 18 832 19 283 19 443 19 135 19 670 20 673 24 928 103 108 130Germany 197 492 204 124 211 172 212 832 215 471 217 923 210 885 101 102 99
Estonia : 2 411 3 287 4 755 5 154 5 834 9 082 : : :Ireland 11 976 9 955 9 362 8 906 8 980 17 586 19 152 101 : :Greece 7 507 10 140 10 145 10 271 10 427 10 851 11 220 102 106 109
Spain 120 581 109 798 108 820 112 426 114 205 113 473 116 567 102 101 104France 288 927 292 658 292 088 307 501 326 065 324 765 331 778 106 106 108Italy 106 624 111 165 131 764 136 322 145 209 153 997 146 598 107 113 108
Cyprus 203 294 383 325 319 301 319 98 93 98Latvia 3 407 3 200 3 366 2 879 2 750 1 919 1 928 : : :Lithuania 5 492 6 042 6 566 6 561 5 498 4 754 4 372 84 72 67
Luxembourg 2 069 2 124 2 433 2 367 2 471 3 233 3 197 104 137 135Hungary 31 221 31 484 33 364 32 760 29 728 29 645 33 035 91 90 101Malta : : 406 403 390 422 382 97 105 95
Netherlands 104 336 106 410 109 887 110 509 109 154 111 888 : 99 101 :Austria 121 320 148 758 172 115 148 748 135 121 133 546 129 613 91 90 87Poland 74 875 77 152 74 614 68 141 61 399 54 629 52 122 90 80 76
Portugal 22 945 23 414 24 266 23 241 24 155 21 793 24 516 104 94 105Romania 7 130 6 281 6 388 6 469 7 240 7 044 6 842 112 109 106Slovenia 3 070 2 893 2 928 2 856 3 069 3 087 2 638 107 108 92
Slovakia 15 020 13 724 13 755 12 906 10 896 9 620 9 030 84 75 70Finland 34 186 35 293 36 450 37 105 38 037 41 664 42 035 103 112 113Sweden 79 455 83 782 86 107 94 205 98 154 104 627 108 448 104 111 115
UK: England & Wales 1 014 239 1 133 506 1 201 967 1 219 861 1 205 065 1 099 321 1 034 972 99 90 85UK: Scotland 30 819 28 690 29 341 28 407 29 378 26 978 26 400 103 95 93UK: Northern Ireland 32 421 32 735 32 512 34 408 35 223 32 545 32 694 102 95 95
EU Candidate countries : : :Croatia 8 802 10 032 11 292 12 405 13 235 12 966 12 985 107 105 105
the former Yugoslav Republic of Macedonia 702 860 1 094 1 133 993 1 037 905 88 92 80Turkey 102 428 103 685 114 594 125 377 164 972 140 416 167 323 : : :
EU Potential Candidate countriesAlbania : : : : : : 241 : : :Montenegro 4 209 3 940 4 281 3 787 3 537 3 070 2 577 93 81 68Serbia 31 400 25 513 27 950 29 068 28 864 29 316 29 582 99 101 102
EFTA/EEA countriesIceland : : : : : : : : : :Liechtenstein 82 109 96 107 88 86 93 82 80 87Norway 20 414 20 039 21 360 21 381 22 591 23 205 23 848 : : :Switzerland 9 265 10 151 11 917 11 544 12 784 13 537 12 560 111 117 109
: Data not available.| Break in the series.
Source: Eurostat (crim_gen)
Statistics in focus — 58/2010 9
Table 4 Crimes recorded by the police: Robbery Robbery is a sub-set of "violent crime" (see Table 3). It is defined as stealing from a person with force or threat of force, including muggings (bag-snatching) and theft with violence. Pick-pocketing, extortion and blackmailing are generally excluded. For exceptions to the standard definition, see the metadata files on the website.
Index (base year 2005 = 100)Country 2002 2003 2004 2005 2006 2007 2008 2006 2007 2008Belgium 30 229 27 952 24 150 23 912 22 771 20 947 21 893 95 88 92Bulgaria 4 665 4 933 4 131 3 754 2 875 2 996 2 868 77 80 76
Czech Republic 5 468 5 508 6 107 5 550 4 783 4 856 4 641 86 87 84Denmark 6 033 5 884 5 733 5 199 5 048 5 784 10 747 97 111 207Germany 58 867 59 782 59 732 54 841 53 696 52 949 49 913 98 97 91
Estonia : 1 885 1 632 1 298 1 005 887 909 : : :Ireland 1 688 1 719 1 478 1 138 1 250 2 173 2 299 110 : :Greece 2 131 2 320 2 400 2 383 2 598 2 845 3 097 109 119 130
Spain 104 380 92 980 88 413 90 104 90 591 89 884 93 186 101 100 103France 133 137 125 286 119 641 124 600 127 190 112 885 106 633 102 91 86Italy 68 248 70 625 66 643 65 724 71 762 74 130 64 535 109 113 98
Cyprus 36 66 100 73 66 69 62 90 95 85Latvia 2 664 2 503 2 467 2 163 2 248 1 468 1 441 : : :Lithuania 4 535 4 919 5 323 5 206 4 343 3 802 3 452 83 73 66
Luxembourg 367 374 339 351 263 331 260 75 94 74Hungary 3 389 3 289 3 227 2 982 2 709 3 119 3 128 91 105 105Malta 156 195 265 256 222 200 147 87 78 57
Netherlands 20 647 20 018 17 683 15 463 13 716 13 082 : 89 85 :Austria 3 638 4 434 4 798 4 770 5 095 5 036 4 786 107 106 100Poland 40 345 44 086 41 287 36 347 29 472 22 766 21 085 81 63 58
Portugal 19 764 19 767 21 051 20 183 20 870 18 483 20 856 103 92 103Romania 3 025 2 782 3 087 3 326 4 078 2 496 2 464 123 75 74Slovenia 449 349 398 429 525 450 386 122 105 90
Slovakia 1 578 1 918 2 156 1 919 1 594 1 429 1 371 83 74 71Finland 2 120 2 045 2 017 1 814 1 700 1 784 1 696 94 98 93Sweden 8 974 8 575 8 590 9 398 8 584 8 673 8 909 91 92 95
UK: England & Wales 110 271 103 736 91 010 98 198 101 376 84 748 80 116 103 86 82UK: Scotland 4 938 4 159 3 736 3 553 3 578 3 064 2 963 101 86 83UK: Northern Ireland 2 497 1 973 1 487 1 744 1 574 1 143 1 283 90 66 74
EU Candidate countriesCroatia 1 204 1 236 1 622 1 560 1 445 1 272 1 259 93 82 81
the former Yugoslav Republic of Macedonia 463 573 783 709 503 521 458 71 73 65Turkey 3 864 4 776 10 825 15 083 21 555 12 634 8 853 : : :
EU Potential Candidate countriesAlbania : : : : : : 50 : : :Montenegro 4 173 3 908 4 239 3 752 3 494 3 040 2 542 93 81 68Serbia 27 333 21 126 22 893 23 854 23 785 24 272 24 717 100 102 104
EFTA/EEA countriesIceland 32 39 35 49 50 42 43 102 86 88Liechtenstein 1 3 2 1 4 5 1 400 500 100Norway 1 548 1 437 1 596 1 448 1 388 1 464 1 598 96 101 110Switzerland 3 968 4 344 4 749 3 977 4 088 4 481 4 220 103 113 106
: Data not available.| Break in the series.
Source: Eurostat (crim_gen)
10 58/2010 — Statistics in focus
Table 5 Crimes recorded by the police: Domestic burglary Domestic burglary is defined as gaining access to a dwelling by the use of force to steal goods. For exceptions to the standard definition, see the metadata files on the website.
Index (base year 2005 = 100)Country 2002 2003 2004 2005 2006 2007 2008 2006 2007 2008Belgium 79 240 64 053 57 527 57 060 63 929 62 832 62 715 112 110 110Bulgaria 31 639 28 210 25 565 22 379 23 460 22 208 19 980 105 99 89
Czech Republic 11 933 12 164 11 670 10 361 9 603 9 163 9 111 93 88 88Denmark 35 557 33 879 32 956 29 439 31 204 36 342 43 974 106 123 149Germany 130 055 123 280 124 155 109 736 106 107 109 128 108 284 97 99 99
Estonia 7 356 6 495 5 752 4 766 3 928 3 096 3 321 82 65 70Ireland 15 474 16 436 16 148 17 012 15 513 23 566 24 864 91 : :Greece 31 805 31 181 26 489 30 207 32 407 37 917 44 150 107 126 146
Spain 93 751 88 128 81 552 81 495 80 981 72 723 82 135 99 89 101France 224 223 216 797 202 880 181 503 177 840 165 780 166 250 98 91 92Italy 169 430 173 097 112 112 122 250 143 726 169 367 153 080 118 139 125
Cyprus 1 228 3 159 3 311 2 812 3 084 2 656 2 576 110 94 92Latvia 5 177 5 327 6 031 4 310 4 624 3 654 3 538 : : :Lithuania 6 989 8 573 9 174 7 065 6 637 5 516 6 076 94 78 86
Luxembourg 1 992 2 206 2 100 1 486 1 838 2 030 1 731 124 137 116Hungary 22 907 19 366 18 671 17 786 16 856 17 415 19 239 95 98 108Malta 679 682 782 1 113 856 735 674 77 66 61
Netherlands 101 920 103 577 95 952 92 890 91 235 85 902 : 98 92 :Austria 12 674 13 429 20 276 21 227 18 945 20 040 18 648 89 94 88Poland 67 290 65 172 66 795 59 325 46 610 37 644 31 481 79 63 53
Portugal 19 989 21 963 22 587 21 840 23 314 22 343 29 663 107 102 136Romania 12 001 10 063 10 002 9 135 9 165 10 829 10 285 100 119 113Slovenia 3 051 2 368 2 750 2 286 2 220 2 282 : 97 100 :
Slovakia 2 785 2 642 3 023 2 809 2 602 2 437 2 118 93 87 75Finland 7 406 7 373 7 901 7 281 5 923 6 532 5 978 81 90 82Sweden 16 562 17 344 17 573 16 654 15 005 16 936 18 176 90 102 109
UK: England & Wales 437 583 402 345 321 507 300 517 292 260 280 694 284 427 97 93 95UK: Scotland 29 623 24 828 23 613 21 232 20 429 17 465 17 223 96 82 81UK: Northern Ireland 10 125 8 944 7 302 7 259 6 831 6 712 7 351 94 92 101
EU Candidate countriesCroatia 4 174 4 125 3 734 3 396 2 981 3 094 2 714 88 91 80
the former Yugoslav Republic of Macedonia 792 1 088 1 275 1 146 1 367 1 590 1 346 119 139 117Turkey 29 042 31 971 36 639 57 389 89 334 73 475 69 709 : : :
EU Potential Candidate countriesAlbania : : : : : : 30 : : :Montenegro : : : : : : : : : :Serbia 9 084 6 890 7 611 7 738 6 224 6 184 6 353 80 80 82
EFTA/EEA countriesIceland 3 208 2 889 2 769 2 244 2 365 2 277 2 731 105 101 122Liechtenstein 87 123 121 97 120 102 93 124 105 96Norway 10 482 10 475 8 613 8 136 7 268 6 777 8 125 89 83 100Switzerland 60 822 68 551 70 370 61 194 56 706 57 493 55 688 93 94 91
: Data not available.| Break in the series.
Source: Eurostat (crim_gen)
Statistics in focus — 58/2010 11
Table 6 Crimes recorded by the police: Theft of a motor vehicle Motor vehicles include all land vehicles with an engine that run on the road which are used to carry people (including cars, motor cycles, buses, lorries, construction and agricultural vehicles, etc.). For exceptions to the standard definition, see the metadata files on the website.
Index (base year 2005 = 100)Country 2002 2003 2004 2005 2006 2007 2008 2006 2007 2008Belgium 42 361 32 878 27 042 24 277 24 424 22 684 21 086 101 93 87Bulgaria 2 196 1 488 1 268 785 640 448 430 82 57 55
Czech Republic 26 143 25 331 24 230 23 040 20 996 20 329 18 893 91 88 82Denmark 37 390 34 037 31 525 25 887 25 183 25 868 26 804 97 100 104Germany 116 230 109 846 107 920 96 451 90 224 92 628 89 036 94 96 92
Estonia 2 628 2 099 1 840 1 929 1 239 1 007 1 035 64 52 54Ireland 14 111 12 463 13 527 13 271 12 642 13 534 14 307 95 : :Greece 5 385 5 865 5 568 5 860 6 799 7 494 7 834 116 128 134
Spain 156 232 138 829 126 902 120 946 117 663 107 786 96 314 97 89 80France 382 148 328 678 285 680 260 538 243 153 224 658 211 484 93 86 81Italy 232 564 221 543 270 129 265 975 280 167 277 549 229 961 105 104 86
Cyprus 1 206 1 569 1 475 1 610 1 780 2 025 1 786 111 126 111Latvia 2 845 3 369 2 960 2 023 2 168 1 729 1 868 : : :Lithuania 6 484 7 022 6 330 4 541 3 460 2 848 2 553 76 63 56
Luxembourg 519 453 526 464 523 454 343 113 98 74Hungary 11 569 12 240 10 969 10 770 10 058 15 017 16 539 93 139 154Malta 707 887 798 672 584 388 398 87 58 59
Netherlands 42 428 34 271 30 652 25 928 22 667 20 248 : 87 78 :Austria 5 489 7 720 8 156 11 089 8 959 7 802 9 049 81 70 82Poland 53 674 54 291 51 150 45 292 30 529 21 284 17 669 67 47 39
Portugal 30 250 29 934 29 237 25 716 24 495 23 986 25 274 95 93 98Romania 1 297 1 127 1 120 1 082 1 266 1 817 2 355 117 168 218Slovenia 815 682 704 873 852 839 582 98 96 67
Slovakia 5 099 5 295 6 000 5 591 5 525 4 719 4 135 99 84 74Finland 23 115 21 922 19 326 16 791 15 276 14 827 13 804 91 88 82Sweden 75 593 67 199 60 980 56 719 51 639 49 249 44 717 91 87 79
UK: England & Wales 318 507 291 858 242 732 214 182 193 384 170 008 147 342 90 79 69UK: Scotland 22 495 17 843 15 633 14 041 15 000 12 105 11 551 107 86 82UK: Northern Ireland 8 410 5 369 4 456 3 721 3 418 3 336 2 954 92 90 79
EU Candidate countriesCroatia 2 404 2 338 2 462 2 274 2 033 2 069 1 927 89 91 85
the former Yugoslav Republic of Macedonia 576 560 827 567 365 413 581 64 73 102Turkey 20 740 25 443 25 667 33 344 33 091 24 153 17 988 : : :
EU Potential Candidate countriesAlbania : : : : : : 28 : : :Montenegro 166 78 67 121 98 98 85 81 81 70Serbia 4 600 3 056 3 572 3 472 3 533 4 075 3 773 102 117 109
EFTA/EEA countriesIceland : : : : : : : : : :Liechtenstein 7 14 16 10 7 7 16 70 70 160Norway 22 595 20 130 17 867 15 350 14 619 12 571 11 901 95 82 78Switzerland : : : : : : : : : :
: Data not available.| Break in the series.
Source: Eurostat (crim_gen)
12 58/2010 — Statistics in focus
Table 7 Crimes recorded by the police: Drug trafficking Drug trafficking includes illegal possession, cultivation, production, supplying, transportation, importing, exporting, financing etc. of drug operations which are not solely in connection with personal use.. For exceptions to the standard definition, see the metadata files on the website.
Index (base year 2005 = 100)Country 2002 2003 2004 2005 2006 2007 2008 2006 2007 2008
Belgium 9 673 9 751 10 580 11 391 11 812 12 606 12 612 104 111 111Bulgaria 1 648 2 006 2 412 2 720 2 824 2 844 2 857 104 105 105
Czech Republic 4 114 3 497 2 803 2 706 2 668 2 639 2 812 99 98 104Denmark 2 675 2 667 3 158 2 738 2 917 3 258 3 237 107 119 118Germany 76 038 73 375 75 347 72 002 64 865 64 093 55 905 90 89 78
Estonia 632 604 494 686 981 1 449 1 558 : : :Ireland 2 632 2 430 2 273 2 751 3 160 3 824 4 028 115 : :Greece 10 001 10 556 7 761 8 393 8 152 7 959 9 852 97 95 117
Spain 12 133 11 742 11 947 11 968 12 711 14 098 14 574 106 118 122France 5 165 6 094 6 296 6 108 5 792 5 797 6 128 95 95 100Italy 37 965 37 288 30 053 32 059 32 306 34 439 34 082 101 107 106
Cyprus 433 475 514 611 653 876 780 107 143 128Latvia 629 997 1 148 1 049 997 1 434 2 512 : : :Lithuania 213 509 711 999 704 765 793 70 77 79
Luxembourg 1 321 1 133 1 342 1 326 1 201 1 448 1 343 91 109 101Hungary 4 790 3 387 6 678 7 626 6 740 4 676 5 464 88 61 72Malta : : 78 113 123 149 180 109 132 159
Netherlands 12 752 15 633 15 662 15 305 16 361 15 657 : 107 102 :Austria 2 320 2 506 2 443 2 337 2 377 2 473 1 980 102 106 85Poland 2 371 2 577 3 296 3 608 3 220 3 926 3 317 89 109 92
Portugal 4 053 3 739 3 654 3 535 3 610 3 281 3 730 102 93 106Romania 1 074 1 131 1 775 2 441 3 079 2 796 3 621 126 115 148Slovenia 1 162 775 997 1 026 1 590 1 429 1 434 155 139 140
Slovakia 674 734 711 843 411 488 524 49 58 62Finland 6 617 5 974 5 269 5 177 4 837 5 115 5 659 93 99 109Sweden 5 259 5 129 4 905 4 670 6 449 7 026 7 797 138 150 167
UK: England & Wales 22 435 24 628 24 190 25 276 26 550 28 330 29 841 105 112 118UK: Scotland 10 327 9 044 9 333 9 613 10 890 9 827 10 315 113 102 107UK: Northern Ireland 291 405 375 349 473 529 607 136 152 174
EU Candidate countriesCroatia 8 717 7 992 7 529 8 186 8 346 7 952 7 882 102 97 96
the former Yugoslav Republic of Macedonia 273 397 357 390 315 451 415 81 116 106Turkey 5 148 5 036 6 720 7 550 10 508 13 649 15 366 : : :
EU Potential Candidate countriesAlbania : : : : : : 274 : : :Montenegro 305 299 355 294 438 549 460 149 187 156Serbia 1 077 2 492 4 116 5 256 5 505 5 414 6 049 105 103 115
EFTA/EEA countriesIceland 121 149 165 95 92 104 104 97 109 109Liechtenstein 447 364 459 435 285 225 210 66 52 48Norway 19 294 16 152 16 814 17 118 19 156 19 086 17 547 112 111 103Switzerland 7 877 7 806 7 803 7 076 6 296 6 297 7 317 89 89 103
: Data not available.| Break in the series.
Source: Eurostat (crim_gen)
Statistics in focus — 58/2010 13
Table 8 Prison population Total number of adult and juvenile prisoners (including pre-trial detainees) at 1 September (or nearest available date). Including offenders held in Prison Administration facilities, other facilities, juvenile offenders institutions, drug addicts institutions and psychiatric or other hospitals. Excluding non-criminal prisoners held for administrative purposes (for example, people held pending investigation into their immigration status). For exceptions to the standard definition, see the metadata files on the website.
Rate per100 000 population
Index (base year 2005 = 100) average per year,Country 2002 2003 2004 2005 2006 2007 2008 2006 2007 2008 2006-2008Belgium 8 605 9 308 9 249 9 330 9 573 9 950 9 858 103 107 106 92Bulgaria 9 607 10 056 10 935 11 399 11 452 10 792 9 922 100 95 87 140
Czech Republic 16 597 17 180 18 303 19 003 18 904 19 110 20 471 99 101 108 189Denmark 3 435 3 641 3 767 4 041 3 932 3 646 3 530 97 90 87 68Germany 75 025 79 183 79 329 79 519 77 166 73 319 73 203 97 92 92 91
Estonia 4 775 4 352 4 575 4 410 4 310 3 466 3 656 98 79 83 284Ireland 3 028 2 986 3 138 3 022 3 053 2 669 2 872 101 88 95 67Greece 8 284 8 555 8 760 9 871 10 280 10 864 : 104 110 : 95
Spain 51 882 56 096 59 375 61 054 64 021 67 100 73 558 105 110 120 153France 53 463 55 407 59 246 59 197 59 522 60 403 64 003 101 102 108 96Italy 55 670 54 237 56 068 59 523 39 005 48 693 58 127 66 82 98 82
Cyprus 351 355 546 536 599 646 646 112 121 121 81Latvia 8 358 8 222 7 666 6 998 6 636 6 548 6 873 95 94 98 293Lithuania 11 345 8 957 7 838 7 951 7 982 7 770 7 736 100 98 97 231
Luxembourg 391 455 577 735 738 666 673 100 91 92 145Hungary 17 838 16 507 16 543 15 720 14 740 14 743 14 626 94 94 93 146Malta 283 278 277 294 376 382 444 128 130 151 98
Netherlands 14 132 15 194 17 397 17 891 16 579 15 777 14 734 93 88 82 96Austria 7 511 7 816 9 000 8 955 8 780 8 887 7 899 98 99 88 103Poland 80 990 80 692 79 344 82 656 87 669 90 199 84 549 106 109 102 229
Portugal 13 772 13 635 12 956 12 687 12 446 11 587 10 807 98 91 85 110Romania 48 075 42 815 39 031 36 700 34 038 29 390 26 212 93 80 71 139Slovenia 1 120 1 099 1 126 1 132 1 127 1 336 1 318 100 118 116 63
Slovakia 7 849 8 829 9 504 9 289 8 657 8 235 8 313 93 89 89 156Finland 3 469 3 463 3 535 3 883 3 477 3 370 3 457 90 87 89 65Sweden 6 478 6 726 7 291 7 016 7 151 6 740 6 806 102 96 97 76
UK: England & Wales 71 218 73 657 74 488 76 190 77 982 79 734 83 194 102 105 109 148UK: Scotland 6 475 6 621 6 779 6 857 7 183 7 376 7 835 105 108 114 145UK: Northern Ireland 1 029 1 128 1 219 1 325 1 501 1 484 1 490 113 112 112 85
EU Candidate countriesCroatia 2 641 2 803 3 010 3 485 3 833 4 290 4 734 110 123 136 97
the former Yugoslav Republic of Macedonia 1 291 1 545 1 791 2 081 2 090 2 050 2 235 100 99 107 104Turkey 59 512 63 796 58 016 55 966 70 524 90 732 103 435 126 162 185 125
EU Potential Candidate countriesAlbania : : : : : : : : : : :Montenegro 715 744 802 816 852 961 1 255 104 118 154 163Serbia 6 283 7 128 7 653 8 078 7 862 8 970 9 701 97 111 120 120
EFTA/EEA countriesIceland 107 112 115 119 119 115 : 100 97 : 39Liechtenstein 67 67 59 62 48 38 78 77 61 126 155Norway 2 832 2 944 3 028 3 124 3 250 3 420 : 104 109 : 72Switzerland 4 937 5 214 5 977 6 137 5 888 5 715 5 780 96 93 94 77
: Data not available.| Break in the series.
Source: Eurostat (crim_pris)
14 58/2010 — Statistics in focus
Table 9 Number of police officers All ranks of police officers including criminal police, traffic police, border police, gendarmerie, uniformed police, city guard, municipal police. Excluding civilian staff, customs officers, tax police, military police, secret service police, part-time officers, special duty police reserves, cadets, court police. For exceptions to the standard definition, see the metadata files on the website.
Index (base year 2005 = 100)Country 2002 2003 2004 2005 2006 2007 2008 2006 2007 2008Belgium 37 242 36 318 37 008 38 911 38 963 38 718 38 068 100 100 98Bulgaria : : : : : : 33 800 : : :
Czech Republic 45 538 46 616 47 232 45 498 46 032 44 101 42 117 101 97 93Denmark 10 233 10 352 10 483 10 728 10 819 10 841 10 743 101 101 100Germany 247 190 245 415 246 756 248 188 250 284 250 353 247 619 101 101 100
Estonia 3 503 3 553 3 520 3 412 3 238 3 247 3 218 95 95 94Ireland 11 895 12 017 12 209 12 265 12 954 13 755 14 411 106 112 117Greece 51 634 52 123 50 171 49 696 48 521 51 152 50 798 98 103 102
Spain 190 119 194 973 198 072 202 365 209 163 214 935 224 086 103 106 111France 235 116 233 250 235 792 234 966 241 998 238 478 228 402 103 101 97Italy 272 282 323 482 325 632 329 012 324 339 : : 99 : :
Cyprus 4 531 4 773 4 903 4 999 5 125 5 139 5 280 103 103 106Latvia 10 265 9 796 9 902 9 920 9 568 8 222 8 410 96 83 85Lithuania 11 678 11 910 11 526 11 216 11 301 11 173 11 018 101 100 98
Luxembourg 1 254 1 304 1 352 1 403 1 447 1 519 1 555 103 108 111Hungary 28 996 29 518 29 516 28 627 28 636 26 334 33 698 100 92 118Malta 1 796 1 845 1 775 1 798 1 755 1 933 1 884 98 108 105
Netherlands 36 766 36 907 35 996 35 284 35 324 35 363 35 463 100 100 101Austria 27 798 26 634 27 111 27 111 26 623 26 623 26 623 98 98 98Poland 99 502 99 919 100 770 100 654 99 083 98 337 100 648 98 98 100
Portugal 48 060 47 417 47 949 47 174 48 082 51 779 51 854 102 110 110Romania 45 245 45 690 45 770 46 875 45 219 45 391 50 339 96 97 107Slovenia 7 392 7 526 7 618 7 881 7 857 7 971 7 779 100 101 99
Slovakia 13 997 13 667 14 079 14 345 14 361 14 134 14 059 100 99 98Finland 8 323 8 288 8 247 8 237 8 312 8 156 8 191 101 99 99Sweden 16 149 16 292 16 891 17 073 17 423 17 866 18 321 102 105 107
UK: England & Wales 129 603 133 366 139 200 141 230 141 381 140 514 140 230 100 99 99UK: Scotland 15 287 15 482 16 001 16 221 16 234 16 221 17 048 100 100 105
UK: Northern Ireland 9 070 8 986 8 936 8 579 8 354 6 140 7 302 97 72 85
EU Candidate countriesCroatia 19 537 19 622 19 634 19 898 19 790 20 424 19 823 99 103 100
the former Yugoslav Republic of Macedonia 7 683 8 357 9 231 9 815 9 776 9 599 9 905 100 98 101Turkey 370 095 318 189 327 371 330 310 325 738 329 533 341 770 99 100 103
EU Potential Candidate countriesAlbania : : : : : : : : : :Montenegro : : : : : : : : : :Serbia : : : : : : : : : :
EFTA/EEA countriesIceland 678 678 671 679 688 683 646 101 101 95Liechtenstein 79 84 87 92 96 93 83 104 101 90Norway 8 221 8 062 8 169 7 485 7 506 7 453 7 505 100 100 100Switzerland 15 073 15 155 15 473 16 444 16 649 16 199 16 326 101 99 99: Data not available.| Break in the series.
Source: Eurostat (crim_plce)
Statistics in focus — 58/2010 15
METHODOLOGICAL NOTES
Developing EU Statistics on crime and criminal justice Eurostat received a mandate under the 2004 Hague Programme1: strengthening freedom, security and justice in the European Union to develop comparable statistics on crime and criminal justice, and a series of measures towards this end were undertaken under the 2006-10 Action Plan on Developing a comprehensive and coherent EU strategy to measure crime and criminal justice2.
Following the conclusion of the Action Plan, the system will be enhanced and extended as part of the implementation of the 2009 Stockholm Programme3: An open and secure Europe serving and protecting citizens.
Data collection The methodology used in this publication draws upon that developed by the European Sourcebook of Crime and Criminal Justice Statistics4, in particular the definition and measurement of criminal offences, and upon the Surveys on Crime Trends conducted by the United Nations Office of Drugs and Crime5.
Figures for the United Kingdom are reported separately (as UK: England & Wales, UK: Scotland and UK: Northern Ireland), owing to the existence of three separate jurisdictions.
Comparisons Most of the data are taken from information recorded or reported by the police. Comparisons of crime levels based on the absolute figures would be misleading, since they are affected by many factors, including:
• different legal and criminal justice systems • rates at which crimes are reported to the police and
recorded by them • differences in the point at which crime is measured
(for example, report to the police, identification of suspect, etc.)
• differences in the rules by which multiple offences are counted
• differences in the list of offences that are included in the overall crime figures
Figures for the prison population may also be affected by many factors, including:
• number of cases dealt with by the courts • the percentage receiving a custodial sentence • the length of the sentences imposed • the size of the population on remand • the date of the survey, especially where amnesties
(or other early release arrangements) apply
For these reasons, direct comparisons of crime levels in different countries should be avoided. Rates per head of population (which might imply that such comparisons could be made) are therefore not presented in this publication, except in the case of homicide and the prison population, where the figures may be more readily comparable. In these cases, rates per 100 000 head of population averaged over 3 years have been calculated.
As a general rule, comparisons should be based upon trends rather than upon levels, on the assumption that the characteristics of the recording system within a country remain fairly constant over time. Even here, however, there are many exceptions as methods change, causing breaks in the series, indicated using the symbol '|'. The symbol ‘:’ is used for some countries to indicate that definitional changes make such a comparison impossible. Fuller information on these changes is given on the Eurostat website.
Where national series without definitional changes are available for the years between 2005 and 2008, indices have been calculated using the 2005 figure as a base, in order to make it easier to follow the trends.
Eurostat website The website allows users access to the data, the metadata and the charts on which the analysis has been based.
There are tables on total crime from 1950 onwards and from 1993 for some specific offences, from 1993 for the number of police officers and from 1987 for the prison population.
For each table, notes are provided on the definitions which countries were asked to observe in assembling the figures. The relevant SDMX (Statistical Data and Metadata eXchange) files provide details of the divergence of national figures from the proposed standard definition. As already noted above, comparability of the figures between countries is difficult to achieve and users are strongly advised to consult the metadata files when referring to the figures.
Data on other countries In addition to the countries considered in this document (EU Member States, candidate countries, selected potential candidate countries and EFTA/EEA countries), information has also been collected (and is available via the Eurostat website) for some other countries: Australia, Canada, Japan, New Zealand, Russian Federation, U.S.A., South Africa. For fuller information on these and other non-EU countries, users should consult the UNODC website.
1 The Hague Programme Official Journal C 53 of 3.3.2005, p.11 http://eur-lex.europa.eu/ 2 Commission communication COM/2006/437 final http://eur-lex.europa.eu/ 3 Stockholm Programme Official Journal C115 of 4.5.2010, p.1 http://eur-lex.europa.eu/ 4 European Sourcebook of Crime and Criminal Justice Statistics http://www.europeansourcebook.org/index.html 5 United Nations Office on Drugs and Crime http://www.unodc.org/unodc/en/data-and-analysis/index.html
Further information Eurostat Website: http://ec.europa.eu/eurostat Data on "Crime and criminal justice" http://epp.eurostat.ec.europa.eu/portal/page/portal/crime/data/database More information about "Crime and criminal justice" http://epp.eurostat.ec.europa.eu/portal/page/portal/crime/introduction Journalists can contact the media support service: Bech Building Office A4/125 L - 2920 Luxembourg Tel. (352) 4301 33408 Fax (352) 4301 35349 E-mail: [email protected] European Statistical Data Support: With the members of the ‘European statistical system’, Eurostat has set up a network of support centres in nearly all Member States and in some EFTA countries. Their mission is to provide help and guidance to Internet users of European statistical data. Contact details for this support network can be found on our Internet site: http://ec.europa.eu/eurostat/ All Eurostat publications can be ordered via EU-Bookshop: http://bookshop.europa.eu/
Manuscript completed on: 29.11.2010 Data extracted on: 29.11.2010 ISSN 1977-0316 Catalogue number: KS-SF-10-058-EN-N © European Union, 2010