Embed Size (px)
Citation preview

GE.19-00624(E)
Committee for the Review of the Implementation of the Convention Seventeenth session
Georgetown, Guyana, 28–30 January 2019
Item 2 of the provisional agenda
Assessment of implementation
Strategic objectives 1 to 5
Global analysis of financial data
Report by the Global Mechanism
Summary
This document contains an analysis of global financial flows related to the
implementation of the United Nations Convention to Combat Desertification (UNCCD),
providing complementary information to the preliminary analysis of strategic objective 5
during the UNCCD 2017−2018 reporting process. Monitoring financial flows for UNCCD
related-activities requires the tracking of flows from multiple sources. This document
mainly focuses on international public sources, consisting of bilateral Official Development
Assistance (ODA), multilateral ODA, and multilateral-bilateral (multi-bi) ODA using the
database of the Organization for Economic Co-operation and Development (OECD) and
reports from multilateral organizations.
Overall, this document provides an overview of trends in global financial flows for
UNCCD implementation. Improving methodologies and data quality for monitoring
financial flows related to combating desertification/land degradation and drought may be an
area of further work to enhance the understanding of global financial flows related to the
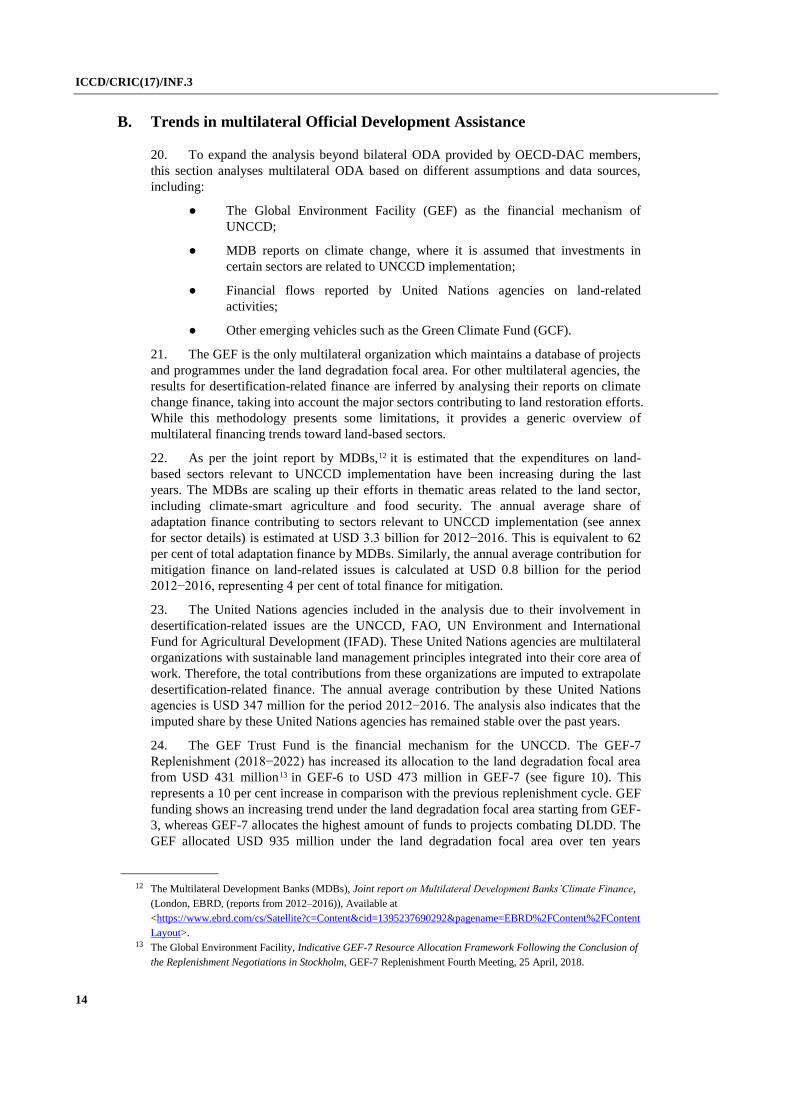
implementation of the Convention.
United Nations ICCD/CRIC(17)/INF.3
Convention to Combat Desertification
Distr.: General
16 January 2019
English only

ICCD/CRIC(17)/INF.3
2
Contents
Paragraphs Page
List of abbreviations ................................................................................................ 3
I. Introduction ............................................................................................................. 1 4
II. Objectives ................................................................................................................ 2 4
III. Overall picture: monitoring UNCCD-related financial flows ................................. 3–8 4
IV. Trends in global financial flows for implementing the UNCCD ............................ 9–34 7
A. Trends in bilateral Official Development Assistance ..................................... 10–19 7
B. Trends in multilateral Official Development Assistance ................................ 20–26 14
C. Trends in private finance ................................................................................ 27–30 16
D. Trends in blended finance ............................................................................... 31–34 17
V. Conclusions ............................................................................................................. 35–39 18
Annex
Methodology to calculate multilateral flows ............................................................................ 20

ICCD/CRIC(17)/INF.3
3
List of abbreviations
ADB Asian Development Bank
AfDB African Development Bank
CBD Convention on Biological Diversity
CRIC Committee for the Review of the Implementation of the Convention
CRS Creditor Reporting System
DAC Development Assistance Committee
DLDD desertification/land degradation and drought
EBRD European Bank for Reconstruction and Development
EIB European Investment Bank
FAO Food and Agriculture Organization
GCF Green Climate Fund
GEF Global Environment Facility
IADB Inter-American Development Bank
IFAD International Fund for Agricultural Development
MDB Multilateral Development Bank
ODA Official Development Assistance
OECD Organisation for Economic Co-operation and Development
SDG Sustainable Development Goal
SO Strategic objective
UNCCD United Nations Convention to Combat Desertification
UNFCCC United Nations Framework Convention on Climate Change

ICCD/CRIC(17)/INF.3
4
I. Introduction
1. Country Parties to the United Nations Convention to Combat Desertification
(UNCCD) are mandated to report every four years against five strategic objectives,
including strategic objective (SO) 5. As defined in the UNCCD 2018−2030 Strategic
Framework, SO5 is related to the mobilization of substantial financial and non-financial
resources to support the implementation of the Convention by building effective
partnerships at the global level. At the fifteenth session of the Committee for the Review of
the Implementation of the Convention (CRIC 15) held in Nairobi in 2016, Parties suggested
simplifying the UNCCD reporting process under SO 5. To complement the information
shared by the country Parties, the Global Mechanism suggested conducting an analysis of
global financial flows supporting the implementation of the Convention. Whereas a
systematic and comprehensive approach to track desertification-related financial flows does
not exist, this document compiles information from various available sources to present a
picture of global financial flows for UNCCD implementation. It provides a non-exhaustive,
general overview.
II. Objectives
2. The Global Mechanism developed this report with the following objectives in mind:
(a) Provide complementary information to the preliminary analysis of country
reports on SO5 in the context of the UNCCD 2017−2018 reporting process;
(b) Present a broad overview on financing for the implementation of the
Convention, drawing on multiple sources;
(c) Provide information to the Parties to facilitate the discussion during the
interactive session on financing to be held at CRIC 17.
III. Overall picture: monitoring UNCCD-related financial flows
3. Finance for UNCCD-related activities refers to the mobilization and tracking of
financial and non-financial resources for the implementation of the Convention. Monitoring
these resources requires the tracking of flows from multiple sources and instruments
supporting activities that combat desertification/land degradation and drought (DLDD).
Figure 1 provides an overview of resource flows according to their source (public or private;
international or domestic) and terms (concessional 1 or non-concessional). As discussed
below, most of the analysis in this document focuses on flows related to the shaded area in
figure 1. This document also discusses steps to be taken to improve the monitoring of
financial flows across the broader range of sources presented.
1 Concessional flows refer to loans that are extended at softer terms than those issued at market rates (OECD, DAC
High Level meeting, <www.oecd.org/dac/OECD%20DAC%20HLM%20Communique.PDF>).

ICCD/CRIC(17)/INF.3
5
Figure 1
Schematic representation of the resource flows categorized according to sources,
origin, concessionality, instruments and institutions
Source: UNCCD Global Mechanism based on OECD,2 Schmidt-Traub and Sachs,3 United Nations.4
4. Official public flows from international financing sources (see quadrant I of
figure 1): This category primarily tracks resource flows between countries (including
South−South cooperation) in the form of Official Development Assistance (ODA) and
Other Official Flows. These flows are mostly channelled through bilateral development
agencies. The OECD uses the Rio markers to identify those activities targeting the global
environmental objectives of the three Rio Conventions (Convention on Biological Diversity,
UNCCD and the United Nations Framework Convention on Climate Change (UNFCCC))
through four markers: biodiversity, climate change adaptation, climate change mitigation
and desertification. Rio markers were devised and adopted by the OECD to support the
analysis of global environmental objectives related to ODA. Whereas the system ultimately
depends on expert judgement to link activities to the aims of each Convention and therefore
may have some imperfections, it provides an overview of ODA distribution to different
thematic areas and sectors.
2 OECD, Development Co-operation Report 2014: Mobilising Resources for Sustainable Development (OECD
Publishing, 2014). Available at <http://dx.doi.org/10.1787/dcr-2014-en>.
3 Schmidt-Traub and Sachs Financing Sustainable Development: Implementing the SDGs through Effective
Investment Strategies and Partnerships. Available at <http://unsdsn.org/wp-content/uploads/2015/04/150408-
SDSN-Financing-Sustainable-Development-Paper.pdf>.
4 A/69/315.
Other Official Flows Dom estic Budget Revenues
Bilateral ODA
Institutions
I II
III IV
Foreign Direct Investm ents Bank loans
Charitable grants Export credits Charitable grants Bonds
Private Sector loans Equities
Project Level Equity Derivatives
Private Institutions Balance sheet Financing
Philantropic foundations & Institutions Institutions Institutions
NGOs National Foundation
Households and Local NGOs
Non-profit institutions
Private corporations
Pension funds
Sovereign wealth funds M icrofinace coorporations
Private corporations
Com ercial institutions Dom estic com ercial
InstitutionsInsurances
Pension funds Households
Public
Official Developm ent
Assistance (ODA) (e.g. Dom estic public spending, grants, Subsidies,
Loans)Official direct export credits
M ultilateral ODA
Institutions
E.g. GEF, IFAD, W orld Bank,
UN
Governm ental agencies
M ulti-Bi ODA
V. Blended Finance
Guarantees, Risk-based instrum ents, Loans.
Institutions Public and Private Partnerships
Sources\Origin International Dom estic
Concessional Flows Non-concessional Flows Concessional Flows Non-concessional Flows

ICCD/CRIC(17)/INF.3
6
5. This document uses data from the desertification marker to report on bilateral ODA
from the members of the Development Assistance Committee (DAC).5 The OECD refers to
desertification-related development finance as “activities that combat desertification or
mitigate the effects of drought in arid, semi-arid and dry sub-humid areas through
prevention and/or reduction of land degradation, rehabilitation of partly degraded land, or
reclamation of desertified land” (Ref OECD). These activities/projects are additionally
classified into (i) ‘principal’, featuring those activities that impact a specific marker as a
primary objective; and (ii) ‘significant’, identifying activities that play a secondary role
with respect to an environmental objective. Projects and programmes marked as a principal
or significant for one Rio marker can simultaneously contribute to other markers.
6. Other ODA flows apart from bilateral ODA consist of multilateral aid and bi-multi
aid. Multilateral aid represents core contributions from official (government) sources to
multilateral agencies. Funding is used for supporting programmes of multilateral agencies.
As there is no data reported by multilateral organizations on desertification in the OECD
Creditor Reporting System (CRS),6 these flows are estimated using information from the
following multilateral organizations (as reported in their budget and thematic reports):
Global Environment Facility (GEF), multilateral development banks (MDBs), International
Fund for Agricultural Development (IFAD); UNCCD; Food and Agriculture Organization
of the United Nations (FAO); and the United Nations Environment Programme (UN
Environment) (for further details see annex).
7. With regard to multi-bi ODA, also referred as earmarked or non-core funding, the
OECD defines these flows as those resources directed by donor countries to multilateral
agencies to deliver a specific programme or project on its behalf in a recipient country.
Data on multi-bi flows are retrieved from the OECD CRS by selecting only those sectors
that are relevant to UNCCD, in this case: agriculture, forestry and general environment
protection.
8. The remaining resource flows across quadrants in figure 1 (for which there are only
partial estimates available for some financial flow categories) include: (i) Other Official
Flows (see quadrant I of figure 1), comprising public international flows that do not meet
ODA criteria (primarily non-concessional resources2); (ii) domestic and public resources
(see quadrant II of figure 1), consisting of public resources collected from tax and non-tax
revenues that pass through government budgets, excluding loans and external financing that
is spent according to various government priorities;3 (iii) domestic and international
private financial flows (see quadrants III and IV of figure 1), containing concessional
financial flows in the form of grants provided by institutions including philanthropic
foundations, non-governmental organizations (NGOs) households and private corporations7
as well as non-concessional flows, consisting of financial resources at market terms
financed out of private sector resources; and (iv) blended finance (see box V of figure 1),
using development finance for the mobilization of additional finance towards sustainable
5 The 30 members of the DAC are: Australia, Austria, Belgium, Canada, Czechia, Denmark, the European Union,
Finland, France, Germany, Greece, Hungary, Iceland, Ireland, Italy, Japan, Luxembourg, the Netherlands, New
Zealand, Norway, Poland, Portugal, the Republic of Korea, Slovakia, Slovenia, Spain, Sweden, Switzerland, the
United Kingdom of Great Britain and Northern Ireland and the United States of America. There are 13 non-DAC
member countries who also report to the OECD. Figures on non-DAC member countries’ bilateral ODA are not
included in the analysis because they are not available in the Rio markers database.
6 The Creditor Reporting System (CRS) is the central database for development co-operation compiled by the DAC.
It is the official source of development co-operation statistics for all DAC member countries. (OECD, Creditor
Reporting System (CRS), OECD.stat. Available at <https://stats.oecd.org/index.aspx?DataSetCode=CRS1>)
7 Organisation for Economic Co-operation and Development, Grants by private agencies and NGOs (indicator).
Available at: <https://data.oecd.org/drf/grants-by-private-agencies-and-ngos.htm>.

ICCD/CRIC(17)/INF.3
7
development in developing countries.8 These resources frequently play an important role in
leveraging private capital with the support of the public sector by building public−private
partnerships.
IV. Trends in global financial flows for implementing the UNCCD
9. This section presents information on trends in global financial flows supporting the
implementation of the Convention according to the different sources described in the
previous section. The section presents financial flows starting with international public
sources (see quadrant I of figure 1), breaking them down into bilateral ODA, multilateral
ODA and multi-bi ODA. The remaining subsections describe trends in international private
resources (see quadrant III of figure 1) and blended finance (see box V of figure 1).
A. Trends in bilateral Official Development Assistance
10. The total annual bilateral desertification-related ODA from DAC members
amounted to USD 2.4 billion (average from 2014−2016). This figure includes bilateral
ODA activities targeting desertification as a principal objective or significant objective.
Furthermore, most of the activities (91 per cent) target desertification as a significant
objective for this particular period (2014−2016), while the remaining activities (9 per cent)
target desertification as a principal objective.
11. Bilateral desertification-related ODA represents 2.4 per cent of the total bilateral
ODA from OECD-DAC members. This share constitutes a small reduction with respect to
previous periods (2011−2013 and 2008−2010), when the percentage of bilateral
desertification-related ODA was 2.5 per cent and 2.8 per cent of total ODA, respectively.
Bilateral ODA related to desertification is the lowest among the three Rio conventions and
markers, whereas the major portion of the financing goes to climate change adaptation and
mitigation (see box below for further details on finance across Rio conventions).
8 Organisation for Economic Co-operation and Development, Making Blended Finance Work for the Sustainable
Development Goals, Available at: <https://read.oecd-ilibrary.org/development/making-blended-finance-work-for-
the-sustainable-development-goals_9789264288768-en#page1>.

ICCD/CRIC(17)/INF.3
8
(Source: The Global Mechanism analysis based on the OECD database)
Box
Trends in bilateral Official Development Assistance for the Rio conventions
This box offers a brief overview of bilateral Official Development Assistance (ODA) from the
members of the Development Assistance Committee (DAC) of the Organisation for Economic Co-
operation and Development (OECD) across the three Rio conventions (Convention on Biological
Diversity (CBD), United Nations Convention to Combat Desertification (UNCCD) and the United
Nations Framework Convention on Climate Change (UNFCCC) and four Rio markers: mitigation,
adaptation, biodiversity and desertification. Using the OECD Global Environmental Objectives
database, it is estimated that projects and programmes targeting the three Rio conventions in the form
of bilateral ODA amounted to USD 29.4 billion (annual average between 2014−2016). This equals 30
per cent of total bilateral ODA. A considerable share of these projects and programmes
simultaneously target more than one Rio convention. For instance, USD 9.8 billion of the USD 29.4
billion (or 33 per cent) was contributed to more than one Rio convention either as a principal or
significant, whereas the remaining USD 19.6 billion (67 per cent) impacted exclusively one marker.
The figure below shows bilateral ODA commitments for each of the four Rio markers. The
desertification marker accounts for the smallest amount in relation to other markers: USD 2.4 billion,
followed by biodiversity (USD 7.6 billion), adaptation (USD 13.6 billion) and mitigation (USD 19.9
billion). The figure also illustrates that resources allocated to projects and programmes combating
desertification also have impacts on other Rio conventions and markers. For example, 96 per cent of
the finance for desertification-related activities contributed simultaneously to others markers as well.
This demonstrates that investing in land contributes to multiple environmental objectives, including
biodiversity, climate change mitigation, climate change. Finance for climate change mitigation, on the
other hand, offers the least synergetic effect across markers, as only 35 per cent of the resources
allocated to the mitigation marker contributed to other environmental objectives (see figure 2 for
further details on other markers).
Figure 2
Bilateral Official Development Assistance across Rio markers* (Annual average 2014−2016
with a constant 2016 price)
Source: The Global Mechanism analysis based on the OECD database.
*Figures displayed across markers present some degree of double-counting as some projects and programmes
contribute to more than one Rio marker. Nonetheless, the total bilateral ODA across markers without double-
counting is estimated at USD 29.4 billion.

ICCD/CRIC(17)/INF.3
9
12. Figure 3 illustrates that the desertification-related ODA remained on a stable level
from 2008 onwards. However, the number of desertification-related projects varied by year.
The majority of the projects targeted other environmental objectives that indirectly
contributed to land restoration. The absolute amount of funding for desertification was
stable over the last decade. Of total projects applicable to the desertification Rio marker,
USD 0.2 billion (9 per cent) has desertification as the principal objective, while the
remaining USD 2.15 billion (91 per cent) addresses desertification as a significant objective
from 2002−2016. Projects grouped under ‘significant objective’ have other environmental
objectives (climate change and/or biodiversity) as principal objectives, and at the same time
address desertification issues through their activities, reflecting the synergies and co-
benefits between the Rio conventions. It also emphasizes that investment in land issues cuts
across sectors and Rio markers, making it difficult to measure. It is important to preserve
the central and pivotal role of land restoration for both climate change and biodiversity
conservation.
Figure 3
Trends in Official Development Assistance towards desertification (three-year
averages, 2002−2016, bilateral commitments, USD billion, constant 2016 prices)
Source: The Global Mechanism analysis based on the OECD database
13. Figure 4 presents the trend of total bilateral ODA (three-year averages) for 2002–
2016. It shows that the total ODA increased substantially since 2005 with a slight decline
during 2011−2013, but overall it shows a rising trend. However, the land-related ODA
remained stable over this period without a substantial increase.

ICCD/CRIC(17)/INF.3
10
Figure 4
Trends in total Official Development Assistance (three-year averages, USD billion,
bilateral commitments)
Source: The Global Mechanism analysis based on the OECD database.
Note: This figure shows bilateral commitments only. When other categories of ODA such as multilateral ODA are
added to the bilateral commitment, the total ODA increases to USD 116 billion (annual average for 2014−2016).
14. This section looks into the six major sectors which make up 84 per cent of the total
desertification-related ODA (see figure 5). The largest share of desertification-related ODA
is concentrated in the agriculture sector (29 per cent). Sustainable agriculture practices not
only improve cropping systems, water use and resilience, among other things; they also
help the land withstand the effects of drought and desertification. The agriculture sector has
been a centre of focus for the past few decades in the light of Millennium Development
Goal 1: Eradicate extreme poverty and hunger (1999–2015) and Sustainable Development
Goal 2: Zero Hunger. Therefore, development assistance agencies are providing funding
and advocating for sustainable agriculture practices, which in turn protects land against
desertification. In terms of desertification-related ODA, agriculture is followed by the
general environment protection sector (20 per cent), multi-sector (12 per cent) and the
developmental food aid/food security assistance sector (10 per cent). These sectors account
for 84 per cent of the total desertification-related bilateral ODA commitments from
2010−2016 (see figure 5). The last two sectors out of the six sectors illustrated in figure 5
are water supply and sanitation (7 per cent) and forestry (5 per cent). The forestry sector,
being less related to desertification, is an anomaly because trees control erosion and provide
vegetation cover to the soil. Also, forests help in keeping the climate moist, which protects
the soil from drying out, which leads to desertification. The low allocation to forest implies
that overall bilateral ODA for the forestry sector decreased over the past few years.

ICCD/CRIC(17)/INF.3
11
Figure 5
Top sectors targeting desertification finance (average 2010−2016, bilateral
commitments, USD million, constant 2016 prices)
Source: The Global Mechanism analysis based on the OECD database.
15. Figure 6 shows the top ten providers of bilateral ODA related to desertification in
USD million. The European Union is at the top of the list followed by Germany. The
average annual ODA allocated to desertification by the European Union exceeded USD 600
million during 2014−2016. The reason for this largest allocation is explained in the
following paragraphs.
16. Drylands take up 41.3 per cent of the land surface, while Africa is considered to be
the hardest hit by the impacts of desertification. The entire Sahel region in Africa is
classified as severely degraded.9 Cooperation at the continental level between Africa and
the European Union is guided by a strategic partnership. In 2007, the Joint Africa–EU
Strategy was adopted by both partners to forge stronger links in key areas of cooperation.
The strategy strives to bring Africa and Europe closer together through the strengthening of
economic cooperation and the promotion of sustainable development. Large-scale
programmes, such as the Pan–African Programme (EUR 845 million for 2014–2020), was
developed with assistance from the European Union for African countries. The European
Union provides the largest share (26 per cent) of bilateral ODA to address desertification
across the world (see figure 6). The European Union provides financing for large-scale
sustainable land management projects in Africa, such as Action against Desertification and
the Great Green Wall. The contribution from the European Union is followed by Germany
(16 per cent), Australia (8 per cent), France (8 per cent) and Denmark (6 per cent).
17. The Government of Germany has also placed land degradation as a priority on its
agenda, which explains Germany’s contribution of 17 per cent of the total bilateral ODA.
The top ten contributors in the graph above add up to 88 per cent of total desertification
9 European Commission Joint Research Centre (JRC), World Atlas of Desertification, Re-thinking Land
Degradation and Sustainable Land Management, 3rd ed. (2018), (European Union, Luxembourg, 2018).

ICCD/CRIC(17)/INF.3
12
finance.10 Biodiversity also shows a similar result. The European Union, Germany and
Japan are the top three providers, contributing 44 per cent of total biodiversity ODA.
Figure 6
Top ten providers of desertification-related Official Development Assistance (annual
average 2014−2016, bilateral commitments, USD million, constant 2016 prices)
Source: The Global Mechanism analysis based on the OECD database.
18. As per the reports submitted by the country Parties to the UNCCD, 168 countries
across the globe are facing severe challenges posed by DLDD. Africa and Asia are amongst
the worst hit by the effects of desertification.11 Globally, an area equal to 4.18 million km²
is degraded annually, most of which is in Africa and Asia. Donor countries, especially the
European Union, have allocated a large share of ODA to Africa (52 per cent) to combat
desertification, followed by Asia (17 per cent) (see figure 7). Almost 19 per cent of the total
desertification allocation is unspecified.
10 Germany, Federal Ministry for Economic Cooperation and Development (BMZ), Combating Desertification,
Germany’s Commitment under United Nations Convention to Combat Desertification, (Germany, Federal Ministry
for Economic Cooperation and Development (BMZ), Bonn)
<www.bmz.de/en/publications/archiv/type_of_publication/information_flyer/flyer/Desertification_en.pdf>.
11 European Commission Joint Research Centre (JRC), World Atlas of Desertification, Re-thinking Land
Degradation and Sustainable Land Management, 3rd ed. (,2018), (European Union, Luxembourg, 2018).

ICCD/CRIC(17)/INF.3
13
Figure 7
Geographical distribution of bilateral flows for desertification (average 2014−2016,
bilateral commitments, USD million, constant 2016 prices)
Source: The Global Mechanism analysis based on the OECD database.
19. Niger and Ethiopia are amongst the top recipients of desertification-related finance
in Africa. Niger receives 5.5 per cent of bilateral ODA for desertification, while Ethiopia
receives 5.1 per cent. Due to increasing desertification and recurrent droughts, people living
in African countries are vulnerable to impacts of desertification. Therefore, the largest share
of bilateral ODA is directed towards them. Policies of the recipient country and government
priorities also play a major role in this.
Figure 8
Top recipient countries of bilateral flows to desertification (annual average 2014−2016,
bilateral commitments)
Source: The Global Mechanism analysis based on the OECD database.
ICCD/CRIC(17)/INF.3
14
B. Trends in multilateral Official Development Assistance
20. To expand the analysis beyond bilateral ODA provided by OECD-DAC members,
this section analyses multilateral ODA based on different assumptions and data sources,
including:
● The Global Environment Facility (GEF) as the financial mechanism of
UNCCD;
● MDB reports on climate change, where it is assumed that investments in
certain sectors are related to UNCCD implementation;
● Financial flows reported by United Nations agencies on land-related
activities;
● Other emerging vehicles such as the Green Climate Fund (GCF).
21. The GEF is the only multilateral organization which maintains a database of projects
and programmes under the land degradation focal area. For other multilateral agencies, the
results for desertification-related finance are inferred by analysing their reports on climate
change finance, taking into account the major sectors contributing to land restoration efforts.
While this methodology presents some limitations, it provides a generic overview of
multilateral financing trends toward land-based sectors.
22. As per the joint report by MDBs,12 it is estimated that the expenditures on land-
based sectors relevant to UNCCD implementation have been increasing during the last
years. The MDBs are scaling up their efforts in thematic areas related to the land sector,
including climate-smart agriculture and food security. The annual average share of
adaptation finance contributing to sectors relevant to UNCCD implementation (see annex
for sector details) is estimated at USD 3.3 billion for 2012−2016. This is equivalent to 62
per cent of total adaptation finance by MDBs. Similarly, the annual average contribution for
mitigation finance on land-related issues is calculated at USD 0.8 billion for the period
2012−2016, representing 4 per cent of total finance for mitigation.
23. The United Nations agencies included in the analysis due to their involvement in
desertification-related issues are the UNCCD, FAO, UN Environment and International
Fund for Agricultural Development (IFAD). These United Nations agencies are multilateral
organizations with sustainable land management principles integrated into their core area of
work. Therefore, the total contributions from these organizations are imputed to extrapolate
desertification-related finance. The annual average contribution by these United Nations
agencies is USD 347 million for the period 2012−2016. The analysis also indicates that the
imputed share by these United Nations agencies has remained stable over the past years.
24. The GEF Trust Fund is the financial mechanism for the UNCCD. The GEF-7
Replenishment (2018−2022) has increased its allocation to the land degradation focal area
from USD 431 million13 in GEF-6 to USD 473 million in GEF-7 (see figure 10). This
represents a 10 per cent increase in comparison with the previous replenishment cycle. GEF
funding shows an increasing trend under the land degradation focal area starting from GEF-
3, whereas GEF-7 allocates the highest amount of funds to projects combating DLDD. The
GEF allocated USD 935 million under the land degradation focal area over ten years
12 The Multilateral Development Banks (MDBs), Joint report on Multilateral Development Banks’Climate Finance,
(London, EBRD, (reports from 2012–2016)), Available at
<https://www.ebrd.com/cs/Satellite?c=Content&cid=1395237690292&pagename=EBRD%2FContent%2FContent
Layout>.
13 The Global Environment Facility, Indicative GEF-7 Resource Allocation Framework Following the Conclusion of
the Replenishment Negotiations in Stockholm, GEF-7 Replenishment Fourth Meeting, 25 April, 2018.

ICCD/CRIC(17)/INF.3
15
(2002–2012) within three replenishment cycles starting from 2002. The average co-
financing generated from this is USD 5.78 billion.14
Figure 9
Global Environment Facility allocation for the land degradation focal area (USD
million)
Source: The Global Mechanism analysis based on the GEF publications.
25. The GEF Trust Fund has disbursed USD 11.6 billion15 from GEF-3 to the GEF -6
replenishment cycles, contributing 6 per cent of the total disbursed GEF Trust Fund 16
towards the land degradation focal area as at 30 June 2017 (see figure 10). During GEF-6,
the GEF responded to UNCCD guidance on the land degradation focal area by increasing
the emphasis on projects focused on achieving land degradation neutrality.
14 The co-financing requirement for third and fifth GEF replenishment was at a ratio of 1:6, i.e. The level of co-
financing mobilized by the GEF through other resources is 6 to qualify for 1 dollar of GEF financing.
15 The Global Environment Facility Independent Evaluation Office (GEF IEO), OPS6 Final Report: The GEF in the
Changing Environmental Finance Landscape. (Washington, DC: GEF IEO, 2018). Available at:
<www.gefieo.org/evaluations/ops>.
16 As at 30 June 2017. The resource utilization figure for GEF-6 does not represent the final figure.

ICCD/CRIC(17)/INF.3
16
Figure 10
Global Environment Facility utilization for land degradation focal area (LDFA) (USD
million)
Source: The Global Mechanism analysis based on the GEF publications.
26. GCF is an important funding source for the forestry and land-use sector, however its
Secretariat does not currently offer specific data on the amount of GCF financing and co-
financing leveraged, segregated by the results areas that are relevant to the UNCCD. It does
analyse, however, the proportion of the funding requests by results area. According to its
Board document GCF/B.20/Inf.07/Rev.01, approximately 14 per cent of funding requests
had been submitted within the forestry and land-use window. Such an estimate is based on
the simple attribution according to the number of results areas marked in each proposal.
With regard to multi-bi or earmarked flows, the agriculture and forestry and general
environment protection sectors are considered in the analysis as these sectors are closely
related to desertification. An average of USD 0.9 billion was disbursed to the agricultural
and forestry sector, and USD 0.7 billion was disbursed to the general environment
protection sector between 2012−2016, which is approximately 9 per cent of total annual
multi-bi contribution. These results indicate that in general, the funds under these sectors
contribute indirectly to land restoration and combating land degradation, whereas a major
focus of multi-bi funding is allocated to other ODA sectors.
C. Trends in private finance
27. This section provides information on private financing from available sources. As
mentioned earlier, a database of private financing for environmental thematic areas is not
available. However, there are surveys and analyses of private entity finance. Since private
financing is focused on profit-oriented sectors, a small portion of these private investments
is dedicated to desertification-related sectors such as agriculture and water supply. In the
absence of a database and methodology for desertification-related private finance, funding
allocated to relevant sectors is inferred as desertification-related finance. This method is not
perfect, but it provides a general overview.

ICCD/CRIC(17)/INF.3
17
28. The OECD-DAC survey17 on resources mobilized from the private sector by official
development finance intervention shows that a total of USD 81.1 billion was mobilized
between 2012−2015. The survey additionally showed an increase in private sector financial
flows from USD 15 billion in 2012 to USD 26.8 billion in 2015. The largest share of the
resources mobilized (33 per cent) was allocated to the banking sector, however there is no
tracking of how these funds are utilized. This is followed by 25 per cent in the energy
sector, and 14 per cent in the industry sector. The share for the agriculture sector and the
water and sanitation sector was only 3 per cent and 2 per cent, respectively. The guarantee
remained the major mobilization financial instrument among these sectors. The largest
share of private investment is mobilized in the African region (30 per cent), followed by
Asia (26 per cent). The survey also highlighted 26 per cent of private investment
contributed to the climate change sector.
29. Similarly, an OECD assessment 18 on private foundation support to development
shows USD 23.9 billion over 2013−2015 contributing significantly to the health sector. The
assessment shows that the contribution of this concessional private finance is gradually
increasing (USD 6.8 billion in 2013 to USD 9.6 billion in 2015). More than half (52 per
cent) of the contribution by the foundation is in the health sector (including reproductive
health), followed by education (9 per cent) and agriculture (8 per cent). The Bill and
Melinda Gates Foundation is the major contributor (49 per cent) among the surveyed
foundations.
30. The global finance landscape for the environment has been evolving rapidly beyond
ODA after the adoption of Addis Ababa Action Agenda on financing for development, the
SDGs and the UNFCCC Paris Agreement. The annual financing gap in key Sustainable
Development Goal (SDG) sectors is estimated at USD 2.5 trillion for the period
2015−2030.19 The Addis Ababa Action Agenda called for an effort to engage the private
sector and move from billions to a trillion to achieve the SDGs. Private funds such as the
eco.business Fund and the Land Degradation Neutrality Fund have been established to
support the business and consumption practices that contribute to the land restoration and
ecosystem balance. However, there is currently no systematic mechanism to measure the
finance from these private funds for different sectors. Further work on this will help for a
more comprehensive analysis of the contribution of private finance to environment and
desertification.
D. Trends in blended finance
31. The OECD-DAC survey on amounts mobilized from the private sector through
official development finance shows that USD 81.1 billion was mobilized between
2012−2015 as mentioned in the previous section. However, this survey does not provide
any information on whether any public finance was invested in private finance.
17 Julia Benn and others, “Amount mobilised from the private sector by official development finance interventions:
Guarantees, syndicated loans and shares in collective investment vehicles”, OECD Development Co-operation
Working Papers. (Paris, OECD, 2017).
18 Organisation for Economic Co-operation and Development, Private Philanthropy for Development, the
Development Dimension, (OECD Publishing, Paris, 2018).
19 United Nations Conference on Trade and Development, Scaling up financing for the Sustainable Development
Goals. Available at <https://unctad.org/en/PublicationsLibrary/gdsecidc2017d4_en.pdf>.

ICCD/CRIC(17)/INF.3
18
32. A recent report by the OECD-DAC 20 highlighted that blended finance is more
aligned towards potential profit-making sectors. This finance category focuses on SDGs
targeting economic growth (SDG 8), infrastructure (SDG 6, SDG 7, SDG 9, SDG 11),
climate change (SDG 13), no poverty (SDG 1) and affordable and clean energy (SDG 7).
SDGs related to biodiversity and natural resources (SDG 14 and SDG 15) appear to be of
least concern to these funds (Figure 10).
Figure 11
Funds and facilities targeting different Sustainable Development Goals
Source: ‘Making Blended Finance Work for the Sustainable Development Goals,” OECD 2018.
33. The report also found that various provider countries had set up 167 facilities by
2016 to pool public financing for blending different financial instruments and approaches.
34. Blended finance has the potential to amplify the impact of public resources by
sharing the risk for the private investors and therefore increasing the amount of private
finance to achieve SDGs. However, the blending should be contextual depending on the
size and scope of the blended finance market as well as country’s priorities, economic
conditions and SDGs.
V. Conclusions
35. Monitoring the entirety of desertification-related financial and non-financial
resources (including public, private, domestic, international, and blended finance) is
challenging due to the cross-sectoral and cross-thematic nature of land-related issues
as well as the multiple sources, institutions and instruments supporting activities that
combat desertification/land degradation and drought. Due to data limitations, this
20 Organisation for Economic Co-operation and Development, Making Blended Finance Work for the Sustainable
Development Goals, Available at: <https://read.oecd-ilibrary.org/development/making-blended-finance-work-for-
the-sustainable-development-goals_9789264288768-en#page1>.

ICCD/CRIC(17)/INF.3
19
document has mainly focused on international public financial resources in the form
of desertification-related bilateral and multilateral ODA.
36. The total estimates on Bilateral desertification-related Official Development
Assistance (ODA) by members of the OECD Development Assistance Committee
(DAC) amounted to USD 2.4 billion (annual average 2014−2016). These resources
have remained relatively stable over the last decade, whereas its relative share with
respect to total ODA has been declining. This suggests that the allocation of aid to
desertification-related activities has been losing its relative importance with regard to
other sectors and environmental objectives.
37. Other key trends in bilateral desertification-related ODA relates to (i) donor
countries, the top 5 providers being the European Union, Germany, Australia, France
and Denmark; (ii) sectors, with primary allocations made to the agriculture, general
environment protection, food aid, other multi-sector, and water supply and sanitation
sectors; (iii) recipient countries, the top 10 recipient being Niger, Ethiopia, Chad, Mali,
Turkey, Kenya, Afghanistan, the Plurinational State of Bolivia, India and the
Democratic Republic of Congo.
38. Multilateral flows have also played an important role with regard to
international concessional public resources supporting UNCCD-related activities, with
the following key trends: (i) the GEF allocated USD 473 million to the land
degradation focal area during GEF-7 (2018−2022), representing an increase of 10 per
cent with respect to the previous cycle (GEF-6); (ii) the imputed share from joint
MDBs for UNCCD-related activities has been increasing, amounting to USD 4.1
billion annually during the time period 2012−2016; (iii) The imputed share of
contributions by United Nations agencies working to combat desertification has been
steady over the years, reaching about USD 300-400 million for the period of
2012−2016; and (iv) Overall desertification-related multi-bi funding has been growing
over time, with an average allocation of USD 1.6 billion annually.
39. Given the lack of desertification markers for those financial flows beyond
bilateral ODA, it is important to continue exploring methodological and data
advances to develop a comprehensive and systematic approach to track financial flows
for the implementation of the Convention.

ICCD/CRIC(17)/INF.3
20
Annex
Methodology to calculate multilateral flows
1. This document considers joint reports on climate finance from multilateral
development banks (MDBs) to analyse the contribution of MDBs. These reports provide an
overview of the financing committed by the African Development Bank, Asian
Development Bank, European Bank for Reconstruction and Development, European
Investment Bank, Inter-American Development Bank Group and the World Bank Group to
climate change adaptation and mitigation over the years. This joint methodology for
tracking climate finance describes the projects that are eligible for climate finance (both
adaptation and mitigation). The sectors relevant to the implementation of the United
Nations Convention to Combat Desertification (UNCCD) are mentioned below in the table
with their respective activities. Hence, the contribution of MDBs to the following sectors
relevant to UNCCD implementation is considered in the analysis. The joint MDB report of
2012−2016 is referred to in this document.
Sector/topic Mitigation
Agriculture, forestry and land-use
- Reduction in energy use in traction (such as efficient tillage), irrigation, and other agricultural processes
- Agricultural projects that improve existing carbon pools (such as rangeland management, collection and use of bagasse, rice husks, or other agricultural waste, reduced tillage techniques that increase carbon contents of soil, rehabilitation of degraded lands, peatland restoration, and so on)
- Reduction of non-carbon dioxide greenhouse gas (GHG) emissions from agricultural practices and technologies (for example, paddy rice production, reduction in fertilizer use)
- Afforestation (plantations) and agroforestry on non-forested land
- Reforestation on previously forested land
- Sustainable forest management activities that increase carbon stocks or reduce the impact of forestry activities
- Biosphere conservation and restoration projects (including payments for ecosystem services) seeking to reduce emissions from the deforestation or degradation of ecosystems
- Livestock projects that reduce methane or other GHG emissions (for example, manure management with bio digesters and improved feeding practices to reduce methane emissions)
- Production of biofuels, including biodiesel and bioethanol (only if net emission reductions can be demonstrated)

ICCD/CRIC(17)/INF.3
21
Sector/topic Mitigation
Other agricultural and ecological resources
- Supplemental irrigation, multi-cropping systems, drip irrigation, levelling, and other approaches and technologies that reduce the risk of large crop failure
- Improved management of forest fires and pest or disease outbreaks
- Increased production of adequate fodder crops to supplement rangeland foraging
- Adoption of sustainable fisheries and aquaculture techniques to compensate for the reduction in local fish supplies
- Establishment of core protected areas and buffer zones for the sustainable use of biodiversity and water to meet livelihood needs in more extreme droughts
Water and wastewater systems
- Well fields relocated away from floodplains and raised wellheads
- Protection of wastewater infrastructure from increased flooding
- Improved catchment management planning and regulation of water abstraction
Crop production and food production
- Investments in research and development of crops that are more resilient to climate extremes and change
Coastal and riverine infrastructure (including built flood-protection infrastructure)
- Physical or natural reinforcement of coastline and/or additional coastal structures or vegetation
- Increased river dredging programmes, reinforcement of levees, re-establishment of natural flood plains and vegetation in upstream areas or river banks
2. The Global Environment Facility (GEF), as the financial mechanism of the
UNCCD, reports regularly to the Conference of Parties (COP), which is held every two
years. The GEF report to COP 13 provided progress on GEF activities during Financial
Year 2016−Financial Year 2017 in the land degradation focal area and also provides a
contribution under enabling activities for the GEF-6 1 July 2014 to 30 June 2018. In
addition to this, the analysis also considers the report21 on the sixth replenishment of the
GEF Trust Fund and the report by the GEF Independent Evaluation Office.22
3. The OECD-DAC database on the multilateral system was used for the analysis of
the contributions from United Nations agencies relevant to UNCCD implementation. The
core multilateral flows from the UNCCD (including the Global Mechanism), International
Fund for Agricultural Development, FAO and UNEP were included in the analysis
presented in this document.
21 Global Environment Facility. Report on the sixth replenishment of the GEF trust fund. Available at:
<https://www.thegef.org/sites/default/files/council-meeting-
documents/GEF.A.5.07.Rev_.01_Report_on_the_Sixth_Replenishment_of_the_GEF_Trust_Fund_May_22_2014
_1.pdf>.
22 Global Environment Facility Independent Evaluation Office (GEF IEO). Land Degradation Focal Area Study,
Evaluation Report No. 120 (Washington, DC: GEF IEO, 2018). Available at: <www.gefieo.org/evaluations/land-
degradation-focal-area-ldfa-study-2017>.