Embed Size (px)
Citation preview
IV, Conclusions
All of the fuels tested in this program changed inoctane rating as the pressure of the altitude chamberwas decreased. In general, the fuels that were themost sensitive to altitude changes were those withthe highest sensitivity to engine severity, as definedby the differences between their Motor Method andResearch Method ratings. This is to be expected,as the higher compression ratios used at lower cham-ber pressures increase the engine severity by raisingthe compression temperatures.
It has been shown that decreased inlet temperatureand decreased speed shift altitude ratings by theMotor Method toward their sea-level values, but atdifferent rates for various fuels. Although the effectsof spark advance on this method were not investi-gated, a change in this factor might prove ad-vantageous. Larger carburetor Venturis have proveduseful, and permit ratings to be maintained at abouttheir sea-level values up to altitudes to 3,000 to 4,000ft. I t is possible that the Motor Method ratings arecapable of being equalized throughout the altituderange by use of a suitable combination of changedconditions.
The Research Method, on the other hand, doesnot lend itself well to modifications of this type.The spark advance is already nearly the optimum,inlet temperature is at about the minimum that willassure adequate vaporization of the fuel, the volu-metric efficiency is improved very little by use of alarger venturi, and the engine speed is already verylow.
It appears, therefore, that the surest way of makingthe engine severity equal to that at sea level, regard-less of the altitude, is to supercharge the inlet andthrottle the exhaust, thereby simulating sea-levelconditions. For this purpose, a small single-stagecentrifugal compressor would probably suffice. The
air would enter the blower through a standardhumidity-controlling ice tower, and thence throughthe standard air heater to a pressurized carburetor.It is possible that an after-cooler may also be neces-sary to keep the inlet temperature below 125° F inthe Research Method at the lower chamber pressures.
This investigation was carried out in cooperationwith the Octane Correlation Advisory Committee ofthe Division of Refining of the American PetroleumInstitute. Members of this committee are: BrunoR. Siegel, chairman, Frank C. Burk, Carl E. Haber-mann, J. E. Taylor; associate members are HaroldM. Trimble, H. R. Stacey, John M. Snell, Afton D.Puckett, and Hudson W- Kellogg. Appreciation isexpressed to the committee members for planningthe scope of the work and their expert advice incarrying it out. Credit is also due the following fortheir work in operating the engines and altitudeequipment: W. C. Lacey, Myron C. Wolfe, JamesO. Chase, H. B. Dickerson, J. M. Mealing, L. J.Wilson, H. S. Simmons, Fred W. Ramin, George J.Miner, Edwin H. Rich, Richard M. David, JamesA. Walker, Milford Barnes, Thomas W. Mears, andMrs. Cecil S. Dussinger.
V. References[1] W. M. Holaday and G. T. Moore, Effect of altitude on
octane number determination, presented at SAE AnnualMeeting, January 1937.
[2] D. B. Brooks, Effect of altitude on knock rating in CFRengines, J. Research NBS 28, 713 (1942) RP1475.
[3] ASTM manual of engine test methods for rating fuelsand 1948 appendix (American Society for TestingMaterials, 1916. Race Street, Philadelphia 3, Pa.).
[4] O. C. Bridgeman, Equilibrium volatility of motor fuelsfrom the standpoint of their use in internal combustionengines, J. Research NBS 13, 53 (1934) RP694.
WASHINGTON, April 10, 1950.
Journal of Research of the National Bureau of Standards Vol. 45, No. 2, August 1950 Research Paper 2121
Creep of High-Purity Copper
By William D. Jenkins and Thomas G. Digges
Creep tests were made at 110°, 250°, and 300° F on annealed oxygen-free high-con-ductivity copper. The rate of loading to the ultimate had a significant effect on the amountof plastic extension and thereby affected the creep behavior. The strain rate during theso-called second stage of approximately constant rate was not constant but varied in a cyclicmanner. A less-pronounced cyclic variation was also evident in both the first and thirdstages. The beginning of the third stage was often accompanied by microcracking, but inother tests this stage was initiated without the presence of such cracks. The parent grainswere fragmented during creep, and strain markings were observed in all specimens carriedto complete fracture.
I. Introduction
Creep tests in tension were made on annealedoxygen-free high-conductivity copper as a part of acontinuing investigation at this Bureau on the creep
of metals and alloys. Additional tests at elevatedand subzero temperatures on this copper and othermaterials are in progress. In a previous paper [I]1 itwas shown that the flow, ultimate and fracture
i Figures in brackets indicate the literature references at the end of this paper.
153

stresses, and ductility increased with a decrease intest temperature and with an increase in strain rateof another lot of oxygen-free high-conductivitycopper initially cold-rolled 75-percent reductionin area.
Parker and Riisness [2] reported that the creepstrength at 200° C of annealed oxygen-free high-conductivity copper was independent of the grainsize. Parker [3] also determined the stress-ruptureproperties at 200° C of this type of copper initially inthe conditions as (1) annealed, (2) cooled in air, and(3) quenched in water from 850° C. The strengthand ductility of the quenched specimens wereappreciably lower than those of the specimens asannealed or as cooled in air. A linear relation wasshown in a log-log plot of the experimental valuesof the stress versus the time to rupture for both theannealed and air-cooled conditions, but there werepoints at which changes occurred in the slope of thecurve for the initially quenched specimens. Somerecrystallization occurred in specimens, which werecold-rolled from 1.0 to 0.1 in. in thickness, afterheating at 200° C for 20 hr.
Davis [4] made a study of the creep and relaxation(constant deformation) at temperatures up to 235° Cof oxygen-free copper initially extended 8 percent intension, and he attempted to correlate the resultsof the two different types of tests by using varioustheories of plastic deformation. At 235° C, the creep(extension-time) curves tended to become straightafter about 400 hr, but at 165° C they did notbecome straight until after about 1,200 hr; at 30° C,the curves had not reached a constant slope after3,500 hr. The stresses used in these creep testsranged from 12,000 to 16,000 psi at 30° C, 4,000 to10,000 psi at 165° C, and 2,500 to 7,000 psi at235° C. The logarithms of minimum creep rates forall the tests, except those at 30° C, were plottedagainst the stress, and straight lines were drawn tofit these data (semilog plot). He concluded that thehyperbolic-sine relation between the minimum creeprate and stress fitted the test data very well. Noaccurate theory existed by which the shape of therelaxation curve could be predicted from dataobserved in creep tests when the temperatures werewithin the range covered in these tests. The strainrate in the latter stages of a relaxation test wasslower than the minimum creep rate for the cor-responding stress.
Burghoff and Blank [5] presented data on creepat 300°, 400°, and 500° F of four types of wroughtcopper and several copper alloys initially as annealedand as cold-drawn. Usually, their creep tests didnot progress beyond the first stage (that of decreas-ing rate under constant load) within a period ofabout 6,000 hr; the values reported for creep ratewere those obtained in the latter part of the test.A linear relationship was shown in a log-log plot ofthe experimental values of stress versus strain ratefor oxygen-free copper (99.98 percent copper) initiallyboth as annealed (0.025-mm grain diameter) and as
cold-drawn 84 percent. The cold-drawn specimensbecame about half recrystallized during the courseof the tests at 300° F and completely recrystallizedat 400° F shortly after the creep load was applied.
Schwope, Smith, and Jackson [6] recently investi-gated the effect of cold work on the short-time creepstrength in tension and compression at 570° F andon the long-time creep strength in tension at lowertemperatures (200° to 300° F) of several types ofcommercial copper, including the oxygen-free high-conductivity grade. They reported that cold workincreases the creep strength of copper, but its bene-ficial effect is lost at temperatures where recrystalli-zation was rapid. The trends in the short-time creeptests were also evident in the longer time creep tests.A linear relation was shown in plots of stress versuslog of strain rate of the experimental values for boththe short- and long-time tests.
II. Material and Testing Procedures
All specimens were cut from a bright annealed%-in. round bar of oxygen-free high-conductivitycopper (OFHC) containing 99.99+ percent of cop-per as determined by chemical analysis. The arcspectrum of the copper was examined for the sensitivelines of Ag, Al, B, Be, Co, Fe, In, Ir, Mg, Mo, Na,Ni, Pb, Sb, Si, Sn, Ti, V, and Zn. The lines forAg, Al, Mg, and Si were identified, and there wassome indication of the presence of Fe, Ni, and Pb.
Some properties at room temperature of the an-nealed copper were as follows:
Average grain diameter, mm • 0. 025Average hardness, Rockwell F__ 34Tensile strength, 1,000 psi 31. 9Yield strength, (0.2 percent offset) 1,000 psi. 12. 2Elongation in 2 in., percent at maximum load. 39Elongation in 2 in., percent at fracture 51Reduction of area, percent at maximum load. 28Reduction of area, percent at fracture 88
The creep tests were made on specimens having a0.505-in. gage diameter and a gage length of 2 in.;all specimens were prepared from the same bar. Thetests were carried out in a noncontrolled atmosphere(air) at temperatures of 110°, 250°, and 300°'F.The temperatures of the creep furnaces were con-trolled within the range of about ± 1 deg F of thedesired temperature (temperature differences withinthe gage length of the test specimen were less than3 deg F), and the probable error of extensionmeasurements was less than 0.00002 in. The speci-mens were held for a minimum of 48 hr at tempera-ture before loading, and the rate of loading of eachspecimen to the selected ultimate2 stress was ac-curately controlled. Each creep test was made at aconstant load, which was maintained for the com-plete test. A rate of loading of 3,200 psi/hr (3,200psi applied at 1-hr intervals) was selected as a
2 The terms "ultimate strep" are used to designate the selected stress appliedto a specimen for testing in creep at a constant load. The value for ultimatestress is obtained by dividing the load by the original area of the specimen.
154

"standard," and this rate was used in all testsexcept those in which the rate of loading was variedto determine its effect on creep behavior. When theultimate stress (nominal)3 was not divisible by 3,200,the remainder was added as the final step.
The equipment used for creep testing is essentiallythe same as that used and described in previousinvestigations [7]; some improvements have beenmade, especially in temperature controllers, measur-ing microscopes, and method of attaching the stripsto specimens for measuring the extension.
Rockwell F hardness (60-kgload, l/16-in.-diameter3 The nominal stress is denned as the stress obtained by dividing the current
load toy the original area of the specimen. The true stress is denned as the stressobtained by dividing the current load by the current minimum area of the speci-
ball) measurements were made on the bar as annealedand on selected specimens after testing either increep or in normal tension at room temperature.Two flats 180° apart were prepared parallel to thelongitudinal axis of the specimens tested to fracturein tension, and the Rockwell readings were made atroom temperature on various points along the centerline of these flats. The diameters of the specimensat the points of indentation were accurately de-termined by means of a measuring microscope.Thus, the hardness values could be correlated with thedegree of plastic deformation.
Usual procedures were followed in preparingspecimens by mechanical methods for metallographyand in carrying out the metallographic examinations.
TABLE 1. Summary of conditions used and results of creep and tension tests on high-purity copper initially as bright annealed
Thermal mechanicalhistory
Tem-pera-ture
Ulti-matestress
Loadingschedule
Creeprate Time Plastic
extension
Beginning of thirdstage
TimePlas-
ticexten-sion
Truestress
End of test
TimePlas-tic
exten-sion
Re-duc-
tion ofarea
Truestress
Remarks
Initially as annealed
Do 70
1,000
31.9
31.8
Wfloohr
60,00060,000
hr % in 2 in. hr0.7
.7
%2 in.39.
38.5
1,000lb/inf
44.0
44.0
hr1.25
1.20
%2 in.51.0
62.0 78
1,000Ib/in*140.0
80
Tested to frac-ture.
Test stopped be-bore completefracture.
Average
Initially as annealed
Extended 9.5% at 250°F. with ultimate of16,000 psi. Tempera-ture changed to 110°F . at 4,062 hr.
Initially as annealed
Extended 9.5% at 250°F . with ultimate of16,000 psi. Tempera-ture changed to 110°F . at 4,062 hr.
Initially as annealed
Do
31. 60,000 38.8 44.0
Do...
Do-
Extended 8.94% at 250°F. with ultimate of16,000 psi for 2,472hr.
Extended 9% in tensiletest at 80° F.
Initially as annealed
Extended 18% at 250°F. in 3,381 hr. withultimate of 19,200 psi.
Initially as annealed
DoExtended 16.5% at 250°
F. in 4,050 hr. withultimates of 16,000and 19,200 psi.
Initially as annealed
110
110
110
110
250
250
250
250
250
250
250
250
250
300300
300
25.6
25.6
28.8
28.8
16.0
16.0
19.2
19.2
19.2
19.2
22.4
22.4
24.0
19.219.2
20.8
3,200 psi/hr
Load added inincrementsof 1,600 or3,200 p s iLoading timeat 110° F.,1,076 hr.
3,200 psi/hr..._
Load added inincrementsof 1,600 or3,200 psi.Loading timeat 110° F.,2,756 hr.
3,200 psi/hr
Appl ied in-stantane-ously.
3,200 psi/hr
3,200 psi/wk____
3,200 psi ap-plied instan-taneously.
3,200 psi/hr
3,200 psi/hr
3,200 psi addedinstantane-ously.
3,200 psi/hr
3,200 psi/hrTemperature
change only,with load onspecimen.
3,200 psi/hr
1.08
165
2,100
0.44
0.43
1.15
10.1
37.8
130
8.38.3
36/4
500 to 900
500 to 900
24. 5 to 105
1. 2 to 3.03
1103 to 2472
1103 to 2472
14.31.61.511.431.041.771.551.67
23 to 123791 to 1679700 to 22001679 to 25412500 to 5000' 774 to 16771677 to 2541789 to 1679
700 to 2200
312 to 1248
170 to 369
31 to 134
200 to 990330 to 835
80 to 335
18. 57 to 19.0
23. 65 to 24. 4
28.8 to 42. 2
37.7 to 41.9
8.34 to 8.94
8.43 to 9.01
10.9 to 12.615.1 to 16. 514.9 to 17. 216. 5 to 17. 717. 6 to 20. 215.1 to 16. 716. 7 to 18.0
15.05 to 16. 54
10.9 to 12.6
25. 5 to 35. 7
32.1 to 39. 6
27.9 to 41.2
18.9 to 25.421.2 to 25.4
22.1 to 31. 4
105
3.03
42.2
41.9
40.9
40.7
1,680
123
5
2,472
2,472
19.0
25.6
62.5
68.5
8.94
9.01
16.0
20.4
90
86.2
8.19
8.34
30.5
32.2
278.6
208.6
17.4
17.5
1,248
134
990835
335
35.7
41.2
25.425.4
31.4
30.0
31.4
24.124.1
27.5
2,5411,679
2,700
1,824
483
168
1,5221,332
439
18.016.54
16.0
47.3
59.4
36.536.5
46
15.314.2
11.5
34.3
40.5
78.7
3333
46.7
22.7
22.4
21.7
34.1
37.6
112.4
28.828.8
39
Test stopped insecond stage.
Do.
Tested to com-plete fracture.
Do.
Test stopped insecond stage.
Do.
Test still inprogress.
Test stopped insecond stage.
Do.
Do.
Test stopped in3d stage be-fore completefracture.
Do.
Tested to com-plete fracture.
Do.Do.
Do.
155

III. Results and Discussion
1. Influence of Temperature, Stress, and Rate ofLoading on Plastic Extension in First Stage ofCreep
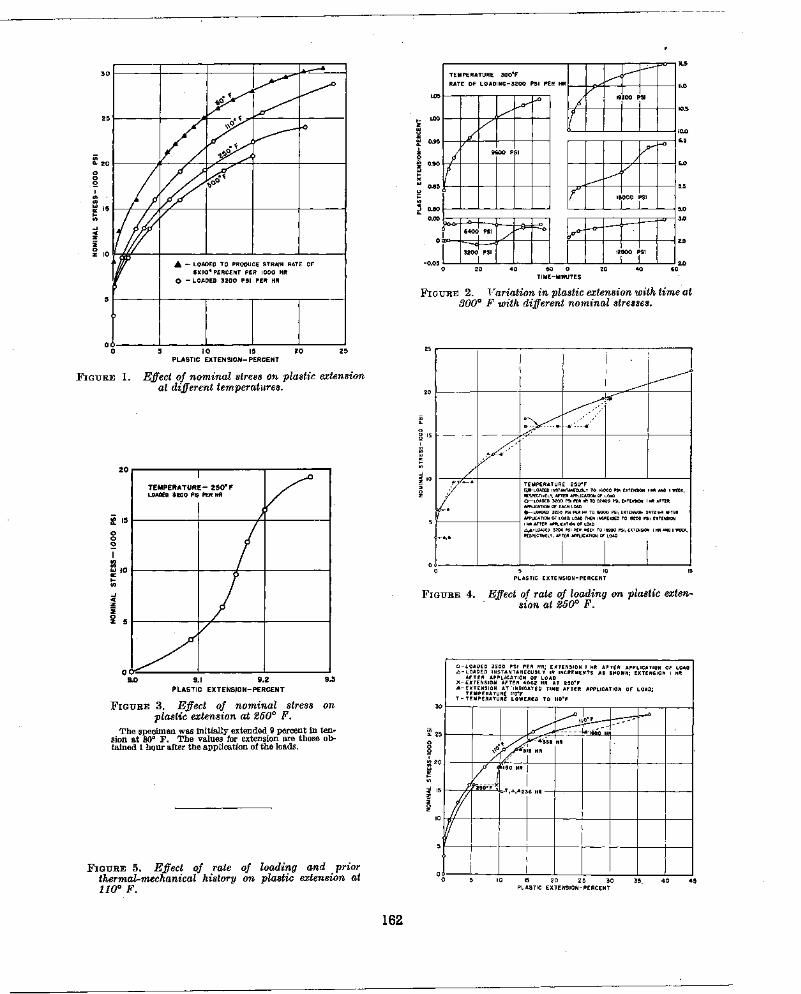
The experimental results are summarized in table1 and figures 1 to 27. The influence of temperatureon the stress-strain relationship of the initiallyannealed copper is shown by a comparison of therelative positions of the curves in figure 1. Exceptfor the specimen extended at 80° F (room tempera-ture) at a rate of 6X10⁴ percent/1,000 hr, eachspecimen was loaded in increments of 3,200 psiapplied hourly (hereafter designated as "standard"rate of loading), and the values plotted for extensionare those obtained after the application of the loadsfor a period of 1 hr. Obviously, the resistance toflow decreased as the test temperature was increased.The relatively high resistance to flow of the specimenat 80° F was due partially to the higher strain rateused; an increase in strain rate and decrease in testtemperature both tend to increase the rate of workhardening.
Stresses of 3,200 and 6,400 psi produced only smallamounts of plastic extension in 1 hr in specimens at110°, 250°, or 300° F. With the application ofhigher stresses at each of these temperatures, how-ever, the specimens continued to extend during the1 hr they were subjected to the constant stress(creep usually occurred at a decreasing rate), as isillustrated by the typical curves given in figure 2for a specimen tested at 300° F.
The stress-strain curve, for a specimen initiallyextended 9 percent in tension at room temperaturebefore heating at 250° F for 48 hr and then loadedat the standard rate to an ultimate of 19,200 psi, isgiven in figure 3. The resistance to plastic deforma-tion at 250° F was materially increased by the cold-working at room temperature. Although the in-crease in plastic extension at 250° F was less than0.3 percent after the application of the stress of19,200 psi for 1 hr, the shape of the curve showsthat relatively rapid increases in extension occurredwith the application both of the initial and finalstresses. The rapid increase in deformation with theapplication of only 3,200 psi indicates that theinternal stress induced by cold-working was con-siderably relieved during the period of heating at250° F before applying this stress; the rapid increasein extension with the application of a stress of19,200 psi may be attributed to a change in grainorientation.
The effect of variations in the rate of loading onthe plastic extension at 250° F is shown by theresults summarized in figure 4. The experimentalpoints as plotted in this figure are based on the ex-tension produced after the different loads wereapplied for a period of 1 hr and also at the end of theperiod of creep when the specimens were allowed toremain under constant loads for periods in excess of1 hr. At a stress of 16,000 psi, the plastic extensionincreased somewhat with change in rate of loading
from instantaneous4 to increments of 3,200 psi/hr(standard), but the elongation obtained with thestandard rate was the same as that of a specimenloaded at a considerably slower rate in increments of3,200 psi/week. However, the paths of the stress-strain curves of the specimens loaded at the standard(3,200 psi/hr) and slow rates (3,200 psi/week) werenot alike. In the early stages of loading, the curvefor the specimen loaded relatively slowly was at ahigher level (value for extension after load wasapplied for 1 hr) than that of the curve of the speci-mens loaded at the standard rate; the stress-straincurves as reproduced for these two specimens eithercoincide or cross at several points due to the changein plastic extension with increase in time from 1 hrto 1 week at a constant load. At a stress of 19,200psi, the plastic extension (after 1 hr) of the specimenloaded at the relatively slow rate was greater thanthat of the specimens loaded at the standard rate,and it was less than that of a specimen loaded at thestandard rate to 16,000 psi, allowed to creep at thisload for an appreciable time (2,472 hrs) before in-creasing the stress to 19,200 psi.
The stress-strain curve for a specimen at 110° F,which was loaded at the standard rate, and thecurve for another specimen at 250° F on which astress of 16,000 psi was applied instantaneously aregiven in figure 5. The stress of 16,000 psi remainedon the specimen at 250° F for 4,062 hr (extension of9.5 percent) before reducing the test temperature to110° F (load not changed); the test was then con-tinued for 236 hr at 110° F (less than 0.1-percentincrease in extension) before increasing the stress to28,800 psi in increments of either 1,600 or 3,200 psiand allowing to creep at each load for the time asgiven on the curve. The latter curve falls appre-ciably below the former curve, especially in the re-gion corresponding to the higher range in stress.Thus the rate of loading to the ultimate and thethermal history had a marked effect on the amountof plastic extension, and this in turn affected thecreep rates in the first, second, and third stages, theduration of these stages, and ductility at fracture(table 1).
The results presented in a previous investigation[8] also showed that the creep behavior of initiallycold-drawn ingot iron was affected by the rate ofloading to the ultimate. The creep rate in thesecond stage and elongation at fracture both de-creased with a decrease in rate of loading in the firststage.
2. Influence of Prior Thermal-Mechanical Historyon Creep Behavior
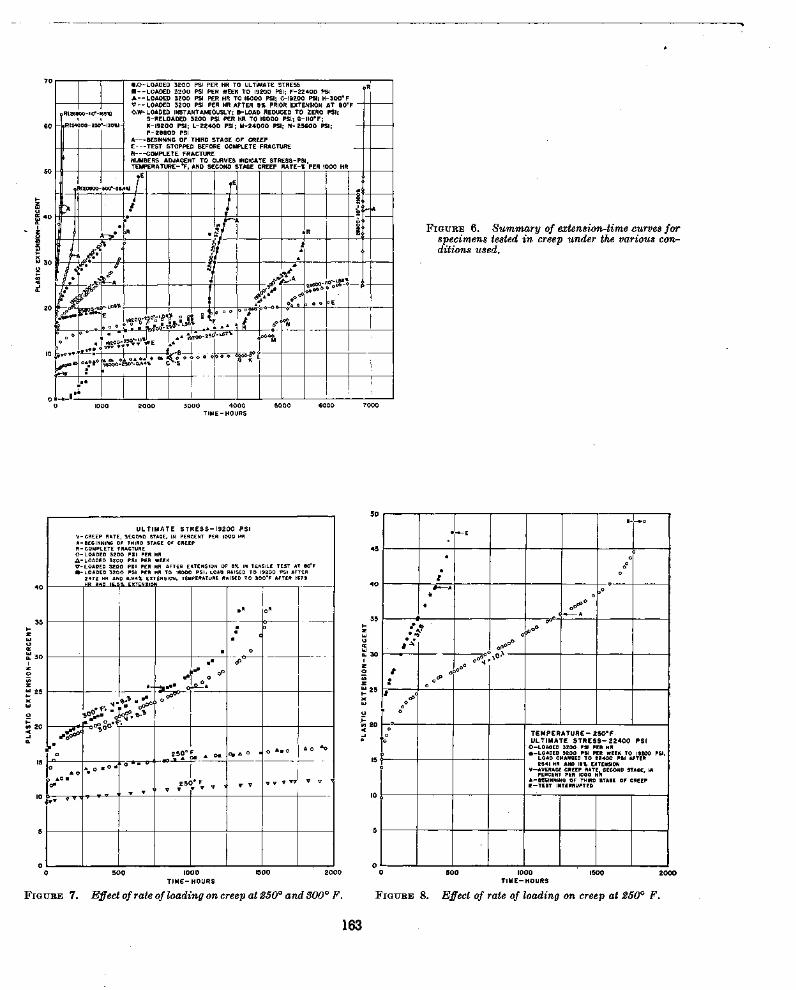
A summary of the extension-time curves for thevarious conditions investigated is given in figure 6,and the influence of prior strain history on creepbehavior is shown by a comparison of these curvesand those reproduced in figures 7, 8, 9, and 10.
At an ultimate stress of 19,200 psi (fig. 7), the4 The term "instantaneous" is used to designate the rate of loading in which
the load was applied gradually over a period of about 30 sec.
156
general trend was for the creep rate at 250° F to de-crease as the rate of attaining the initial extension ofabout 9 percent was increased. That is, for thesame time or strain interval (table 1), the slowestaverage creep rate during the second stage occurredin the specimen initially extended about 9 percentat room temperature, intermediate in the specimenloaded at the standard rate and extended at 250°F, and next fastest in the specimen allowed to creep8.9 percent at 250° F (stress of 16,000 psi) beforeapplying a stress of 19,200 psi. The fastest creeprate occurred in the specimen loaded 3,200 psi/week.At 300° F, the average creep rates in the secondstage and the extensions both at the beginning ofthe third stage and at complete fracture were alikefor specimens either loaded slowly (allowed to creepat 250° F before increasing the test temperature) orat the standard rate, but the total time required toreach the third stage and fracture was greater forthe specimen loaded at the standard (faster) rate.
At an ultimate stress of 22,400 psi (fig. 8), theaverage creep rate in the second stage at 250° F ofthe specimen loaded at the standard rate was onlyabout one-quarter of that of another specimen al-lowed to extend approximately 18 percent at 250°F before applying the ultimate load; the differencein plastic extension at the start of the third stage inthe two specimens is partly due to the difference instrain rates in the second stage.
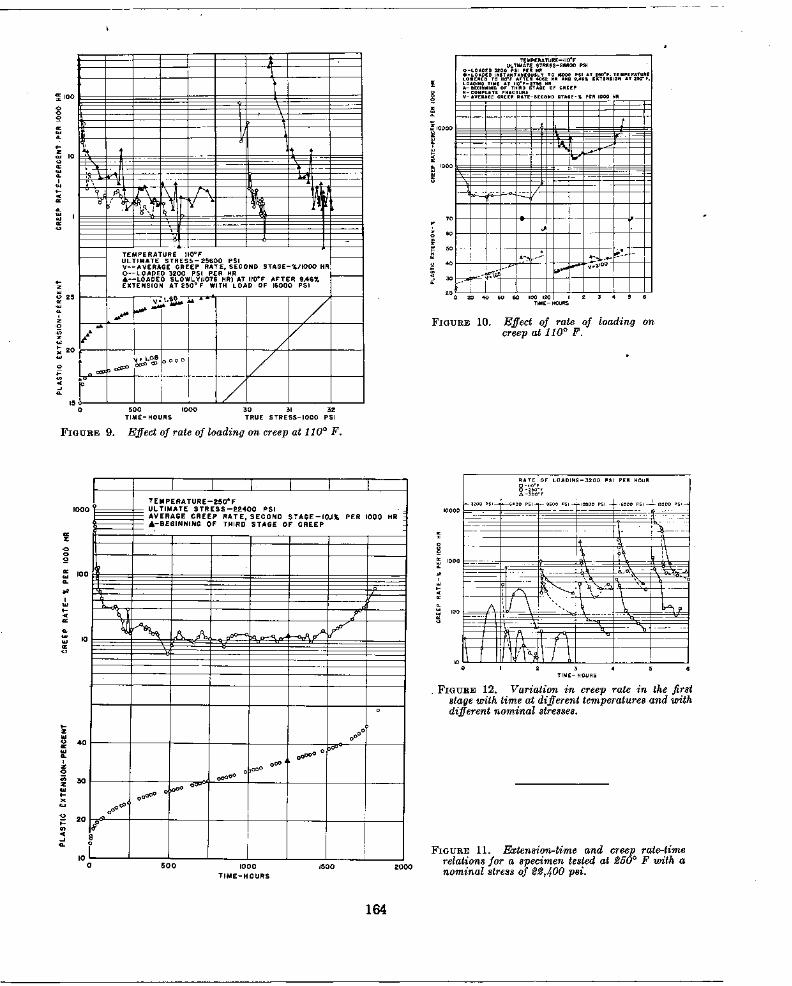
At an ultimate stress of 25,600 psi (fig. 9), theaverage creep rate in the second stage at 110° F ofthe specimen loaded at the standard rate was con-siderably slower than that of the specimen loadedrelatively slowly (extended about 9.5 percent in4,062 hr at 250° F with load of 16,000 psi beforedecreasing temperature to 110° F and then increasingthe load to 25,600 psi in 1,076 hr).
At an ultimate stress of 28,800 psi (fig. 10) theaverage creep rate in the second stage at 110° F ofthe specimen loaded at the standard rate (relativelyfast) was considerably less than that of anotherspecimen allowed to creep at 250° F and at 110° Fwith lower stresses before applying the ultimate.
The extension-time curve for a specimen tested at250° F with an ultimate stress of 22,400 psi into thethird stage of creep is reproduced in figure 11. Thecurve as plotted is typical of the idealized creep intension (constant load and temperature) in that itconsists of an initial extension (about 15 percent) andstages of primary, secondary, and tertiary creep,respectively; the test was discontinued before com-plete fracture. However, the strain rate during theso-called second stage of approximately constant ratewas not constant but varied in a cyclic manner overan appreciable range as is illustrated by the course ofthe creep rate-time curve given in the upper partof the figure. Even in the primary (creep at adecelerating rate) and tertiary stages (creep ataccelerating rate leading to fracture) the change instrain rate with time did not always occur uniformly(continuous decrease or increase, respectively) butoften varied in cycles or showed discontinuities ineach of these two stages.
Although some irregularities were observed in tliecreep rate-time relation in each specimen of high-purity copper as tested in tension in creep, the testconditions and prior mechanical history affected theamplitude and frequency of the cycles or discontinui-ties. For example, the cycles are quite prominentin both the first and second stages for the test condi-tions as given in figure 9. Cycling is not evident inthe first stage in the creep rate-time curve for thespecimen tested at an average creep rate of 165 per-cent per 1,000 hr (fig. 10), or in the third stage ofanother specimen tested at a creep rate of 2,100percent per 1,000 hr. The two specimens differed instrain history, which affected the creep rates. I tshould be pointed out that some cycling or irregu-larity did occur for each of these conditions, however,the cycling trend is not manifested in the curves untilthe time coordinate is expanded considerably overthat used in figure 10. The phenomenon as observedin the first, second, and third stages is not a directresult of the increase in true stress with increase inplastic deformation during the course of the test asis illustrated for the first and second stages in figure 9.
The effects of test temperature and stress on thecycling of strain rate in the first stage of creep ofinitially annealed specimens are shown by a com-parison of the curves in figure 12. The trend was forthe cycling in this stage to decrease in amplitudewith increase in both stress and temperature.
As is illustrated in figure 13, the observed trendwas for the amplitude of the creep rate-plasticextension cycles in the second stage to decrease withan increase in both the strain rate (constant tem-perature) and the temperature (constant strain rate).A significant feature is that at a constant tempera-ture, the beginning of this prominent cycling effectwas shifted to lower strain values as the ultimatestress was decreased. Furthermore, the amount ofplastic extension at the beginning of the second stageof creep decreased with a decrease in ultimate stress.Irregularities are also shown in the creep rate duringthe first and third stages. However, these irregu-larities were less prominent in the third than in thefirst stage and considerably less prominent in boththan in the second stage of creep.
The described discontinuities and cycling con-ditions in the creep rate-time curves are believed tobe due to changes in the degrees of slip and theaccompanying work hardening and recovery.
Cycling in extension-time curves was also ob-served and reported in a previous study of the creepcharacteristics of cold-drawn ingot iron [8].
Any adequate physical theory of the mechanismof the deformation of high-purity copper by creepin tension must account for this variation in strainrate with time or plastic extension.
3. Influence of Prior Strain History on RecoveryCharacteristics
Carreker, Leschen, and Lubahn [9] investigatedthe effect of changing stress on strain rate at roomtemperature of annealed specimens of oxygen-free
157
high-conductivity copper and high-purity lead wires.A discontinuous change in the strain rate followedby a gradual approach to a steady state value wasproduced in polycrystalline aggregates of eachmaterial when the applied stress was suddenlychanged from one to another constant value.
Part of an extension-time curve for a specimentested at 250° F with an ultimate stress of 16,000 psiis given in figure 14. After the specimen wasallowed to extend to about 9.0 percent, the load wasremoved in increments of 3,200 psi/hr, and whencompletely unloaded (temperature not changed), itwas allowed to rest for 33 hr before starting reloadingat the standard rate to an ultimate of 16,000 psi.The specimen was allowed to creep under this stressfor an additional period of about 600 hr when thestress was momentarily increased (position D oncurve); thereafter the specimen continued to creepunder the original load. Although the specimencontracted plastically about 0.07 percent during thecycle of unloading and reloading, and extendedplastically about 0.06 percent as a result of themomentary increase in stress, the average creep ratein the second stage was not significantly affected bythese changes. However, as illustrated by thecourse of the creep rate-time curve, the amplitudeof the cycles increased with these two changes in thetesting procedure.
The change in total extension (elastic and plastic)with time as the above specimen was unloaded insteps of 3,200 psi at an interval of 1 hr is shown infigure 15. Although the frequency of the measure-ments of extension was necessarily decreased in thelate stage of each period of 1 hr, the curves as con-structed to represent the experimental values showdefinite trends that are believed to be characteristic.Cycling is evident in each curve except for thecondition of zero stress. These cycles are moreprominent in the early than in the latter part of theperiods after the application of stresses of 12,800 psi,9,600 psi, or 3,200 psi, and their magnitude appearsto decrease with a decrease in stress. Although thespecimen contracted after the removal of the loadsto attain the stresses of 12,800, 9,600, and 6,400 psi,a noteworthy feature is that the extension increased(not decreased) immediately after the time requiredto make the initial readings. However, no changein extension was detected immediately after makingthe initial reading on reducing the stress to 3,200 psi,and at zero load the specimen contracted rapidly forabout one-quarter hour, and thereafter, even for aperiod of 33 hr, its extension was practically un-changed.
The change in total extension oi the above speci-men after 1 hr under each constant load duringunloading and reloading is shown in figure 16.Similar curves are also reproduced for unloading twoother specimens at 250° F at the same rate (3,200isi/hr) from an ultimate of 19,200 psi. As is shown•y the difference in slope of the curves, the prior
strain history of the specimens affected the degreeof recovery at 250° F during unloading; the decreasein total extension for the three specimens at zero
load ranged from about 0.2 percent for the specimenunloaded from 16,000 psi to about 0.3 percent forthe two specimens unloaded from 19,200 psi.
4. Influence of Temperature and Stress on theAverage Creep Rate in the Second Stage
The relation between nominal stress and averagecreep rate in the second stage of specimens testedat different temperatures is shown in figure 17. At250° F, the experimental values do not fall on astraight line in either a semilog or log-log plot. Thecourse of the stress-strain rate curve was not defin-itely established at 110° or 300° F as only two creeptests were made at each of these temperatures.However, these results show that the resistance tocreep of the initially annealed copper increased witha decrease in test temperature.
5. Variation of Ductility with Temperature andCreep Rate
In the creep tests in which the specimens wereloaded at the standard rate the initial extension,intercept, extension at the start of the third stage,extension at fracture, and reduction of area at frac-ture (fig. 18) each increased with an increase instrain rate (constant temperature) and tended todecrease with an increase in temperature (constantstrain rate). It should be pointed out, however, theextension at fracture of the specimen tested in creepat 110° and 250° F was greater than that of thespecimens fractured at room temperature in theordinary tension test (table 1). The true stress atcomplete fracture of the specimen tested at 110° F(strain rate of 165 percent per 1,000 hr) was alsoconsiderably greater than that of the specimensfractured at room temperature. This increase isbelieved to be due in part to the higher strain ratejust prior to complete fracture of the specimen testedin creep.
6. Influence of Prior Thermal Mechanical Historyon Room Temperature Tensile and HaidnessValues
The effect of plastic extension in creep at 110° and250° F on the flow characteristics at 80° F (roomtemperature) is shown in figure 19. The true stress-strain curves at 80° F (based on total deformation)for the specimens initially as annealed or extendedinto the second stage of creep at rates of about 1.1percent per 1,000 hr are nearly alike over the rangein true stress of 40,000 to 70,000 psi. That is, thecombined effect of creep, work-hardening, and re-covery at 110° or 250° F is not manifested in theshape of the flow curves in this range of stress. Thetrue stress-strain curve at 80° F of the specimenextends into the third stage of creep at 250° F (49%extension at a rate of 10%/l,000 hr) falls appreciablybelow the corresponding curve of the annealedmaterial. The lowering of the flow curve for thisspecimen previously extended in creep can be attrib-uted to its relatively high degree of recovery and
158

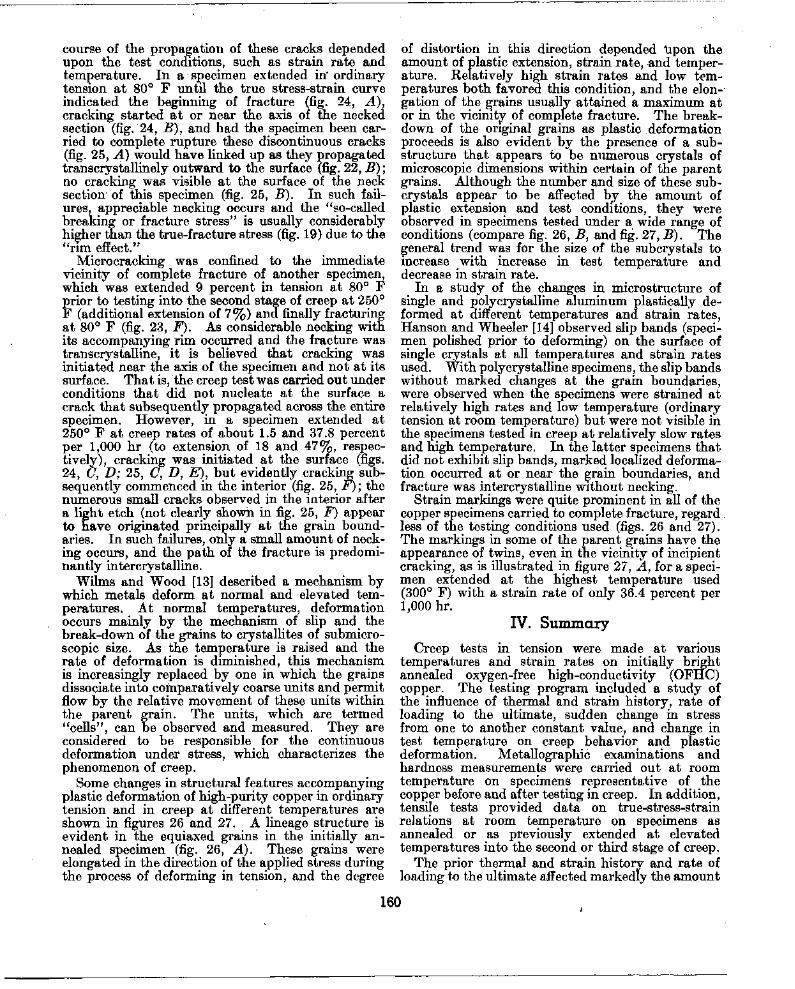
possibly to the presence of cracks of submicroscopicdimensions at the completion of the creep test (fig.23, D and E).
In all cases, the values at maximum load for plasticextension, reduction of area, and true stress wereless in the annealed specimen than the correspondingvalues of the specimens previously extended in creep.However, the values for reduction of area and truestress at both the beginning of and at completefracture were less foi; each of the specimens previouslyextended in creep at 250° F than those of the annealedspecimens or the specimens extended in creep at110° F.
The change in hardness at room temperature withplastic extension (reduction of area) of specimenstested to complete fracture in creep at differenttemperatures and rates, and in tension at roomtemperature, is given in figure 20. The hardness ofthe initially annealed specimens (i?r=34). increasedmarkedly with increase in plastic deformation to thethird stage of creep (20 to 30 percent reduction ofarea, table 1); thereafter the induced hardness variedwith the amount of deformation, temperature ofdeformation, and strain rate. Of the two specimenstested at 300° F, the induced hardness was somewhatgreater and the peak in the hardness-reduction ofarea curve occurred at a greater amount of extensionin the specimen tested at the higher strain rate in thesecond stage. In both specimens, the value forhardness in the vicinity of the fracture was less thanthat at some lower value of extension. The curvesfor the specimen tested in ordinary tension at 70°,and in creep at 110° and 250° F, were quite similarin that none showed a definite break or peak (that is,the maximum hardness is in vicinity of fracture),and the maximum hardness value attained in eachwas greater than that of the specimens tested in creepat 300° F. In the plastic range beyond the beginningof the third stage, however, the curve for the speci-men tested at 250° F is below the curves of the speci-mens at 80° and 110° F.
7. Changes in Microstructure and Fracture Char-acteristics as Affected by Temperature andStrain Rate
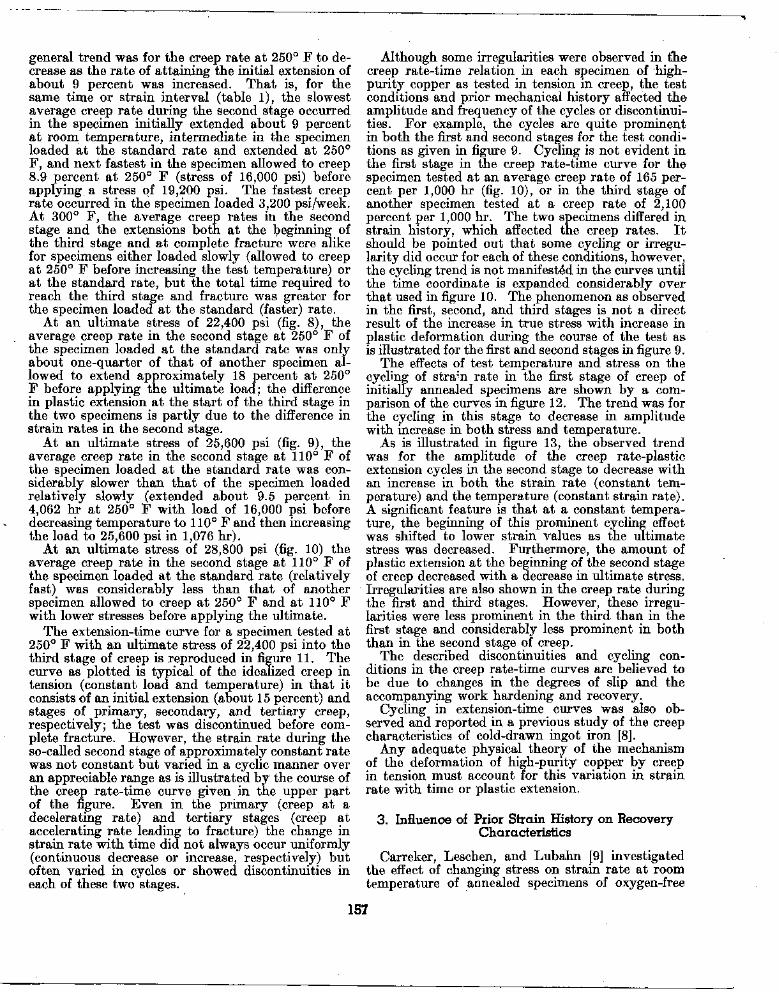
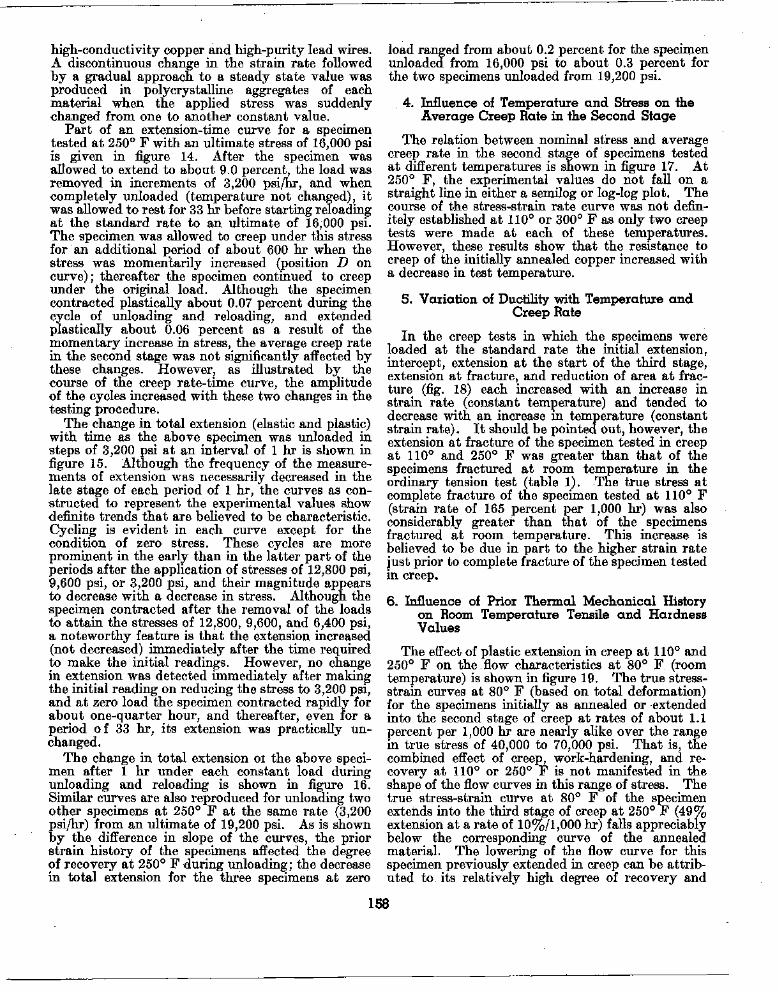
For the specimens tested to complete fracture increep, the propensity to necking (fig. 21) and totranscrystalline fracture (fig. 22) increased with in-crease in strain rate and decrease in temperature.At sufficiently high strain rates and low temperatures,considerable necking occurred (fig. 21, A, B, and G)and the fractures were essentially transcrystalline(fig. 22, B, C, and D), but with relatively slow strainrates and high temperatures no appreciable neckingoccurred (fig. 21, D, E, and F) and the fractures werepredominantly intercrystalline (fig. 22, E and F).In the specimens that fractured in a transcrystallinemanner (fig. 22, B and (7), cracking was confinedprincipally to the region of complete fracture, whereasin the specimens that fractured in an intercrystallinemanner (fig. 22, E and F) numerous cracks (generaldisintegration) were observed in regions remote fromcomplete fracture; some cracks of microscopic dimen-
sions were observed about 0.05 in. from the positionof complete fracture of a specimen in which the frac-ture appeared to be partly intercrystalline but pre-dominantly transcrystalline (fig. 22, D).
The tendency for a specimen to disintegrate asplastic deformation by creep proceeds to intercrystal-line rupture is illustrated by a comparison of typicalphotomicrographs of figures 22, F, and 23, A and B.Appreciable cracking is evident even at a deformationcorresponding to the beginning of the third stage ofcreep (fig. 23, B) in a specimen tested at 300° F tocomplete rupture. Similar conditions were observedin another specimen fractured in creep at the sametemperature (300° F) and strain rate (8.3%/l,000hr) but with an entirely different strain history.Furthermore, cracking at deformations correspond-ing to the beginning of the third stage of creep wasdetected in two other specimens tested at a lowertemperature (250° F) and different strain rates (fig.23, C and D). The creep tests of the latter twospecimens were terminated during the third stagebefore complete fracture, but one specimen was sub-sequently fractured at 80° F.
Only a few cracks of microscopic size were observedat a deformation corresponding to the beginning ofthe third stage in the specimen extended in creep at250° F and finally fractured at 80° F (fig. 23, D).Although these cracks were located principally in theinterior of the specimen in the vicinity of its axis, afew cracks were also located at the surface (fig. 23,E). The surface cracks (not detected at a magni-fication of about 25 diameters) were invisible at theend of the creep test. As previously shown (fig. 19),the true stress-strain curve at 80° F of this specimenwas materially lowered by extending in creep, andthis decrease in resistance to flow might be partlydue to the presence of submicroscopic cracks at thetermination of the creep test.
It is evident, therefore, that under certain condi-tions the third stage of c^eep can be accompanied bycracking, but other evidence (fig. 22, G) shows thatcracks of microscopic dimensions are not a pre-requisite for the initiation of the third stage of creepin high-purity copper.
Baeyertz, Craig, and Bumps [10] reported the pres-ence of discontinuous cracks in steel fractured byimpact, and Jaffee, Reed, and Mann [11] also founddiscontinuous cracks adjacent to the path of finalbrittle failure in both fatigue and impact specimensmade from steel forgings and castings. Tipper [12]observed microcracks near the fracture of mild steelplates. Jaffee and coauthors [11] were of the opinionthat brittle transgranular fracture of polycrystallinemetal does not originate at one point and propagatecontinuously across the material, but rather nucleateat numerous related points, leading to a series ofmicrocracks that link up subsequently.
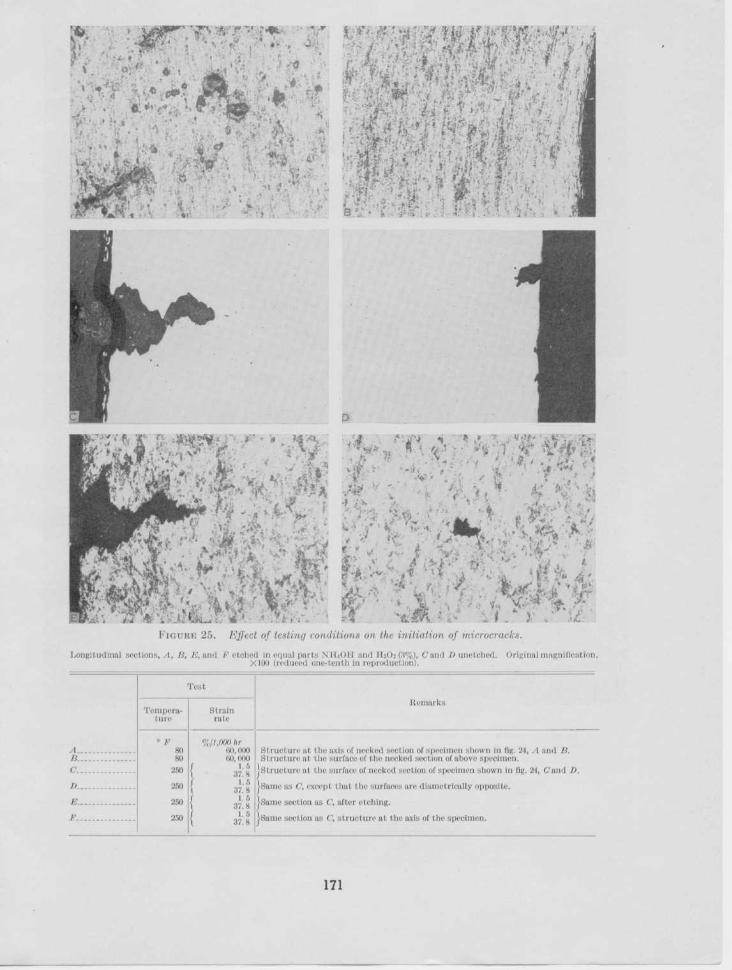
In some cases, cracking leading eventually to com-plete fracture was initiated at the axis of specimenstested in tension, whereas in other specimens crackingwas initiated at the surface. As is illustrated infigure 24 and 25, the position (interior or exterior ofthe specimen) where cracking was initiated and the
159
course of the propagation of these cracks dependedupon the test conditions, such as strain rate andtemperature. In a specimen extended in' ordinarytension at 80° F until the true stress-strain curveindicated the beginning of fracture (fig. 24, A),cracking started at or near the axis of the neckedsection (fig. 24, B), and had the specimen been car-ried to complete rupture these discontinuous cracks(fig. 25, A) would have linked up as they propagatedtranscrystallinely outward to the surface (fig. 22, B);no cracking was visible at the surface of the necksection of this specimen (fig. 25, B). In such fail-ures, appreciable necking occurs and the "so-calledbreaking or fracture stress" is usually considerablyhigher than the true-fracture stress (fig. 19) due to the"rim effect."
Microcracking was confined to the immediatevicinity of complete fracture of another specimen,which was extended 9 percent in tension at 80° Fprior to testing into the second stage of creep at 250°F (additional extension of 7%) and finally fracturingat 80° F (fig. 23, F). As considerable necking withits accompanying rim occurred and the fracture wastranscrystalline, it is believed that cracking wasinitiated near the axis of the specimen and not at itssurface. That is, the creep test was carried out underconditions that did not nucleate at the surface acrack that subsequently propagated across the entirespecimen. However, in a specimen extended at250° F at creep rates of about 1.5 and 37.8 percentper 1,000 hr (to extension of 18 and 47%, respec-tively), cracking was initiated at the surface (figs.24, C, D; 25, C, D, E), but evidently cracking sub-sequently commenced in the interior (fig. 25, F); thenumerous small cracks observed in the interior aftera light etch (not clearly shown in fig. 25, F) appearto nave originated principally at the grain bound-aries. In such failures, only a small amount of neck-ing occurs, and the path of the fracture is predomi-nantly intercrystalline.
Wilms and Wood [13] described a mechanism bywhich metals deform at normal and elevated tem-peratures. At normal temperatures, deformationoccurs mainly by the mechanism of slip and thebreak-down of the grains to crystallites of submicro-scopic size. As the temperature is raised and therate of deformation is diminished, this mechanismis increasingly replaced by one in which the grainsdissociate into comparatively coarse units and permitflow by the relative movement of these units withinthe parent grain. The units, which are termed"cells", can be observed and measured. They areconsidered to be responsible for the continuousdeformation under stress, which characterizes thephenomenon of creep.
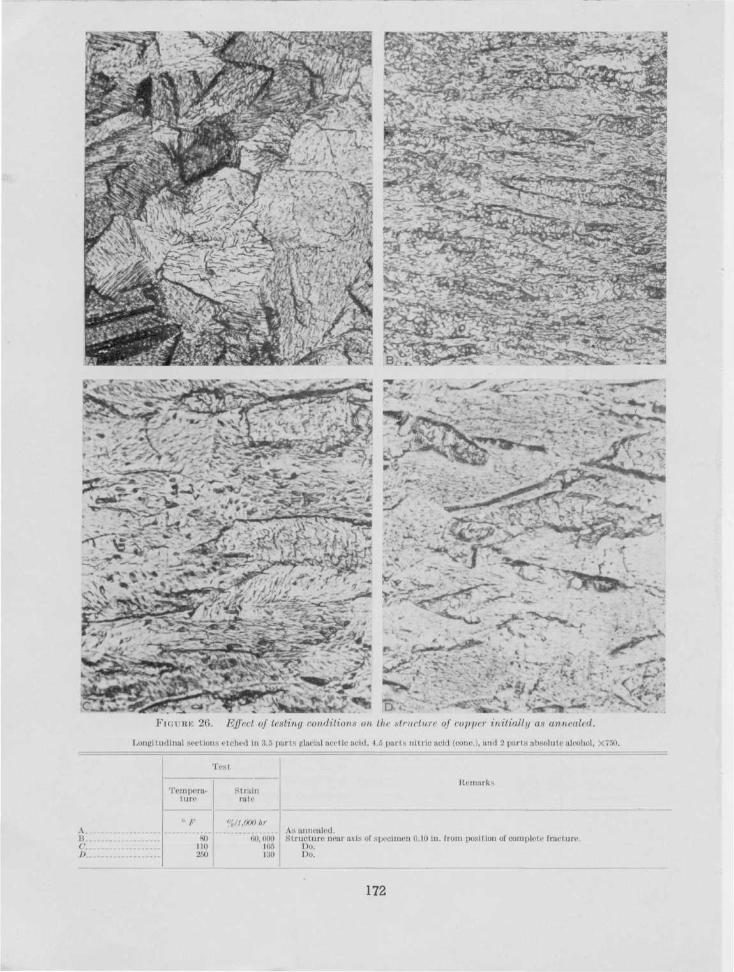
Some changes in structural features accompanyingplastic deformation of high-purity copper in ordinarytension and in creep at different temperatures areshown in figures 26 and 27. A lineage structure isevident in the equiaxed grains in the initially an-nealed specimen (fig. 26, A). These grains wereelongated in the direction of the applied stress duringthe process of deforming in tension, and the degree
of distortion in this direction depended upon theamount of plastic extension, strain rate, and temper-ature. Relatively high strain rates and low tem-peratures both favored this condition, and the elon-gation of the grains usually attained a maximum ator in the vicinity of complete fracture. The break-down of the original grains as plastic deformationproceeds is also evident by the presence of a sub-structure that appears to be numerous crystals ofmicroscopic dimensions within certain of the parentgrains. Although the number and size of these sub-crystals appear to be affected by the amount ofplastic extension and test conditions, they wereobserved in specimens tested under a wide range ofconditions (compare fig. 26, B, and fig. 27, B). Thegeneral trend was for the size of the sub crystals toincrease with increase in test temperature anddecrease in strain rate.
In a study of the changes in microstructure ofsingle and polycrystalline aluminum plastically de-formed at different temperatures and strain rates,Hanson and Wheeler [14] observed slip bands (speci-men polished prior to deforming) on the surface ofsingle crystals at all temperatures and strain ratesused. With polycrystalline specimens, the slip bandswithout marked changes at the grain boundaries,were observed when the specimens were strained atrelatively high rates and low temperature (ordinarytension at room temperature) but were not visible inthe specimens tested in creep at relatively slow ratesand high temperature. In the latter specimens thatdid not exhibit slip bands, marked localized deforma-tion occurred at or near the grain boundaries, andfracture was intercrystalline without necking.
Strain markings were quite prominent in all of thecopper specimens carried to complete fracture, regardless of the testing conditions used (figs. 26 and 27).The markings in some of the parent grains have theappearance of twins, even in the vicinity of incipientcracking, as is illustrated in figure 27, A, for a speci-men extended at the highest temperature used(300° F) with a strain rate of only 36.4 percent per1,000 hr.
IV. SummaryCreep tests in tension were made at various
temperatures and strain rates on initially brightannealed oxygen-free high-conductivity (OFHC)copper. The testing program included a study ofthe influence of thermal and strain history, rate ofloading to the ultimate, sudden change in stressfrom one to another constant value, and change intest temperature on creep behavior and plasticdeformation. Metallographic examinations andhardness measurements were carried out at roomtemperature on specimens representative of thecopper before and after testing in creep. In addition,tensile tests provided data on true-stress-strainrelations at room temperature on specimens asannealed or as previously extended at elevatedtemperatures into the second or third stage of creep.
The prior thermal and strain history and rate ofloading to the ultimate affected markedly the amount
160

of plastic deformation and creep behavior. Thegeneral trend was for the degree of plastic deforma-tion and creep rate in the second stage to decrease asthe rate of loading was increased.
The strain rate during the second stage of creepwas not constant but varied with time in a cyclicmanner. The trend was for the amplitude of thesecycles to decrease with increase in both stress andtemperature.
In some cases, the beginning of the third stage ofcreep was accompanied by cracks of microscopicdimensions, but the presence of such cracks are not aprerequisite for the initiation of the third stage ofcreep in high-purity copper.
The positions at which cracks were nucleated andthe course of their propagation were affected by thetest conditions. Cracking started at or near theaxis of the specimen tested in ordinary tension atroom temperature. These discontinuous cracksunited as they propagated transcrystallinely outwardtoward the surface, and appreciable necking oc-curred in the specimen before complete rupture.Cracking started at the surface of a specimen testedinto the third stage of creep at 250° F, but at a laterstage numerous small cracks were also nucleated inits interior, principally in the parent grain boundaries.Complete rupture occurred in this specimen withoutappreciable necking and the fracture was predom-inantly intercrystalline.
The degree of necking, ductility at the beginningof the third stage and at complete rupture, and thepropensity to transcrystalline fracture of the speci-mens tested in creep increased with an increase instrain rate (temperature constant) and with a de-crease in temperature (strain rate constant).
Metallographic examination showed the break-down of the original grains of the copper thatoccurred with plastic deformation under a widerange of test conditions. Strain markings were alsoobserved in all specimens that were carried to com-plete rupture. Some of these markings had theappearance of twins.
The authors are indebted to J. H. Darr, C. R.Johnson, and F. A. Wilkinson for assistance inmaking many of the measurements of creep.
V. References[1] D. J. McAdam, Jr., G. W. Geil, and D. H. Woodard,
Influence of strain rate and temperature on the me-chanical properties of Monel metal and copper, Proc.Am. Soc. Testing Materials 46, 902 (1946).
[2] E. R. Parker and C. F. Riisness, Effect of grain size andbar diameter on creep rate of copper at 200° C, MetalsTech. 11, TP 1690 (Feb. 1944); Trans. Am Inst.Mining Met. Engrs. (Inst. of Metals Div.) 156, 117(1944).
[3] E. R. Parker, The effect of impurities on some high tem-perature properties of copper, Trans. Am. Soc. Metals29, 269 (1941).
[4] E. A. Davis, Creep and relaxation of oxygen-free copper,Trans. Am. Soc. Mech. Engrs. 65, [A] 101 (1943).
[5] H. L. Burghoff and A. I. Blank, The creep characteristicsof copper and some copper alloys at 300, 400, and500° F, Proc. Am. Soc. Testing Materials 47, 725 (1947)
[6] A. D. Schwope, K F. Smith, and L. R. Jackson, Thecomparative creep properties of several types of com-mercial coppers, J. Metals 1, (July 1949); MetalsTrans. 185, 409 (1950).
[7] J. A. Bennett and D. J. McAdam, Jr., Creep rates ofcold-drawn nickel-copper alloy (Monel metal), J. Re-search NBS 38, 417 (1942) RP1462.
[8] W. D. Jenkins and T. G. Digges, Influence of strain rateand temperature on the creep of cold-drawn ingotiron, J. Research NBS 43, 117 (1949) RP2013.
[9] R. P. Carreker, J. G. Leschen and J. D. Lubahn, Tran-sient plastic deformation, Trans. AIME (Inst. of Met.Div.) 180, 139 (1949); Metals Tech. 15 (Sept. 1948)TP2477.
[10] M. Baeyertz, W. F. Craig, Jr., and E. S. Bumps, Ametallographic description of fracture in impactspecimens of a structural steel, J. Metals 1 (August1949); Metals Trans. 185, 481 (1950).
[11] L. D. Jaffe, E. L. Reed, and H. C. Mann, Discontinuouscrack propagation—Further studies, J. Metals 1(Oct. 1949); Metals Trans. 185, 683 (1950).
[12] C. F. Tipper, Brittle fracture in mild-steel plates II,Engineering 165, 594 (1948).
[13] G. R. Wilms and W. A. Wood, Mechanism of creep inmetals, J. Inst. Metals 75, 693 (1949).
[14] D. Hanson and M. A. Wheeler, The deformation of metalsunder prolonged loading. I—The flow and fractureof aluminium, J. Inst. Metals Proc. 45, 229 (1931).
161
o6o
AIfft/
-O
A - LOADED TO PRODUCE STRAIN RATE OF
5 10 15
PLASTIC EXTENSION-PERCENT
FIGURE 1. Effect of nominal stress on plastic extensionat different temperatures.
I2 io
I 5
TEMPERATURLOADED 3200 PS
E- 250° FPER HR
/
/
Y9.0 9.1 9.2
PLASTIC EXTENSION-PERCENT9.3
FIGURE 3. Effect of nominal stress onplastic extension at 250° F.
The specimen was initially extended 9 percent in ten-sion at 80° F. The values for extension are those ob-tained 1 hour after the application of the loads.
FIGURE 5. Effect of rate of loading and priorthermal-mechanical history on plastic extension at110° F.
TIME-MINUTES
FIGURE 2. Variation in plastic extension with time at300° F with different nominal stresses.
/
f
^ ^
< ^
TEMPERATURE 250°Fq»-LOADeO INSTANTANEQUSLY TO 16000 PSI; EXTENSION
RESPECTIVELY, AFTER APPLICATION OF LOAD
O — LOADED 3200 PSI PER HR TO 2 2 4 0 0 PSIj EXTENSION
APPLICATION OF EACH LOAD
APPLICATION OF LOAD; LOAD THEN INCREASED TO 19200 PS
1 HR AFTER APPLIC/\A- LOADED 3200RESPECTIVELY, AFT
ATION OF LOAD
PSI PER WEEK TO
ER APPLICATION OF9200 PSI; EXTENSIO
LOAO
HR AND 1 WEEK.
HR AFTER
472 HR AFTER
; EXTENSION
1 HR AND 1 WEEK,
PLASTIC EXTENSION-PERCENT
FIGURE 4. Effect of rate of loading on plastic exten-sion at 250° F.
30
25
20
15
10
J
O-L0ADE0 3200 PSI PER HR; EXTENSION 1 HR AFTER APPLICATION OF LOAOA-LOAOED INSTANTANEOUSLY IN INCREMENTS AS SHOWN; EXTENSION 1 HR
TEMPERATURE IIO'F
9
AIf^190 HR
2 HR
HR
PLASTIC EXTENSION-PERCENT
162
?R( 28800-110*-165%)
R(24OOO-25O*-I3O%)
•,O-LOADED 3200 PSI PER HR TO ULTIMATE STRESS• --LOADED 3200 PSI PER WEEK TO 19200 PSI; F-22400 PSIA--LOADED 3200 PSI PER HR TO 16000 PSI; C-19200 PSI; H-300°FV--LOADED 3200 PSI PER HR AFTER 9% PRIOR EXTENSION AT 80°F "O.W-LOADED INSTANTANEOUSLY; B-LOAD REDUCED TO ZERO PSI;
S-RELOADED 3200 PSI PER HR TO 16000 PSI; G-IIO°F;K-19200 PSI; L-22400 PSI; M-24000 PSI; N- 25600 PSI;P-28800 PSI
A---BEGINNING OF THIRD STAGE OF CREEPE---TEST STOPPED BEFORE COMPLETE FRACTURER---COMPLETE FRACTURENUMBERS ADJACENT TO CURVES INDICATE STRESS-PSI.TEMPERATURE-°F, AND SECOND STAGE CREEP RATE-% PER 1000 HR
FIGURE 6. Summary of extension-time curves forspecimens tested in creep under the various con-ditions used.
2000 3000 4000 5000TIME-HOURS
6000 7000
A-BEGINNING C
ULTIMATE STRESS-19200 PSI
A-LOADED 3200 PSI PER WEEK
• -LOADED 3200 PSI PER HR TO 16000 PSI. LOAD RAISED TO 19200 PSI AFTER
•
O
0A O
O"
r ov*-
A . o . O "
A—
1 o A • u
• O
2 5 0 o
25Cv v
•
>• A ° "
>• ^ v ,
-R
•
o
O. A O -
V V
O R
0
o A« o
V V V W
A o AO
V V *
45
40
35
30
25
20
<
10 ,
0
•
•
••
•*v
/
' yo
o
o
o
) \
0
o0
TEMPERATURE- 25O°FULTIMATE STRESS-22400 PSI
O-LOADED 3200 PSI PER HR0-LOADED 3200 PSI PER WEEK TO 19200 PSI,
2S4I HR AND 16% EXTENSIONV-AVERAGE CREEP RATE, SECOND STAGE, IN
PERCENT PER 1000 HRA-BEGINNING OF THIRD STAGE OF CREEPE—TEST INTERRUPTED
0 500
FIGURE 7. Effect of rate of loading on creep at 250° and 300° F.
1000TIME-HOURS
1000TIME-HOURS
FIGURE 8. Effect of rate of loading on creep at 250° F.
163
TEMPERATURE IIO°FULTIMATE STRESS-25600 PSIV--AVERA6E CREEP RATE, SECOND STAGE-%/IOOO HRO—LOADED 3200 PSI PER HRA—LOADED SLOWLY(IO76 HR) AT IIO°F AFTER 9.46%EXTENSION AT 250° F WITH LOAD OF 16000 PSI
500TIME-HOURS
30 31 32TRUE STRESS-IOOO PSI
0000
1000
70
60
50
40
30
J
O-L0ADED 32
• - L O A D E D IN
LOWERED TOLOADING TIME
A - BEGINNING
\
I
f
3O jPO—
pd
TEMPERATURE-IIO'FULTIMATE STRESS-28800 PSI
30 PSI PER HRTANTANEOUSLY TO 16000 PSI AT 250*F.IO°F AFTER 4062 HR ANO 9.46% EXTENS
AT IIO*F-2755 HROF THIRD STAGE OF CREEP
0 20 40 60 80 1
/
oo 120
^j»—'
TEMPERATUREON AT 250* F.
T
FIGURE 10. Effect of rate of loading oncreep at 110° F.
FIGURE 9. Effect of rate of loading on creep at 110° F.
TEMPERATURE-250°FULTIMATE STRESS-22400 PSIAVERAGE CREEP RATE, SECOND STAGE-IO.1% PER 1000 HRA-BEGINNING OF THIRD STAGE OF CREEP
A A,
oo°°°
1000TIME-HOURS
0000
1000
100
10
— 3 2 0 0 P S I — •
A
711\ \
RATE
O -250A -300
9
A:l/ \^ \
h
OF L O A D I N
T
1 1
G - 3 2 0 0 PS
•- 12800 PSI —
\
? h \ - --o^
\
PER HOUR
\
i
q
V
? i \
TIME-HOURS
FIGURE 12. Variation in creep rate in the firststage with time at different temperatures and withdifferent nominal stresses.
FIGURE 11. Extension-time and creep rate-timerelations for a specimen tested at 250° F with anominal stress of 22,400 psi.
164

XoI
a.I
10000
1000
100
10
O-L0ADED 3200 PSI PER HR-250"F• - - u -300°FA-L0A0 CHANGEO TO 22400 PSI AFTER 18% EXTENSIONWITH LOAD OF 19200 PSI. TEMPERATURE- 250°F FORDURATION OF TESTE-TEST INTERRUPTED
NUMBERS ADJACENT TO CURVES REPRESENT ULTIMATESTRESSES IN POUNDS PER SO IN
NUMBERS ADJACENT TO O INDICATE PLASTIC EXTEN-SION, PERCENT, AT FRACTURE
OJ10 15 20 4 0 4525 30 35
PLASTIC EXTENSION-PERCENT
FIGURE 13. Variation in creep rate with plastic extension at 250° and 300° F.
50 55 6 0
0.8
0.6
0 4
0.3
0.2
9.4
9.2
9.1
9.0
8.9
8.8
8.7
\
V
0
A\K\
B-
C -
A ft1 (X
V9/ \
f \
r
D
E
oY/
ilk1 VIy
A
/ \
1
TEMPERATURE-250 o FJLTIMATE STRESS-16000 PSAVERAGE CREEP RATE-0.33%0 0 0 HRJ-UNLOADED 3200 PSI PER HR
)-L0AD'-TEST
FLUCTUC0NDI1
ATEOIONS C HANGED
PER
18 20 22 24 26 28 30 32 34 36 38 40 42 44TIME-100 HR
FIGURE 14. Variations in plastic extension and creep ratewith time at 250° F.
i
-PE
RC
EN
TCD
C
D
t2
K 8.94
8 91
8.90
\ f}
fhi
\
12800 F SI
. - -
o' 1
9600 P
6 *00 P
-4-«SI
SI
TEMPERATURE 25O°FUNLOADING RATE- 3200 PSI PER HRINITIALLY LOADED INSTANTANEOUSLY TO AN U L -
TIMATE STRESS OF 16000 PSI AT 25O°F.ALLOWED TO EXTEND FOR 2472 HOURS TO 9 0 1 %PLASTIC EXTENSION BEFORE REDUCTION OF LOAD
WAS STARTED. TEMPERATURE UNCHANGED FOR
DURATION OF TEST
ahr *-32OC PSI
1ZER
f—3 STR
ESS
|
" " " "1
8.8T
8.82
TIME-MINUTES
FIGURE 15. Change in extension with time at 250° Fof a specimen unloaded from 16,000 psi.
Some creep characteristics of this specimen before and after unload-ing and reloading are given in figure 14.
165

UNLOADING R A T E - 3 2 0 0 PSI PER HOUR
O-ORIGINALLY ANNEALED; LOADEO 3200 PSI PER HOUR TO 19200 PSI AT
250°F; ALLOWED TO CREEP AT 250°F FOR 8111 HR TO 22.9% EXTENSION
A - - E X T E N D E D 9% IN TENSION AT 80"Fj LOADEO 3 2 0 0 PSI PER HOUR
TO 19200 PSI AT 250°F; ALLOWED TO CREEP AT 25O°F FOR 2700 HR TO
16% EXTENSION
O-ORIGINALLY ANNEALED; LOADED INSTANTANEOUSLY TO 16000 PSI AT
25O*F; ALLOWED TO CR£EP AT 250°F FOR 2472 HR TO 9% EXTENSION. ^ ^ J
A - ZERO STRESS 33 HR) RELOADED AT RATE OF 3200 PSI PER HR
DECREASE IN EXTENSION-PERCENT
FIGURE 16. Change in total extension at 250° Fduring unloading specimens initially at stressesof 16,000 or 19,200 psi.
00
80
60
4 0
20
O - N O T TESTED IN CREEP• -TESTED AT 80°F TO 9% EXTENSION AT STRAIN RATE OF 6XI0 4 % PER 1000 MR; AND
TESTED IN CREEP AT 250°F WITH CREEP RATE OF 1.1% PER 1000 HR FOR 2700 HR
D - 250°F « » » « 10.1% '• » " " 1824 "RT-BEGINNING OF FRACTURER l i 2 i 3 i 4-COMPLETE FRACTURE; R, =STRAIN-I.94, TS-145200; R2«STRAIN-2.i l . TS-139000
o
oo
o
O L J
£
I.l i
A
M~C
* M
D
0•
DDa
D
A
^ M
a
•
• a o<
A
: R 4
/
<
A
RT
/ '
/ « 2
0.6 0.8 1.0STRAIN-LOGe Ao/A
FIGURE 19. Effect of extending in creep at different temperatures on thetensile properties at room temperature of initially annealed copper.
1LOG-LO
/
SEMI-LC
/
ill0 -
/
G
*
. . . .. - — -
• r "
*
. 0
F .
A-r
, o
FIGURE 17. Relation between nominalstress and creep rate at different tempera-tures.
The creep rate is the average value obtained during thesecond stage.
/
/ /
11
1/
1/1/II
11\l
ti-ll
11
/ /
/
A%
l o o
J20
NlINA>
S
H
IN
Z. • — ^
—D
JMBERS ADJACENT TO CURVDICATE TEMPERATURE IN °F/ERAGE RATE OF EXTENSIO^ZCOND STAGE, IN % PER 105URS; AND TOTAL TEST TIN
HOURS
fES
1,
DO
E
DUCTILITY-PERCENT
20 40 60REDUCTION OF AREA-PERCENT
100
FIGURE 18. Influence of creep rate on ductility at differenttemperatures.
The creep rate is the average value obtained during the second stage.
FIGURE 20. Effect of plastic deformation at differenttemperatures and rates on hardness at room temperature.
166
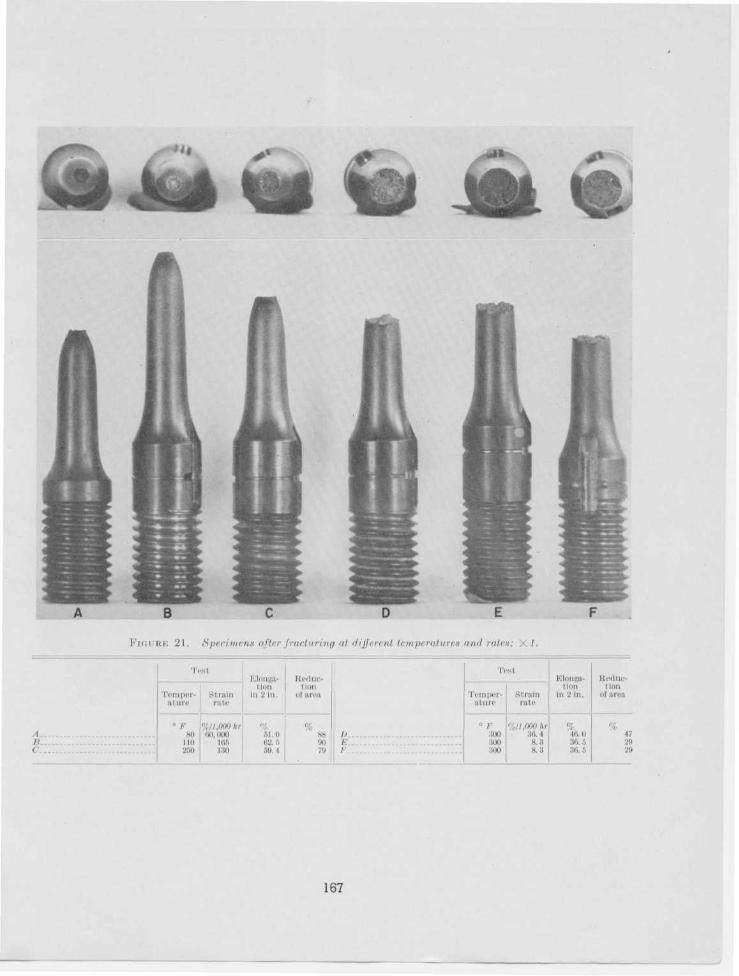
FIGURE 21. Specimens after fracturing at different temperatures end rates;
1/>•
c
Test
Temperul me
• / , •
SOMi)250
Strain
rate
%/l,000 III-IM 001)
iii.r.130
Elonga-tion
i n 2 i l l .
51.062 589. 1
Reduc-tion
of area
Sh8079
1)K/
Test
Temper-ature
O p300300300
Strainrate
%l 1,000 hr36. 18.38,3
Elonga-tion
in 2 i n .
' ,46. o36. .r>36. .r>
Reduc-1 inn
of area
472929
167

FIGURE 22. drain .size of annealed copper and structures at fracture of specimenstested at different temperatures and rale*.
Longitudinal sections e tched In equal parts NH«OH and ii:'<>: <•
1
i:C...I)/.;F...
Test
Temperature
/
80I K )2S0300300
Strainrate,
%/lfiOOkr
60,000Ki.r>13038 18.3
Elonga-tion in
2 In.
61.0
69. I46. o36. 8
Reduc1 inn ofarea
" • ;
8890791729
Remarks
ilium of average grain.xioo.Xloo.xioo.Xioo.Xioo.
168

\ TP 8 a
XA %
.•> ••£.';&'-,.
D * ^
f-*-
FIGURE 215. Effect of temperature, rate, and plastic deformation on microcraching.
Longitudinal sections near axis of specimen, except as Indicated, etched In equal pa r t s of N i i i O i i and H J O J ( 3 % ) . Originalmagnification, XlOO (reduced one-tenth In reproduction).
i
/{
C.D.
/<:/ • •
Test
Temper-ature
300
800
2fiO
260
Strain rate
%/l,O0Ohr8.3
(37.8(b)
10. i
ID. i1. 16
Remarks
Structure 0.06 In. from complete fracture. Structure at fracture Is shown In fig.22, F.
Same specimen as above, structure, at deformation Corresponding to the beginningof third stage,
(a) 19,200 psi for 2,5.10 hr; (i>) 22,400 psi for 483 lir; stopped In third Btage; structureat, il
Stopp
Kxlenseoofracture.
formation corresponding t<id in third Btage; fracturespondlng to the beginning
Same specimen as above; StrUCtUled 9% at room tempera
the beginningi at room temjif third stage.
at surface 0.0!ire; 19,200 psi
id Stage and then fractured at room t(
bird stage,lerature; structure at deformation
in. from complete fracl lire,it, 250" F for 2,7(10 hr; slopped innpcrailire; structure at complete
169

24. Photographs and radiograph of specimens after testing at different temperatures and rates.
i
B
C.
D
Test
Tempera-ture Strain rate
%/l,OOOhr60,000DO, 000
L.6(a)37.8(1))
1.637.8
Remarks
Photograph, x i .Radiograph of above specimen, Indicating tin' presenoe of a oradt In the necked section.
[(a) 10,200 psi for 2,640 hr; (b) 22,400 psl for 483 hr; photograph XI.
Photograph, XIO Of above specimen Showing the presence of a crack ill I lie surface Of the necked.section.
170
m
(•/*• ~Mr: i *
;•*«?*
At
FIGURE 25. Effect of testing conditions on the initiation of microcracks.
Longitudinal sections, A, H, E, and Fetched In equal parts NH4OH and EjO a (3%), C and D unetched. Original magnificat Ion,X100 (reduced one-tentb In reproduction).
A
C.
D
E.
F
Tempera-ture
soso
260
260
2.r.0
rest
Strainrate
%/l,0OOhr(10,0(1060,000
I 37! s
1 87! 8/ l «\ 37. s1 1.6{ ;57. s
Remarks
Structure at the axis of necked section of specimen shown in fi . 24, .1 and /{.Structure at the surface of the necked section of above specimen.
jStructure at the surface of necked section Of specimen shown in li^. 21, C'and 1).Same as c, except, that the surfaces are diametrically opposite.
•Same seel ion as ( ', a l ter etching.
Lsame section as C, s t r u c t u r e at the axis of the specimen.
171
, • — .
FIGXJBB 26. Effect of testing conditions on the structure of copper initially as annealed.
\lic1)
Longitudinal sect ions etched In :i.r> parts glacial acetic acid, 1.5 parts nitric acid (cone.), and 2 parts absolute alcohol, X7f><>.
Tesl
Tempera-ture
80no
SI rainrale
%ll,0O0hr
80,000
130
Remarks
As annealed.Structure near axis of specimen 0.10 In. from position of complete fracture.
Do.Do.
172
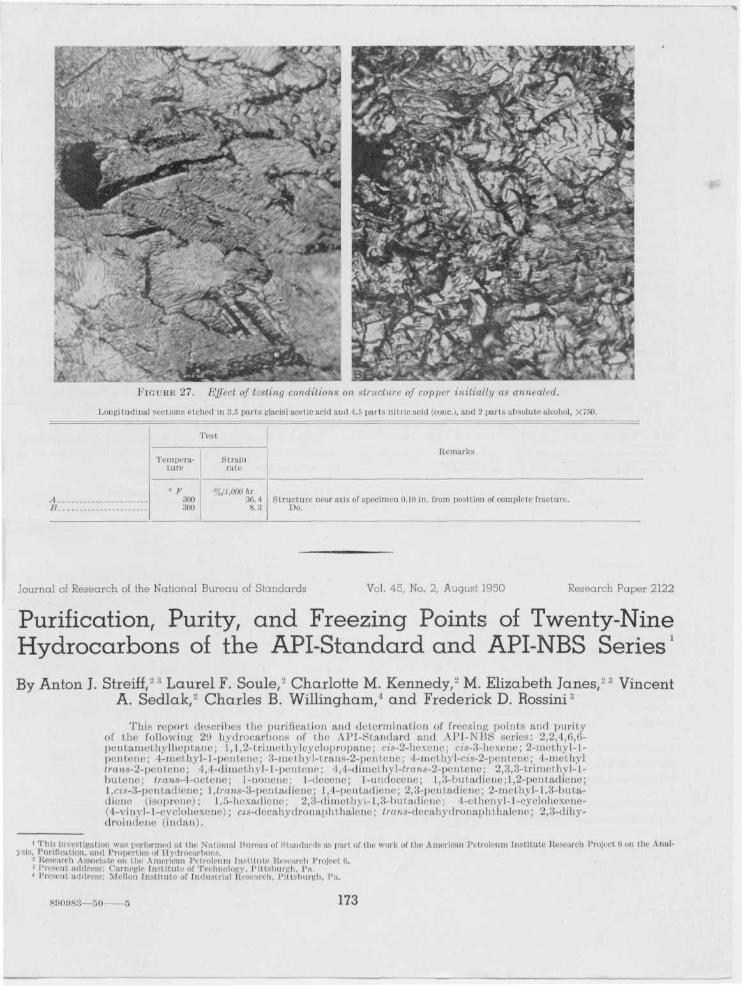
•c.
FIGURE 27. Effect of testing conditions on structure of copper initially as annealed.
Longitudinal sections etched in 3.5 parts glacial acetic acid and 4.5 parts nitric acid (cone), and 2 parts absolute alcohol, X750.
AB
Tempera-ture
° F300300
rest
Strainrate
%/1,000 hr36. 48.3
Remarks
Structure near axis of specimen 0.10 in. from position of complete fracture.Do.
Journal of Research of the National Bureau of Standards Vol. 45, No. 2, August 1950 Research Paper 2122
Purification, Purity, and Freezing Points of Twenty-NineHydrocarbons of the API-Standard and API-NBS Series'By Anton J. Streiff,'~:i Laurel F. Soule,"- Charlotte M. Kennedy,'2 M. Elizabeth Janes,-;! Vincent
A. Sedlak,2 Charles B. Willingham,4 and Frederick D. Rossini!
This report describes the purification and determination of freezing points and purityof the following 29 hydrocarbons of tin- API-Standard and A.PI-NBS scries: 2,2,4,6,6-pentamethylheptane; i, I ,'2-i rimethylcyclopropane; cis-2-hexene; ci8-3-hexene; 2-methyl-l-pentene; 4-methyl-l-pentene; 3-methyl-trans-2-pentene; 4-methyl-cis-2-pentene; 4-methyltrans-2-pentene; 4,4-dimethyl-l-pentene; 4,4-dimei hyl-<rons-2-pentene: 2,3,3-trimei hy]-l-butene; tran8-4-octene; L-nonene; L-decene; L-undecene; L,3-butadiene;l,2-pentadiene;I ,ci8-3-pentadiene; I ,<rans-3-pentadienej l ,4-pentadiene; 2,3-pentadiene; 2-me1 hyl- L,3-buta-diene (isopreue); L,5-hcxadiene; 2,3-dimethyi-1,3-butadiene; l-<ii nenyl-1-cyclohexene-(4-vinyl- L-cyclohexene); cis-decahydronaphthalene; ^rons-decahydronaphi halene; 2,3-dihy-droindene (indan).
1 Tiiis Investigation wan performed ai the National Bureau of Standards us partysis, Purification, and Properties of Eydrocarbons,
- Research Associate on the American Petroleum [nstitute Research Projeci 6.:i Present address: Carnegie [nstitute of Technology, Pittsburgh, Pa.1 Present address: Mellon [nstitute of [ndustrial Research, Pittsburgh, Pa.
he work of the American Petroleum [nstitute Research Project 6on the Anal-
890983—50 173